Article

On Reduced Consumption of Fossil Fuels in 2020 and Its Consequences in Global Environment and Exergy Demand

1
College of Engineering, IT & Environment, Charles Darwin University, Ellengowan Drive, Casuarina, NT 0810, Australia
2
Faculty of Business, Economics & Law, The University of Queensland, St Lucia, QLD 4067, Australia
*
Author to whom correspondence should be addressed.
Energies 2020, 13(22), 6048; https://doi.org/10.3390/en13226048
Submission received: 15 October 2020 / Revised: 17 November 2020 / Accepted: 17 November 2020 / Published: 19 November 2020

Abstract

:
As the world grapples with the COVID-19 pandemic, there has been a sudden and abrupt change in global energy landscape. Traditional fossil fuels that serve as the linchpin of modern civilization have found their consumption has rapidly fallen across most categories due to strict lockdown and stringent measures that have been adopted to suppress the disease. These changes consequently steered various environmental benefits across the world in recent time. The present article is an attempt to investigate these environmental benefits and reversals that have been materialized in this unfolding situation due to reduced consumption of fossil fuels. The life cycle assessment tool was used hereby to evaluate nine environmental impacts and one energy based impact. These impacts include ozone formation (terrestrial ecosystems), terrestrial acidification, freshwater eutrophication, marine eutrophication, terrestrial ecotoxicity, freshwater ecotoxicity, marine ecotoxicity, land use, mineral resources scarcity, and cumulative exergy demand. Outcomes from the study demonstrate that COVID-19 has delivered impressive changes in global environment and life cycle exergy demand, with about 11–25% curtailment in all the above-mentioned impacts in 2020 in comparison to their corresponding readings in 2019.

Graphical Abstract

1. Introduction

The novel Coronavirus disease 2019 (COVID-19), which was first reported in Wuhan, China, in December 2019, has since spread rapidly across the globe. The World Health Organization declared the outbreak a Public Health Emergency of International Concern on 30 January 2020, and a pandemic on 11 March 2020 [1]. So far, the pandemic has significantly altered anthropogenic activities around the world. In a matter of months, 81% of the global workforce of 3.3 billion people have had their workplace fully or partly closed [2] and most of the countries or territories went into lockdown in order to contain the disease. These changes, however, initiated sudden changes in the global environment in numerous ways. In one instance, the residents of the state of Punjab, India, were able to see the snow-capped peaks of the Himalayas for the first time in 30 years from about 200 kilometers away due to a massive drop in air pollution [3]. In another instance, Li et al. (2020) discovered that several primary pollutants, viz., SO2, NOx, PM 2.5, and volatile organic compounds (VOCs), have diminished by approximately (abbreviated as, approx. later) 16–26%, 29–47%, 27–46%, and 37–57%, respectively, between January and March, 2020, over the entire Yangtze River Delta region in China, based on the meteorological data obtained from National Climate Data Center of National Oceanic and Atmospheric Administration and National Data Center of the Chinese Meteorology Agency [4]. Wang and Su (2020) additionally reported that COVID-19 suppressed the Chinese consumption of coal by about 20% and diminished the consumption of energy and emission of CO2, NO2 sharply in many regions of China [5]. Moreover, Muhammad et al. (2020) reported that NO2 emission declined by up to 30% in Italy, Spain, France, and the USA in different months of 2020. The latter two studies focused on dedicated satellite imagery data from National Aeronautics and Space Administration (NASA) and the European Space Agency (ESA) [6]. Likewise, there is a remarkable improvement in the aquatic environment in different regions of the world. An unprecedented level of water transparency has been observed in canals and lagoons of Venice, Italy, based on the satellite imagery data of ESA in March–April 2020 [7]. In addition, an impressive level of improvement in surface water quality has been reported in the Vembanad lake, the longest freshwater lake of India, with a consequential reduction in the concentration of suspended particulate matter since April 2020 [8]. All these changes have been recorded at a time when the world has been grappling with so many environmental issues. A short list of these issues includes climate change, air pollution, fine particulate matter formation, ionizing radiation, water pollution, acidification, eutrophication, toxicity, hazardous waste, radioactive waste, tropospheric ozone formation, stratospheric ozone layer depletion, depletion of water, mineral, fossil fuel, and other natural resources, etc. However, as concentrations of the primary air and water-based pollutants were reduced impressively in the COVID-19 pandemic situation [3,4,5,6,7,8], it is expected to carry distinctive changes in many of the corresponding environmental concerns. As such, a holistic study on the environmental changes is unequivocally necessary at this unique time.
However, the above-mentioned studies that are mostly based on the data from satellite imagery or ground-based measurement stations are more applicable for a localized zone rather than for a whole country or global basis. In addition, satellite measurements have large uncertainties and demonstrate high variability in concentration fluxes due to diverse meteorological parameters [9,10]. Accordingly, it is unconventional to determine the global-scale anthropogenic emissions just based on the satellite imagery data. Evidence of this can be seen from the assessment reports of the Intergovernmental Panel on Climate Change (IPCC), which quantifies the global greenhouse gas emission on the basis of various anthropogenic activities rather than focusing on worldwide satellite data [11]. Hence, changes in global anthropogenic activities will stand as a strong basis for estimating the change in the global environment in this unique time. However, in a practical situation, most of these activities are not updated instantaneously. In the COVID-19 situation, this process has been further challenging due to sudden, unexpected, and tremendous changes in anthropogenic activities and their associated uncertainties.
Nevertheless, few countries and organizations have reported near-real-time and/or projected data for both fossil fuel and renewable energy usage both for national and global scenarios [12,13,14,15,16,17]. Out of these, the fossil energies shape almost all sectors of modern life, living, and society whether it is food, accommodation, electricity, transportation, or industrial use. A relevant industry report states that three major fossil fuels, viz., petroleum, coal, and natural gas, contributed to approx. 34%, 27%, and 24% of the total primary energy consumption of the world, respectively, in 2019 [17]. Another example from the 5th Assessment Report of IPCC (IPCC AR5) states that the fossil fuels issued about 32 ± 3.7 × 10⁹ metric ton CO2 equivalent (abbreviated as eq later) greenhouse gas (GHG) emission in 2010, which amounted to ~61.54% of the total worldwide GHG emission in the same year [18]. Accordingly, the fossil fuels hold the potential to upend or fluctuate the global environment immensely. The authors, therefore, focus on the change in the consumption of fossil fuels to determine the changes in global environment and exergy demand in 2020.
The changes in the worldwide consumption of the fossil fuels have particularly been demonstrated in various reports from the Energy Information Administration (EIA), which is the leading statistical and analytical agency of the US Department of Energy and is one of the most reputable organizations of its kind worldwide. Particularly, the Short Term Energy Outlook Aug 2020 report by EIA highlights the impacts of COVID-19 on fossil fuels as “reduced economic activity related to the COVID-19 pandemic has caused changes in energy supply and demand patterns in 2020. Uncertainties persist across the U.S. Energy Information Administration’s (EIA) outlook for all energy sources, including liquid fuels, natural gas, electricity, coal, and renewables” [15,16]. In another instance, the same report focuses on the fundamental causes of declining consumption of petroleum products, such as: “The decline reflects travel restrictions and reduced economic activity related to COVID-19 mitigation efforts” [16]. Similarly, about the impact of COVID-19 on natural gas, the report states that “The largest decline in consumption occurs in the industrial sector … as a result of reduced manufacturing activity” [15,16]. In another instance, the report mentions that “EIA expects that US LNG exports will decline through the end of the summer as a result of reduced global demand for natural gas” [15,16]. In addition, the Short Term Energy Outlook Aug 2020 report states that “coal consumption will decrease by 26% in 2020 and increase by 20% in 2021” after an anticipated recovery from COVID-19 [16]. On another note, coal production will decrease by 25% to 530 million short tons in 2020 based on a reduced demand from global steel production, coking coal, and steam coal [15]. Therefore, it is unequivocally necessary to reflect on how the change in fossil fuel consumption shapes the global environment in current time.
Life cycle assessment (LCA) has been used hereby as the methodological tool to calculate the changes in various environmental impacts and exergy demand. LCA is one of the most powerful environmental impact assessment tools that models the entire life cycles of fossil fuels starting from its extraction from nature to all life cycle phases, including refining, transportation, end-use until the final end-of-life emission while most of the other tools, such as environmental impact assessment, cost-benefit analysis, or material intensity per unit service, estimate the environmental impacts mostly for the operational phase of the system [19,20,21,22]. In addition, LCA offers a robust, unbiased, quantitative, and objective analysis of the environmental impacts of a product or technology.
Overall, the present study accompanies at least two novelties in respective domains of knowledge, which are as follows:
(1)
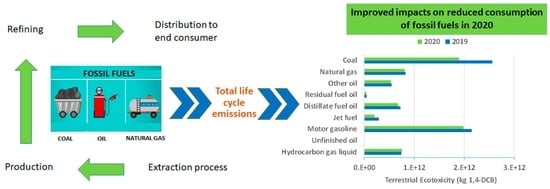
This is the first LCA-based study that has evaluated the changes in nine environmental impacts in 2020 due to the reduced consumption of fossil fuels. These include: (a) ozone formation (terrestrial ecosystems), (b) terrestrial acidification, (c) freshwater eutrophication, (d) marine eutrophication, (e) terrestrial ecotoxicity, (f) freshwater ecotoxicity, (g) marine ecotoxicity, (h) land use, and, (i) mineral resource scarcity;
(2)
The study additionally evaluates the changes in cumulative exergy demand due to the reduced consumption of fossil fuels from the life cycle perspective; so far, no scholarly article has focused on this theme to evaluate the changes occurring in the COVID-19 period. The cumulative exergy demand calculates the exergy removed from nature in the process of all life cycle steps of the fossil fuels; accordingly, it determines how much exergy savings are achievable in 2020 due to the change in fossil fuel consumption.
Finally, both of these novelties have been affirmed based on systematic literature search studies conducted in three prominent research databases, such as, Scopus, ScienceDirect, and Web of Science, latest on 8 November 2020.

2. Methodology

2.1. Goal and Scope Definition

This study conducted a cradle to end-user/gate LCA of various fossil fuels based on their consumption data in the year 2019 and 2020. Three major fossil fuels, viz., petroleum and other liquid, natural gas, and coal, were studied in this context. Relevant consumption data were sourced from EIA reports [14,15,16]. As the year 2020 has not finished yet, the consumption data of the first half of the year indicate the actual readings while the same for the latter half is based on the reliable estimates of EIA. Accordingly, consumption data of petroleum include different categories of petroleum end-products, crude oil, and unfinished oil. The petroleum end-products include hydrocarbon gas liquid, motor gasoline, jet fuel, distillate fuel oil, residual fuel oil, and other oils. Consumption data of these petroleum end-products were computed as follows: field production, plus imports, plus refinery and blender net production, plus net receipts, plus adjustments, minus stock change, minus refinery and blender net inputs, minus exports [14,15,16]. Likewise, for natural gas, the consumption data include the following: (a) residential use; (b) commercial sector use, including use in commercial combined-heat-and-power (CHP) and commercial electricity-only plants; (c) industrial sector use: lease and plant fuel use, and other industrial deliveries, including use in industrial CHP and industrial electricity-only plants; (d) transportation sector use, including pipelines and distribution use, and vehicle fuel use; and (e) electric power sector: electric utility and independent power producer use [14,15,16]. Consequently, the consumption of coal was based on: (a) residential use, (b) commercial use, (c) industrial sector, (d) power production, and (e) coke plants [14,15,16]. Details of the end-products, their components, and the end-uses have been discussed more comprehensively in EIA reports [14,15,16].

2.2. Life Cycle Inventory and Life Cycle Assessment Process

The worldwide consumption data of fossil fuels in the year 2019 and 2020 are highlighted in Table 1. The details of this consumption are discussed in Supplementary Materials Information (S1, S2). Additionally, the consumption data of all fossil fuels are displayed in Supplementary Materials Tables S1–S6.
Some of the fossil fuels, viz., unfinished oil, motor gasoline, jet fuel, distillate fuel oil, residual fuel oil, and natural gas, were modelled with existing life cycle inventory (LCI) processes available in Ecoinvent database version 3.6 [23]. Some other fossil fuels, such as hydrocarbon gas liquid, other oil, and coal, were modelled by defining new LCI processes out of the existing ones, as available in the aforesaid database. Typical life cycle stages of the fossil fuels are shown in Figure 1 and details of the LCI processes are presented in Supplementary Materials Information S3. Additionally, the ReCiPe 2016 mid-point (H) method version 1.03 and Cumulative Exergy Demand method version 1.05 were used in the study [19,24]. The environmental impacts were calculated based on the characterization factor of each individual emission issued in various life cycle processes and end-of-life stages. The characterization factor for the same emission or component varies across the impact indicators [19]. Besides, the impact values are indicative of actual characterized results rather than comparative or normative ones as no normalization reference was used in the study to compare the results of environmental and exergy-based impacts. In addition, the ‘hierarchist’ LCA theme was applied in evaluating all the environmental impacts, which focuses on a moderate time horizon rather than the ‘individualist’ or ‘egalitarian’ perspective, which deals with short-term or very long-term evaluation, respectively [19,20,21]. This time horizon is not the same for all impacts; moreover, it varies based on an ‘individualist’, ‘egalitarian’, and ‘hierarchist’ perspective. Details of these time horizons are discussed in the manuals of the ReCiPe method [19,22]. Additionally, the exergy of both renewable and non-renewable energy and material resources consumed in different life cycle phases of the fossil fuels were quantified in the cumulative exergy demand evaluation process [24]. These energy and material-based resources include potential, kinetic, solar, biomass, water, fossil, nuclear, primary energies, and metal and mineral resources. Lastly, the overall LCA modelling was conducted in SimaPro LCA software platform version 9.0.0.49 from PRe’ Sustainability [25].

3. Results and Discussion

The results and discussion section covers two sub-sections, where the first one highlights the results of nine environmental impact while the next one focuses on the cumulative exergy demand savings by all fossil fuels in 2020.

3.1. Results of Nine Environmental Impacts

3.1.1. Ozone Formation (Terrestrial Ecosystems)

The results of ozone formation (terrestrial ecosystems) display a drastic reduction of 16% impact in 2020 in comparison to the same in 2019 as a result of the reduced consumption of fossil fuels. The ozone formation impact was evaluated based on the ecosystem ozone formation potential (EOFP) of various environmental pollutants [26,27]. Air pollution intensifies the photochemical reaction of NOx and non-methane volatile organic compounds (NMVOCs), which ultimately results in an increased concentration of ozone in the atmosphere. This photochemical ozone inhibits the growth of seeds, crops, and vegetables and decreases the productivity of plant species. Based on the evaluation of EOFPs of various pollutants throughout the life cycle processes of the above-mentioned fossil fuels, it appears that per m3 natural gas issues the lowest ozone formation (terrestrial ecosystems) impact of ~0.00093 kg NOx eq, where NOx refers to various nitrogen oxides. This can be attributed to its root LCI processes, viz., high-pressure natural gas production, natural gas sweetening, and medium-voltage electricity required in various life cycle processes carrying a lower ozone formation (terrestrial ecosystems) impact. All the contributing emissions hereby are expressed in the unit of NOx due to its well-developed environmental fate and chemistry in relation to the ozone formation. Comparatively, per liter heavy fuel oil, motor gasoline, other oil, distillate fuel oil, jet fuel, hydrocarbon gas liquid, and unfinished oil carry approx. 2.05-, 2.02-, 1.95-, 1.89-, 1.81-, 1.76-, and 1.26-fold impact, respectively, in comparison to per m3 natural gas. In addition, 1 kg of coal exudes ~1.91-fold ozone formation impact in comparison to per m3 natural gas; here, the blasting process is one of the largest impact contributors that exploits varieties of explosives to break the rocks and excavate the coal mines. The corresponding results of the ozone formation (terrestrial ecosystems) impact are illustrated in Figure 2a, which demonstrates a ~4.46 × 10⁹ kg NOx eq reduction in 2020 with respect to the same in 2019. In overall consumption scale, the majority of this impact was curtailed by the diminishing use of three fossil fuels, viz., coal, motor gasoline, and distillate fuel oil, contributing about 3.58 × 10⁹, 3.76 × 10⁸, and 1.32 × 10⁸ kg NOx eq impact reduction, respectively. By contrast, consumption of unfinished oil and hydrocarbon gas liquid increased by about 28.29% and 1.40%, respectively, in 2020, which consequently increased the ozone formation (ecosystem) impact by ~2.53 × 10⁷ kg NOx eq. It is noteworthy to mention here that although in percentage scale the consumption of ‘unfinished oil’ exhibits a remarkable increase in 2020, its actual market share is just 0.3% within all liquid fossil fuels in the same year. Hence, its high percentage increase in consumption does not deliver an impressive change in environmental impacts.

3.1.2. Terrestrial Acidification

Similar to the ozone formation (terrestrial ecosystems) impact, terrestrial acidification abates by ~15.16% in 2020. Some inorganic substances, such as sulphates, nitrates, and phosphates, change the acidity level of soil and consequently affect the growth of plant species [19,28]. The associated acidification potential of each substance is expressed in the unit of kg SO2 eq, where SO2 represents sulphur dioxide. Out of the above-mentioned fossil fuels, coal delivers the highest reduction in terrestrial acidification impact of ~6.04 × 10⁹ kg SO2 eq. This can be attributed to three factors: (i) coal was one of the most widely consumed fossil fuels in the world in 2019; (ii) there is an impressive reduction of ~25.88% in coal consumption in 2020 with respect to the 2019 level; and (iii) per kg coal carries ~0.00299 kg SO2 eq terrestrial acidification impact, which represents a considerably high impact among all fossil fuels. In a comparative scale, per m3 natural gas issues the lowest terrestrial acidification impact of about 0.001521 kg SO2 eq; here, the ‘sour gas’ processing and natural gas sweetening process contribute the most significant impacts of about 0.000505 and 6.14 × 10⁻⁵ kg SO2 eq impact, respectively. By contrast, the life cycle processes of per liter motor gasoline, residual fuel oil, distillate fuel oil, and jet fuel issue ~2.83-, 2.67-, 2.55-, and 2.43-fold impact of per m3 natural gas, respectively. Overall, there is a significant decline in the consumption of jet fuel (~29.07%) and residual fuel oil (~18.08%) globally in 2020 owing to the COVID-19 pandemic situation. Out of these, jet fuel and residual fuel oil had a market share of ~6.52% and ~1.18% in 2020, respectively, within all liquid fuels, which are not significant enough. Thus, these fuels do not yield a significant reduction of terrestrial acidification impact.

3.1.3. Freshwater Eutrophication

There is a remarkable decline of ~25.07% in freshwater eutrophication impact in 2020 with respect to the same in 2019. Freshwater eutrophication generally occurs due to the discharge of phosphorus and nitrogen into soil or freshwater, which increases the uptake of nutrients by various autotropic organisms and heterotrophic species. This ultimately results in a relative loss of freshwater species [19,29]. Out of the fossil fuels, per liter unfinished oil contributes the lowest freshwater eutrophication impact of ~2.8 × 10⁻⁵ kg P eq, where P refers to phosphorus. Per liter other oil, motor gasoline, residual fuel oil, and hydrocarbon gas liquid issue about 2.7-, 2.25-, 2.18-, and 2.02-fold impact of the same volume of unfinished oil, respectively. By contrast, the LCI processes of per m3 natural gas deliver a freshwater eutrophication impact of ~2.9 × 10⁻⁵ kg P eq only. In addition, per kg coal carries ~49.59-fold impact of per liter unfinished oil; therefore, a massive reduction in the consumption of coal ensures an intense drop in the freshwater eutrophication impact in 2020. In total, coal reduces the freshwater eutrophication impact by ~2.82 × 10⁹ kg P eq. Comparatively, natural gas reduces the impact by ~3.10 × 10⁶ kg P eq, which is just 0.11% of the reduction that coal issues in 2020. One of the reasons behind this is associated with a ~2.79% reduction in natural gas consumption in 2020, which is insignificant with respect to the reduction in coal consumption (~25.88%) in the same year. In addition, leachate spoils from lignite and hard coal mining carry short- and long-term emissions to groundwater through rainwater infiltration leaching. These emissions carry significant freshwater eutrophication of ~0.000719 and ~0.000674 kg P eq for per kg lignite and hard coal, respectively. No LCI process in natural gas contributes such a large-scale freshwater eutrophication impact. Lastly, combining the contribution of all liquid fuels, net freshwater eutrophication impact reduces by ~2.69 × 10⁷ kg P eq after balancing the impact increase by hydrocarbon gas liquid and unfinished oil.

3.1.4. Marine Eutrophication

Marine eutrophication generally occurs due to the enrichment of nutrients in marine ecosystems. Usually, most of the industrial runoffs and leaching processes consequently end up in soil, riverine, and marine systems, which increases the nutrient levels in corresponding ecosystems and thus agitates and perturbs these environments. The LCA study of the fossil fuels shows that about 97% reduction in the marine eutrophication impact in 2020 is associated with scaled-down consumption of coal, as illustrated in Figure 2d. This amounts to ~1.73 × 10⁸ kg N eq, where N refers to nitrogen. By contrast, the reduction in natural gas consumption reduces the marine eutrophication impact merely by ~5.05 × 10⁵ kg N eq. The same group of leachate-based processes, as in the freshwater eutrophication impact, again emit the largest marine eutrophication impacts in coal-based LCI processes whereas the treatment of dross as a result of electrolysis of aluminum and off-site treatment of sulfidic tailings required in natural gas LCI processes issue the highest marine eutrophication of ~2.6 × 10⁻⁶ and ~1.99 × 10⁻⁷ kg N eq, respectively. Within all liquid fuels, large reductions in marine eutrophication impact are contributed by motor gasoline, jet fuel, and distillate fuel oil with about a 1.46 × 10⁶, 9.13 × 10⁵, and 5.43 × 10⁵ kg N eq reduction, respectively. By contrast, per liter unfinished oil entails the lowest marine eutrophication impact of ~2 × 10⁻⁶ kg N eq. Other liquid fuels can be sequentially arranged as motor gasoline, distillate fuel oil, other oil, residual fuel oil, hydrocarbon gas liquid, and jet fuel, issuing about 3.97-, 3.94-, 3.90-, 3.51-, 3.47-, and 3.43-fold marine eutrophication impact of the same volume of unfinished oil, respectively. Unfinished oil necessitates a series of downstream processes to transform to final end-products and these downstream processes carry significant marine eutrophication impact. By definition, these additional LCI processes are not accounted for in estimation of the marine eutrophication impact of unfinished oil. In addition, other oil and residual fuel oil had a low market share of about 1.33% and 9.35% in 2019. Due to this, their high marine eutrophication impact in per liter LCI processes yielded only a marginal reduction of about 1.23 × 10⁵ and 9.11 × 10⁴ kg N eq impact, respectively, in 2020. Other than these, unfinished oil and hydrocarbon gas liquid increase the marine eutrophication impact by about 7.45 × 10³ and 8.04 × 10⁴ kg N eq, respectively, due to their associated rise in consumption in the same time.

3.1.5. Terrestrial Ecotoxicity, Freshwater Ecotoxicity, and Marine Ecotoxicity

Next, three ecotoxicity-based impacts, namely, terrestrial ecotoxicity, freshwater ecotoxicity, and marine ecotoxicity, were evaluated based on the toxicity potential of a total of 3094 organic and inorganic substances over the life cycle processes of fossil fuels for a time horizon of 100 years [19,30,31]. The ecotoxicity impact of 1 kg 1,4-dichlorobenzene (1,4-DCB) was used as the reference unit in the associated calculation [19]. The companion fate, exposure, and toxicity of chemicals were simulated based on the global scenarios of Uniform System for the Evaluation of Substances-LCA (USES-LCA) model version 3.0 [30,31]. The results of the terrestrial ecotoxicity modelling show that 1 m3 natural gas carries the lowest impact of ~0.216227 kg 1,4-DCB eq. Most of this terrestrial ecotoxicity impact in natural gas originates from the LCI processes of various metals used in its different life cycle stages. Obviously, these material-based processes are not the core LCI processes in natural gas production; hence, the corresponding terrestrial ecotoxicity impact of natural gas is low. The core natural gas-based LCI processes, viz., high-pressure natural gas production or sweet gas processing, only deliver ~0.00118 and ~0.00216 kg 1,4-DCB eq ecotoxicity impact, respectively. A full-fledge process-scale impact contribution study for all the fossil fuels is out of the scope of this article. Nevertheless, it is worthwhile to mention here that per liter jet fuel, residual fuel oil, distillate fuel oil, motor gasoline, hydrocarbon gas liquid, and other oil issue about 170%, 180%, 187%, 275%, 284%, and 363% more impact than the aforesaid volume of natural gas as their core LCI processes of corresponding liquid fuel production contribute to larger terrestrial ecotoxicity impacts. By contrast, per kg coal delivers about 52% higher impact than natural gas. Herein, the process-scale contributions demonstrate that various transport-based LCI processes deliver the largest terrestrial ecotoxicity impact in coal. In the overall consumption scale, coal delivers a drastic reduction of terrestrial ecotoxicity impact, amounting to about 6.63 × 10¹¹ kg 1,4-DCB eq in 2020, due to its impressive cut in consumption in the same time period. In addition, motor gasoline maintains the largest market share of about 45.3% within all liquid fuel consumption; hence, the second largest cut in terrestrial ecotoxicity impact is contributed by motor gasoline, as illustrated in Figure 2e.
Comparatively, the results of the freshwater ecotoxicity impact unveil a much different scenario; here, the life cycle processes of per liter unfinished oil carry the lowest impact of ~0.00253 kg 1,4-DCB followed by jet fuel (~0.00392 kg 1,4-DCB), distillate fuel oil (~0.00428 kg 1,4-DCB), hydrocarbon gas liquid (~0.00433 kg 1,4-DCB), residual fuel oil (~0.00477 kg 1,4-DCB), motor gasoline (~0.005 kg 1,4-DCB), and other oil (~0.00737 kg 1,4-DCB), respectively. Accordingly, motor gasoline and jet fuel appear as the leading contributors in freshwater ecotoxicity impact reduction, owing to their: (i) associated large-scale impact in per liter LCI processes, (ii) large-scale annual consumption, and (iii) significant drop in consumption in 2020. This holds true in the marine ecotoxicity impact as well, where motor gasoline and jet fuel again deliver a significant impact reduction in 2020 owing to the COVID-19 situation. However, by considering all the fossil fuels, coal reduces both of the freshwater ecotoxicity and marine ecotoxicity impacts the most, as illustrated in Figure 2f,g. By comparison, natural gas reduces both of the impacts by only about 4.28 × 10⁸ and 6.8 × 10⁸ kg 1,4-DCB eq, respectively. The consumption of natural gas only reduces by 2.79% in 2020, which is not significant enough to result in a large-scale reduction of any of the impacts except when the unit LCI processes of natural gas carry a tremendously larger impact in comparison to the other fossil fuels.

3.1.6. Land Use

Next, the diminishing use of fossil fuels induced a ~21.89% reduction in land uses in 2020 with respect to 2019. Herein, land use encompasses the process of land transformation, land occupation, and land relaxation, where the latter models the end-of-life scenarios of land use, whereby a land is assumed to return to its pre-transformation phase or (semi-) natural state. Associated characterization factors of various land systems, such as used forest, pasture and meadow, annual crop-based land, permanent crop-based land, mosaic agricultural land, urban, industrial, and others, were based on De Baan et al. (2013) and Curran et al., (2014) [32,33]. Out of all the fossil fuels, coal contributes the most in reducing the land use impact in 2020. This amounts to the reduction of ~3.86 × 10¹⁰ m2 crop eq land area. The coal mining operation requires large swathes of land; in addition, construction of railway track and underground mining infrastructure necessitate about 0.0015 and 0.000682 m2 crop eq land area in per kg coal production, respectively. The next major land use impact reduction is contributed by motor gasoline with ~1.08 × 10⁹ m2 crop eq land area, as displayed in Figure 2h. Here, the LCI processes relevant to the construction of onshore petroleum field infrastructure, regional distribution infrastructure, and roads contribute the largest impacts of about 0.00154, 0.000505, and 0.000451 m2 crop eq land area, respectively. All other fossil fuels deliver a negligible change in land use impact in 2020.

3.1.7. Mineral Resources Scarcity

Next, the life cycle processes of coal, motor gasoline, and jet fuel bring a noticeable reduction in ‘mineral resources scarcity’ impact in 2020. The extraction of mineral resources generally decreases the quality of ores; thus, future extraction of minerals necessitates production of an increased volume of ores in comparison to the previous extraction [19,20]. The LCI processes of fossil fuels consume diverse kind of materials and minerals; therefore, a reduction in the consumption of these fossil fuels carries consequential changes in the ‘mineral resources scarcity’ impact. The surplus ore potentials of 74 different mineral resources were used hereby to quantify the ‘mineral resources scarcity’ impact in the unit of copper (Cu) equivalence [34,35]. Cu is one of the most commonly available material resources in various deposits and mines across the world although its percentage amount in various mines varies widely. Hence, it is convenient to quantify the characterizing factors of mining yield and expenses of other minerals with reference to Cu. This yield data was subsequently used in evaluating the material resources scarcity impact. The relevant results are illustrated in Figure 2i, which demonstrates that a reduction in coal consumption ensures a sharp reduction of ~7.28 × 10⁸ kg Cu eq impact in 2020 with respect to the same in 2019. Moreover, motor gasoline and jet fuel slash the impact by about 1.86 × 10⁸ and 1.01 × 10⁸ kg Cu eq, respectively, which are the largest contributors in mineral resources scarcity impact reduction within petroleum and other liquids. Apart from these, hydrocarbon gas liquid and unfinished oil increase the impact by ~9.54 × 10⁶ and ~2.16 × 10⁶ kg Cu eq due to their associated rise in consumption in 2020. On the basis of per unit LCI processes, per kg coal, however, exudes the lowest amount of mineral resource scarcity impact of 0.000361 kg Cu eq within all fossil fuels. This can be attributed to a comparatively lower usage of metal resources in the life cycle processes of coal. Only iron ore mining operation (46% iron), ferronickel production (25% nickel), molybdenite, and bauxite mining operations contribute larger mineral resources scarcity impacts in this fossil fuel. By contrast, per m3 natural gas carries a 1.92-fold impact while, for liquid fuels, it varies in the range of 1.48- (unfinished oil) to 2.88- (other oil) fold with respect to per kg coal. The LCI processes of iron mining operation, ferronickel, and barite production deliver the largest impacts in these liquid fuels.

3.2. Cumulative Exergy Demand of Fossil Fuels

Unlike energy, exergy of a system does not follow the law of the conservation of energy. Hence, exergy can be partly or completely lost or destroyed due to the irreversibility of the associated thermodynamic processes [36,37]. Accordingly, it is possible to reduce the exergy loss of a system, which simultaneously diminishes the consumption of accompanying energy and/or mineral resources by the system, and this ultimately abates various environmental impacts. As illustrated in Figure 2j, the total cumulative exergy demand by all fossil fuels reduces by ~7.21 × 10¹³ MJ in 2020 with respect to the level in 2019 (here, MJ refers to Mega joule; joule is the unit of work or energy). Out of this, coal leads the reduction in exergy demand by ~4.72 × 10¹³ MJ in 2020, which represents ~65.42% of the total reduction by all fossil fuels. A change in the consumption of 1 kg coal corresponds to ~23.38 MJ cumulative exergy demand. Obviously, the majority of this exergy demand is associated with non-renewable fossil sources, as derived from coal (~98.80%). Biomass-based exergy has the next important share (~0.775% of total exergy) in coal followed by nuclear, potential, and kinetic resources. The unit LCI processes of all liquid petroleum products and natural gas necessitate much higher cumulative exergy than per kg coal; which vary in the range of ~38.26 MJ/liter (for hydrocarbon gas liquid) to ~54.31 MJ/liter (for heavy fuel oil). This establishes the coal-based life cycle processes as more exergy efficient than all other fossil fuel-based processes. However, based on the individual fuel consumption pattern in 2019 and 2020, only four remaining fossil fuels other than coal, viz., motor gasoline, jet fuel, natural gas, and distillate fuel oil, share a significant cut of about 12.75%, 9.42%, 6.14%, and 5.12% in total cumulative exergy demand reduction, respectively. It is noteworthy to mention here that although per kg coal carries a lower cumulative exergy demand, its significant level of consumption in the year 2019 and a sharp cut in consumption in 2020 (~25.88%), as shown in Table 1, establish it as the leading contributor in exergy demand reduction in comparison to the remaining fossil fuels.

4. Conclusions

COVID-19 has spread at a time when the human civilization has been in its peak of progression in the known history. Accordingly, this pandemic has been able to trigger more far-reaching and extensive changes in the world, economy, and environment than any other natural phenomenon in the recent history. This article investigated the remarkable changes that are emerging in the global environmental landscape in this significant time through the lens of an LCA study. The restoration of the environment evidenced in this study suggests future studies should focus on whether some form of temporary shutdown measure carries ample potential to restore the global environment. In summary, this study illustrates manifestations of meaningful changes in the global environment in 2020, as such:
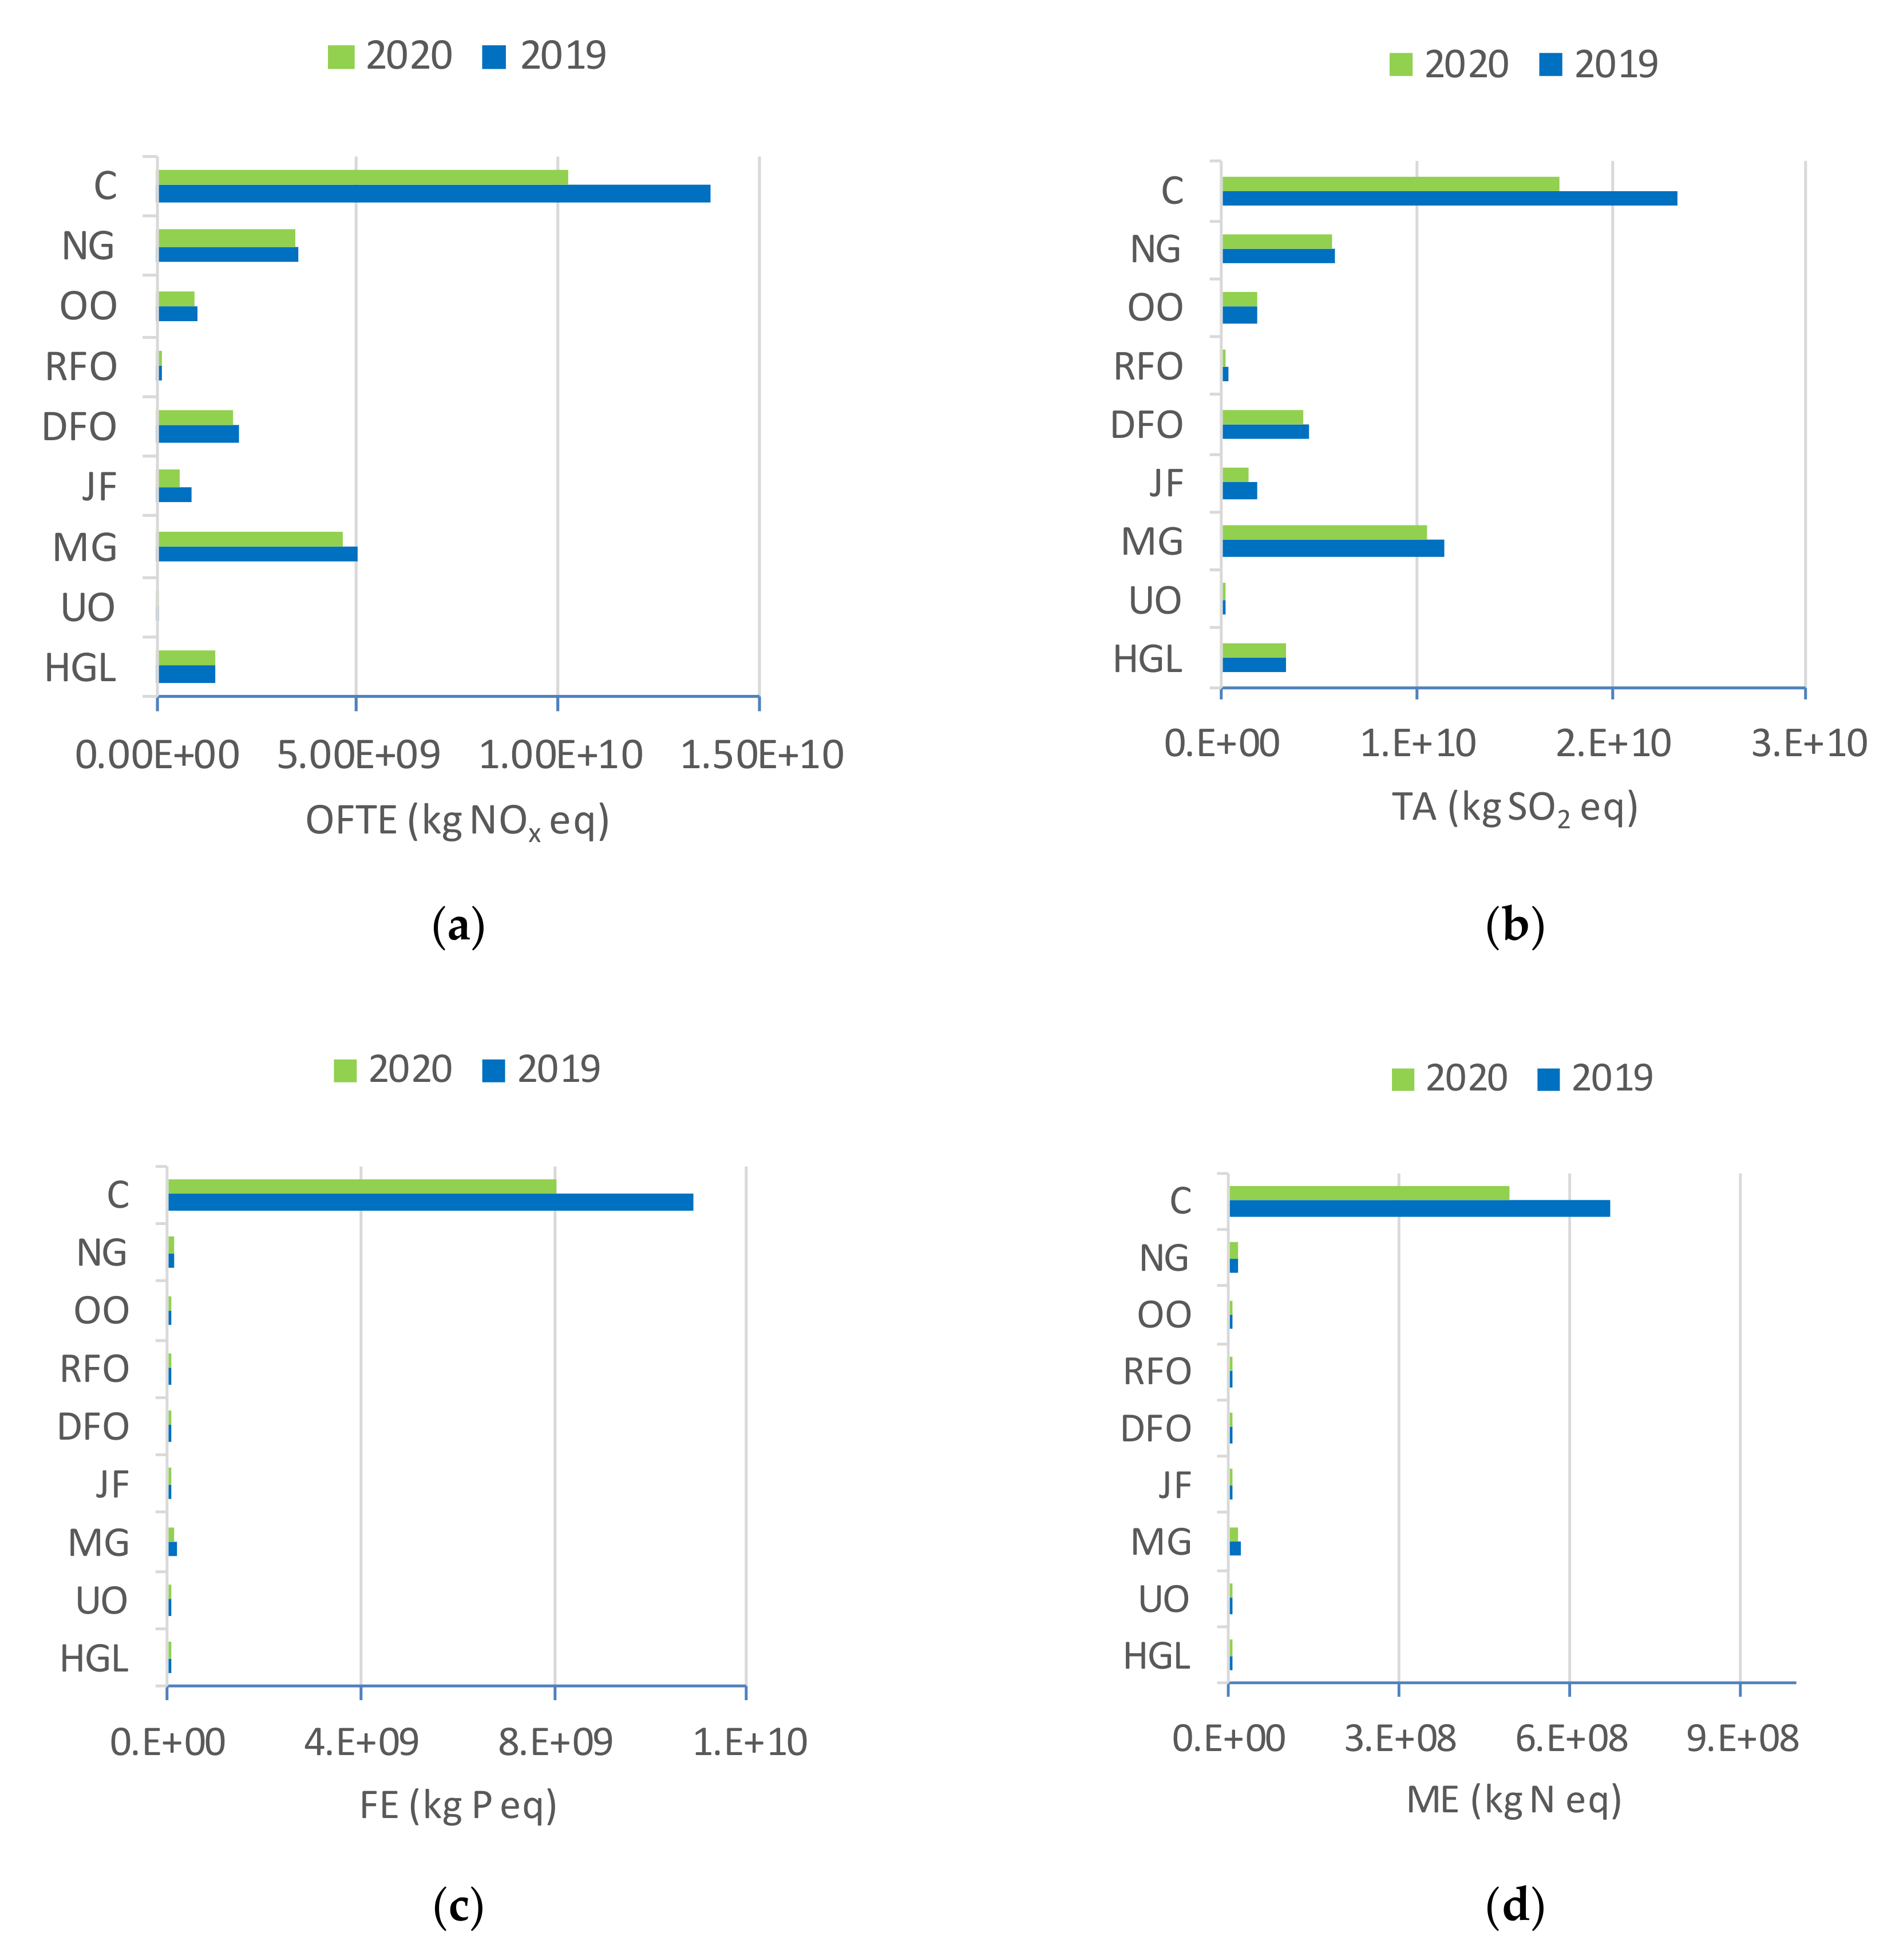
  • Ozone formation (terrestrial ecosystem) impact reduces by ~16.00% in 2020 with respect to the 2019 level with a corresponding reduction of ~4.46 × 10⁹ kg NOx eq;
  • Terrestrial acidification impact reduces by ~15.16% in 2020 with respect to the 2019 level with a corresponding reduction of ~7.95 × 10⁹ kg SO2 eq;
  • Freshwater eutrophication reduces by ~25.07% in 2020 with respect to the 2019 level with a corresponding reduction of ~2.85 × 10⁹ kg P eq;
  • Marine eutrophication reduces by ~24.26% in 2020 with respect to the 2019 level with a corresponding reduction of ~1.77 × 10⁸ kg N eq;
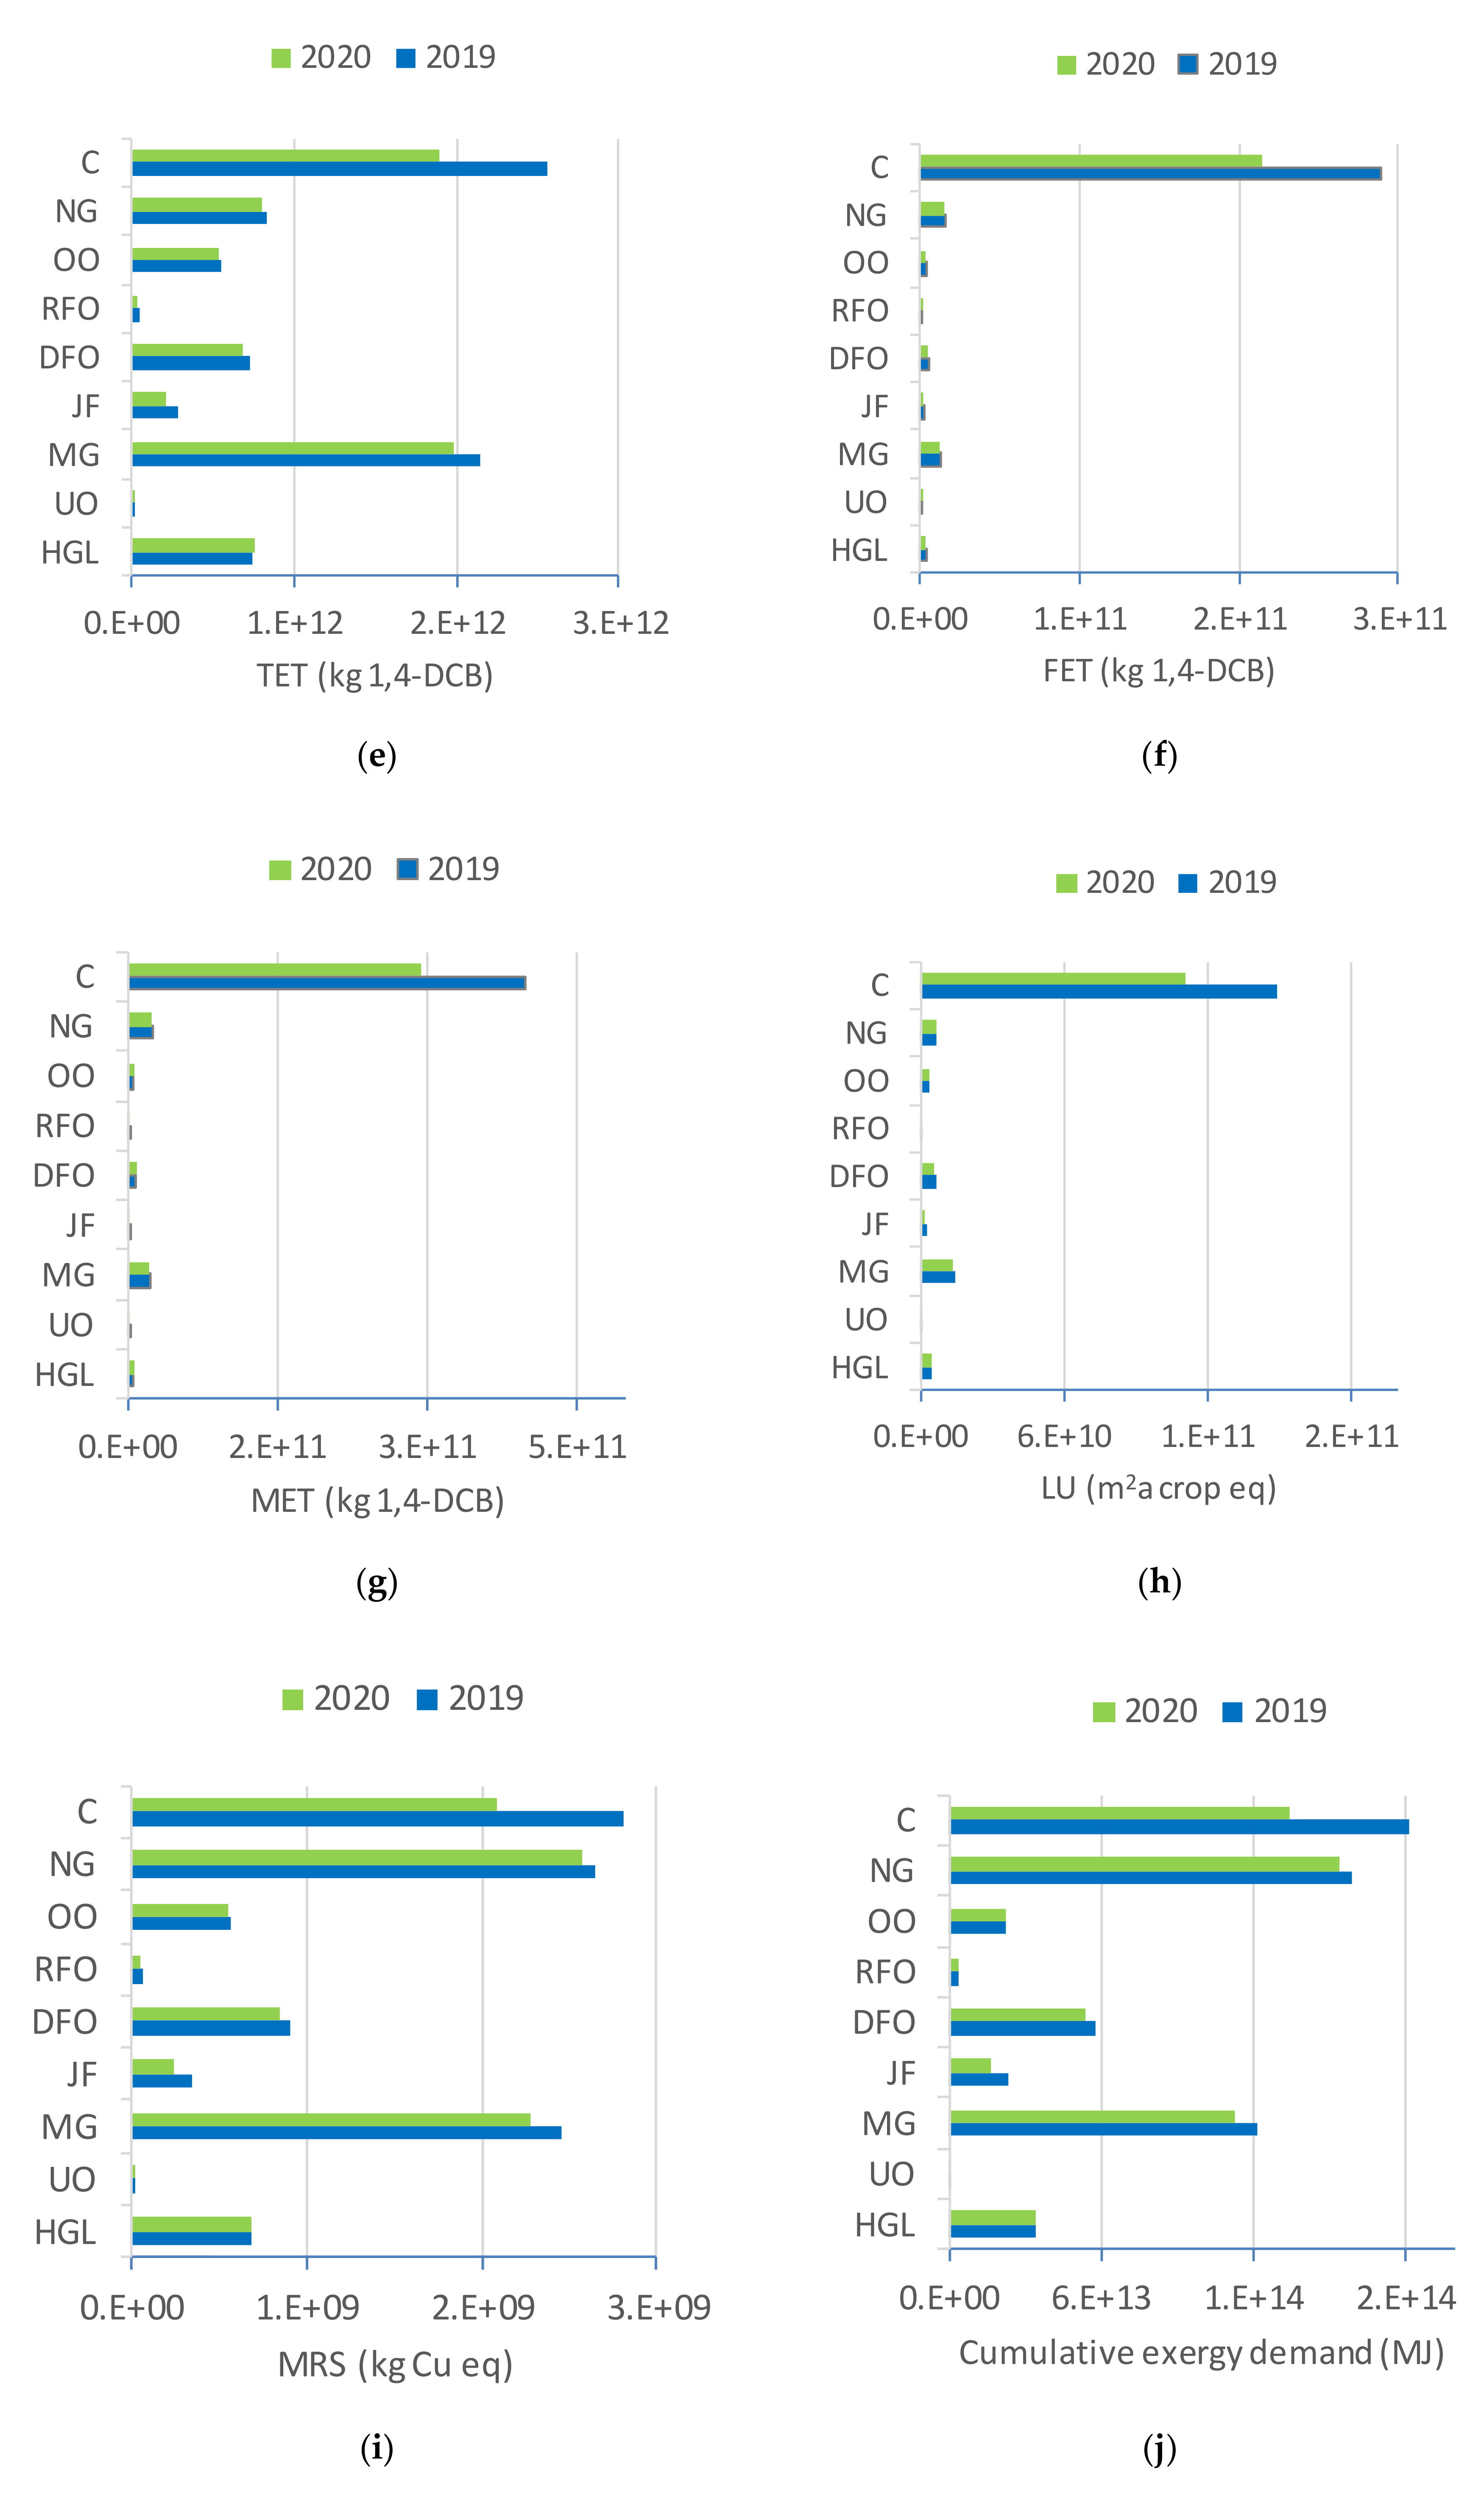
  • Terrestrial ecotoxicity reduces by ~12.59% in 2020 with respect to the 2019 level with a corresponding reduction of ~9.94 × 10¹¹ kg 1,4-DCB eq;
  • Freshwater ecotoxicity reduces by ~23.20% in 2020 with respect to the 2019 level with a corresponding reduction of ~7.71 × 10¹⁰ kg 1,4-DCB eq;
  • Marine ecotoxicity reduces by ~22.77% in 2020 with respect to the 2019 level with a corresponding reduction of ~1.07 × 10¹¹ kg 1,4-DCB eq;
  • Land use reduces by ~21.89% in 2020 with respect to the 2019 level with a corresponding reduction of ~4.11 × 10¹⁰ m2 area crop eq;
  • Mineral resource scarcity reduces by ~11.10% in 2020 with respect to the 2019 level with a corresponding reduction of ~1.16 × 10⁹ kg Cu eq; and
  • Cumulative exergy demand reduces by ~11.90% in 2020 with respect to the 2019 level with a corresponding reduction of ~7.21 × 10¹³ MJ through reduced use of fossil fuels.
A limitation of the study lies in the estimated data of the 2020 consumption of the fossil fuels by EIA for the second half of the year, which typically fluctuates in a narrow range in an ideal case. However, the COVID-19 outbreak is still an evolving scenario. Accordingly, worsening of the corresponding situation together with enhanced lockdowns or reduced anthropogenic activities may contribute to further curtailment of the consumption of fossil fuels and simultaneously intensify the environmental benefits. The opposite scenario is also not unexpected if the governments or industries plan to restart the economy expeditiously or a COVID-19 vaccine is developed soon. Another limitation centres on the inventory data of the fossil fuels. Being a very wide-scale study, the life cycle processes of the fossil fuels incorporated energy, material, and emission data of wide-ranging extraction, production, infrastructure, transportation, and other life cycle processes across the globe, which embodies a series of assumptions. Therefore, a more detailed study on this topic should focus on Monte Carlo-based statistical analysis and/or sensitivity analysis in order to investigate how significantly the assumptions in different life cycle processes for each of the fossil fuels affect the final LCA results. The authors did not assimilate similar extensive studies here as these do not match with the scope and size of a single research article. Furthermore, it is also worthwhile to mention that this study calculated the difference of LCA impacts due to the change in the consumption of fossil fuels in 2019 and 2020 rather than individually calculating the impacts either for 2019 or for 2020. Therefore, the Monte Carlo and/or sensitivity analysis will have a negligible impact on the difference of the two results than on the actual results of 2019 or 2020. Finally, the authors recommend conducting more LCA studies to investigate the various environmental changes emerging due to the COVID-19 pandemic in different industry sectors, economic zones, and regional and national levels by exploiting different environmental assessment methods.

Supplementary Materials

The following are available online at https://www.mdpi.com/1996-1073/13/22/6048/s1.

Author Contributions

Conceptualization, A.R.; methodology, A.R.; software, A.R.; validation, A.R., T.K. and M.J.; formal analysis, A.R. and T.K.; investigation, A.R. and T.K.; data curation, A.R. and T.K.; writing—original draft preparation, A.R.; writing—review and editing, A.R., T.K. and M.J.; visualization, A.R. and T.K.; project administration, A.R. All authors have read and agreed to the published version of the manuscript.

Funding

This research received no external funding.

Conflicts of Interest

The authors declare no conflict of interest.

Abbreviations

1:4-DCB eq1,4-dichlorobenzene equivalent
kg Cu eqkg copper equivalent
kg N eqKg nitrogen equivalent
kg P eqkg phosphorus equivalent
CHPCombined heat and power
EIAEnergy Information Administration
ESAEuropean Space Agency
FEFreshwater eutrophication
FETFreshwater ecotoxicity
GHGGreenhouse gas
LCA Life cycle assessment
LCILife cycle inventory
LULand use
MEMarine eutrophication
METMarine ecotoxicity
MRSMineral resources scarcity
NASANational Aeronautics and Space Administration
NMVOCNon-methane volatile organic compounds
NOxNitrogen oxides
OFTEOzone formation (terrestrial ecosystems)
PM2.5Particulate matter with diameter less than 2.5 micron
SO2Sulphur dioxide
TATerrestrial acidification
TETTerrestrial ecotoxicity
VOCVolatile organic compounds

References

  1. World Health Organization. Available online: https://www.who.int/emergencies/diseases/novel-coronavirus-2019/events-as-they-happen (accessed on 29 September 2020).
  2. International Labor Organization. Available online: https://www.ilo.org/global/about-the-ilo/newsroom/news/WCMS_740893/lang--en/index.htm (accessed on 30 September 2020).
  3. Cable News Network International. Available online: https://edition.cnn.com/travel/article/himalayas-visible-lockdown-india-scli-intl/index.html (accessed on 30 September 2020).
  4. Li, L.; Li, Q.; Huang, L.; Wang, Q.; Zhu, A.; Xu, J.; Liu, Z.; Li, H.; Shi, L.; Li, R.; et al. Air quality changes during the COVID-19 lockdown over the Yangtze River Delta Region: An insight into the impact of human activity pattern changes on air pollution variation. Sci. Total Environ. 2020, 732, 139282. [Google Scholar] [CrossRef] [PubMed]
  5. Wang, Q.; Su, M. A preliminary assessment of the impact of COVID-19 on environment—A case study of China. Sci. Total Environ. 2020, 728, 138915. [Google Scholar] [CrossRef] [PubMed]
  6. Muhammad, S.; Long, X.; Salman, M. COVID-19 pandemic and environmental pollution: A blessing in disguise? Sci. Total Environ. 2020, 728, 138820. [Google Scholar] [CrossRef] [PubMed]
  7. Braga, F.; Scarpa, G.M.; Brando, V.E.; Manfè, G.; Zaggia, L. COVID-19 lockdown measures reveal human impact on water transparency in the Venice Lagoon. Sci. Total Environ. 2020, 736, 139612. [Google Scholar] [CrossRef] [PubMed]
  8. Braga, F.; Scarpa, G.M.; Brando, V.E.; Manfè, G.; Zaggia, L. COVID-19 and surface water quality: Improved lake water quality during the lockdown. Sci. Total Environ. 2020, 731, 139012. [Google Scholar]
  9. Le Quéré, C.; Jackson, R.B.; Jones, M.W.; Smith, A.J.P.; Abernethy, S.; Andrew, R.; De-Gol, A.J.; Willis, D.R.; Shan, Y.; Canadell, J.G.; et al. Temporary reduction in daily global CO2 emissions during the COVID-19 forced confinement. Nat. Clim. Chang. 2020, 731, 139012. [Google Scholar] [CrossRef]
  10. Ballantyne, A.; Alden, C.; Miller, J.; Tans, P.P.; White, J.W.C. Increase in observed net carbon dioxide uptake by land and oceans during the last 50 years. Nature 2012, 488, 70–72. [Google Scholar] [CrossRef] [PubMed]
  11. IPCC 2019. 2019 Refinement to the 2006 IPCC Guidelines on National Greenhouse Gas Inventories. Available online: https://www.ipcc.ch/report/2019-refinement-to-the-2006-ipcc-guidelines-for-national-greenhouse-gas-inventories/ (accessed on 1 October 2020).
  12. Organization of the Petroleum Exporting Countries. Available online: https://www.opec.org/opec_web/en/publications/338.htm (accessed on 25 September 2020).
  13. International Energy Agency. World Energy Balances: Overview. Complete Energy Balances for over 180 Countries and Regions Statistics Report-July 2020. Available online: https://www.iea.org/reports/world-energy-balances-overview (accessed on 15 September 2020).
  14. US Energy Information Administration. Monthly Energy Review April 2020. DOE/EIA-0035(2020/4); Office of Energy Statistics, U.S. Department of Energy: Washington, DC, USA, 2020.
  15. US Energy Information Administration. Short-Term Energy Outlook June 2020; Office of Energy Statistics, U.S. Department of Energy: Washington, DC, USA, 2020.
  16. US Energy Information Administration. Short-Term Energy Outlook August 2020; Office of Energy Statistics, U.S. Department of Energy: Washington, DC, USA, 2020.
  17. British Petroleum. BP Statistical Review of World Energy 2019. Available online: https://www.bp.com/content/dam/bp/business-sites/en/global/corporate/pdfs/energy-economics/statistical-review/bp-stats-review-2019-full-report.pdf (accessed on 20 September 2020).
  18. Edenhofer, O.; Pichs-Madruga, R.; Sokona, Y.; Minx, J.C.; Farahani, E.; Kadner, S.; Seyboth, K.; Adler, A.; Baum, I.; Brunner, S.; et al. IPCC 2014. Mitigation of Climate Change. Contribution of Working Group III to the Fifth Assessment Report of the Intergovernmental Panel on Climate Change; Cambridge University Press: Cambridge, UK; New York, NY, USA, 2014. [Google Scholar]
  19. ReCiPe 2016 v1.1. A Harmonized Life Cycle Impact Assessment Method at Midpoint and Endpoint Level. Report I: Characterization; RIVM Report 2016-0104a; National Institute for Public Health and the Environment: Bilthoven, The Netherlands, 2017.
  20. Rashedi, A.; Khanam, T. Life cycle assessment of most widely adopted solar photovoltaic energy technologies by mid-point and end-point indicators of ReCiPe method. Environ. Sci. Pollut. Res. 2020, 27, 29075–29090. [Google Scholar] [CrossRef]
  21. Rashedi, A.; Sridhar, I.; Tseng, K. Life cycle assessment of 50 MW wind firms and strategies for impact reduction. Renew. Sustain. Energy Rev. 2013, 21, 89–101. [Google Scholar] [CrossRef]
  22. Goedkoop, M.; Heijungs, R.; Huijbregts, M.; De Schryver, A.; Struijs, J.; van Zelm, R. ReCiPe 2008 Report I: Characterisation (v 1.08); Ministry of Housing, Spatial Planning and Environment: Amsterdam, The Netherlands, 2008.
  23. Ecoinvent Version 3.6. Available online: https://www.ecoinvent.org/database (accessed on 25 August 2020).
  24. Huijbregts, M.A.J.; Hellweg, S.; Frischknecht, R.; Hendriks, H.W.M.; Hungerbühler, K.; Hendriks, A.J. Cumulative energy demand as predictor for the environmental burden of commodity production. Environ. Sci. Technol. 2010, 44, 2189–2196. [Google Scholar] [CrossRef] [Green Version]
  25. SimaPro Version 9.0.0.49. PRé. Quantifying Sustainability. Available online: https://www.presustainability.com/ (accessed on 18 September 2020).
  26. Van Zelm, R.; Preiss, P.; Van Goethem, T.; Van Dingenen, R.; Huijbregts, M.A.J. Regionalized life cycle impact assessment of air pollution on the global scale: Damage to human health and vegetation. Atmos. Environ. 2016, 134, 129–137. [Google Scholar] [CrossRef] [Green Version]
  27. Van Zelm, R.; Preiss, P.; Van Goethem, T.; Van Dingenen, R.; Huijbregts, M.A.J. European characterization factors for damage to natural vegetation by ozone in life cycle impact assessment. Atmos. Environ. 2013, 77, 318–324. [Google Scholar]
  28. Roy, P.-O.; Azevedo, L.B.; Margni, M.; Van Zelm, R.; Deschênes, L.; Huijbregts, M.A. Characterization factors for terrestrial acidification at the global scale: A systematic analysis of spatial variability and uncertainty. Sci. Total Environ. 2014, 500, 270–276. [Google Scholar] [CrossRef] [PubMed]
  29. Azevedo, L.B.; Henderson, A.D.; Van Zelm, R.; Jolliet, O.; Huijbregts, M.A.J. Assessing the importance of spatial variability versus model choices in life cycle impact assessment: The case of freshwater eutrophication in Europe. Environ. Sci. Technol. 2013, 47, 13565–13570. [Google Scholar] [CrossRef]
  30. Van Zelm, R.; Huijbregts, M.; Van de Meent, D. USES-LCA 2.0: A global nested multi-media fate, exposure and effects model. Int. J. Life Cycle Assess. 2009, 14, 282–284. [Google Scholar]
  31. Van Zelm, R.; Stam, G.; Huijbregts, M.A.J.; Van De Meent, D. Making fate and exposure models for freshwater ecotoxicity in life cycle assessment suitable for organic acids and bases. Chemosphere 2013, 90, 312–317. [Google Scholar] [CrossRef] [Green Version]
  32. De Baan, L.; Alkemade, R.; Köllner, T. Land use impacts on biodiversity in LCA: A global approach. Int. J. Life Cycle Assess. 2013, 18, 1216–1230. [Google Scholar] [CrossRef]
  33. Curran, M.; Hellweg, S.; Beck, J. Is there any empirical support for biodiversity offset policy? Ecol. Appl. 2014, 24, 617–632. [Google Scholar] [CrossRef]
  34. Vieira, M.D.M.; Ponsioen, T.C.; Goedkoop, M.; Huijbregts, M.A.J. Surplus cost potential as a life cycle impact indicator for metal extraction. Resources 2016, 5, 2. [Google Scholar] [CrossRef] [Green Version]
  35. Vieira, M.D.M.; Ponsioen, T.C.; Goedkoop, M.; Huijbregts, M.A.J. Surplus ore potential as a scarcity indicator for resource extraction. J. Ind. Ecol. 2016, 21, 381–390. [Google Scholar] [CrossRef]
  36. Ahamed, J.; Saidur, R.; Masjuki, H. A review on exergy analysis of vapor compression refrigeration system. Renew. Sustain. Energy Rev. 2011, 15, 1593–1600. [Google Scholar] [CrossRef]
  37. Dincer, I. The role of exergy in energy policy making. Energy Policy 2002, 30, 137–149. [Google Scholar] [CrossRef]
Figure 1. Life cycle processes of the fossil fuels.
Energies 13 06048 g001
Figure 2. Changes in life cycle impacts due to reduced consumption of fossil fuels owing to the COVID-19 situation—(a) ozone formation (terrestrial ecosystems) [OFTE], (b) terrestrial acidification [TA], (c) freshwater eutrophication [FE], (d) marine eutrophication [ME], (e) terrestrial ecotoxicity [TET], (f) freshwater ecotoxicity [FET], (g) marine ecotoxicity [MET], (h) land use [LU], (i) mineral resources scarcity [MRS], and (j) cumulative exergy demand.
Energies 13 06048 g002aEnergies 13 06048 g002b
Table 1. Global fossil fuel consumption in 2019 and 2020 [14,15,16].
Fuel TypeUnitConsumption in 2019Consumption in 2020
Hydrocarbon gas liquidliter per year895.43 × 109908.01 × 109
Unfinished oilsame as above14.30 × 10918.35 × 109
Motor gasolinesame as above2.65 × 10122.45 × 1012
Jet fuelsame as above497.78 × 109353.07 × 109
Distillate fuel oilsame as above1.17 × 10121.09 × 1012
Residual fuel oilsame as above77.96 × 10963.86 × 109
Other oilssame as above547.13 × 109529.98 × 109
Natural gasm3 per year3.83 × 10123.72 × 1012
Coalkg per year7.80 × 10125.78 × 1012
Publisher’s Note: MDPI stays neutral with regard to jurisdictional claims in published maps and institutional affiliations.

