Comparative Analysis of System Performance and Thermal Comfort for an Integrated System with PVT and GSHP Considering Two Load Systems: Convective Heating and Radiant Floor Heating


Abstract
:1. Introduction
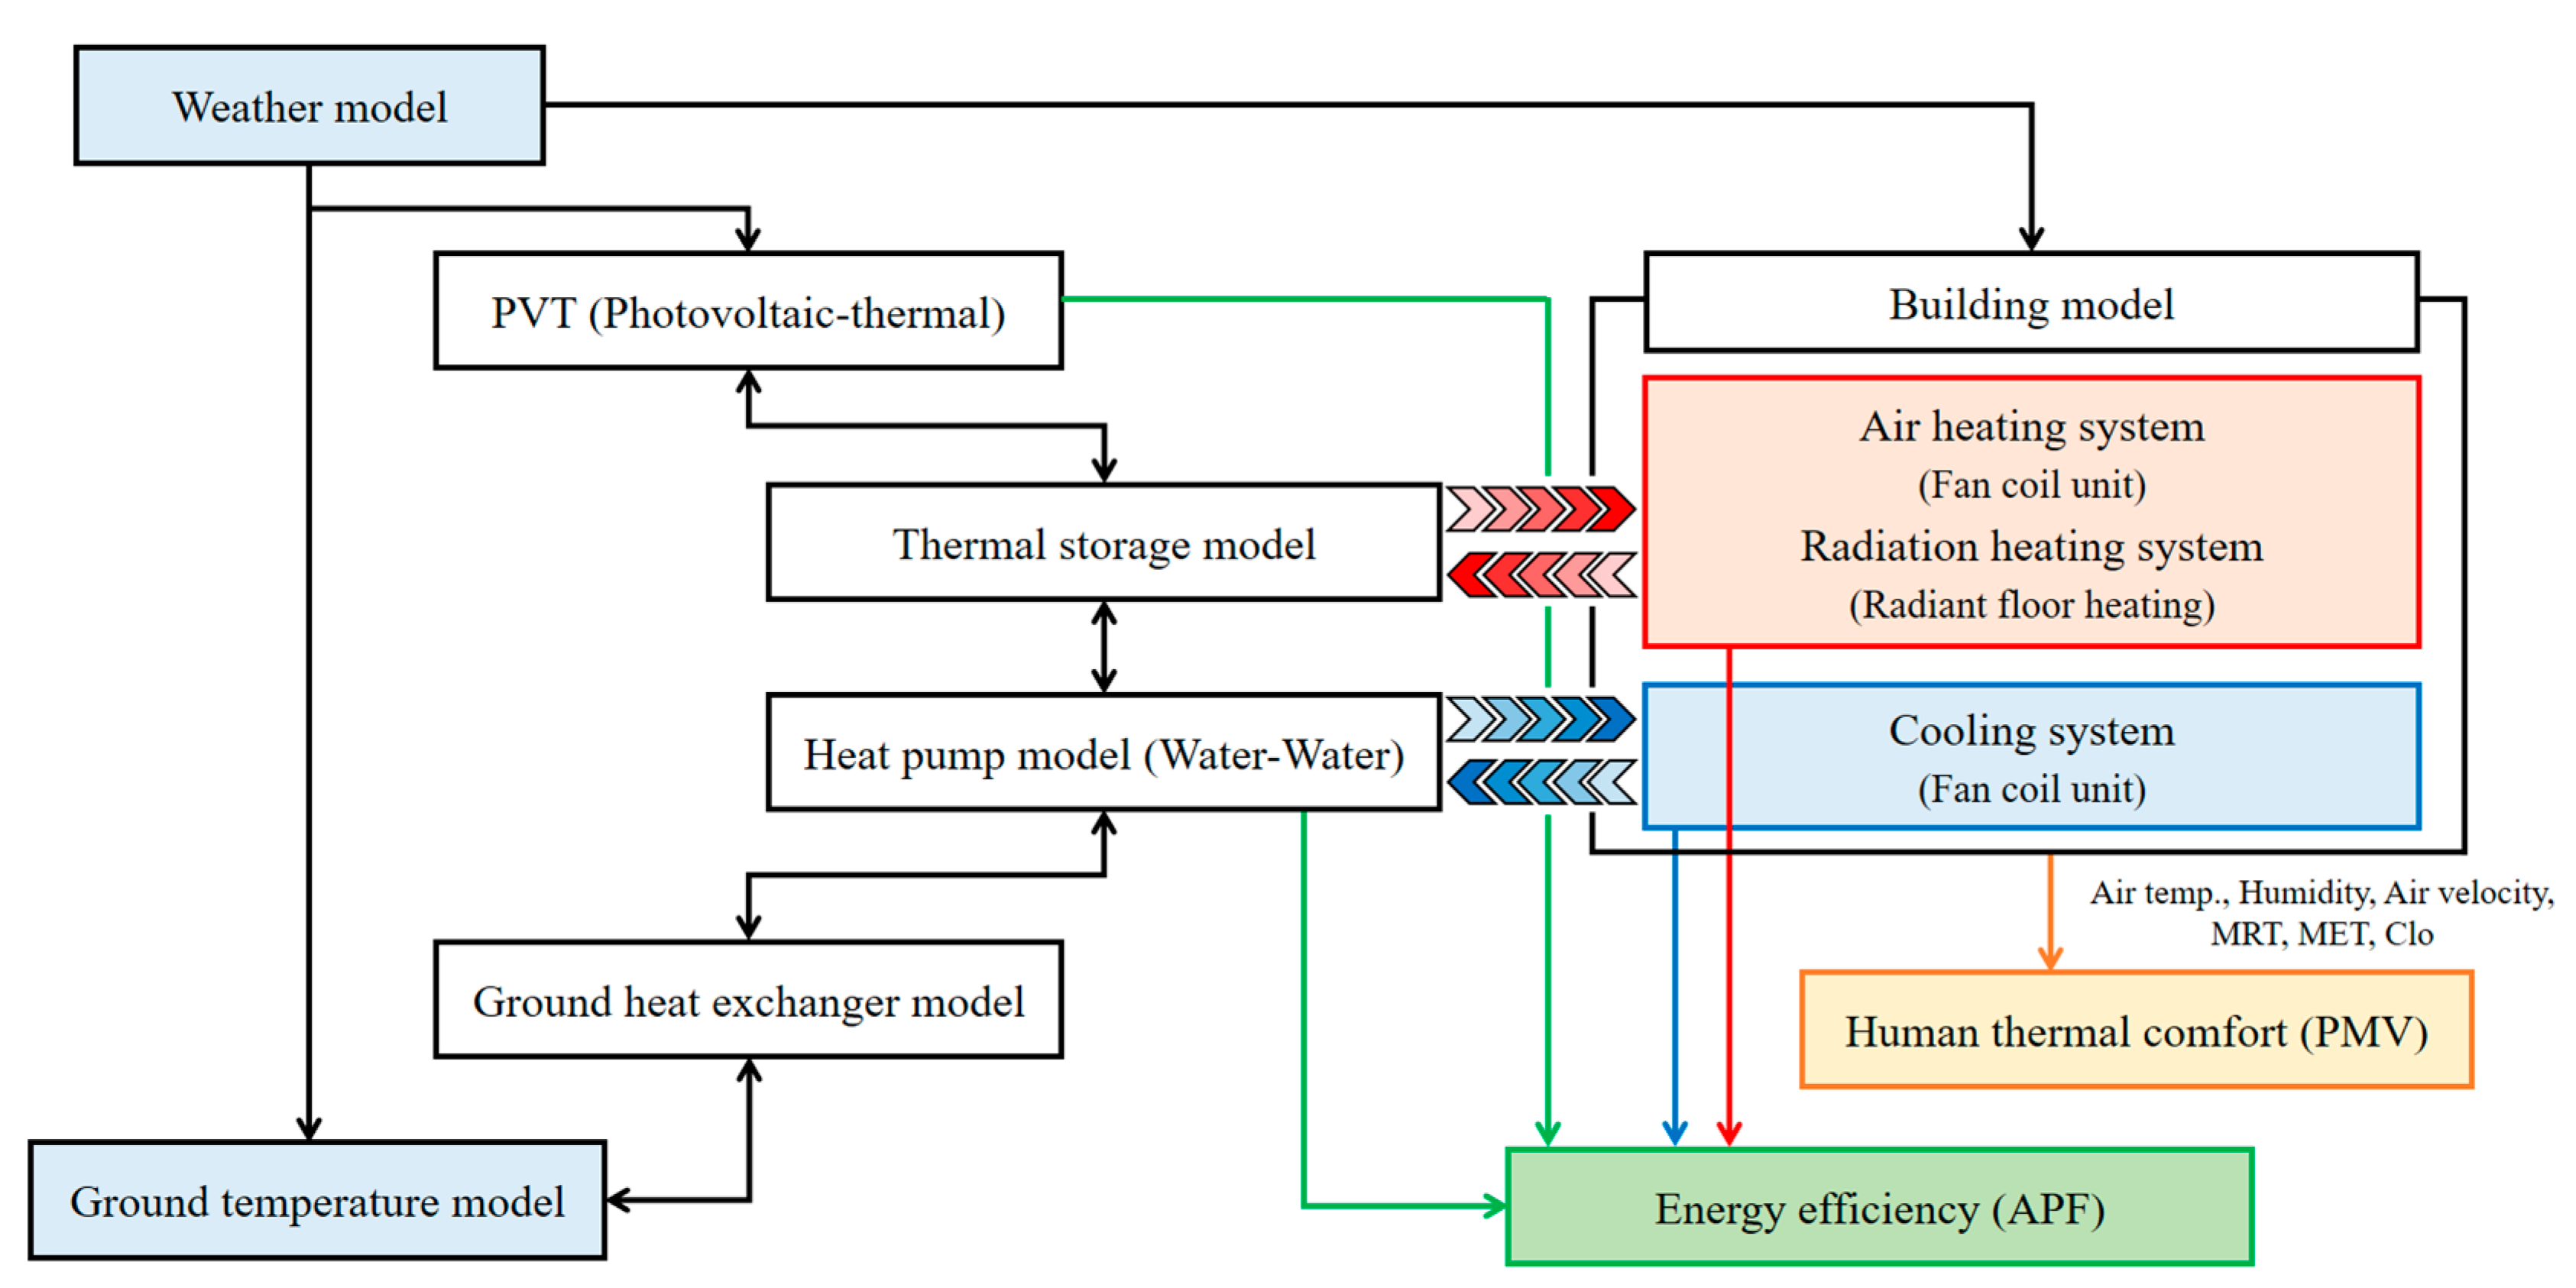
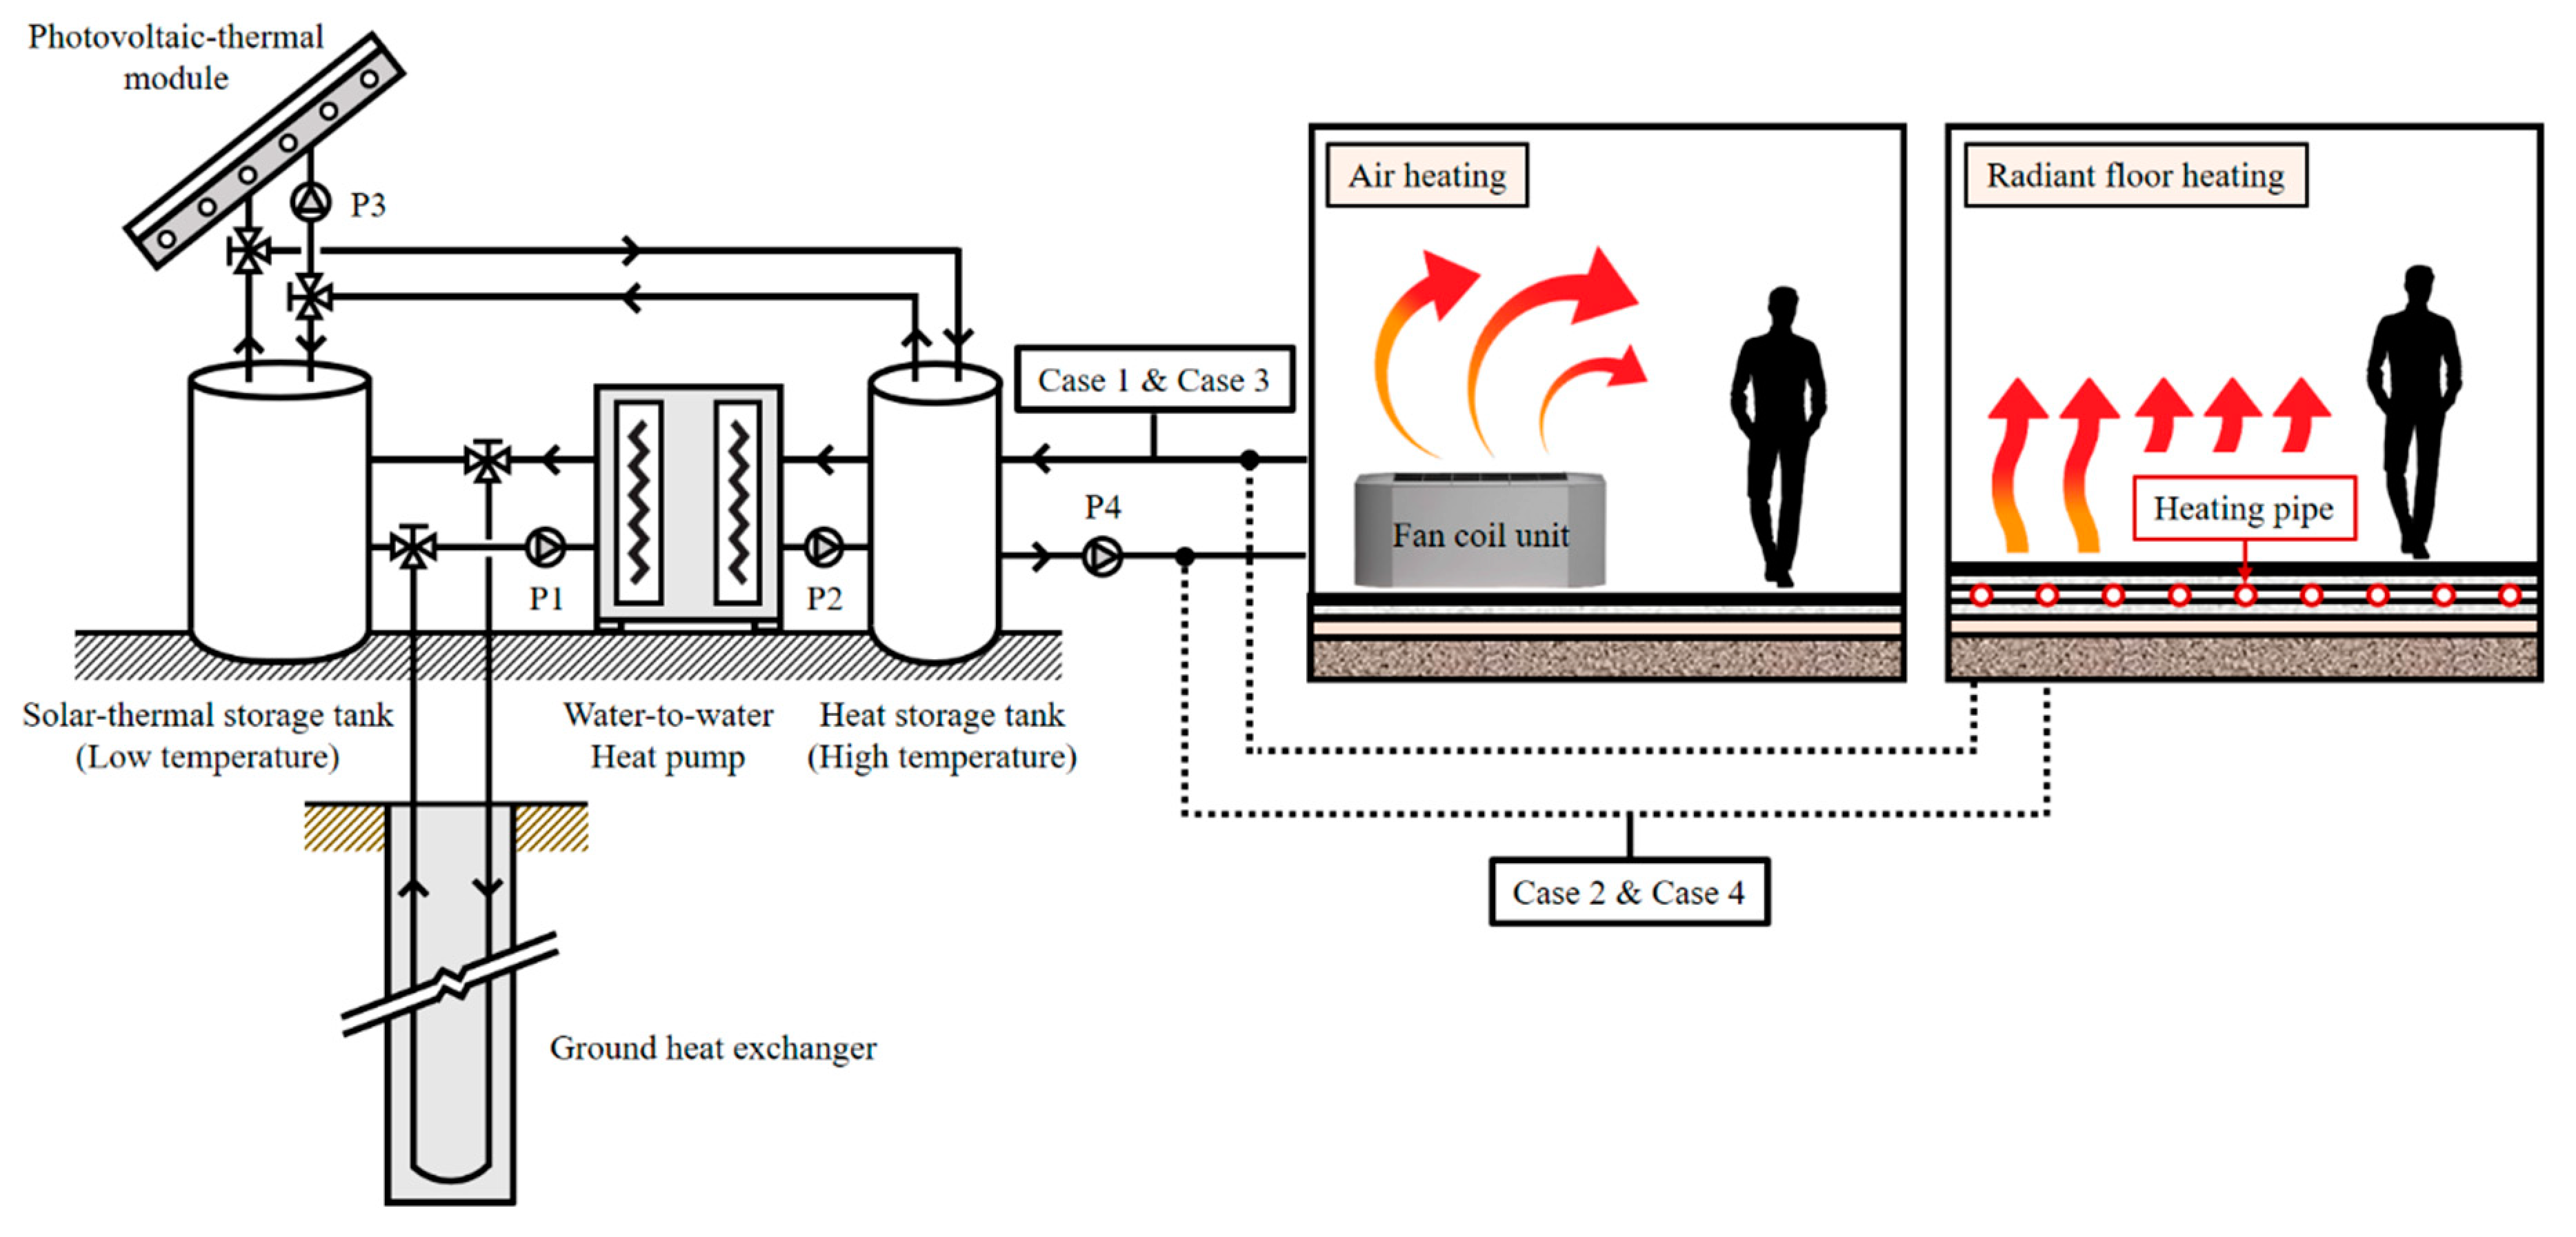
2. Integrated Simulation Model
2.1. Overview of the Integrated Simulation Model
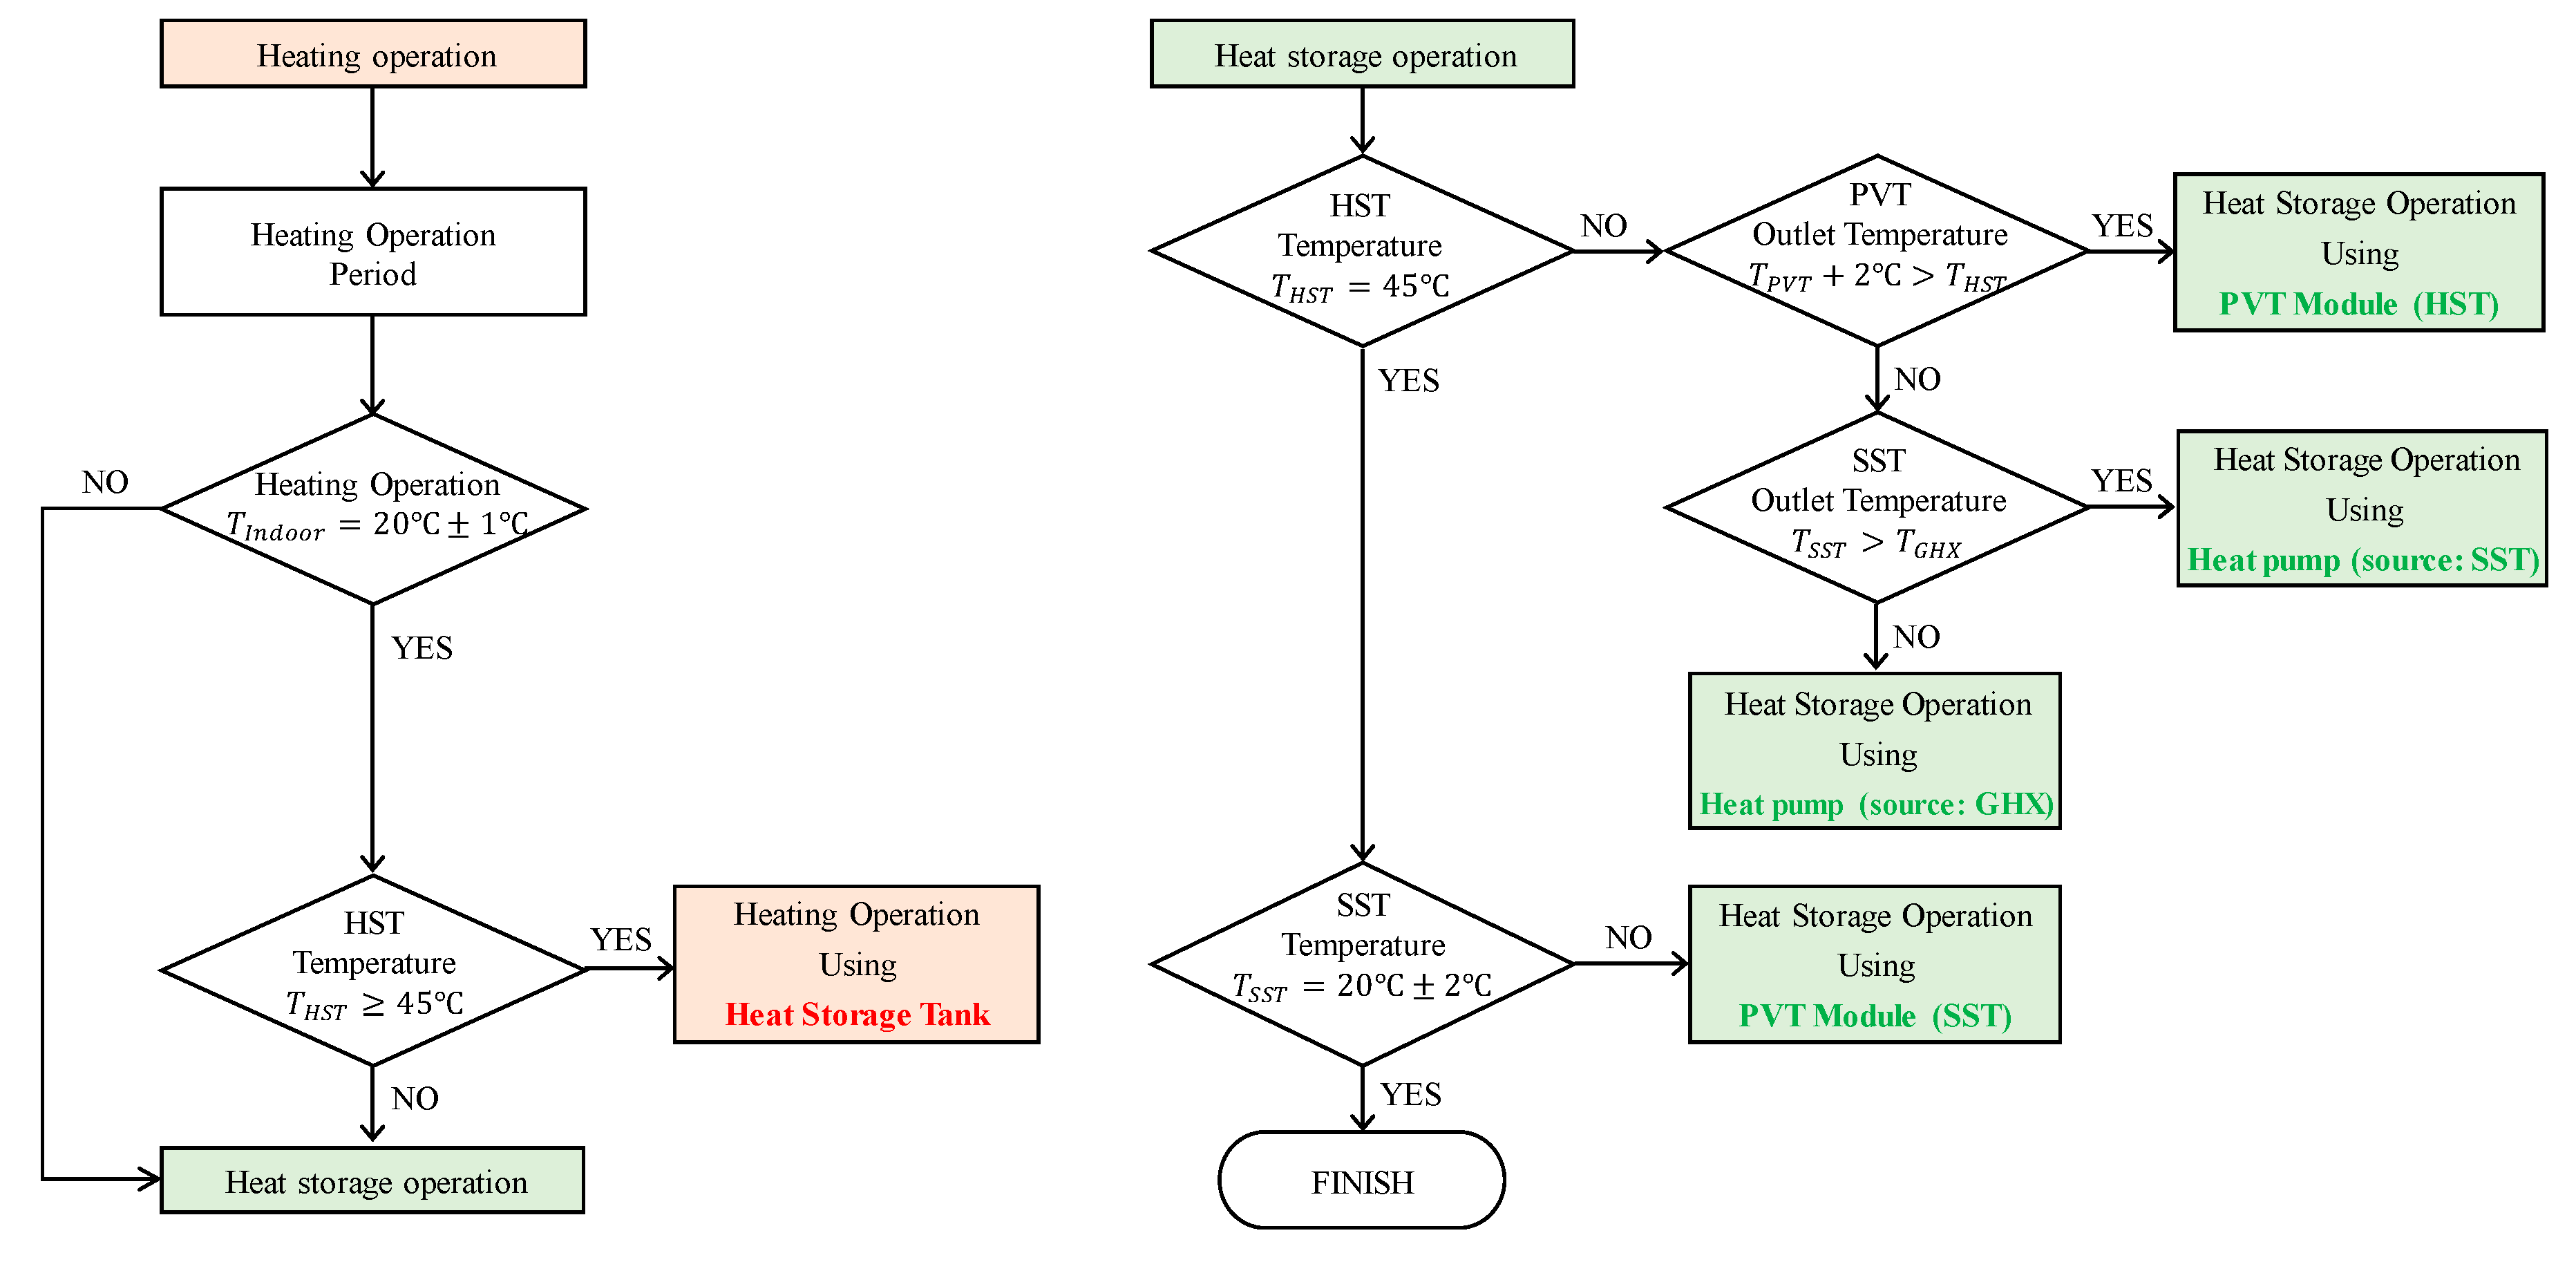
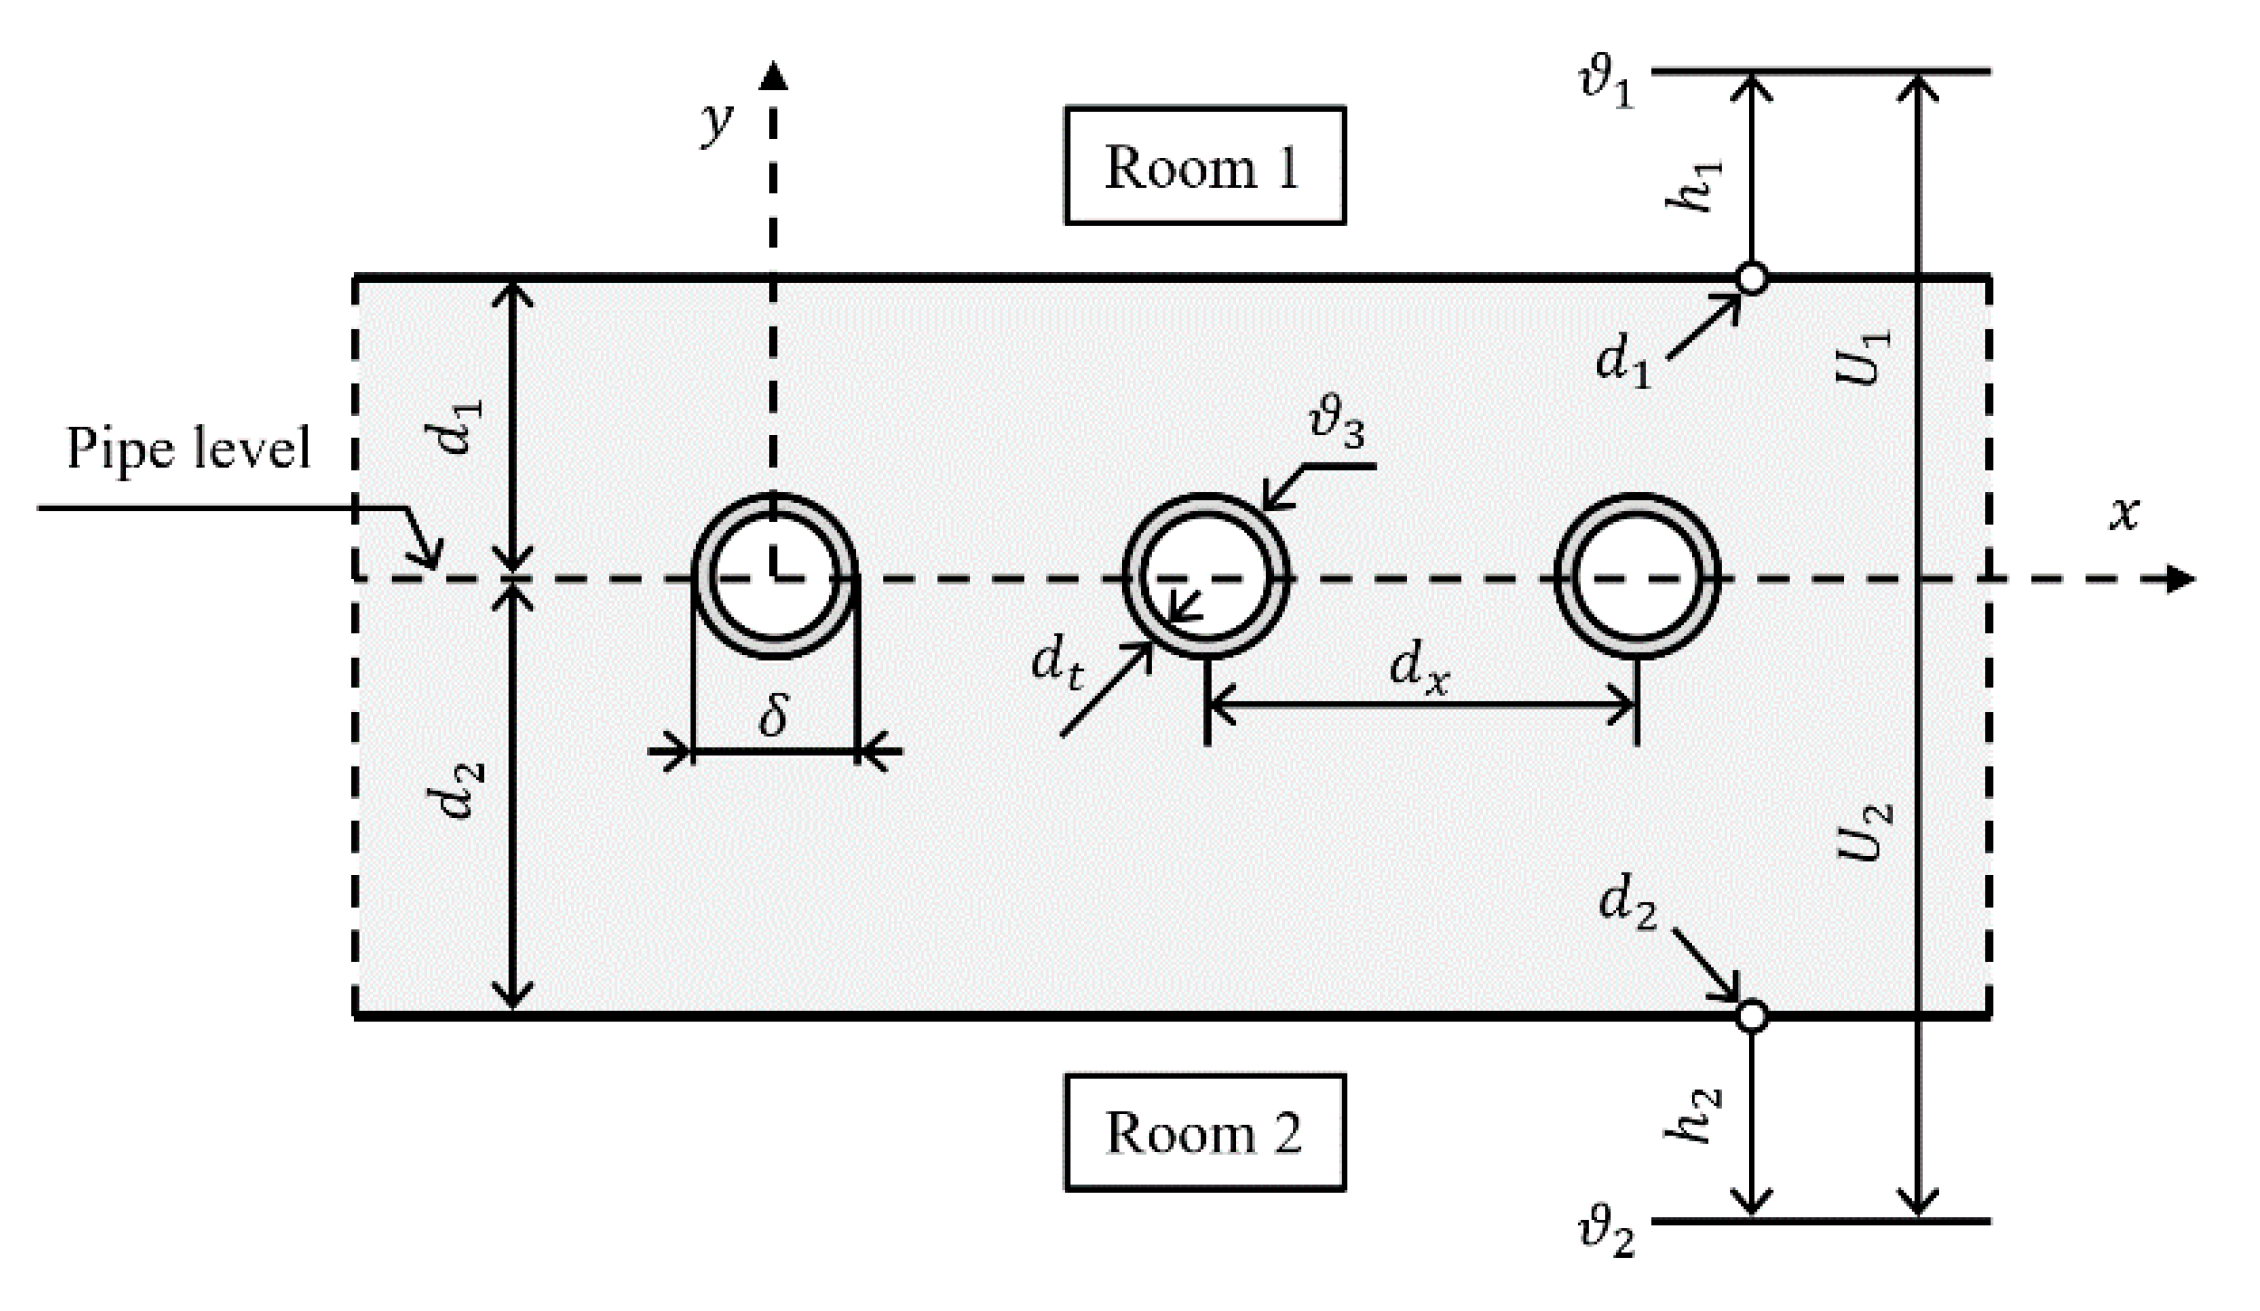
2.2. Analysis Method (Equation) of Integrated Simulation Model
3. Simulation Condition and Cases
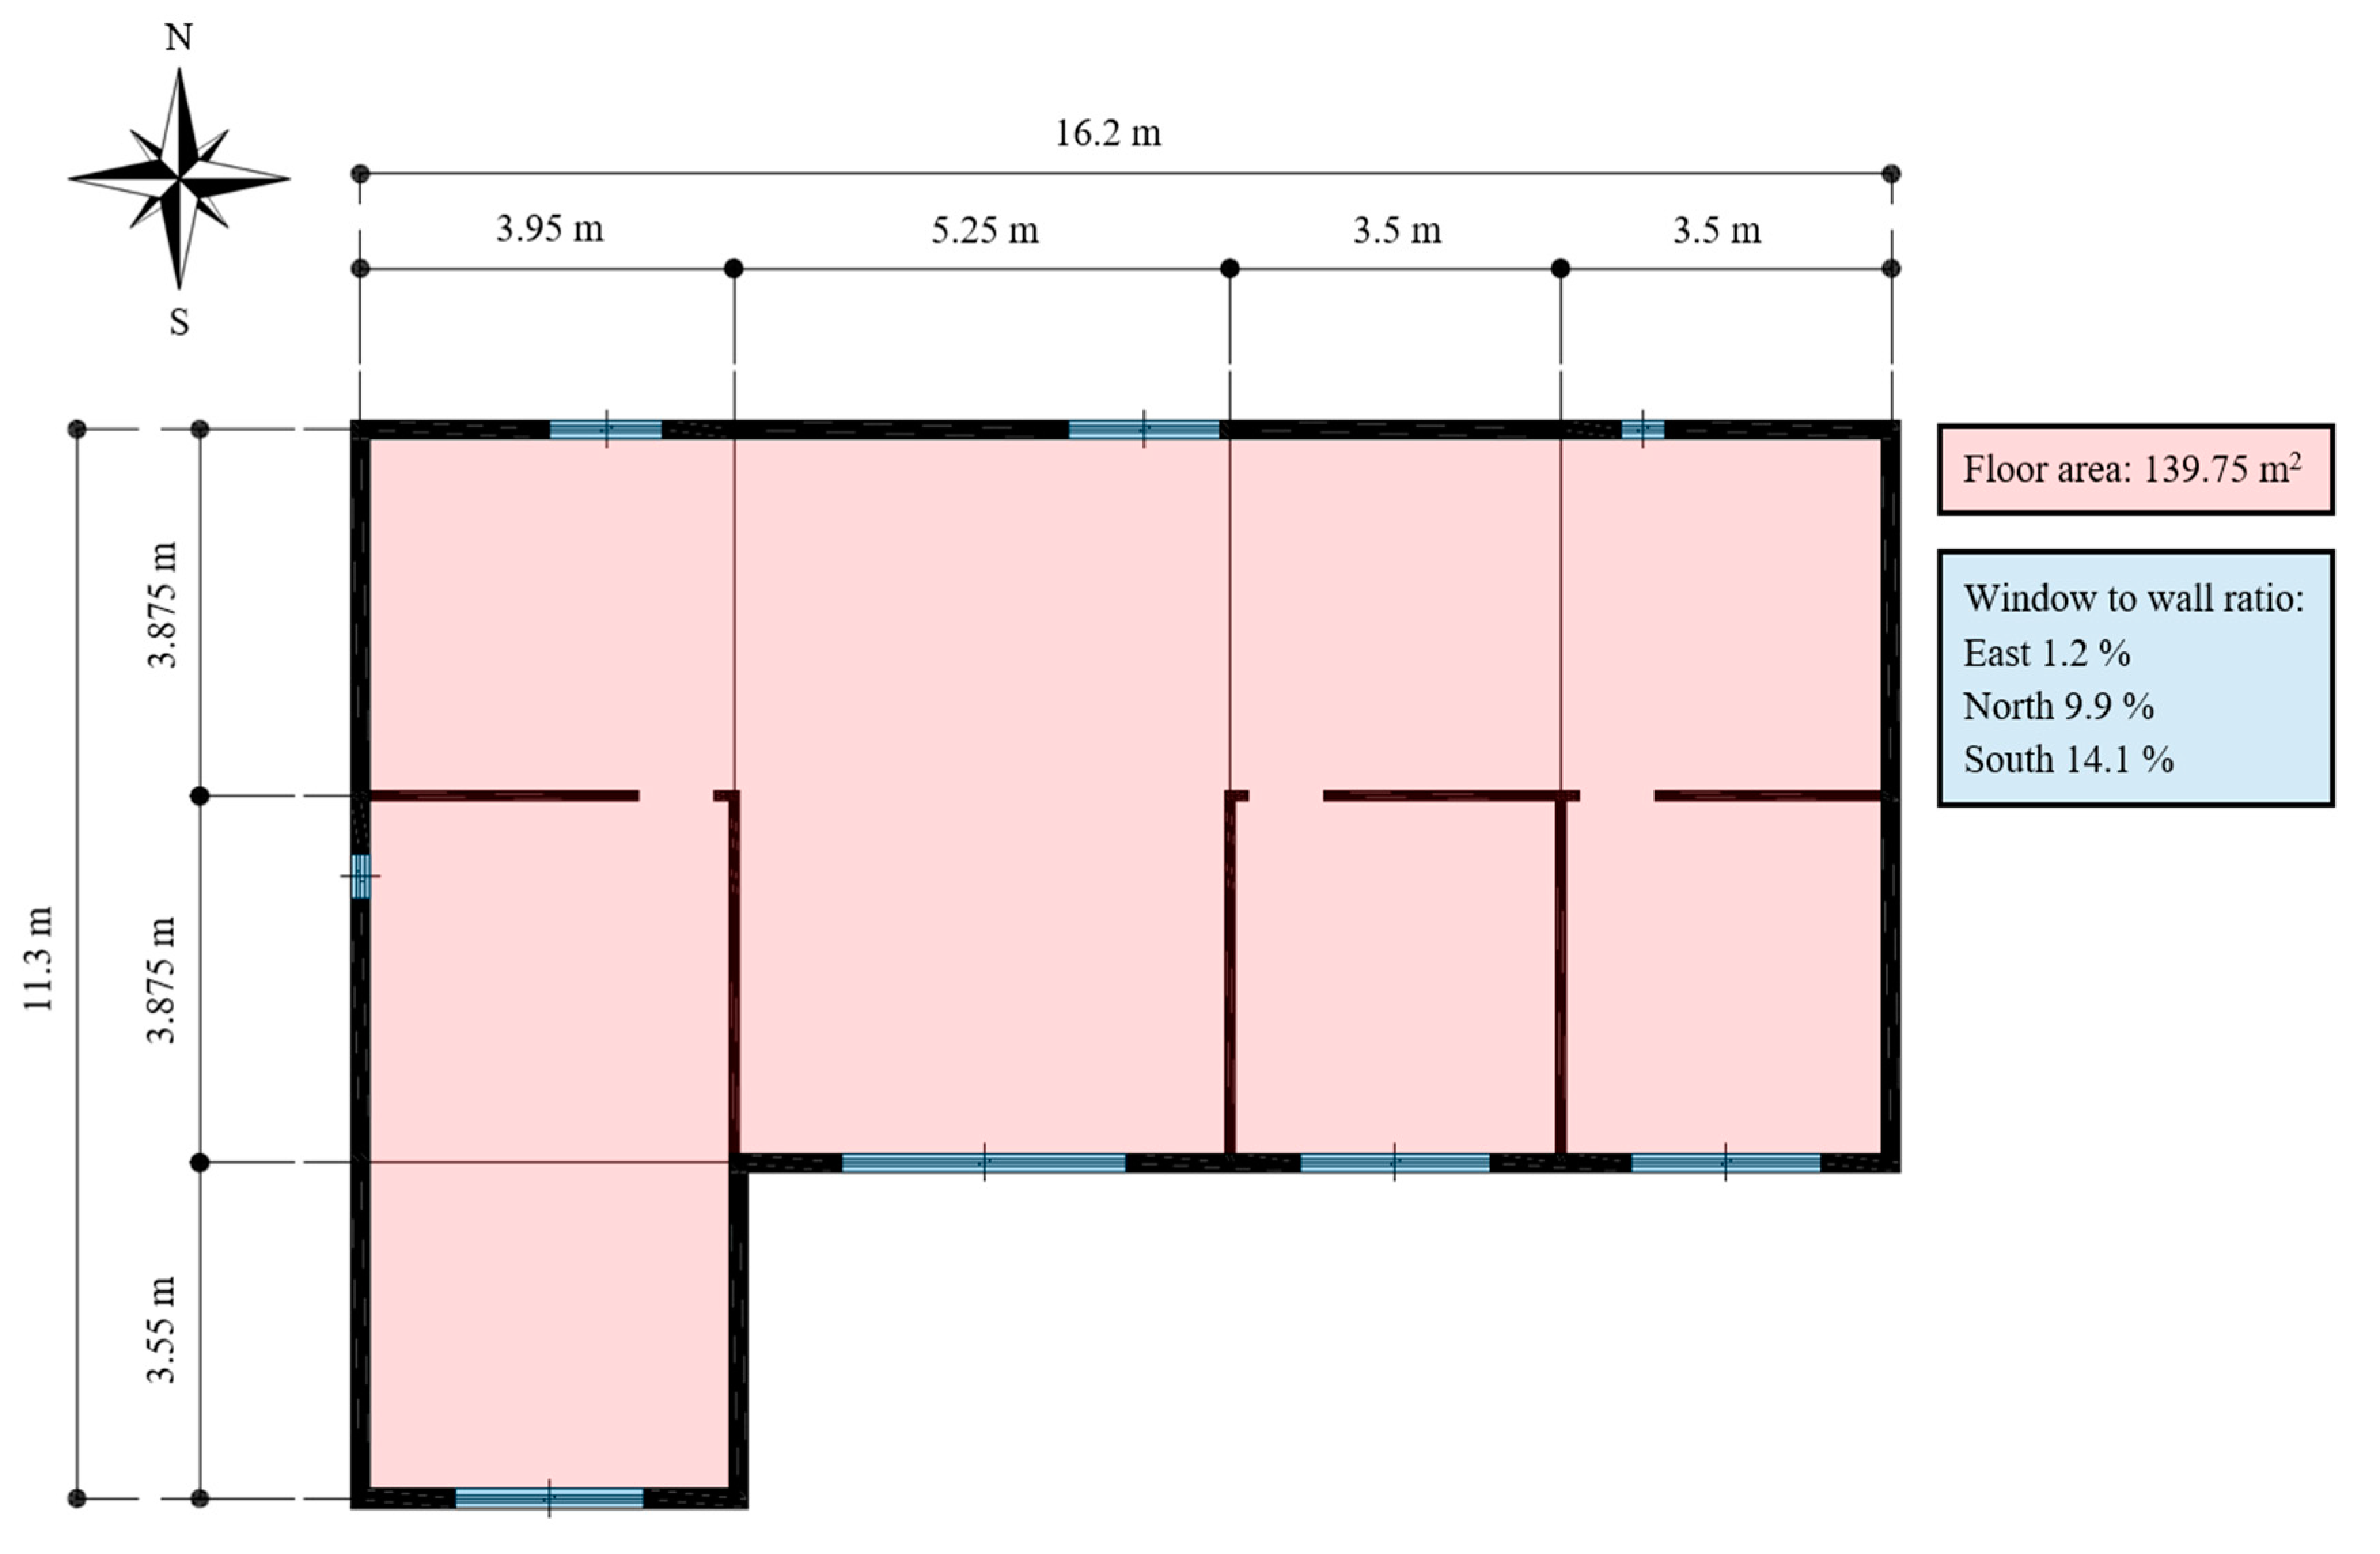
3.1. Building Model Conditions
3.2. Simulation Cases
4. Simulation Result
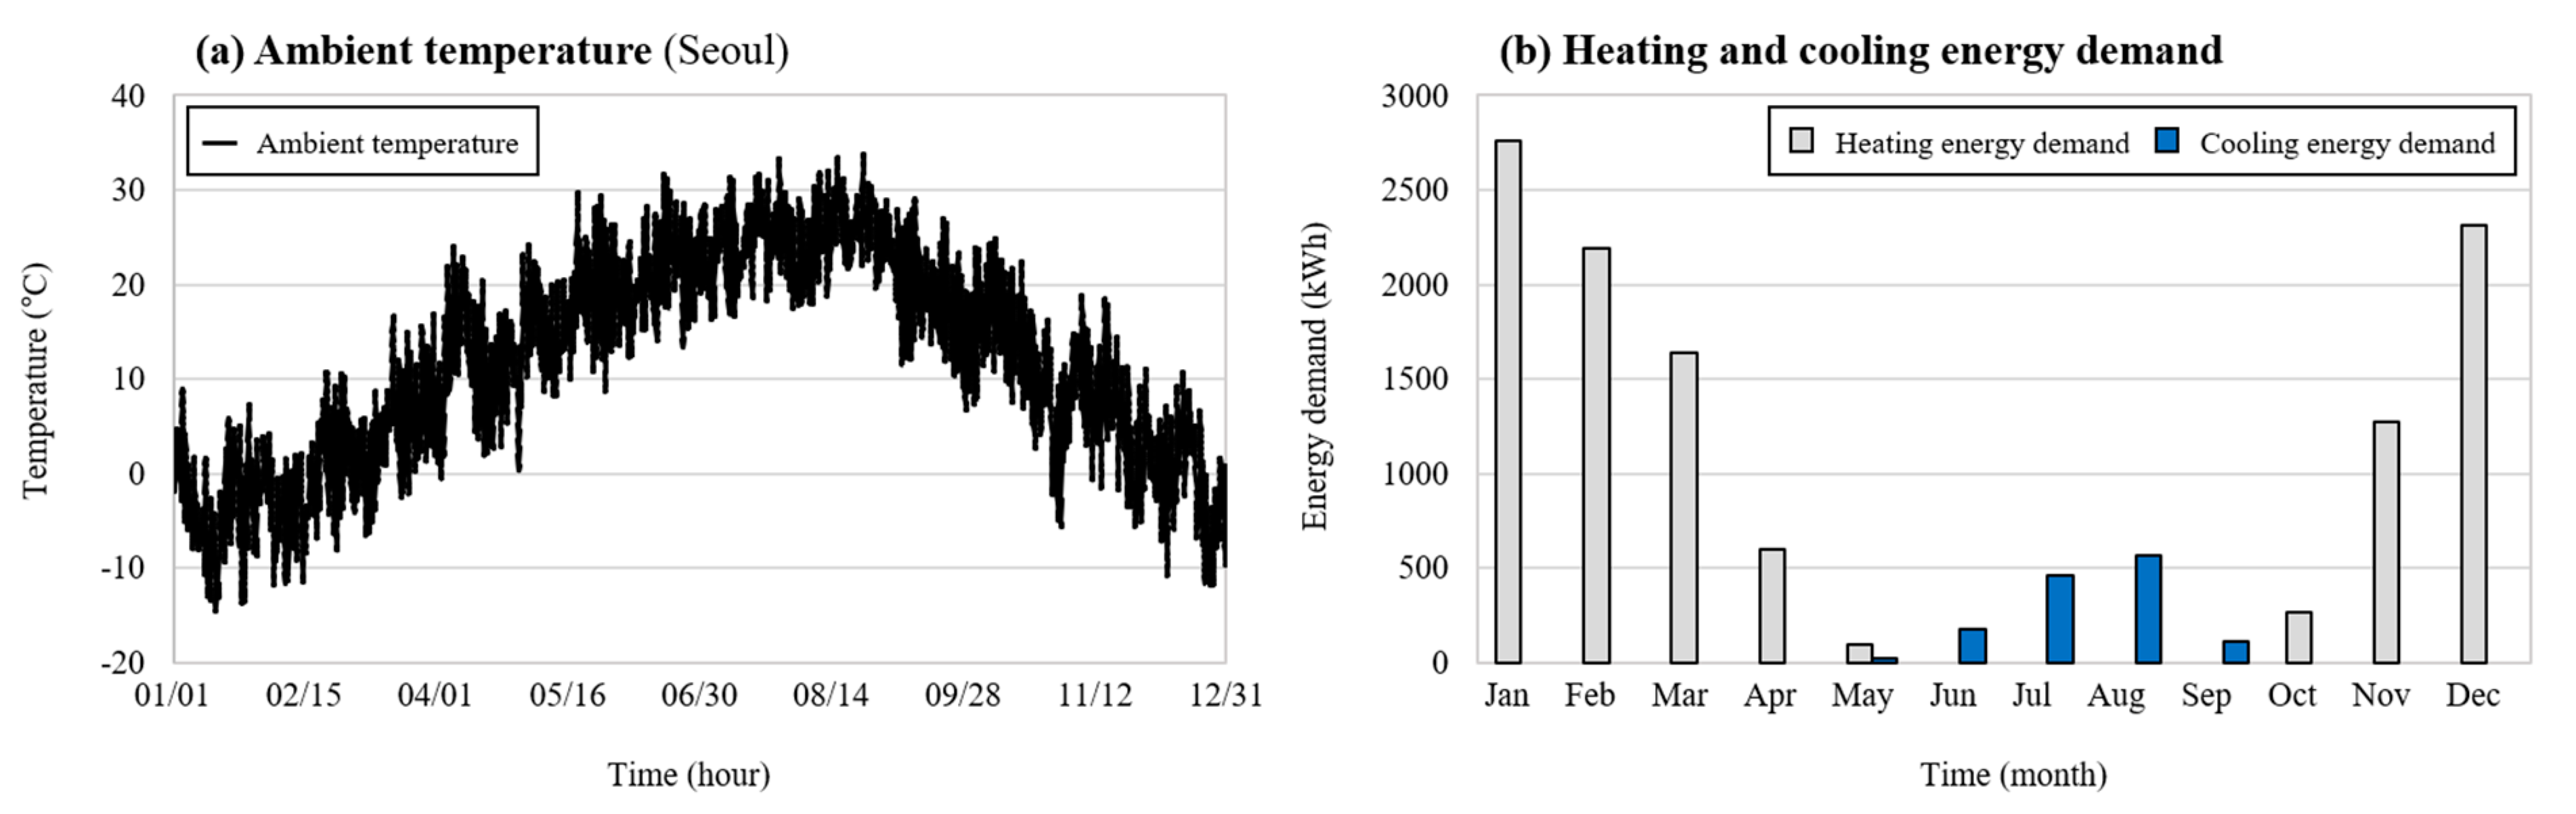
4.1. Building Load
4.2. Energy Efficiency
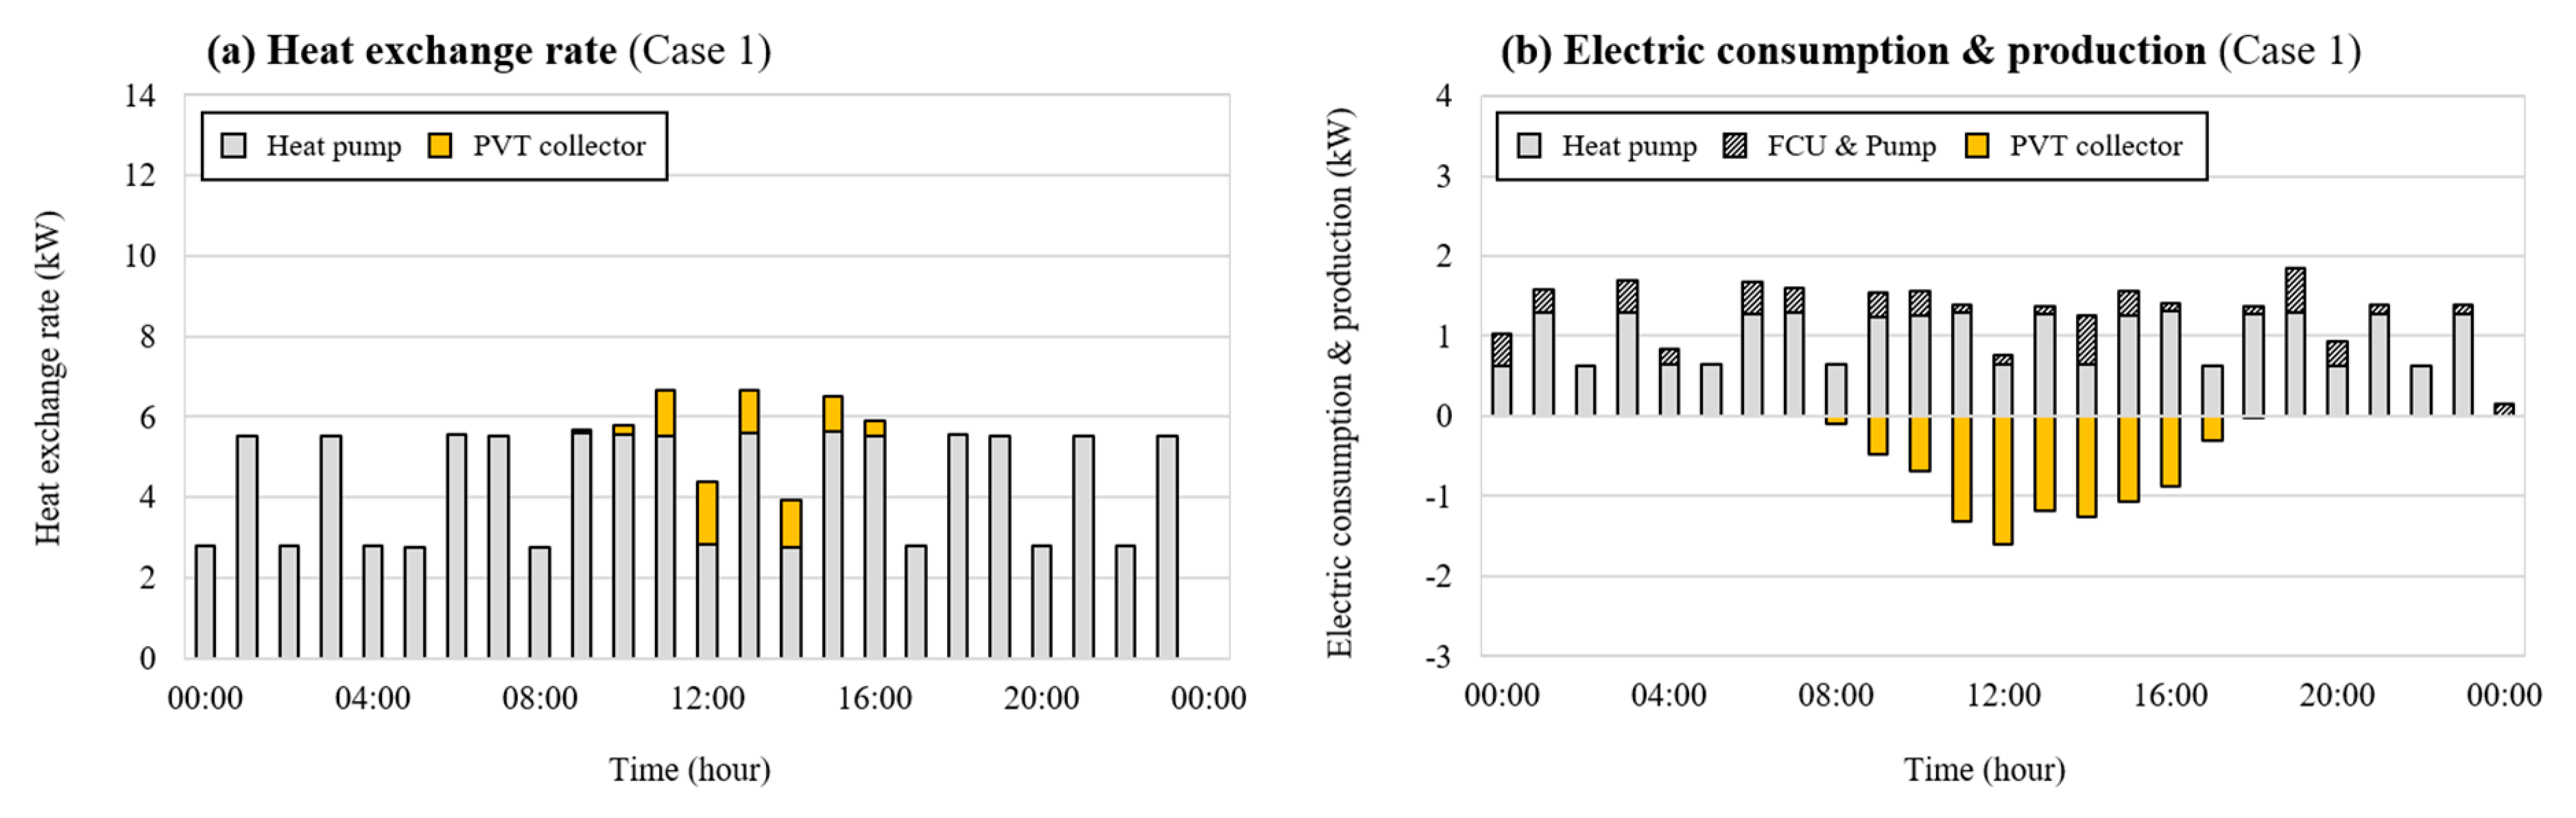
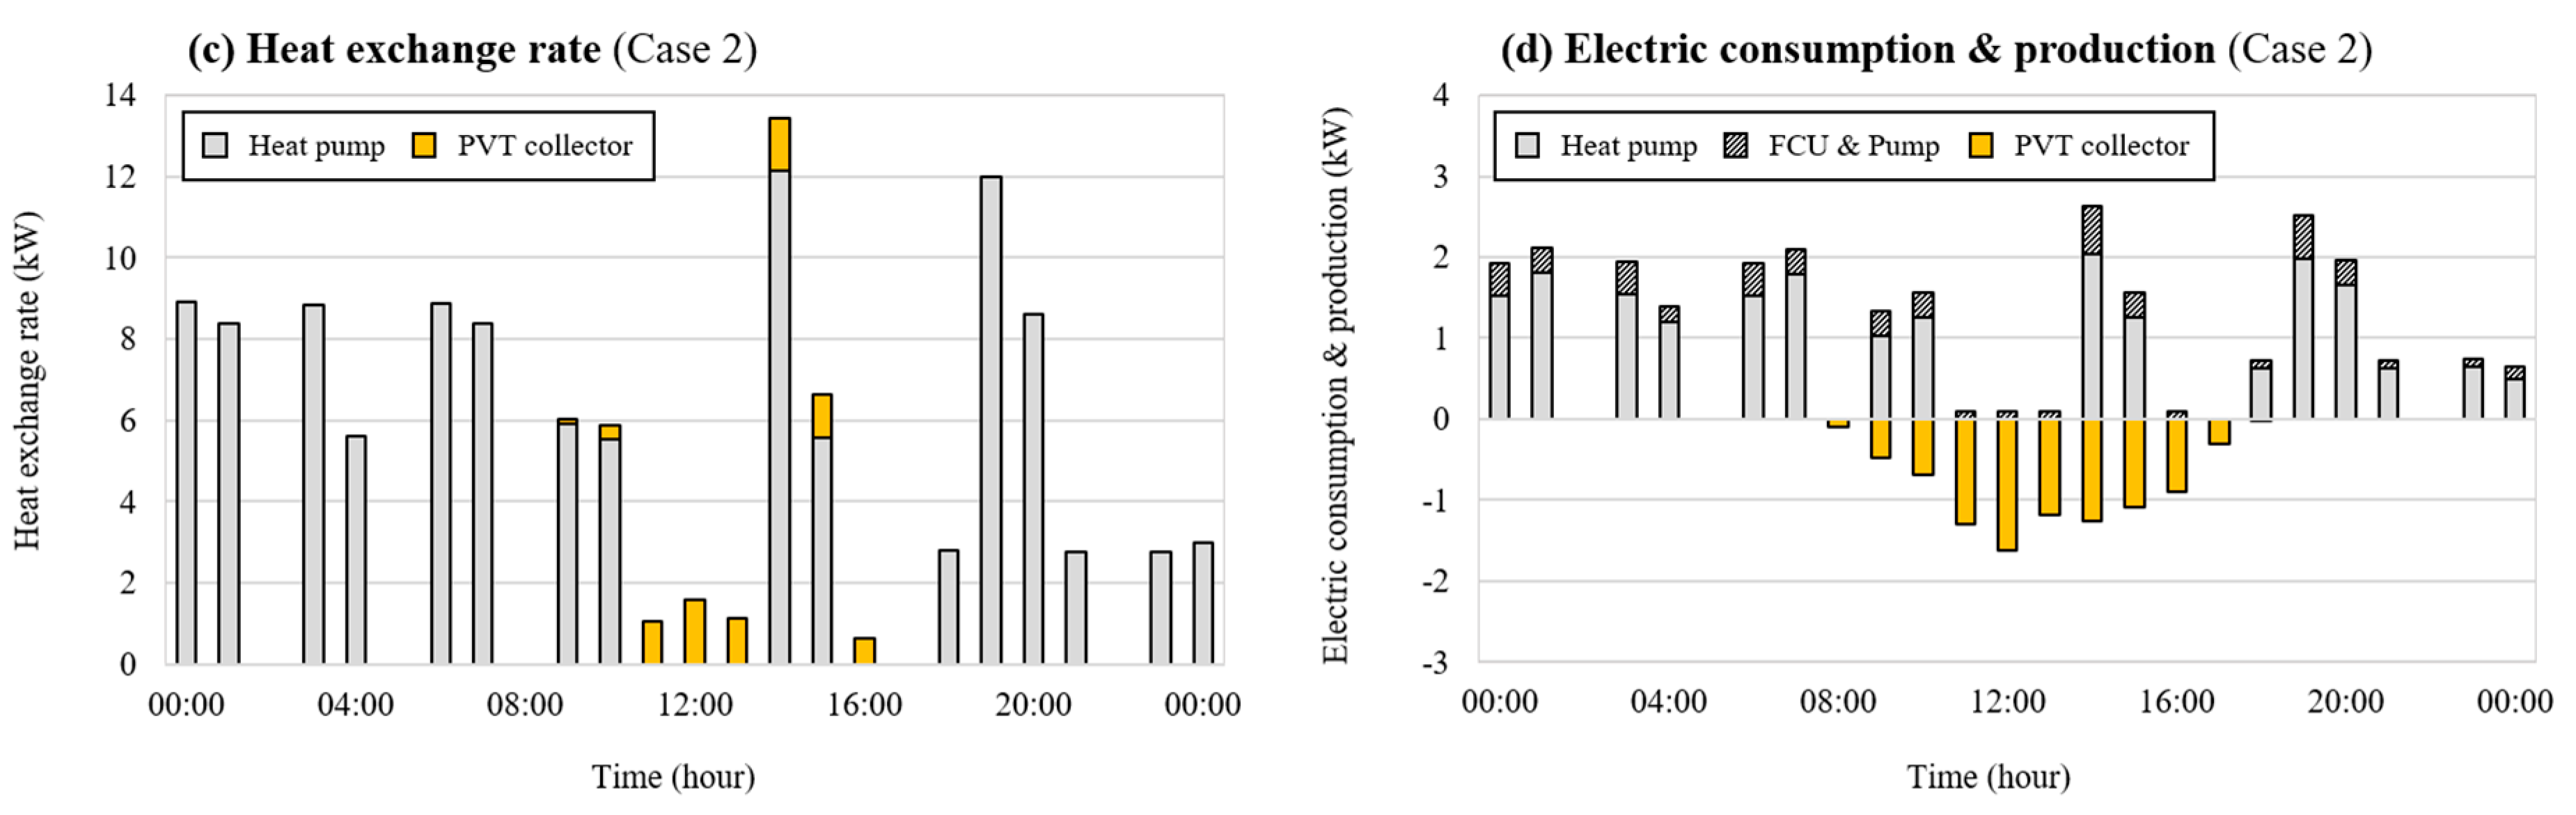
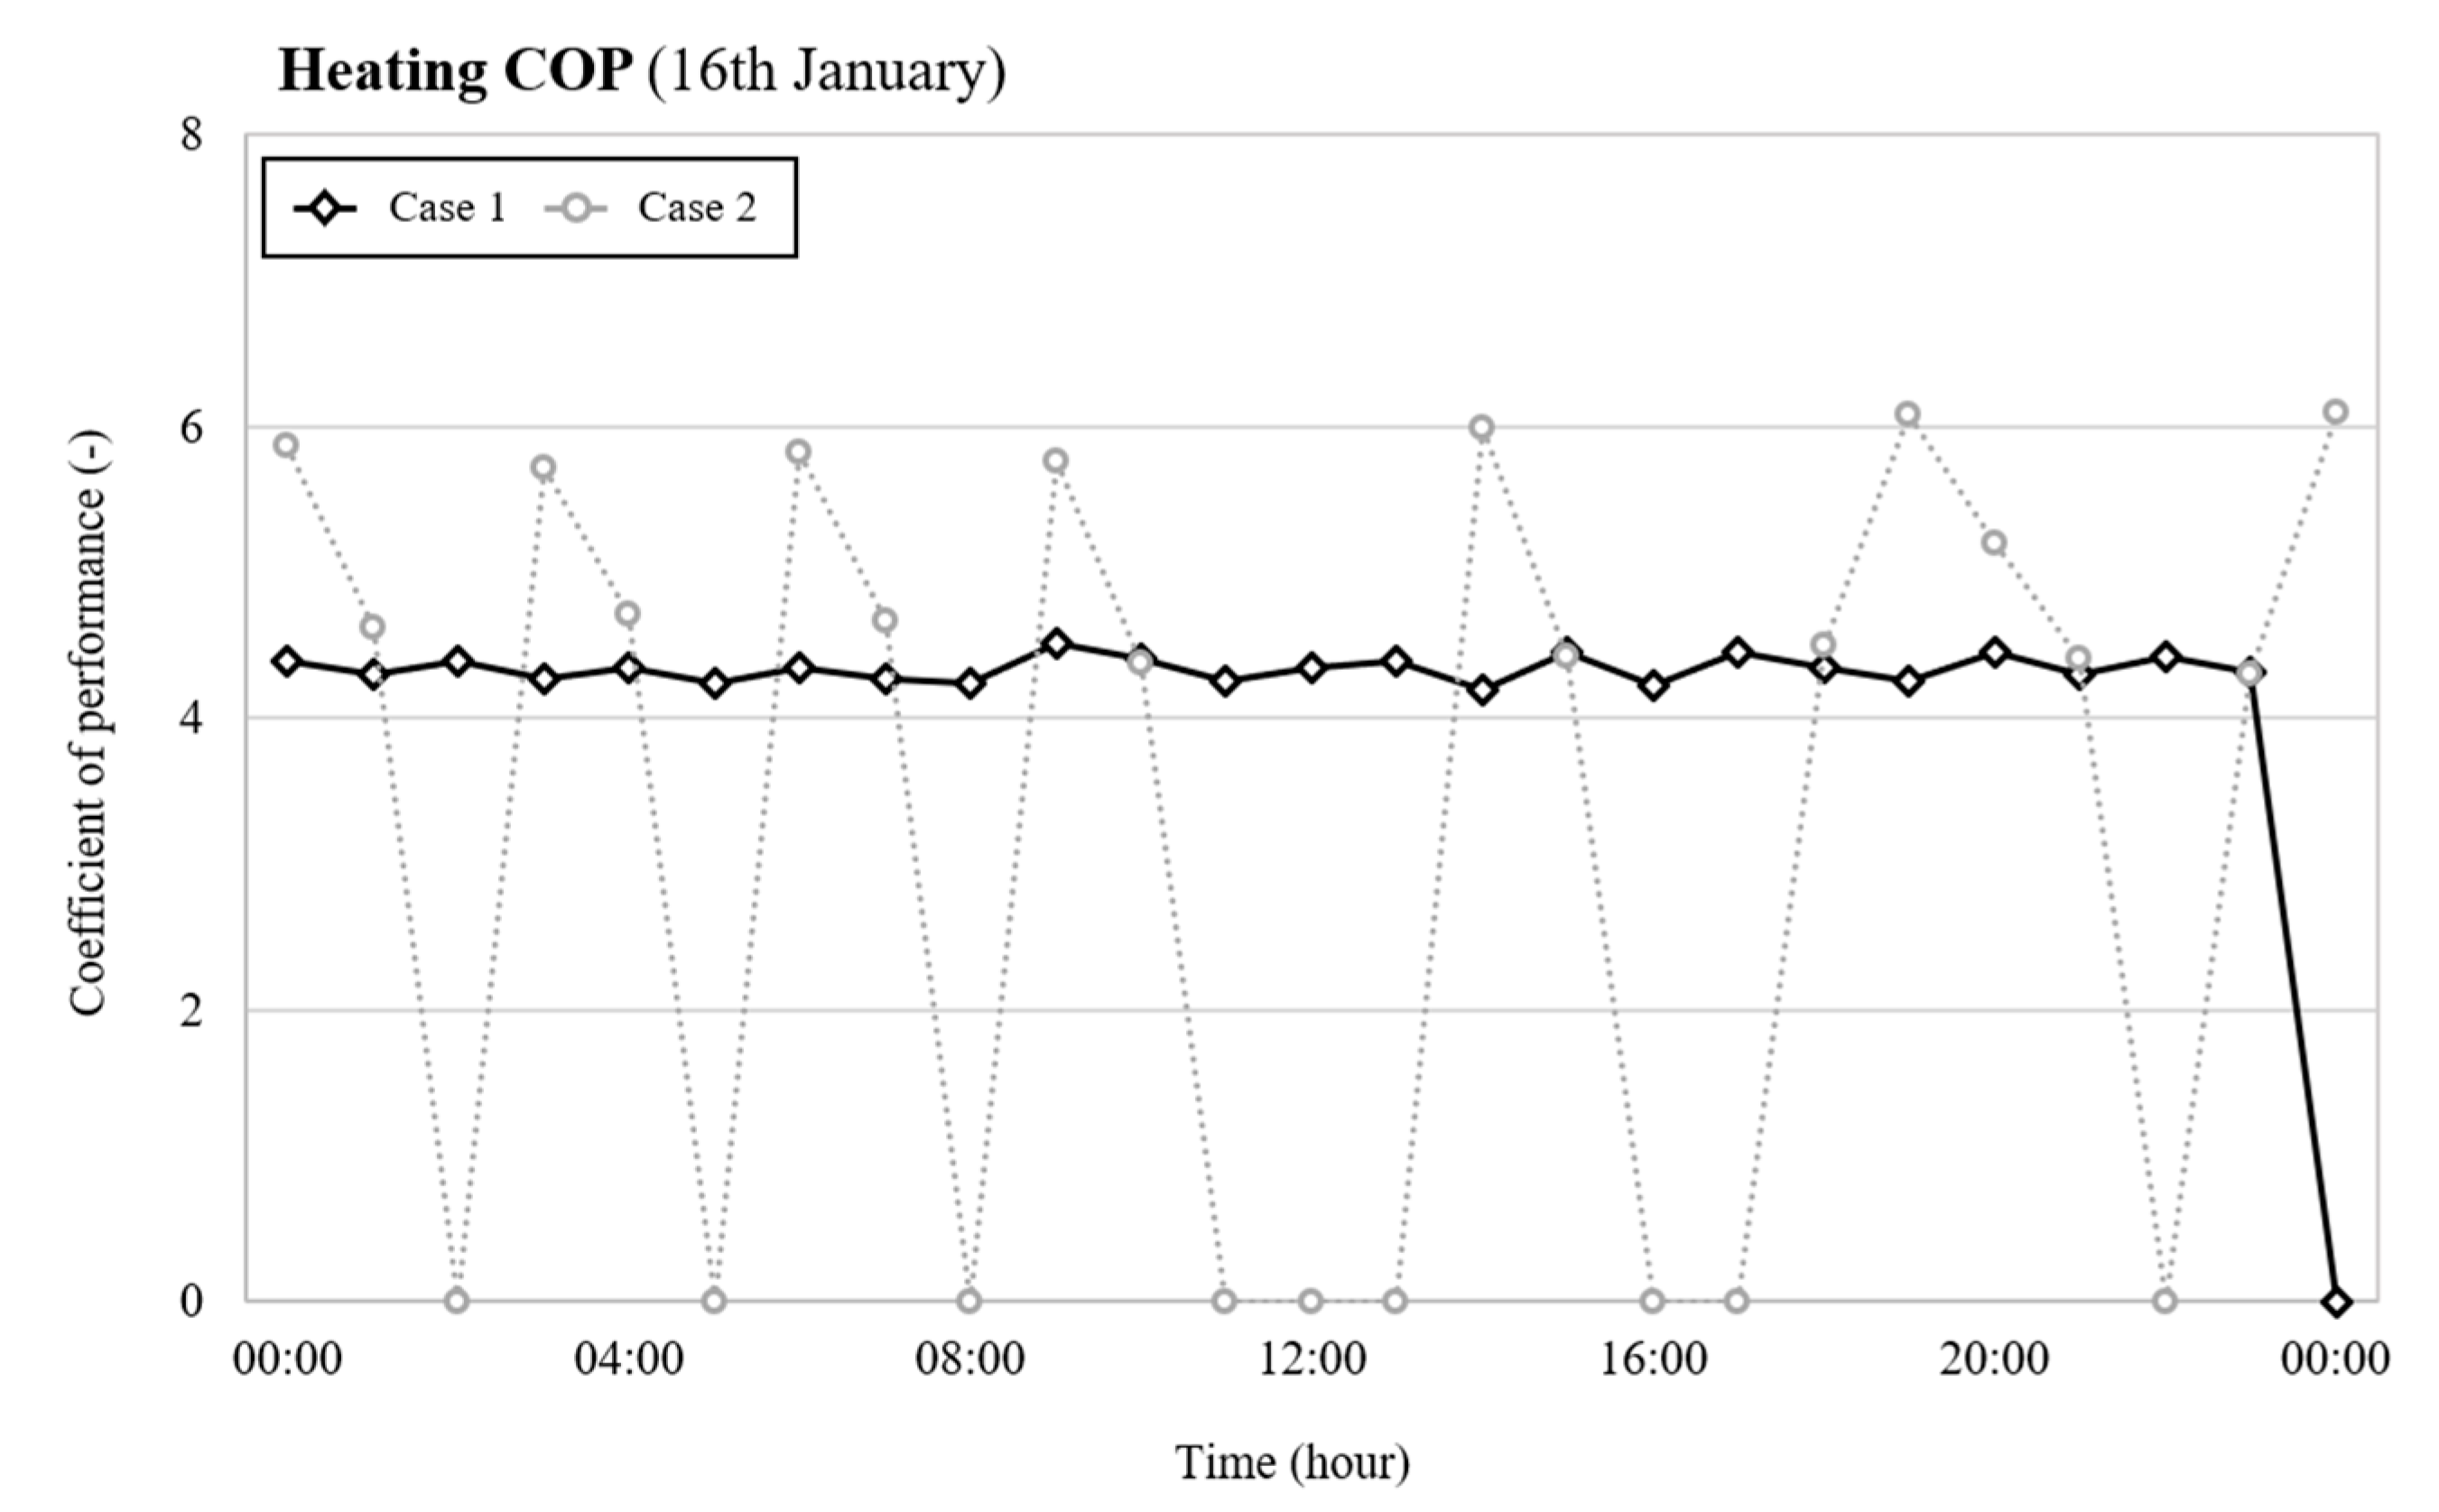
4.2.1. Thermal and Electric Performance on a Representative Day
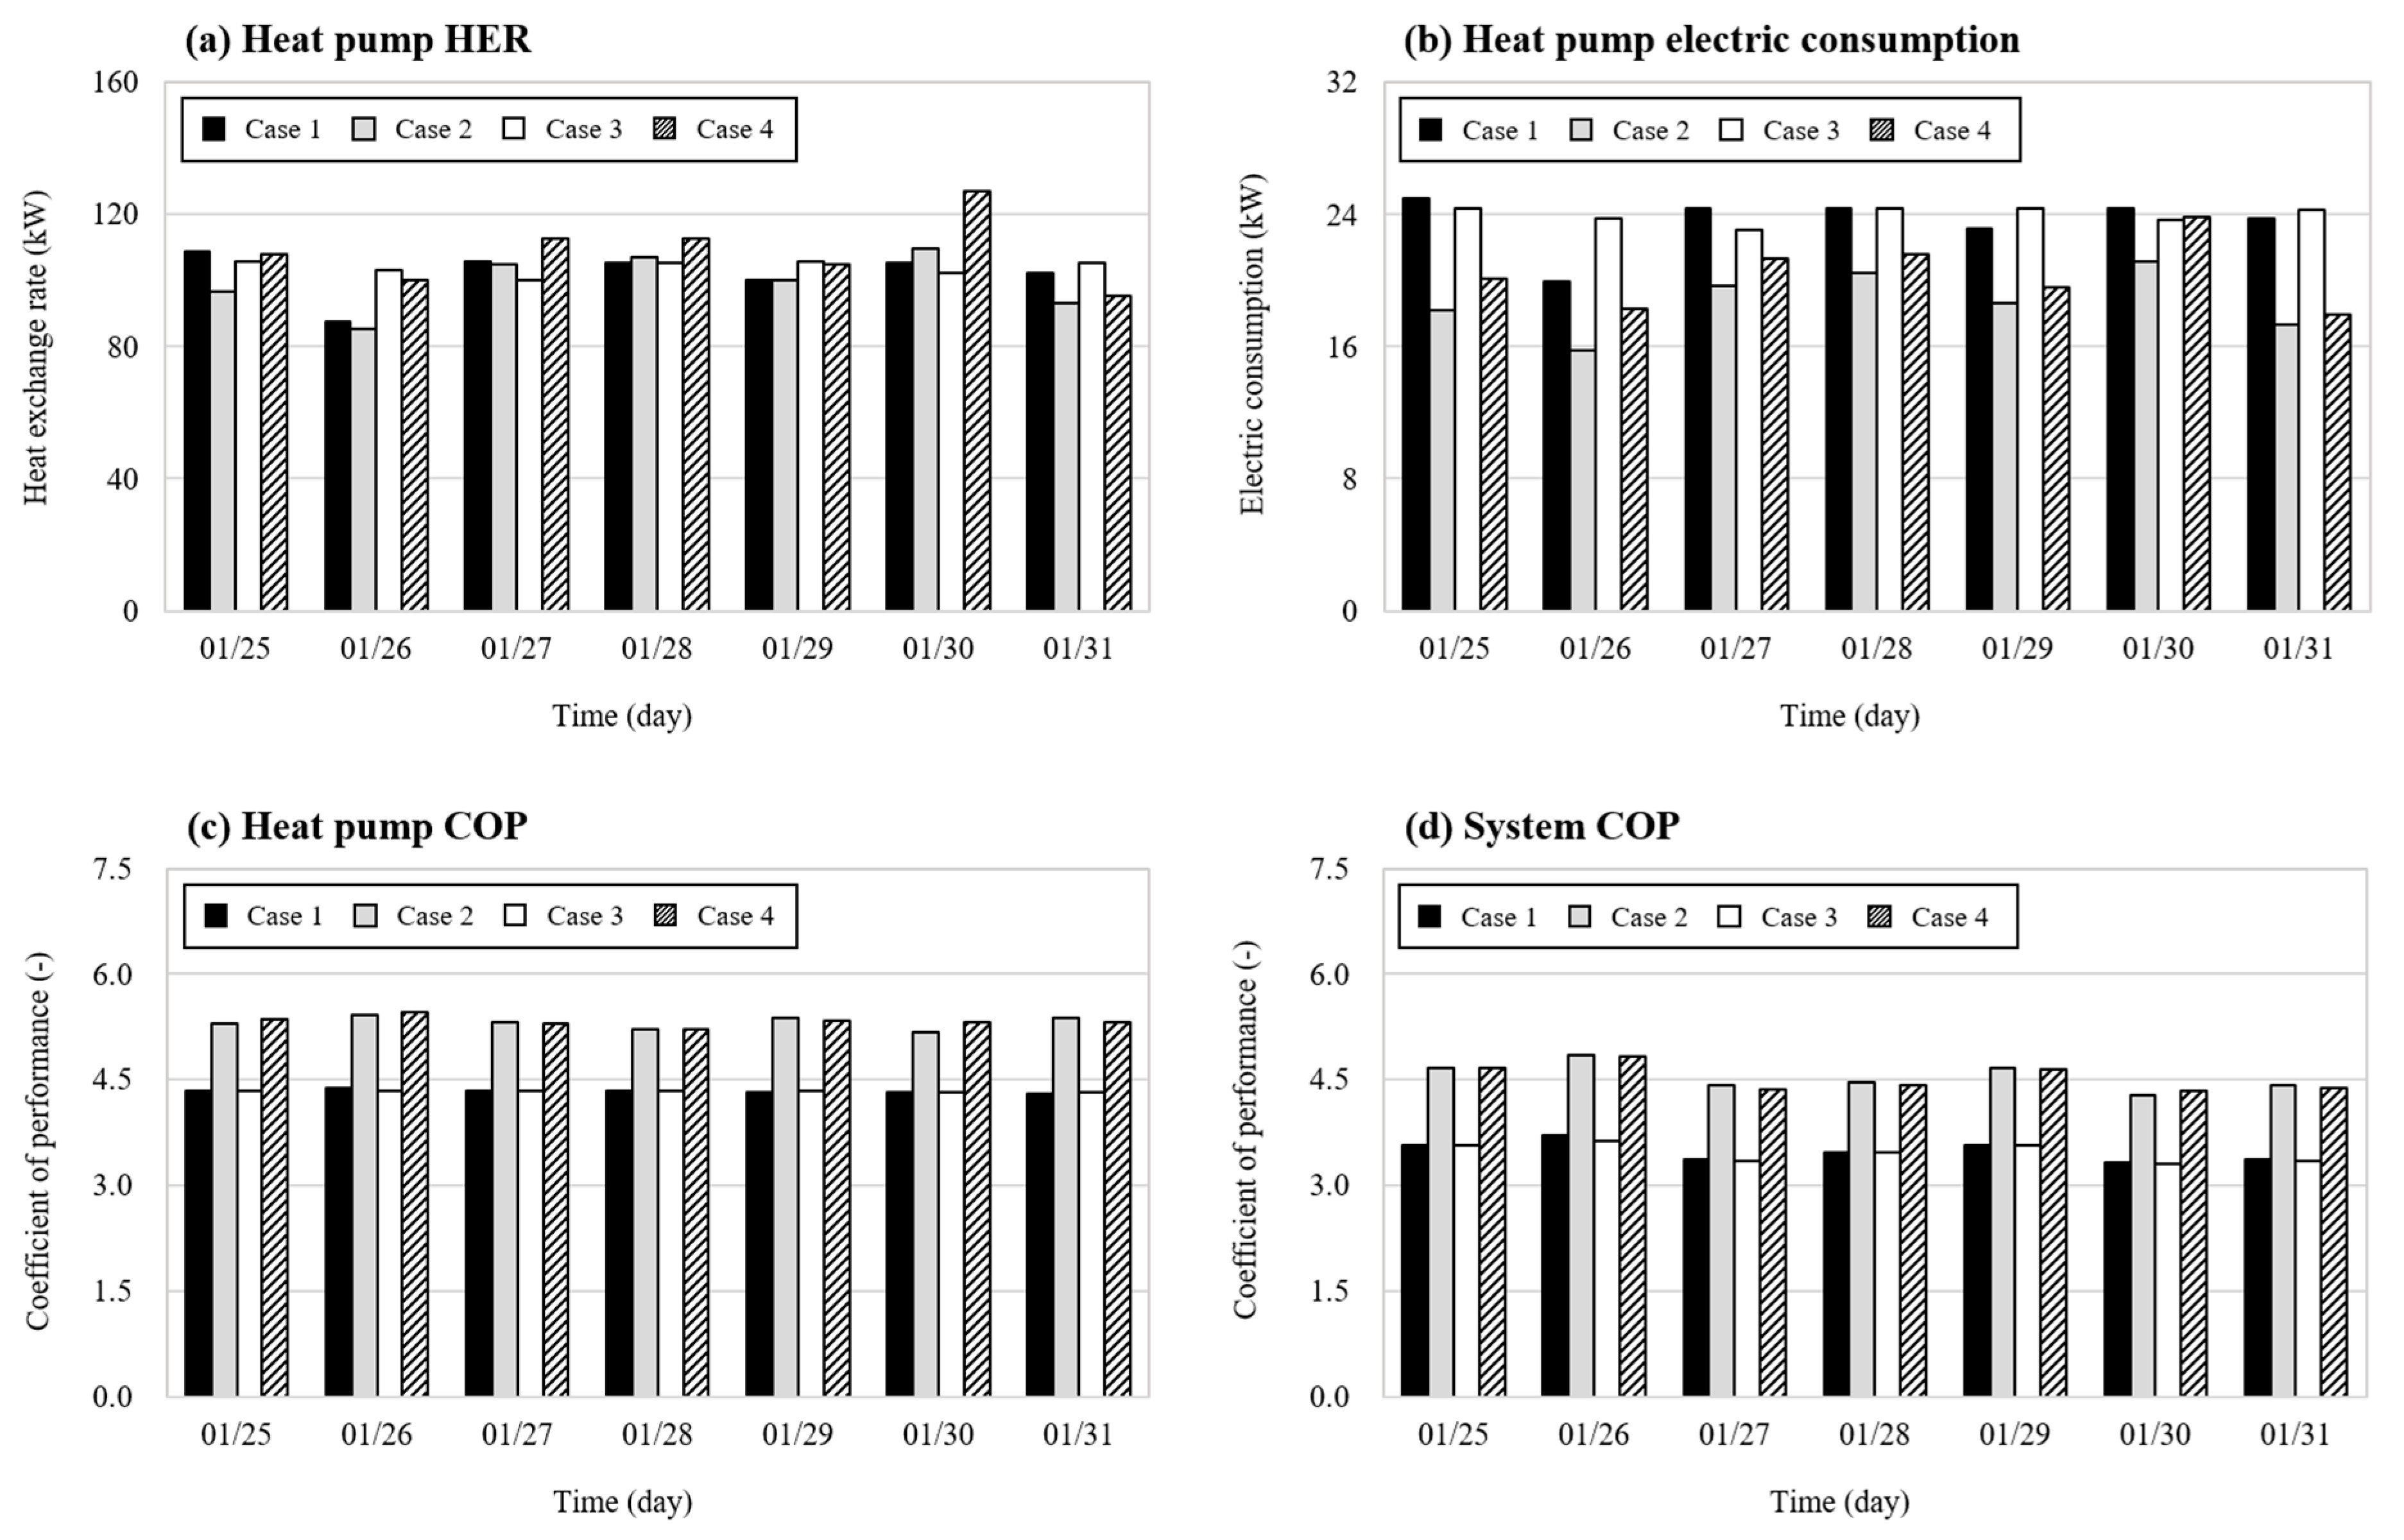
4.2.2. Weekly Performance of Heat Pump and System
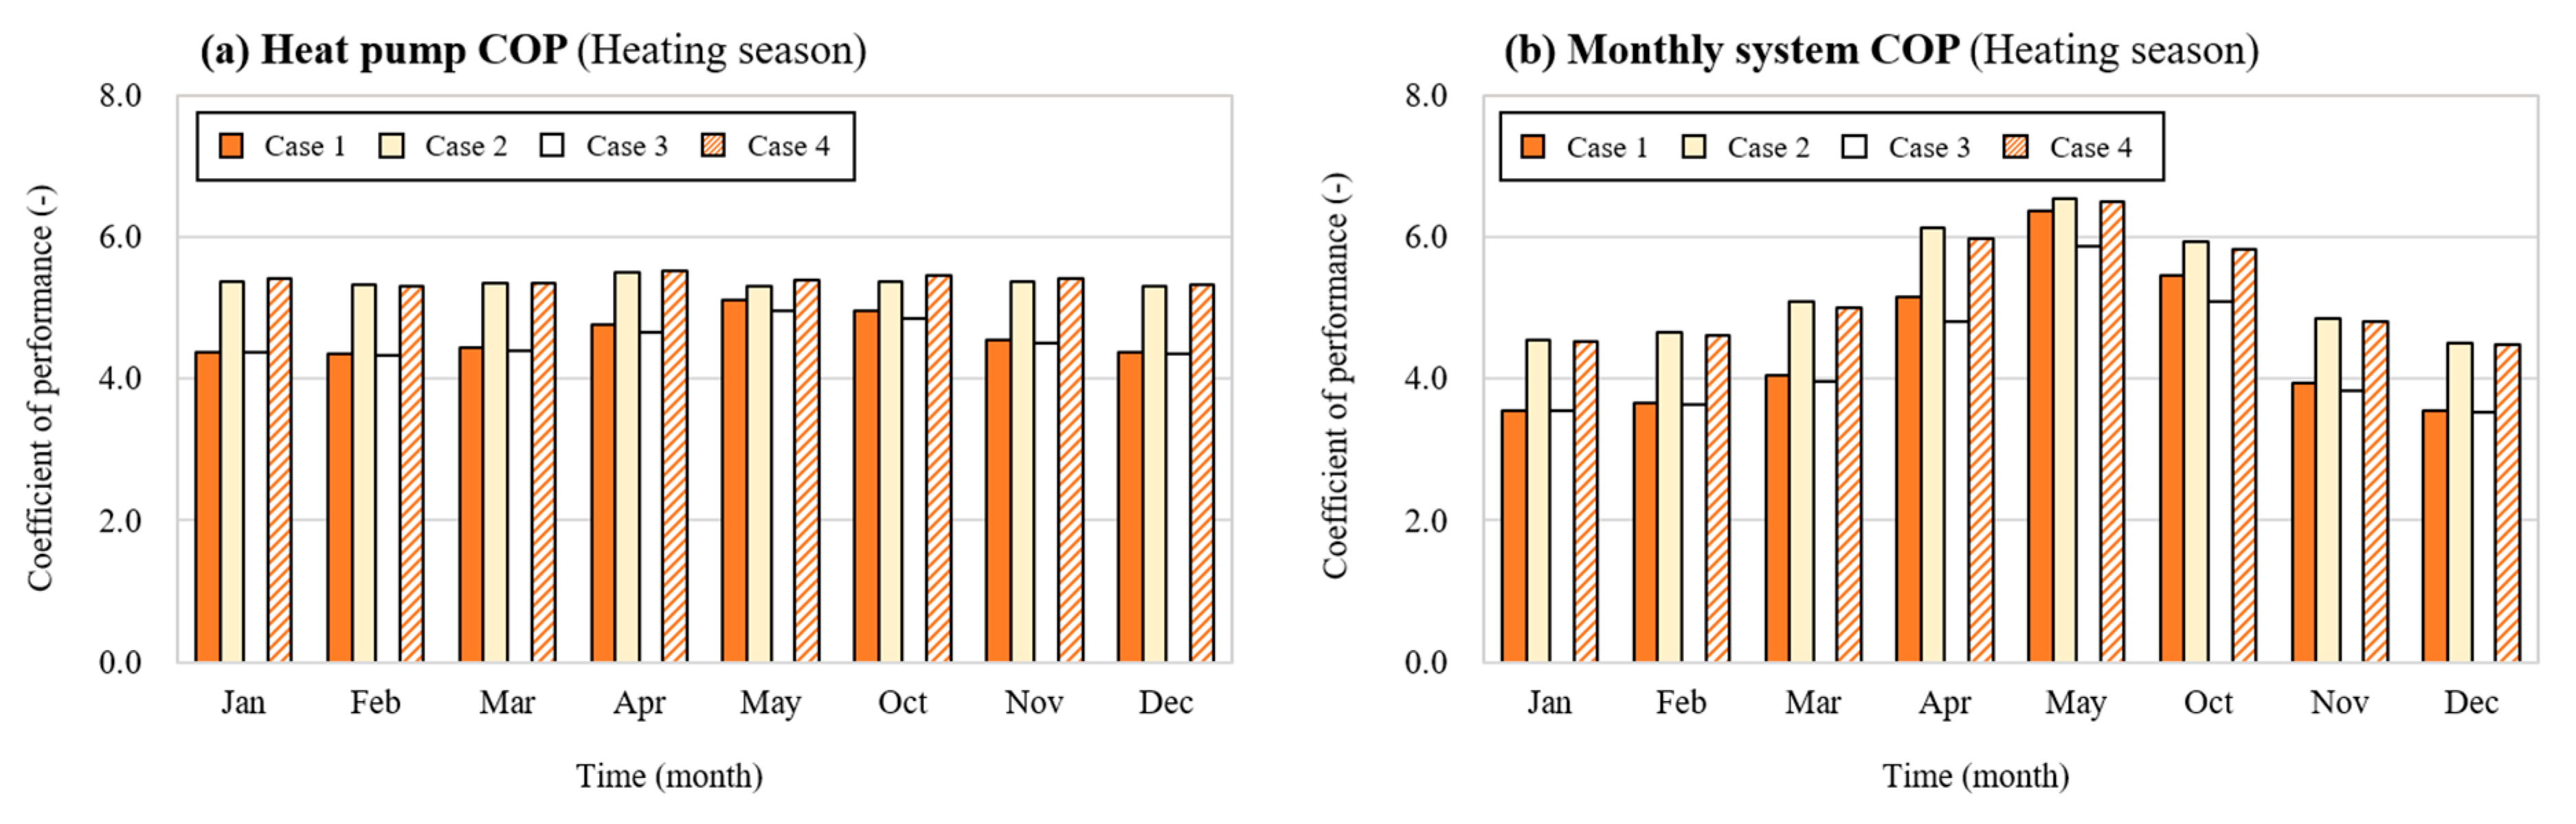
4.2.3. Monthly Performance of Heat Pump and System
4.3. Indoor Thermal Comfort
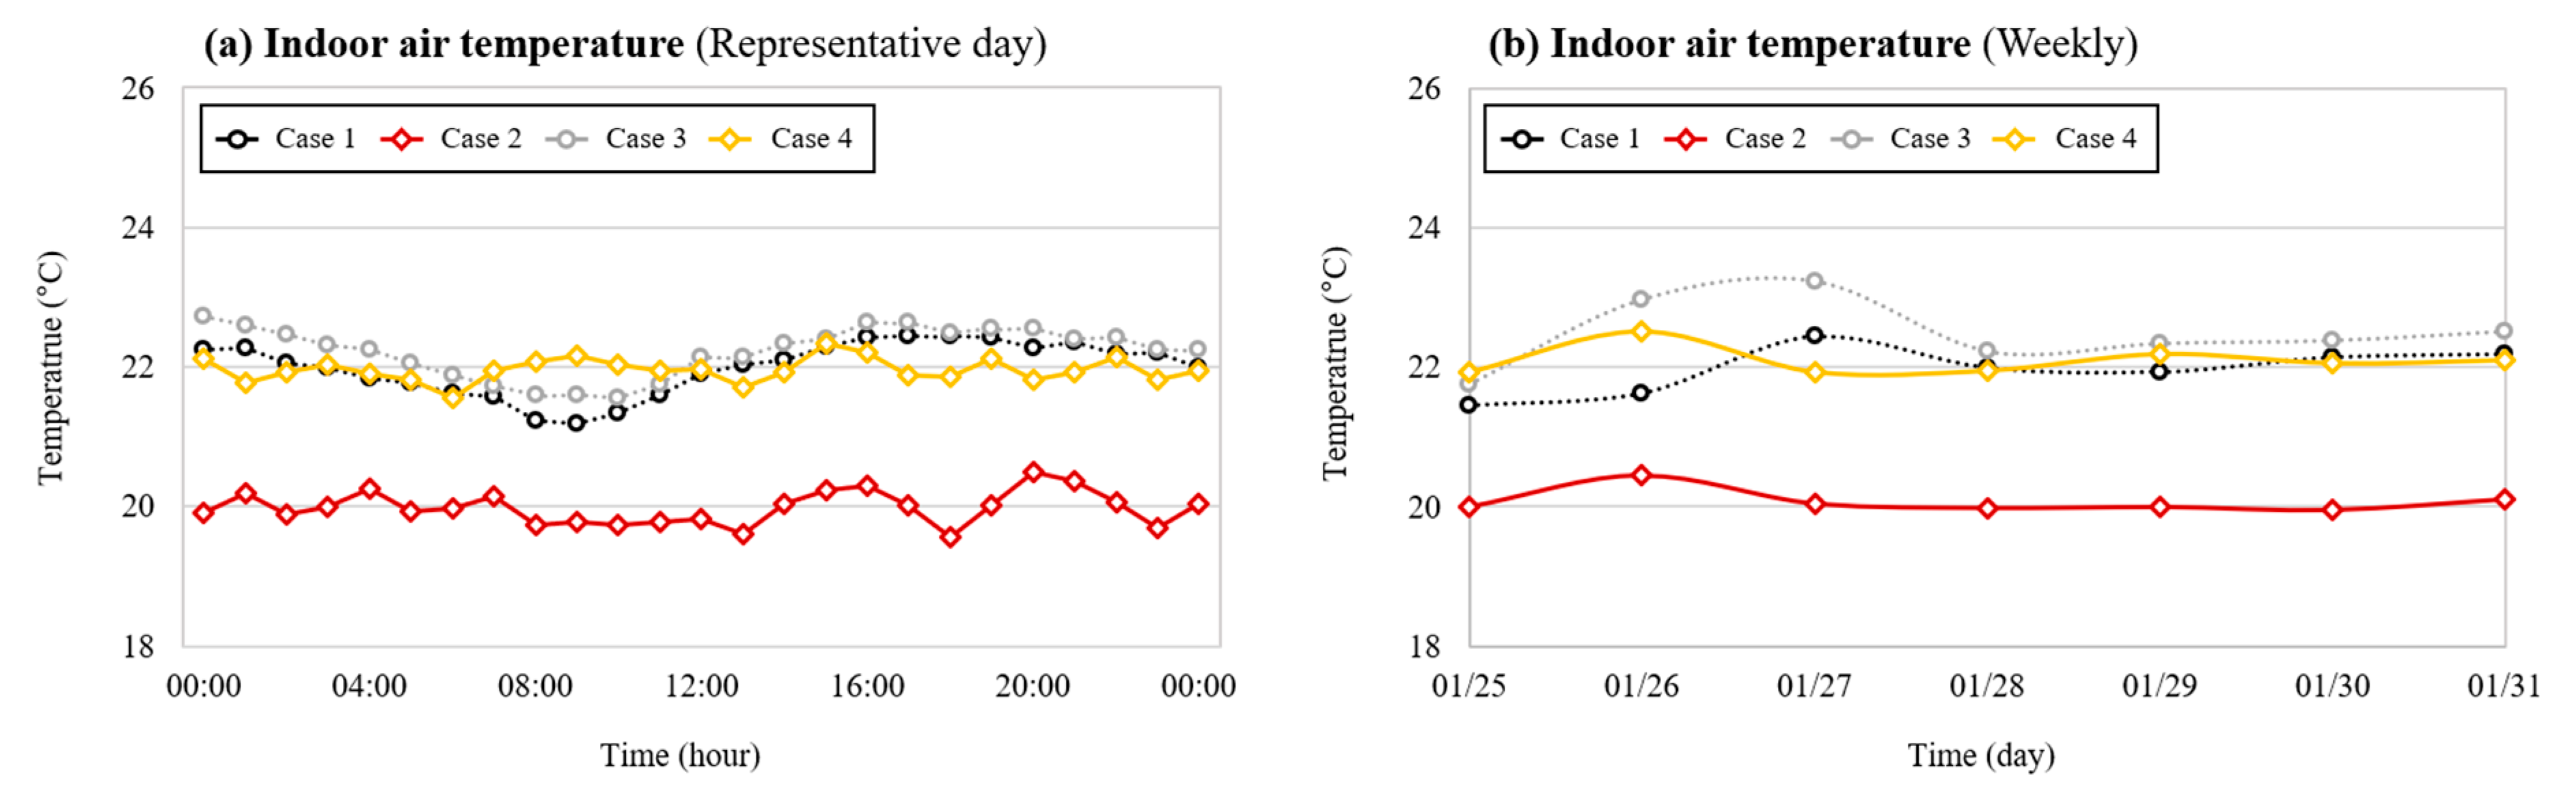
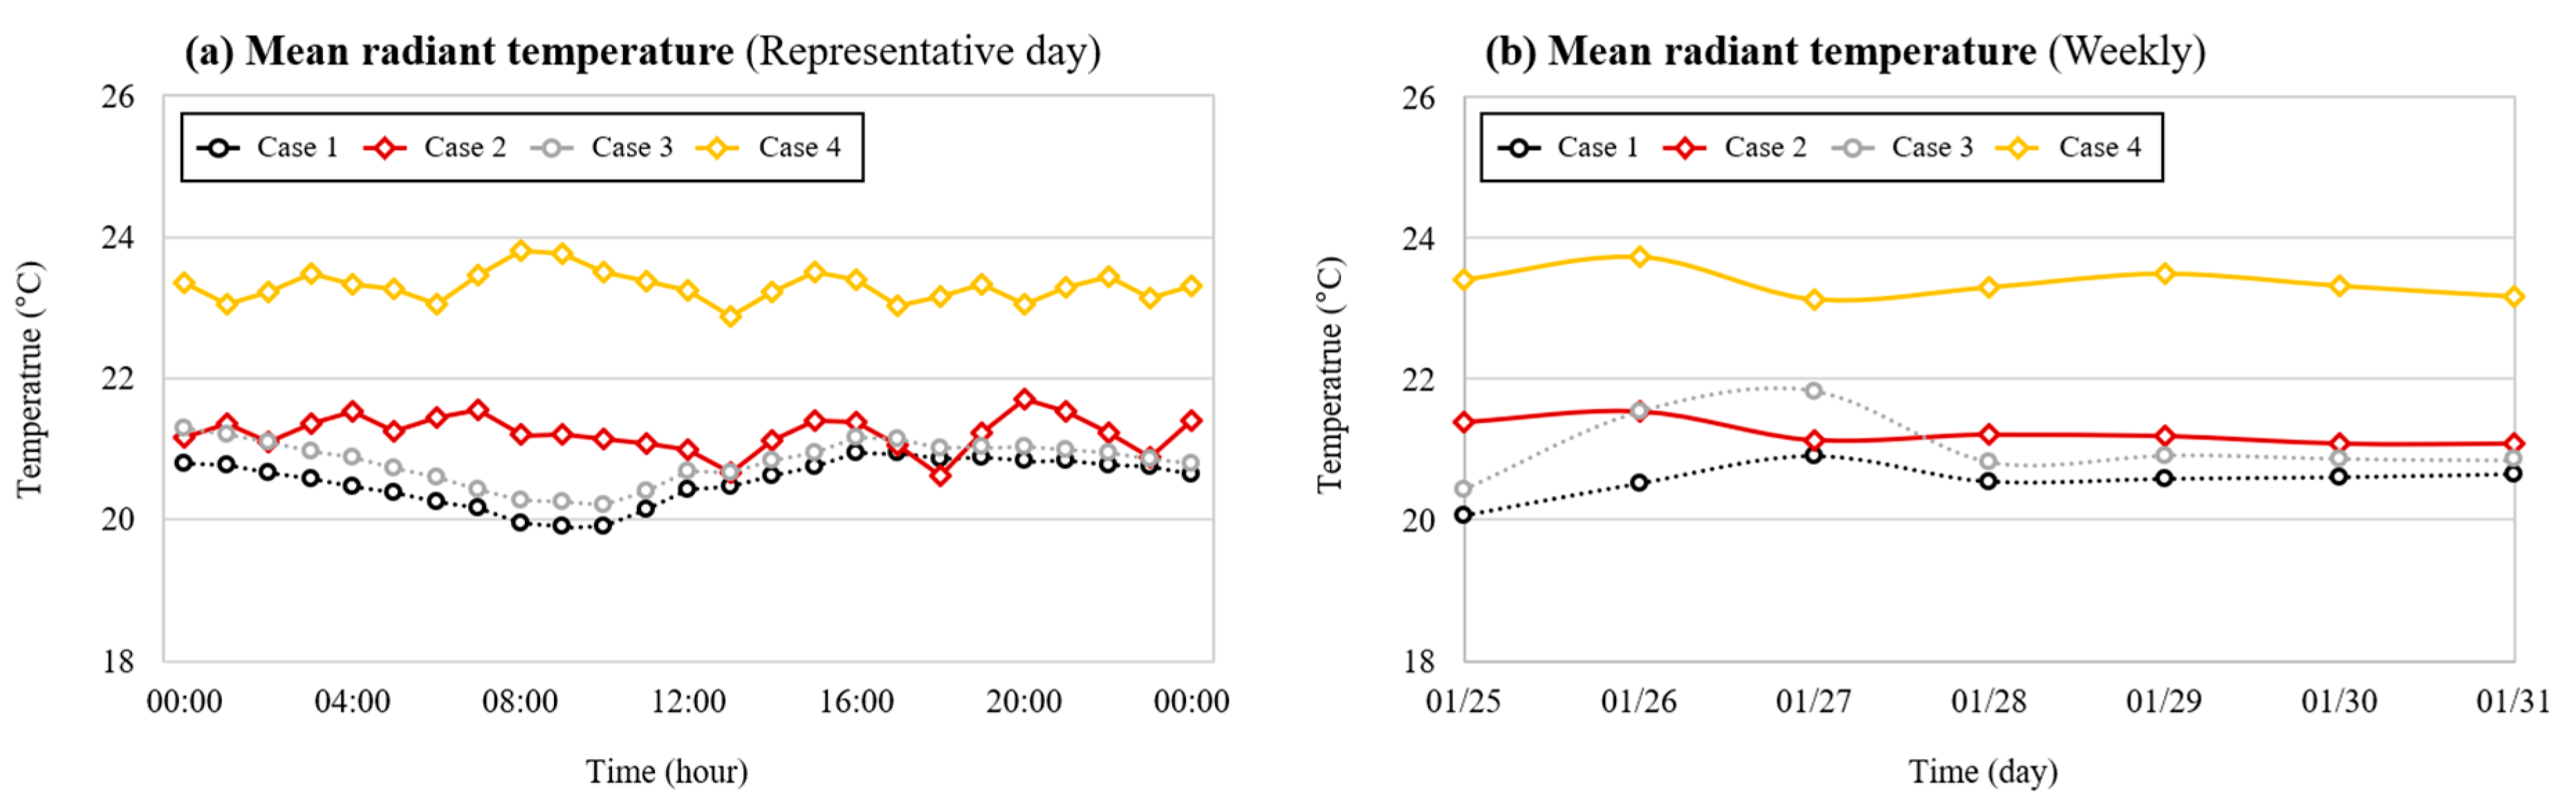
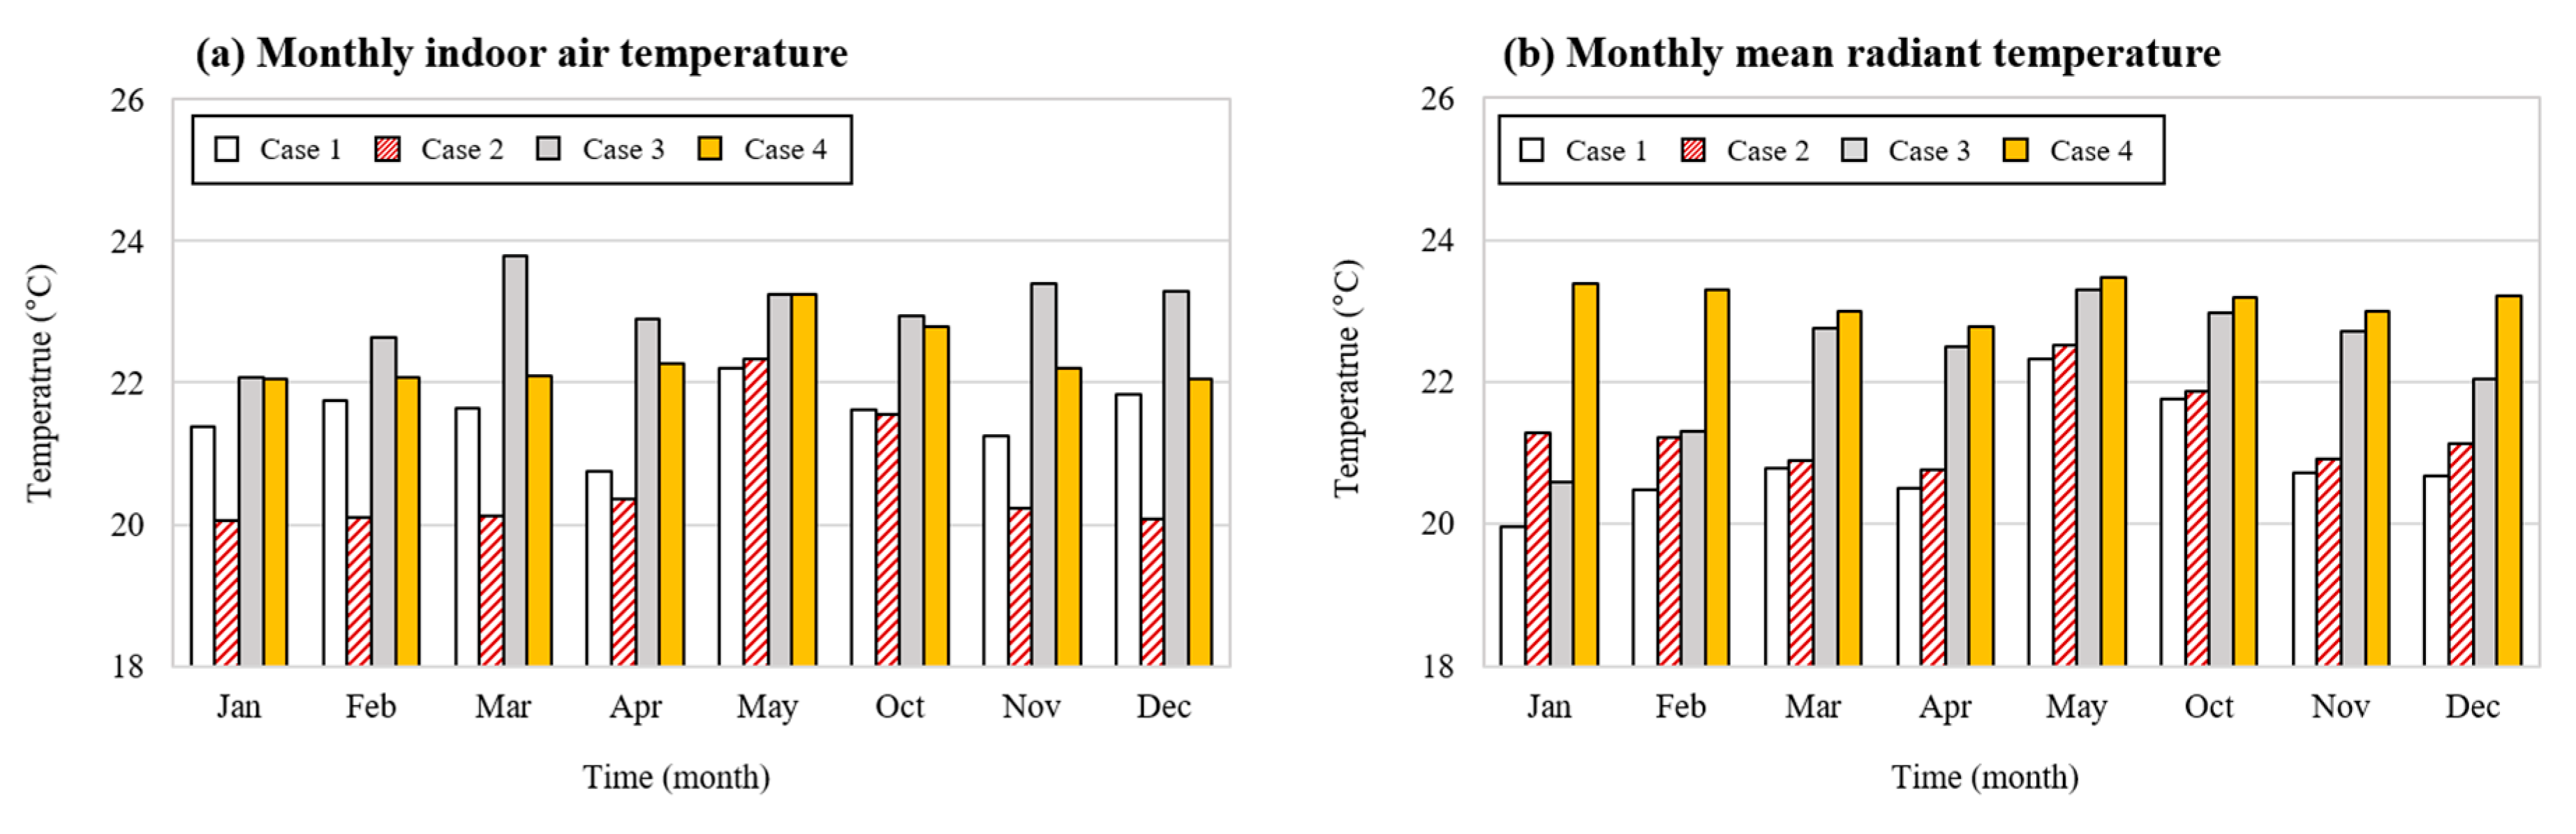
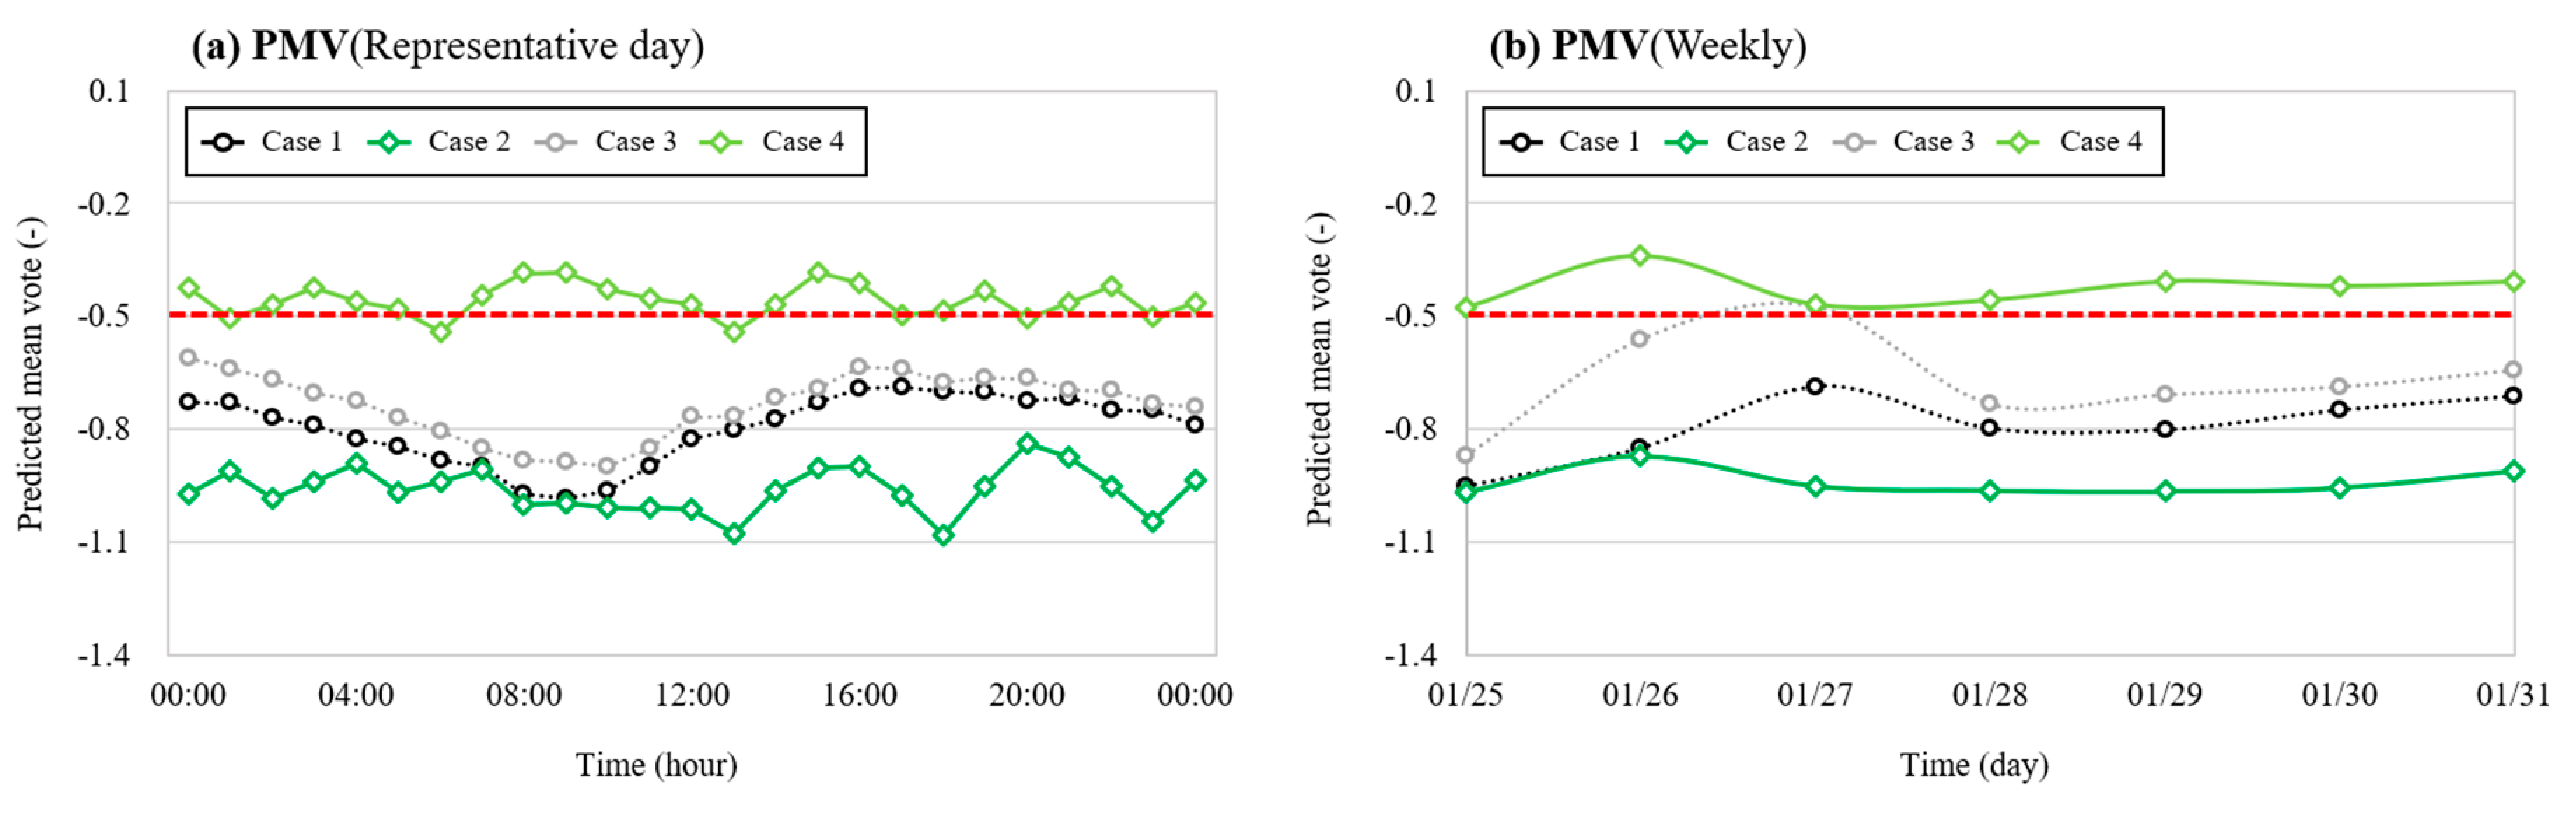
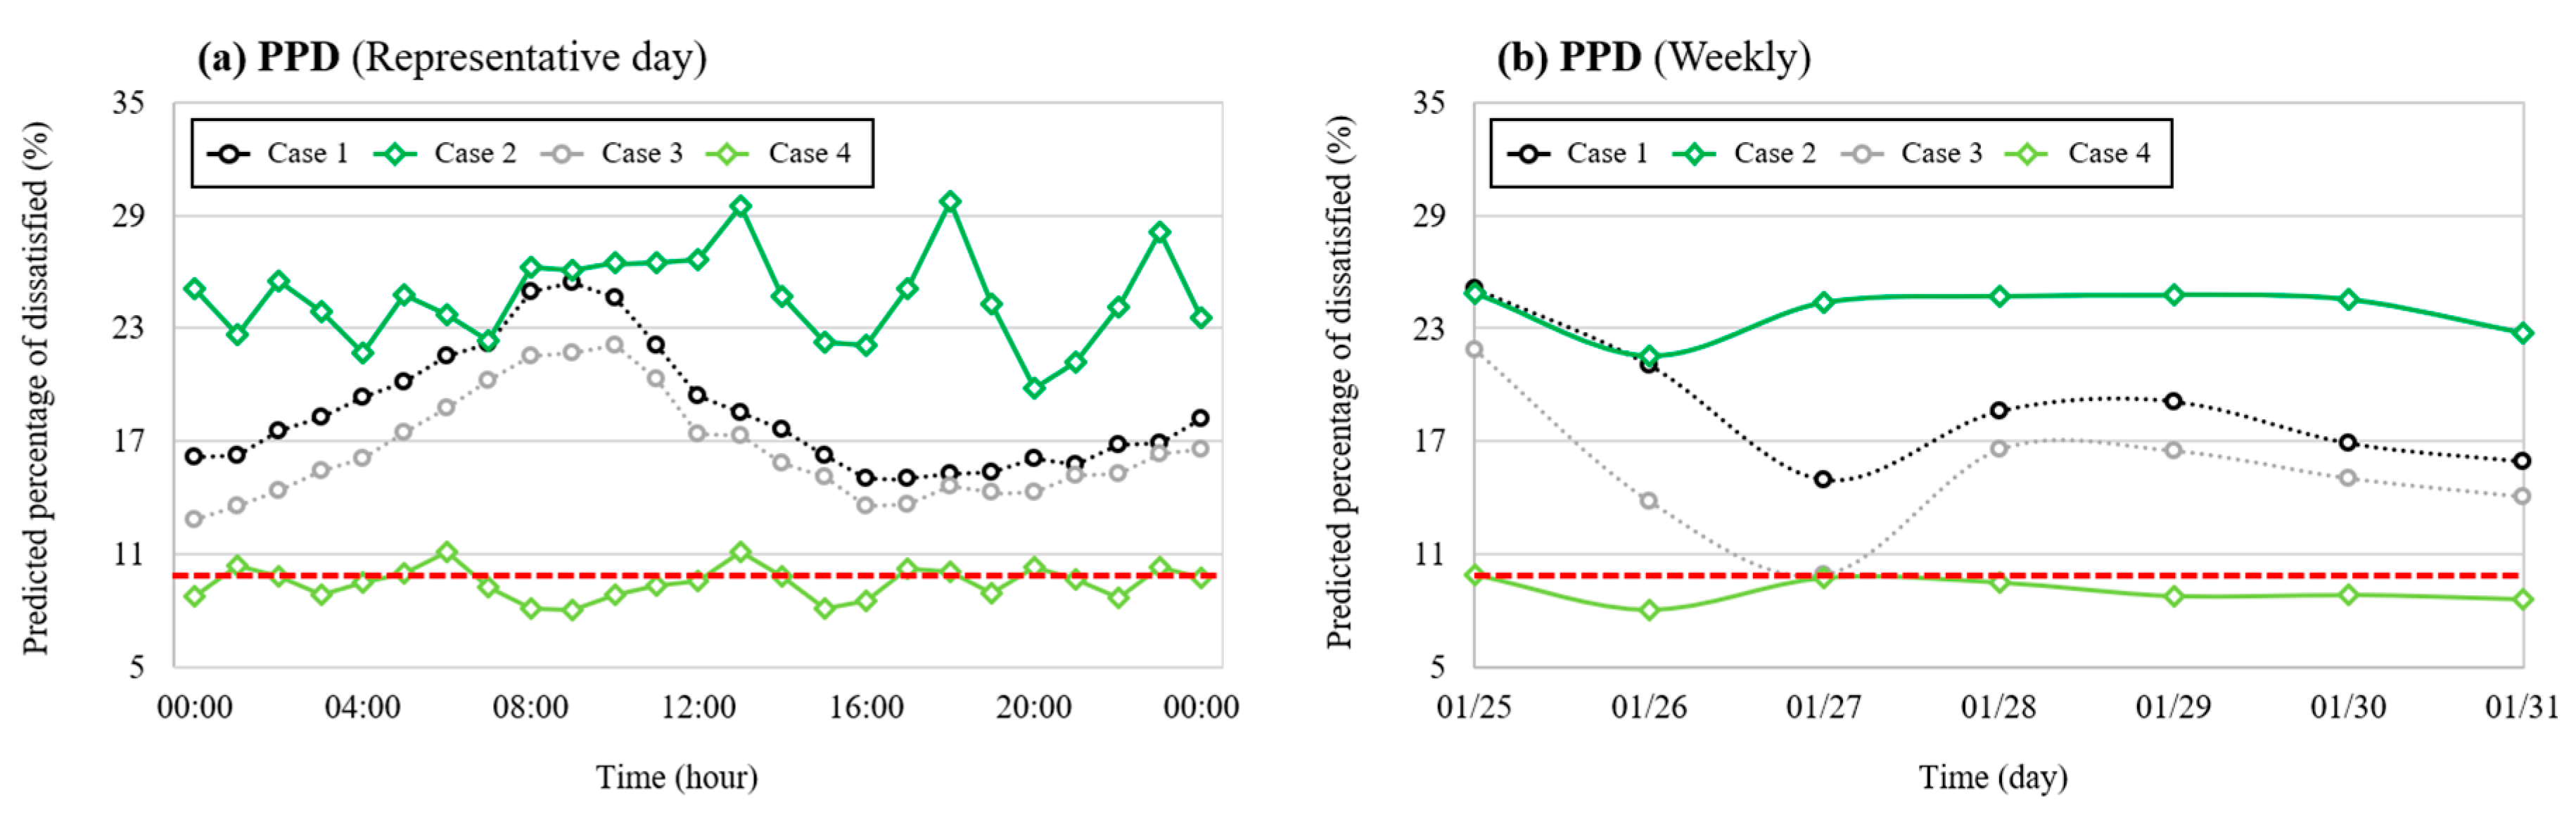
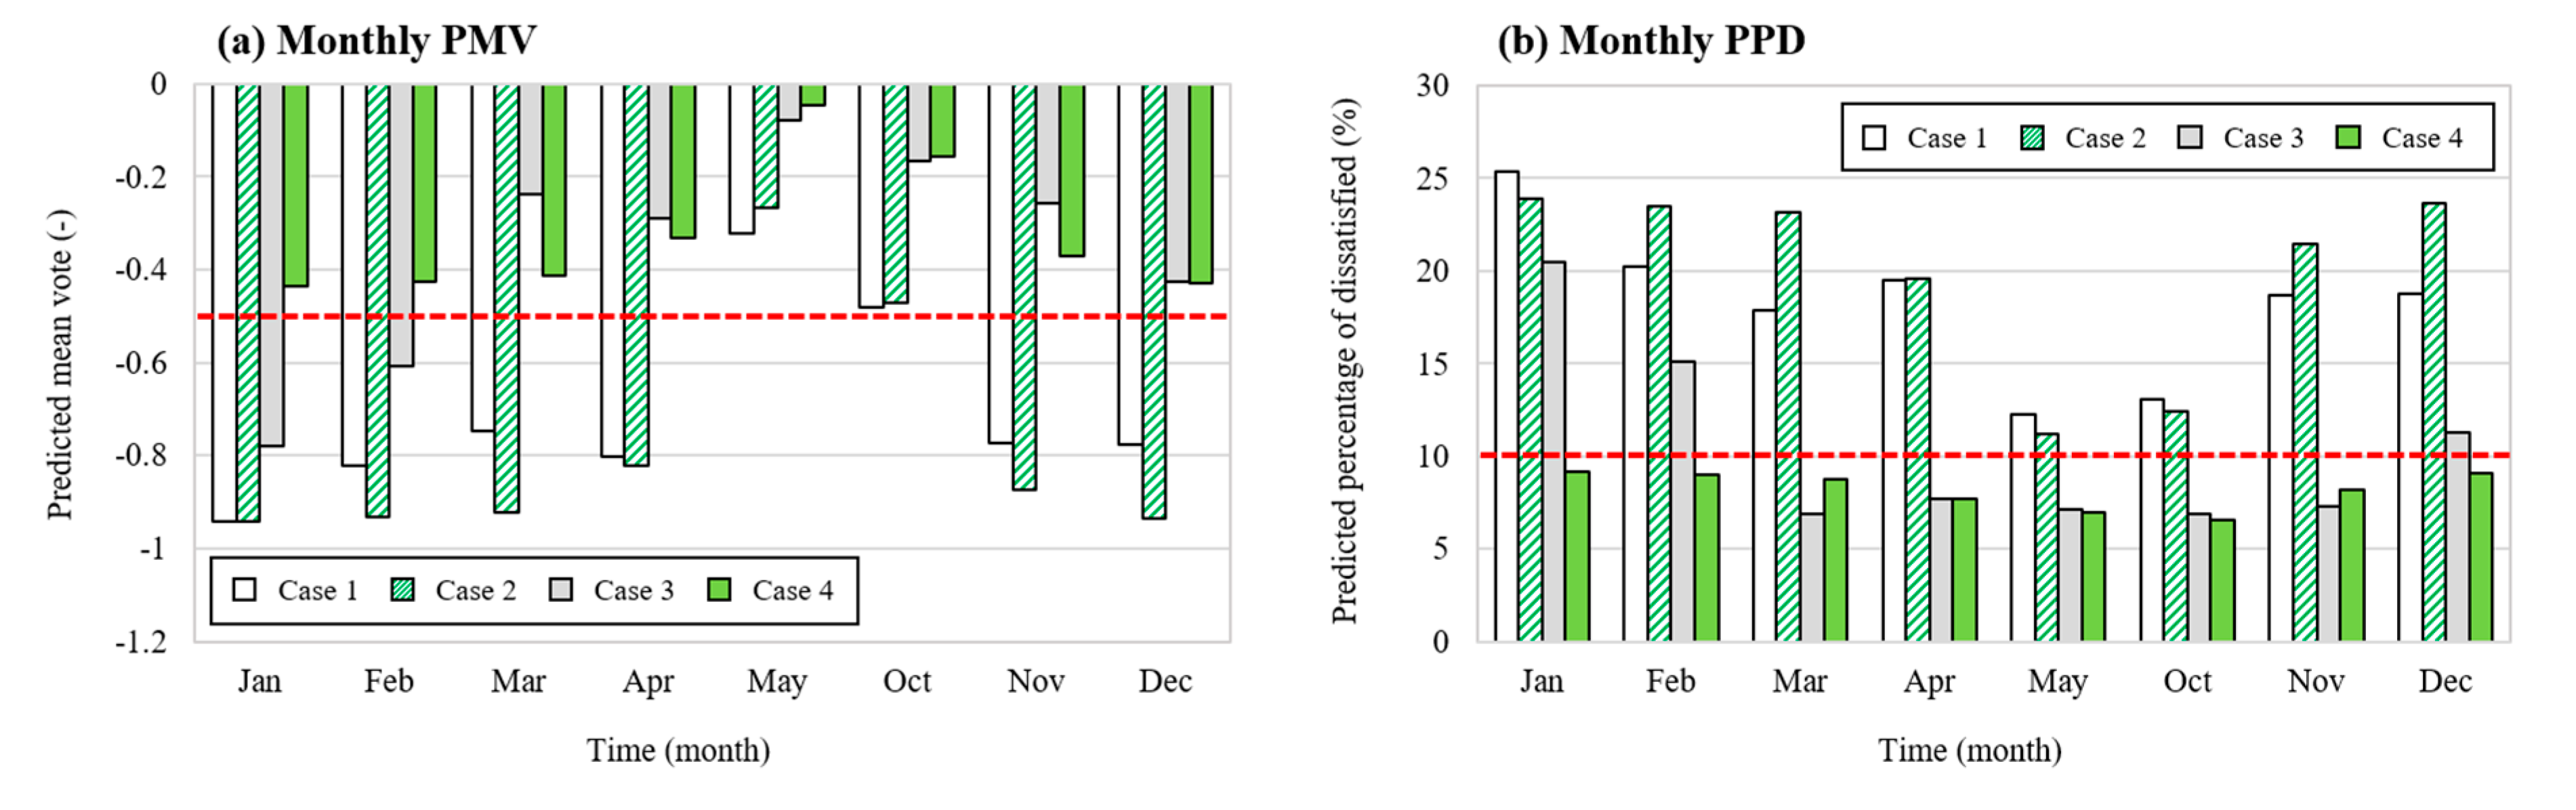
4.3.1. Thermal Environmental Parameters
4.3.2. Indoor Thermal Comfort
5. Conclusions
- (1)
- The average COPs of the heat pump on a representative day in the winter season were 4.3 and 5.2 for convective heating (Case 1) and radiant floor heating (Case 2), respectively. The heating COP for radiant floor heating was 18.8% higher than that for convective heating. Overall, the radiant floor heating system was more efficient than the convective heating system.
- (2)
- The radiant floor heating system was more effective for MRT than the convective heating system. The MRT showed a difference of 2.3 °C according to the heating type. The MRT difference was larger in January, February, and December, when the heating load was high. This is because the available time for radiant floor heating to heat the floor structure increased with the increasing heating load. However, the MRT was similar for both radiant floor heating and convective heating at low heating loads.
- (3)
- Although the MRT was higher for radiant floor heating (Case 1) than for convective heating (Case 3), the PMV standard (−0.5 < PMV < 0.5) was not met when the indoor air temperature was low. This result confirms that MRT has a strong influence on PMV only if an appropriate level of indoor air temperature (22 °C) is secured. For convective heating (Case 3), the standards of PMV and PPD were not met in January and February when the heating load was high. For radiant floor heating (Case 4), the PMV and PPD standards were met in all heating periods. This result confirms that the radiant floor heating system is more suitable than the convective heating system for the indoor thermal comfort of occupants.
Author Contributions
Funding
Conflicts of Interest
Nomenclature
| Symbols | |
| Heat flow [W] | |
| Coefficient of thermal transmittance [-] | |
| distance, thickness [m] | |
| Time constant [-] | |
| The air temperature [K] | |
| The mean radiant temperature [K] | |
| The surface temperature of the area [K] | |
| The angular factor between a person and the area [-] | |
| Predicted mean vote [−3 to 3] | |
| L | Thermal load [W/m2] |
| M | Metabolic rate [W/m2] |
| Rate of mechanical work accomplished [W/m2] | |
| Total rate of evaporative heat loss from skin [W/m2] | |
| Rate of evaporative heat loss from respiration [W/m2] | |
| Rate of convective heat loss from respiration [W/m2] | |
| Sensible heat loss from skin [W/m2] | |
| Sensible heat loss from skin [W/m2] | |
| Respiratory quotient [W/m2] | |
| Volumetric rate of oxygen consumption at conditions of 0 °C [W/m2] | |
| DuBois surface area [m2] | |
| Person’s weight [kg] | |
| Person’s height [m] | |
| Predicted percentage of dissatisfied [%] | |
| . | The heat pump coefficient of performance in heating mode [-] |
| The heat pump coefficient of performance in cooling mode [-] | |
| . | The energy absorbed by the heat pump in heating mode [W] |
| The energy rejected by the heat pump in cooling mode [W] | |
| The power drawn by the heat pump in heating mode [W] | |
| The power drawn by the heat pump in cooling mode [W] | |
| The system coefficient of performance [-] | |
| The heat production by photovoltaic-thermal module [W] | |
| The heat production by heat pump [W] | |
| The power consumption of fan coil unit [W] | |
| The power consumption of circulating pump [W] | |
| The power consumption of heat pump [W] | |
| Greek Symbols | |
| Correction factor [-] | |
| Room 1 temperature [K] | |
| Room 2 temperature [K] | |
| Outside surface temperature of the pipe [K] | |
| Outside diameter of the pipe [m] | |
| Thermal conductivity of material [W/m·K] | |
| Acronyms and abbreviations | |
| ZEB | Zero-energy building |
| MRT | Mean radiant temperature |
| PMV | Predicted mean vote |
| PPD | Predicted percentage of dissatisfied |
| COP | Coefficient of performance |
| PVT | Photovoltaic-thermal |
| GHX | Ground heat exchanger |
| SST | Solar-thermal storage tank |
| HST | Heat storage tank |
| FCU | Fan coil unit |
References
- National Institute of Building Sciences. Life-Cycle Cost Analysis (LCCA); National Institute of Building Sciences: Washington, DC, USA, 2016. [Google Scholar]
- Executive Office of the President. Executive Order 13834 Efficient Federal Operations; Executive Office of the President: Washington, DC, USA, 2018. [Google Scholar]
- Korea Land, Infrastructure and Transport. Green Buildings Construction Support Act; Korea Land, Infrastructure and Transport: Sejong, Korea, 2018. [Google Scholar]
- Korea Heating Air-Conditioning Refrigeration & Renewable Energy News (Kharn). Available online: https://www.kharn.kr/mobile/article.html?no=11399 (accessed on 18 August 2020).
- Jeong, Y.D.; Yu, M.G.; Nam, Y. Feasibility Study of a Heating, Cooling and Domestic Hot Water System Combining a Photovoltaic-Thermal System and a Ground Source Heat Pump. Energies 2017, 10, 1243. [Google Scholar] [CrossRef] [Green Version]
- Bae, S.; Jeong, Y.; Nam, Y. Performance Analysis of Hybrid System with PVT and GSHP for Zero Energy Building. KIEAE J. 2018, 18, 85–92. [Google Scholar] [CrossRef]
- Bae, S.; Nam, Y.; Cunha, I.D. Economic Solution of the Tri-generation System Using Photovoltaic-Thermal and Ground Source Heat Pump for Zero Energy Building (ZEB) Realization. Energies 2019, 12, 3304. [Google Scholar] [CrossRef] [Green Version]
- Jeong, Y.D.; Nam, Y.; Yeo, S. Dynamic Energy Simulation for Suitable Capacity Decision of GSHP-PVT Hybrid System. J. Archit. Inst. Korea Struct. Constr. 2017, 33, 53–61. [Google Scholar]
- Bae, S.; Nam, Y. Study on the Optimal Capacity Design for Tri-generation System using PVT and GSHP. Trans. Korea Soc. Geotherm. Energy Eng. 2019, 15, 16–23. [Google Scholar]
- Papadopoulos, S.; Kontokosta, C.E.; Vlachokostas, A.; Azar, E. Rethinking HVAC temperature setpoints in commercial buildings: The potential for zero-cost energy savings and comfort improvement in different climates. Build. Environ. 2019, 155, 350–359. [Google Scholar] [CrossRef]
- Kim, C.H.; Lee, S.E.; Lee, K.H.; Kim, K.S. Detailed Comparison of the Operational Characteristics of Energy-Conserving HVAC Systems during the Cooling Season. Energies 2019, 12, 4160. [Google Scholar] [CrossRef] [Green Version]
- Robledo-Fava, R.; Hernández-Luna, M.C.; Fernández-de-Córdoba, P.; Michinel, H.; Zaragoza, S.; Castillo-Guzman, A.; Selvas-Aguilar, R. Analysis of the Influence Subjective Human Parameters in the Calculation of Thermal Comfort and Energy Consumption of Buildings. Energies 2019, 12, 1531. [Google Scholar] [CrossRef] [Green Version]
- Kim, J.; Song, D.; Kim, S.; Park, S.; Choi, Y.; Lim, H. Energy-Saving Potential of Extending Temperature Set-Points in a VRF Air-Conditioned Building. Energies 2020, 13, 2016. [Google Scholar] [CrossRef]
- Mohelníková, J.; Novotný, M.; Mocová, P. Evaluation of School Building Energy Performance and Classroom Indoor Environment. Energies 2020, 13, 2489. [Google Scholar] [CrossRef]
- Elhadad, S.; Radha, C.H.; Kistelegdi, I.; Baranyai, B.; Gyergyák, J. Model Simplification of Energy and Comfort Simulation Analysis for Residential Building Design in Hot and Arid Climate. Energies 2020, 13, 1876. [Google Scholar] [CrossRef] [Green Version]
- Park, B.; Ryu, S.R.; Cheong, C.H. Thermal Comfort Analysis of Combined Radiation-Convection Floor Heating System. Energies 2020, 13, 1420. [Google Scholar] [CrossRef] [Green Version]
- Fan, Y.; Li, X.; Zheng, M.; Weng, R.; Tu, J. Numerical Study on Effects of Air Return Height on Performance of an Underfloor Air Distribution System for Heating and Cooling. Energies 2020, 13, 1070. [Google Scholar] [CrossRef] [Green Version]
- Yang, L.; Yan, H.; Lam, J.C. Thermal comfort and building energy consumption implications—A review. Appl. Energy 2014, 115, 164–173. [Google Scholar] [CrossRef]
- Belussi, L.; Barozzi, B.; Bellazzi, A.; Danza, L.; Devitofrancesco, A.; Fanciulli, C.; Ghellere, M.; Guazzi, G.; Meroni, I.; Salamone, F.; et al. A review of performance of zero energy buildings and energy efficiency solutions. J. Build. Eng. 2019, 25, 100772. [Google Scholar] [CrossRef]
- Ng, L.; Poppendieck, D.; Stuart Dols, W.; Dougherty, B.P. Nist net-zero energy residential test facility. ASHRAE J. 2018, 60, 12–19. [Google Scholar]
- Lee, E.J.; Kang, E.C.; Lee, K.S.; Ghorab, M.; Yang, L.; Entchev, E. PVT-GSHP hybrid tri-generation system for zero energy buildings. In Proceedings of the ISES Solar World Congress 2017, Abu Dhabi, UAE, 29 October 2017; Available online: http://proceedings.ises.org/paper/swc2017/swc2017-0061-Lee (accessed on 19 September 2020).
- International Organization for Standardization (ISO). Ergonomics of the Thermal Environment—Analytical Determination and Interpretation of Thermal Comfort Using Calculation of the PMV and PPD Indices and Local Thermal Comfort Criteria; ISO 7730; ISO: Geneva, Switzerland, 2005. [Google Scholar]
- TRNSYS 18. Multizone Building Modeling with Type 56 and TRNBuild; TESS Libs 18: Milwaukee, WI, USA, 2017; Volume 5. [Google Scholar]
- Fanger, P.O. Thermal Comfort: Analysis and Application in Environment Engineering; McGraw Hill: New York, NY, USA, 1972. [Google Scholar]
- International Organization for Standardization. Ergonomics of the Thermal Environment—Instruments for Measuring Physical Quantities; ISO 7726; ISO: Geneva, Switzerland, 2001. [Google Scholar]
- ASHRAE. Thermal Environmental Conditions for Human Occupancy; ASHRAE Standard 55-2013; ASHRAE: Atlanta, GA, USA, 2013. [Google Scholar]
- TRNSYS 17. GHP Library Mathematical Reference; TESS Libs 17: Milwaukee, WI, USA, 2012; Volume 4. [Google Scholar]
- Duffie, J.A.; Beckman, W.A. Solar Engineering of Thermal Process, 4th ed.; John Wiley & Sons, Inc.: Hoboken, NJ, USA, 2013. [Google Scholar]
- Hellström, G. Duct Ground Heat Storage Model Manual for Computer Code; Department of Mathematical Physics, University of Lund: Lund, Sweden, 1989. [Google Scholar]
- TRNSYS 17. Mathematical Reference; TESS Libs 17: Milwaukee, WI, USA, 2014; Volume 4. [Google Scholar]
- Beginning Farmers Center. Available online: www.returnfarm.com (accessed on 8 August 2020).
- ASHRAE. Energy Standard for Buildings Except Low-Rise Residential Buildings; ASHRAE Standard 90.1-2004; ASHRAE: Atlanta, GA, USA, 2004. [Google Scholar]
- ASHRAE. Energy-Efficient Design of Low-Rise Residential Buildings; ASHRAE Standard 90.2-2004; ASHRAE: Atlanta, GA, USA, 2004. [Google Scholar]
- Olsen, B.W. Radiant floor heating in theory and practice. ASHRAE J. 2002, 44, 19–24. [Google Scholar]


| Construction Type | U-Value (W/m2·K) | Reference |
|---|---|---|
| External wall | 0.242 | Green Buildings Construction Support Act–2018 (Korean Ministry of Land, Infrastructure, and Transport) |
| Ground Floor | 0.240 | |
| Roof | 0.151 | |
| Exterior window | 1.49 |
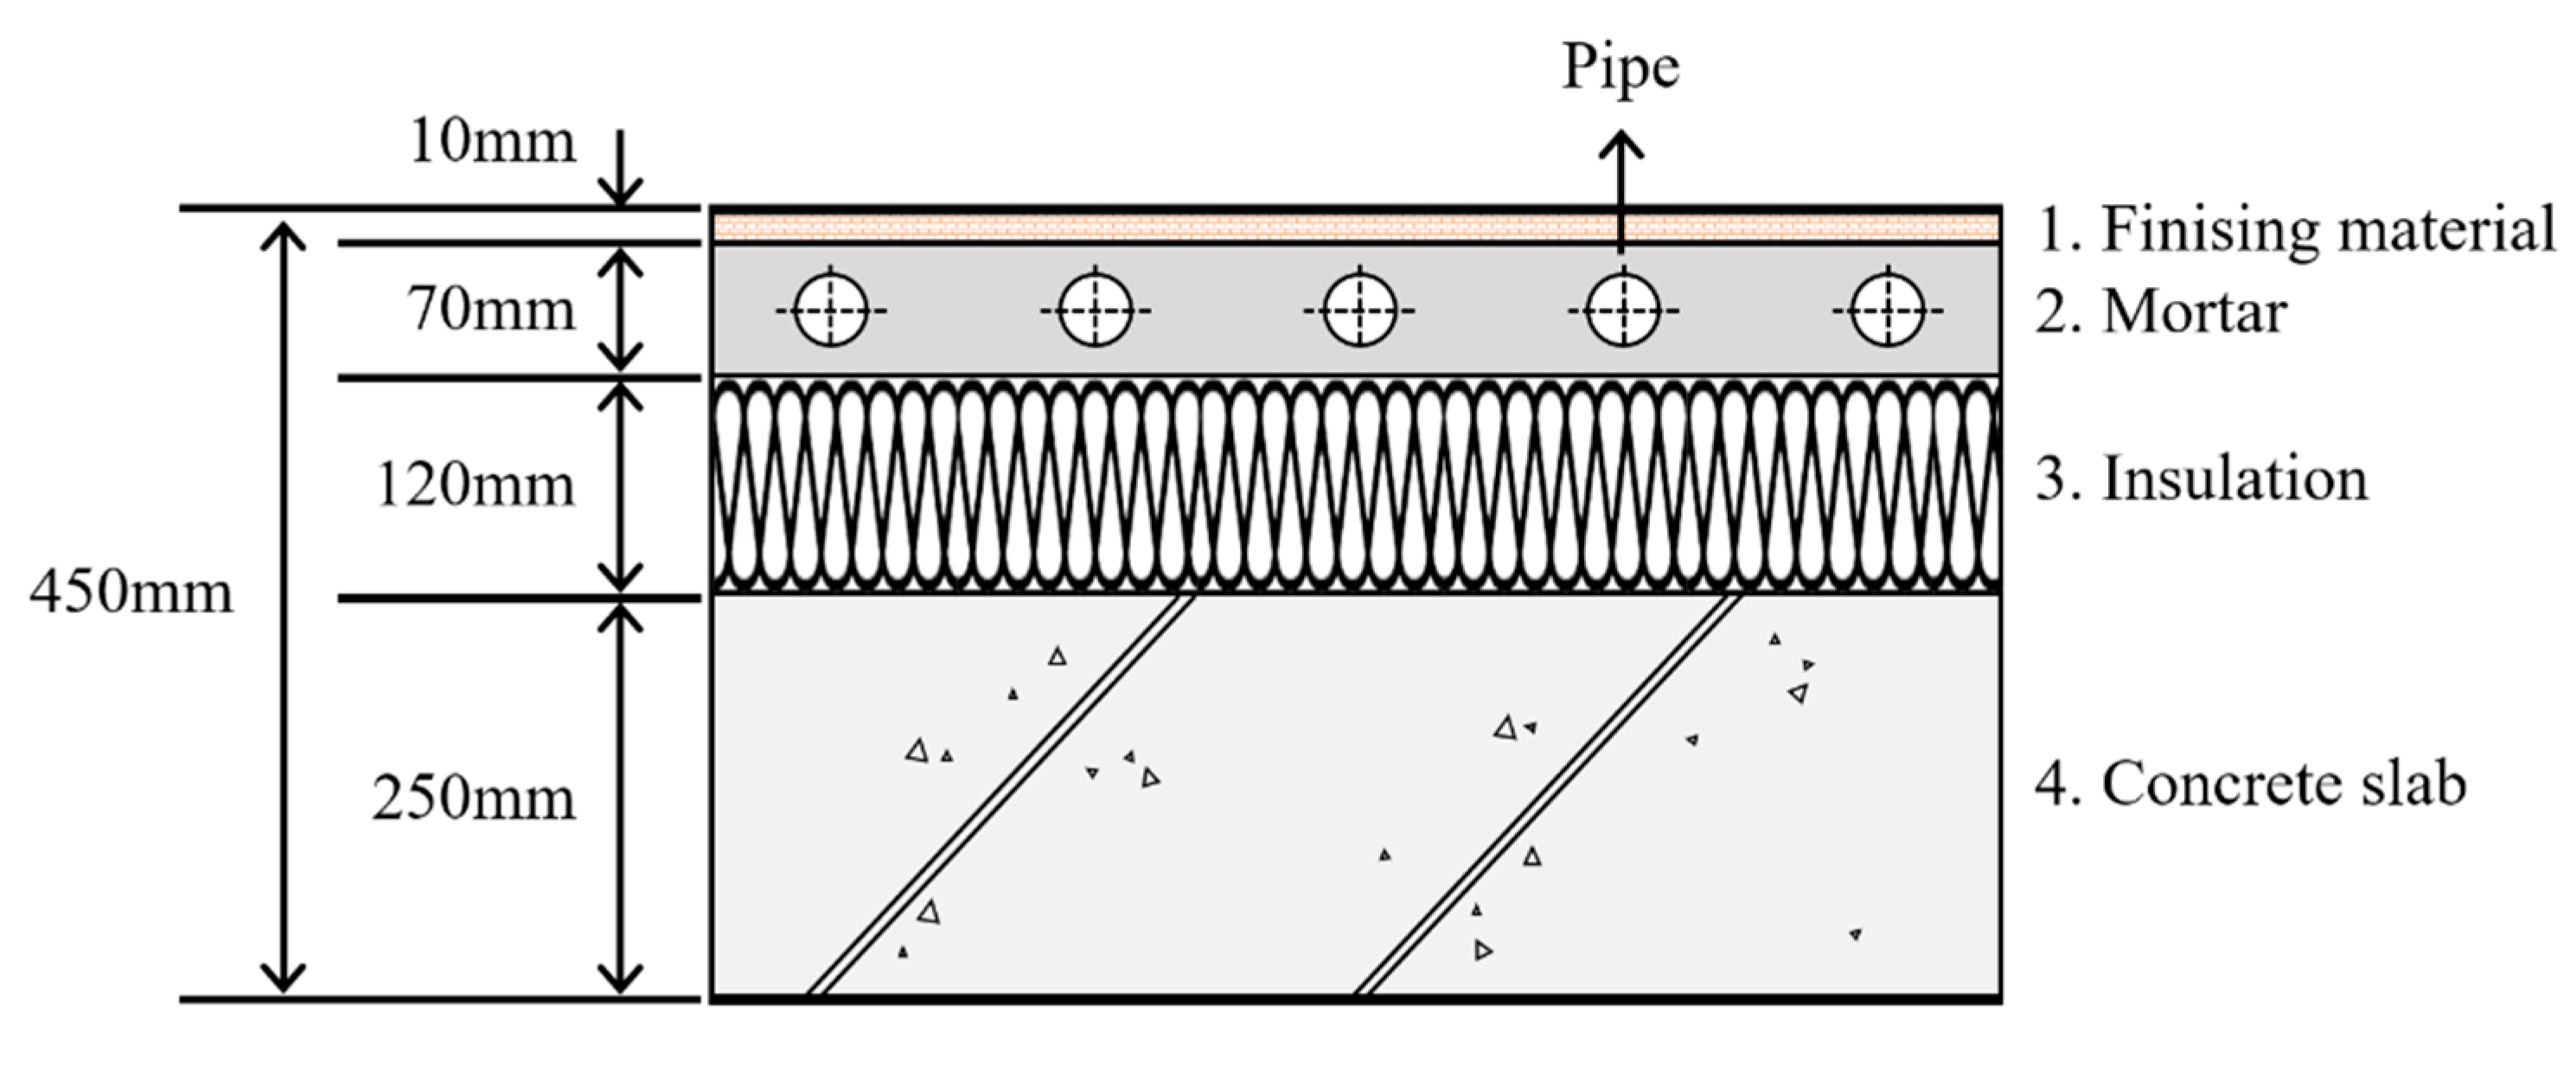
| Properties | Finishing | Mortar | Insulation | Concrete |
|---|---|---|---|---|
| Thermal conductivity (W/m·K) | 0.166 | 1.51 | 0.032 | 1.52 |
| Thermal capacity (kJ/kg·K) | 1 | 0.8 | 1.47 | 0.9 |
| Density (kg/m3) | 800 | 2000 | 30 | 2300 |
| Parameter | Value | Reference |
|---|---|---|
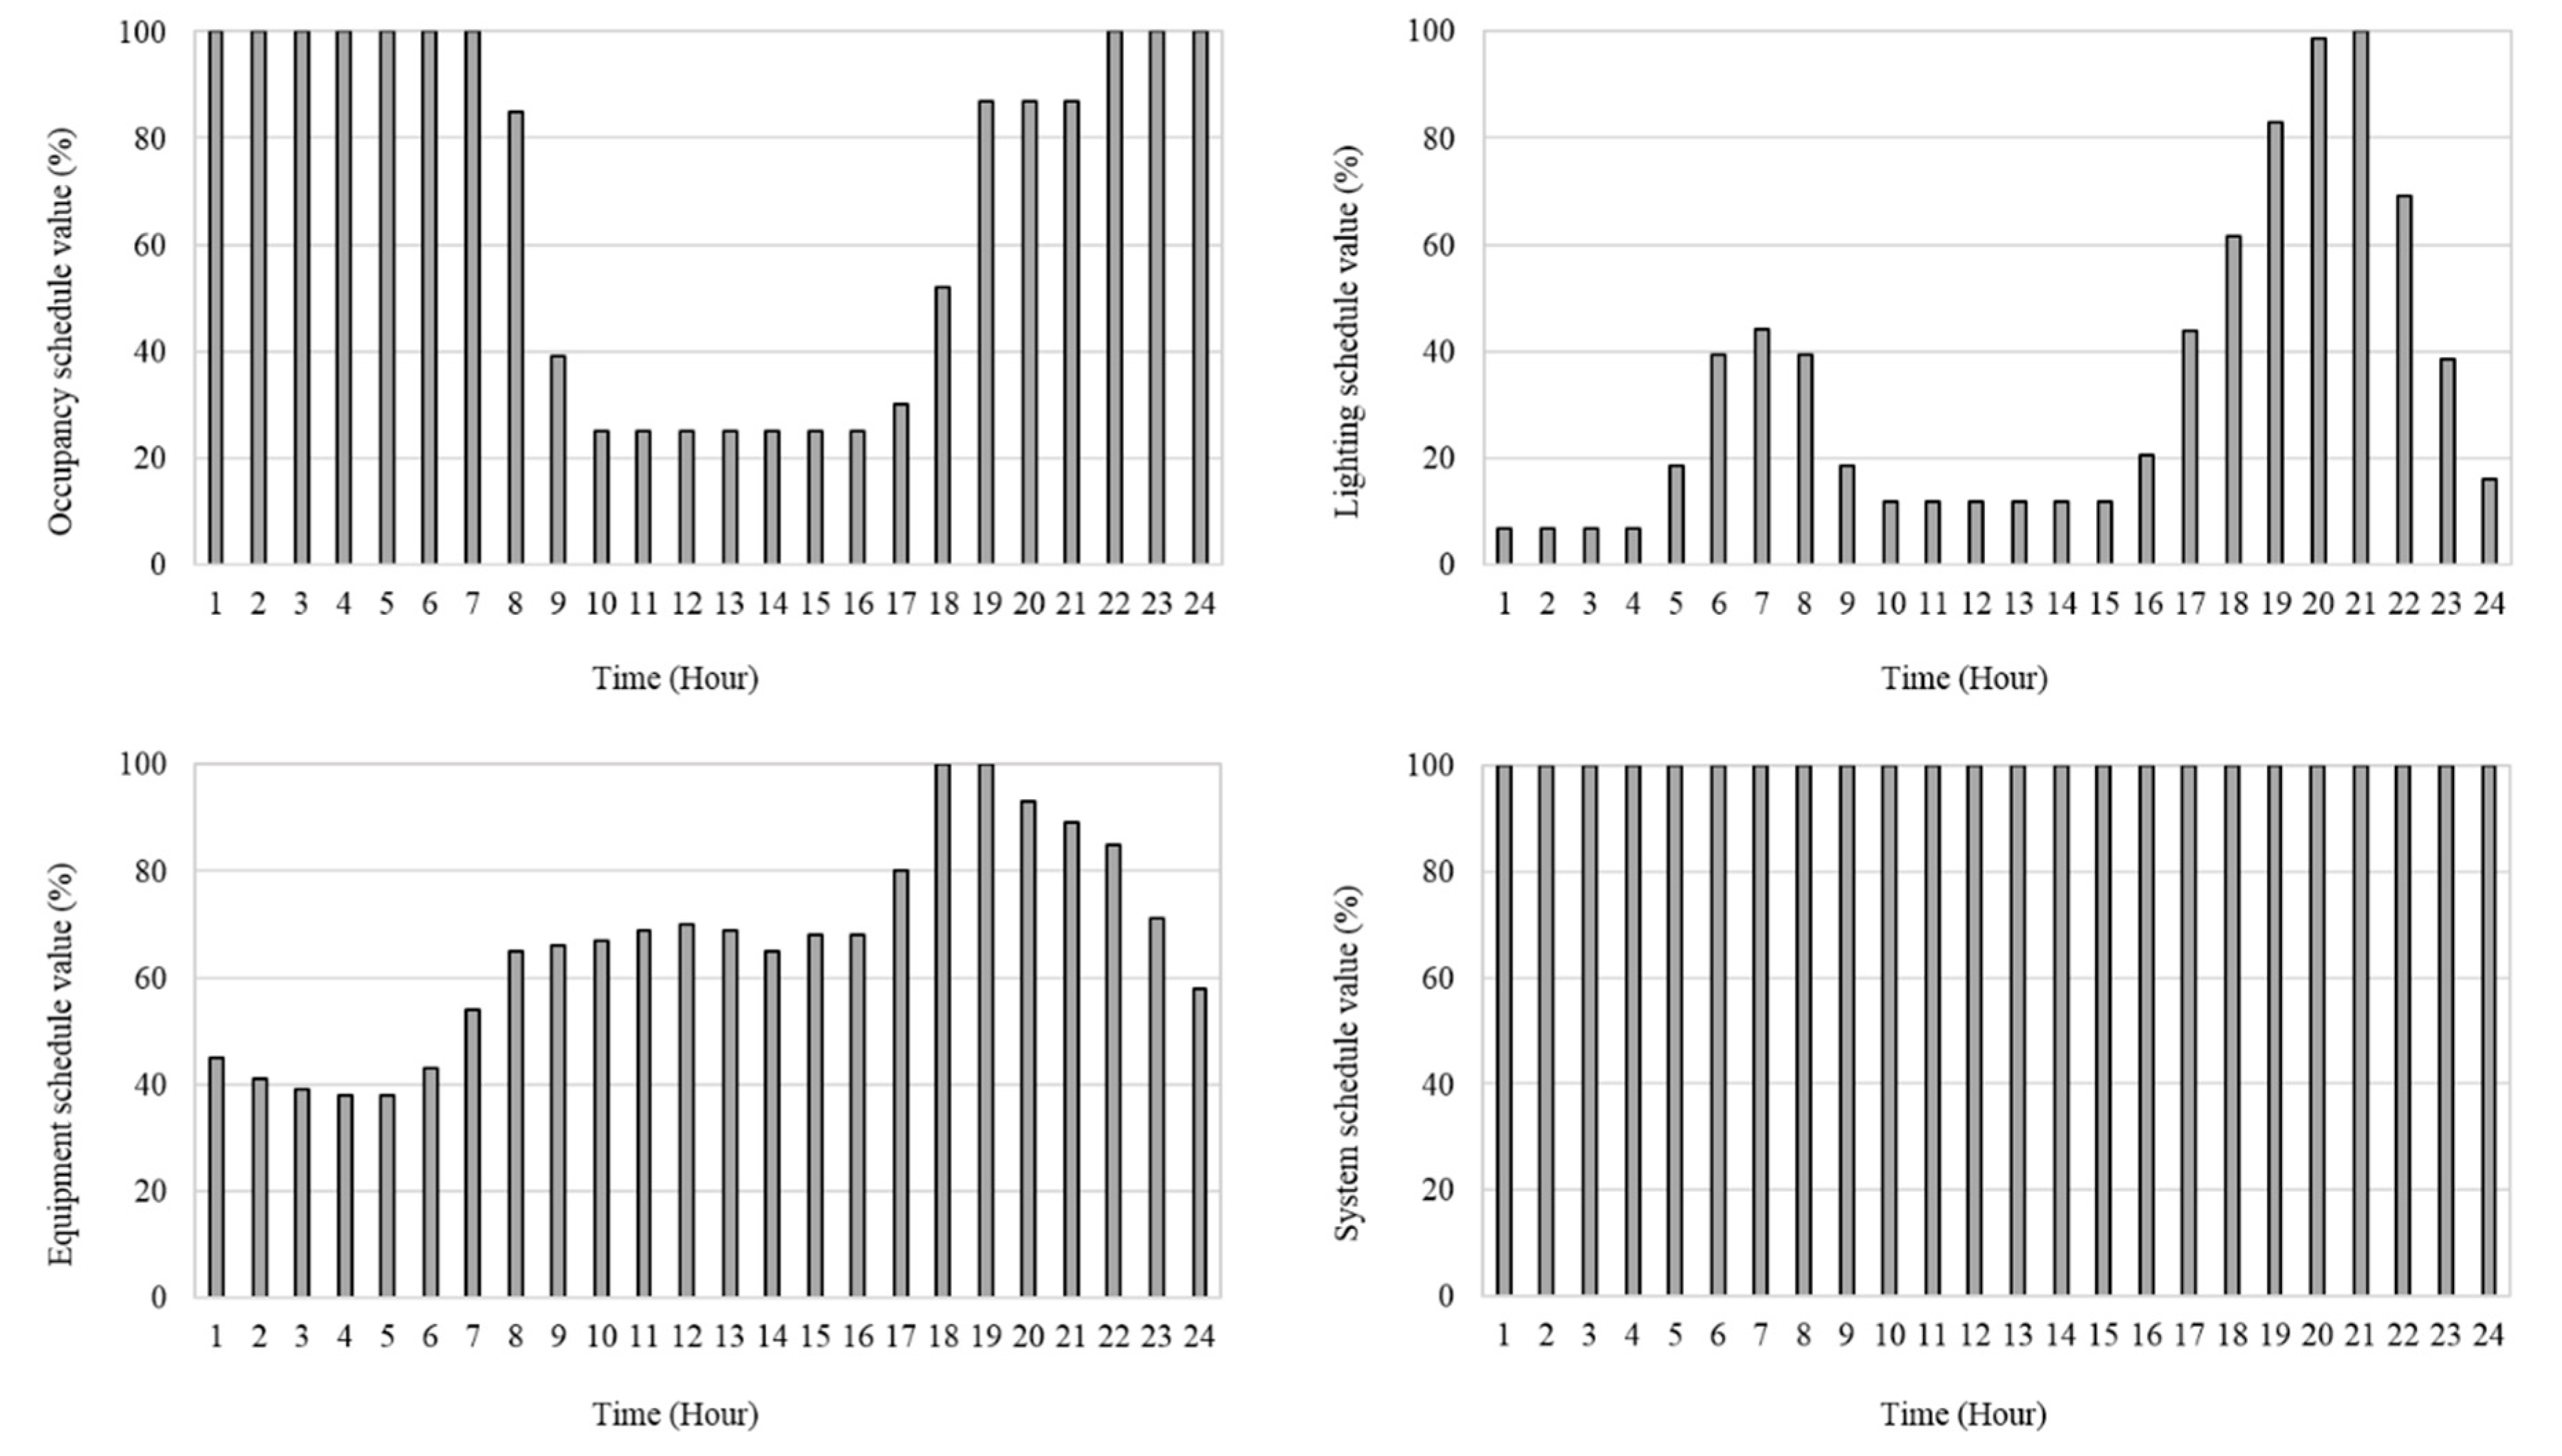
| People | Sensible heat 75 W Latent heat 45 W | ASHRAE Standard 55-2013 |
| Light | 10.76 W/m2 | ASHRAE Standard 90.1-2004 |
| Equipment | 9.68 W/m2 | |
| Infiltration | 0.5 ACH | ASHRAE Standard 90.2-2004 |
| Parameter | Value | Reference |
|---|---|---|
| Clothing factor | Winter 1.0 Clo., Summer 0.5 Clo. | ASHRAE Standard 55-2013 |
| Metabolic rate | 1 MET | |
| Air velocity | 0.1 m/s |
| Heating Type | Indoor Setpoint Temperature | Reference | |
|---|---|---|---|
| Case 1 | Convective heating | Heating 20 °C | ASHRAE 90.2-2004 |
| Case 2 | Radiant floor heating | ||
| Case 3 | Convective heating | Heating 22 °C | ASHRAE standard 55-2013 |
| Case 4 | Radiant floor heating |
| Component | Name | Value |
|---|---|---|
| PVT collector | Type | Unglazed water |
| Length and width | 1.01 m × 19.72 m (19.95 m2) | |
| Number of tubes | 210 | |
| PV efficiency | 20% | |
| Slope | 35° | |
| Heat pump | Type | Water-to-water |
| Heating capacity | 10.5 kW | |
| Cooling capacity | 11.3 kW | |
| Ground heat exchanger | Number of boreholes | 1 |
| Borehole radius | 0.15 m | |
| Borehole depth | 200 m | |
| Circulating pump | Number of pumps | 5 |
| Power consumption | 2 kW | |
| Fan coil unit (Convective heating) | Heating capacity | 15 kW |
| Cooling capacity | 12 kW | |
| Fan power | 0.09 kW | |
| Floor heating pipes (Radiant floor heating) | Pipe spacing | 0.2 m |
| Pipe outside diameter | 0.02 m | |
| Pipe wall thickness | 0.001 m | |
| Pipe wall conductivity | 1.36 kJ/h·m·K |
| Heat Pump COP | System COP | |
|---|---|---|
| Case 1 | 4.3 | 3.5 |
| Case 2 | 5.3 | 4.5 |
| Case 3 | 4.3 | 3.5 |
| Case 4 | 5.3 | 4.5 |
Publisher’s Note: MDPI stays neutral with regard to jurisdictional claims in published maps and institutional affiliations. |
© 2020 by the authors. Licensee MDPI, Basel, Switzerland. This article is an open access article distributed under the terms and conditions of the Creative Commons Attribution (CC BY) license (http://creativecommons.org/licenses/by/4.0/).
Share and Cite
Bae, S.; Nam, Y.; Choi, J.-H. Comparative Analysis of System Performance and Thermal Comfort for an Integrated System with PVT and GSHP Considering Two Load Systems: Convective Heating and Radiant Floor Heating. Energies 2020, 13, 5524. https://doi.org/10.3390/en13205524
Bae S, Nam Y, Choi J-H. Comparative Analysis of System Performance and Thermal Comfort for an Integrated System with PVT and GSHP Considering Two Load Systems: Convective Heating and Radiant Floor Heating. Energies. 2020; 13(20):5524. https://doi.org/10.3390/en13205524
Chicago/Turabian StyleBae, Sangmu, Yujin Nam, and Joon-Ho Choi. 2020. "Comparative Analysis of System Performance and Thermal Comfort for an Integrated System with PVT and GSHP Considering Two Load Systems: Convective Heating and Radiant Floor Heating" Energies 13, no. 20: 5524. https://doi.org/10.3390/en13205524