Article

Voltage Reduction in Medium Voltage Distribution Systems Using Constant Power Factor Control of PV PCS

1
Department of Electrical Engineering, Graduate School of Engineering, Tohoku University, Miyagi 980-8579, Japan
2
Kyushu Electric Power Co., Inc., Fukuoka 815-8720, Japan
*
Author to whom correspondence should be addressed.
Energies 2020, 13(20), 5430; https://doi.org/10.3390/en13205430
Submission received: 18 September 2020 / Revised: 12 October 2020 / Accepted: 13 October 2020 / Published: 17 October 2020

Abstract

:
Reverse power flow from a photovoltaic (PV) system in a distribution system causes a voltage rise. A relative study regarding the reduction in the distribution feeder voltage depending on system conditions and the magnitude of reverse power flow has been conducted. Several methods for mitigating voltage rise have been proposed; however, the influence of these methods on the voltage in the distribution system, where the voltage is reduced due to reverse power flow, remains to be determined. In this study, the effect of constant power factor control in low-voltage PV systems, which are widely used as voltage rise countermeasures in distribution systems, was analyzed under the condition that the distribution line voltage decreases due to reverse power flow. Consequently, the constant power factor control of the low-voltage distribution system was found to adversely reduce voltage in the medium voltage distribution system due to the consumption of lagging reactive power by the PV systems.

1. Introduction

Increasing the use of renewable energy sources, such as photovoltaic (PV) systems and wind turbines, can help reduce CO2 emission. However, the amount of renewable energy sources and weather conditions can degrade the power quality, such as voltage violations in a power grid. In a distribution system that supplies electric power in medium voltage (MV) and low-voltage (LV) power systems, the voltage rise due to the generation of renewable energy sources is one of the power quality issues [1]. Various studies have been conducted regarding countermeasures for the voltage rise using a control device introduced into the distribution system. Upgrading the existing distribution system by larger cables to reduce impedance or a larger voltage system is one of the basic countermeasures for the voltage rise. In a previous study [2], the optimal tap position of the on-load tap changer (OLTC) was determined based on the measurement of load current and distributed generator output power. A static var compensator (SVC) installed in the LV system can mitigate the voltage rise due to the PV system [3]. Regarding PV penetration, coordinating multiple devices, such as OLTC, SVC, shunt capacitors, and energy storage systems, is considered useful for mitigating the voltage rise [4,5,6,7].
Although the primary operation of a PV system is to generate electricity, an inverter that converts DC power from PV modules to AC power can control the amount of active power and reactive power depending on the power grid requirement within the range of the rated capacity [8]. Mitigation of the voltage rise in a distribution system using the control of an inverter, such as an active power curtailment and reactive power control, has been investigated in several previous studies [9]. For example [10], reactive power control of micro generators in distribution system mitigates the voltage rise and minimizes the power loss. A droop-based reactive power compensation algorithm and active power curtailment using significantly short-term PV power forecasts were proposed to alleviate the voltage rise [11]. Curtailment is the most effective measure to suppress the voltage rise; however, it is not cost-efficient. Therefore, the reactive power control method based on the sensitivity of the inverter to the critical bus voltage has been reported to regulate voltage within the allowable range and avoid unnecessary curtailment [12]. Because voltage control based on multi-point measurement results in an increase in the cost of information transmission, the optimal set points of active and reactive power with limited information exchanges were calculated for the residential PV inverters [13]. In another study [14], the effect of the inverter power factor setting on loss, voltage difference, and voltage variability across the feeder was investigated to determine that the optimal inverter power factor for voltage regulation depends on the power grid requirement and feeder characteristics. Furthermore, the dependence of the hosting capacity, which is the maximum amount of PV system in the distribution feeder [15], on the power factor setting of the inverter was previously analyzed [16]. Command governor design was proposed to control the voltage in the distribution system by the combination of reactive power and tap change control [17].
As indicated above, the voltage in the distribution system rises with an increase in the reverse power flow. However, in recent years, the voltage in the MV radial feeder with a large capacity of the PV system has been reported to decrease due to the reverse power flow from the high penetration of the PV system [18,19]. Moreover, the voltage reduction due to reverse power flow was measured [18]. Previous studies [18,19] have indicated that this phenomenon occurs because the voltage reduction effect by reactive power loss and line reactance is greater than the voltage rise effect by reverse active power flow and line resistance. Because the voltage reduction and voltage rise increase the voltage fluctuation across the feeder, the countermeasure for the voltage regulation in the distribution system with a large capacity of the PV system will be highly complex. A decrease in the hosting capacity caused by voltage reduction due to the large reverse power flow considering voltage violation has been previously reported [20,21,22].
The majority of studies regarding voltage control in distribution systems with the large-scale introduction of PV systems consider voltage fluctuations in terms of voltage rise due to the reverse power flow. Therefore, most voltage countermeasures are for voltage rise. However, whether the countermeasures that are useful for mitigating voltage rise will also be effective in voltage control in distribution systems where voltage reduction occurs due to the reverse power flow is unknown. It is of interest to determine how the constant power factor control of the PV system, which is one of the countermeasures for the voltage rise, affects the distribution system with the problem of voltage reduction due to the consumption of lagging reactive power by the PV system.
This study aims to evaluate the constant power factor control of a power conditioning system (PCS) for the PV added to the distribution system, where the voltage reduction occurs due to the reverse power flow. It is assumed that the proposed PV PCS has a constant power factor control that is a countermeasure against the voltage rise. The distribution system operator (DSO) should not allow such a PV system to be introduced into the distribution line where the voltage reduction occurs. However, if the voltage reduction phenomenon in the distribution lines is not sufficiently recognized by the DSO and PV system introducers, it is possible to install a PV system with a constant power factor control into such a distribution system. Therefore, the effect of the reactive power injected by the PV system on the voltage in the distribution system was analyzed using a distribution system model that corresponds to an actual feeder in Japan.
The remainder of this paper is organized as follows. The measured example of voltage reduction due to reverse power flow is introduced in Section 2. In Section 3, a simulation model that evaluates the effect of constant power factor control on the voltage is presented. Various case studies are provided in Section 4, followed by the conclusions in Section 5.

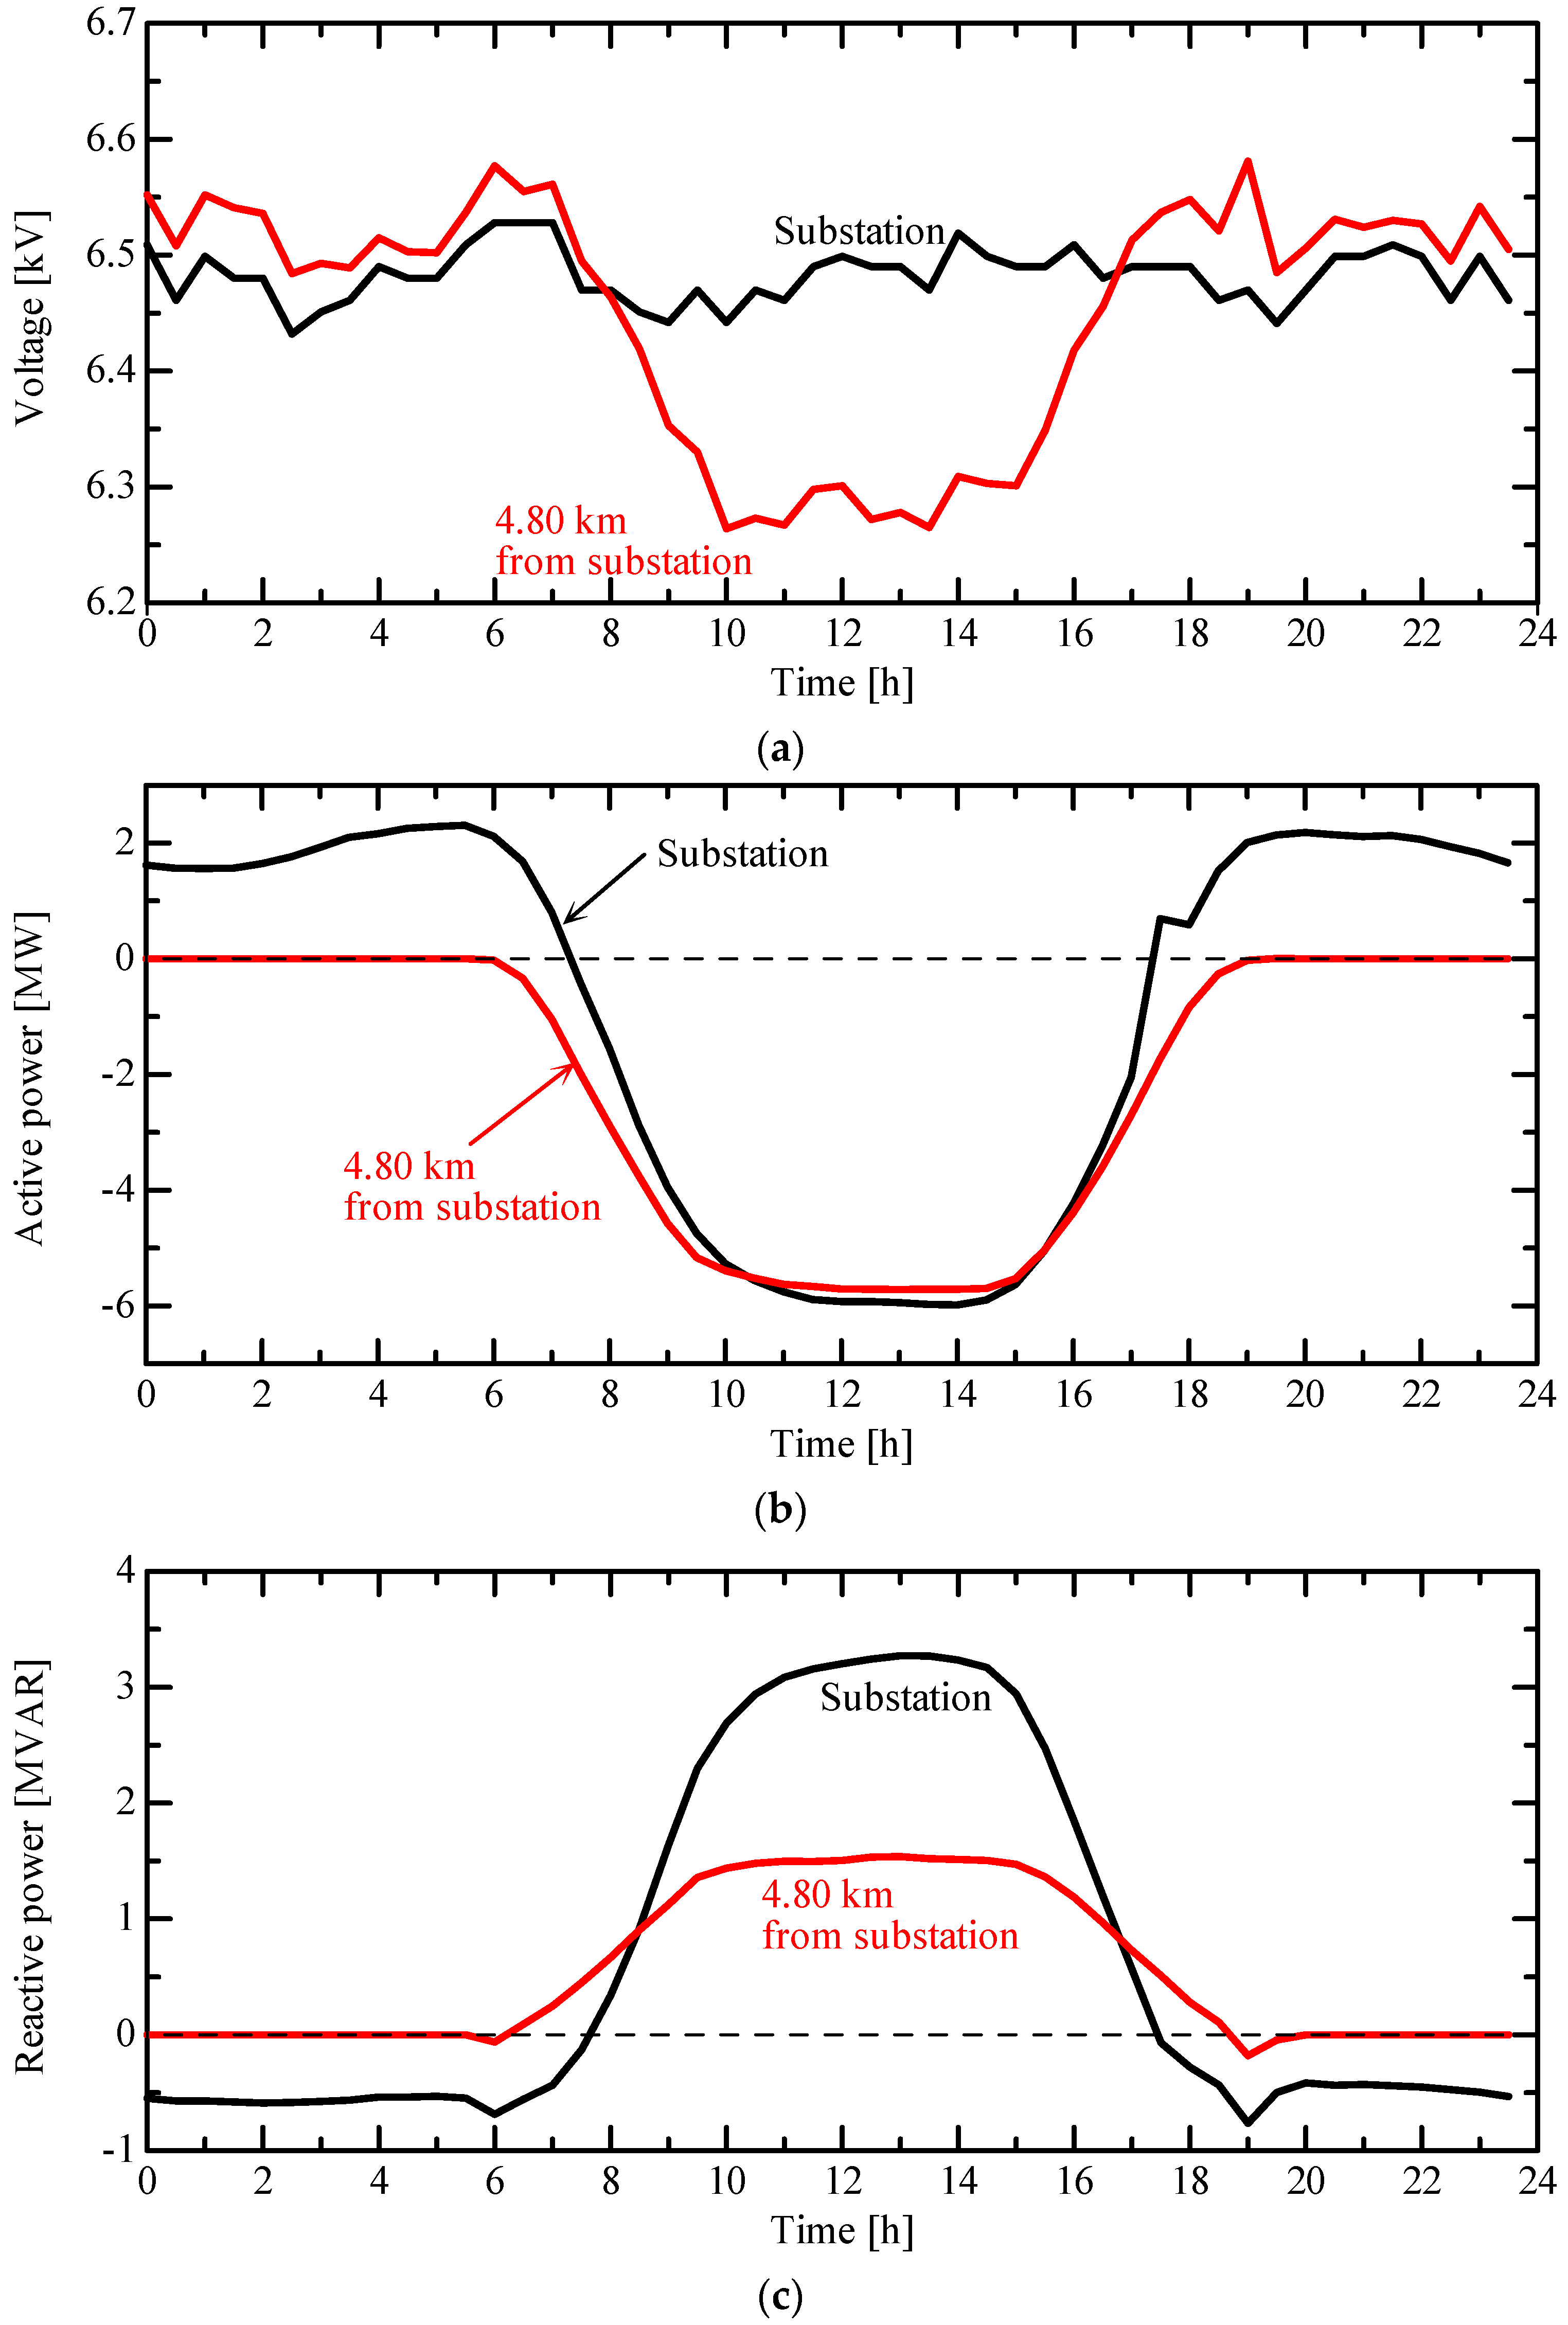
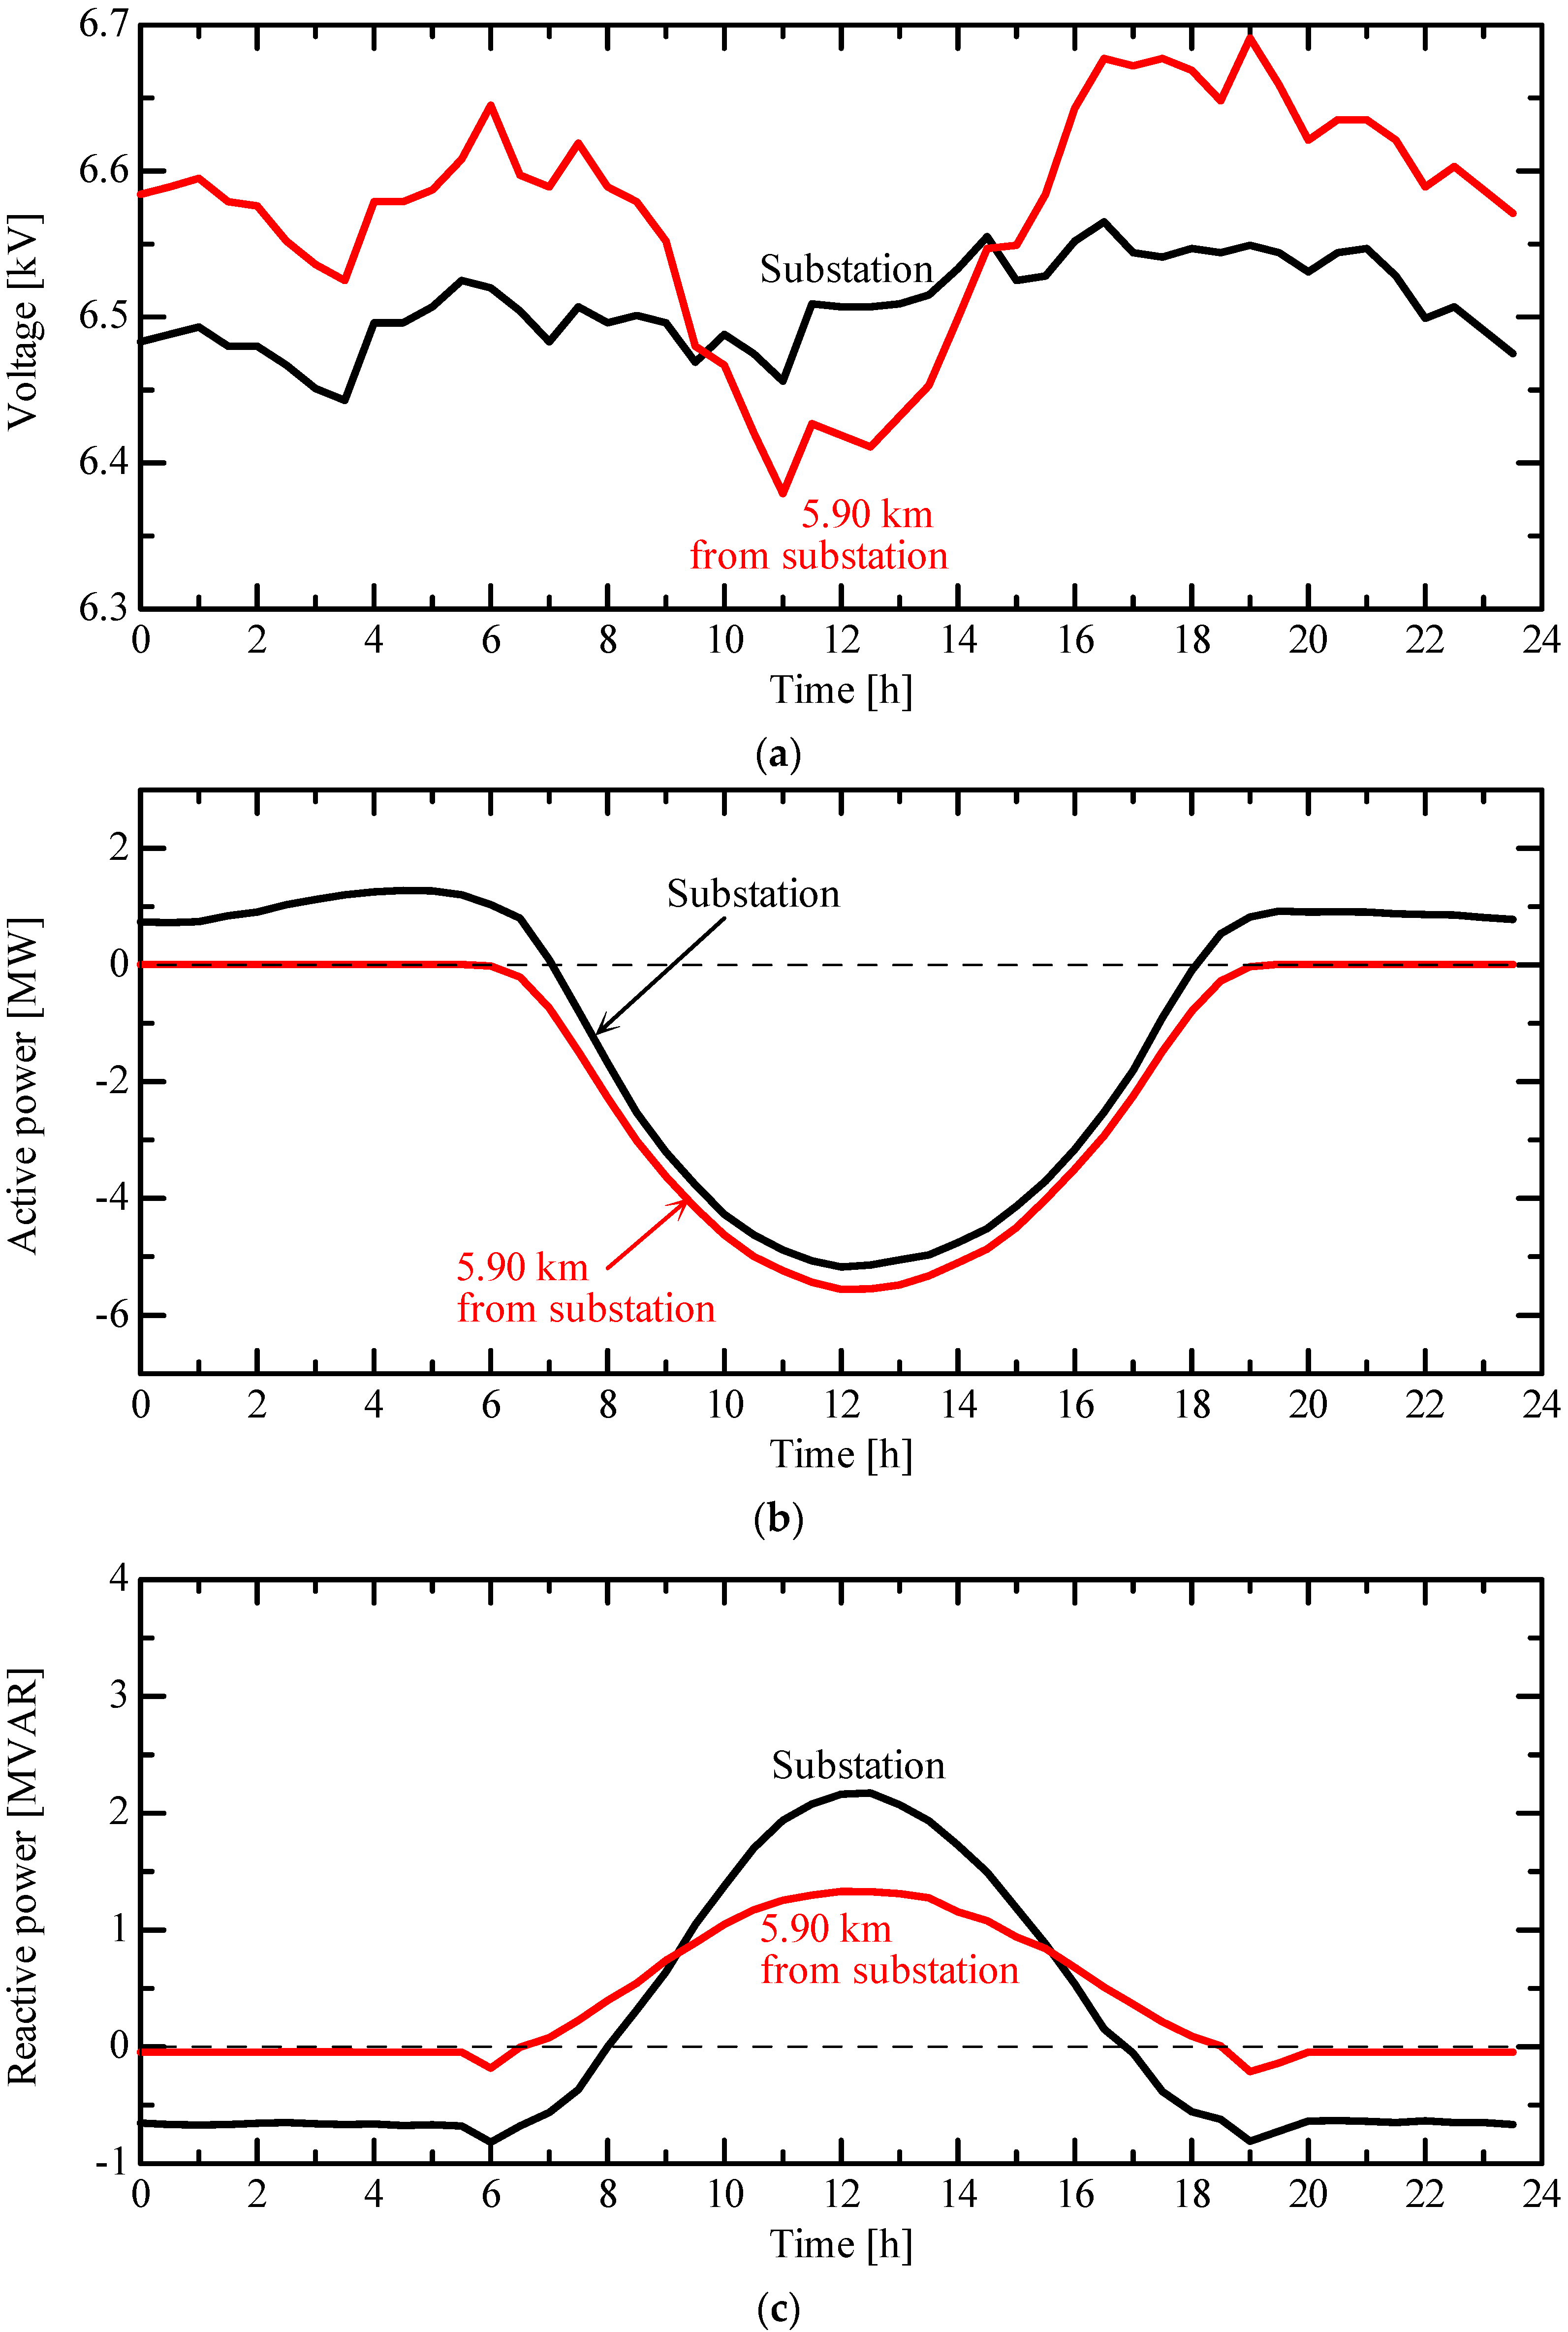
2. Measurement of Voltage Reduction Due to Reverse Power Flow

Sample MV feeders with the PV system in the Kyushu area of Japan were extracted for measurement of voltage. The nominal voltage is 6.6 kV. As an example, a single line diagram for three of the sampled distribution feeders is presented in Figure 1.
Because MW-class PV systems that are larger than loads in the feeder are connected to all the distribution feeders in Figure 1, a large reverse power flow occurs during the day. The distribution feeder voltage near the substation and the MW-class PV system was measured using sensors. The sensors measure the voltage and current every second, and the average values for 30-min are recorded. The recorded data are applied to the voltage management system, which is composed of voltage control and distribution system planning. In our study, the measurement data have been analyzed so as to find the voltage reduction due to the reverse power flow. The active and reactive power can be calculated using the measurements. Measurements were conducted on 23 April 2017, which was a sunny day with a high level of solar radiation.
Figure 2 presents the measured voltage, active power, and reactive power in distribution feeder A shown in Figure 1a.
When the reverse active power flow increases during the daytime, the voltage near the MW-class PV system decreases compared to the voltage at the substation, that is, the voltage reduction due to reverse power flow occurs. In Figure 2c, the reactive power loss is presented by the difference between the measured reactive power near the substation and the PV system. It is clear that the reactive power loss increases with the magnitude of voltage reduction. The fact that the voltage reduces with an increase in the reactive power loss supports the theory previously indicated [16].
Similarly, Figure 3 and Figure 4 present the measurement results of distribution feeders B and C, shown in Figure 1b,c, respectively.
The voltage reduction due to the reverse power flow was also observed, simultaneously confirming the increase in the reactive power loss in the distribution feeder. These measurements indicate that the voltage reduction due to reverse power flow is a phenomenon that can occur in daily operation in a distribution feeder. This suggests that voltage control should be performed for voltage reduction and voltage rise due to reverse power flow.

3. Medium and LV Distribution System Model

3.1. MV Distribution System Model

The effect of an increase in the PCS with a constant power factor control on voltage by power flow calculation was investigated using one of the actual distribution systems indicated in Section 2. Several new PCSs were assumed to be connected to the LV distribution system. Prior to the connection of the PCS, the voltage in the MV distribution feeder was reduced due to the reverse power flow, as shown in Figure 2a.
Figure 5 presents a detailed one-line diagram of the three-phase 6.6-kV MV distribution system model that corresponds to the actual distribution feeder shown in Figure 1a. Node N1 expresses the secondary side of the transformer in the distribution substation. Large capacity PV systems are connected to nodes N23 and N35. Several nodes in the figure have the MV loads corresponding to the factory loads, while the other nodes have the LV distribution system of which the capacities are listed in Table 1. The line impedance shown in Figure 5 is estimated from the actual line material, thickness, length, and arrangement.

3.2. Low-Voltage Distribution System Model

The LV distribution system is assumed to be a single-phase three-wire system that is widely applied for customers in residential areas. Figure 6 presents a one-line diagram indicating a typical LV distribution system in Japan. A distribution transformer supplies power to eight customers via distribution lines. The impedance in the LV distribution system is shown in Table 2. The line impedance shown in Figure 6 is estimated from the actual line material, thickness, length, and arrangement. The customer has a load of 4 kW; therefore, the total load capacity in the LV distribution system is 32 kW. The amount of the LV distribution system connected to the MV distribution system shown in Figure 5 is arranged to obtain the load capacity of the LV distribution system presented in Table 1.
The total capacity of PCS in the LV distribution system depends on the number of customers with PV systems. The PCS consists of a DC/DC converter and inverter, which converts from DC power generated by the PV module to AC power. The capacity of PCS per customer is 4 kW. Because the amount of the LV distribution system connected to the MV distribution system depends on the load capacity shown in Table 1, the total capacity of the PCS installed in the distribution system can be changed by the number of customers with the PV system, as presented in Table 3.
Constant power factor control presented in Table 3 is applied to the PCS. The effect of the constant power factor control on the voltage will be described in Section 4. It is assumed that the bad influence of PCS, such as resonance due to power factor control on the power grid, would not occur in our study.

3.3. Load and PV Output Model

The time variation in the active power supplied to the load in the LV distribution system was modeled based on the measured value in the actual MV distribution line. Sensors were installed on the feeder that supplies power to the residential area, and the time variation in active power was measured. The time variation in the active power of the load model was obtained and expressed per unit, as shown in Figure 7, by selecting the total load capacity of the LV distribution system in the measured feeder as the base power. The reactive power of the load in the LV distribution system was excluded because it was sufficiently smaller than the active power in the LV distribution system in Japan. Therefore, the effect of the constant power factor control of PCS on the voltage in the distribution system would be apparent because the PCS is the only reactive power source in the LV distribution system.
Additionally, a load model in the MV distribution system was obtained based on the measurements. The difference from the load in the LV distribution system was the time variation in the reactive power because most of the load in the MV distribution system, such as factories, introduces a capacitor for power factor correction. Therefore, the reactive power supplied to the load in the MV distribution system is not negligible.
The output model of the PV system in the distribution system shown in Figure 8 was created assuming clear weather, which implies significant solar radiation. Therefore, the reactive power injected from the PCS regulated by a constant power factor control will be larger than on cloudy or rainy days. This is a suitable condition for investigating the effect of the constant power factor control of the PCS on the voltage.

4. Effect of Constant Power Factor Control of PCS on Voltage in an MV Distribution System

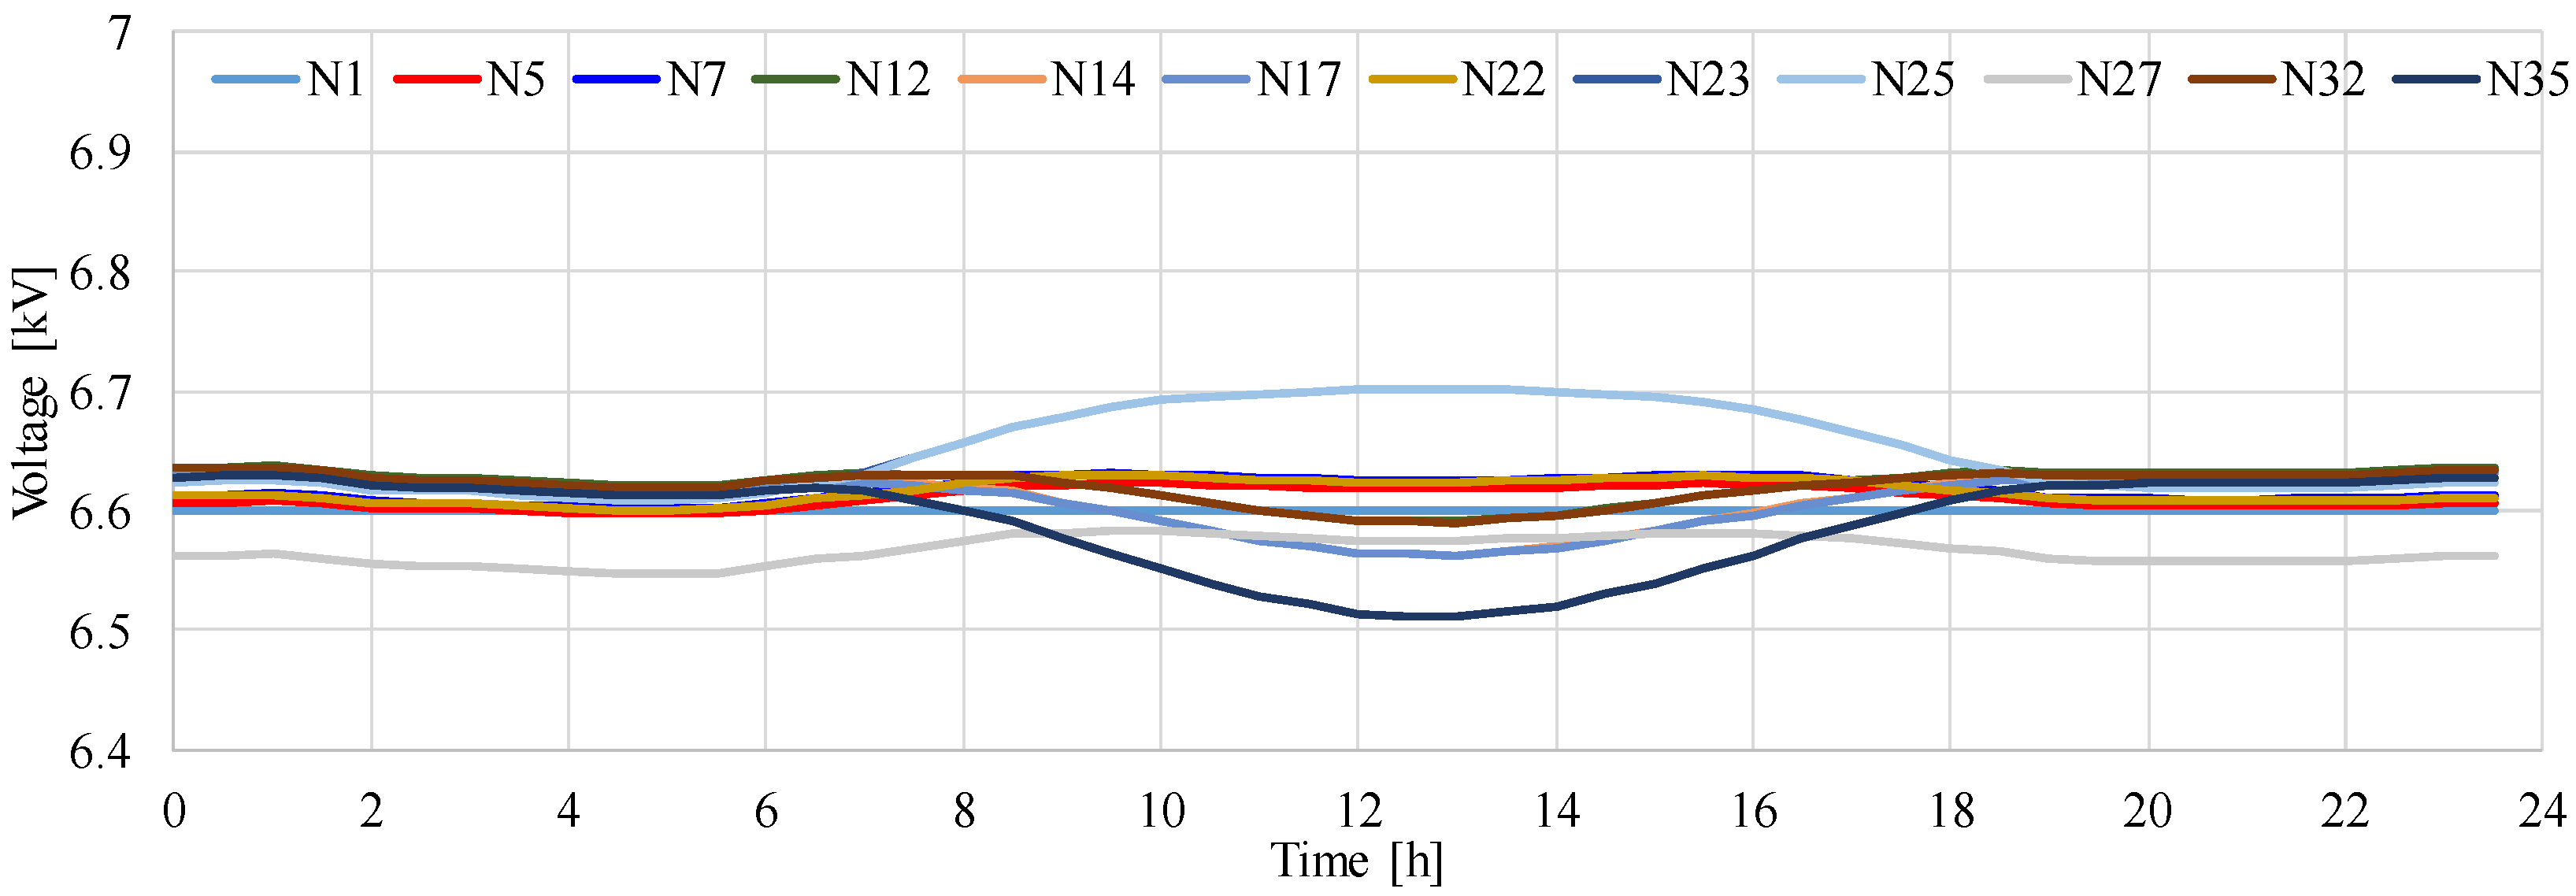
4.1. Voltage without LV PCS

To clarify the effect of the amount and constant power factor control of PCS, the case where the PCS was not installed was calculated.
Figure 9 presents the time variation in the voltage in the MV distribution system model shown in Figure 5. The results illustrate that the voltage at several nodes decreases with an increase in the output of the PV systems in the MV distribution system presented in Figure 5. The maximum voltage reaches 6.70 kV. It was found that the minimum voltage during the 24-h period drops to 6.51 kV when the amount of solar radiation is at its maximum. The difference between the maximum and minimum voltage is 0.19 kV.

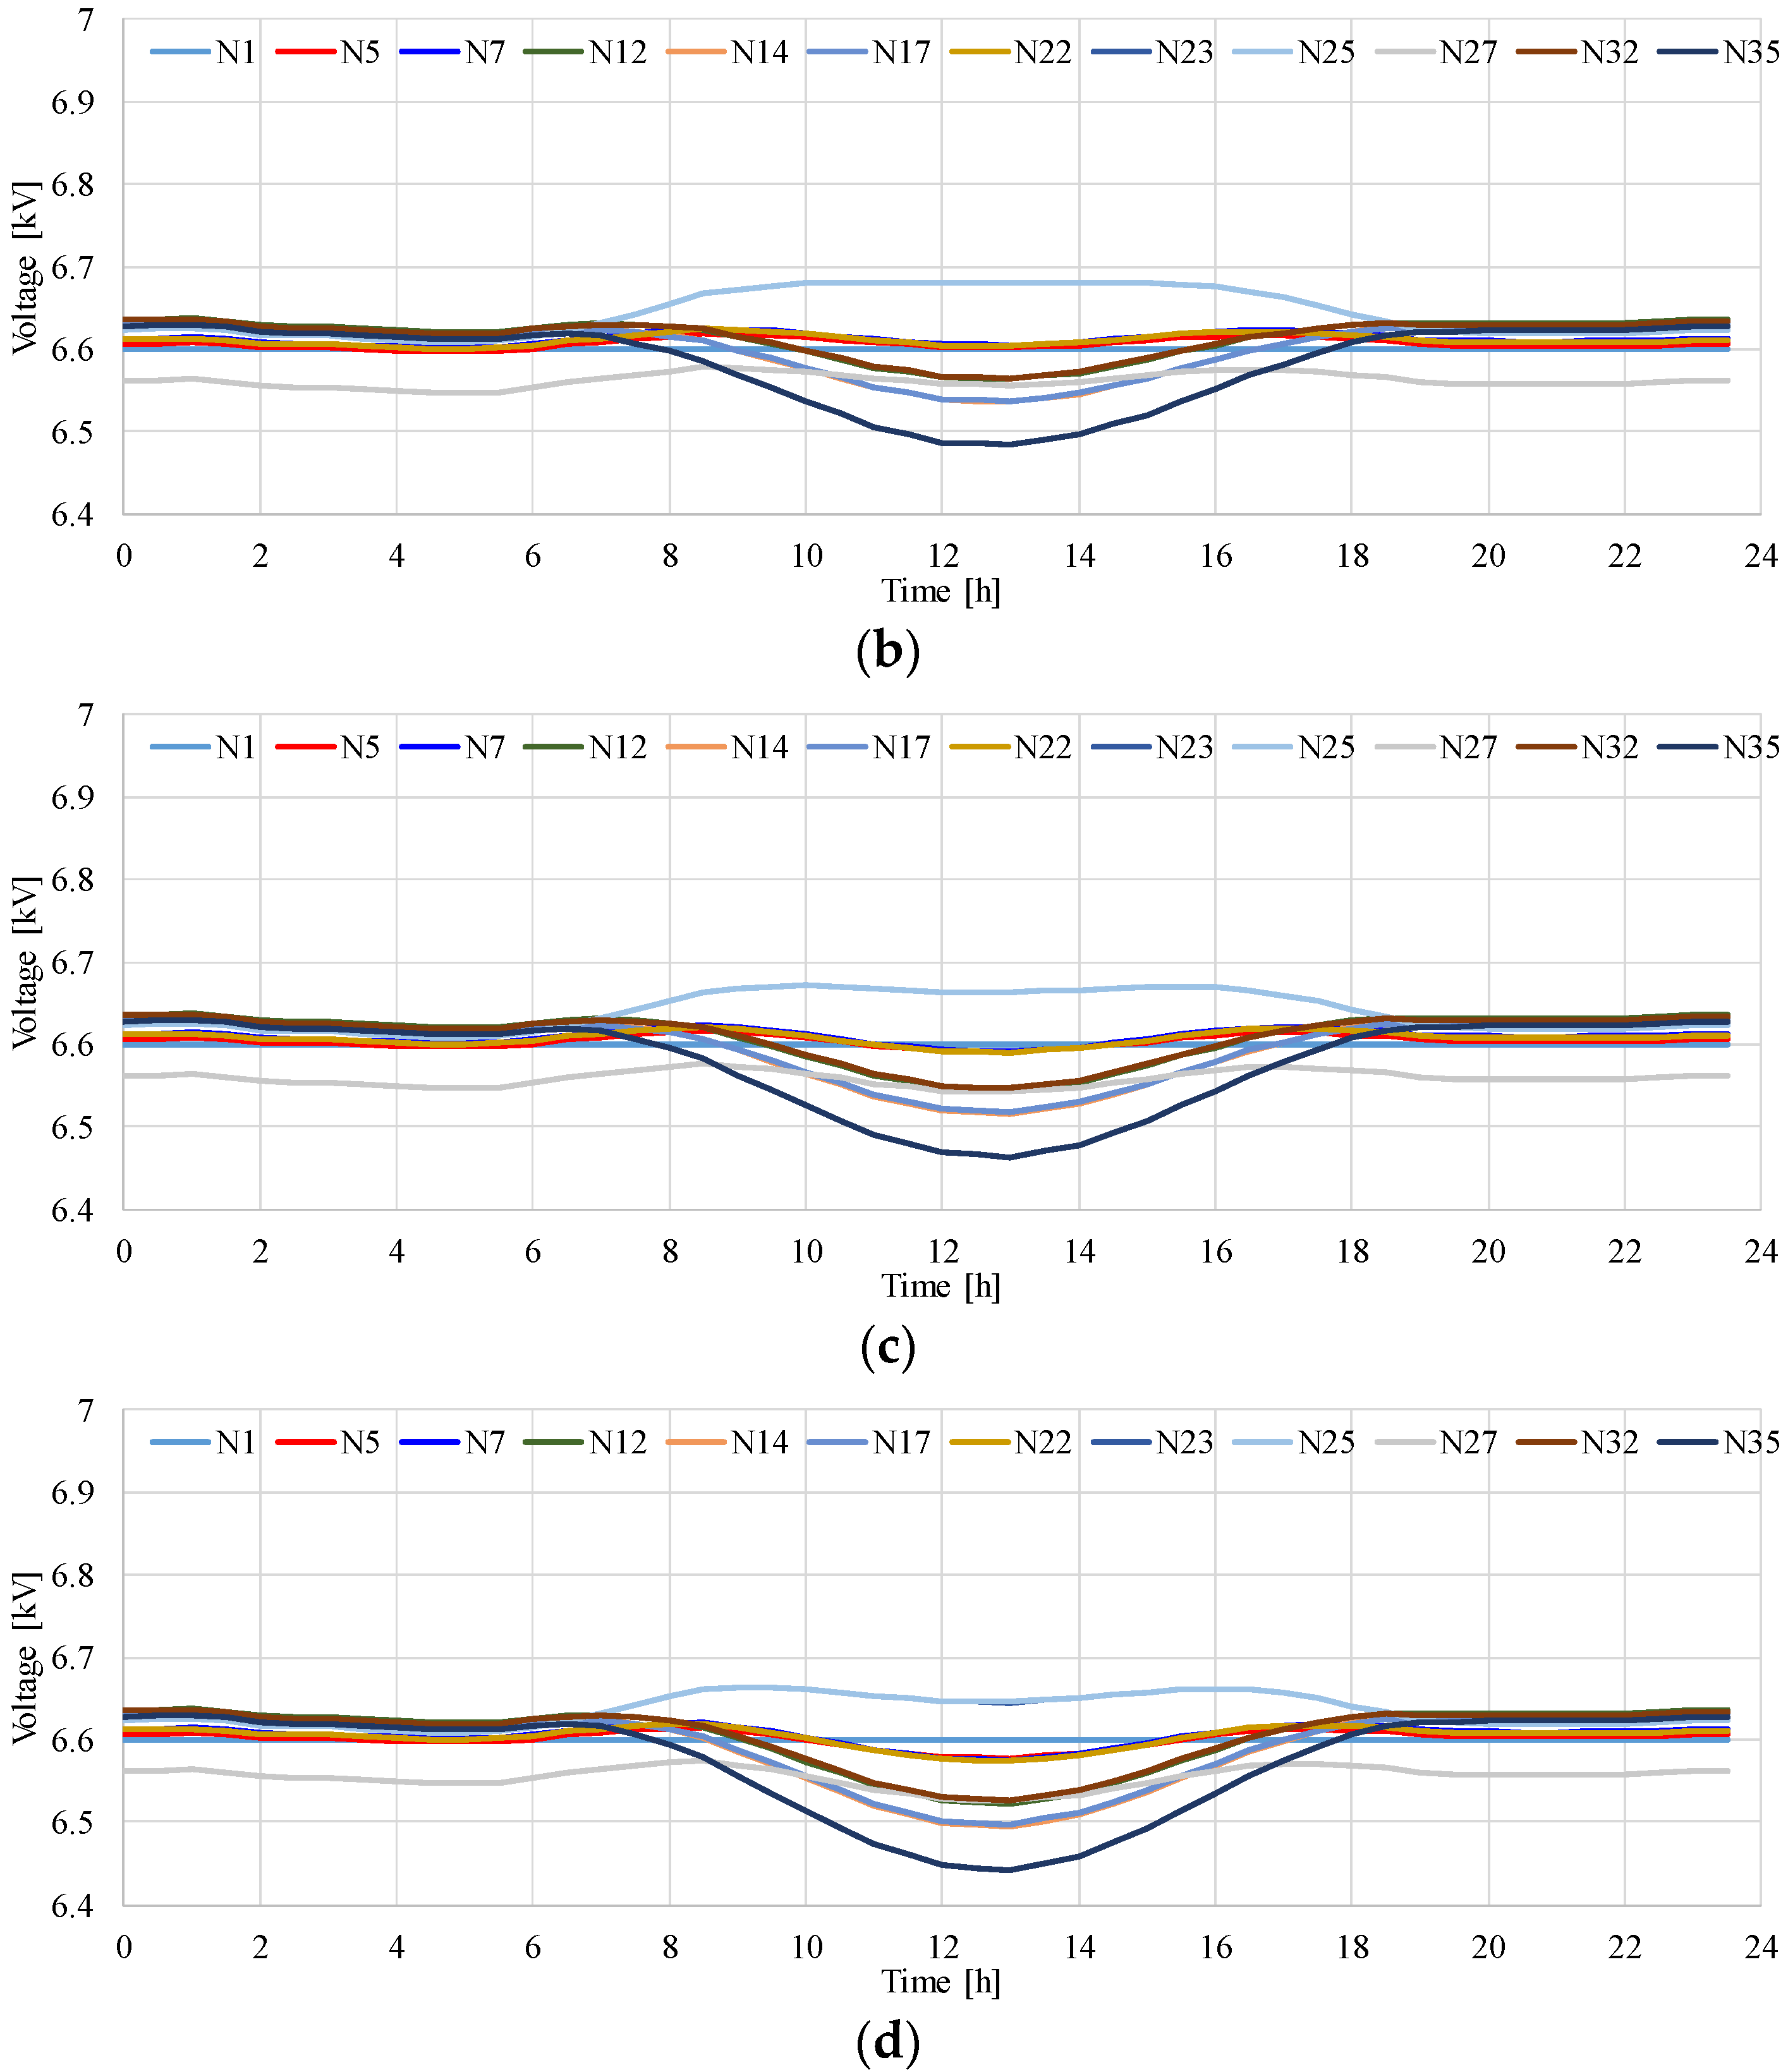
4.2. Effect of Constant Power Factor Control of PCS on Voltage at MV Distribution System

Figure 10 presents the time variation in the voltage of the MV distribution feeder when the PCS is installed, for which the capacity is indicated in Table 3. As shown in Figure 10, the power factor of the PCS is set to 1.0. Case A1 is the smallest, and case D1 is the largest in the capacity of PCS. The maximum voltage during the 24-h period increases slightly with the capacity of PCS. This is explained by the power factor of the PV system. The average power factor of the PV system in the MV distribution feeder shown in Figure 5 is less than 1.0. When the capacity of PCS with a power factor of 1.0 increases, the power factor of the entire PV system approaches 1.0. For the same reason, the minimum voltage increases slightly.
Figure 11 shows the voltage profile at the time when the PCS output is at its maximum. The horizontal axis shows the node number that corresponds to the main line in the MV distribution system shown in Figure 5. The voltage increases with the capacity of PCS. When the power factor of PCS is equal to 1.0, the reactive power is not generated by the PCS. As a result, the voltage reduction due to the reactive power and line reactance does not affect the distribution line voltage.
Notably, the voltage reduction due to the reverse power flow worsens by setting the power factor of PCS to 0.95, as shown in Figure 12. The reactive power loss in the MV distribution feeder increases with the reactive power generated by PCS, and the voltage in the MV distribution feeder decreases. This becomes more apparent as the capacity of PCS increases. Regarding case D2, which is the largest in the capacity of PCS in Figure 11, the minimum voltage drops to 6.44 kV. The maximum voltage also decreases for the same reason.
Figure 13 also presents the voltage profile when the power factor of PCS is 0.95. The voltage decreases with an increase in the capacity of PCS. The reactive power generated by the PCS has an influence on the voltage reduction. As presented in Figure 9, the voltage decreases by the PV system that is installed in the MV distribution system. Figure 13 indicates that the voltage is further reduced due to the constant power factor control of PCS. The voltage may decrease and deviate the lower limit of voltage in the MV distribution system by the constant power factor control.
The maximum and minimum voltages in the MV distribution line as a function of PCS capacity are shown in Figure 14. When the power factor is set to 1.0, the maximum and minimum voltages increase with the capacity of PCS. However, setting the power factor to 0.95 results in the opposite. In particular, note that a decrease in the minimum voltage may affect the management of MV regulation. The difference between the maximum and minimum voltages does not significantly depend on the capacity of PCS.

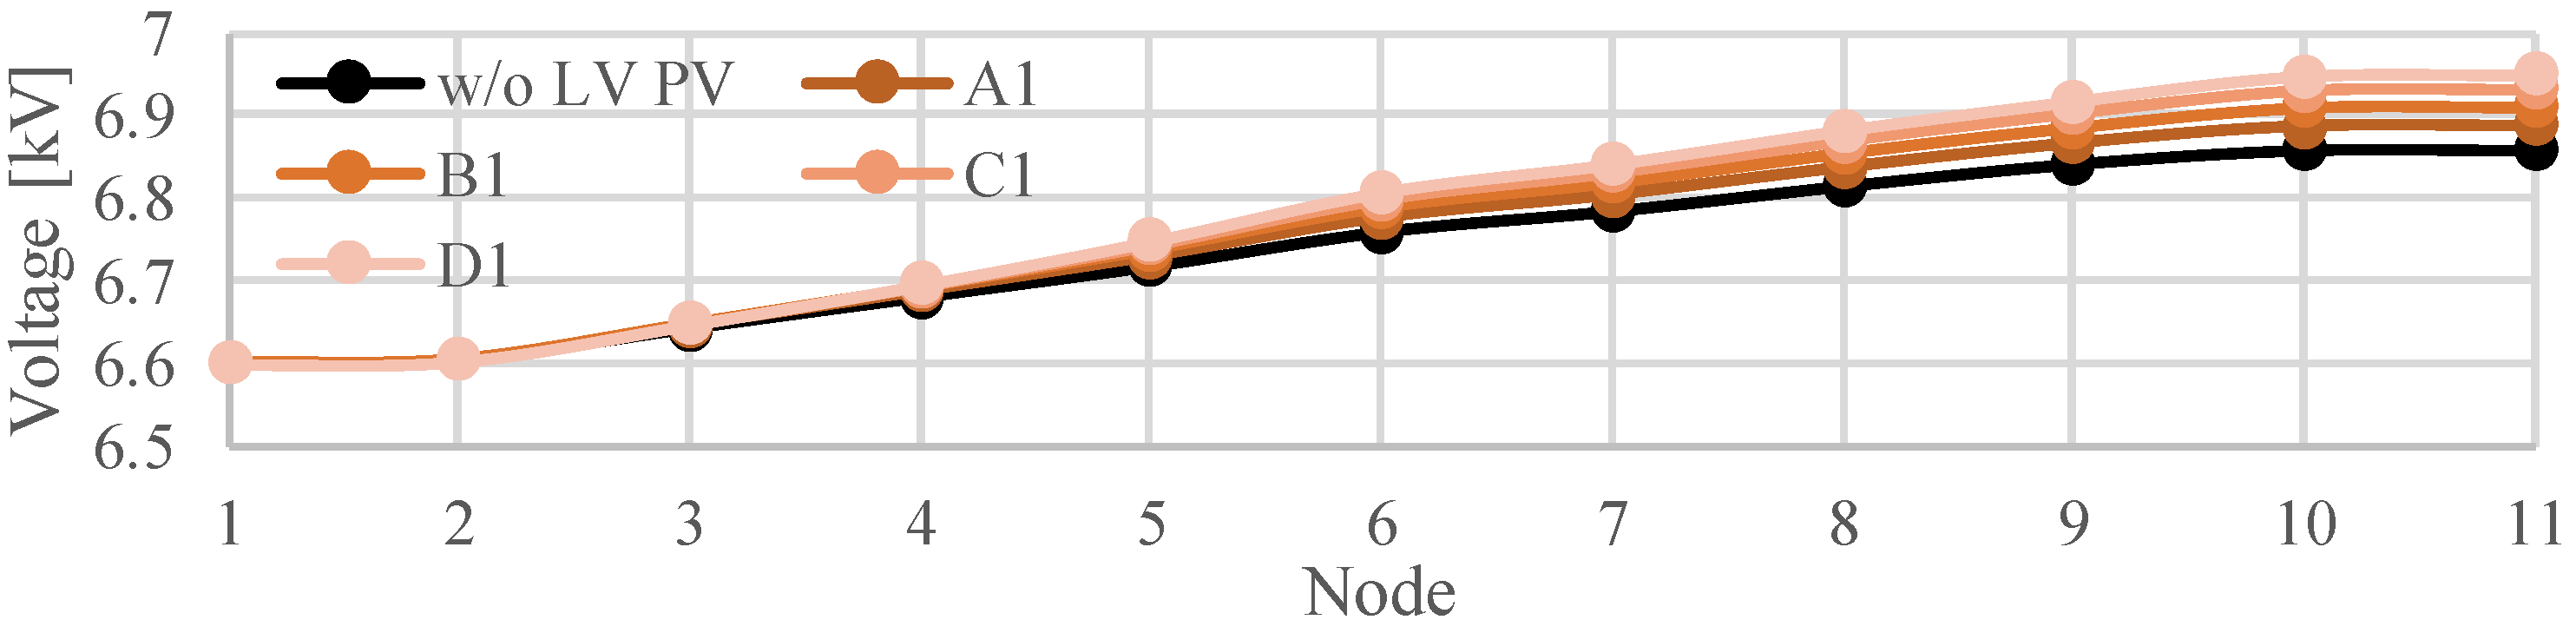
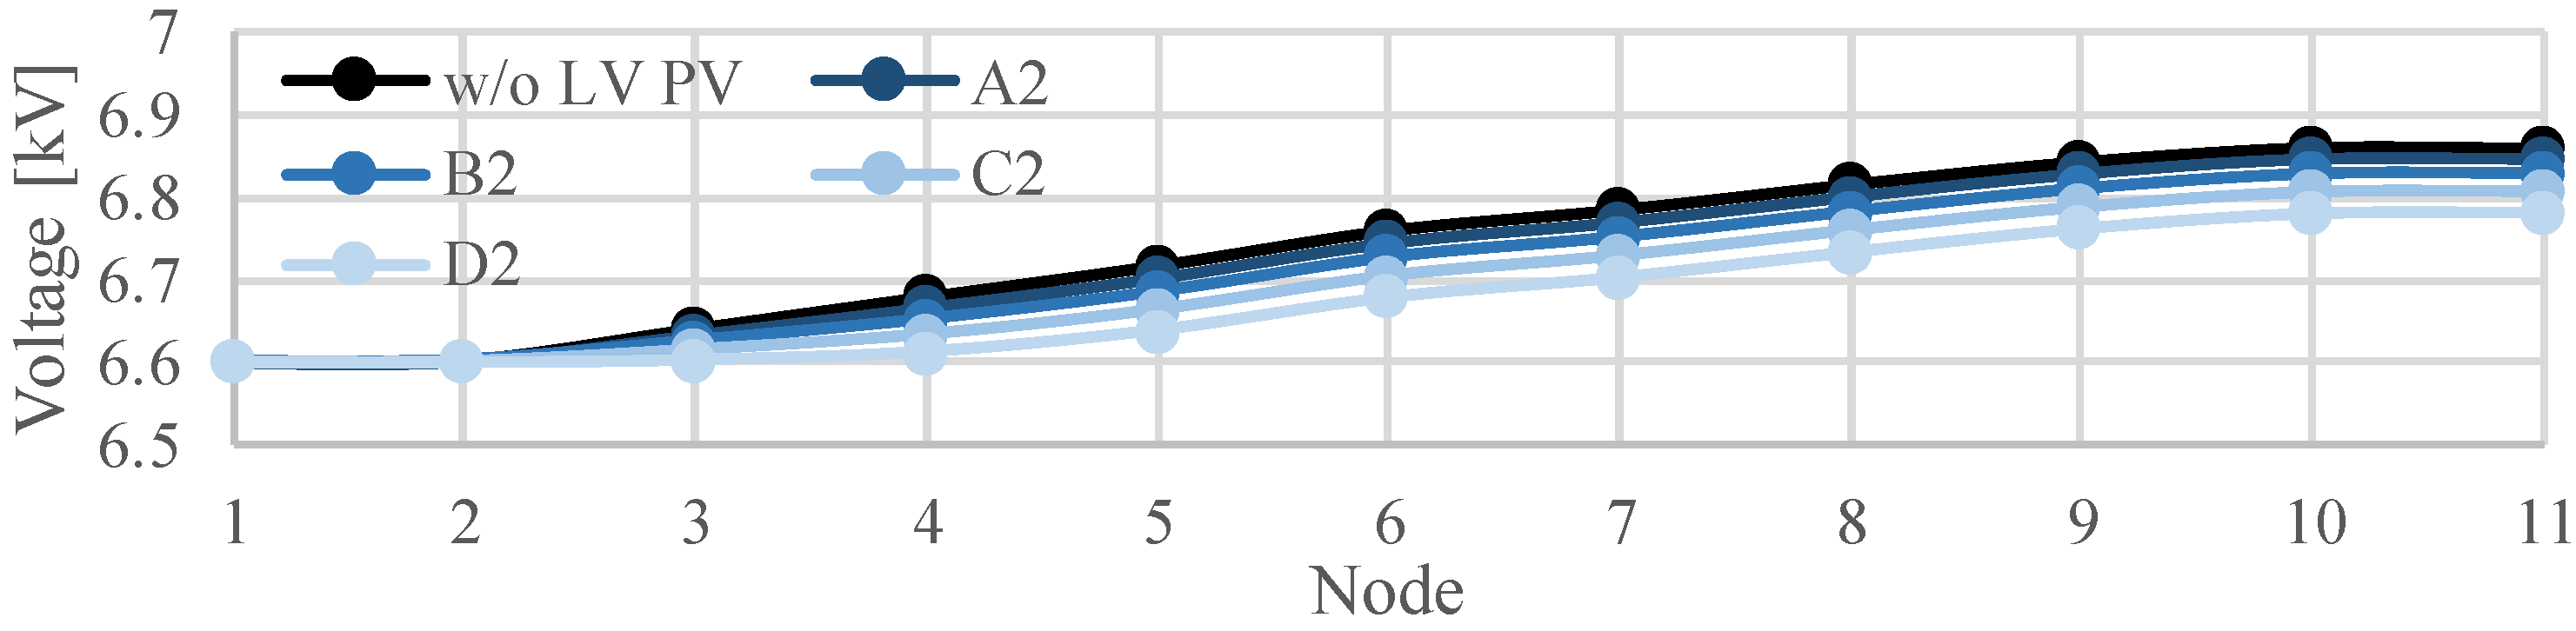
4.3. Comparison with Other MV Distribution System

The effects of constant power factor control of PCS on the voltage have been compared using other distribution system models. Figure 15 presents another detailed one-line diagram of the three-phase 6.6 kV MV distribution system model that corresponds to the actual distribution feeder. Although large capacity PV systems are connected to nodes N24 and N25, the voltage reduction due to reverse power flow was not observed, and the voltage rise was observed.
Figure 16 and Figure 17 presents the voltage profile at the time when the PCS output is maximum. The horizontal axis shows the node number that corresponds to the main line in the MV distribution system shown in Figure 15. The black solid line shows the voltage profile without LV PCS, which presents the voltage rises by the reverse power flow. When the power factor is equal to 1.0, as shown in Figure 16, the voltage increases with the capacity of PCS. The application of the power factor of 0.95 on the PCS mitigates the voltage rise as shown in Figure 17.
These results are widely known as the effect of constant power factor control on the voltage rise, and are presented in [3,4,5,6,7,8,9,10,11,12,13,14,16,17]. However, as described the previous section, if the voltage reduction is due to the large-scale reverse power flow, the power factor control has a bad influence on the voltage reduction, that is, the voltage may further decrease. In this case, the constant power factor control should not be applied to the LV PCS.

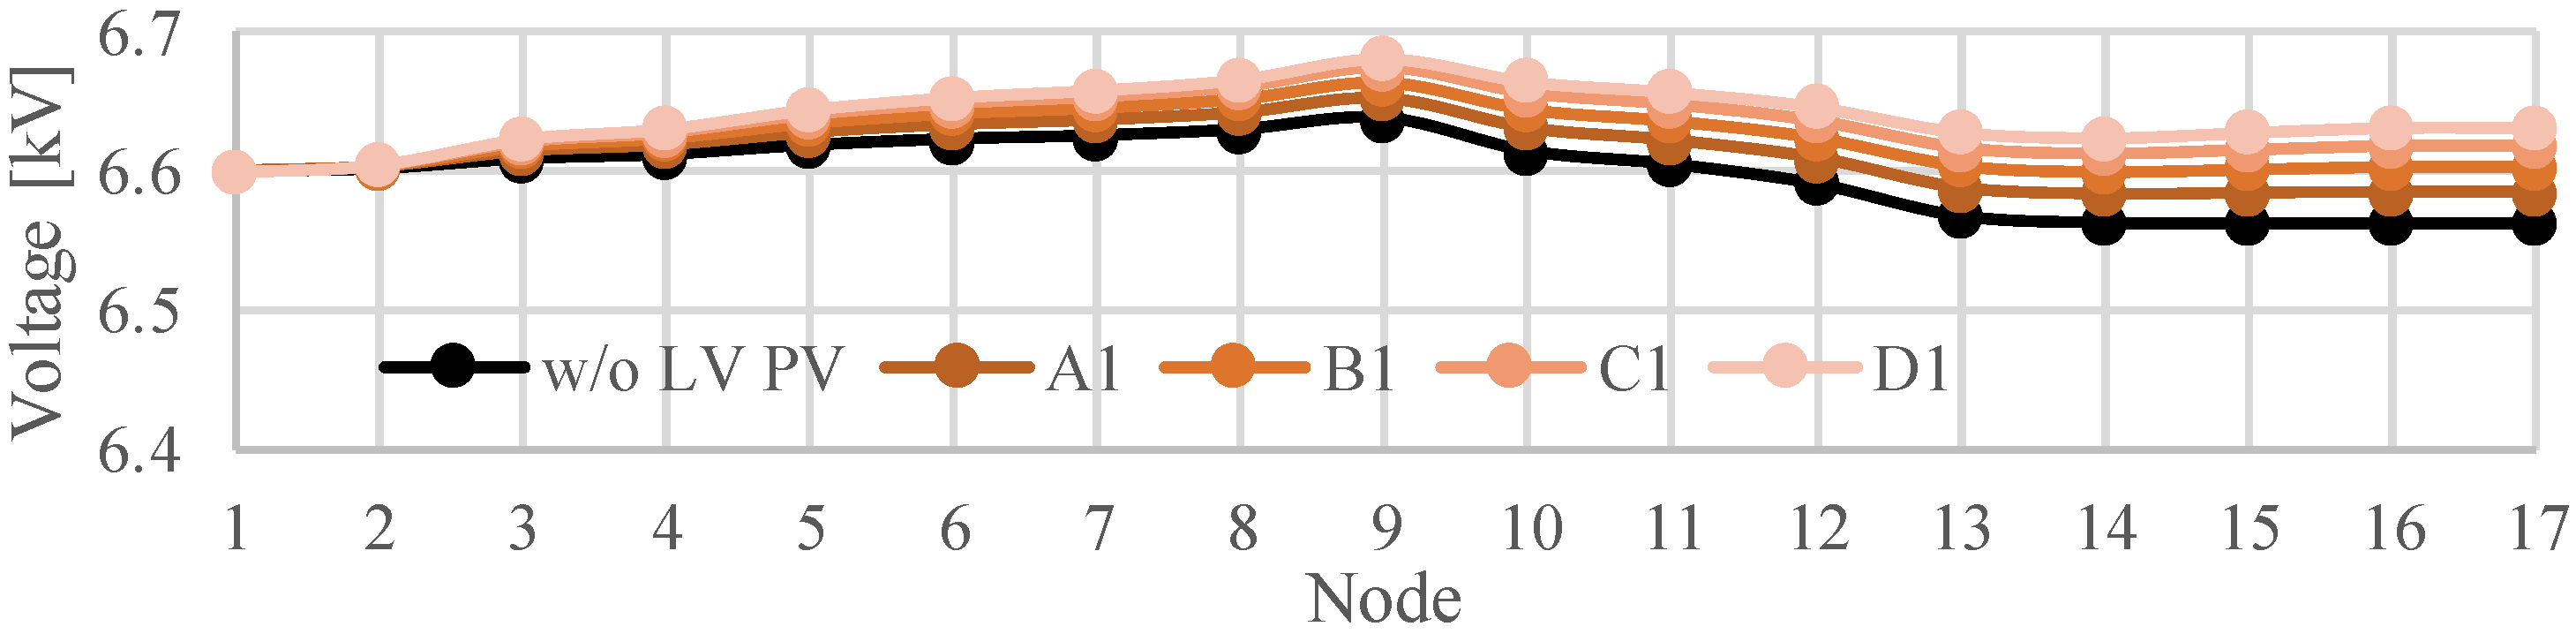
4.4. Effect of Constant Power Factor Control of PCS on Voltage in LV Distribution System

The voltage in all LV distribution systems connected to the MV distribution feeder was analyzed. The maximum and minimum voltages in all LV distribution systems during a 24-h period are summarized in Figure 18, which indicates that setting the power factor of PCS to 0.95 can mitigate the rise of the maximum voltage despite the capacity of PCS increasing. This can be explained by the fact that the constant power factor control of the PV system mitigates the overall voltage rise in the LV distribution system. Because the line resistance of the LV distribution system is sufficiently greater than its line reactance, the voltage reduction effect due to the reactive power loss of the PCS in the LV distribution system is smaller than the voltage increase effect due to the reverse active power flow. On the contrary, because the minimum voltage in the LV distribution system depends on the early morning load without PCS, the minimum voltage is constant with changes in the capacity of PCS.

5. Conclusions

The measurement of voltage reduction in an actual distribution system due to a large reverse power flow in Japan was presented in this study. In addition, the effect of the constant power factor control of PCS in a LV distribution system on the voltage was investigated, assuming that the voltage of the MV distribution line reduces due to reverse power flow from the PV system in the MV distribution line. The primary results obtained are as follows:
  • Notably, the constant power factor control of PCS worsens voltage reduction in a MV distribution system. This can be explained by an increase in the reactive power loss in a MV distribution line due to reverse power flow. The decrease in the minimum voltage of the distribution system may affect the management of voltage regulation.
  • The constant power factor control of PCS works effectively for mitigating the voltage rise in LV distribution systems and even in an MV distribution system with the characteristic of voltage reduction due to the reverse power flow.
  • As described in many studies, it has been confirmed that the constant power factor control mitigates the voltage rise in a distribution system in which the voltage rises with the increase in the reverse power flow.
  • Before the constant power factor control is applied to the PCS in the LV distribution system, the DSO should determine whether the voltage reduction due to reverse power flow may occur in the MV distribution line.

Author Contributions

This study is a collaborative effort among the authors, and all authors have read and agreed to the published version of the manuscript. conceptualization, D.I.; methodology, D.I. and T.T.; software, D.I. and T.T.; validation, T.T. and T.H.; formal analysis, D.I.; investigation, T.F.; resources, J.M.; data curation, T.F.; writing—original draft preparation, D.I.; writing—review and editing, D.I., T.F., T.T., T.H. and J.M.; visualization, D.I. and T.F.; supervision, T.H.; project administration, T.H.

Funding

This research received no external funding.

Conflicts of Interest

The authors declare no conflict of interest.

References

  1. Masters, C.L. Voltage rise: The big issue when connecting embedded generation to long 11 kV overhead lines. Power Eng. J. 2002, 16, 5–12. [Google Scholar] [CrossRef]
  2. Choi, J.H.; Kim, J.C. Advanced voltage regulation method of power distribution systems interconnected with dispersed storage and generation systems. IEEE Trans. Power Deliv. 2001, 16, 329–334. [Google Scholar] [CrossRef]
  3. Iioka, D.; Sakakibara, K.; Yokomizu, Y.; Matsumura, T.; Izuhara, N. Distribution voltage rise at dense photovoltaic generation area and its suppression by SVC. Electr. Eng. Jpn. 2009, 166, 47–53. [Google Scholar] [CrossRef]
  4. Abdel-Rahman, M.H.; Youssef, F.M.H.; Saber, A.A. New static var compensator control strategy and coordination with under-load tap changer. IEEE Trans. Power Deliv. 2006, 21, 1630–1635. [Google Scholar] [CrossRef]
  5. Daratha, N.; Das, B.; Sharma, J. Coordination between OLTC and SVC for Voltage Regulation in Unbalanced Distribution System Distributed Generation. IEEE Trans. Power Syst. 2014, 29, 289–299. [Google Scholar] [CrossRef]
  6. Aryanezhad, M. Management and coordination of LTC, SVR, shunt capacitor and energy storage with high PV penetration in power distribution system for voltage regulation and power loss minimization. Int. J. Electr. Power Energy Syst. 2018, 100, 178–192. [Google Scholar] [CrossRef]
  7. Kraiczy, M.; Stetz, T.; Braun, M. Parallel Operation of Transformers with on Load Tap Changer and Photovoltaic Systems with Reactive Power Control. IEEE Trans. Smart Grid 2018, 9, 6419–6428. [Google Scholar] [CrossRef]
  8. Hassaine, L.; Olias, E.; Quintero, J.; Haddadi, M. Digital power factor control and reactive power regulation for grid-connected photovoltaic inverter. Renew. Energy 2009, 34, 315–321. [Google Scholar] [CrossRef]
  9. Chaudhary, P.; Rizwan, M. Voltage regulation mitigation techniques in distribution system with high PV penetration: A review. Renew. Sustain. Energy Rev. 2018, 82, 3279–3287. [Google Scholar] [CrossRef]
  10. Bolognani, S.; Carli, R.; Cavraro, G.; Zampieri, S. Distributed Reactive Power Feedback Control for Voltage Regulation and Loss Minimization. IEEE Trans. Autom. Control 2015, 60, 966–981. [Google Scholar] [CrossRef] [Green Version]
  11. Ghosh, S.; Rahman, S.; Pipattanasomporn, M. Distribution Voltage Regulation through Active Power Curtailment with PV Inverters and Solar Generation Forecasts. IEEE Trans. Sustain. Energy 2017, 8, 13–22. [Google Scholar] [CrossRef]
  12. Safayet, A.; Fajri, P.; Husain, I. Reactive Power Management for Overvoltage Prevention at High PV Penetration in a Low-Voltage Distribution System. IEEE Trans. Ind. Appl. 2017, 53, 5786–5794. [Google Scholar] [CrossRef]
  13. Dall’Anese, E.; Dhople, S.V.; Johnson, B.B.; Giannakis, G.B. Decentralized Optimal Dispatch of Photovoltaic Inverters in Residential Distribution Systems. IEEE Trans. Energy Convers. 2014, 29, 957–967. [Google Scholar] [CrossRef] [Green Version]
  14. Bello, M.; Montenegro, D.; York, B.; Smith, J. Optimal Settings for Multiple Groups of Smart Inverters on Secondary Systems Using Autonomous Control. In Proceedings of the 2017 IEEE Rural Electric Power Conference (REPC), Columbus, OH, USA, 23–26 April 2017; pp. 89–94. [Google Scholar] [CrossRef]
  15. Smith, J. Stochastic Analysis to Determine Feeder Hosting Capacity for Distributed Solar PV; EPRI Report; No. 1026640; EPRI: Palo Alto, CA, USA, 2012. [Google Scholar]
  16. Rylander, M.; Reno, M.J.; Quiroz, J.E.; Ding, F.; Li, H.; Broderick, R.J.; Mather, B.; Smith, J. Methods to determine recommended feeder-wide advanced inverter settings for improving distribution system performance. In Proceedings of the 2016 IEEE 43rd Photovoltaic Specialists Conference (PVSC), Portland, OR, USA, 5–10 June 2016; pp. 1393–1398. [Google Scholar] [CrossRef]
  17. Casavola, A.; Tedesco, F.; Vizza, M. Command Governor Strategies for the Online Management of Reactive Power in Smart Grids with Distributed Generation. IEEE Trans. Autom. Sci. Eng. 2017, 14, 449–460. [Google Scholar] [CrossRef]
  18. Iioka, D.; Fujii, T.; Orihara, D.; Tanaka, T.; Harimoto, T.; Shimada, A.; Goto, T.; Kubuki, T. Voltage reduction due to reverse power flow in distribution feeder with photovoltaic system. Int. J. Electr. Power Energy Syst. 2019, 113, 411–418. [Google Scholar] [CrossRef]
  19. Matsumura, T.; Tsukamoto, M.; Tsusaka, A.; Yukita, K.; Goto, Y.; Yokomizu, Y.; Tatewaki, K.; Iioka, D.; Shimizu, H.; Kanazawa, Y.; et al. Line-End Voltage and Voltage Profile along Power Distribution Line with Large-Power Photovoltaic Generation System. Int. J. Photoenergy 2019, 2019. [Google Scholar] [CrossRef]
  20. Iioka, D.; Miura, K.; Machida, M.; Kikuchi, S.; Imanaka, M.; Baba, J.; Takagi, M.; Asano, H. Hosting capacity of large scale PV power station in future distribution networks. In Proceedings of the 2017 IEEE Innovative Smart Grid Technologies-Asia (ISGT-Asia), Auckland, New Zealand, 4–7 December 2017. [Google Scholar] [CrossRef]
  21. Kikuchi, S.; Machida, M.; Tamura, J.; Imanaka, M.; Baba, J.; Iioka, D.; Miura, K.; Takagi, M.; Asano, H. Hosting capacity analysis of many distributed photovoltaic systems in future distribution networks. In Proceedings of the 2017 IEEE Innovative Smart Grid Technologies-Asia (ISGT-Asia), Auckland, New Zealand, 4–7 December 2017. [Google Scholar] [CrossRef]
  22. Takagi, M.; Bando, S.; Tagashira, N.; Nagata, Y.; Asano, H.; Ishihara, M.; Nogiwa, H.; Iioka, D.; Machida, M.; Kikuchi, S.; et al. Cost-effective analysis of countermeasures for solar photovoltaic systems in distribution networks. In Proceedings of the 2017 IEEE Innovative Smart Grid Technologies-Asia (ISGT-Asia), Auckland, New Zealand, 4–7 December 2017. [Google Scholar] [CrossRef]
Figure 1. Medium voltage (MV) distribution feeder that measured voltage reduction due to large reverse power flow: (a) Feeder A; (b) Feeder B; (c) Feeder C.
Energies 13 05430 g001
Figure 2. Measured voltage, active power, and reactive power in MV feeder A: (a) Voltage; (b) Active power; (c) Reactive power.
Energies 13 05430 g002
Figure 3. Measured voltage, active power, and reactive power in MV feeder B: (a) Voltage; (b) Active power; (c) Reactive power.
Energies 13 05430 g003
Figure 4. Measured voltage, active power, and reactive power in MV feeder C: (a) Voltage; (b) Active power; (c) Reactive power.
Energies 13 05430 g004
Figure 5. MV distribution system model that corresponds to the actual distribution feeder shown in Figure 1a.
Energies 13 05430 g005
Figure 6. LV distribution system model.
Energies 13 05430 g006
Figure 7. LV load model.
Energies 13 05430 g007
Figure 8. PV system output model.
Energies 13 05430 g008
Figure 9. Time variation in voltage at MV distribution system without PCS in the LV distribution system.
Energies 13 05430 g009
Figure 10. Time variation in voltage at MV distribution feeder with PCS for which the power factor is set to 1.0: (a) Case A1; (b) Case B1; (c) Case C1; (d) Case D1.
Energies 13 05430 g010aEnergies 13 05430 g010b
Figure 11. Voltage profile in MV distribution feeder (power factor is set to 1.0).
Energies 13 05430 g011
Figure 12. Time variation in voltage at MV distribution feeder with PCS for which the power factor is set to 0.95: (a) Case A2; (b) Case B2; (c) Case C2; (d) Case D2.
Energies 13 05430 g012aEnergies 13 05430 g012b
Figure 13. Voltage profile in MV distribution feeder (power factor is set to 0.95).
Energies 13 05430 g013
Figure 14. Maximum and minimum voltages of MV feeder as a function of capacity of PCS in the LV distribution system.
Energies 13 05430 g014
Figure 15. Another MV distribution system model that corresponds to the actual distribution feeder.
Energies 13 05430 g015
Figure 16. Voltage profile in another MV distribution feeder (power factor is set to 1.00).
Energies 13 05430 g016
Figure 17. Voltage profile in another MV distribution feeder (power factor is set to 0.95).
Energies 13 05430 g017
Figure 18. Maximum and minimum voltage of the LV distribution system connected to the MV distribution feeder as a function of capacity of PCS in the LV distribution system.
Energies 13 05430 g018
Table 1. Load capacity in low-voltage distribution system.
NodeLoad Capacity [kW]NodeLoad Capacity [kW]
513019224
6462295
719523341
84724138
992251
12922763
1311328117
141393056
151383125
161443226
1713370
Table 2. Impedance of LV distribution system model.
NodeNodeImpedance [Ω]
120.0152 + j0.0195
230.0179 + j0.0160
240.0179 + j0.0160
260.0285 + j0.0013
270.0285 + j0.0013
380.0285 + j0.0013
390.0285 + j0.0013
450.0460 + j0.0160
4100.0285 + j0.0013
4110.0285 + j0.0013
5120.0285 + j0.0013
5130.0285 + j0.0013
Table 3. Case of interconnections of PCS.
CaseNode
w/PV System
Total Capacity of PCS in A LV Distribution System Shown in Figure 6 [kW]Total Capacity of PCS in Distribution System Shown in Figure 5 [kW]Power Factor of PCS
A18, 1245731.00
A28, 1245730.95
B16, 8, 10, 1281 1471.00
B26, 8, 10, 1281 1470.95
C16, 8, 9, 10, 12, 13121 7201.00
C26, 8, 9, 10, 12, 13121 7200.95
D16, 7, 8, 9, 10, 11, 12, 13162 2931.00
D26, 7, 8, 9, 10, 11, 12, 13162 2930.95
Publisher’s Note: MDPI stays neutral with regard to jurisdictional claims in published maps and institutional affiliations.

