Article

CFD-DEM Simulation of Biomass Pyrolysis in Fluidized-Bed Reactor with a Multistep Kinetic Scheme

1
Division of Fluid Dynamics, Chalmers University of Technology, 41296 Göteborg, Sweden
2
Department of Engineering Mechanics, Zhejiang University, Hangzhou 310027, China
3
State Key Laboratory of Clean Energy Utilization, Zhejiang University, Hangzhou 310027, China
4
Department of Energy and Process Engineering, Norwegian University of Science and Technology, 7491 Trondheim, Norway
*
Author to whom correspondence should be addressed.
Energies 2020, 13(20), 5358; https://doi.org/10.3390/en13205358
Submission received: 16 September 2020 / Revised: 4 October 2020 / Accepted: 9 October 2020 / Published: 14 October 2020
(This article belongs to the Special Issue Thermochemical Conversion of Biomass and Waste)

Abstract

:
The pyrolysis of biomass in a fluidized-bed reactor is studied by a combination of a CFD-DEM algorithm and a multistep kinetic scheme, where fluid dynamics, heat and mass transfer, particle collisions, and the detailed thermochemical conversion of biomass are all resolved. The integrated method is validated by experimental results available in literature and a considerable improvement in predicting the pyrolysis product yields is obtained as compared to previous works using a two-fluid model, especially the relative error in the predicted tar yield is reduced by more than 50%. Furthermore, the evolution of light gas, char and tar, as well as the particle conversion, which cannot easily be measured in experiments, are also revealed. Based on the proposed model, the influences of pyrolysis temperature and biomass particle size on the pyrolysis behavior in a fluidized-bed reactor are comprehensively studied. Numerical results show that the new algorithm clearly captures the dependence of char yield on pyrolysis temperature and the influence of heating rate on light gas and tar yields, which is not possible in simulations based on a simplified global pyrolysis model. It is found that, as the temperature rises from 500 to 700 °C, the light gas yield increases from 17% to 25% and char yield decreases from 22% to 14%. In addition, within the tested range of particle sizes (<1 mm), the impact on pyrolysis products from particle size is relatively small compared with that of the operating temperature. The simulations demonstrate the ability of a combined Lagrangian description of biomass particles and a multistep kinetic scheme to improve the prediction accuracy of fluidized-bed pyrolysis.

Graphical Abstract

1. Introduction

The thermochemical conversion of biomass has become more and more important in the renewable energy industry in recent years, an industry which contributes above 10% of the total power generation nowadays in European countries [1]. The major advantage of biomass over coal lies in its CO2-neutral, renewable characteristics and large reservation around the world. Among various routes of biomass utilization, fluidized-bed pyrolysis is one of the most promising technologies to produce bio-oil and other high-quality fuels [2,3,4,5]. These fuels can be used for power generation or serve as an alternative to fossil fuels in the transportation sector. Recently, the conversion of biomass to valuable energetic products such as hydrogen is a good example [6,7]. Contemporary biomass conversion technology in fluidized-bed reactors also include oxy-combustion, chemical looping combustion, etc., [8,9,10], which could remarkably improve the conversion efficiency and reduce CO2 emissions that otherwise constitute a major cause of global warming in traditional coal combustion [11,12,13]. In addition, according to recent studies, by either torrefication or blending with coal, the energy conversion efficiency can reach a much higher value than in traditional methods because of the diverse components of biomass materials [14,15,16]. However, due to the inherent complexity of biomass pyrolysis, the application to large-scale fluidized-bed reactors still faces many challenges [17,18]. For example, tar removal and pollutant formation are some of the most serious issues, which both reduce the biomass conversion efficiency and also cause air pollution that affects human health and further influences global warming [19,20].
In the last few decades, many kinetic models have been developed to explore the mechanism of biomass pyrolysis [21,22]. The earliest global type pyrolysis models are still widely used until today due to their high computational efficiency [23], especially in the simulation of large-scale reactors [24,25,26]. However, these models are too rough to capture the variation of pyrolysis yields with the change of operating conditions. To solve this problem, Miller and Bellan proposed the so-called competitive mechanism [27], where the formation of light gas and char competes with that of tar by using different kinetic rates. This model is applicable for each component of biomass (cellulose, hemicellulose, and lignin) and allows for the variation of product with pyrolysis conditions. However, the model is only able to predict the general trends of pyrolysis yields under different temperatures, as detailed information for a specific species cannot be obtained. To get a more accurate prediction of pyrolysis yields, Niksa established bio-FLASHCHAIN pyrolysis model [28], where the thermal degradation of biomass is modeled as four basic reactions: bridge scission, spontaneous charring, bimolecular recombination, and char decomposition. The coefficients of species yield in this model can also be determined from experimental measurements.
During the thermochemical conversion of biomass, tar generation is one of the most challenging issues [29,30,31], which could cause serious technical problems in real applications such as degradation and blocking of reactors [32] and erosion of equipment [33]. Although a lot of efforts have been made, the mechanism of tar generation is still an open problem. Experimental works in literature have shown that tar contains a wide range of chemical species (C3H6O2, C6H5OH, C7H8…) and that these species vary a lot depending on the operating conditions and biomass types [34,35]. However, in theoretical studies, simplifications must be made to get a general understanding of the mechanism of tar generation. The multistep kinetic scheme developed by Ranzi’s group in recent years is one such mechanism [36,37]. The main idea of the multistep scheme is to model the pyrolysis of biomass with a series of parallel sub-mechanisms applied to cellulose, hemicellulose, and lignin, where light gas and tar are lumped to twenty representative species. The medium complexity and the detailed species yield information of the model make it very popular in the analysis of biomass pyrolysis. For example, Gentile et al. [38] studied the pyrolysis behavior of a single biomass particle by using the multistep kinetic model. Good agreement between simulation and experimental data was obtained for both light gas and tar species. In addition, the work in our group also demonstrates the universality of the multistep kinetic model in predicting the unsynchronized evolution for different light gas and tar species [39]. Due to the good performance of the multistep kinetic model, researchers have recently begun to use it in the study of reactor scale biomass pyrolysis. Sommariva et al. [40] revealed the important influence of inlet temperature on the start-up performance of a fixed-bed reactor from numerical simulations with the multistep kinetic model. Peng et al. [41] used the multistep model to investigate the influence of operating temperature and the mass fraction of basic components on fast pyrolysis in fluidized-bed reactors. They found that the pyrolysis reaction rate increased remarkably when the operating temperature exceeds 400 °C. In addition, the tar yield reached a maximum of 70% at 500 °C. Shi et al. [42] also used the multistep kinetic model to investigate the pyrolysis yields in a screw reactor. It was observed that both reactor temperature and char yield showed a reasonable agreement with the experimental measurement. Ranganathan and Gu [43] simulated fluidized-bed pyrolysis with different kinetic schemes and found that the multistep kinetic model performs much better than other kinetic models.
In addition to the accuracy of the adopted pyrolysis model, the multiphase flow algorithm is another important issue in reactor scale pyrolysis simulations. As has been pointed out by Ranzi et al. [44], biomass pyrolysis is a multi-scale problem, where the interphase transport phenomena both at particle scale and reactor scale should be carefully considered. In general, there are two types of multiphase flow algorithms to deal with interphase exchange: the Eulerian–Eulerian method and the Eulerian–Lagrangian method [45]. The Eulerian–Eulerian method is especially suitable for large scale simulations with huge numbers of particles due to a simplified modeling of the particle collisions and the lack of detailed information about the environment surrounding the individual particles [46]. Instead of tracking each particle in the reactor, a pseudo-stress model is generally used to simulate particle interactions which remarkably reduces the computational cost. However, due to the averaging over many particles, the heat/mass transfer between the gas phase and the particle phase can only be approximately accounted for. The Eulerian–Lagrangian method differs from the Eulerian–Eulerian approach in that it models particle–particle interaction by using Newton’s second law of motion, thus allowing for a more accurate consideration of interphase exchange [47,48]. For example, it is straightforward to take the dynamic effects of particle shrinkage and varying particle sizes into account, which is much more difficult in Eulerian–Eulerian algorithms [49,50,51]. Existing studies also illustrate that the Eulerian–Lagrangian method predicts more realistic fluidization phenomena such as segregation rate and bubble structures [52,53]. However, most of the above-mentioned simulations of fluidized-bed pyrolysis are based on the Eulerian–Eulerian method. Therefore, the influence of the accuracy of the interphase exchange on the prediction of the chemical kinetics in these works is still not well known.
From the above-mentioned works, one can see that the existing numerical studies for biomass pyrolysis in fluidized-bed reactors are mainly based on Eulerian–Eulerian and Eulerian–Lagrangian multiphase flow models. The Eulerian–Lagrangian model is usually more accurate than a Eulerian–Eulerian model, and it is also more time-consuming. Therefore, one-step pyrolysis models such as global reaction mechanisms are usually used for simplicity and to save computational time. However, the simplified one-step pyrolysis model is incapable of describing many of the intricate details of the biomass conversion process, and is therefore far less accurate in the study of some of the key issues related to tar evolution and pollutant formation (e.g., NOx and SOx) [14,20]. On the other hand, the studies with a detailed pyrolysis model are mainly based on Eulerian–Eulerian models. The lack of an assessment of a combined Eulerian–Lagrangian multiphase flow model and a detail pyrolysis model contributes to the research gap and thus motivates the current work.
To obtain a comprehensive understanding of biomass pyrolysis in fluidized-bed reactors, this paper is aimed at developing a detailed algorithm based on the combination of the Eulerian–Lagrangian approach denoted CFD-DEM (discrete element method) and the multistep pyrolysis kinetics, where both the evolution of syngas and tar species as well as the interphase heat/mass transfer can be accurately considered. The performance of the new algorithm will be validated and compared with existing experimental results and numerical predictions from a Eulerian–Eulerian multiphase flow model with a multistep pyrolysis scheme. Fluidization characteristics, such as the particle temperature distribution, which are not easily obtained in experiments will also be discussed. The current work could improve the mechanism exploration of biomass pyrolysis in fluidized-bed reactors and also lay a foundation for future studies of more complex issues such as tar removal and pollutant formation. The paper is organized as follows: Section 2 presents the mathematic model. The implementation of the algorithm is presented in Section 3. After that, model validation and discussions are carried out in Section 4. Finally, conclusions are drawn in the last section.

2. Computational Model

Biomass pyrolysis in a fluidized-bed reactor includes several simultaneous physical and chemical conversion processes. The final pyrolysis products depend to a large extent on the heating process of each biomass particle. To capture the detailed conversion behavior of the biomass particles, the current pyrolysis algorithm is established based on a CFD-DEM model developed in our previous works [54,55,56]. In this section, the governing equations of gas and particle phases, the interphase heat/mass exchange and the multistep pyrolysis kinetics are briefly presented. The gas phase governing equations which include the mass, momentum, energy, and species transport equations as well as the k-ε turbulence model, are listed in Table 1 [55]. Note that in the energy equation, P-1 model is applied to compute the radiation term [57]. For the k-ε turbulence model, the values of the constant parameters are set as follows: Cε1 = 1.44, Cε2 = 1.92, Cμ = 0.09, σk = 1.0 and σε = 1.3. Further detailed information about the gas phase evolving equations can be found in our earlier publication [55].
For both particle phases (biomass and bed material), each particle is treated as a discrete entity. Table 2 presents the particle phase governing equations [55], which also include mass, momentum and energy evolving equations as well as the Gidaspow drag correlation used to calculate interphase momentum exchange [58]. In the energy equation, it is assumed that the temperature throughout the particle radius is uniform during the heating and conversion process because of the small particle size. Moreover, every biomass particle undergoes a continuous shrinkage with a constant particle density. During fluidization, both the collisions between particles (e.g., biomass and sand particles) and the collisions between particles and reactor wall are simulated by a soft-sphere model [59].
For modeling biomass pyrolysis, a multistep kinetic scheme is implemented in the CFD-DEM model. The applicability of the multistep kinetic model has been demonstrated in our previous work [39], in which the pyrolysis of a single biomass particle was investigated and a good agreement between the simulated yields of char, tar, and light gas with the experimental measurements was achieved. However, it was also found that there is still a small amount of intermediate species such as G{CO} left in the particle after pyrolysis. Note that these intermediate virtual species only influence the release rate of the corresponding gas species without changing the total pyrolysis yield and without taking part in the subsequent char reactions. Therefore, in the present paper, the activation energies for the thermal decomposition of the intermediate species G{H2}, G{CO}, G{CH4}, G{COH2}, G{C2H4} and G{CH3OH} (please see ref [37]) are slightly changed to 45, 40, 40, 40, 50 and 40 kcal/mol, respectively.

3. Numerical Algorithm

The integrated algorithm has been implemented into the open source CFD toolbox OpenFOAM [60], and the final flow chart is shown in Figure 1. The particle motion is solved by a first-order Euler time integration scheme. For the gas phase governing equations, the standard finite-volume method in OpenFOAM is utilized for spatial discretization and an Euler scheme is used for time discretization. For all the simulations, a small time step of 1.0 × 10⁻⁵ s is adopted to ensure temporal convergence. During each time step, the particle mass loss is calculated by the moisture evaporation and the multistep pyrolysis submodels. Meanwhile, the particle properties such as temperature, diameter, heat capacity, and components are correspondingly updated. The interphase coupling is resolved by the various interphase source terms (i.e., Sp,m, Sp,mom, Sp,h, and Sp,Yi). In addition, a parallelization technique with Massage Passing Interface (MPI) is also used to accelerate the simulation.

4. Results and Discussions

In this section, the established pyrolysis model is first validated with experimental data reported in literature. The product distributions of both light gas and tar species that are not easily obtained in the experiment are also analyzed. Then, the influence of pyrolysis temperature and biomass particle size on the pyrolysis behavior is systematically explored.

4.1. Validation

In our previous works, the CFD-DEM algorithm has already been systematically validated [54,55,56]. Good performance was achieved in the parameter sensitivity analysis for a series of operation conditions such as temperature, gasification agent, and biomass particle size. In addition, in a different work, the multistep pyrolysis model has also been demonstrated to have a high accuracy in predicting pyrolysis yields of tar, char, and light gases [39]. Moreover, there are many other works that have shown the validity of the multistep kinetic scheme in fluidized bed pyrolysis simulations [41,43]. For simplicity, the model validation attended here only concerns the integrated CFD-DEM model with the multistep pyrolysis model. To this end, a biomass fluidized-bed pyrolysis experiment carried out by Kantarelis et al. [61] is adopted for validation. The numerical simulation for this experiment by the same research group is used for additional comparisons with the current work. Figure 2 shows a schematic diagram of the reactor. The fluidizing gas is nitrogen with a temperature of 463 °C. The pyrolysis products including light gases (H2, CH4, CO, CO2, and C2H4) and tar leave the top outlet boundary and are collected for analysis. Initially, the bed material consists of sand particles with a total number of 12,000. Note that in order to reduce the computational cost, the thickness of the bed is set equal to the particle diameter which means that the bed has only one layer of particles. Moreover, due to the complexity of the screw feeder, the biomass feeding position is adjusted from the sidewall to the reactor centerline with the same feeding height (i.e., 57.5 mm) as that in the experiment. Before introducing the biomass, the simulation is running for one second with only sand particles. Afterwards, biomass particles with a diameter of 850 μm are continuously injected and the simulation is run for 10 s. More details of the simulation setup are presented in Table 3 [61,62] and the biomass components are provided in Table 4 [39,61].
Figure 3 presents the comparison of the predicted pyrolysis products with the experimental data from Kantarelis et al. [61] as well as the Eulerian–Eulerian simulation results of Mellin et al. [62]. Note that the char yield contains carbon, ash, and unconverted biomass. As shown in Figure 3a, the current pyrolysis model gives a better prediction of steam, tar, and char mass fractions than that of Mellin et al., while the light gas yield is also underestimated due to the overpredicted char yield, in which there is still a little amount of intermediate gas species left. Compared with the Eulerian–Eulerian method, the predicted steam yield of the Eulerian–Lagrangian method increases from 11% to 14%, while the difference of tar yield with that of experiment is decreased by more than 50%. Figure 3b reveals that our model performs better in the concentrations of four light gas species (i.e., H2, CO, CO2 and C2H4), although the hydrogen concentration is still overpredicted. In particular, the predicted CO and C2H4 yields in this work are improved significantly, with a reduction in the relative error to the experimental data to approximately 30% compared to the Eulerian–Eulerian method. The above comparison indicates that the multistep kinetic model together with the Lagrangian description of the biomass particles improves the prediction of pyrolysis yields. In addition to the comparison, Figure 3c also provides the mole fractions of tar species obtained from the simulations. It is seen that formaldehyde (CH2O), methanol (CH3OH), HAA (C2H4O2), and acetone (C2H5CHO) are the most abundant products among the light tar species, while xylose monomer (C5H8O4), HMFU (C6H6O3), and LVG (C6H10O5) account for the largest portion among the heavy tar species.

4.2. Pyrolysis Phenomena

The previous validation demonstrates that the established algorithm improves the overall prediction of pyrolysis products in biomass fluidized-bed pyrolysis. In this subsection, pyrolysis phenomena of the validation case are further analyzed to depict the instantaneous behavior. Figure 4 shows the particle distributions at different time instants near the end of the simulation. The formation of bubble structures during fluidization is clearly observed. As the bubbles rise, bed materials experience a strong up-and-down movement resulting in an efficient mixing of biomass and sand particles. Above the bed, some biomass particles are more easily thrown into the freeboard due to their lower particle density as compared with the sand particles. After the breakdown of bubble structures, the particles fall back into the bed. When the biomass particles are heated up, the moisture and volatile contents are released into the reactor, which further promotes the local gas phase mixing and contributes to the tendency of the biomass particles to “float” to the surface.
Figure 5 presents the corresponding temperature distributions. At the bottom of the reactor, the temperature is high because the introduced fluidizing gas has a high temperature. In the bed section, the temperature is comparably lower because of the cooling effect of the injected biomass particles. Downstream in the freeboard section, the temperature gradually reaches the operating temperature (i.e., 500 °C) due to the dilution of particles. Generally, the bed temperature decreases from about 470 °C at the bottom to 410 °C towards the bed surface and then increases gradually to 500 °C in the freeboard section. Consequently, the heating process of the biomass particles is actually rather complex, as the particle may move repeatedly through the different regions during fluidization. Moreover, Figure 6 and Figure 7 depict CO and LVG (C6H10O5) mass fraction distributions in the reactor, respectively. In the bed section, it is observed that both light gas (CO) and tar species (C6H10O5) have a higher concentration near the wall and a lower one in the middle area of the reactor. This effect arises due to the longer retention time of the biomass particles on their way downwards in the near-wall regions as compared to their faster rise velocities in the core where they are lifted by the bubbles. Downstream in the freeboard section, the concentrations of both species become relatively uniform.

4.3. Influence of Pyrolysis Temperature

Pyrolysis temperature is one of the most important operating parameters during biomass fluidized-bed pyrolysis [63]. In this subsection, three temperatures, i.e., 500, 600 and 700 °C, which cover the typical temperature range encountered in fluidized-bed pyrolysis [64], are tested while the other operating parameters remain the same as those of the validation case except for the inlet gas temperature which is set to the pyrolysis temperature. Moreover, the case of 500 °C is considered as the base case. Figure 8 compares the pyrolysis products for the three different temperatures. As shown in Figure 8a, increasing the pyrolysis temperature raises the light gas production from 17% to 25% and decreases char mass fraction from 22% to 14%, while it slightly affects the steam and primary tar concentrations, in which the steam yield shows an increasing trend and the primary tar yield shows a decreasing trend. This demonstrates that the multistep pyrolysis model captures the dependence of the char yield on the pyrolysis temperature very well, unlike a one-step global reaction mechanism where the char yield has to be pre-assumed before the simulation [65]. From Figure 8b, it is found that the concentrations of H2, CH4, CO, and CO2 are moderately reduced when the pyrolysis temperature increases from 500 to 600 °C, while the C2H4 volume fraction increases from 0.06 to 0.1. When the temperature further increases to 700 °C, only a small variation is observed for all the light gas species. From Figure 8c, when the pyrolysis temperature rises from 500 to 700 °C, the concentrations of most low-molecular-weight tar species (C1–C3) show an increasing trend while most high-molecular-weight tar species (e.g., C5H8O4, C6H10O5, C7H8O, and C11H12O4) exhibit a decreasing trend.
Figure 9 presents the transient production rates of H2, CH4, CO, and CO2 for different pyrolysis temperatures. Increasing the pyrolysis temperature advances the starting point of light gas releases from about 2 s to 1 s. Moreover, for all light gas species, the average steady state production rate shows an apparent increase when the pyrolysis temperature enhances from 500 to 600 °C. Taking CH4 for example, the average production rate is promoted from 0.12 mg/s at 500 °C to 0.17 mg/s at 600 °C. However, when the pyrolysis temperature further increases to 700 °C, the average production rate only exhibits a slight increase although the amplitude of the fluctuations becomes larger. In addition to the gas products, Figure 10 compares the instantaneous biomass particle distribution at t = 10 s together with the temperature contour for the three temperatures. It is shown that most of the biomass particles undergo a fast heating process and reach the operation temperature very quickly. In addition, the particles lose mass faster at higher temperature and some of them are blown to the top area of the reactor at 700 °C (Figure 10c). Figure 11 shows the average thermochemical conversion processes of all biomass particles for the three different pyrolysis temperatures. The temperature curves in Figure 11a illustrates that the average heating process inside the biomass particles is very sensitive to the change in pyrolysis temperature. At 500 °C, a fast temperature rise occurs before 0.8 s, to be followed by a significant slowdown in the temperature increase. At 600 °C, after the first stage of rapid temperature increase, a second heating stage can be observed from 0.7 s to 1.8 s. Finally, a third stage characterized by a slower temperature rise is seen. At 700 °C, a small plateau period is observed in the heating process before 0.7 s, after which the temperature rise is accelerated again and lasts until 1.1 s.

4.4. Influence of Particle Size

The CFD-DEM model is a good tool to study the influence of particle size on pyrolysis behavior, which is not as easily accounted for by using a two-fluid model [66,67]. In this subsection, pyrolysis simulations with biomass particle size ranging from 450 to 850 μm are compared, while the size of sand particles is kept at 850 μm. The other operating conditions such as pyrolysis temperature and biomass material are the same with that of the base case. Figure 12 shows the pyrolysis product distributions. It is found that the char yield is slightly promoted with increasing biomass particle size, which results in a reduction in light gas and tar yields. This effect is likely caused by a lower heating rate inside the biomass particles, which influences the final pyrolysis products. Therefore, it is demonstrated that the multistep model can also capture the dependence of pyrolysis yields on the heating rate, unlike a traditional one-step global reaction mechanism [68]. In addition, the relative productions of the light gases are almost the same for the different particle sizes. In addition, the tar yield in Figure 12c illustrates that the relative production of light tar species (C1–C3) is similar for the three cases, except that CH2O and CH3OH productions slightly decrease with increasing particle size. Among heavy tar species, the C5H8O4 and C6H10O5 production exhibit a small increase for larger biomass particles. These changes are most likely caused by the variation in pyrolysis reactions in the multistep kinetic model due to the different heating processes. Note that there are basically two parallel reactions with different activation energies and pre-exponential factors for each components of the biomass [37]. As a result, the relative reaction rate depends strongly on the heating rate.
Figure 13 presents the production rate of four light gas species. It is clearly shown that, the volatile release for smaller biomass particles reaches steady state much earlier due to a faster heating process inside the particles. At the steady state, the release rates for different sized biomass particles are close to each other due to the same fuel feeding rate. Finally, Figure 14 presents the biomass particle distributions for the three cases. With reducing particle size, the number of biomass particles increases and the particles become lighter. As a result, some of the initially 450 μm sized particles are blown into the freeboard region after reaching the operation temperature. For a particle diameter larger than 650 μm, the biomass particles undergo a slower heating process and most of them stay inside the sand bed until the end of pyrolysis. Figure 15 shows a detailed comparison of the heating process and the mass loss history for these three cases. It is observed that reducing the particle size remarkably accelerates the heating and mass loss rates of the particle. However, the final conversion stays at the same level of about 0.84 for all particle sizes.

5. Conclusions

A comprehensive simulation algorithm for biomass pyrolysis in a fluidized-bed reactor is established based on a previously well-validated CFD-DEM model developed in our group. With the new algorithm, the influence of variations in the operating conditions, such as pyrolysis temperature and biomass particle size, is studied systematically. The main conclusions of the paper are as follows:
(1)
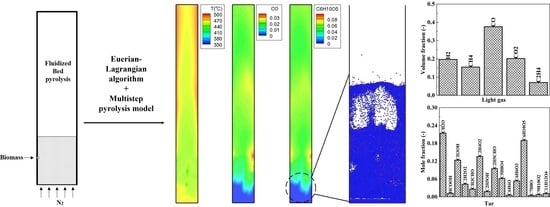
The novelty of the integrated algorithm lies in the utilization of a multistep kinetic scheme for the detailed simulation of particle pyrolysis, thus allowing for a practical consideration of product variation with the change of operating conditions. The current work is the first step for future studies of more complex issues such as tar removal and pollutant reduction.
(2)
The integrated CFD-DEM and multistep pyrolysis model is validated with experimental data and is also compared with the predictions of a two-fluid model. An overall improvement is found in light gas, tar, and char yields, among which, the relative error of the predicted tar yield is reduced by more than 50%, while that of the CO and C2H4 yields is reduced by approximately 30%. In addition, fluidization behaviors, such as the biomass particle distribution and tar evolution, which cannot easily observed in experiments, are also obtained.
(3)
Under the specific pyrolysis conditions at hand, light gas yield increases considerably from 17% to 25% when the pyrolysis temperature rises from 500 to 700 °C. In addition, the primary tar yield stays around 46% and only shows a slight influence by the pyrolysis temperature. The variation in biomass particle size is found to have a significant impact on particle flow pattern, while pyrolysis products only show small variations within the tested range of particle diameter (<1 mm).

Author Contributions

Conceptualization, T.C., X.K. and H.S.; methodology, T.C. and X.K.; software, T.C. and H.S.; validation, T.C., X.K. and H.S.; formal analysis, X.K. and H.S.; investigation, J.L.; data curation, X.K.; writing—original draft preparation, T.C.; writing—review and editing, X.K. and H.S.; visualization, X.K.; supervision, H.S.; project administration, H.S. All authors have read and agreed to the published version of the manuscript.

Funding

This work is financially supported by the National Natural Science Foundation of China (project numbers 51876191 and 11632016), the Swedish Energy Agency (project number 46439-1), the Swedish Centre for Biomass Gasification (SFC, project number P34721-3), and the Centre for Combustion Science and Technology (CECOST).

Conflicts of Interest

The authors declare no conflict of interest. The funders had no role in the design of the study; in the collection, analyses, or interpretation of data; in the writing of the manuscript, or in the decision to publish the results.

References

  1. Scarlat, N.; Dallemand, J.; Monforti-Ferrario, F.; Banja, M.; Motola, V. Renewable energy policy framework and bioenergy contribution in the European Union—An overview from national renewable energy action plans and progress reports. Renew. Sustain. Energy Rev. 2015, 51, 969–985. [Google Scholar] [CrossRef]
  2. Polin, J.P.; Peterson, C.A.; Whitmer, L.E.; Smith, R.G.; Brown, R.G. Process intensification of biomass fast pyrolysis through autothermal operation of a fluidized-bed reactor. Appl. Energy 2019, 249, 276–285. [Google Scholar] [CrossRef]
  3. Cai, W.; Liu, R.; He, Y.; Chai, M.; Cai, J. Bio-oil production from fast pyrolysis of rice husk in a commercial-scale plant with a downdraft circulating fluidized-bed reactor. Fuel Process. Technol. 2018, 171, 308–317. [Google Scholar] [CrossRef]
  4. Blanco, A.; Chejne, F. Modeling and simulation of biomass fast pyrolysis in a fluidized-bed reactor. J. Anal. Appl. Pyrolysis 2016, 118, 105–114. [Google Scholar] [CrossRef]
  5. Molino, A.; Lovane, P.; Donatelli, A.; Braccio, G.; Chianese, S.; Musmarra, D. Steam gasification of resuse-derived fuel in a rotary kiln pilot plant: Experimental tests. Chem. Eng. Trans. 2013, 32, 337–342. [Google Scholar]
  6. Victor, B.A.; Abdullah, T.A.R.B.T.; Alsaffar, M.A.; Mustapa, S.I.; Salleh, S.F. Recent advances in renewable hydrogen production by thermo-catalytic conversion of biomass-derived glycerol: Overview of prospects and challenges. Int. J. Hydrogen Energy 2020, 45, 18160–18185. [Google Scholar]
  7. Mudhoo, A.; Torres-Mayanga, P.C.; Forster-Carneiro, T.; Sivagurunathan, P.; Kumar, G.; Komilis, D.; Sánchez, A. A review of research trends in the enhancement of biomass-to-hydrogen conversion. Waste Manag. 2018, 79, 580–594. [Google Scholar] [CrossRef] [Green Version]
  8. Wei, X.; Manovic, V.; Hanak, D.P. Techno-economic assessment of coal- or biomass-fired oxy-combustion power plants with supercritical carbon dioxide cycle. Energy Convers. Manag. 2020, 221, 113143. [Google Scholar] [CrossRef]
  9. Shi, Y.; Liu, Q.; Shao, Y.; Zhong, W. Energy and exergy analysis of oxy-fuel combustion based on circulating fluidized bed power plant firing coal, lignite and biomass. Fuel 2020, 269, 117424. [Google Scholar] [CrossRef]
  10. Zhang, Y.; Chao, Z.; Jakobsen, H.A. Modeling and simulation of chemical looping combustion process in a double loop circulating fluidized reactor. Chem. Eng. J. 2017, 320, 271–282. [Google Scholar] [CrossRef] [Green Version]
  11. Zhang, Y.; Fang, Y.; Jin, B.; Zhang, Y.; Zhou, C.; Sher, F. Effect of slot wall jet on combustion process in a 660MW opposed wall fired pulverized coal Boiler. Int. J. Chem. React. Eng. 2019, 17. [Google Scholar] [CrossRef]
  12. Pérez, S.; Del Molino, E.D.; Barrio, V.L. Modeling and testing of a milli-structured reactor for carbon dioxide methanation. Int. J. Chem. React. Eng. 2019, 20180238. [Google Scholar] [CrossRef]
  13. Sher, F.; Iqbal, S.Z.; Albazzaz, S.; Ali, U.; Mortari, D.A.; Rashid, T. Development of biomass derived highly porous fast adsorbents for post-combustion CO2 capture. Fuel 2020, 282, 118506. [Google Scholar] [CrossRef]
  14. Sher, F.; Yaqoob, A.; Saeed, F.; Zhang, S.; Jahan, Z.; Klemeš, J.J. Torrefied biomass fuels as a renewable alternative to coal in co-firing for power generation. Energy 2020, 209, 118444. [Google Scholar] [CrossRef]
  15. Mallick, D.; Mahanta, P.; Moholkar, V.S. Co-gasification of coal and biomass blends: Chemistry and engineering. Fuel 2017, 204, 106–128. [Google Scholar] [CrossRef]
  16. Sher, F.; Iqbal, S.Z.; Liu, H.; Imran, M.; Snape, C.E. Thermal and kinetic analysis of diverse biomass fuels under different reaction environment: A way forward to renewable energy sources. Energy Convers. Manag. 2020, 203, 112266. [Google Scholar] [CrossRef]
  17. Seddighi, S.; Clough, P.T.; Anthony, E.J.; Hughes, R.W.; Lu, P. Scale-up challenges and opportunities for carbon capture by oxy-fuel circulating fluidized-beds. Appl. Energy 2018, 232, 527–542. [Google Scholar] [CrossRef]
  18. Dingh, R.I.; Kumar, R. Current status and experimental investigation of oxy-fired fluidized-bed. Renew. Sustain. Energy Rev. 2016, 61, 398–420. [Google Scholar]
  19. Hai, I.U.; Sher, F.; Zarren, G.; Liu, H. Experimental investigation of tar arresting techniques and their evaluation for product syngas cleaning from bubbling fluidized bed gasifier. J. Clean. Prod. 2019, 240, 118239. [Google Scholar] [CrossRef]
  20. Williams, A.; Jones, J.M.; Ma, L.; Pourkashanian, M. Pollutants from the combustion of solid biomass fuels. Prog. Energy Combust. Sci. 2012, 38, 113–137. [Google Scholar] [CrossRef]
  21. Wang, S.; Dai, G.; Yang, H.; Luo, Z. Lignocellulosic biomass pyrolysis mechanism: A state-of-the-art review. Prog. Energy Combust. Sci. 2017, 62, 33–86. [Google Scholar] [CrossRef]
  22. Hameed, S.; Sharma, A.; Pareek, V.; Wu, H.; Yu, Y. A review on biomass pyrolysis models: Kinetic, network and mechanistic models. Biomass Bioenergy 2019, 123, 104–122. [Google Scholar] [CrossRef]
  23. Prakash, N.; Karunanithi, T. Kinetic modeling in biomass pyrolysis—A review. J. Appl. Sci. Res. 2008, 4, 1627–1636. [Google Scholar]
  24. Gerber, S.; Behrendt, F.; Oevermann, M. An Eulerian modeling approach of wood gasification in a bubbling fluidized-bed reactor using char as bed material. Fuel 2010, 89, 2903–2917. [Google Scholar] [CrossRef]
  25. Aghaalikhani, A.; Schmid, J.C.; Borello, D.; Fuchs, J.; Benedikt, F.; Hofbauer, H.; Rispoli, F.; Henriksen, U.B.; Sárossy, Z.; Cedola, L. Detailed modeling of biomass steam gasification in a dual fluidized-bed gasifier with temperature variation. Renew. Energy 2019, 143, 703–718. [Google Scholar] [CrossRef]
  26. Wang, S.; Luo, K.; Hu, C.; Sun, L.; Fan, J. Impact of operating parameters on biomass gasification in a fluidized-bed reactor: An Eulerian-Lagrangian approach. Powder Technol. 2018, 333, 304–316. [Google Scholar] [CrossRef]
  27. Miller, R.S.; Bellan, J. A generalized biomass pyrolysis model based on superimposed cellulose, hemicellulose and lignin kinetics. Combust. Sci. Technol. 1997, 126, 97–137. [Google Scholar] [CrossRef]
  28. Niksa, S. Predicting the rapid devolatilization of diverse forms of biomass with bio-flashchain. Proc. Combust. Inst. 2000, 28, 2727–2733. [Google Scholar] [CrossRef]
  29. Ren, J.; Liu, Y.; Zhao, X.; Cao, J. Biomass thermochemical conversion: A review on tar elimination from biomass catalytic gasification. J. Energy Inst. 2020, 93, 1083–1098. [Google Scholar] [CrossRef]
  30. Thangalazhy-Gopakumar, S.; Adhikari, S.; Gupta, R.B.; Fernando, S.D. Influence of pyrolysis operating conditions on bio-oil components: A microscale study in a pyroprobe. Energy Fuels 2011, 25, 1191–1199. [Google Scholar] [CrossRef]
  31. Papari, S.; Hawboldt, K. A review on the pyrolysis of woody biomass to bio-oil: Focus on kinetic models. Renew. Sustain. Energy Rev. 2015, 52, 1580–1595. [Google Scholar] [CrossRef]
  32. Islam, M.W. A review of dolomite catalyst for biomass gasification tar removal. Fuel 2020, 267, 117095. [Google Scholar] [CrossRef]
  33. Sansaniwal, S.K.; Rosen, M.A.; Tyagi, S.K. Global challenges in the sustainable development of biomass gasification: An overview. Renew. Sustain. Energy Rev. 2017, 80, 23–43. [Google Scholar] [CrossRef]
  34. Devi, L.; Ptasinski, K.J.; Janssen, F.J.J.G. A review of the primary measures for tar elimination in biomass gasification processes. Biomass Bioenergy 2003, 24, 125–140. [Google Scholar] [CrossRef]
  35. Cheng, L.; Wu, Z.; Zhang, Z.; Guo, C.; Ellis, N.; Bi, X. Tar elimination from biomass gasification syngas with bauxite residue derived catalyst and gasification char. Appl. Energy 2020, 258, 114088. [Google Scholar] [CrossRef]
  36. Ranzi, E.; Cuoci, A.; Faravelli, T.; Frassoldati, A.; Migliavacca, G.; Pierucci, S.; Sommariva, S. Chemical kinetics of biomass pyrolysis. Energy Fuels 2008, 22, 4292–4300. [Google Scholar] [CrossRef]
  37. Debiagi, P.E.A.; Pecchi, C.; Gentile, G.; Frassoldati, A.; Cuoci, A.; Faravelli, T.; Ranzi, E. Extractives extend the applicability of multistep kinetic scheme of biomass pyrolysis. Energy Fuels 2015, 29, 6544–6555. [Google Scholar] [CrossRef]
  38. Gentile, G.; Debiagi, P.E.A.; Cuoci, A.; Frassoldati, A.; Ranzi, E.; Faravelli, T. A computational framework for the pyrolysis of anisotropic biomass particles. Chem. Eng. J. 2017, 321, 458–473. [Google Scholar] [CrossRef]
  39. Chen, T.; Ku, X.; Lin, J.; Ström, H. Pyrolysis simulation of thermally thick biomass particles based on a multistep kinetic scheme. Energy Fuels 2020, 34, 1940–1957. [Google Scholar] [CrossRef]
  40. Sommariva, S.; Grana, R.; Maffei, T.; Pierucci, S.; Ranzi, E. A kinetic approach to the mathematical model of fixed bed gasifiers. Comput. Chem. Eng. 2011, 35, 928–935. [Google Scholar] [CrossRef]
  41. Peng, J.; Eri, Q.; Zhao, X. Detailed simulations of fast pyrolysis of biomass in a fluidized-bed reactor. J. Renew. Sustain. Energy 2018, 10, 013104. [Google Scholar] [CrossRef] [Green Version]
  42. Shi, X.; Ronsse, F.; Nachenius, R.; Pieters, J.G. 3D Eulerian-Eulerian modeling of a screw reactor for biomass thermochemical conversion. Part 2: Slow pyrolysis for char production. Renew. Energy 2019, 143, 1477–1487. [Google Scholar] [CrossRef]
  43. Ranganathan, P.; Gu, S. Computational fluid dynamics modeling of biomass fast pyrolysis in fluidized-bed reactors, focusing different kinetic schemes. Bioresour. Technol. 2016, 213, 333–341. [Google Scholar] [CrossRef] [PubMed] [Green Version]
  44. Ranzi, E.; Corbetta, M.; Manenti, F.; Pierucci, S. Kinetic modeling of the thermal degradation and combustion of biomass. Chem. Eng. Sci. 2014, 110, 2–12. [Google Scholar] [CrossRef]
  45. Xiong, Q.; Yang, Y.; Xu, F.; Pan, Y.; Zhang, J.; Hong, K.; Lorenzini, G.; Wang, S. Overview of computational fluid dynamics simulation of reactor-scale biomass pyrolysis. ACS Sustain. Chem. Eng. 2017, 5, 2783–2798. [Google Scholar] [CrossRef]
  46. Liu, H.; Elkamel, A.; Lohi, A.; Biglari, M. Computational fluid dynamics modeling of biomass gasification in circulating fluidized-bed reactor using the Eulerian-Eulerian approach. Ind. Eng. Chem. Res. 2013, 52, 18162–18174. [Google Scholar] [CrossRef]
  47. Gerber, S.; Oevermann, M. A two dimensional Eulerian-Lagrangian model of wood gasification in a charcoal bed—Part I: Model description and base scenario. Fuel 2014, 115, 385–400. [Google Scholar] [CrossRef]
  48. Solar, J.; de Marco, I.; Caballero, B.M.; Lopez-Urionabarrenechea, A.; Rodriguez, N.; Agirre, I.; Adrados, A. Influence of temperature and residence time in the pyrolysis of woody biomass waste in a continuous screw reactor. Biomass Bioenergy 2016, 95, 416–423. [Google Scholar] [CrossRef]
  49. Hu, C.; Luo, K.; Wang, S.; Sun, L.; Fan, J. Computational fluid dynamics/discrete element method investigation on the biomass fast pyrolysis: The influences of shrinkage patterns and operating parameters. Ind. Eng. Chem. Res. 2019, 58, 1404–1416. [Google Scholar] [CrossRef]
  50. Mehrabian, R.; Scharler, R.; Obernberger, I. Effects of pyrolysis conditions on the heating rate in biomass particles and applicability of TGA kinetic parameters in particle thermal conversion modeling. Fuel 2012, 93, 567–575. [Google Scholar] [CrossRef]
  51. Zhou, T.; Yang, S.; Wei, Y.; Hu, J.; Wang, H. Impact of wide particle size distribution on the gasification performance of biomass in a bubbling fluidized bed gasifier. Renew. Energy 2020, 148, 534–547. [Google Scholar] [CrossRef]
  52. Goldschmidt, M.; Beetstra, R.; Kuipers, J. Hydrodynamic modelling of dense gas-fluidised beds: Comparison and validation of 3D discrete particle and continuum models. Powder Technol. 2004, 142, 23–47. [Google Scholar] [CrossRef]
  53. Van Sint Annaland, M.; Bokkers, G.A.; Goldschmidt, M.; Olaofe, O.O.; van der Hoef, M.A.; Kuipers, J. Development of a multi-fluid model for poly-disperse dense gas-solid fluidized-beds, part II: Segregation in binary particle mixtures. Chem. Eng. Sci. 2009, 64, 4237–4246. [Google Scholar] [CrossRef]
  54. Ku, X.; Li, T.; Løvås, T. Eulerian-Lagrangian simulation of biomass gasification behavior in a high-temperature entrained-flow reactor. Energy Fuels 2014, 28, 5184–5196. [Google Scholar] [CrossRef] [Green Version]
  55. Ku, X.; Li, T.; Løvås, T. CFD-DEM simulation of biomass gasification with steam in a fluidized-bed reactor. Chem. Eng. Sci. 2015, 122, 270–283. [Google Scholar] [CrossRef] [Green Version]
  56. Ku, X.; Jin, H.; Lin, J. Comparison of gasification performances between raw and torrefied biomasses in an air-blown fluidized-bed gasifier. Chem. Eng. Sci. 2017, 168, 235–249. [Google Scholar] [CrossRef]
  57. Backreedy, R.I.; Fletcher, L.M.; Ma, L.; Pourkashanian, M.; Williams, A. Modelling pulverised coal combustion using a detailed coal combustion model. Combust. Sci. Technol. 2006, 178, 763–787. [Google Scholar] [CrossRef]
  58. Gidaspow, D. Multiphase Flow and Fluidization; Academic Press: San Diego, CA, USA, 1994. [Google Scholar]
  59. Tsuji, Y.; Tanaka, T.; Ishida, T. Lagrangian numerical simulation of plug flow of cohesionless particles in a horizontal pipe. Powder Technol. 1992, 71, 239–250. [Google Scholar] [CrossRef]
  60. OpenCFD, Ltd. OpenFOAM—The Open Source CFD Toolbox—User Guide, Version 2.1.1; OpenCFD, Ltd.: Reading, UK, 2012. [Google Scholar]
  61. Kantarelis, E.; Yang, W.; Blasiak, W. Production of liquid feedstock from biomass via steam pyrolysis in a fluidised bed reactor. Energy Fuel 2013, 27, 4748–4759. [Google Scholar] [CrossRef]
  62. Mellin, P.; Kantarelis, E.; Yang, W. Computational fluid dynamics modeling of biomass fast pyrolysis in a fluidized-bed reactor, using a comprehensive chemistry scheme. Fuel 2014, 117, 704–715. [Google Scholar] [CrossRef]
  63. Pan, Y.; Kong, S. Predicting effects of operating conditions on biomass fast pyrolysis using particle-level simulation. Energy Fuels 2017, 31, 635–646. [Google Scholar] [CrossRef]
  64. Calonaci, M.; Grana, R.; Hemings, E.B.; Bozzano, G.; Dente, M.; Ranzi, E. Comprehensive kinetic modeling study of bio-oil formation from fast pyrolysis of biomass. Energy Fuels 2010, 24, 5727–5734. [Google Scholar] [CrossRef]
  65. Varhegyi, G.; Antal, M.J. Kinetics of the thermal decomposition of cellulose, hemicellulose, and sugar cane bagasse. Energy Fuels 1989, 3, 329–335. [Google Scholar] [CrossRef]
  66. Mlonka-Mędrala, A.; Magdziarz, A.; Dziok, T.; Sieradzka, M.; Nowak, W. Laboratory studies on the influence of biomass particle size on pyrolysis and combustion using TG GC/MS. Fuel 2019, 252, 635–645. [Google Scholar] [CrossRef]
  67. Burton, A.; Wu, H. Influence of biomass particle size on bed agglomeration during biomass pyrolysis in fluidized bed. Proc. Combust. Inst. 2017, 36, 2199–2205. [Google Scholar] [CrossRef]
  68. Efika, C.E.; Onwudili, J.A.; Williams, P.T. Influence of heating rates on the products of high-temperature pyrolysis of waste wood pellets and biomass model compounds. Waste Manag. 2018, 76, 497–506. [Google Scholar] [CrossRef]
Publisher’s Note: MDPI stays neutral with regard to jurisdictional claims in published maps and institutional affiliations.
Figure 1. Flow chart of the CFD-DEM algorithm with a multistep kinetic scheme.
Energies 13 05358 g001
Figure 2. Geometry of the fluidized-bed reactor and pyrolysis conditions.
Energies 13 05358 g002
Figure 3. Pyrolysis products. (a) H2O, light gas, tar, and char; (b) light gas species; and (c) tar species.
Energies 13 05358 g003
Figure 4. Particle distribution (blue: sand particles; red: biomass particles) (a) 9 s, (b) 9.1 s, (c) 9.2 s, (d) 9.3 s, (e) 9.4 s, (f) 9.5 s, and (g) 9.6 s.
Energies 13 05358 g004
Figure 5. Temperature distributions. (a) 9 s, (b) 9.1 s, (c) 9.2 s, (d) 9.3 s, (e) 9.4 s, (f) 9.5 s, and (g) 9.6 s.
Energies 13 05358 g005
Figure 6. CO mass fractions. (a) 9 s, (b) 9.1 s, (c) 9.2 s, (d) 9.3 s, (e) 9.4 s, (f) 9.5 s, and (g) 9.6 s.
Energies 13 05358 g006
Figure 7. LVG mass fractions. (a) 9 s, (b) 9.1 s, (c) 9.2 s, (d) 9.3 s, (e) 9.4 s, (f) 9.5 s, and (g) 9.6 s.
Energies 13 05358 g007
Figure 8. Pyrolysis products for different pyrolysis temperatures. (a) H2O, light gas, tar, and char; (b) light gas species; and (c) tar species.
Energies 13 05358 g008
Figure 9. Light gas production rate for different pyrolysis temperatures.
Energies 13 05358 g009
Figure 10. Biomass particle distribution at t = 10 s under different pyrolysis temperatures.
Energies 13 05358 g010
Figure 11. The average thermochemical conversion of the biomass particles for the different temperatures: (a) Particle temperature; (b) Particle mass loss.
Energies 13 05358 g011
Figure 12. Pyrolysis products for different particle sizes. (a) H2O, light gas, tar, and char; (b) light gas species; and (c) tar species.
Energies 13 05358 g012aEnergies 13 05358 g012b
Figure 13. Light gas production rate for different particle sizes.
Energies 13 05358 g013
Figure 14. Biomass particle distribution at t = 10 s for different particle sizes.
Energies 13 05358 g014
Figure 15. The average thermochemical conversion of biomass particles for different particle sizes: (a) Particle temperature; (b) Particle mass loss.
Energies 13 05358 g015
Table 1. Gas phase governing equations.
t ( ε g ρ g ) + ( ε g ρ g u g ) = S p , m
t ( ε g ρ g u g ) + ( ε g ρ g u g u g ) = p + ( ε g τ eff ) + ε g ρ g g + S p , mom
t ( ε g ρ g E ) + ( ε g u g ( ρ g E + p ) ) = ( ε g α eff h sen ) + S h + S p , h + S rad
t ( ε g ρ g Y i ) + ( ε g ρ g u g Y i ) = ( ε g ρ g D eff Y i ) + S p , Y i + S Y i
t ( ε g ρ g k ) + ( ε g ρ g u g k ) = ( ε g ( μ g + μ t σ k ) k ) + ε g G k ε g ρ g ε t ( ε g ρ g ε ) + ( ε g ρ g u g ε ) = ( ε g ( μ g + μ t σ ε ) ε ) + ε g ε k ( C ε 1 G k C ε 2 ρ g ε ) μ t = ρ g C μ k 2 ε
Table 2. Particle phase governing equations.
Mass:
d m p d t = d m v a p o r d t + d m d e v o l d t
Momentum:
m p d v p d t = f g + f c + m p g I p d ω p d t = T p
Energy:
m p c p d T p d t = h A p ( T g T p ) + e p A p 4 ( G 4 σ T p 4 ) + Q p
Drag correlation:
f g = V p β ε p ( u g v p ) β = { 150 ε p 2 μ g ε g 2 d p 2 + 1.75 ε p ρ g ε g d p | u g v p | ε g < 0.8 0.75 C d ε p ρ g d p | u g v p | ε g 2.65 ε g 0.8 C d = { 24 Re p ( 1 + 0.15 R e p 0.687 ) Re p < 1000 0.44 Re p 1000 Re p = ε g ρ g d p | u g v p | / μ g
Table 3. Simulation setups of the fluidized-bed reactor.
ParameterValue
Reactorgeometry (m)0.072 × 0.65 × 0.00085
wall temperature (°C)500
inlet gas temperature (°C)463
inlet gas flow rate (g/s)0.05
Sand particleshapesphere
diameter (μm)850
density (kg/m3)2650
Biomass particleshapesphere
diameter (μm)450, 650, 850
materialmixture of pine and spruce
density (kg/m3)600
feeding rate (g/s)0.00835
Resolutiongrid20 × 130 × 1
time step (s)1.0 × 10⁻⁵
Table 4. Component mass fraction of the mixed pine and spruce (%).
BiomassLignocellulose
moisture9.8cellulose44.0297
ash0.3067hemicellulose21.9245
lignocellulose89.8933LIG-H16.2854
LIG-O6.4921
LIG-C11.2683
Publisher’s Note: MDPI stays neutral with regard to jurisdictional claims in published maps and institutional affiliations.

