1. Introduction
Increasing world population intensifies the global energy demand. The imbalance in supply and demand emerges a need for the exploration of new pathways for the production of energy [
1]. It has been established that renewable sources of energy have great importance for sustainable development. Moreover, the increasing consciousness about environmental threats such as global warming has directed the world towards the usage of renewable sources [
2].
Biomass is a renewable energy source that is abundantly available as a wide range of materials, which includes agricultural waste, organic wastes such as food, sewage sludge, etc. [
3]. Sewage sludge (SS) is a heterogeneous material originated from the wastewater treatment. SS is comprised of a high amount of water content, carbohydrates, proteins, lipids, and other toxic and non-toxic inorganic elements [
4]. Due to massive urbanization and rapid growth in population, the production of SS has become a crucial issue that obstacles urban development and creates environmental pollution [
5]. In the European Union (EU), by implementing Urban Waste Water Treatment (UWWT) Directive 91/271/EC (CEC, 1991), the total annual SS production from the EU will exceed 13 million dry tons by 2020 [
6]. Over the years, landfill, incineration, and agricultural applications are mostly adopted ways for the disposal of SS, and these technologies are facing several challenges due to limited land and strict environmental regulations [
7]. Therefore, it is essential to establish an alternative disposal route, involving recycling and safe disposal simultaneously. SS is enriched with volatiles, and thus, recognized as a bio-resource for the production of liquid fuels and a variety of chemicals [
8]. The higher heating value (HHV) of SS varies between 12 to 20 MJ/kg, which is in line with other energy-rich biomass [
9].
Currently, for biomass conversion, hydrothermal liquefaction (HTL) has received much attention in the recent past due to the efficient processing of wet feedstocks. HTL works at moderate temperatures, and high pressures wherein water facilitates acid-base catalyzed reactions for the disintegration of the organic matter [
10]. In HTL, from the past two decades, SS has been considered as a viable feedstock for the production of bio-crude due to its low cost and abundant accessibility [
11,
12]. For SS, HTL is the best choice of technology due to the high water content, and this water emerges to be a by-product of the process, which must be managed sustainably. This effluent water from the HTL process is often termed process water or aqueous phase containing water-soluble organics. From the literature based on HTL of SS, the majority of studies were published on the production of bio-crude and energy recovery [
13,
14,
15]. However, few articles are available on the characterization of the aqueous phase. Maddi et al. quantitatively characterized the aqueous phase from primary, secondary, and digested SS, and obtained mostly N-heterocyclic compounds and short-chain acids [
16]. Xu et al. treated SS under subcritical conditions and reported a decrease in total organic carbon (TOC) level (19 to 9 g/L) of the aqueous phase with increasing temperatures (260 to 350 °C) [
17]. Some algal biomass studies have indicated that the aqueous phase contains up to 45% of carbon and almost 80% of the nitrogen and phosphorus [
18,
19]. For this reason, it becomes necessary to create ways for the recovery of the organics and nutrients from the aqueous stream before discharging into the natural environment [
20].
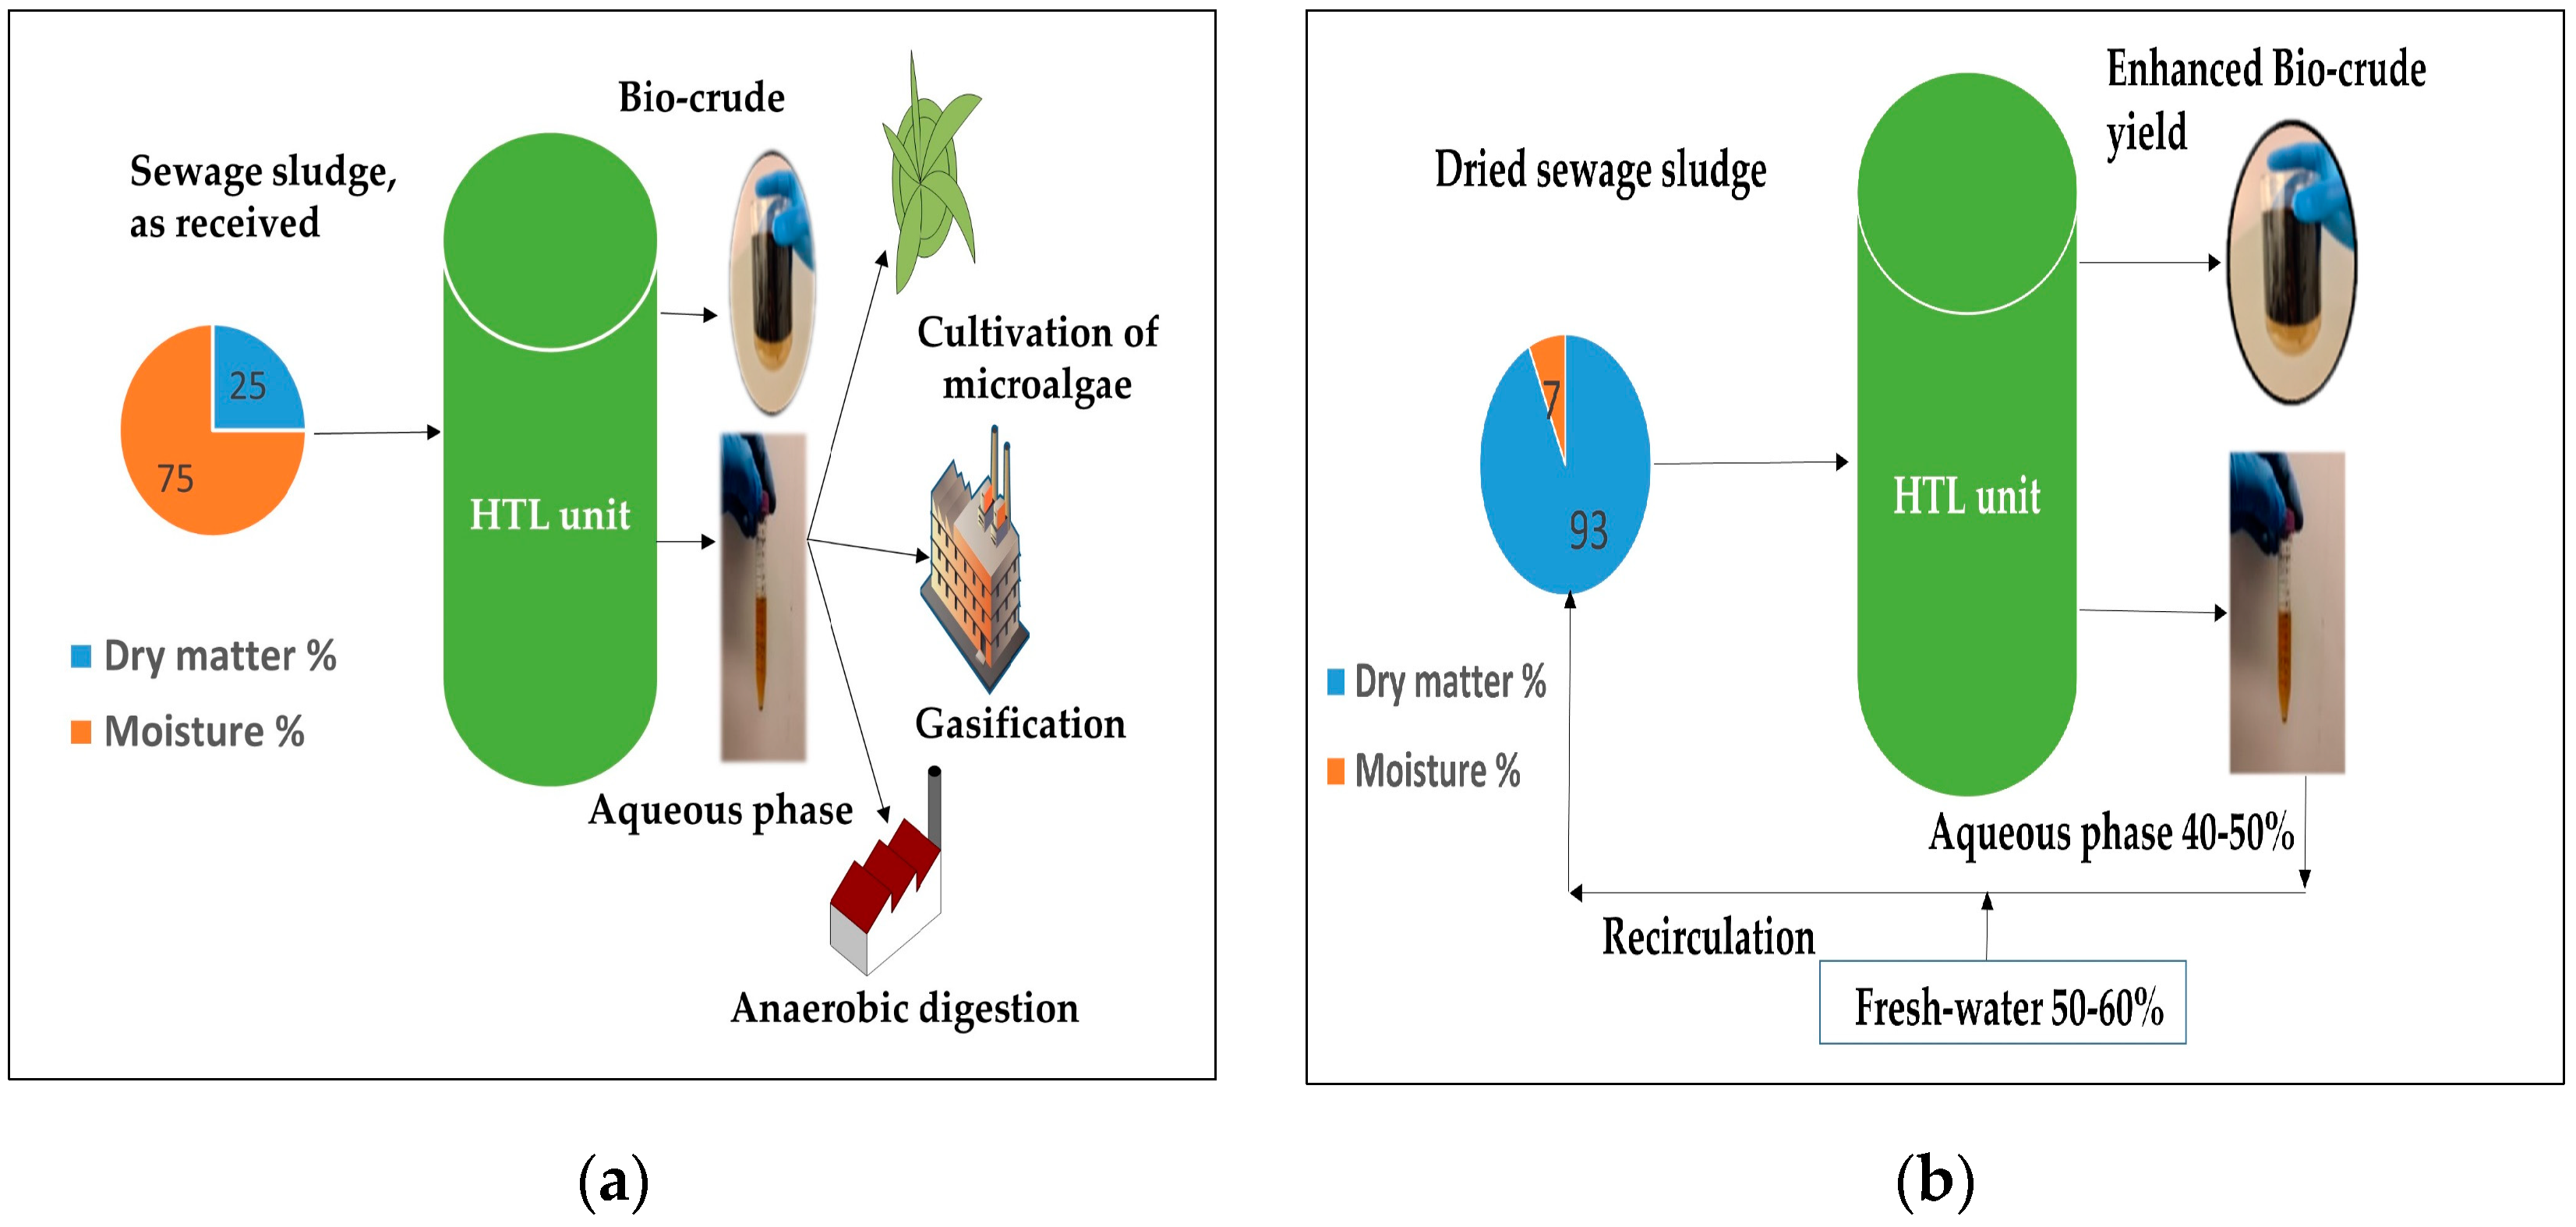
There are mostly two ways to implement water management in an HTL process. (1) To identify appropriate technology that can extract energy in the form of organics as well as inorganics (nutrients) directly from the aqueous phase, which is then discharged into the environment. (2) To recycle the aqueous phase back into the HTL process. In recent past, many researchers have studied the utilization of the aqueous phase via different routes like gasification, which specially produces gaseous fuel or from gas to liquid hydrocarbons [
21,
22], direct recycling for the cultivation of algal biomass [
23], and anaerobic digestion for the production of methane gas [
24], as illustrated in
Figure 1a. Currently, the more recent approach is the recirculation of the aqueous phase back to the HTL unit, as several studies have revealed a positive impact on yield, and energy recovery of the bio-crude. For instance, Zhu et al. performed the recycling of aqueous phase from ligno-cellulosic biomass and reported enhanced bio-crude yield (35 to 38.4%) after three rounds [
25]. Pedersen et al. carried out recycling of aqueous phase from co-liquefaction of wood and glycerol in the continuous plant, but unfortunately, the authors could not observe a clear trend in bio-crude yield due to complex separation process, although higher amount of organic carbon and ash were detected in the aqueous phase at each recycle [
26]. Ramos-Tercero et al. [
27], reported an increase in bio-crude yield from 14 to 42% after seven recycles from micro-algae, whereas HHV of bio-crude was decreased via successive recycles. Biller et al. [
28] carried out recycling experiments with and without catalyst (K
2CO
3) and noticed a higher rate of increase in bio-crude yield and energy recovery in catalytic bio-crude than the non-catalytic runs from dry distillates grains with solubles (DDGS). Daniel et al. [
29] also reported the higher bio-crude yield with a decrease in solids with HHVs (33–35 MJ/kg) from blackcurrant pomace.
One aspect of recycling the aqueous phase, which has not yet been addressed in the literature, is balancing the recycled water stream with the water already present in the feedstock. If a feedstock is dry, this is not very complicated, likely being only a question of adjusting water content by adding additional water to the feed stream. In the context of continuous plants for real feedstocks such as SS, there is plenty of water already in the feedstock, typically in a range of 75–95%. This makes recycling of aqueous phase in the HTL process more complicated, as water must be removed to maintain the organic loading, without losing the soluble organics. To address aqueous phase recycling for SS in a continuous process, a series of well-controlled batch experiments have been carried out. In these, dried SS has been processed at hydrothermal conditions with the recycling of soluble organics, using make-up water to maintain a constant organic loading of the process as demonstrated in
Figure 1b. In summary, this study aims to obtain fundamental information about the implications of aqueous phase recycling on HTL products produced from the high nitrogen-containing feedstock. Furthermore, the fate of nutrients is also discussed in the last part of the study.
3. Results and Discussion
3.1. Effect of Temperature and Catalyst on Products Yield
Initially, three experiments were performed without recycling of the aqueous phase, two at subcritical conditions with (Cat-K
2CO
3), and without catalyst (350-None). To investigate the effect of the temperature at a supercritical state, one experiment was conducted in duplicate without catalyst (400-None), as given in
Figure 3. In terms of temperature perspective, at both conditions, almost the same yields (25.30% at 350-None, and 23.90% at 400-None) were obtained with a minor difference of 1.4% that can be ignored under the experimental protocols. Nevertheless, the slightly lower bio-crude yield with small error bars at 400-None might be due to the conversion of bio-crude fractions to aqueous or gas phase via cracking reactions above the critical point (374 °C). The Cat-K
2CO
3 bio-crude showed the highest bio-crude yield (28.5%). It is primarily due to the hydrolysis of carbohydrate components, which accounted for 52%. Alkali carbonates assist in the hydrolysis and cleavage of glycosidic bonds and reduce the formation of char [
35].
In the overall scenario, no significant improvement in bio-crude yield was observed by the addition of catalyst due to the substantial amount of proteins (43%) present in the SS. Previously, Yulin et al. highlighted that the alkali catalyst is not favorable for the conversion of high protein-containing feedstocks [
20]. In our case, an approximately 3% increase in bio-crude yield is attributed to the higher carbohydrate fractions rather than to the proteins in the SS, as mentioned in
Table 1. Previously Yokoyama et al. has already reported the enhanced bio-crude yield from SS containing 57% of carbohydrates by using 2.5% of sodium carbonate as a catalyst [
36]. Therefore, we can conclude that the role of the alkali catalyst is strongly dependent upon the biochemical composition of the feedstock. At both temperatures, almost similar carbon and hydrogen contents were found, whereas Catalytic-K
2CO
3 bio-crude showed maximum energy recovery (44.09%) with HHV of (36.45 MJ/kg) as listed in
Table 4.
3.2. Effect of Aqueous Phase Recycling on HTL Product Yield
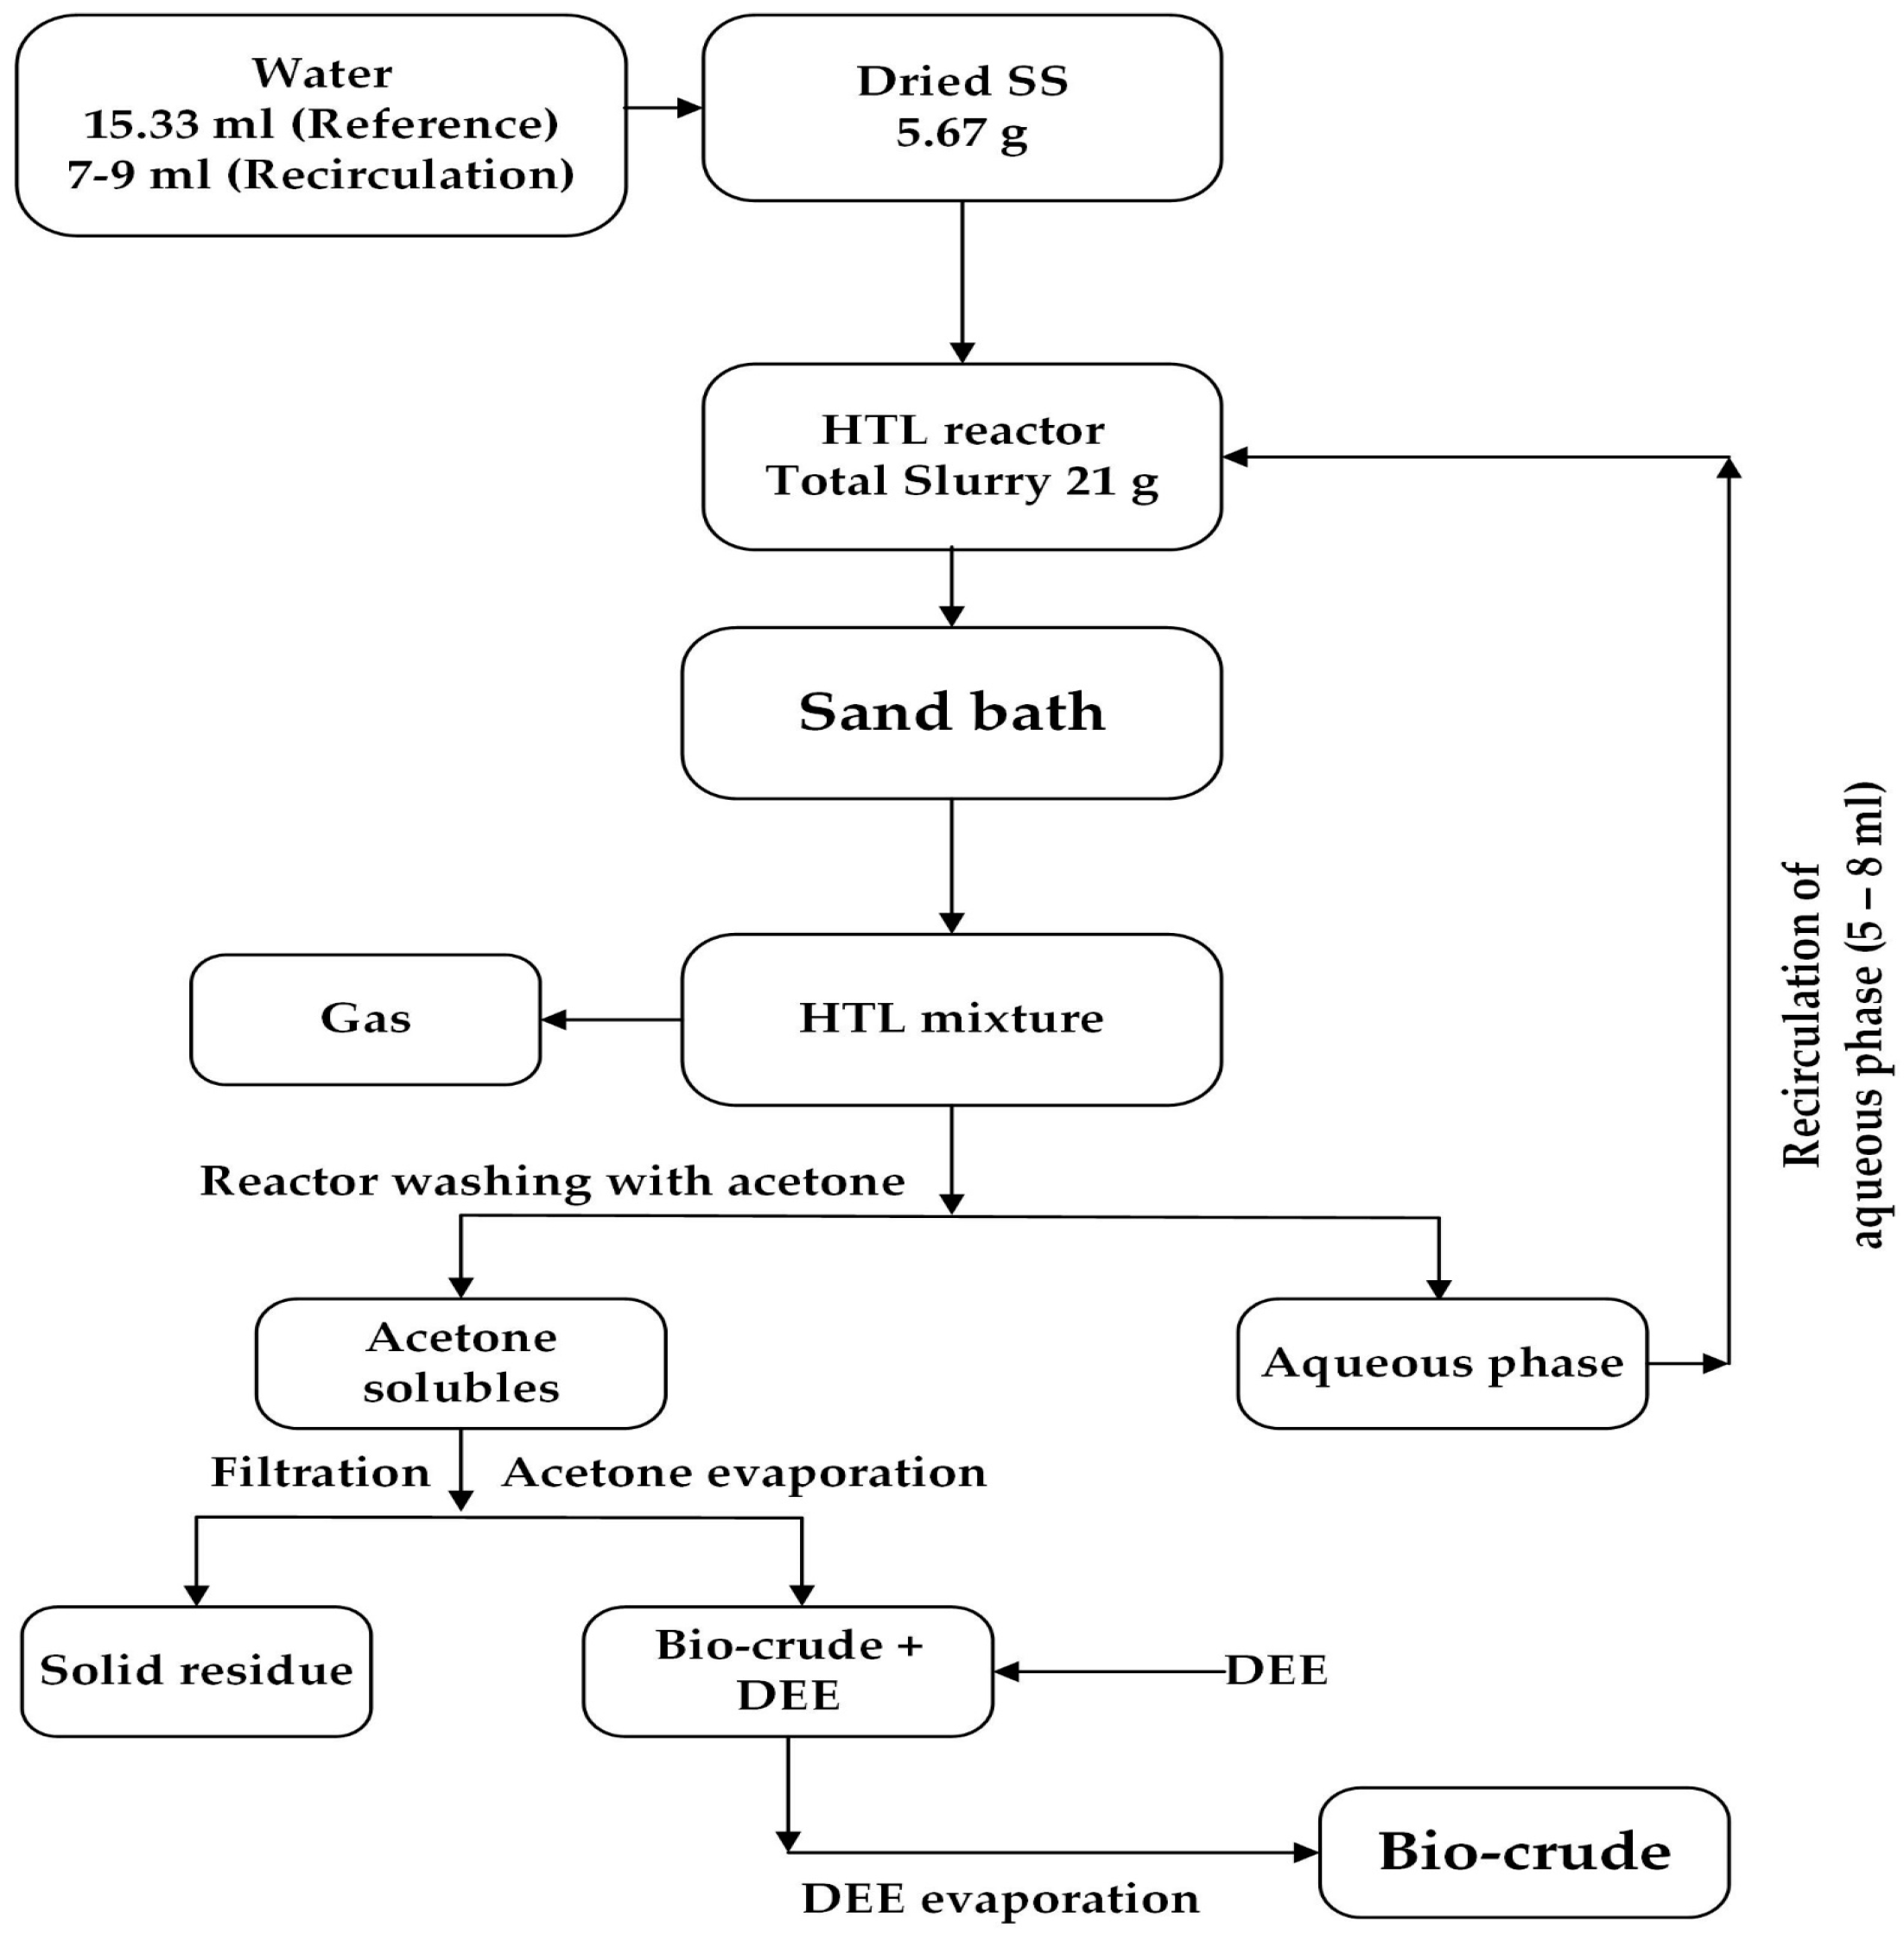
In the second phase, the condition (350-None) was selected as the reference or baseline run (C0). The series of a total eight (C1 to C8) experiments with the recycling of aqueous phase were performed. Among them, five experiments were performed in duplicates, and the rest, C6, C7, C8, were carried out only once due to the smaller amount of aqueous phase that was recovered from previous runs.
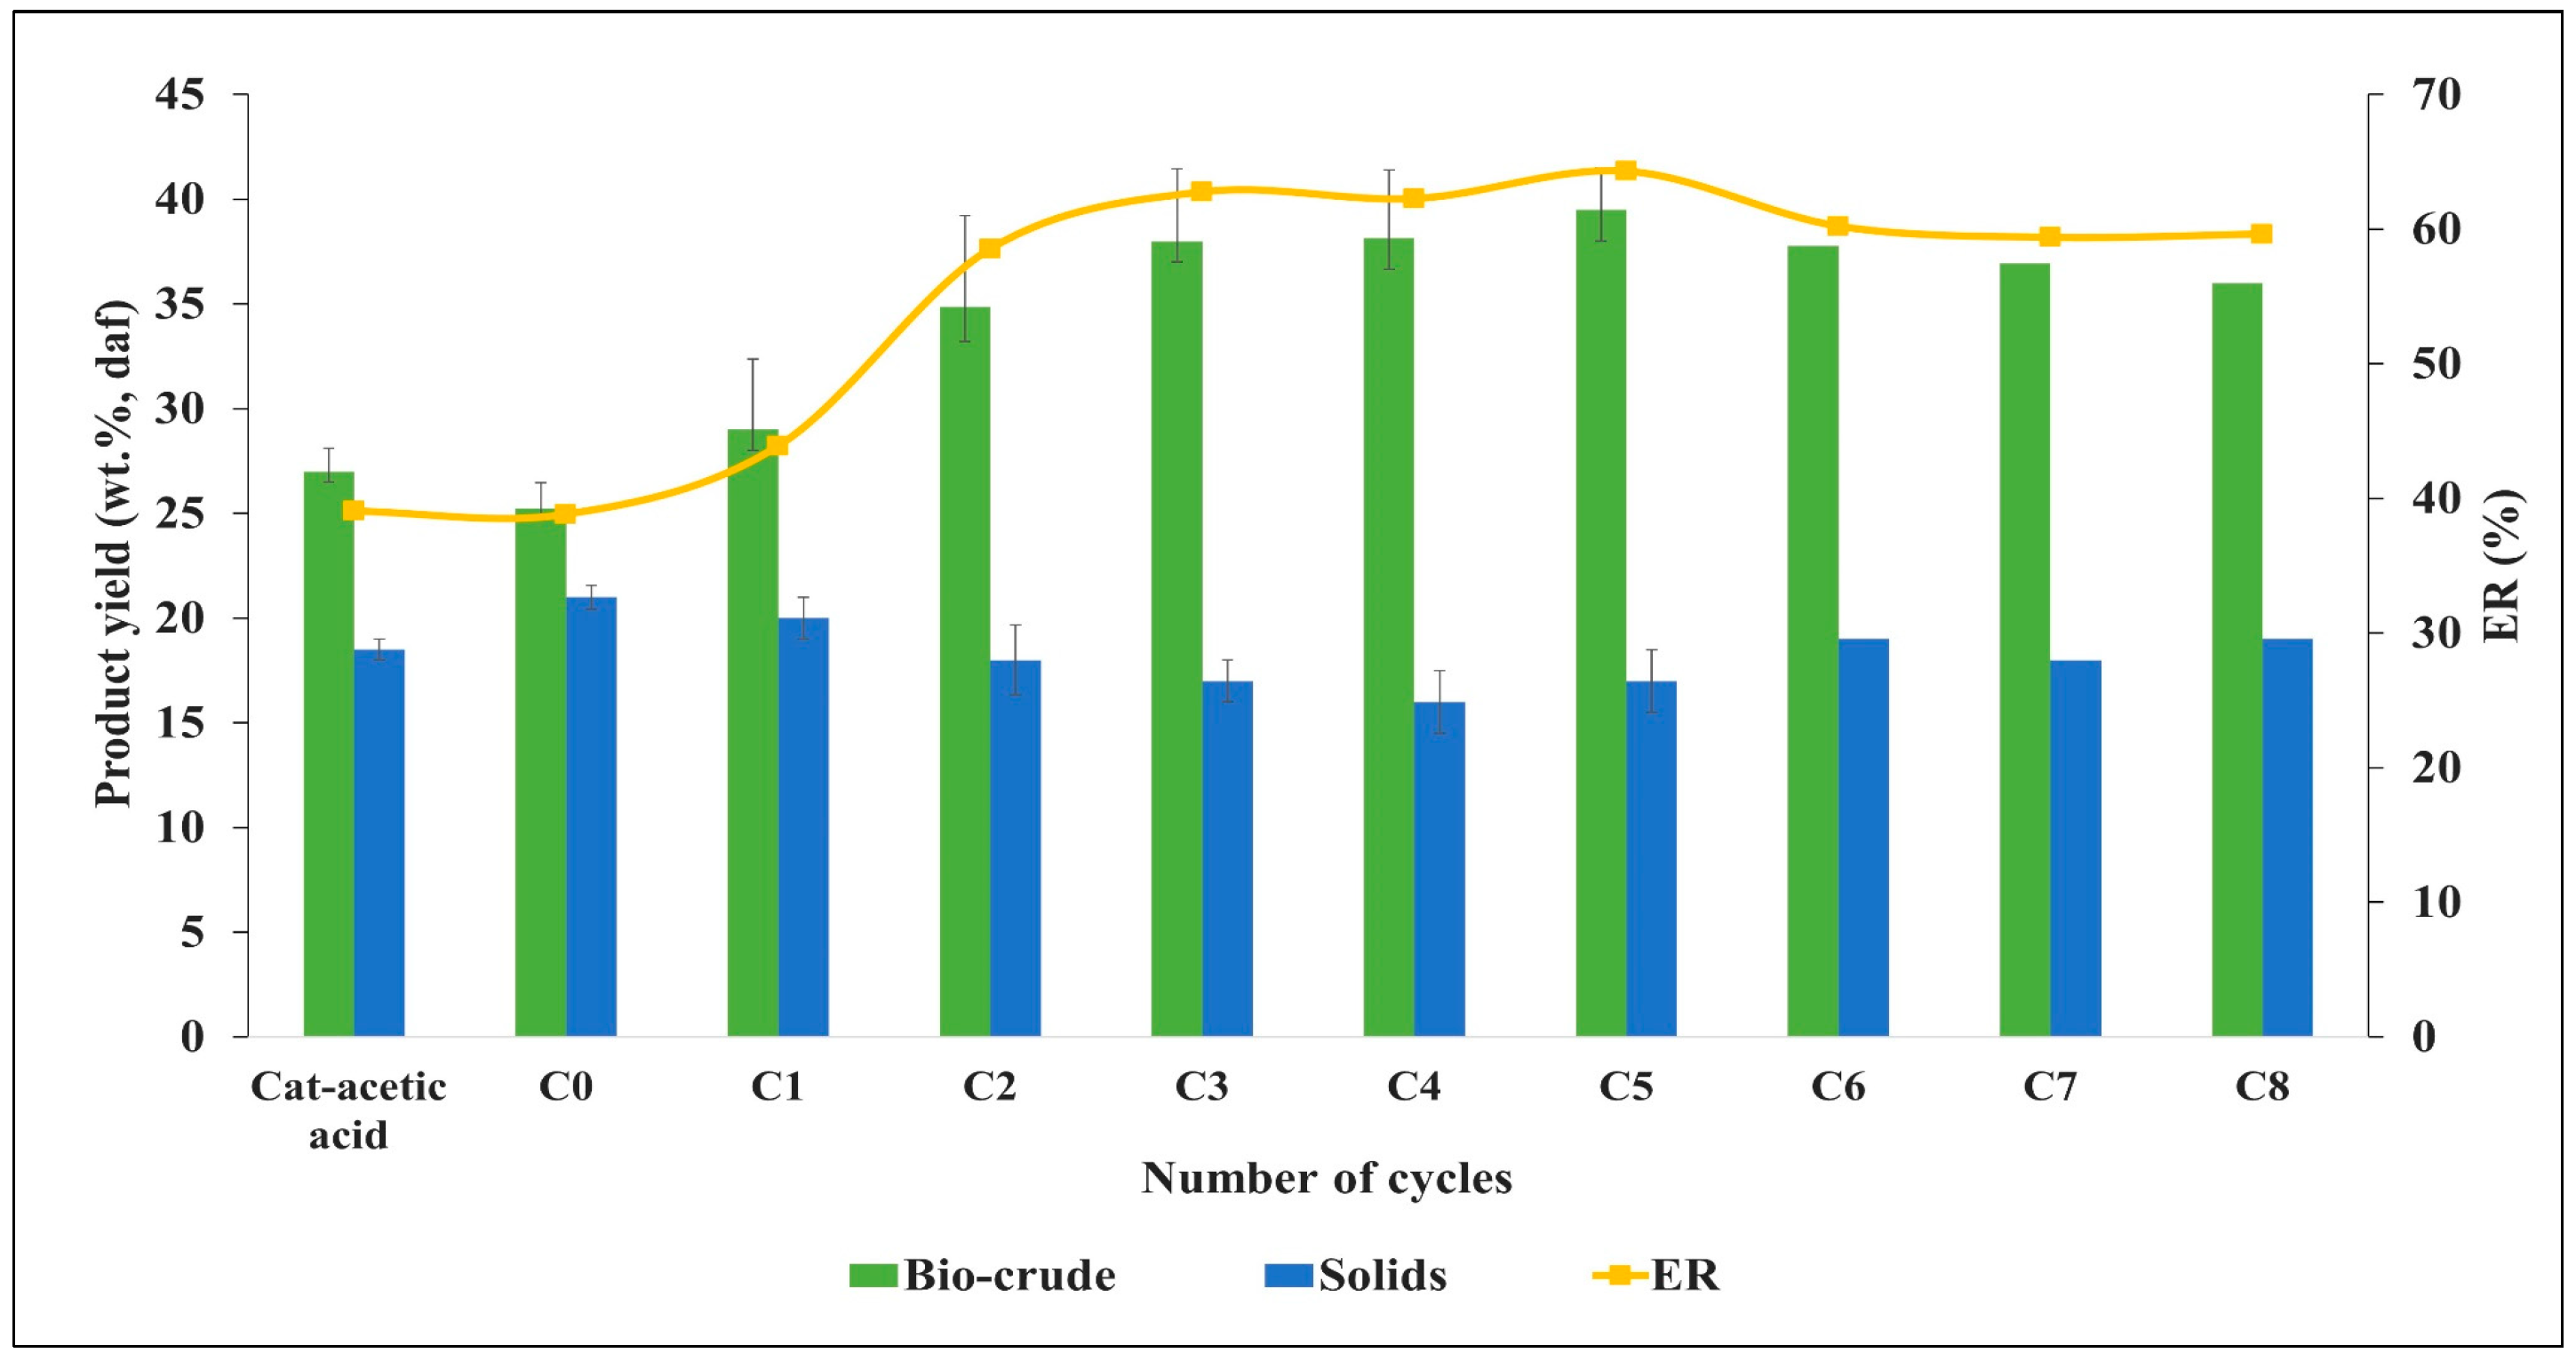
Figure 4 demonstrates that bio-crude yield increased from 25 to 38% at C5, and stabilized up to ~36% at C8. The increase in the yield is due to the saturation of WSO, especially from the N-containing organic compounds present in the aqueous phase, which is discussed later in detail in
Section 3.7. At cycles C4 and C5, it is observed that the WSO has reached the maximum level of saturation corresponding to their highest TOC values (~28 g/L), which resist the further increase in bio-crude yield. However, due to lack of aqueous phase in runs C6–C8, these were only carried out as single experiments, which make it impossible to evaluate these runs in detail, except to consider that yield and energy recovery seem to be stabilized for higher recycles. Almost 50% of the bio-crude yield was increased after eight recycles. The solid yield was inversely correlated with bio-crude yield in the range of 16 to 20% in all runs.
3.3. Influence of Acetic Acid on Bio-Crude Yield and Quality
In earlier studies, it was noticed that acetic acid is one of the influential compounds for improving the bio-crude yield [
25,
37]. Therefore, to investigate the catalytic effect, 2.5% of the total slurry or (0.56 M) acetic acid was used. The addition of acetic acid resulted in a negligible (1.5%) increase in bio-crude yield. Ross et al. [
38] mentioned that the decomposition of small chain organic acids forms in-situ hydrogen and carbon monoxide, the in-situ hydrogen would further act as a proton donor to improve bio-crude yield.
To further explore this mystery, the concentration of acetic acid in all aqueous phases was determined by HPLC. The standard calibration was drawn with (R
2 = 0.999) to determine the concentration of acetic acid, as given in
Figure S2 (Supplementary Materials).
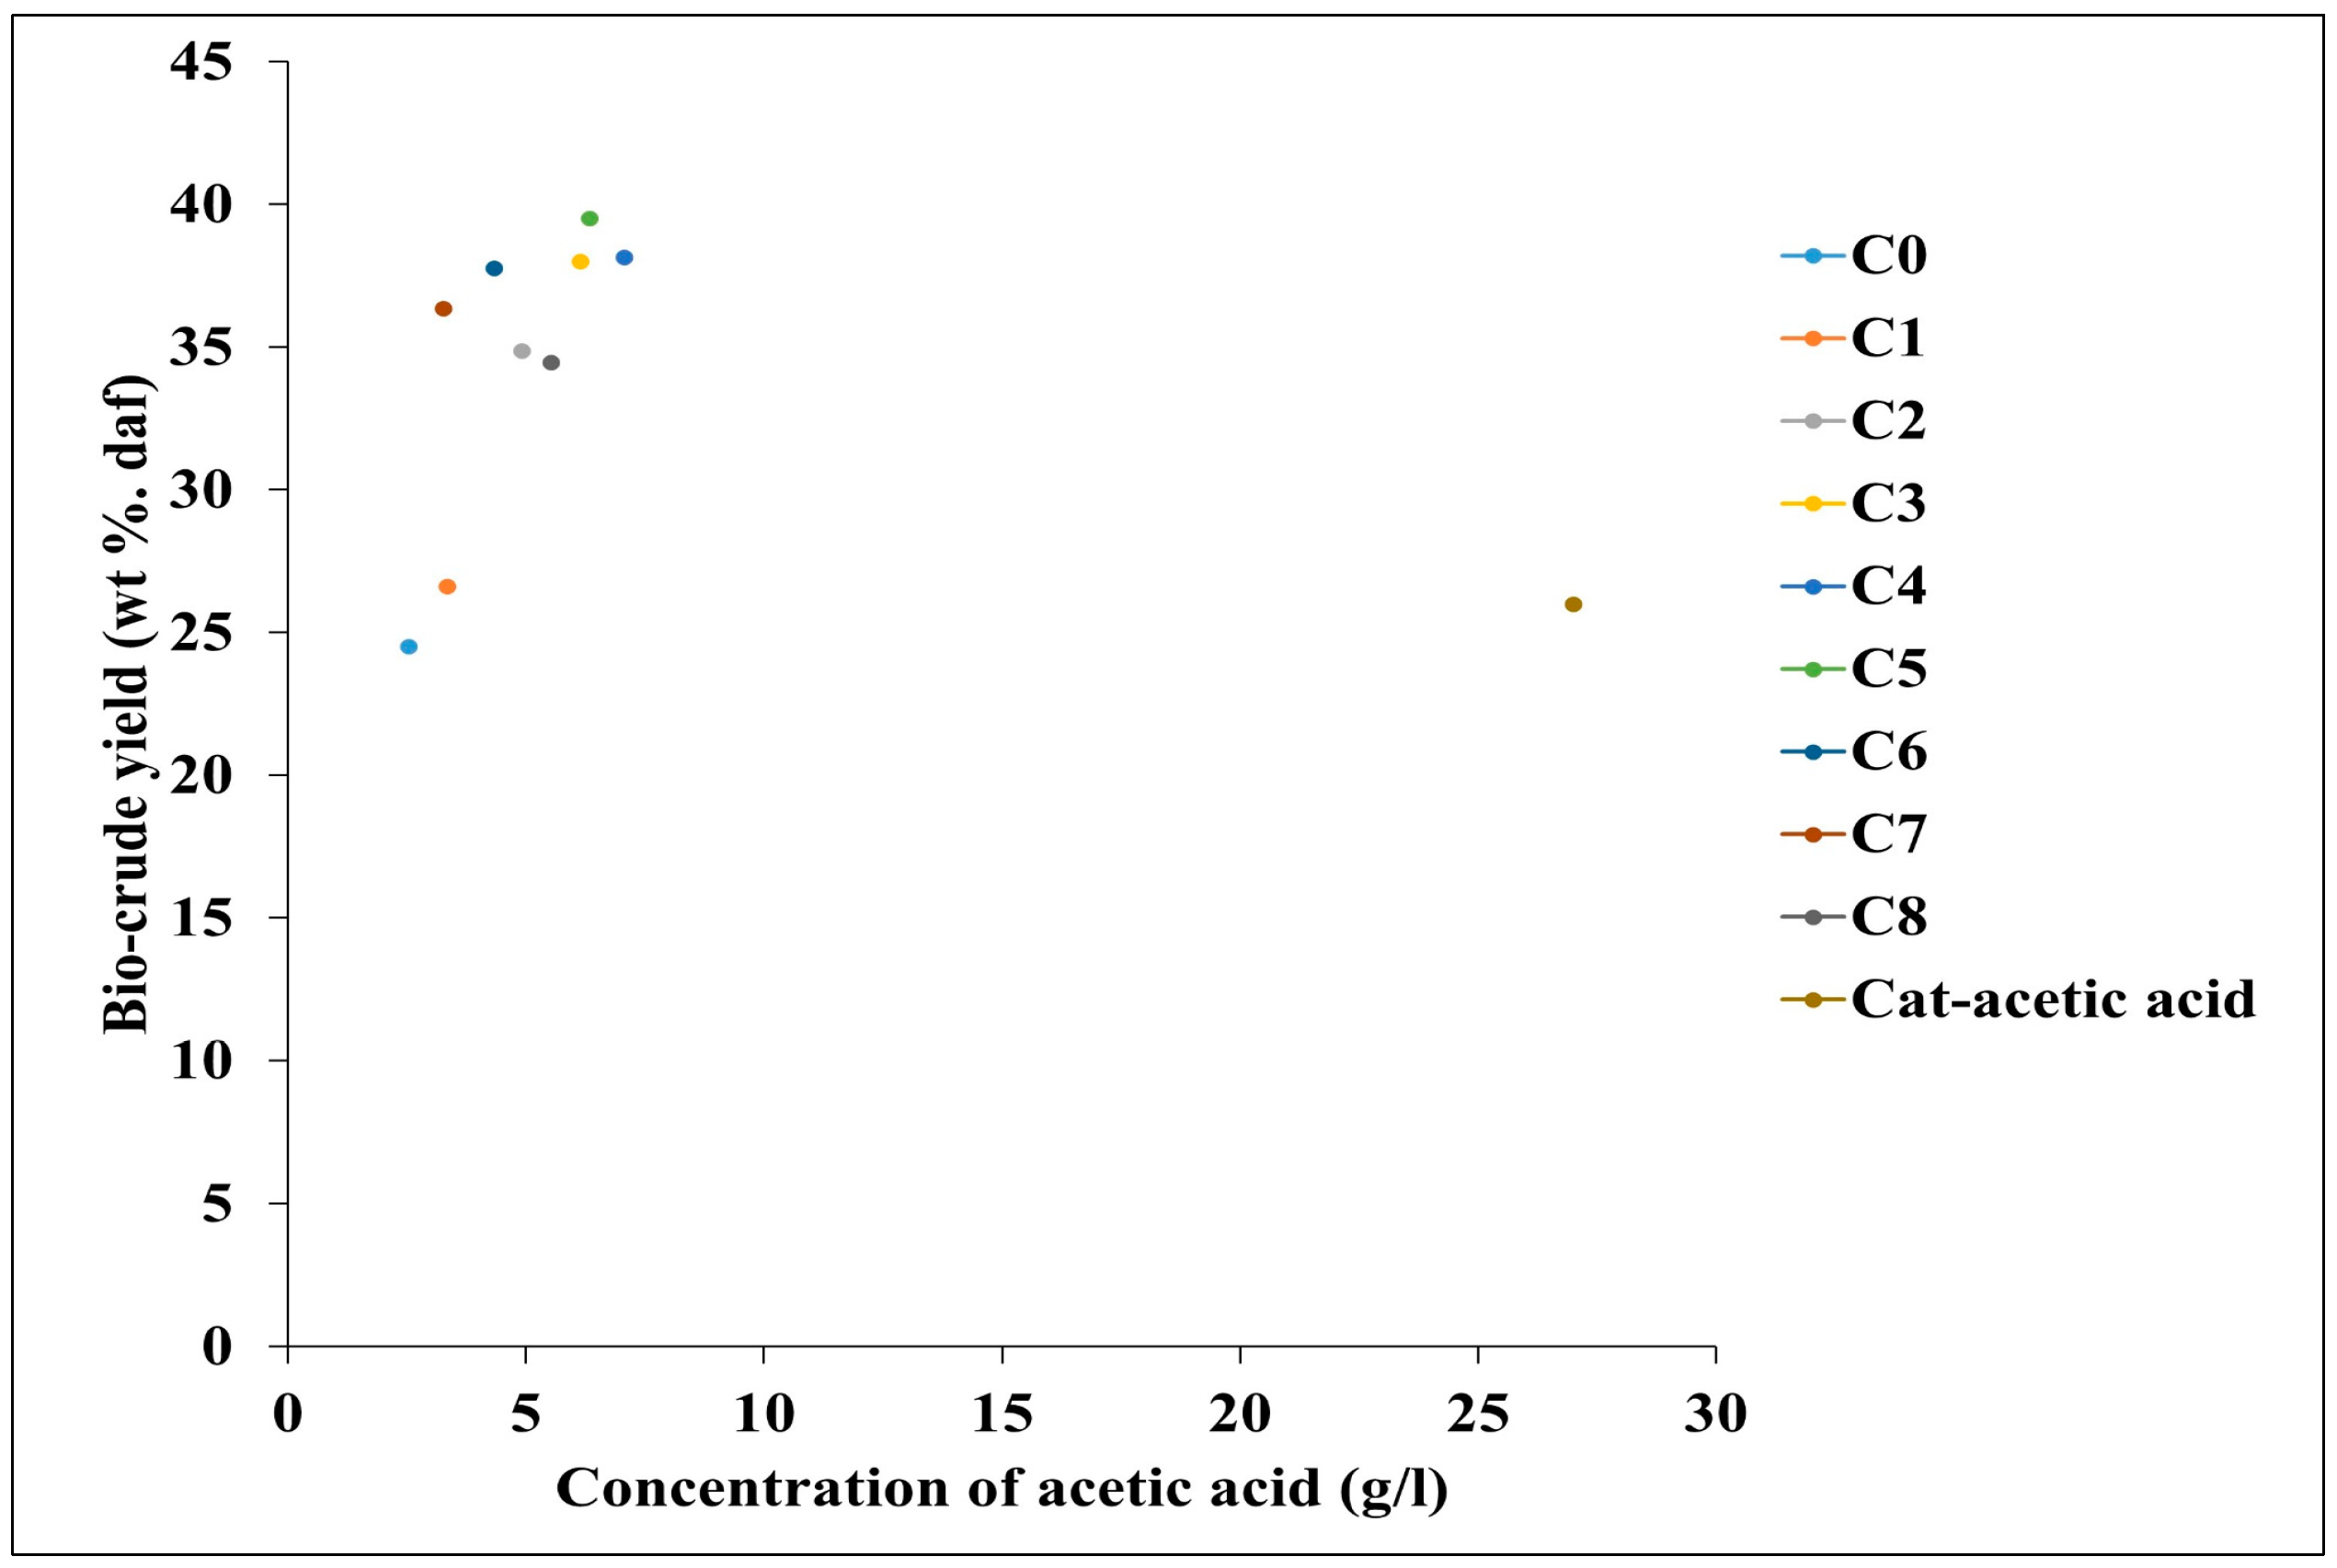
The plots of bio-crude yield versus the concentration of acetic acid are shown in
Figure 5. The maximum concentration of acetic acid (27 g/L) was detected when acetic acid was used as a catalyst itself. However, the bio-crude yield was almost the same (26.85%) as the baseline experiment. This observation confirms that acetic acid is not the only contributor to the bio-crude yield, but the overall recycling effect of WSO is responsible for the improvement of yield. This is because, during recycling experiments, the WSO undergo different chemical reactions such as repolymerization and cyclization, which lead to the formation of heavier fragments and become part of the bio-crude. This can also be interpreted by the higher nitrogen content in the bio-crude with successive recycles. The overall concentration of acetic acid increased with the recycling of the aqueous phase (2.4 to 7.1 g/L). Some variation in acetic acid concentration might be due to the variable dilution ratio, arising due to the experimental procedure and small sample amounts.
In the recent past, Ramos-Tercero et al. experienced a mere 0.62% increase in bio-crude yield on the action of (0.1 M) acetic acid from microalgae [
27]. This is quite consistent in our case, where we used five times more concentration and obtained a 1.5% increase in yield. The variation in bio-crude yield may be due to the different chemical composition of the feedstock. In addition, the GCMS of the aqueous phase was carried out for the qualitative analysis of the organic compounds, which is in
Section 3.7.
Table 5 shows the elemental composition of bio-crude. The overall carbon content in all bio-crudes was 70–74%, the hydrogen was also varied by the marginal difference in the range of 9 to 10.50%. Interestingly, an increasing trend of nitrogen (4.3 to 7.10%) was found, especially due to the accumulation of N-containing compounds. The overall HHVs were detected in the range of 33 to 35 MJ/kg, and 59% of the ER was enhanced after eight recycles. The Cat-acetic acid bio-crude contained higher oxygen content, which refers to the conversion of aqueous phase fractions to the bio-crude in the form of acids, alcohols, and other oxygenates.
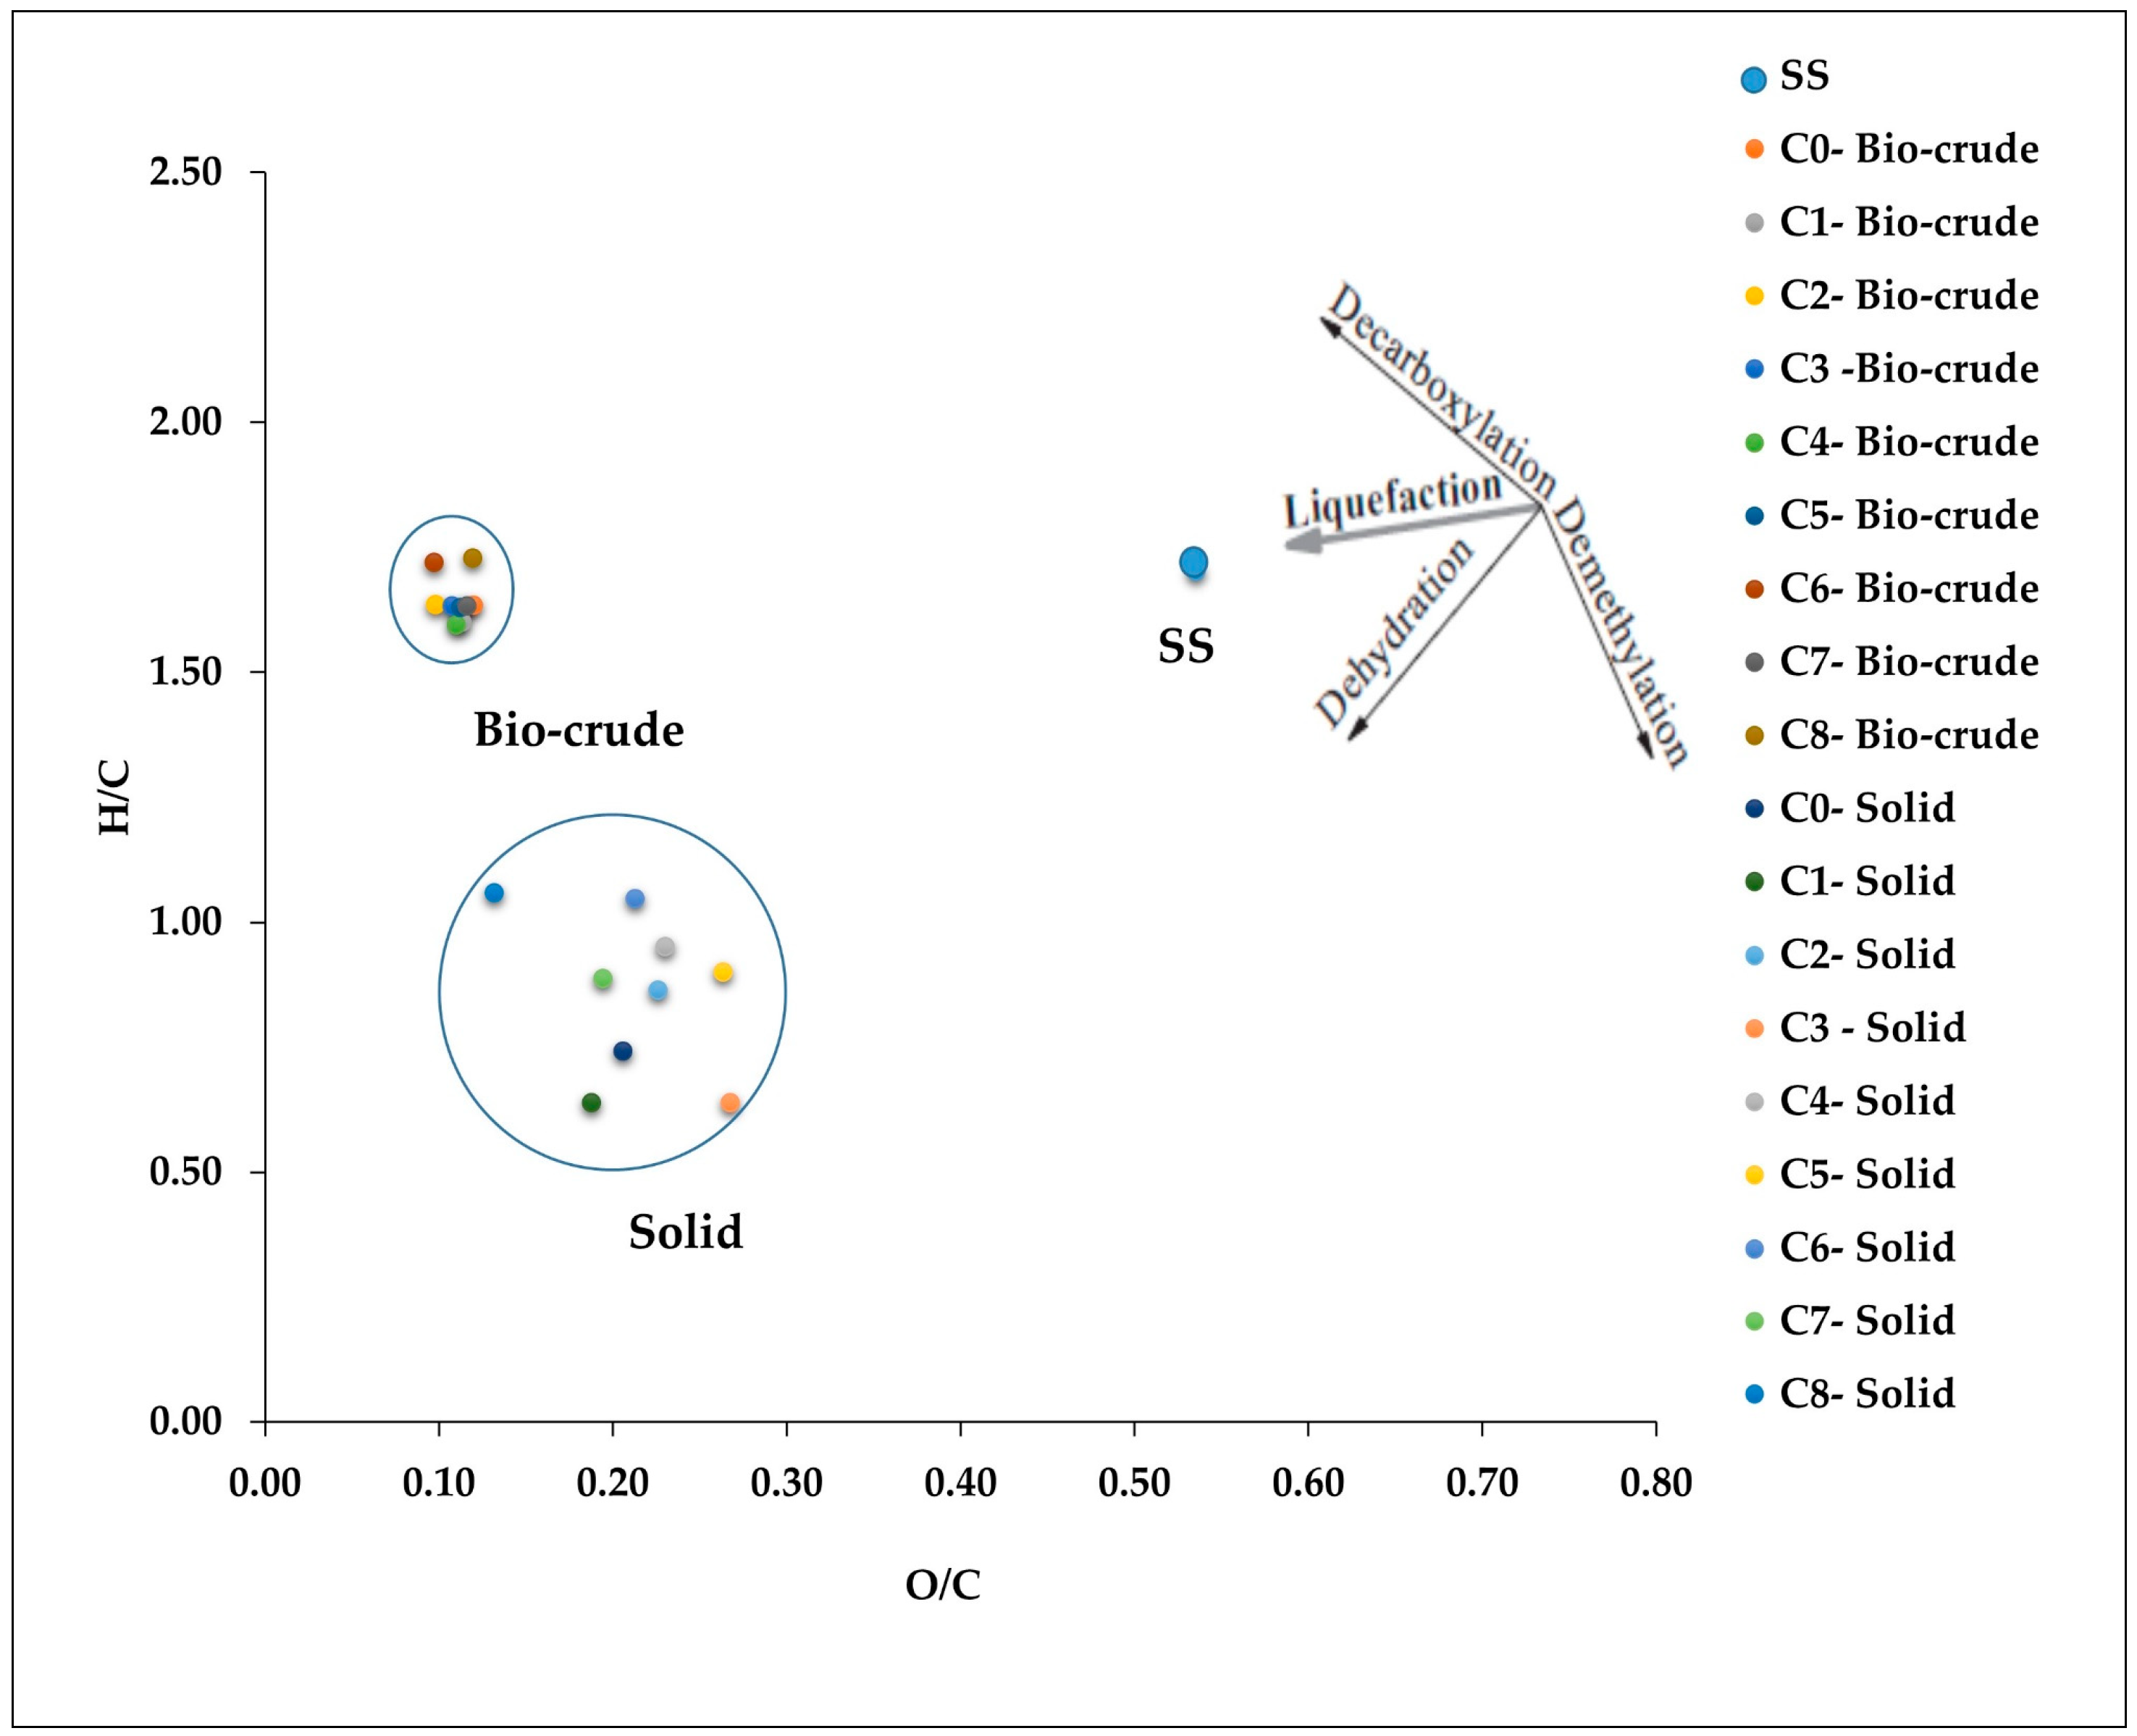
The H/C (1.51 to 1.69), and O/C (0.10 to 0.13) ratios were also calculated. The lower O/C ratio of the bio-crude indicates the conversion of SS via dehydration and decarboxylation reactions, as illustrated in
Figure 6. High operating conditions accelerate the rate of dehydration and decarboxylation reactions, which take away the oxygen in the form of water and carbon dioxide. Lower O/C ratio improves the stability of the bio-crude, which could reduce the hydrogen demand for the upgrading of the bio-crude. Among all bio-crudes, the higher degree of deoxygenation was calculated at bio-crude from run C2 (72.5%) with maximum calorific value 35.71 MJ/kg.
3.4. Thermal Behavior of Bio-Crude
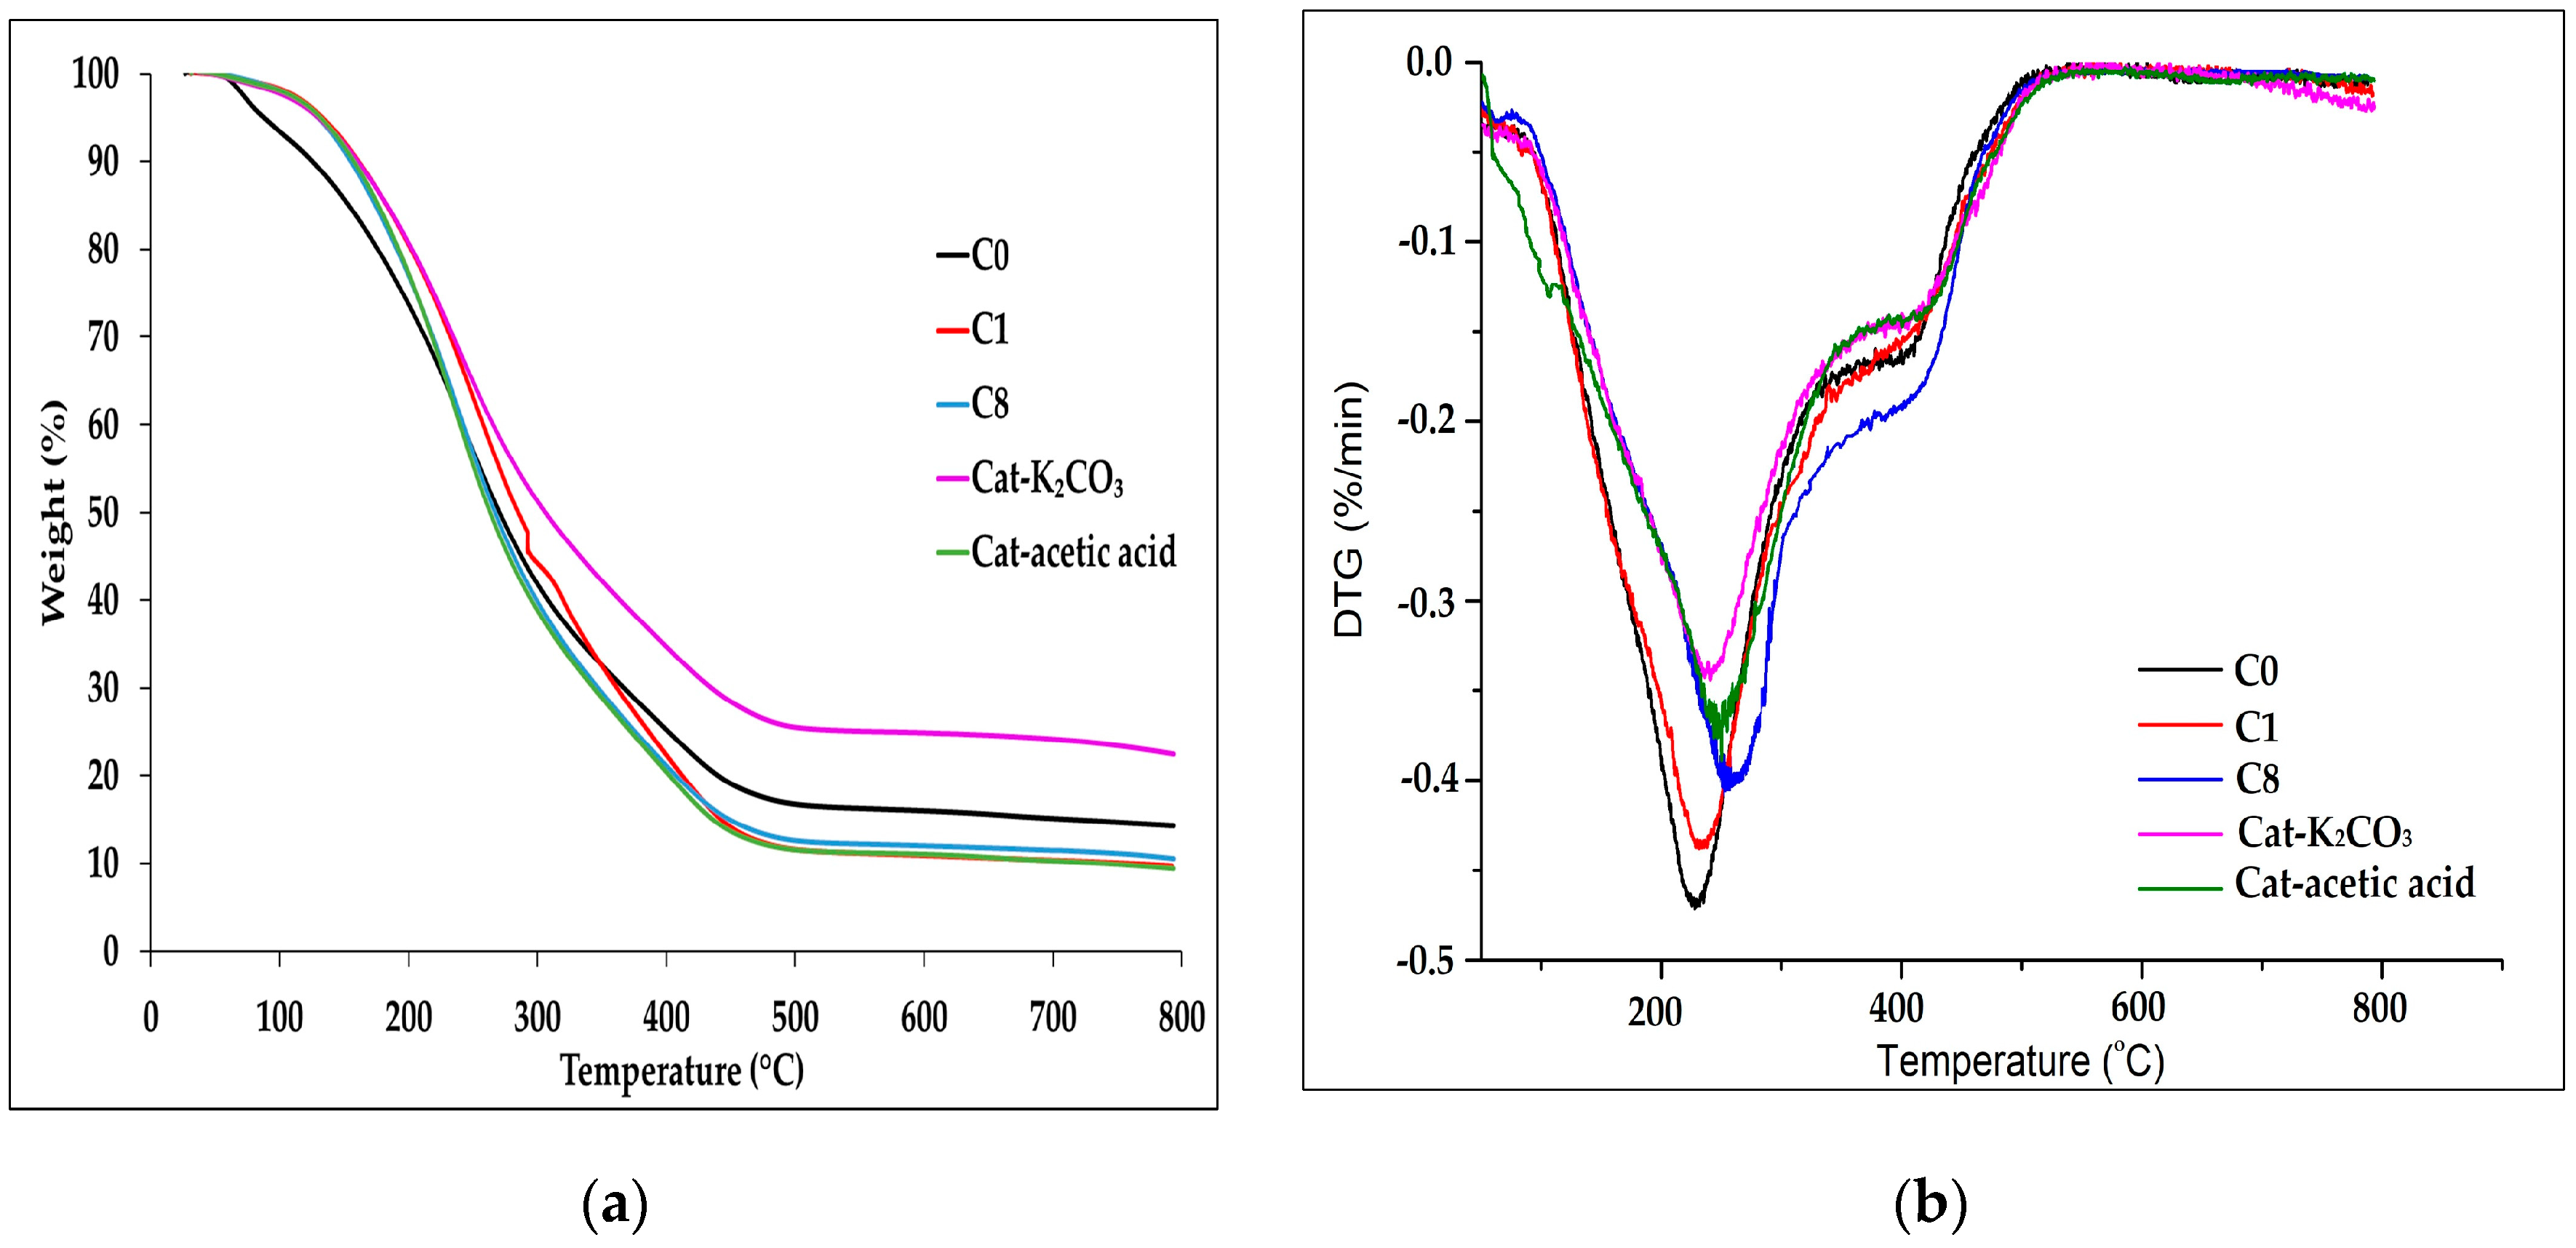
To assess the thermal behavior of the bio-crude, the TGA analysis was conducted. It was noticed that from all the bio-crudes except Cat-K
2CO
3, almost 65% of the mass was volatilized at temperatures ≤350 °C
Figure 7a. To elaborate further, the Differential Thermogravimetric (DTG) curves are presented in
Figure 7b, which confirm the volatility analysis as the highest rate of weight loss can be seen at the temperatures around 200–300 °C.
Figure 7a also shows that aqueous phase recycling considerably changed the thermal behavior of the bio-crudes as C1 and C8 contained a higher mass of heavier fractions with respect to C0 in the range of 100 to 200 °C. It clearly designates the accumulation of high boiling point components produced through the action of recycling. Cat-acetic acid bio-crude showed the same trend as other bio-crudes from recycling. At extreme temperatures (800 °C), almost 10–15% of heavy residue was detected from all the bio-crudes except Cat-K
2CO
3, which carried around 25% of the non-volatilized fragments.
3.5. Compound Composition of Bio-Crude
GCMS analysis was performed for the identification of organic compounds in the bio-crude at 300 °C. The GCMS has only described the partial information of the TGA, as almost 60% of the bio-crude was analyzed. The chromatogram detected a total of 200 compound peaks from which 35 to 40 peaks covered more than 50% of the area. However, the smaller peaks with lower probabilities caused great difficulty for the identification of the particular functional group of the compound. Irrespectively, the heteroatoms, such as nitrogen and oxygen, were quite distinctly visible from these chromatograms, and it is worth to separate them from hydrocarbons. In this context, the organic compounds are classified as N-containing compounds (N&O heterocyclic compounds and amides), Oxygenated compounds (ketones, alcohols, acids, and esters, etc.), and Hydrocarbons.
In
Figure 8a, the bio-crude C0 contained around 24% of the N-containing compounds, which were exceeded up to 53% and 48% in the C5 and C8, respectively. These N-containing compounds were extensively increased due to two possible reasons: (1) high concentration of proteins in the feedstock and (2) the addition of surplus nitrogen from the aqueous phase during recycling.
For further verification, it can be seen from the chromatograms in
Figure 8b that the peak area of N&O heterocyclic compound [RT: 13.06 min, 4-Piperidinone-2,2,6,6-tetramethyl] was increased with consecutive recycling due to higher degree of Maillard reaction between the polysaccharides (carbohydrates) and amino acids (proteins) [
39]. Interestingly the amides remained in the same range 6 to 9%. These amides originated purely from the acylation reaction of fatty acids with amines [
40].
Here,
Figure 8b also represents the formation of new N-containing compounds in C5, such as: [RT: 14.88 min, N-Nitro-N-N-pentamethyleneguanidine] and [RT: 16.36, 2-Propen-1-amine, N, N-bis (1-methyl-ethyl)]. No larger peaks of N&O heterocyclic compounds were detected in Cat-acetic acid bio-crude; on the other hand, higher amides, particularly [RT: 27.11 min, 9-Octadecenamide-Z] were observed. As a result, Cat-acetic acid bio-crude contained only 32% of the N-containing compounds with the majority of oxygenated compounds. In all bio-crudes, hydrocarbons were accounted for 10 to 20%. According to Abdelmoez et al. [
41], the acidic environment facilitates the decomposition of protein. From this statement, it can be hypothesized that acetic acid might change the reaction pathway of the amino-acids to amides by the reaction with fatty acids, instead of interacting with polysaccharides to form N-heterocyclic compounds. Earlier, Biller et al. also reported higher amides while using formic acid as a catalyst with different types of microalgae [
42]. Straight long-chain compounds like hexadecane, originating via decarboxylation reactions from saturated fatty acids [
14]. The few aromatic compounds, such as p-cresol and phenol, were observed in smaller magnitudes, which were conceivably formed by the dehydration and cyclization reactions of cellulose [
43], as given in
Table 6. From these results, it can be deduced that recycling of aqueous phase is beneficial for the bio-crude yield, but at the same time, it increases the heteroatoms, especially the nitrogen content, which requires hydro-treatment to meet the standards of drop-in fuels.
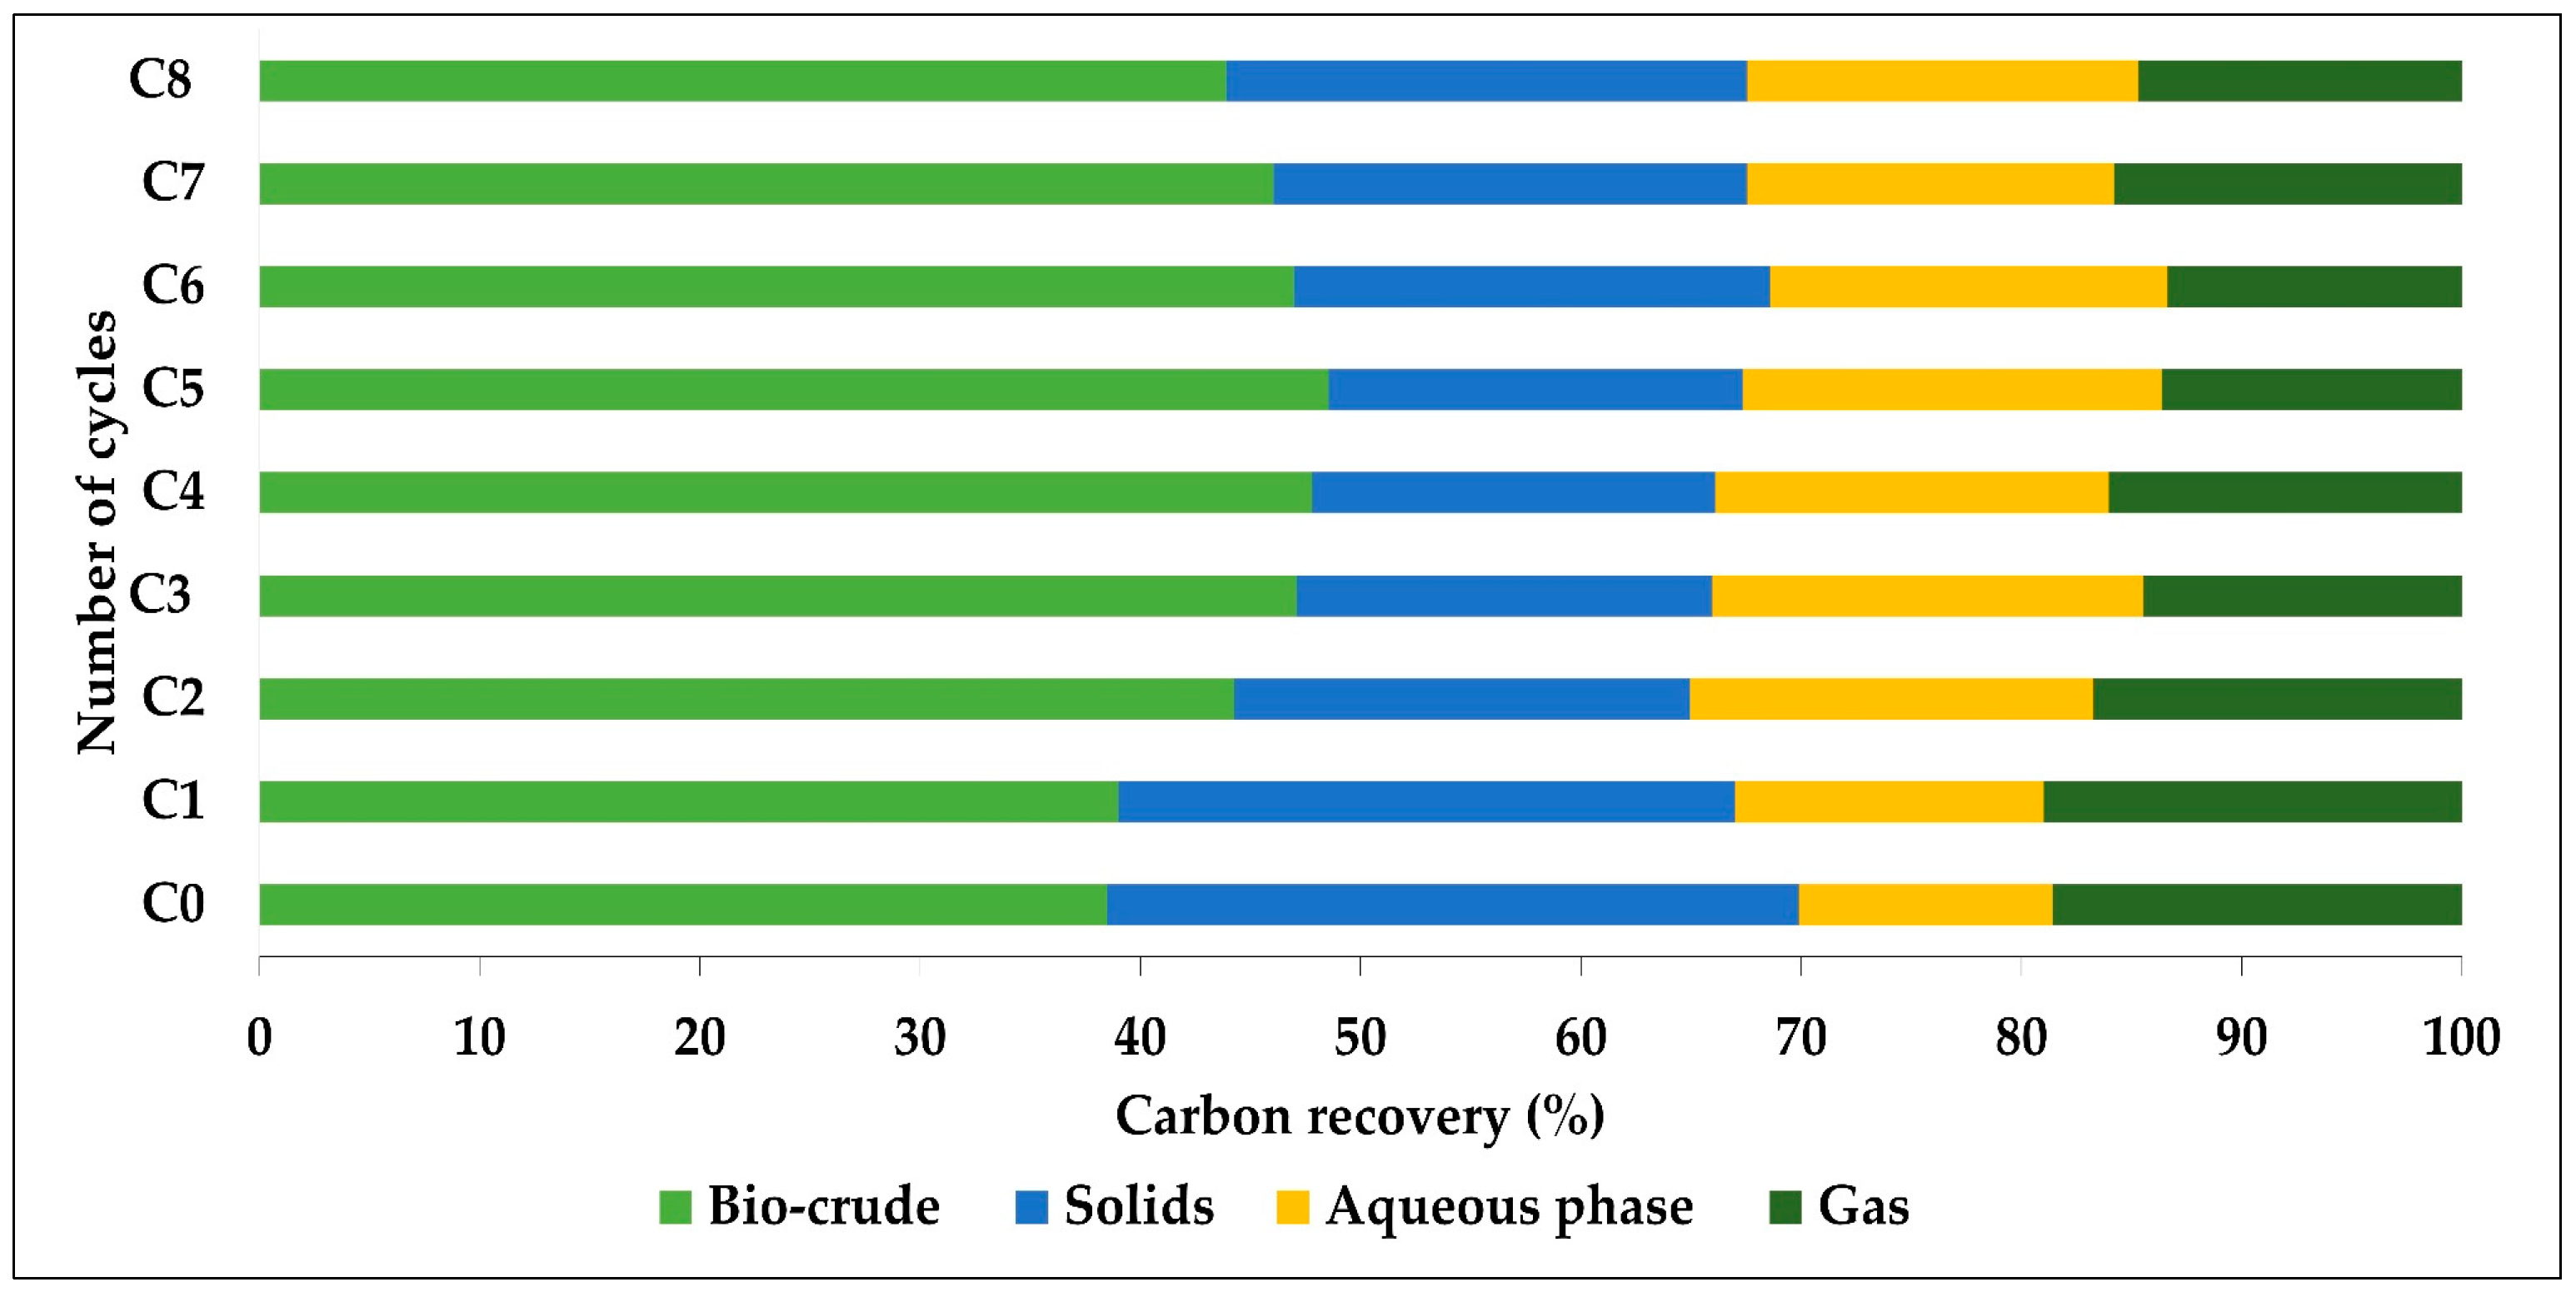
3.6. Carbon Recovery (CR)
The CR in the products was determined by the formula as the ratio of carbon in the product to the carbon in the SS, multiplied by the yield of the product. For the aqueous phase, the CR was calculated by the TOC values [assuming, water in = water out (mL)]. For the recycling experiments, the extra carbon from aqueous phase recycling was also taken as the input carbon along with the carbon in the feedstock, as given in Equation (5). Here, the aqueous phase carried 10 to 19% of the carbon, out of which almost 45% of the recovered carbon from each cycle was recirculated back with the feed to the HTL.
Figure 9 represents that carbon was mainly distributed in the bio-crude and solid phase. With consecutive recycling, the CR in the bio-crude was increased from 34 to ~46. This increase is strongly associated with the substantial rise in bio-crude yield, although the comparable values for carbon and hydrogen contents were detected by the elemental analyzer. The CR in the solids was almost consistent in the range of 22 to 29%. Slightly lower carbon in the gases was estimated with recycling, which may be due to condensation of light fractions to aqueous phase or bio-crude.
3.7. Characterization of the Aqueous Phase
The earlier sections highlighted that the recycling of the WSO from aqueous phase has a huge role in increasing bio-crude yield. Thus, the organic composition of the aqueous phase was analyzed by GCMS. Therefore, two separate runs were carried out to produce a sufficient amount of the aqueous phase. The aqueous phase produced from the second recycle C2 was selected for the characterization. The compounds listed in
Table 7, covered 60% of the total 70% of the area. For further validation, the chromatogram is also presented in
Figure S3 (Supplementary material).
The aqueous phase contained the majority of the N-containing compounds, such as [RT: 12.74, 2,5-Pyrrolidinedione, 1-methyl-], which resulted from the Maillard reaction. Some light short-chain acids, such as Acetic acid, and Pentanoic acid, 4-methyl, were also detected, these acids may have originated from the hydrolysis and dehydration of cellulose. The small chain water-soluble acids serve as a precursor for bio-crude and become part of the aqueous phase [
20,
25]. In another study, Madsen et al. quantitatively characterized the aqueous phases from the modal biomass components and found a higher concentration of acetic acid (2600 mg/L) in pure proteins due to deamination of the amino acid (glycine) as compared to carbohydrates (1700 mg/L) [
44]. Therefore, it is still challenging to predict the exact pathway for the formation of acetic acid. Acetamide was formed by the reaction of acetic acid and ammonia (liberated from the deamination of amino acids) [
16]. In short, the compound composition of the aqueous phase replicates the overall biochemical composition of the SS.
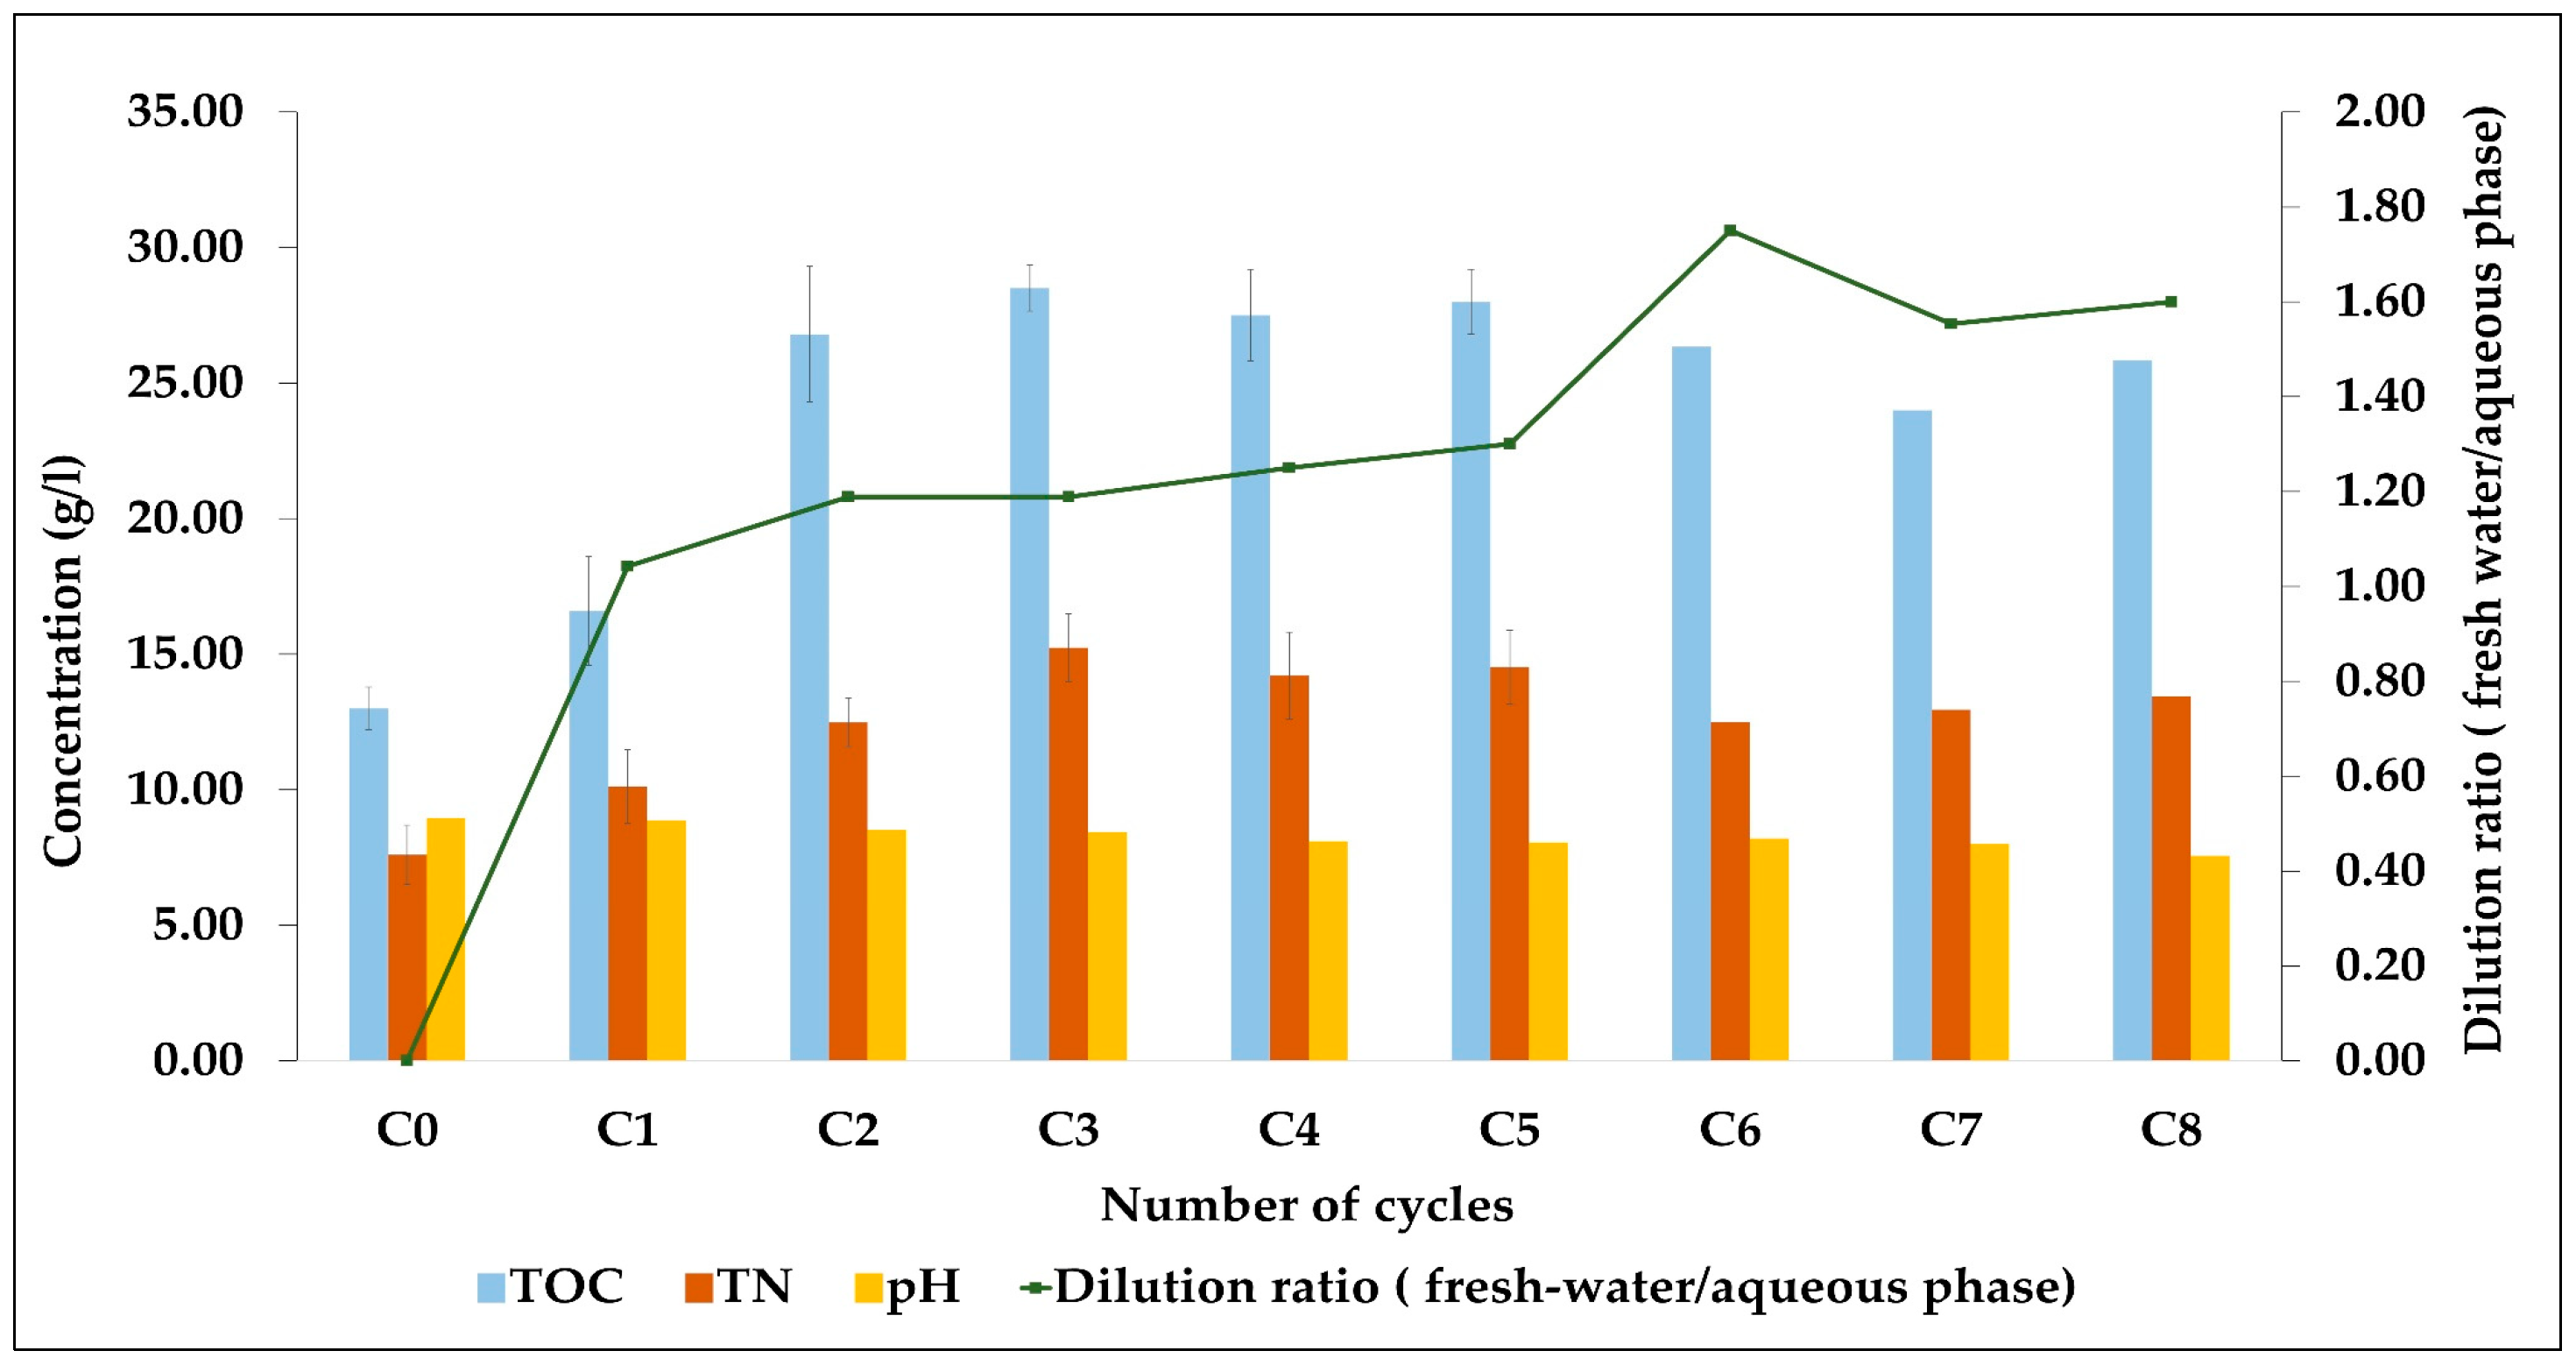
With successive recycling rounds, the TOC and TN values were both increased by 2.6 and 2 times, respectively. The TOC value rose from 12.8 to 27 g/L at C5, which reflects that WSO has reached its equilibrium/steady-state, and no more organics are further dissolved in the aqueous phase. Slight lower TOCs at runs C6-C8 can be ascribed to higher dilution ratios. The same trend was observed in TN, as shown in
Figure 10.
The literature related to water recirculation studies shows the continuous increase in TOCs with successive recycling. Biller et al. observed the sharp rise in TOC from 25 to 90 g/L after nine recycles [
28]. Similarly, Pedersen et al. has also noticed the high increase in TOC from 54 to 136.2 g/L after three recycles on continuous pilot-scale plant [
26]. In our case, the TOC level gradually rose from 12.8 to 26–29 g/L after eight rounds. This is quite understandable because here, we have diluted the aqueous phase, as water dilution slowly increases the TOC level unless it reaches the steady state. Secondly, the continuous plant scale results are difficult to compare with laboratory-oriented batch scale experiments. The overall pH values were found in the range of 8.80 to 7.56, the slight decrease in pH was noticed, which is correlated with an increased concentration of acetic acid with continuous recycling. Nevertheless, all the pH values displayed in the alkaline range. The aqueous phases from catalytic runs Cat-acidic acid and Cat-K
2CO
3 had pH values 5.86 and 8.96, respectively, owing to their high concentration of H
+ and CO
3− ions.
The weight of the inorganics in the aqueous phase was also quantified. The 4 mL sample was placed in the furnace at 600 °C for 4 h at 5 °C/min ramp. The difference was noted down, and the remaining material was counted as the weight of the inorganics. It was found that the inorganic content in the aqueous phase increased from 0.53 to 0.79% for C0 and C2, respectively. This infers that during the recycling, not only organic matter is transferred to the aqueous phase, but some fractions of inorganics are also contributed in the aqueous phase. This finding is further supported by ICP-AES results in
Figure 11; where we could see more amount of potassium and sodium in the aqueous phase at recycle C5 as compared to C0.
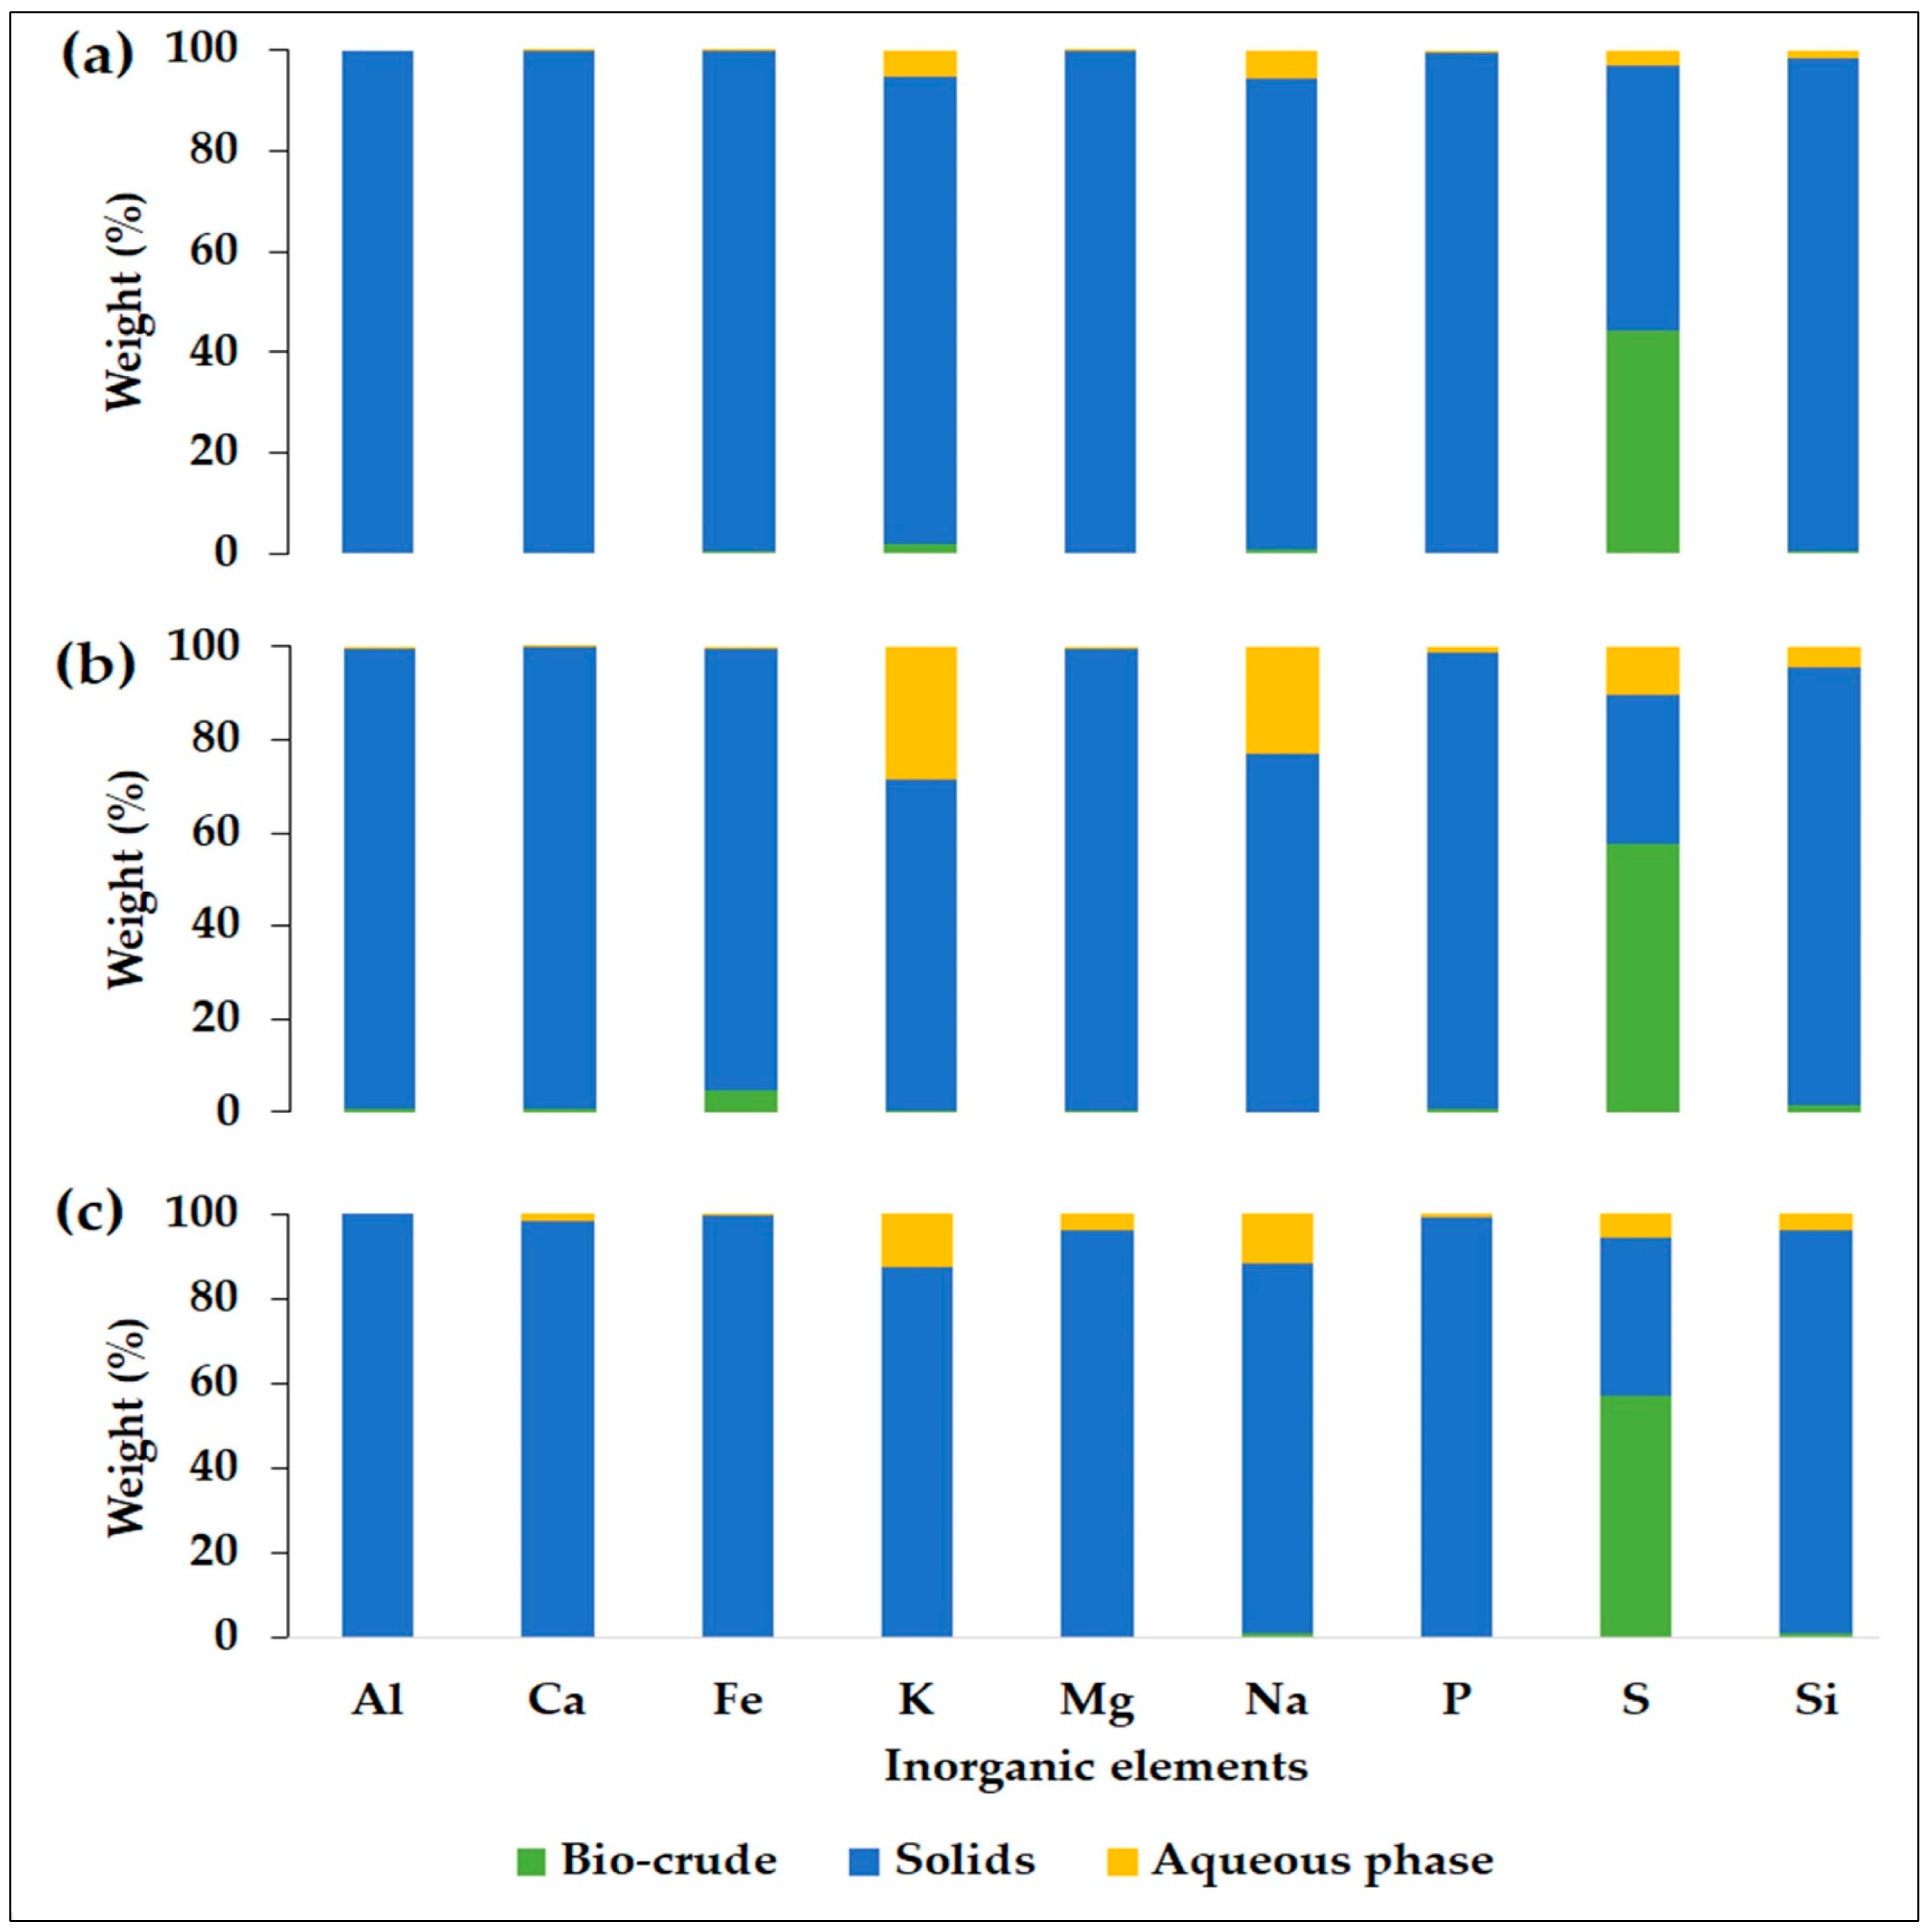
3.8. Distribution of Inorganic Elements
To assess the effect of aqueous phase recycling on the distribution of inorganics in the products, a total of nine inorganic elements were detected through ICP-AES. The (weight %) of each element was calculated by multiplying the concentration of each inorganic element to the weight of each product. For a single inorganic element, the distribution was normalized with respect to the total amount of inorganic element obtained in all phases, as bio-crude, solids, and aqueous phase. The level of quantification was (0.01 mg/kg) for all elements.
Figure 11a shows the distribution in the baseline run (C0); almost 99% of the mass of Al, Ca, Fe, and Mg was migrated to the solid phase. The potassium and sodium were transferred 5 to 6% to the aqueous phase, whereas 40% of the sulfur was observed to the bio-crude. This may be due to the cleavage of sulfur-containing organic compounds in the feedstock.
Huang et al. reported in his review article related to liquefaction of SS that irrespective of temperature conditions, the majority of inorganic elements concentrated into the solids phase [
45]. From recycle C5, the solid phase contained the majority of the inorganic elements, except potassium and sodium, which went around 20% and 16% in the aqueous phase, respectively. This is quite logical because continuous recycling of the aqueous phase builds up higher amount of inorganic elements that disintegrated from the original feedstock, as illustrated in
Figure 11b. Earlier, Pederson et al. already confirmed the accumulation of ash from 5 to 12% in the aqueous phase with recycling rounds from co-liquefaction of wood and glycerol [
26]. However, sulfur was distributed in all three phases. This sulfur could assist in the hydrotreating process for the catalytic upgrading of bio-crude, especially for sulfided CoMo and NiMo catalysts [
46].
Figure 11c shows more or less the same distribution in Cat-acetic acid as the baseline experiment. Again, a higher amount of sulfur was observed in bio-crude. This may be due to the catalytic action of acetic acid on the degradation of polysaccharides containing sulfur in the ring structure. In the recent past, Conti at al. has already investigated the distribution of inorganics from willow in supercritical water and reported a significant amount of alkali metals in the aqueous phase and 50% of the sulfur in the bio-crude [
33].
In a broader context, one interesting outcome was found; the solid phase contained the majority of the phosphorus in all three conditions, which means that the migration of phosphorus was not affected by the recirculation of aqueous phase or catalytic action of acetic acid. This phosphorus has existed in the form of phosphates with its other allied elements Al, Ca, Na, and K, which were also present in higher concentrations in the feedstock. This significant amount of phosphorus could unlock another gateway for the utilization of the solid phase as a fertilizer for the cultivation of biomass.
4. Conclusions
In this article, the valorization of aqueous phase generated from HTL of SS has been discussed in detail. Initially, SS was hydrothermally liquefied with and without catalyst (K2CO3). The results revealed that the alkali catalyst is proved beneficial for high carbohydrate-containing SS. Acetic acid was produced as a significant water-soluble product, and employed as a catalyst (0.56 M) to baseline conditions, which resulted only ~1.5% increase in bio-crude yield with slightly lower HHV (34.48 MJ/kg). In the second phase, the recycling effect of the aqueous phase was investigated, which resulted in a 50% increase in bio-crude yield and energy recovery. However, aqueous phase recycling also increased the nitrogen content in bio-crude from 4.3 to 7.1%. Furthermore, HPLC analysis revealed that the overall recycling effect of the WSO is responsible for the improvement of bio-crude yield.
In the whole scenario, aqueous phase recycling increases the bio-crude energy recovery, but at the same time, it imparts more heteroatoms in the bio-crude, which requires more energy and cost for hydro-treatment. Therefore, reduction of the heteroatoms should be a target of further recycling studies in the future, combined with techno-economic studies to estimate the pros and cons of post-HTL hydro-treatment versus nitrogen-reduction measures.

 and
and 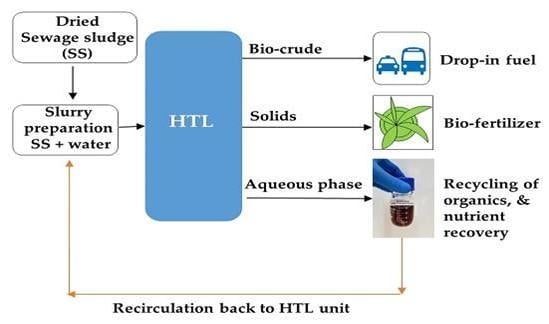


