Article

Techno-Economic Evaluation of Food Waste Fermentation for Value-Added Products

by
Noor Intan Shafinas Muhammad
1,2 and
Kurt A. Rosentrater
1,*
1
Agricultural & Biosystems Engineering Department, Iowa State University, Elings Hall, Ames, IA 50011, USA
2
Faculty of Chemical and Process Engineering Technology, University Malaysia Pahang, Lebuhraya Tun Razak, Kuantan 26300, Pahang, Malaysia
*
Author to whom correspondence should be addressed.
Energies 2020, 13(2), 436; https://doi.org/10.3390/en13020436
Submission received: 27 November 2019 / Revised: 30 December 2019 / Accepted: 13 January 2020 / Published: 16 January 2020
(This article belongs to the Special Issue Sustainability of Biorenewable Systems and Processes)

Abstract

:
Food waste (FW) is one of the most critical problems in the world. Most FW will be sent to landfills, generally accompanying some significant disadvantages to the surrounding environment. Fermentation is considered as another disposal method to deal with FW. In this study, using a techno-economic analysis (TEA) method, an evaluation of the economic impact of three different scenarios of FW fermentation is carried out. A SuperPro Designer V9.0 simulation was used to model a commercial scale processing plant for each scenario, namely, a FW fermentation process producing hydrolysis enzymes and featuring a 2-step distillation system, a FW fermentation process without enzymes, using a 2-step distillation system, and a FW fermentation process without enzymes, using a 1-step distillation system. Discounted cash flow analysis is used to estimate the minimum ethanol selling price (MESP), where the lowest MESP result of $2.41/gal ($0.64/L) of ethanol is found for the second aforementioned scenario, showing that, even without enzymes in FW fermentation, the product cost can be competitive when compared to the other scenarios considered in this study. This project thus reflects a significant positive economic impact while minimizing the environmental footprint of a commercial production facility.

Graphical Abstract

1. Introduction

Finding other options to reduce fossil fuel dependency is an exciting and challenging field of study. Ethanol has been identified to be one of the best options to substitute gasoline, with less of a negative impact on the environment. Therefore, increasing biofuel production has gained more attention globally.
There are mandates in most countries to support biofuel development and consumption. For example, in the United States, the Renewable Fuel Standard (RFS2), under the Energy Independence and Security Act (EISA), has set total renewable fuel production to increase by more than 100% from 2008 to 2022. Apart from that, cellulosic ethanol is predicted to be produced, where at least 16 million gallons is estimated to be produced in 2022 [1]. However, according to the Congressional Research Service (CRS) report, cellulosic biofuels have never met the mandate proposed by EISA. The shortage of a cellulosic ethanol supply in the market has been a reason for the Environmental Protection Agency (EPA) to reduce the mandated target in the future [2].
Food waste (FW) is categorized as one of the potential feedstocks of cellulosic biofuels. It is abundant, rich with nutrient, and has virtually no cost [3]. FW generation can be driven by various factors, such as population growth, level of income, modernization, safety policy, and human behavior [4,5,6]. In 2015, the United States had sent at least 76% of the total FW to the landfill, followed by 18.6% for incineration and 5.3% for composting [7]. FW composition is rich with carbohydrates, proteins, and lipids, which are easily decomposed by a microorganism, emitting greenhouse gases (GHGs) to the atmosphere. Methane gas (CH4) is one of the most potent GHGs, having a higher impact on global warming [8,9,10]. Furthermore, FW in landfill could contribute a significant impact on human health, ecosystems, diversity, land, and pollution, as found by previous researchers [11,12]. Additionally, FW also has a negative impact on the economy. For example, a larger area for the disposal site is required to load this waste, and the cost is significantly higher than in an urban area. Other than that, the tipping fees are expensive, based on the distance from the collection area and landfill area [7,13,14,15,16].
Various studies related to FW analyses from university dining centers have been reviewed for this study [17,18,19,20,21], and Figure 1 shows the average values of FW composition described in these studies. Even though the studies were performed in different regions, the results indicate glucose to be a principal component in FW, followed by starch. Glucose is a fermentable sugar that can be directly consumed by Saccharomyces cerevisiae and converted into ethanol under anaerobic conditions. This type of yeast is widely used in the corn ethanol industry, because it has a higher specific growth rate and productivity [22].
Because of its composition, FW is considered a potentially useful source for producing ethanol, and there are a few studies related to using FW fermentation in producing biofuels. The authors of [23] used dilute acid and hydrothermal conditions to hydrolyze FW before the fermentation process in order to obtain a maximum ethanol yield of 0.42 g/g of FW. Another study by Uncu and Cekmecelioglu [24] achieved an optimum ethanol yield of 0.16 g/g of dry matter using enzymatic hydrolysis (e.g., α-amylase, amyloglucosidase, cellulose, and β-glucosidase) in the yeast fermentation process. That study showed the desirability of pre-treatment by either chemical or thermal means to enhance ethanol production, but such pre-treatment was unfortunately identified as being cost-intensive [25]. For example, hydrolysis by dilute acid involves higher temperatures and pressures, increasing the utility and capital cost for a downstream neutralization system. Furthermore, enzymes are expensive, require more retention time, and have the potential to inhibit yeast fermentation [26].
Alternatively, FW fermentation without chemical and thermal pre-treatment has been found to be a potentially attractive approach. Muhammad [27] performed an experimental study and achieved a maximum ethanol yield of 2.2% (w/w) on a wet basis from FW fermentation without using any hydrolysis enzymes. This finding is higher than the result reported by Suwannarat and Ritchie [28], given as ~1.5%, under the same feedstock and fermentation conditions.
Although there have been various studies to evaluate the potential of FW as ethanol feedstock, there have been no extensive studies on the full economic impact of such a process on a commercial scale [29], so the focus of this study is to evaluate the economic impact of ethanol production from a FW process based on the three different scenarios illustrated in Figure 2, Figure 3 and Figure 4. Scenario A uses the fermentation conditions described in a study by Uncu and Cekmecelioglu [24], while scenario B uses the experimental results found by Muhammad [26]. In scenario C, the ethanol conversion rate was similar to that of scenario B, but with a modification to the separation system. Ethanol was considered to be the main product, while waste from the process was considered a co-product, because both liquid and solid waste from the fermentation process have a resale value when used as organic liquid and bio-compost soil fertilizer. Since this waste also comprises a valuable nutrient that could enhance water retention in soil and provide carbon sequestration when used in the agricultural industry, liquid fertilizer and bio-compost could be expected to have a significant impact on the product value of ethanol.

2. Methodology

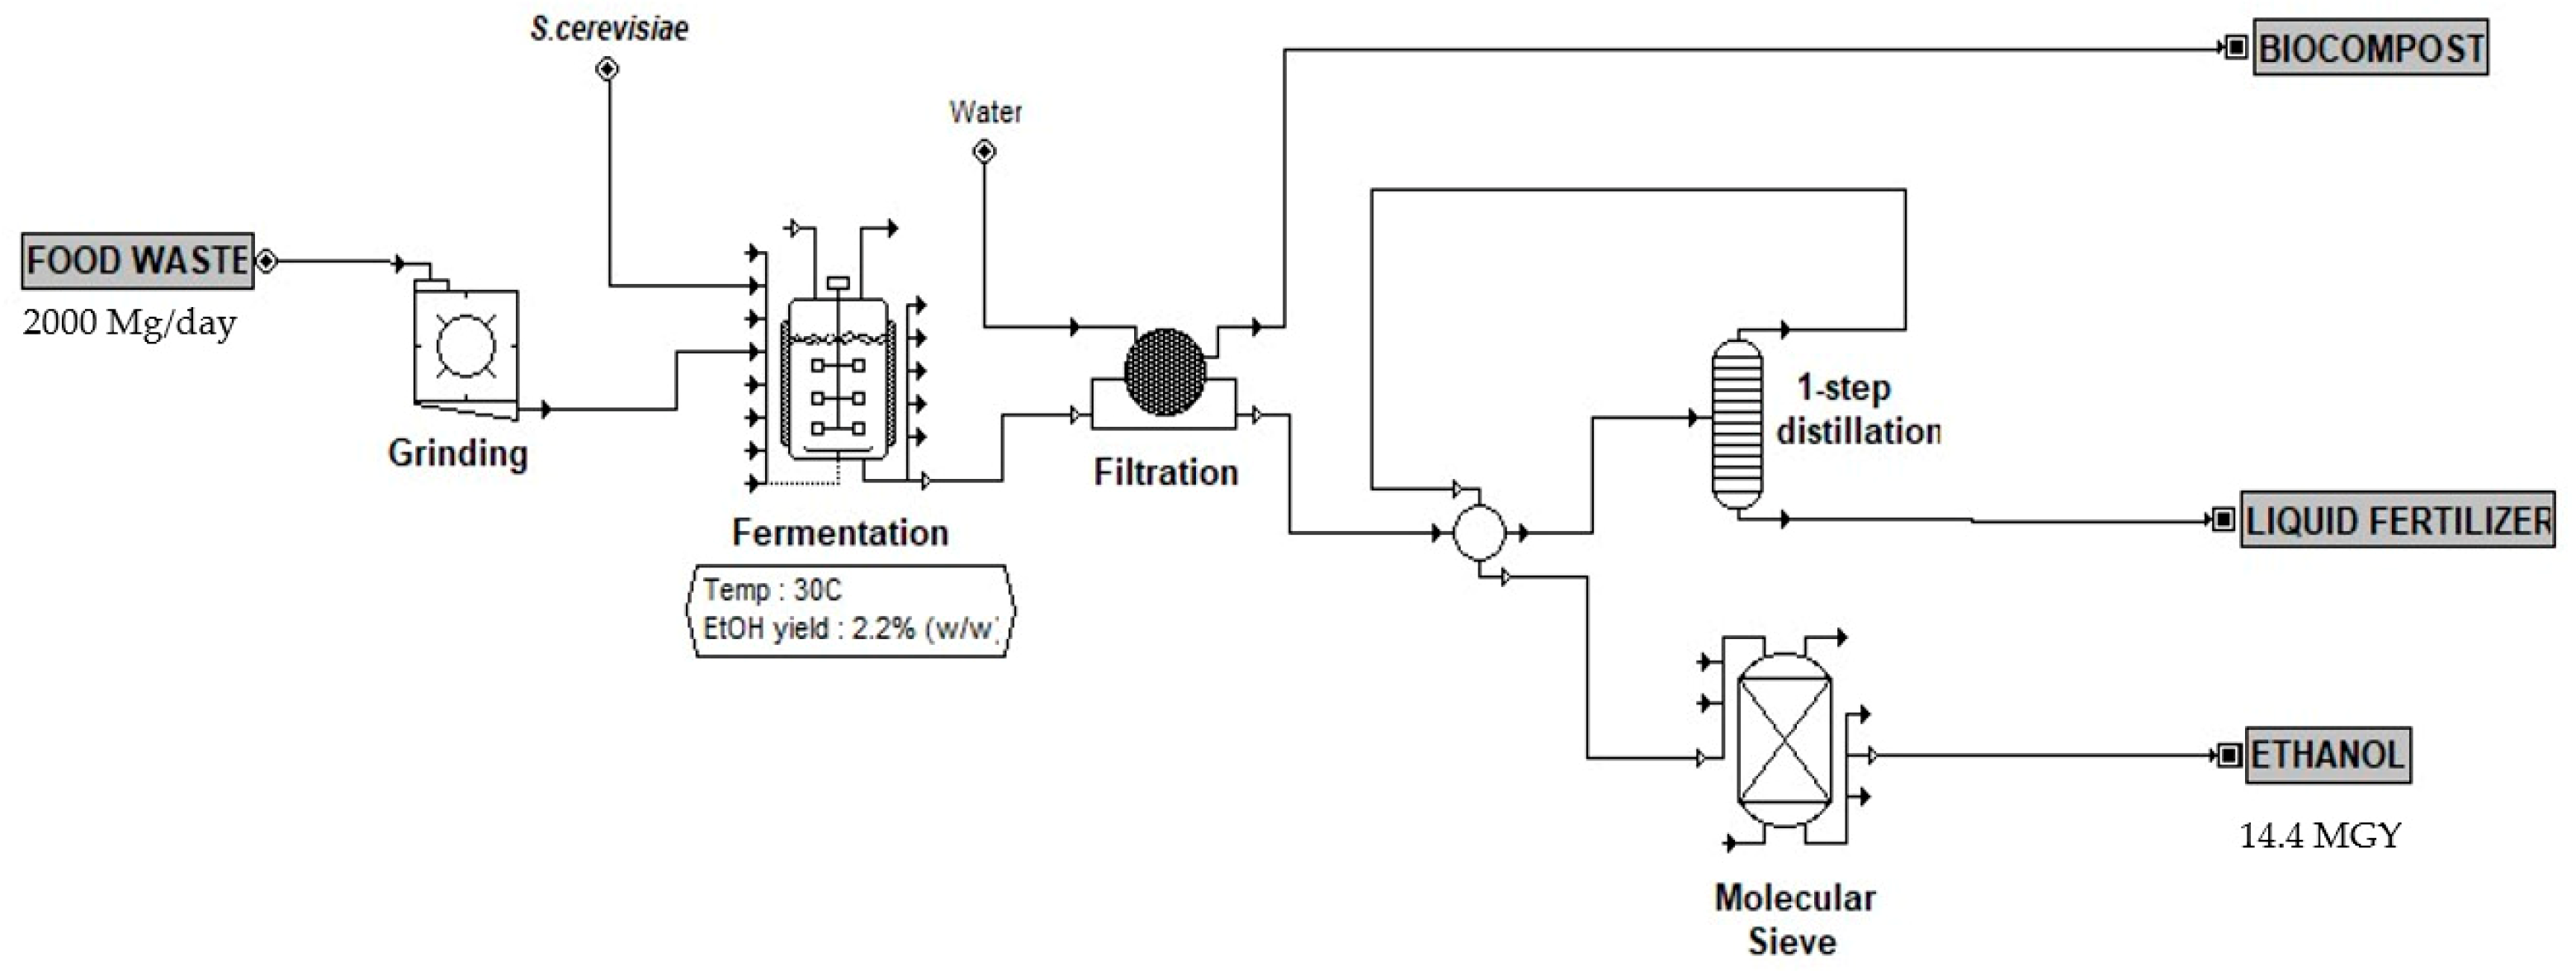
2.1. Process Modeling

The conceptual process model for a FW fermentation ethanol plant was simulated using SuperPro Designer V9.0 (9.0, Intelligen, Inc., Scotch Plains, NJ, USA). In this study, FW was assumed to have 78% moisture content, with 45% glucose, 19% starch, 5% fiber (wet basis), and other trace elements. The plant feedstock was supposed to be 2000 Mg/day. At present, FW was expected to have no cost for feedstock. The waste stream from the conversion process was considered as a by-product, as mentioned in the previous section. In this conceptual simulation process, liquid and solid waste were separated using rotary filtration. The recommended moisture content of bio-compost was in the range of 40–60% by weight [30,31]. Therefore, in this study, bio-compost was maintained to have a moisture content of 40% by weight in order to limit microbial activity.
Distillation is the common practice of separating ethanol from fermentation, followed by a purification process through a molecular sieve. In this study, there are two different separation systems that use a distillation column that have been designed. For scenarios A and B, a double distillation column setup was used. The first column is known as a beer column, while the second column is combination between the stripping and rectifying columns. Additionally, scenario C, with one-column distillation, was conducted to evaluate the energy demand and cost requirements compared to scenarios A and B. The process flow diagrams for scenarios A, B, and C are shown in Figure 2, Figure 3 and Figure 4, respectively.
The mass and energy balance from the simulation model was used to size and quantify the equipment in the process. The total purchased equipment cost was taken from the software that was indexed to 2018 dollars. The plant had approximately 7900 operating hours per year.

2.2. Techno-Economic Assumptions

Techno-economic analysis (TEA) is used here to assess the potential of commercial-scale plant FW to produce ethanol. The methodology for capital cost estimation was adapted from Peters et al. [32]. The installation factor for this study was 3.02, as it is a common factor for biorenewable facilities. The working capital cost was calculated from 15% of the fixed capital cost. The logistics of feedstocks are important to determine economically viable. According to Poliafico and Murphy [33], a possible economic distance should be in the range of 9–16 miles (15–26 km). Thus, in this study, 12 miles (19 km) was used to calculate the transportation cost, which contributes to the overall variable cost.
The discounted cash flow analysis was performed to evaluate the factory-gate price or known by minimum ethanol selling price (MESP) ($/L). This value represents the lowest price for selling the ethanol to generate a net present value (NPV) of zero for the pre-determined internal rate of return (IRR). The IRR value was set to 10% to allow the ethanol product cost to have a competitive price in the market [34]. The working capital was assumed to be 15% of the fixed capital investment. The capital and operational costs were taken from SuperPro V9.0 and used in the discounted cash flow analysis. Total project investment (TPI) was the total of the capital, direct, and indirect costs.
Most of the financial assumptions have been adapted from National Renewable Energy Laboratory (NREL) reports [35,36,37,38,39]. Table 1 shows the main economic parameters used in the discounted cash flow analysis to determine MESP, as adopted from the previous literature.
For scenario A, enzymatic hydrolysis was used in the fermentation process to enhance the ethanol yield. Due to limited information on the exact price of industrial enzymes, an assumption was made, where the enzyme cost would be similar to the cost from the corn ethanol industry, which is equivalent to 3.35¢/gal (0.9¢/L) ethanol, in order to improve the meaning of the presented idea [40].
As mentioned previously, waste streams from the plant (e.g., liquid and solid) could potentially be used as organic fertilizer for the agricultural industry. It was assumed that there was an available market to sell this product. Therefore, by considering selling all products, this was expected to optimize the operational profit. The bio-compost was assumed to have a resale value of 8¢/lb (18¢/kg), based on the average organic fertilizer price in Iowa [41]. The liquid fertilizer selling price was considered via a conservative assumption, which was 30¢/gal (8¢/L), although, in the real market, this could be higher.
Labor cost was considered as one of the major fixed operating costs. It was calculated from the number of operators required per equipment, as listed in Table 2.

2.3. Sensitivity Analysis

Sensitivity analysis was performed by changing one parameter value while holding all other parameters constant. This approach is important when identifying key variables that have high an impact on the MESP value (our key dependent variable). In this analysis, plant capacity (Mg/day), plant distance (km), fixed capital cost ($), ethanol yield (%), enzymes price (¢/L), liquid fertilizer (¢/L), and the bio-compost (¢/kg) credit value ($/L) were selected for evaluation. The price range for bio-compost was taken from national compost price [41] The enzyme price range was assumed to be from zero cost to 18¢/L ethanol, as found by Klein-Marcuschamer et al. [42]. For the other variables, a range of ±30% was used to estimate the MESP ($/L) from an optimistic, base case, and pessimistic point of view for each case, as suggested by previous studies [34,35,43]. Additionally, the effects on an IRR of 10%, percent of equity with an 8.25% interest rate, and a ten-year loan, were also examined in order to understand their impacts on the MESP. All selected parameters for the sensitivity analysis are shown in Table 3.

2.4. Economies of Scale

Economies of scale are an essential tool for businesses to look at the reduction of unit costs by increasing production capacity. The main effect of economies of scale is to achieve the optimum plant capacity with the minimum cost of production. In this analysis, the FW rate value was designed from 10 Mg/day to 5000 Mg/day in order to project how price would change according to the expanding feedstock value.

3. Results

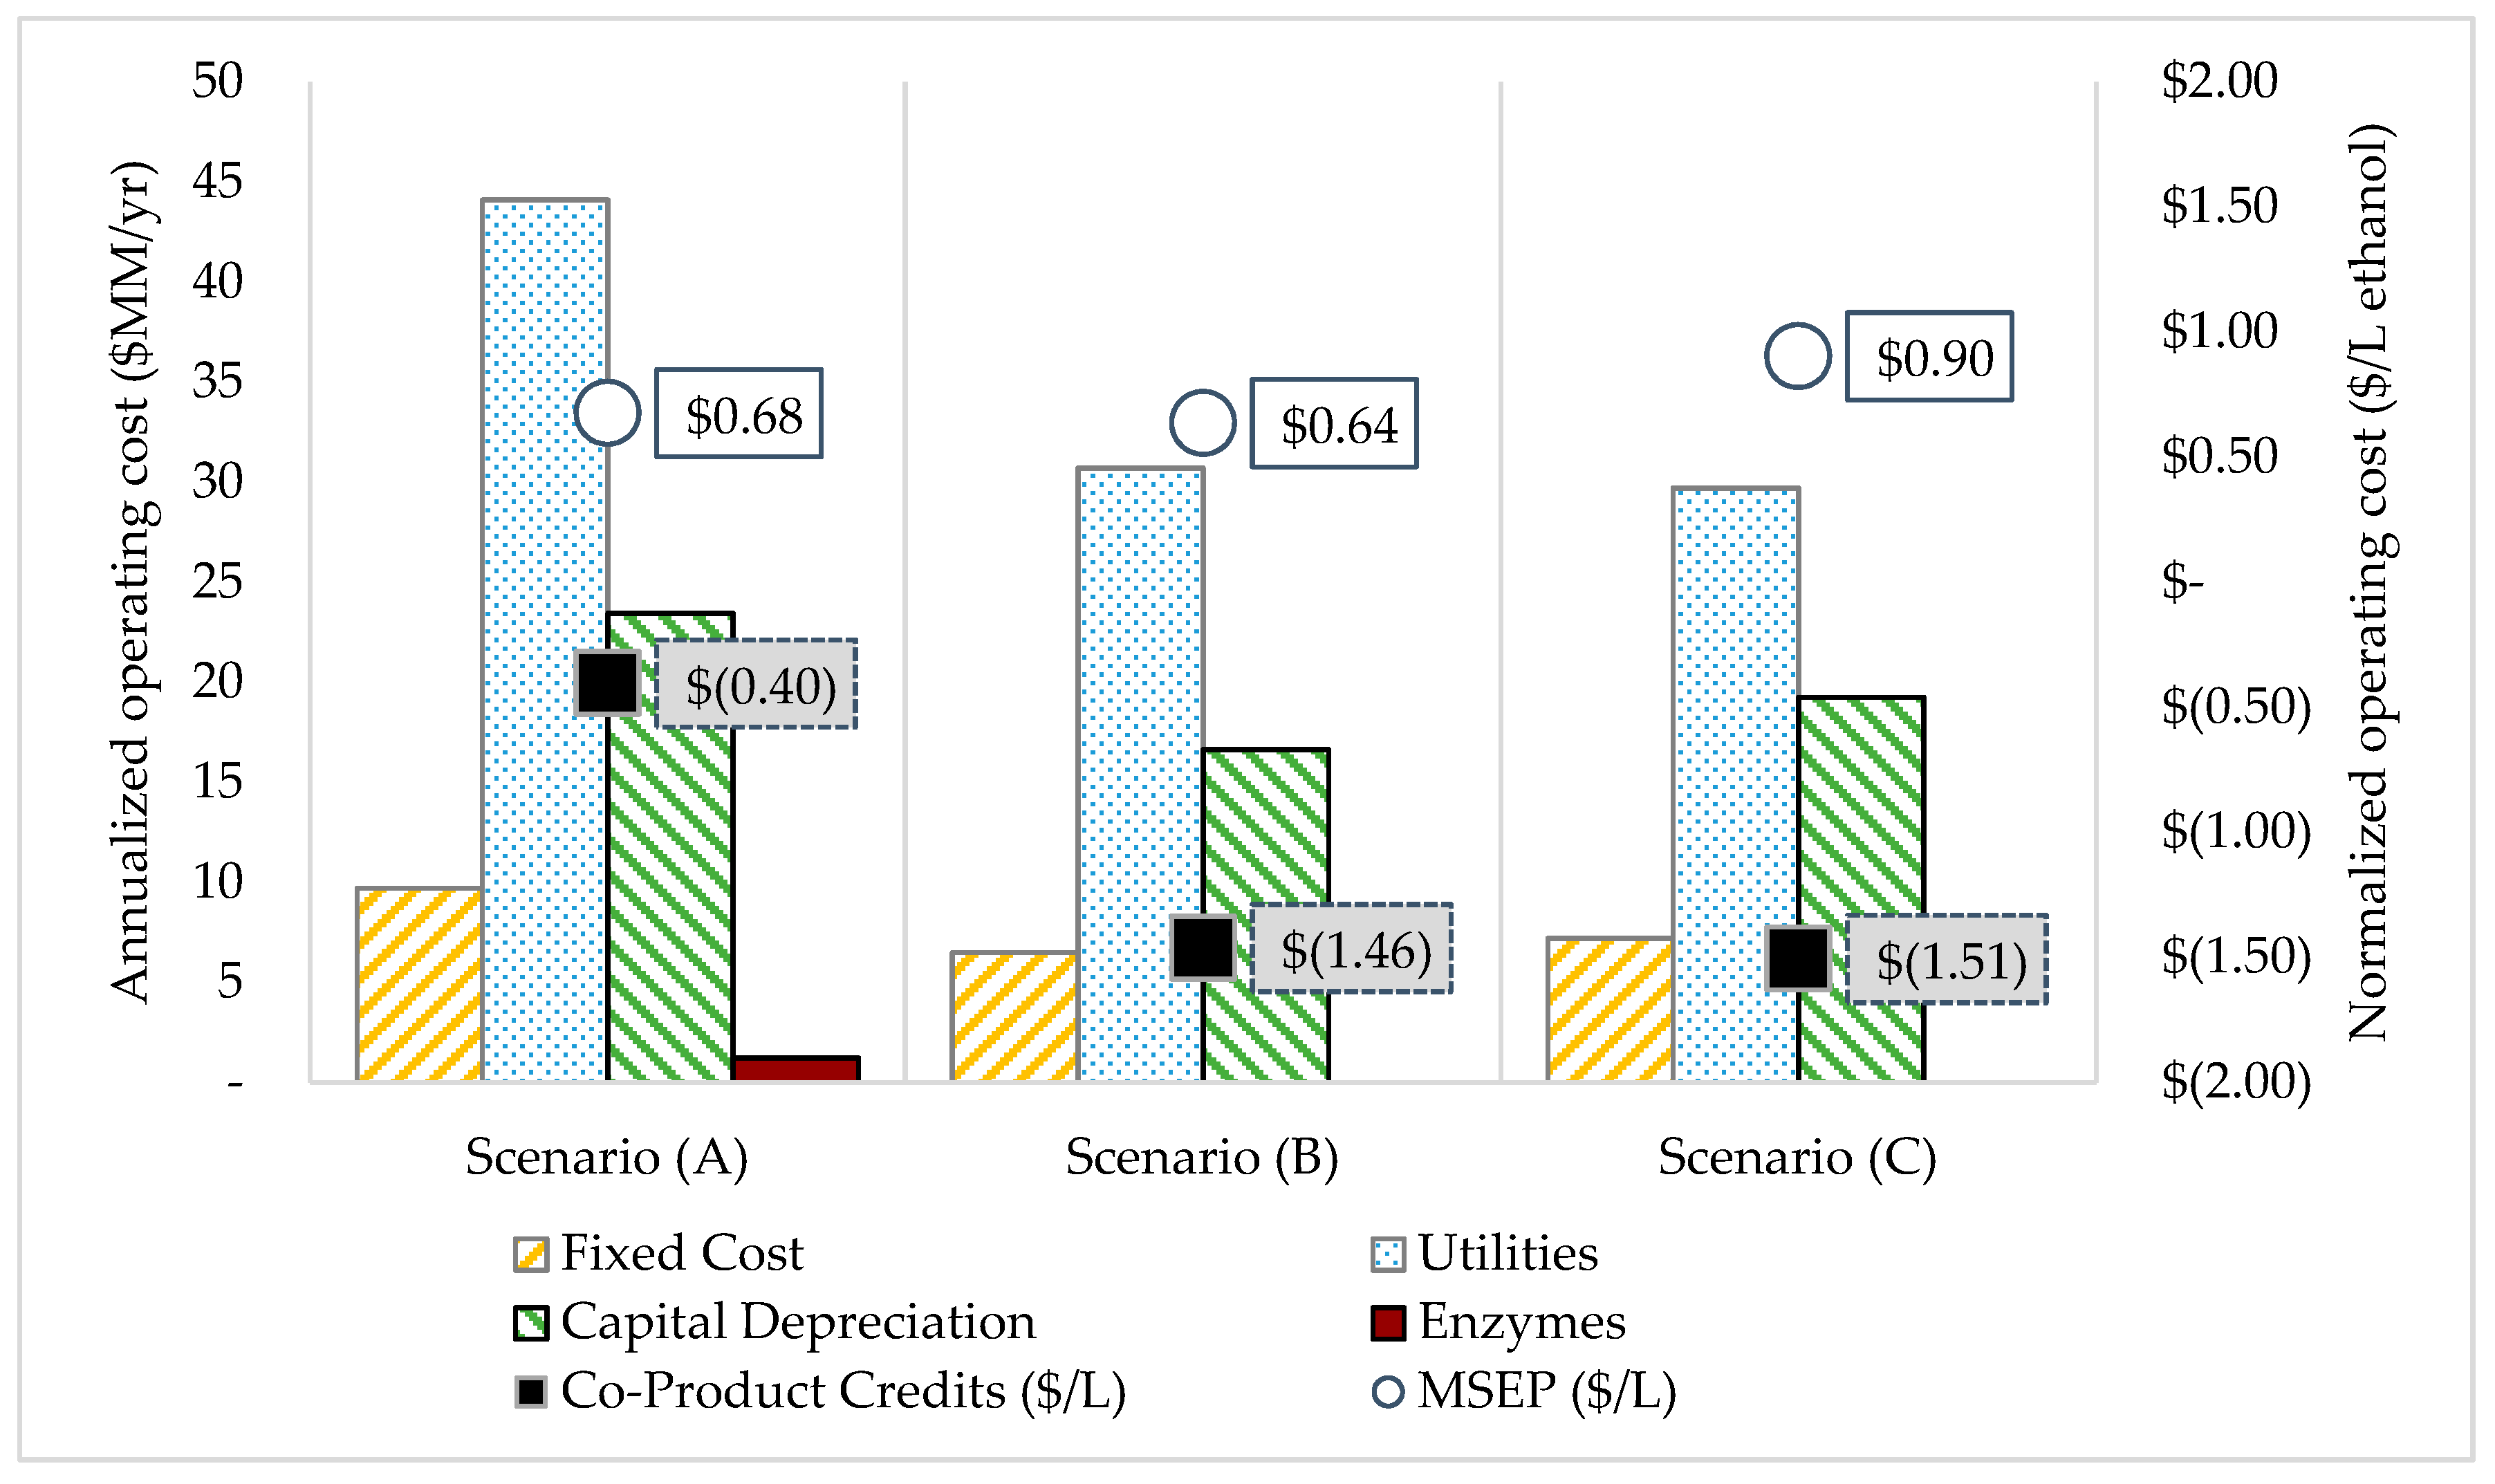
3.1. Economic Analysis

The capacity of this plant was designed with 2000 Mg/day of FW for all three scenarios. The mass balance obtained from the conceptual plant simulation shows that case study B presents a higher amount of ethanol production, as expected. Table 4 shows the total installed equipment cost (TIEC), total project investment (TPI), annual utility cost, ethanol production (MGY), and minimum ethanol selling price ($/gal) for scenarios A, B, and C, as estimated from the SuperPro simulation.
Scenario A had a higher in TPI and utility cost compared to the other scenarios. This was because, in this simulation, there were two additional unit operations to convert starch into fermentable sugar, as shown in Figure 2. These unit operations required different temperatures, which were 95 °C and 55 °C, which were used for the liquefaction and hydrolysis processes, respectively. In fact, here, the heating and cooling systems required more energy as compared to the other scenarios, thus leading to a higher annual utility cost. Utilities represent the process inputs of heat transfer agents, electrical power, and water. The heat transfer agents in this processing plant were chilled water, cooling water, and steam. For power demand, standard electrical prices were used when considering the power required to supply energy and operate the equipment. The price for each unit energy was obtained from [44] and used in the SuperPro Designer V9.0 software. Even though ethanol production was higher compared to the other scenarios, it did not have an impact in decreasing the MESP value.
In a separation distillation column, there are two columns commonly used to gain a higher purity of ethanol from the fermentation broth. The first column was designed to yield 55% (v/v) ethanol in the distillate, while the second column was a combination of stripping and rectifying systems, giving a yield of 95–96% (v/v) ethanol. Scenario C was designed with one-column distillation, as illustrated in Figure 4. This method was used to assess the cost impact of a one-column distillation process for low concentration ethanol product. However, the distillate from the column required more units of the molecular sieve to purify ethanol up to 99% (v/v). Therefore, scenario C required a higher TPI than scenario C, even though the ethanol yield was similar. This result shows that one-column distillation is not economically viable.
Three major cost areas were used in the discounted cash flow analysis to estimate the MESP ($/L): Total project investment (TPI), variable cost ($/y), and the fixed operating cost ($/y). Variable cost consists of the raw materials cost, transportation cost, and utility cost, while the fixed cost consists of the operating labor cost, laboratory cost, overhead, maintenance, local taxes, and insurances. The operating labor cost was wages for the people who manage and operate the plant, which estimated from the number of operators per shift, as listed in Table 2. Generally, a unit operation involved with heat is more complicated and will require more operators to operate and maintain the operation. Therefore, a plant which has more unit operations is anticipated to have a higher value for the fixed cost.
Figure 5 shows the annual ($ MM/y) and normalized operating costs ($ MM/L ethanol) for all scenarios. Here, the operating costs are the expenses used by plant operation on a continuous process, which are associated with variable and fixed costs. From the graph, it shows that scenario A had the highest operating cost and capital depreciation compared to the other scenarios. This is due to more unit operations and the additional cost of enzymes.
As defined in the chemical engineering literature, the MESP is the lowest ethanol cost capable of yielding an NPV of zero with a 10% IRR [34]. Higher production yield was not the critical factor that could influence the final product price here. All costs incorporated with the process plant operation were counted to estimate the MESP. Even though ethanol yield was higher in scenario A, the estimated MESP value was 6.2% higher than in the case of scenario B. This finding indicates that, even without enzymes, FW has the potential to produce ethanol with a lower MESP value. For scenario C, the MESP value was the highest compared to others, due to a higher TPI but lower ethanol yield, as mentioned before.
According to Karmee [29], bioethanol production using a reaction process without any prior process could make the whole process more cost-effective. While a lot of studies have examined ethanol production from waste products, none of them provide findings like those found in this research study. The estimated MESP heavily depends on the type of feedstock, plant capacity, process conversion, and economic assumptions. For instance, in a study by Ro et al. [45], the MESP ranged from $2.24–2.96 per gallon ($0.60–0.78 per liter) when using livestock, agricultural, and forest residue, with a plant capacity of 50 MGY when using syngas fermentation. In addition, Toa et al. [39] found that the MESP from corn stover was $2.15 per gallon ($0.57 per liter) when using a biochemical conversion process. Based on this comparison, the findings from this study are not too far from others, even though a different feedstock and process were used.

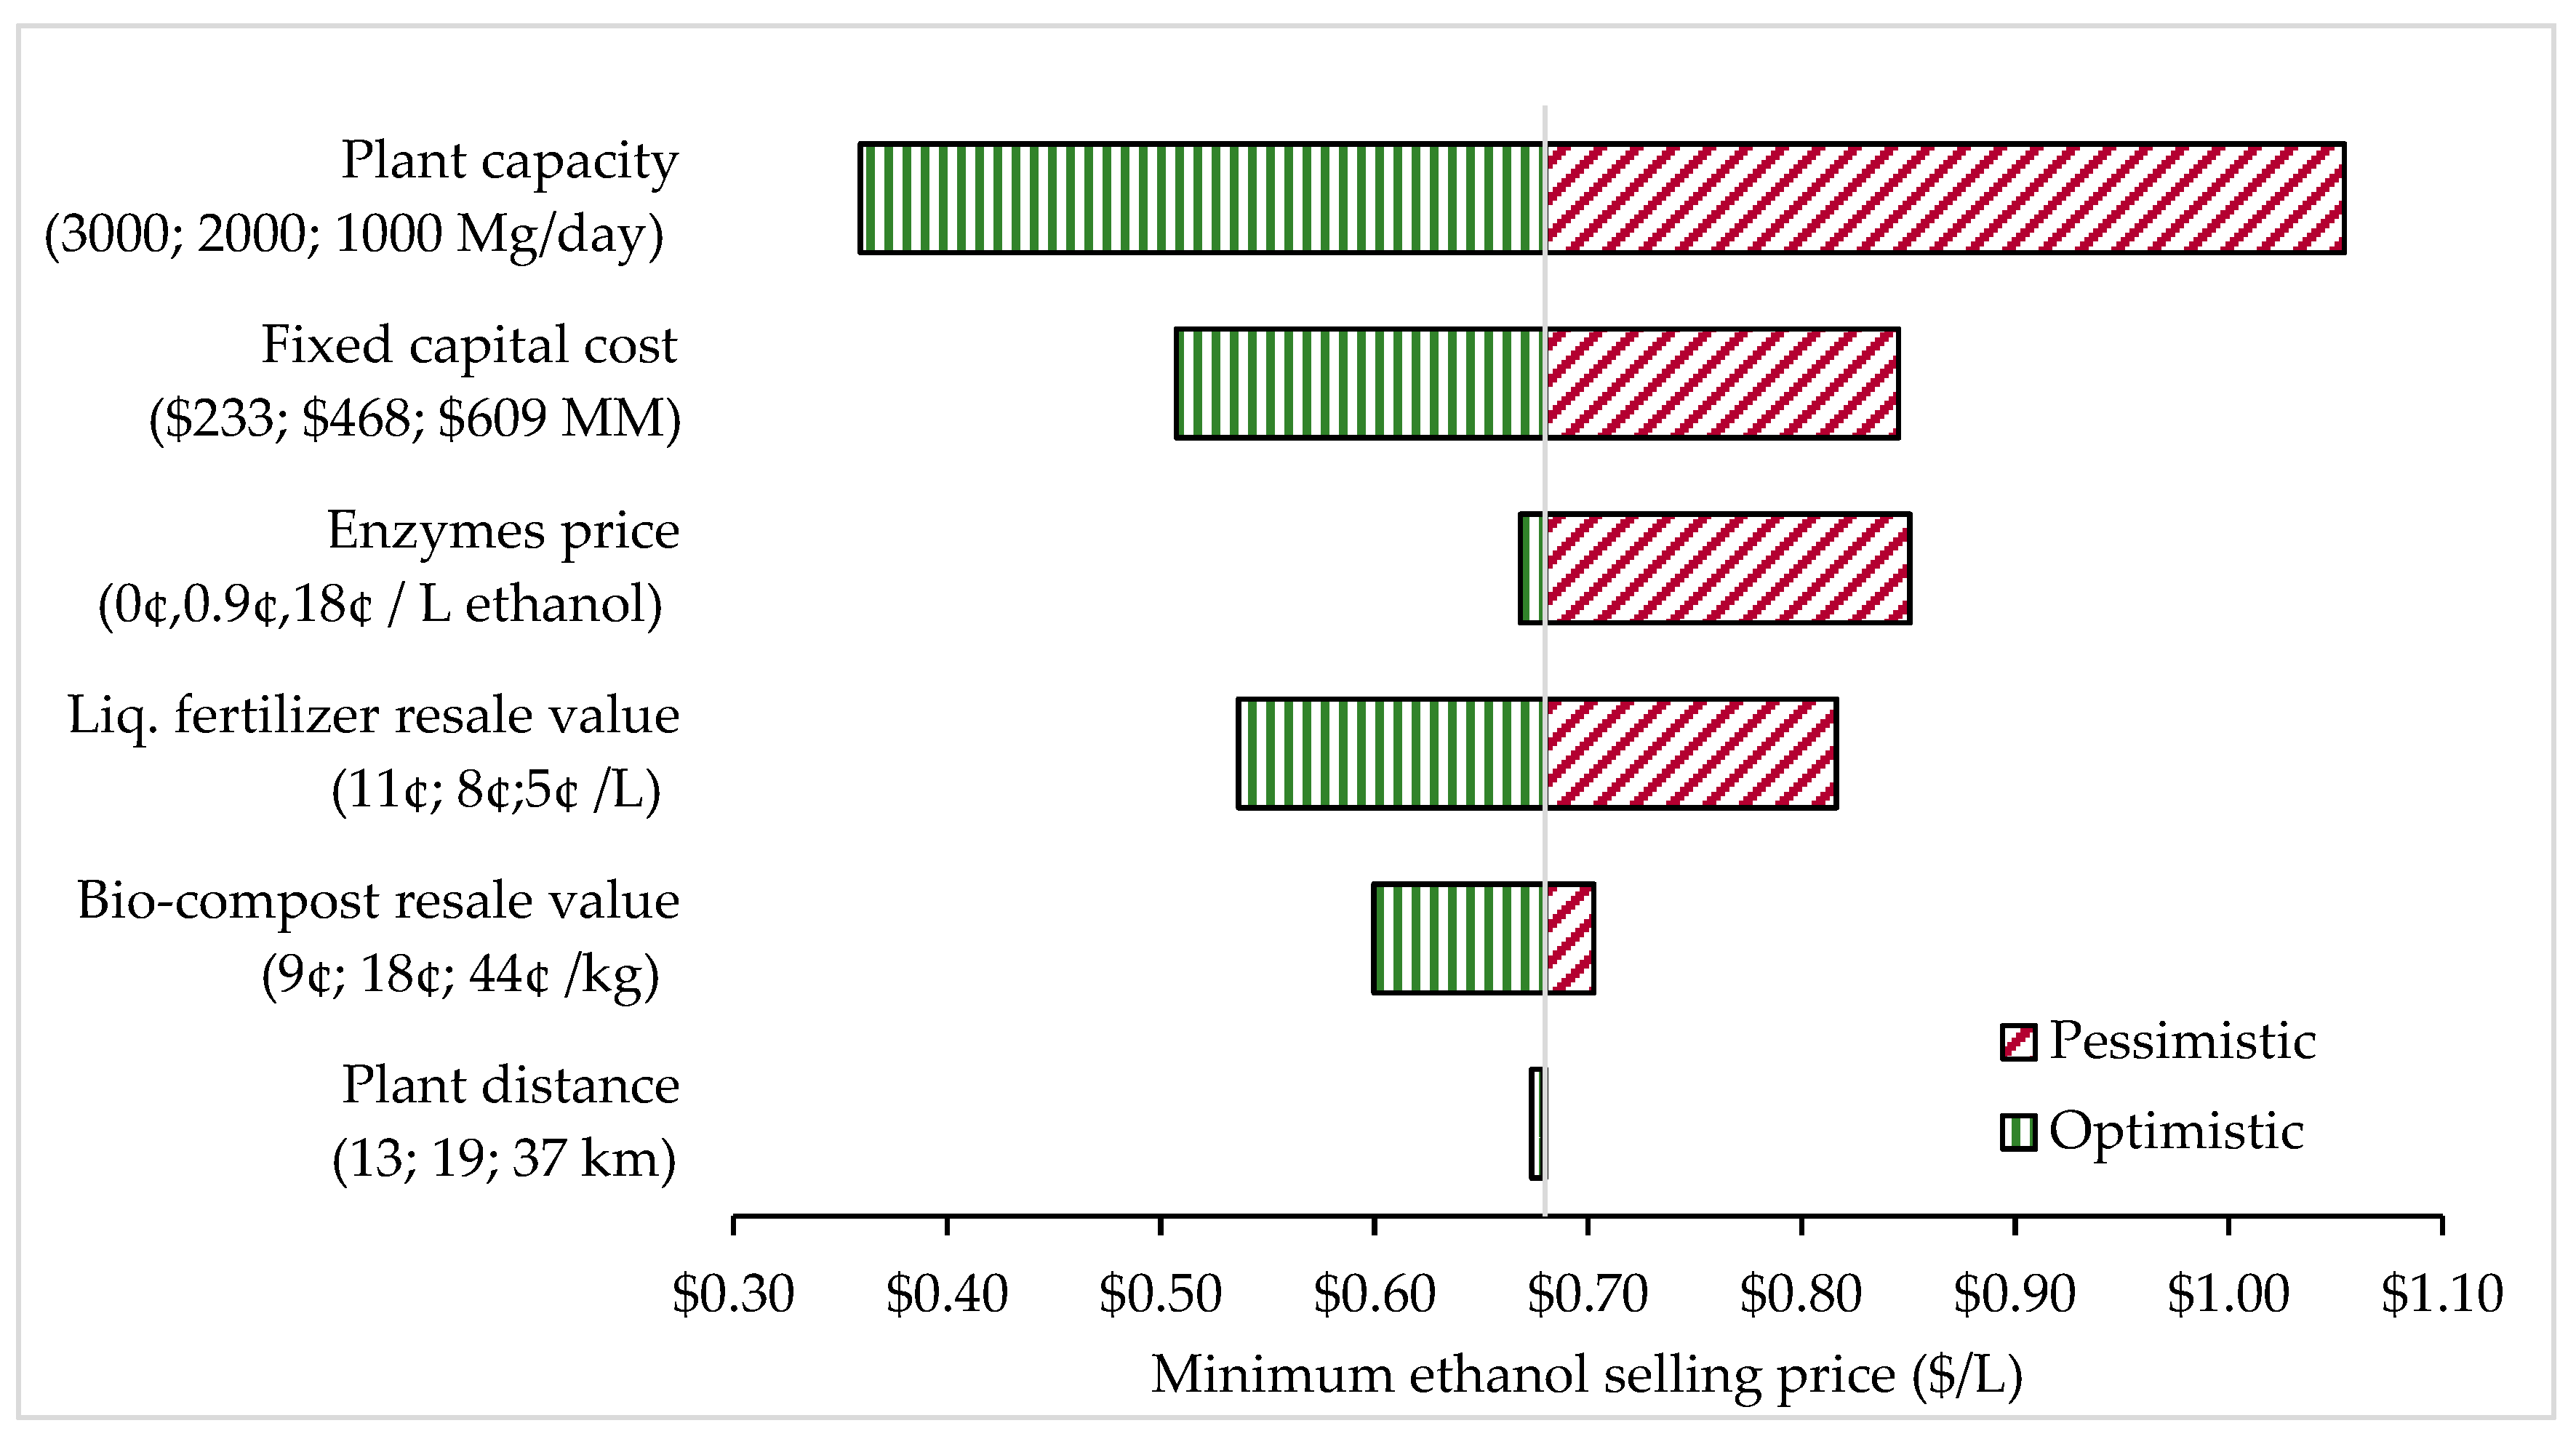
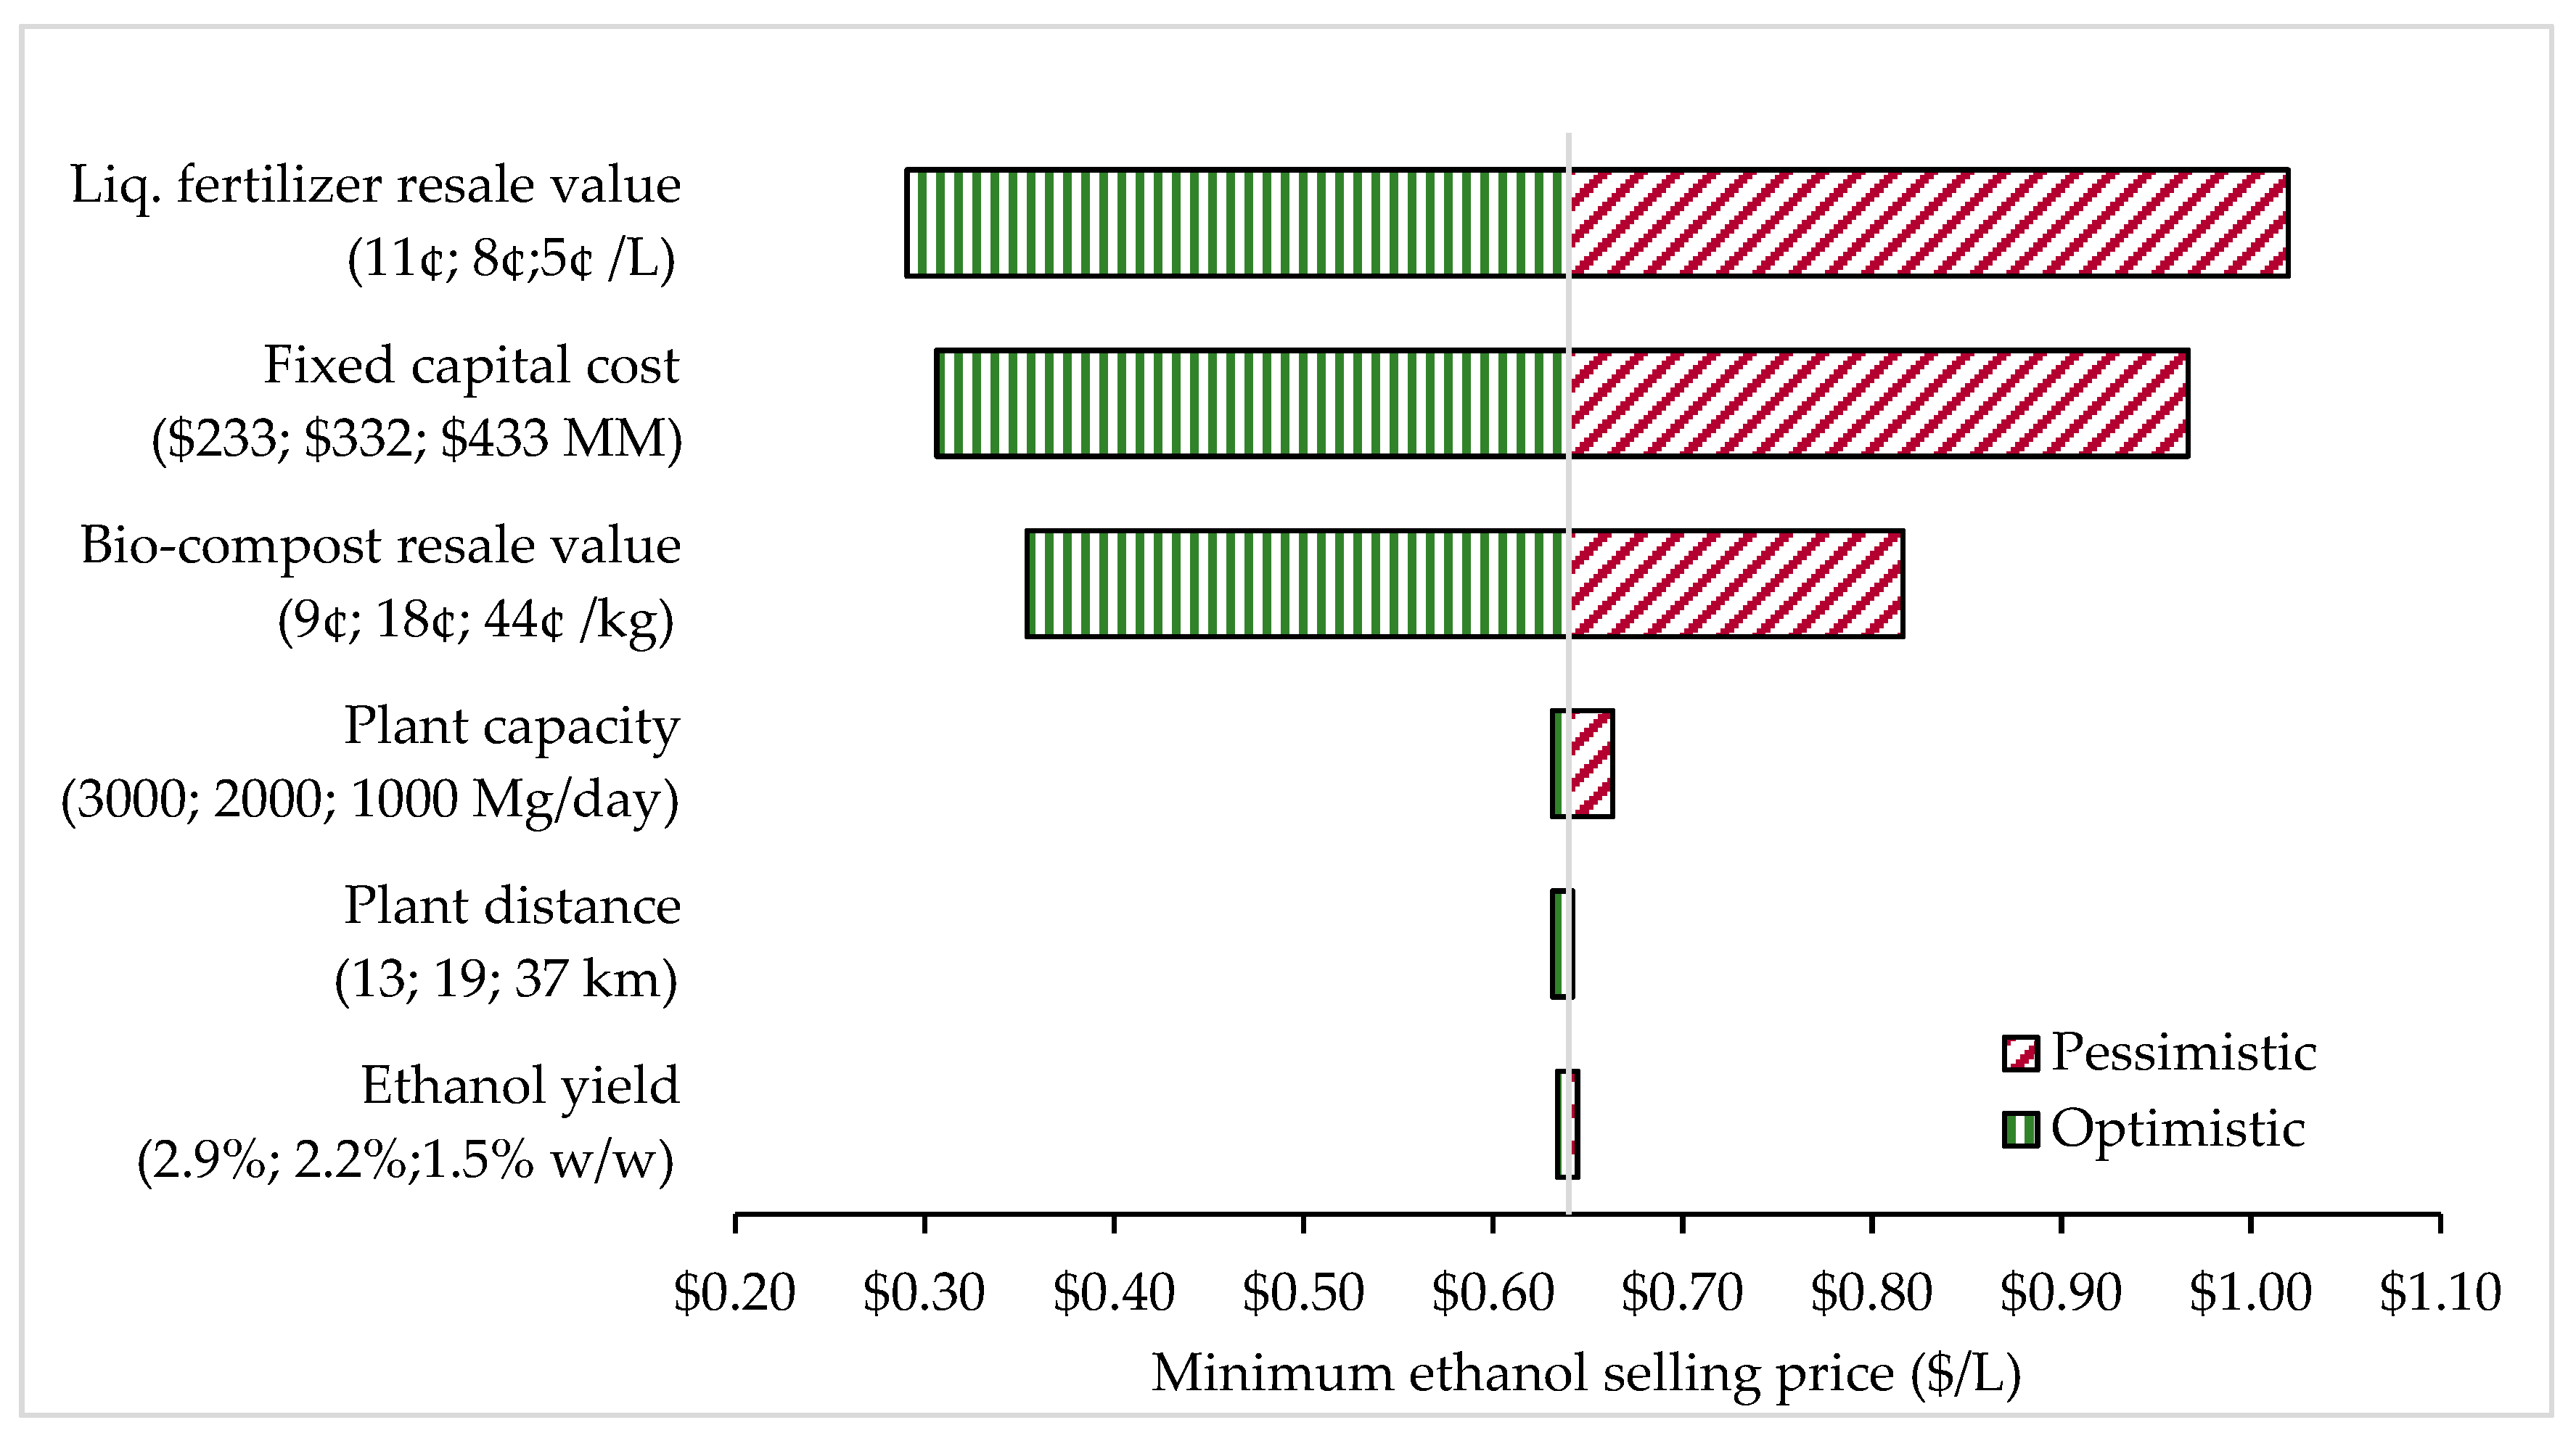
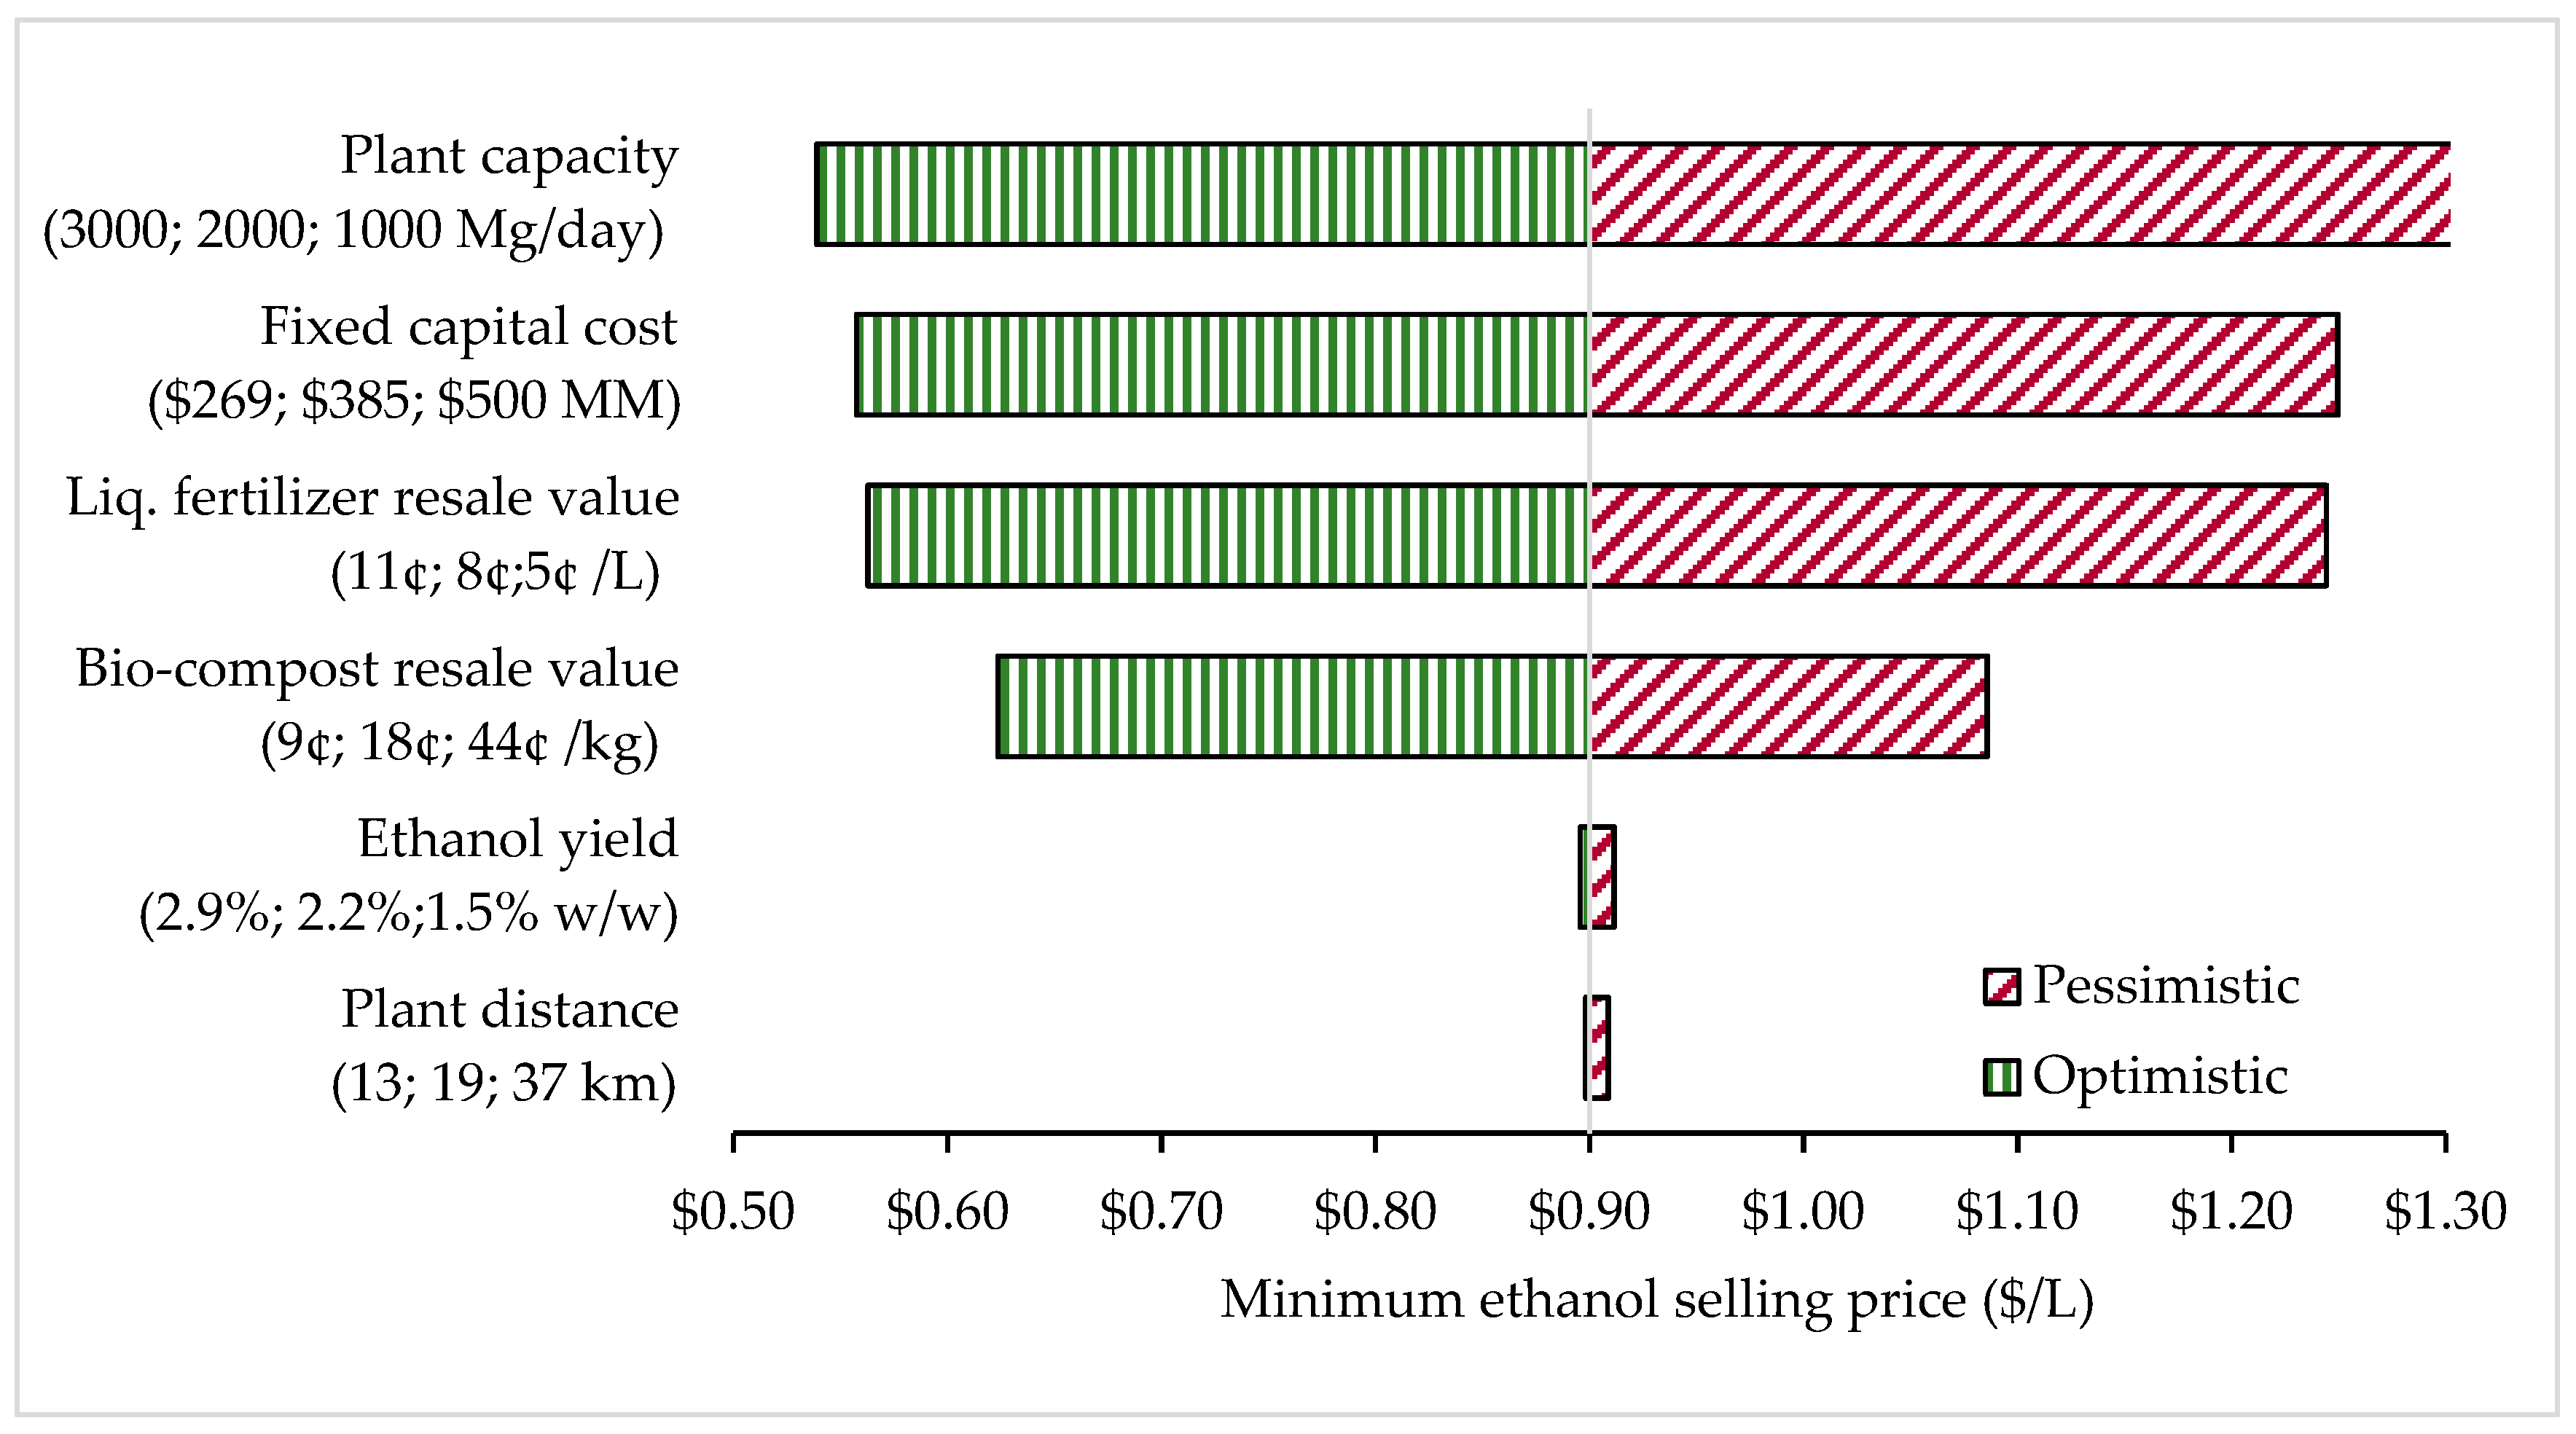
3.2. Sensitivity Analysis

Figure 6 shows the sensitivity analysis of the minimum ethanol selling price with a 10% IRR change in the percent of equity for all scenarios. The IRR is a method to estimate the profitability of a potential project. The 10% value was the suggested assumption to make the NPV of all cash flows from this project be equal to zero. Equity is the participation or ownership of investors. From the graph, it shows that the changes in equity percent have a minor effect on the MESP.
Figure 7, Figure 8 and Figure 9 show the sensitivity analysis for each scenario. Variables such as plant capacity, fixed capital cost, enzyme price, co-product credit value, plant distance, and ethanol yield have been identified to evaluate the impact on the MESP value.
Scenario A is illustrated in Figure 7. The tornado chart clearly shows that the plant capacity, fixed capital, and enzyme price are the most sensitive variables that could influence the MESP value. As discussed above, when using enzymes, there will be additional processes, equipment, and conditions required to enhance the production. Thus, small changes in the mentioned variable will affect the MESP value. Similar results can be found in previous studies which have found that enzymes are not economically viable in this regard [26,46,47].
Figure 8 shows the sensitivity analysis for scenario B. From the result, the liquid fertilizer price and capital investment had the greatest impact on the minimum ethanol selling price. Increasing the liquid fertilizer credit value from 20¢ to 40¢ per gallon (5.3¢ to 10.6¢ per liter) leads to a lowering of MESP from $3.86 to $1.10 per gallon ($1.12 to $0.29 per liter) ethanol. Additionally, a decrease of fixed capital cost by 30% will decrease the MESP value from $3.66 to $1.16 per gallon ($0.97 to $0.31 per liter) of ethanol.
Sensitivity analysis for scenario C is shown in Figure 9. From the chart, plant capacity, fixed capital cost, and co-product credit value have a significant impact on MESP value. It can be clearly seen that more than half of the variables are sensitive to the estimation of MESP value. Thus, it indicates that this plant finds difficulty in maintaining profitability.

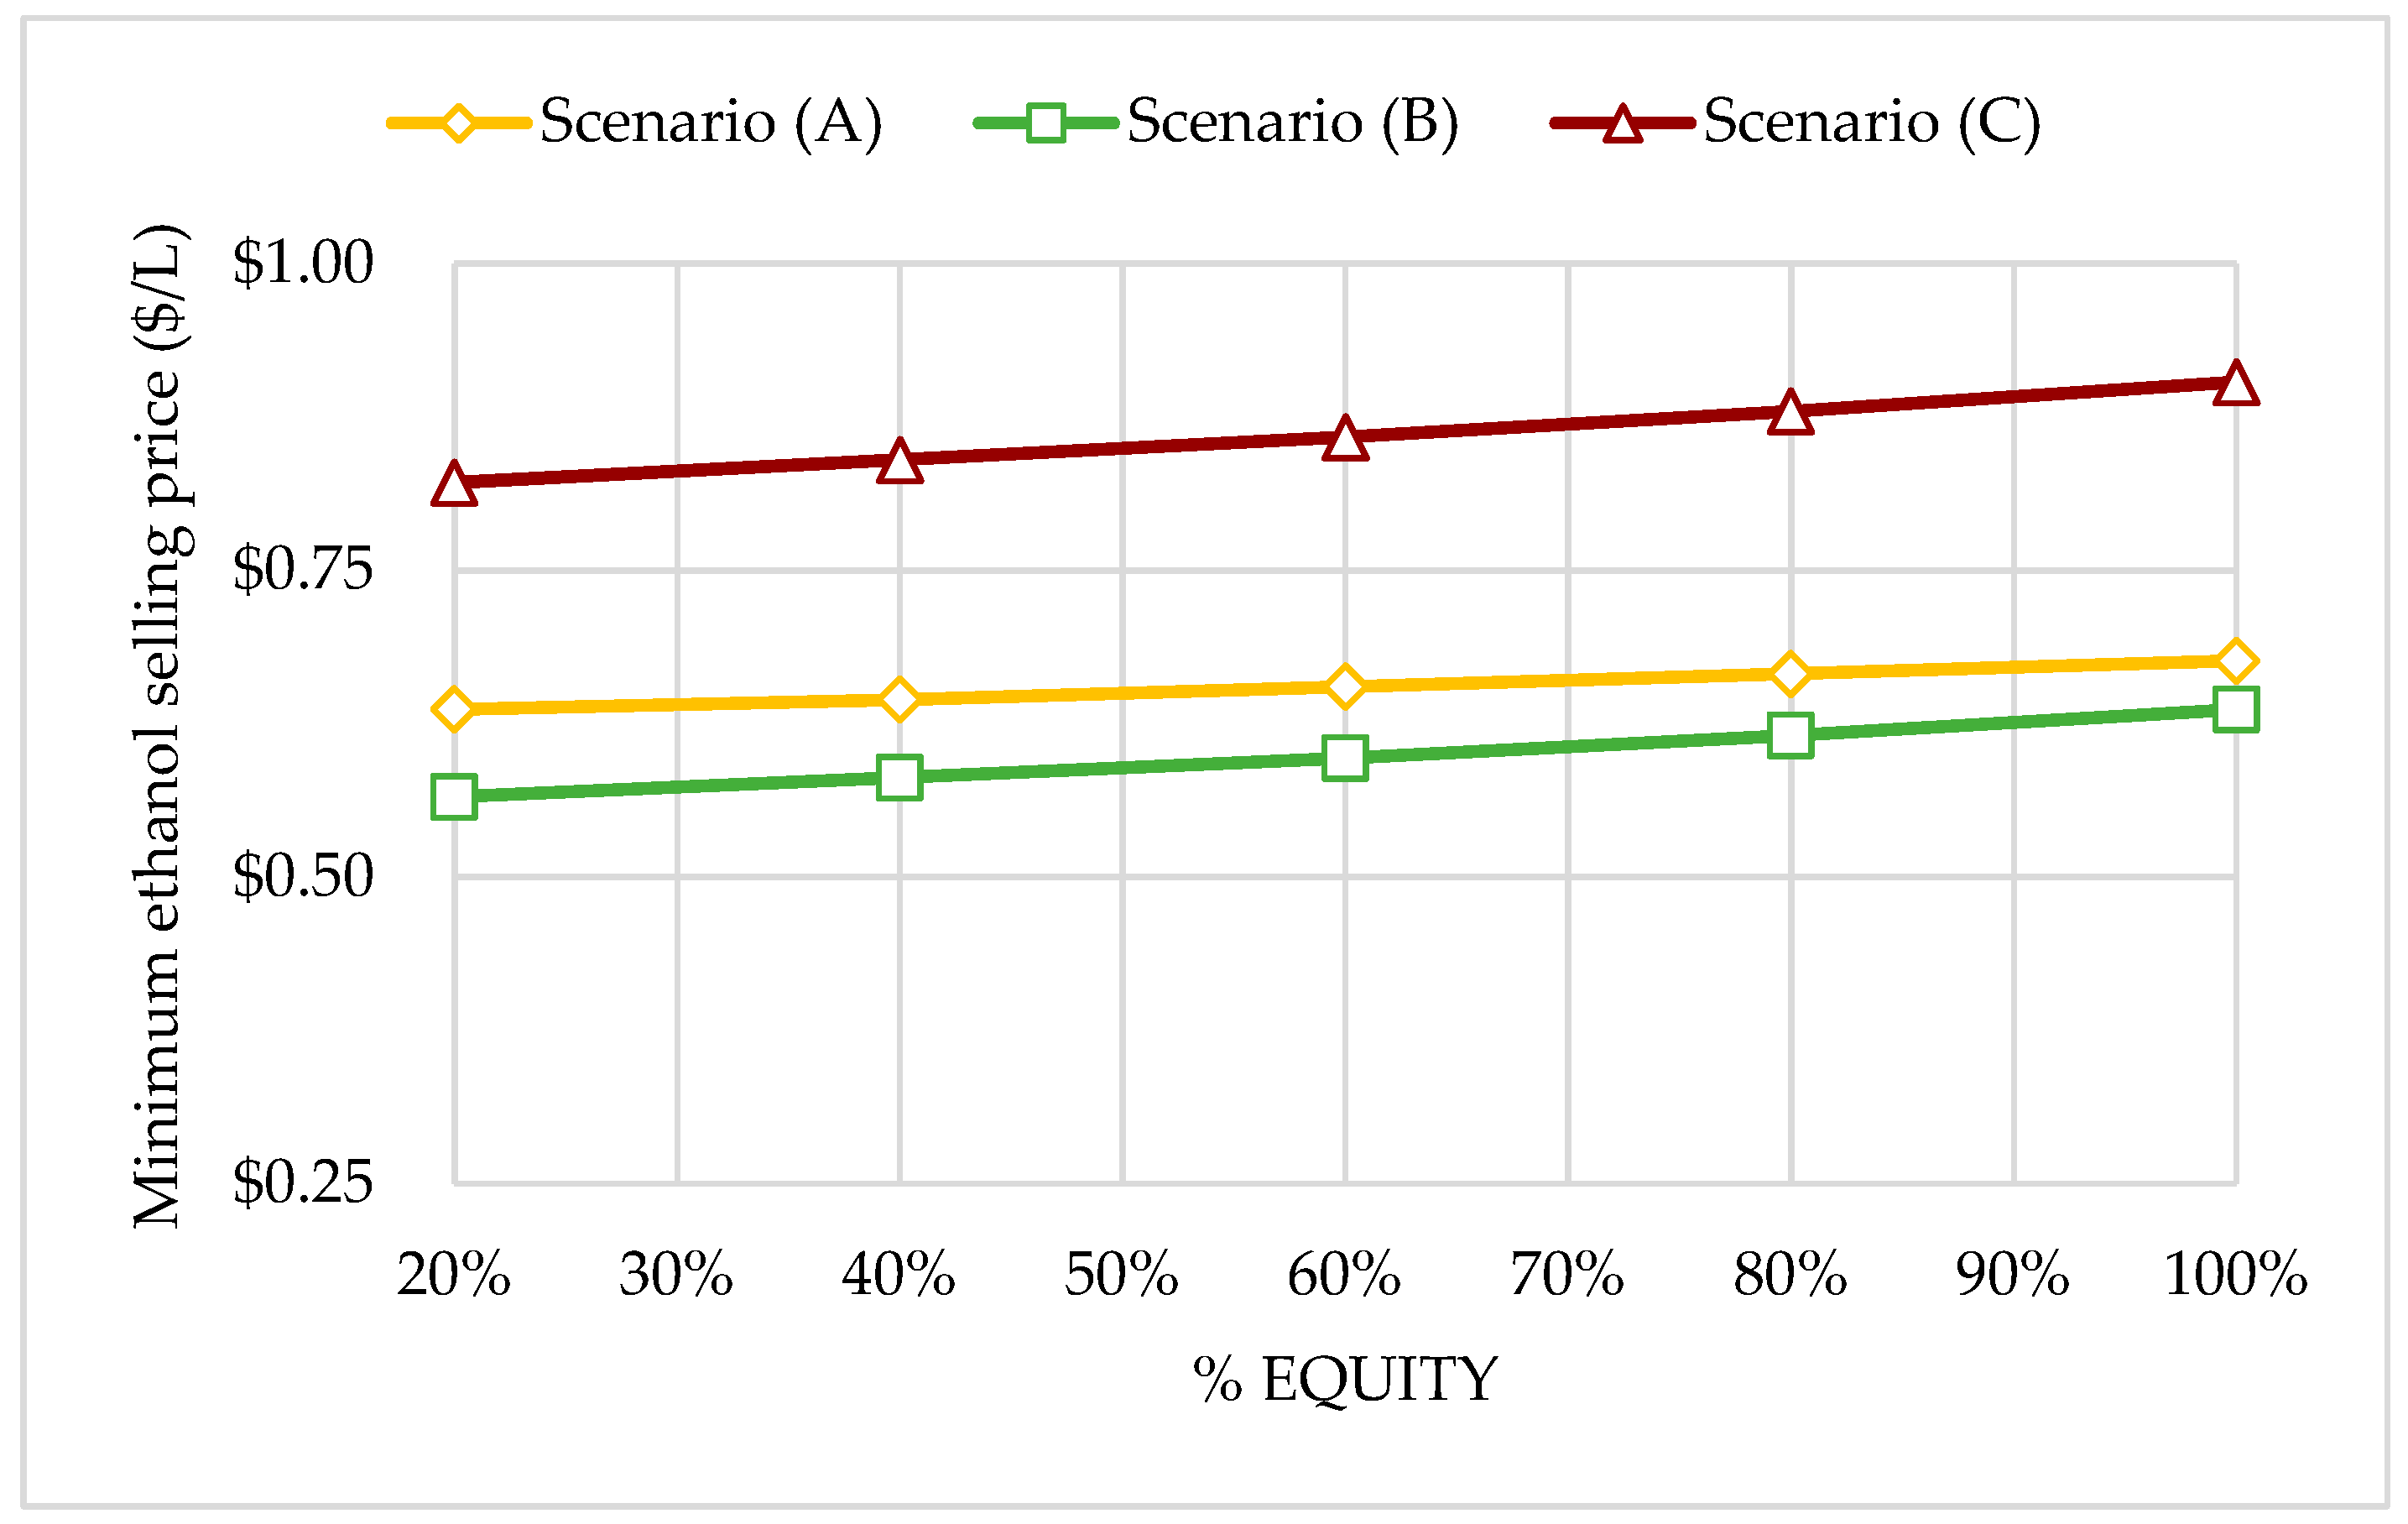
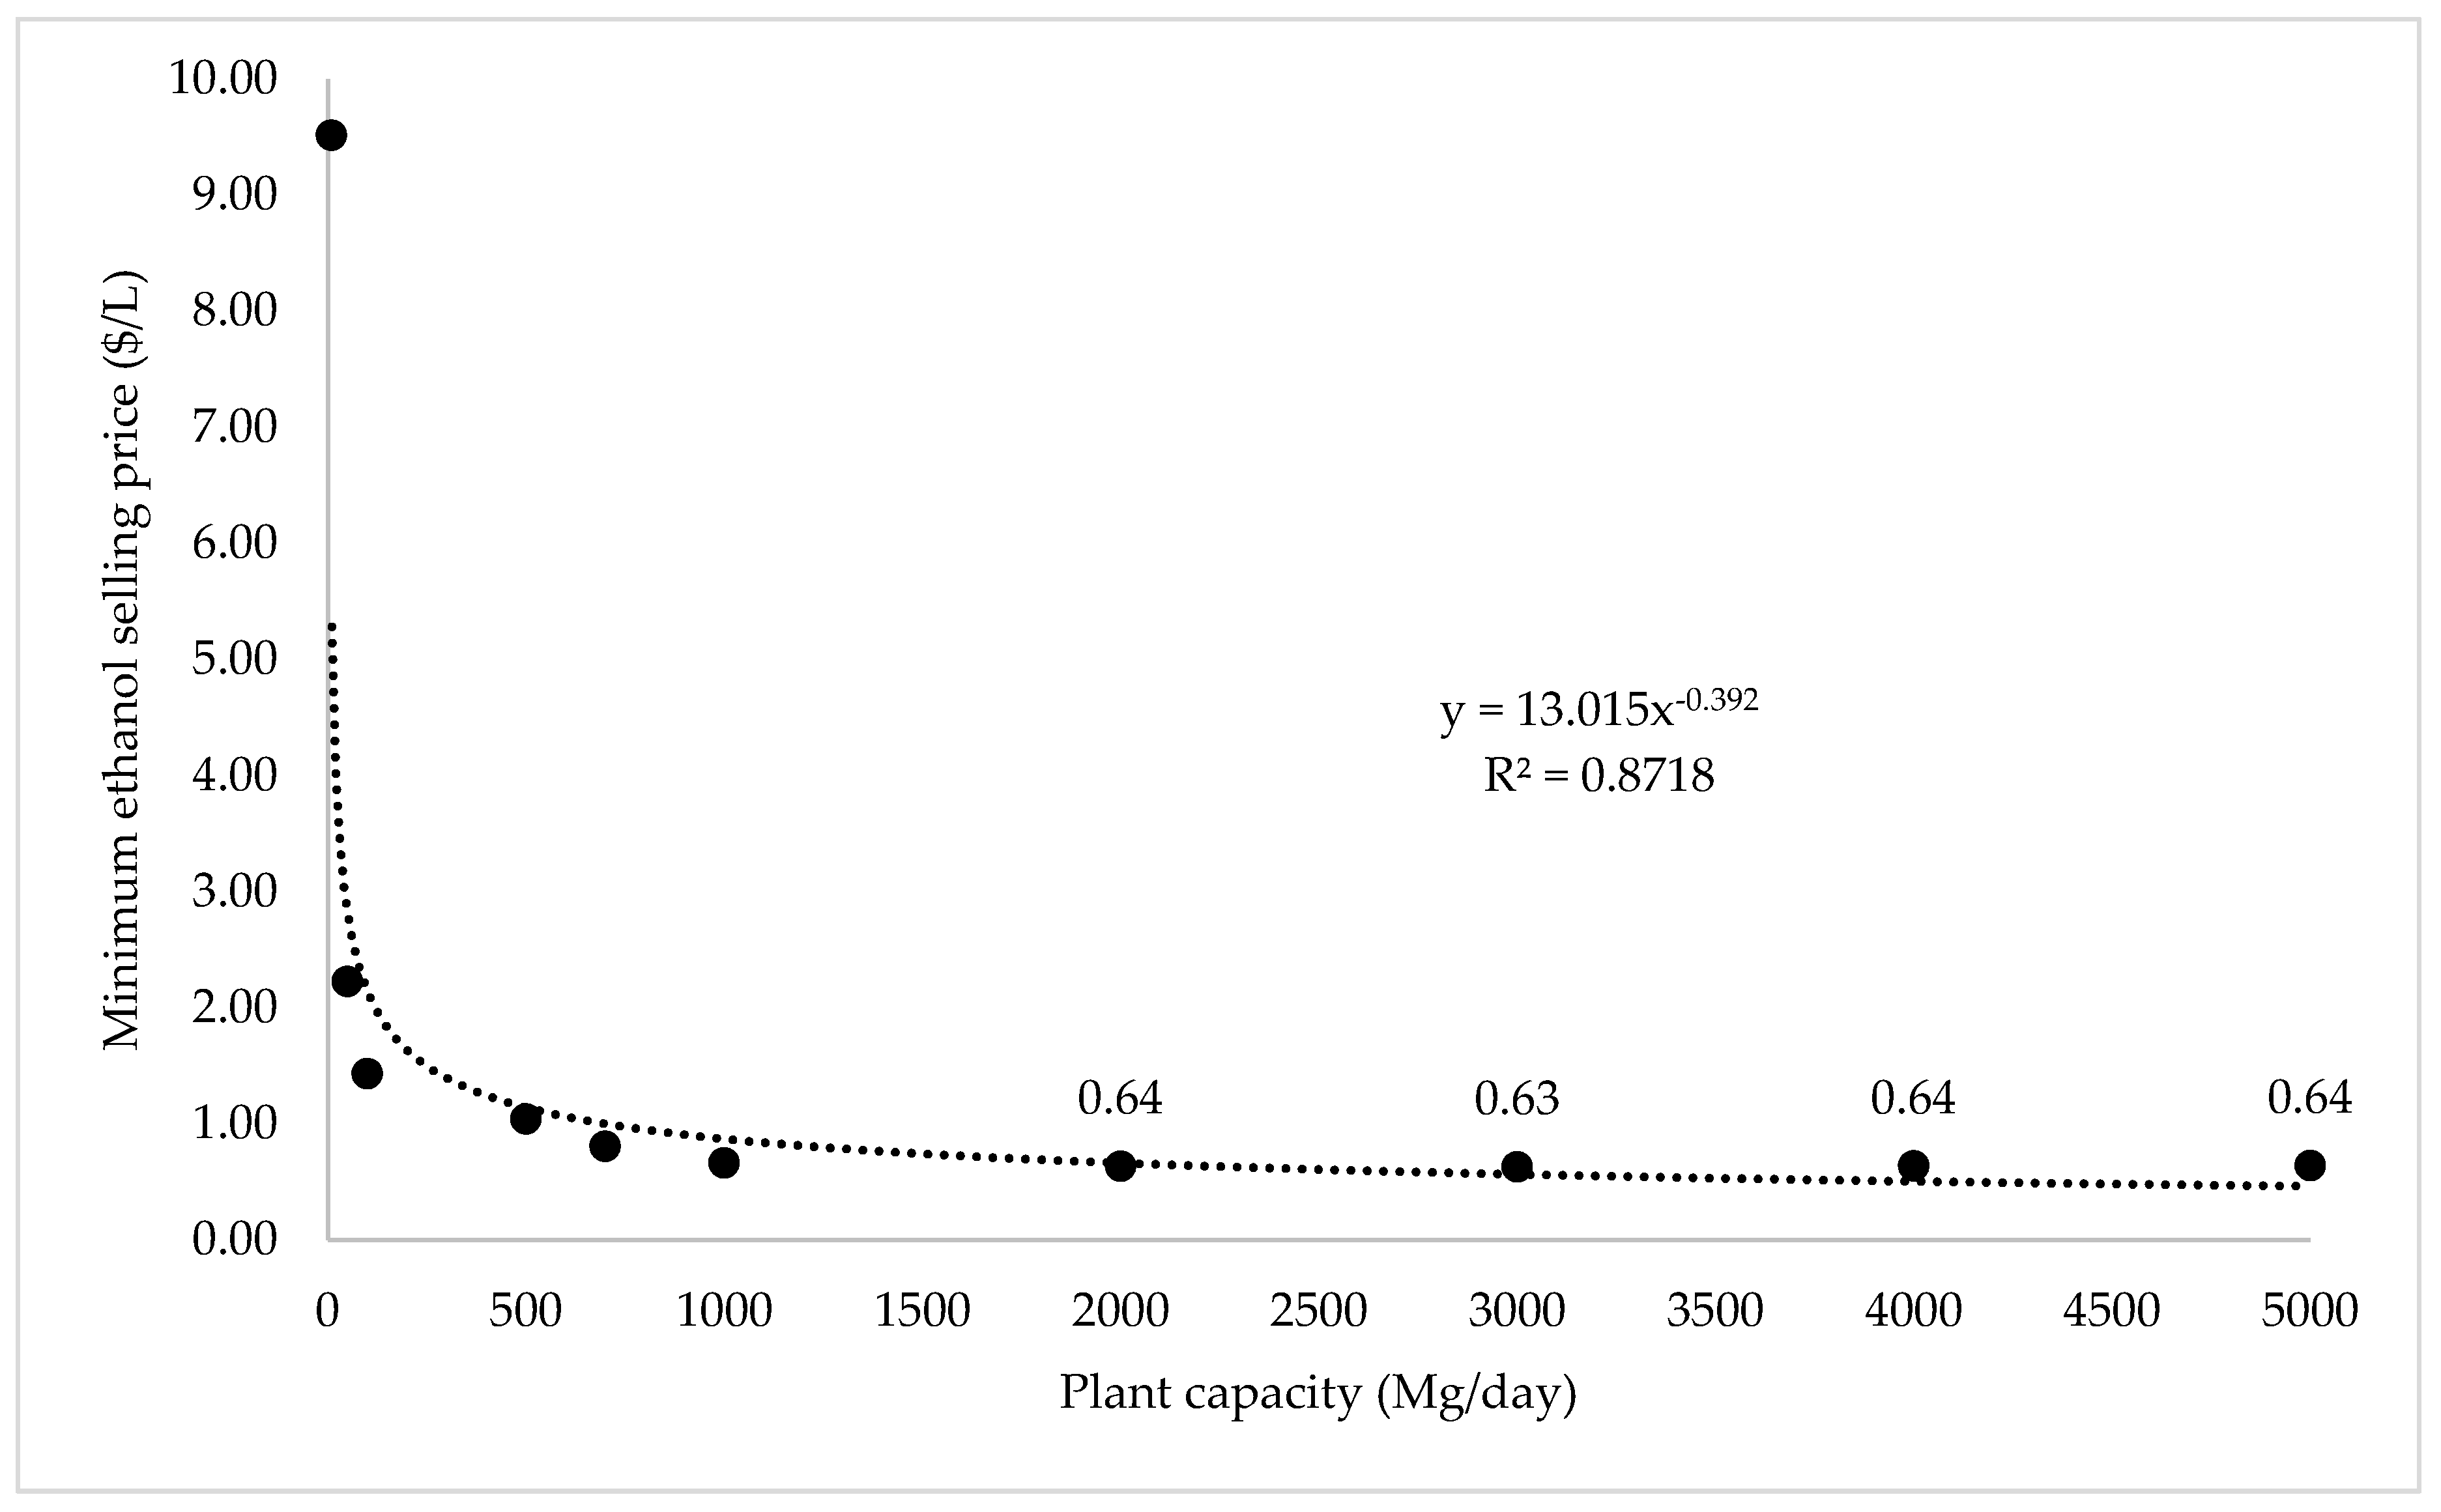
3.3. Economies of Scale

Figure 10 shows the economies of scale for this process. These exist when the increasing size of plant capacity will result in a lower MESP. From the graph, there was a power relationship of −0.392 between MESP and plant capacity. This also indicates that with the feedstock rate varying between 10 and 5000 Mg per day, the MESP of ethanol ranges from $36 to $2.43 per gallon ($9.5 to $0.64 per liter) of ethanol. It clearly shows that diseconomies of scale happen when the plant capacity increases to 3000 Mg per day. Thus, the size of plant capacity should not be larger than 3000 Mg daily in order to make the project economically feasible.

4. Conclusions

As previously discussed, although there are advantages for all scenarios in this study, discounted cash flow analysis indicated that scenario B showed a better MESP value than scenarios A and C. The analysis also showed that ethanol produced without enzymes and with a 2-step distillation system exhibits a competitive MESP price of $2.41 per gallon ($0.64 per liter), indicating that a FW fermentation process without enzymes is significantly more practical and cost-effective than one with enzymatic assistance. However, some limitations and challenges should be noted. For instance, in this study, an average FW composition was taken from previous studies and modeled for each scenario. It was difficult to achieve consistency for FW composition, as it varies and depends on resources such as diet, culture, and community. Thus, the results will be different based on different feedstock. Furthermore, to improve profitability, it is recommended to potentially replace the distillation system with membrane distillation, which is a technology with low energy consumption and a potentially effective approach to reduce utility cost. This is an interesting research area and would help to deal with FW more practically.

Author Contributions

N.I.S.M. conducted the simulations and drafted the paper. K.A.R. supervised the research and edited the paper. All authors have read and agreed to the published version of the manuscript.

Funding

This research received no external funding.

Conflicts of Interest

The authors declare no conflict of interest.

References

  1. EPA. Overview for Renewable Fuel Standard; The United States Environmental Protection Agency: Washington, DC, USA, 2017.
  2. Bracmort, K. The Renewable Fuel Standard (RFS): Waiver Authority and Modification of Volumes; Congressional Research Service: Washington, DC, USA, 2018.
  3. Meyer, S.; Schmidhuber, J.; Barreiro-Hurlé, J. Cross-trade in Biofuels: How Uncoordinated Environmental Legislation Fuels Resource Use and GHG Emissions. EuroChoices 2013, 12, 45–52. [Google Scholar] [CrossRef]
  4. Uçkun Kıran, E.; Trzcinski, A.P.; Liu, Y. Platform chemical production from food wastes using a biorefinery concept. J. Chem. Technol. Biotechnol. 2015, 90, 1364–1379. [Google Scholar] [CrossRef]
  5. Girotto, F.; Alibardi, L. Food waste generation and industrial uses: A review. Waste Manag. 2015, 45, 32–41. [Google Scholar] [CrossRef]
  6. Thi, N.B.D.; Kumar, G.; Lin, C.-Y. An overview of food waste management in developing countries: Current status and future perspective. J. Environ. Manag. 2015, 157, 220–229. [Google Scholar] [CrossRef]
  7. EPA. Advancing Sustainable Materials Management: 2015 Fact Sheet Assessing Trends in Material Generation, Recycling, Composting, Combustion with Energy Recovery and Landfilling in the United States; United States Environmental Protection Agency: Washington, DC, USA, 2018. Available online: https://www.epa.gov/sites/production/files/2018-07/documents/2015_smm_msw_factsheet_07242018_fnl_508_002.pdf (accessed on 1 November 2018).
  8. EPA. Overview of Greenhouse Gases; United States Environmental Protection Agency: Washington, DC, USA, 2018.
  9. Ermolaev, E.; Jarvis, Å.; Sundberg, C.; Smårs, S.; Pell, M.; Jönsson, H. Nitrous oxide and methane emissions from food waste composting at different temperatures. Waste Manag. 2015, 46, 113–119. [Google Scholar] [CrossRef]
  10. Lopez, V.M.; de la Cruz, F.B.; Barlaz, M.A. Chemical composition and methane potential of commercial food wastes. Waste Manag. 2016, 56, 477–490. [Google Scholar] [CrossRef]
  11. Woon, K.S.; Lo, I.M.C.; Chiu, S.L.H.; Yan, D.Y.S. Environmental assessment of food waste valorization in producing biogas for various types of energy use based on LCA approach. Waste Manag. 2016, 50, 290–299. [Google Scholar] [CrossRef]
  12. Noor, Z.Z.; Yusuf, R.O.; Abba, A.H.; Abu Hassan, M.A.; Mohd Din, M.F. An overview for energy recovery from municipal solid wastes (MSW) in Malaysia scenario. Renew. Sustain. Energy Rev. 2013, 20, 378–384. [Google Scholar] [CrossRef]
  13. De Lange, W.; Nahman, A. Costs of food waste in South Africa: Incorporating inedible food waste. Waste Manag. 2015, 40, 167–172. [Google Scholar] [CrossRef]
  14. Guerrero, L.A.; Maas, G.; Hogland, W. Solid waste management challenges for cities in developing countries. Waste Manag. 2013, 33, 220–232. [Google Scholar] [CrossRef]
  15. Levis, J.W.; Barlaz, M.A.; Themelis, N.J.; Ulloa, P. Assessment of the state of food waste treatment in the United States and Canada. Waste Manag. 2010, 30, 1486–1494. [Google Scholar] [CrossRef] [PubMed]
  16. Manaf, L.A.; Samah, M.A.A.; Zukki, N.I.M. Municipal solid waste management in Malaysia: Practices and challenges. Waste Manag. 2009, 29, 2902–2906. [Google Scholar] [CrossRef]
  17. Hafid, H.S.; Rahman, N.A.; Md Shah, U.K.; Baharudin, A.S. Enhanced fermentable sugar production from kitchen waste using various pretreatments. J. Environ. Manag. 2015, 156, 290–298. [Google Scholar] [CrossRef] [PubMed]
  18. Vavouraki, A.I.; Angelis, E.M.; Kornaros, M. Optimization of thermo-chemical hydrolysis of kitchen wastes. Waste Manag. 2013, 33, 740–745. [Google Scholar] [CrossRef] [PubMed]
  19. Cekmecelioglu, D.; Uncu, O.N. Kinetic modeling of enzymatic hydrolysis of pretreated kitchen wastes for enhancing bioethanol production. Waste Manag. 2013, 33, 735–739. [Google Scholar] [CrossRef] [PubMed]
  20. Zhang, X.; Richard, T. Dual Enzymatic Saccharification of Food Waste for Ethanol Fermentation. In Proceedings of the 2011 International Conference on Electrical and Control Engineering, IEEE, Yichang, China, 16–18 September 2011; pp. 4472–4474. [Google Scholar]
  21. Uçkun Kiran, E.; Trzcinski, A.P.; Ng, W.J.; Liu, Y. Bioconversion of food waste to energy: A review. Fuel 2014, 134, 389–399. [Google Scholar] [CrossRef]
  22. Mohd Azhar, S.H.; Abdulla, R.; Jambo, S.A.; Marbawi, H.; Gansau, J.A.; Mohd Faik, A.A.; Rodrigues, K.F. Yeasts in sustainable bioethanol production: A review. Biochem. Biophys. Rep. 2017, 10, 52–61. [Google Scholar] [CrossRef]
  23. Hafid, H.S.; Nor ’Aini, A.R.; Mokhtar, M.N.; Talib, A.T.; Baharuddin, A.S.; Umi Kalsom, M.S. Over production of fermentable sugar for bioethanol production from carbohydrate-rich Malaysian food waste via sequential acid-enzymatic hydrolysis pretreatment. Waste Manag. 2017, 67, 95–105. [Google Scholar] [CrossRef]
  24. Uncu, O.N.; Cekmecelioglu, D. Cost-effective approach to ethanol production and optimization by response surface methodology. Waste Manag. 2011, 31, 636–643. [Google Scholar] [CrossRef]
  25. Zheng, Y.; Pan, Z.; Zhang, R. Overview of biomass pretreatment for cellulosic ethanol production. Int. J. Agric. Biol. Eng. 2009, 2, 51–68. [Google Scholar]
  26. Pham, T.P.T.; Kaushik, R.; Parshetti, G.K.; Mahmood, R.; Balasubramanian, R. Food waste-to-energy conversion technologies: Current status and future directions. Waste Manag. 2015, 38, 399–408. [Google Scholar] [CrossRef] [PubMed]
  27. Muhammad, N.I.S. Comparative Assessment of the Economic and Environmental Impacts of Food Waste Fermentation on Value-Added Products. Ph.D. Thesis, Iowa State University, Ames, IA, USA, 2019. [Google Scholar]
  28. Suwannarat, J.; Ritchie, R.J. Anaerobic digestion of food waste using yeast. Waste Manag. 2015, 42, 61–66. [Google Scholar] [CrossRef] [PubMed]
  29. Karmee, S.K. Liquid biofuels from food waste: Current trends, prospect and limitation. Renew. Sustain. Energy Rev. 2016, 53, 945–953. [Google Scholar] [CrossRef]
  30. Bertran, E.; Sort, X.; Soliva, M.; Trillas, I. Composting winery waste: Sludges and grape stalks. Bioresour Technol 2004, 95, 203–208. [Google Scholar] [CrossRef] [PubMed]
  31. Cornel Waste Management Institute. Monitoring Compost Moisture—Cornell Composting; Cornell University: Ithaca, NY, USA, 1996. [Google Scholar]
  32. Peters, M.S.; Timmerhaus, K.D.; West, R.E.; Ronald, E. Plant Design and Economics for Chemical Engineers, 5th ed.; McGraw-Hill: Boston, MA, USA, 2003. [Google Scholar]
  33. Poliafico, M.; Murphy, J. Anaerobic Digestion in Ireland: Decision Support System. Epartment of Civil, Structural and Environmental Engineering; Cork Institute of Technology: Cork, Ireland, 2007. [Google Scholar]
  34. Brown, R.C.; Brown, T.R. Biorenewable Resources: Engineering New Products from Agriculture, 2nd ed.; John Wiley & Sons, Inc.: Ames, IA, USA, 2014; pp. 287–326. [Google Scholar]
  35. Short, W.; Packey, D.J.; Holt, T. A Manual for the Economic Evaluation of Energy Efficiency and Renewable Energy Technologies; National Renewable Energy Lab.: Golden, CO, USA, 1995.
  36. Aden, A.; Foust, T. Technoeconomic analysis of the dilute sulfuric acid and enzymatic hydrolysis process for the conversion of corn stover to ethanol. Cellulose 2009, 16, 535–545. [Google Scholar] [CrossRef]
  37. Wright, M.M.; Daugaard, D.E.; Satrio, J.A.; Brown, R.C. Techno-economic analysis of biomass fast pyrolysis to transportation fuels. Fuel 2010, 89, S2–S10. [Google Scholar] [CrossRef] [Green Version]
  38. Humbird, D.; Davis, R.; Tao, L.; Kinchin, C.; Hsu, D.; Aden, A.; Schoen, P.; Lukas, J.; Olthof, B.; Worley, M.; et al. Process Design and Economics for Biochemical Conversion of Lignocellulosic Biomass to Ethanol: Dilute-Acid Pretreatment and Enzymatic Hydrolysis of Corn Stover; National Renewable Energy Lab.: Golden, CO, USA, 2011. [CrossRef] [Green Version]
  39. Tao, L.; Schell, D.; Davis, R.; Tan, E.; Elander, R.; Bratis, A. NREL 2012 Achievement of Ethanol Cost Targets: Biochemical Ethanol Fermentation via Dilute-Acid Pretreatment and Enzymatic Hydrolysis of Corn Stover; National Renewable Energy Lab.: Golden, CO, USA, 2014. [CrossRef] [Green Version]
  40. Hofstrand, D. Ethanol profitability. Iowa State University Extension and Outreach. 2019. Available online: https://www.extension.iastate.edu/agdm/refirst.html (accessed on 1 November 2018).
  41. National Compost Prices. National Compost Prices 2006. Available online: http://www.recycle.cc/compostprices.pdf (accessed on 29 October 2018).
  42. Klein-Marcuschamer, D.; Oleskowicz-Popiel, P.; Simmons, B.A.; Blanch, H.W. The challenge of enzyme cost in the production of lignocellulosic biofuels. Biotechnol. Bioeng. 2012, 109, 1083–1087. [Google Scholar] [CrossRef]
  43. Wimer, J.G.; Summers, W.M. Quality Guidelines for Energy System Studies: Cost Estimation Methodology for NETL Assessments of Power Plant Performance; NETL: Pittsburgh, PA, USA, 2011.
  44. EIA. Iowa State Energy Profile. US Energy Inf Adm 2017. Available online: https://www.eia.gov/state/print.php?sid=IA (accessed on 1 November 2018).
  45. Ro, K.S.; Dietenberger, M.A.; Libra, J.A.; Proeschel, R.; Atiyeh, H.K.; Sahoo, K.; Park, W.J. Production of Ethanol from Livestock, Agricultural, and Forest Residuals: An Economic Feasibility Study. Environments 2019, 6, 97. [Google Scholar] [CrossRef] [Green Version]
  46. Klein-Marcuschamer, D.; Simmons, B.A.; Blanch, H.W. Techno-economic analysis of a lignocellulosic ethanol biorefinery with ionic liquid pre-treatment. Biofuels Bioprod. Biorefin. 2011, 5, 562–569. [Google Scholar] [CrossRef]
  47. Matsakas, L.; Kekos, D.; Loizidou, M.; Christakopoulos, P. Utilization of household food waste for the production of ethanol at high dry material content. Biotechnol. Biofuels 2014, 7, 4. [Google Scholar] [CrossRef] [Green Version]
Figure 1. Average values of food waste (FW) composition (% w/w, wet basis) [17,18,19,20,21].
Energies 13 00436 g001
Figure 2. Process flow diagram of the scenario B FW fermentation process with hydrolysis enzymes and a 2-step distillation system.
Energies 13 00436 g002
Figure 3. Process flow diagram of the scenario A FW fermentation process without enzymes and a 2-step distillation system.
Energies 13 00436 g003
Figure 4. Process flow diagram of the scenario C FW fermentation process without enzymes and 1-step distillation system.
Energies 13 00436 g004
Figure 5. Annual operating cost ($ MM/year) and normalized operating cost ($/L ethanol) for scenario A, FW fermentation with hydrolysis enzyme and a 2-step distillation system, scenario B, FW fermentation process without enzymes and a 2-step distillation system, and scenario C, FW fermentation process without enzymes and a 1-step distillation system.
Energies 13 00436 g005
Figure 6. Sensitivity of minimum ethanol selling price (MESP) to IRR (10%) and percent equity (8.25% interest with a 10-year loan) for scenarios A, B, and C.
Energies 13 00436 g006
Figure 7. Sensitivity analysis for scenario A FW fermentation process, with hydrolysis enzymes and a 2-step distillation system. Optimistic is the best-case scenario simulation and pessimistic is the worst-case scenario simulation.
Energies 13 00436 g007
Figure 8. Sensitivity analysis for the scenario B FW fermentation process, without enzymes and a 2-step distillation system. Optimistic is the best-case scenario simulation and pessimistic is the worst-case scenario simulation.
Energies 13 00436 g008
Figure 9. Sensitivity analysis for the scenario C FW fermentation process, without enzymes and a 1-step distillation system. Optimistic is the best-case scenario simulation and pessimistic is the worst-case scenario simulation.
Energies 13 00436 g009
Figure 10. Economies of scale for the scenario B FW fermentation process, without enzymes and a 2-step distillation system.
Energies 13 00436 g010
Table 1. Financial economic assumptions used for the techno-economic analysis.
ParameterAssumption
Plant capacity2000 Mg/day
Plant life20 years
FW collection distance19 km radius [33]
Equity100% with 0 salvage value
The internal rate of return (IRR)10% [35]
Type of depreciationDouble-declining balance (DDB) [37]
200% with seven years depreciation period [37]
Construction period2.5 years with total capital investment spent at 8%, 60%, and 32% per year (years before the operation) [37]
Startup timeSix months. During this period, revenues, variable operating costs, and fixed operating cost are at 50%, 75% and 100% of normal, respectively [37]
Income tax rate39% [40]
Table 2. Assumptions for operator requirements for various types of process equipment [34].
Generic Equipment TypeOperators Per Unit Per Shift
Crushers, mills, grinders1
Evaporators0.2
Furnace0.5
Heat exchangers0.1
Reactors/bioreactors0.5
Clarifiers and thickeners0.2
Centrifugal separators and filters0.2
Mixers0.3
Rotary and belt filters0.2
Table 3. Sensitivity analysis parameters for all scenarios.
ParametersOptimisticBase CasePessimistic
Ethanol yield (% w/w wet basis)2.92.21.5
Plant capacity (Mg/day)300020001000
Fixed capital cost ($MM)−30%Value estimated by SuperPro simulation30%
Plant distance (km)131937
Liquid fertilizer resale value (¢/L)1185
Biocompost resale value (¢/kg)44189
Enzymes price (¢/L ethanol)00.918
Table 4. Techno-economic analysis results (all results are in 2018 US dollars).
Process Variations (Scenario)TIEC ($MM)TPI ($MM)Annual Utilities ($MM)Ethanol Production (MGY)MESP $/gal ($/L)
(A)
FW fermentation process with hydrolysis enzymes and a 2-step distillation system.
3015454436.62.56 (0.68)
(B)
FW fermentation process without enzymes and a 2-step distillation system.
2143873014.52.41 (0.64)
(C)
FW fermentation process without enzymes and a 1-step distillation system.
2474472514.43.42 (0.90)

