Next Article in Journal
Collective Renewable Energy Prosumers and the Promises of the Energy Union: Taking Stock
Previous Article in Journal
Wireless Power Hanger Pad for Portable Wireless Audio Device Power Charger Application
 
 
Addendum published on 5 March 2020, see Energies 2020, 13(5), 1211.
Review

Green Synthetic Fuels: Renewable Routes for the Conversion of Non-Fossil Feedstocks into Gaseous Fuels and Their End Uses

by
Elena Rozzi
1,2,*,
Francesco Demetrio Minuto
1,2,
Andrea Lanzini
1,2 and
Pierluigi Leone
1,2
1
Department of Energy, Politecnico di Torino, Corso Duca degli Abruzzi 24, 10129 Torino, Italy
2
Energy Center Lab, Politecnico di Torino, Corso Duca degli Abruzzi 24, 10129 Torino, Italy
*
Author to whom correspondence should be addressed.
Energies 2020, 13(2), 420; https://doi.org/10.3390/en13020420
Submission received: 6 December 2019 / Revised: 30 December 2019 / Accepted: 10 January 2020 / Published: 15 January 2020

Abstract

:
Innovative renewable routes are potentially able to sustain the transition to a decarbonized energy economy. Green synthetic fuels, including hydrogen and natural gas, are considered viable alternatives to fossil fuels. Indeed, they play a fundamental role in those sectors that are difficult to electrify (e.g., road mobility or high-heat industrial processes), are capable of mitigating problems related to flexibility and instantaneous balance of the electric grid, are suitable for large-size and long-term storage and can be transported through the gas network. This article is an overview of the overall supply chain, including production, transport, storage and end uses. Available fuel conversion technologies use renewable energy for the catalytic conversion of non-fossil feedstocks into hydrogen and syngas. We will show how relevant technologies involve thermochemical, electrochemical and photochemical processes. The syngas quality can be improved by catalytic CO and CO2 methanation reactions for the generation of synthetic natural gas. Finally, the produced gaseous fuels could follow several pathways for transport and lead to different final uses. Therefore, storage alternatives and gas interchangeability requirements for the safe injection of green fuels in the natural gas network and fuel cells are outlined. Nevertheless, the effects of gas quality on combustion emissions and safety are considered.

Graphical Abstract

1. Introduction

1.1. Background

Global energy consumption has increased rapidly in recent decades due to population and economic growth. In 2018, the overall energy demand increased by 2.3%, nearly double the average rate of growth since 2010, and natural gas contributed almost 45% to the rise [1]. The growing energy consumption leads to the depletion of fossil fuel reserves and the amplification of greenhouse gases (GHG) emissions. Indeed, CO2 emissions in 2018 reached a historical value of 33.1 Gt CO2, increasing by 1.7% [1]. In 2010, governments approved the Paris Agreement, which established the goal to hold the increase in the global average temperature well below 2 °C above pre-industrial levels. The International Energy Agency (IEA) report outlines that, by 2050, a reduction by 85% of the annual GHG emissions is required to meet the Paris Agreement limit [2]. This goal can be achieved with the increase in low-carbon energy technologies, such as wind and solar power. However, the main issues related to energy generation by renewable energy sources are system flexibility and integration. Indeed, the electric grid needs to be balanced instantaneously at all times. Still, energy generation is affected by intermittency and fluctuation of the energy sources that lead to both temporal and spatial discrepancy between the power supply and demand [3].
Green synthetic fuels can support the transition to a decarbonized energy system. Hydrogen and synthetic natural gas are energy carriers that can be exploited as alternative fuels to reduce GHG emissions and the depletion of fossil fuels. They enable cost-effective, long-term and high energy density storage, distribution and transport. Moreover, synthetic fuels can be converted into heat or electric power (combustion, fuel cells) during peak loads, ensuring higher flexibility of the electric and gas grid [4]. Nevertheless, hydrogen plays a primary role in the decarbonization of the road transport sector—the source of 24% of CO2 emissions, which is annually increasing by 1.6% in the past decade [5]. Indeed, the decarbonization of the mobility sector requires the combination of battery electric vehicles (BEVs), fuel-cell electric vehicles (FCEVs), biofuels, and synthetic fuels produced by non-fossil feedstock and low-carbon energy sources or through carbon capture and utilization [6].
BEVs are commercially available for short–medium distance road transportation, but the main drawbacks are related to the low energy density (low power-to-weight ratio) of batteries. Indeed, the battery size remarkably affects the battery cost, competitiveness and its applicability to heavy-duty vehicles, shipping and aviation. Hannula et al. [7] estimate that for a 135 km range, the BEVs equal-cost oil price is 66 $/bbl, which could compete with the fossil fuel price. Further, increasing the range to 500 km, the equal-cost is 243 $/bbl.
Biofuels are widely available and competitive to achieve market penetration. The EU directive 2003/30/EC [8] established targets of biofuels and other renewable fuels utilization in the transport sector. Most vehicles of the European Union are capable of using low biofuel blends, and the Member States should introduce a minimum proportion of biofuels allocated for transport purposes. Targets were set to 2% by 2005 and 5.75% by 2010, and the EU directive 2009/28/EC [9] establishes the target to 10% by 2020. However, biofuels are not sufficient to sustain the transport sector decarbonization due to the relation between bioenergy and land-use change (LUC) and the competition with food production [10].
Instead, carbon-neutral synthetic fuels enable a gradual transition to the decarbonization of mobility, especially in long-distance and heavy transport because the gas storage in low volumes is more effective than electric power in batteries. FCEVs are vehicles that use the hydrogen stored in a pressurized tank to feed fuel cells for electric power generation. Driving performance and refueling time are comparable to conventional cars; therefore, fuel cell vehicles are a promising solution to substitute conventional cars by reducing GHG emissions [11]. The International Renewable Energy Agency (IRENA) [12] analyzes the hydrogen production sources and future perspective. Nowadays, approximately 120 Mtons of hydrogen are produced each year, accounting for approximately 4% of global final energy and non-energy consumption.
Approximately 95% of the hydrogen produced worldwide today is derived from methane in fossil fuels without carbon capture, primarily through steam methane reforming (SMR), followed by coal and oil. Hydrogen is mainly exploited in the industrial sector for the production of ammonia and oil refining [13]. The hydrogen produced from fossil fuels is cost-effective but not environmentally sustainable since the emission factor ranges from 285 gCO2/kWh if derived from SMR to 675 gCO2/kWh from coal gasification. Further, CO2 emissions could be higher compared to direct combustion of fossil fuels due to process losses [14].
An alternative to reduce CO2 emissions is hydrogen generation from fossil fuels with carbon capture utilization and storage (CCUS), the so-called blue hydrogen, able to recover 85%–95% of the CO2 emissions [14]. Three common capture strategies are available: (i) the post-combustion carbon capture and removal at low pressure and low concentration, (ii) pre-combustion removal from syngas produced by SMR or gasification, and (iii) oxyfuel processes with recycled CO2 and steam that result in high CO2 concentration and easy removal by condensation [15].
The cleanest way to produce hydrogen is through water-splitting technologies coupled with renewable energy sources. The Hydrogen Council [16] estimated that, by 2030, a surplus of renewable electric power that ranges between 250 and 300 TWh could be converted to hydrogen, and 200 TWh of electricity could be generated from hydrogen.
A comprehensive review of hydrogen production pathways from fossil, biomass, and water feedstocks are described in [17,18,19]. Several authors have reviewed hydrogen and syngas generation through catalytic roots such as steam reforming and partial oxidation, with or without carbon capture, for the conversion of fossil feedstocks in a low-carbon emissions fuel [20,21,22,23,24]. The biological conversion of biomass through fermentative processes and the dissociation of water by microalgae (direct biophotolysis) or cyanobacteria (indirect biophotolysis) are widely discussed by [25,26,27,28,29,30,31,32]. Fermentative processes exploit food waste, industrial and forest residuals as useful resources for biofuel production [25], while biophotolysis consists of water-splitting reactions [33]. However, technologies are at the earlier research stage. The conversion efficiency of biophotolysis is below 1%, while a critical issue of fermentative processes is the low amount of hydrogen produced per mole of the substrate [27]. An overview of hydrogen generation from renewable energy sources including electrochemical, photochemical and thermochemical processes is reported in [34,35,36,37,38]. Orhan and Babu [39] analyzed the hydrogen production through water splitting by combining nuclear and solar energy sources. They also described the hydrogen storage alternatives and fuel cell technologies for hydrogen conversion to electricity, water and heat. The hydrogen supply chain is also investigated in [40], which describes hydrogen production, storage and end-use appliances also with a focus on safety and detection issues but does not mention the transport through gas networks. Instead, the hydrogen production, transportation and storage are wholly analyzed by [41,42,43].
Syngas production through biomass gasification and pyrolysis and post-treatment for gas cleaning and upgrading are well-known processes broadly disclosed in [44,45,46,47,48,49,50]. Similarly, the anaerobic digestion for biogas production is a well-known and commercialized route [51,52,53,54,55,56,57,58]. Indeed, thermochemical and electrochemical processes for syngas generation are at the earlier research stage and are reviewed in [59,60,61,62]. Moreover, catalytic and biological CO and CO2 methanation reactions, described in [63,64,65,66], are employed to improve the quality of gases such as syngas, biogas or hydrogen and generate synthetic methane.

1.2. Motivation of This Work

In this review, we analyze the hydrogen and synthetic natural gas supply chains. Our focus is both on gas production and possible pathways for gas end uses (see Figure 1). This approach allows an overview of the potential of green synthetic fuels to enter the market, analyzing not only the economic and technological feasibility of renewable fuels generation but also their application in end-use facilities. Particular attention is also paid to safety problems related to the quality of gases for transport, storage and conversion in energy power. Indeed, in the literature, there are many studies about synthetic fuels technologies, sources and storage separately. However, only a few works give a comprehensive overview of the synthetic gaseous fuels supply chain.
The focus is on catalytic processes based on non-fossil feedstock (biomass, water and carbon dioxide) and enhanced by electricity or heat provided by renewable energy sources. Therefore, steam reforming and partial oxidation of fossil feedstocks and biological conversion of biomass and water are not considered in our analysis. Indeed, biological reactions occur under solar irradiation but are not enhanced by electric or thermal power generated by renewable energy sources.
Green synthetic gas generation routes analyzed are based on thermochemical and electrochemical routes. Hydrogen is generated by splitting water molecules via thermochemical cycles or electrochemical processes such as photoelectrochemical and electrolytic cells. Whereas, syngas is derived by the thermochemical conversion of biomass (pyrolysis and gasification processes) and via electrolysis and thermolysis of water and carbon dioxide. Syngas quality is not suitable for end-use application; therefore, it is enhanced by catalytic methanation processes.
For each gas generation process, we describe the main technological and operating characteristics, chemical reactions, and recent progress in materials and device configurations for the enhancement of process efficiency. An extensive focus is directed to electrochemical process since electrolyzers appear to be the most promising and cost-effective technologies with zero-carbon emissions. Moreover, the technology readiness level (TRL) and the leading worldwide pilot and demonstration plants are outlined. Indeed, performances, costs and availability of production technologies are related to the maturity of the generation route.
Finally, the green synthetic fuels supply chain is explored, analyzing the gas quality requirements for safe fuels injection in the natural gas grid and fuel cells, the storage alternatives and their applications, and the effects of the gas composition on combustion emissions and safety of end-use appliances.

2. Heat-to-Gas Routes

The conversion of solar radiation realizes thermochemical solar fuels via concentrated solar power (CSP) technologies into heat that is needed to carry out high temperature reactions. The main thermochemical processes that exploit only renewable and abundant resources without GHG emissions are water thermolysis and thermochemical cycles that need only water, carbon dioxide and concentrated solar power. Other thermochemical routes for solar power production (steam reforming, cracking and gasification) require fossil fuels as raw materials [67]. In this review, only the two emission-free processes are analyzed.

2.1. Solar Water Thermolysis

Solar water thermolysis consists of a single-step direct thermal decomposition of water molecules into hydrogen and oxygen carried out by the exploitation of concentrated solar power. The chemical bond between oxygen and hydrogen requires high bond-dissociation energy. Therefore, the reaction is enhanced by high temperature above 2500 K to obtain a suitable product yield (at 1 bar and 2500 K the dissociation efficiency is approximately 10%) [68]. Solar radiation is first collected and concentrated using a concentrated solar power collector. The required concentration ratio of CSP is of the order of 10,000, and the incident solar energy required is of the order of 10 MW (reached with parabolic dish concentrator, double-concentration systems or solar tower with a heliostat field) [69]. The thermolysis reactor is a refractory nozzle in which the liquid water flows continuously and is vaporized and dissociated. The high temperature needed for the reaction requires the use of special materials such as oxide ceramics including yttria, zirconia and magnesia [70]. The dissociation is partial, and the output depends on temperature and pressure. The process can be summarized by the overall endothermic reaction [71]:
H 2   O   x 1 H 2   O +   x 2 OH + x 3 O + x 4 H + x 5 H 2 + x 6 O 2
The methods used for the energy transfer to water molecules are: (i) bulk heating of water vapor in a furnace cavity with a fluid tubular wall; (ii) direct contact of cold vapor with a hot solid layer covering the walls of the cavity reactor and (iii) direct contact of liquid water with the hot solid plate [72].
The separation of the resulting gas mixture constitutes a critical issue due to the risk during slow cooling of recombination of hydrogen and oxygen that could lead to an explosive mixture. Indeed, the lower limit of flammability of a mixture of oxygen and hydrogen is approximately 5%. The separation is realized via two main processes: at the reaction temperature or after a rapid quenching.
The product separation at the gas temperature is carried out by the continuous removal of one of the reaction products enhancing the thermolysis reaction and preventing the recombination. The separation is obtained via a variety of methods [71,72]:
  • Microporous ceramic membranes made of refractory materials in sub-atmospheric pressure reactors that allow selective separation of a species [73].
  • Membranes semipermeable to oxygen made by a high temperature solid electrolyte material (ZrO2, CaO, CeO2, Y2O3, perovskite) placed in a chemical potential gradient. The mixed ionic and electronic conducting (MIEC) membranes are realized with refractory oxides with a mixed type of electrical conductivity with ionic and electronic components. In the presence of a gradient of oxygen pressure, a chemical potential induces migration of oxygen ions across the membrane, and an electron current circulates in the opposite direction due to electronic conductivity of the material [74].
  • Metallic membranes made of palladium and its alloys. Hydrogen is dissociated on the nonporous metallic membrane surface, and its atoms diffuse through the membrane and are desorbed and recombined after the membrane [20,75].
  • A rotating cylindrical vessel in which the gas mixture could pass through. The centrifugal field of force modifies the equilibrium pressure of species, separating them [76].
  • Supersonic jets generated by expanding a gas mixture rich of dense gases near the jet axis and with lighter gases on the external part. This distribution leads to beam deflection and gas separation due to centrifuge forces in the curved flow [77].
The diffusion flow increases with high temperature and a high-pressure gradient.
The product gas separation via rapid quenching is realized by cooling the product gas at a cooling rate of 105–106 K/s by the direct contact with a cold auxiliary fluid. The quenching is a highly irreversible process, and it permits to recover hydrogen up to 90%. The temperature of the cold, inert fluid is 450–500 K, since the temperature should decrease by 1500–2000 K in a few milliseconds [78]. The cooling rate must be faster than the rate of heat released by the recombination reaction. The quenching process is realized either in an external vessel or internally in the reactor (auto-quenching). The hot gas is cooled down by heat exchange cooling, auto-cooling by the jet of cold stream, auto-cooling by direct contact with cold water or by rapid turbulent cold gas jets [79].

2.2. Thermochemical Cycles

Thermochemical cycles are a suitable process for the production of both syngas and hydrogen. Water splitting via thermochemical cycles addresses problems related to the separation of product gases since the production of hydrogen and oxygen occurs in different steps. The operating temperature needed is relatively low (1100–1500 K) [80]. If only water constitutes the inlet fluid, the product gas is hydrogen, whereas if a mixture of water and carbon dioxide is introduced in the reactor, syngas is generated. Therefore, water, carbon dioxide and heat are the input and oxygen, carbon monoxide and hydrogen the only output. The other reagents are regenerated in a closed loop. The production of pure hydrogen without contaminants allows the direct utilization in fuel cells. Cycles are generally composed of two or three steps and involve metal oxide redox reactions. Two-step thermochemical cycles require high temperature, but also the efficiency of the overall reaction is high. The difference of temperature of oxidation and reduction reactions is the thermodynamic driving force for two-step thermochemical water splitting.
In the first step, the metal oxide (MOox) is thermally dissociated to the metal form or the lower-valence metal oxide (MOred), and oxygen is released (see Figure 2). The reaction is highly endothermic and requires high temperatures [67].
High-temperature reduction (activation step):
MO ox MO red + 1 2   O 2
In the second exothermal step, the hydrolysis of the reduced metal oxide and water splitting occurs. Pure hydrogen and the primary metal oxide are produced. The pure metal oxide is recycled back to the solar reduction reactor, closing the material cycle.
Low-temperature oxidation with H2O (H2 generation step):
MO red +   H 2 O MO ox + H 2
Similarly, syngas could be obtained by introducing a mixture of CO2 and H2O in the reactor vessel. CO2/H2O thermochemical cycles are a possible route for the utilization of the carbon dioxide captured from other processes.
Low-temperature oxidation with CO2 (CO generation step)
MO red + CO 2 MO ox + CO
The previous reactions may be classified as oxide type and are the most investigate nowadays, but other two types of reaction are developed: the hydride type and the hydroxide type [81].
Hydride   type :   MH 2   M + H 2
M + H 2 O MH 2 + 1 2   O 2
Hydroxide   type :   2 MOH 2 M + H 2 O + 1 2   O 2
2 M + 2 H 2 O 2 MOH + H 2
Many thermochemical cycles with metal oxide redox couple have been proposed [82], including Fe3O4/FeO [83,84,85,86], TiO2/TiOx [87], Mn3O4/MnO [88], Co3O4/CoO [89,90], ZnO/Zn [86,91,92], SnO2/SnO [93,94,95], CeO2/Ce2O3 [96,97], CdO/Cd [98,99] and W/WO3 [100]. The most investigated materials are zinc, iron and ceria metal oxides. Nakamura [101], in 1977, first proposed a two-step thermochemical cycle based on Fe3O4/FeO. Iron oxide has a great reduction capacity that enhances the product yield, but the high volatility of ferrite oxides reduces the lifetime of the material and increase operational cost. Ceria is more stable than ferrite but requires a higher temperature in the activation step [102]. Zinc is probably the most promising metal oxide redox pair for its high energy efficiency (44% with heat recovery from the quenching process and 29% without the heat recovery) [86,91]. The use of mixed metal oxides could decrease the reduction temperature required and increase the melting point. Mixed metal oxides are generated by the partial substitution of the primary materials with dopants including Mn, Co, Ni, YSZ and Zn for ferrite cycles [103,104,105,106,107,108], and Zr, Hf, La, Pr, Sm, Gd and Tb for ceria cycles [109,110,111,112,113]. The theoretical energy conversion efficiency of the iron oxide cycle is 39% and up to 75% by recuperating the high-temperature heat and 28% for un-doped ceria without heat recovery [114,115].
Some of the redox pairs, when reduced, mutate to the gaseous phase (for example, the reduction of ZnO and In2O3 to gaseous Zn and In2O, respectively) [80,81]. Volatile cycles are thermodynamically more advantageous, since the formation of the vapor product ensures a higher entropic gain. However, a quenching reactor is needed after the activation step to avoid possible recombination with oxygen and to recover the reduced metal oxide in the condensate phase [116,117]. Non-volatile cycles allow the continuous removal of oxygen from the solid metal oxide, avoiding the recombination and quenching problems.
Three-step thermochemical water splitting is similar to two-step thermochemical cycles, but the former generally requires a lower maximum temperature. However, three-step cycles involve a higher complexity of the plant. Reactions involved in a three-step metal oxide cycle are:
MO ox MO red + 1 2   O 2
MO red + 2 M OH   M 2 O · MO ox + H 2
M 2 O · MO ox + H 2 O MO ox + 2 M OH
In the first step, the metal oxide (MOox) is thermally decomposed to the metal form or the lower-valence metal oxide (MOred), and oxygen is released. In the second step, the reduced metal oxide (MOred) reacts with an alkali metal hydroxide (2M’OH) generating a mixed oxide (M’2O•MOox) and hydrogen. In the third reaction, the mixed oxide is hydrolyzed by the steam regenerating the metal oxide and the alkali metal hydroxide [118]. Sulfur–iodine (S–I), copper–chlorine (Cu–Cl) and magnesium–chlorine (Mg–Cl) are the most promising and investigated three-step thermochemical cycles.
In Figure 3 a schematic diagram of the sulfur–iodine thermochemical cycle is proposed. The maximum temperature required is 1100–1200 K in the first endothermic chemical reaction in which the sulfuric acid (H2SO4) is decomposed into steam, sulfur dioxide (SO2) and oxygen. In the second step, the Bunsen reaction occurs at 300–400 K. Iodine and water enter the reactor and promote the formation of sulfuric acid and hydroiodic acid (HI) reacting with sulfur dioxide. Finally, in the third step, the hydronic acid is split in iodine and hydrogen at 600–800 K [119]. Some drawbacks are the corrosive nature of the species and the poisoning of the aqueous acid phases (HI and H2SO4) that requires additional energy-expensive treatments to separate these compounds. Caple et al. [120] propose an experimental feasibility analysis of a novel sulfur-sulfur cycle that abolish the need for the processing of hydroiodic acid. Yilmaz et al. [121] evaluate the exergy and energy efficiency of the S–I thermochemical cycles by varying several parameters, including operational conditions, state properties and reference environment. The computed thermochemical cycle energy efficiency is 43.85%, and the efficiency of the whole system is 32.76%. The exergy efficiency is 62.39% and 34.56% for the cycle and the whole system, respectively.
The copper–chlorine thermochemical water splitting requires a maximum temperature slightly lower than S–I cycles. Low temperature allows the coupling with various heat sources (mainly nuclear reactors) [122]. Moreover, in Cu–Cl cycles, fewer challenges of equipment material and product separation occur, but the higher price of electricity than heat reduces these advantages from an economic viewpoint [123]. The oxygen production occurs at approximately 800 K, and it represents the maximum temperature needed. However, Cu–Cl cycles also involve electrical energy for the electrolysis step in which hydrogen is produced [124]. In the electrolysis step copper(I) chloride (CuCl) reacts in an aqueous solution with hydrochloric acid (HCl) giving rise to copper(II) chloride (CuCl2) and H2. After drying, CuCl2•H2O is hydrolyzed and forms the solid-phase melanothallite (CuOCuCl2) and HCl. Finally, CuOCuCl2 generates the molten salt CuCl and oxygen through an endothermic reaction [124,125]. Balta et al. [126] propose an energetic and exergetic analysis of a Cu–Cl thermochemical cycle coupled with a geothermal source for hydrogen production via a parametric study. The overall energy efficiency obtained is 21.67%, and the exergy efficiency is 19.35%.
Magnesium–chlorine thermochemical cycles have been developed as an alternative to the single-step reverse Deacon reaction in a two-step chemical loop by Simpson et al. [127]. Three-step hydrogen production is a hybrid thermochemical-electrolytic process, such as Cu–Cl cycles. It involves two thermochemical reactions that require a maximum temperature of 700–800 K and one electrolytic process. In the first step, the magnesium dichloride (MgCl2) reacts with steam and is split in magnesium oxide (MgO) and HCl. The second step involves the reaction between MgO and chlorine (Cl2), generating O2 and MgCl2. The last step concerns the electrolysis of anhydrous HCl into H2 and Cl2 [128,129]. Balta et al. [130] perform the parametric study of energy and exergy efficiency also for this process. The overall energy efficiency obtained is 63.63%, and the exergy efficiency is 34.86%.

2.2.1. Reactors

The solar reactor is the item that receives and transforms the solar radiation into thermal energy.
The reactor has to endure high temperature and high heating rate, promote the heat transfer and reduce energy losses. The requirement of high temperatures is a critical issue of thermochemical water splitting due to the risk of the thermal shock of reactor walls. Further, the reactivity and corrosivity of some reactants (e.g., sulfur and iodine) and the strong oxidizing environment necessitate materials resistant to corrosion. Possible solutions are the use of compatible materials (e.g., ZrO2, graphite or silicon carbide) and the design of reactors to prevent direct contact between chemicals and wall materials [115].
In 1995, Tamaura et al. [131] proposed a first two-step water-splitting cycle, demonstrated experimentally in the solar furnace of the Paul Scherrer Institute, with a two-stage concentrator system and a tubular packed-bed reactor of quartz.
Gokon et al. [132] propose and demonstrate on a laboratory-scale prototype reactor a thermochemical two-step water-splitting cycle using an internally circulating fluidized bed reactor with a redox system of iron-based oxides and ferrite. The cylindrical reactor was made of stainless steel with a beam-down transparent optics. The beam-down optics is a quartz window installed in the ceiling of the reactor to prevent contact between particles and the transparent window. Particles are transported upwards in a draft tube where are directly heated by concentrated solar radiation and move downward in the annulus region. The particles circulation guarantees solar energy transfer from the top to the bottom. The circulating fluidized bed reactor provides a more uniform temperature distribution compared to a packed-bed reactor.
The German Aerospace Center (DLR) develops in the past years fixed coated ceramics reactors as a promising alternative to packed-bed reactors within the project HYDROSOL (HYDROgen production in a SOLar monolithic reactor) [133]. Reactors are realized by a ceramic multi-channeled monolithic honeycomb structure; within are incorporated active iron-oxide-based redox pairs. Walls are coated with silicon carbide (SiC) that ensures high thermal shock resistance, high mechanical strength and high thermal conductivity allowing the operational temperature of approximately 1073–1473 K. The whole plant was tested at the laboratory scale in the solar furnace at DLR, in Cologne.
Fluid-wall reactor configuration appears as a promising technology to control high temperature and corrosivity of thermochemical cycles. The heating rate is very high (up to 105 K/s), and the graphite structure allows ultra-high operational temperatures. The graphite solar-powered fluid-wall aerosol flow reactor has been studied principally for the decarbonization of methane [134]. The reactor is realized with three concentric vertical tubes: the inner tube (“reaction tube”) is made of porous graphite; the central tube (“heating tube”) is composed of solid graphite; the outer tube (“protection tube”) is made of quartz. The concentrated solar power enters through the outer tube that is either totally or partially transparent and heats directly the center solid graphite tube that radiates to the inner porous graphite tube. A non-oxidizing atmosphere is guaranteed by feeding an inert or compatible gas such as argon, helium, neon or nitrogen that flows radially through the porous graphite tube to prevent contact and reactions between graphite and process chemicals (reactants and products). The realization of the protection tube with a quartz window instead of the totally transparent tube provides a reflective inner surface that increases the thermal efficiency [135].
Tapia et al. [136] propose a thermal design and experimental test for a multi-tubular solar reactor (see Figure 4d). The solar radiation enters inside the semi-cylindrical cavity and is absorbed by the alumina tubes in which the ferrite pellets involved in the thermochemical cycle are placed. Furler and Steinfeld [137] propose a dynamic numerical model and test a cavity receiver with a circular quartz window containing a cylinder of reticulated porous ceramic foam made of ceria to develop novel reactor design and configuration to improve energy-to-fuel conversion efficiency.
Also, rotary-type solar reactors have been researched and tested for water-splitting thermochemical cycles. Kaneko et al. [138] manufacture a solar reactor with a beam-down quartz optics that has a cylindrical rotor and dual cells for discharging O2 and for splitting H2O. The rotor is coated with reactive ceramics (CeO2 and Ni, Mn-ferrite). By the rotational movement of the rotor, each fraction of the reactive ceramics is reduced in the O2 releasing cell and split water in the other cell by the rotation. Argon gas is injected to both cells to carry out the gaseous products.
Schunk et al. [139] propose and test reactor prototypes that consist of a multilayer cylindrical rotary cavity receiver made of ZnO tiles placed on a ceramic structure and ZnO particles. The rotation of the rotor forces the oxide particles to the edge of the reactor where they are exposed to solar irradiation. ZnO operates as a radiant absorber, a chemical reactant and a thermal insulator and argon gas is added to protect the quartz window from condensed zinc. Diver et al. [140] propose a two-step solar-driven thermochemical reactor based on iron and ferrite oxide. The reactor is realized with a stack of several counter-rotating rings with fins that contain reactive metal oxide. During the reactor rotation, the reactive material pass through the irradiated zone where is reduced. On the opposite side, water splitting occurs. The oxidized ferrite materials enter into the recuperation zone in which they heat up while the neighboring fins move in the opposite direction cool down.
Finally, the Center for Research and Technology Hellas in Thessaloniki proposes a perovskite redox membrane reactor for the isothermal and continuous production of high purity hydrogen. The reactor consists of two compartments separated by the membrane. Water vapor is introduced in the oxidizing side and is split, producing hydrogen and oxygen. Oxygen ions diffuse in the membrane lattice and are desorbed in the opposite membrane side. To enhance the desorption process, an oxidable agent could be introduced [141].

2.2.2. Technology Readiness Level

Water direct thermolysis and thermochemical cycles are researched mostly at the laboratory scale, but only a few processes have been tested in all steps, with integrated experimental demonstration cycle closure. Direct thermolysis is unlikely in the near term due to the high temperature requirement and the need to separate products after the reaction process [115]. However, recently, several pilot and demonstration plants concerning two-step and three-step thermochemical cycles have been developed worldwide.
A 4 kWth solar reactor prototype (TRL 4–5) has been tested at ETH’s high-flux solar simulator facilities to experimentally validate the numerical model proposed by Furler and Steinfeld for the heat and mass transfer computational simulation of a cavity receiver containing a reticulated porous ceramic foam made of ceria (see Figure 4c) [137].
The international collaboration of Japan and Australia in Asia-Pacific Partnership on Clean Development and Climate (APP) project have carried out a test operation of the Tokyo Tech solar rotary-reactor using the solar concentration technology of National Solar Energy Centre at Commonwealth Scientific and Industrial Research Organization (CSIRO). The power input is 50 kWth from the solar concentrator system with 10 heliostats and two-step water-splitting thermochemical cycle with reactive ceramics of ceria-based solid solution is performed in a beam-down rotary-reactor [142].
In the framework of the SolH2 project (an INNPACTO initiative of the Spanish Ministry of Economy and Competitiveness), a 100 kWth multi-tubular reactor proposed by Tapia et al. [136] has been built and tested in the SSPS-CRS facility of the Plataforma Solar de Almería (PSA) to demonstrate the technological feasibility of solar ferrite thermochemical water-splitting cycles [143].
A demonstration plant with a thermal input of 100 kWth for the water thermal dissociation based on ZnO was designed and tested at the large-scale solar concentrating facility of PROMES-CNRS (PROcédés, Matériaux et Énergie Solaire-National Centre for Scientific Research) MegaWatt Solar Furnace (see Figure 4a) [144,145]. This project followed the previous 10 kWth pilot plant of a rotary cavity receiver experimentally demonstrated at PSI’s High-Flux Solar Simulator by Schunk et al. [139].
Within the EU-funded project, the HYDROSOL Plant has been developed and implemented an industrial-scale plant of a two-step thermochemical cycle with a temperature up to 1400 °C. A plant on a solar tower of the PSA has been built with monolithic reactors based on the fixed coated ceramics reactor proposed by DLR researchers [133]. A plant with a thermal input of 100 kWth (HYDROSOL and HYDROSOL-II) and with two ceramic multi-channeled monolithic honeycomb reactors coated with nickel-ferrite reactive species was previously realized [146,147]. In 2016, this plant was scaled-up to 750 kWth (HYDROSOL-3D) using three monolithic reactors with a foam structure wholly made of nickel-ferrite powders to overcome the problem with the coating of ceramic (see Figure 4b) [148].
For the commercialization of water-splitting thermochemical reactors, further research is needed to develop competitive thermochemical plants. The research should focus on reactor materials resistant to high temperature, thermal shock and chemical corrosion, on quenching processes of products and on the separation of reactants (e.g., in S–I cycles). Moreover, further development of solar concentration technologies is needed to enhance the total conversion efficiency that ranges between 35% and 50% and to reduce concentrator cost that contributes to approximately a half of the total capital cost of the plant [92,149].

3. Power-to-Gas Routes

Electrochemical processes convert water into hydrogen and oxygen, exploiting an external circuit that transfers the photogenerated electrons or electricity provided by renewable sources (photovoltaic, wind, geothermal, hydroelectric).

3.1. Electrolysis

Water electrolysis consists of splitting water molecules into hydrogen and oxygen through the application of an electric potential. Main components of an electrolyzer are two electrodes soaked in a liquid or solid electrolyte and a separator [151]. Electrodes are made of semiconductor materials that catalyze the water-splitting reaction. Electrons provided by the external power generator are injected into the negatively polarized cathode in which the reduction reaction occurs, and hydrogen is generated. The oxidation reaction takes place at the anode in which oxygen and electrons are delivered. The electrons are injected into the external circuit and the anode is positively polarized. Electrode materials have to be resistant to corrosion, provide high electric conductivity and catalytic activity. The electrolyte enhances the ion conductivity, electrically isolates electrodes preventing short-circuit and partitions the product gas streams, avoiding the formation of a flammable mixture. If the electrolyte is in the liquid phase, a separator is introduced for electrical isolation and products division. Both electrolyte and separator have to be highly stable [152]. Electrolyzers are classified in three leading electrolysis technologies (see Figure 5): (i) the alkaline electrolyzer characterized by an aqueous alkaline electrolyte with sodium or potassium hydroxides; (ii) the proton exchange membrane electrolyzer denoted by the polymeric membrane, typically Nafion®, and (iii) the solid oxide electrolyzer that operates at high temperature (600–900 °C) [18]. Additionally, in recent years, microbial electrolysis cell, a new technology based on microorganism anaerobic respiration, is extensively researched.
The overall energy demand (ΔH) for the thermodynamic decomposition of water can be supplied partially by electric energy (ΔG) and the remaining by thermal energy (ΔQ) (Equation (12)). At standard temperature and pressure, the reaction requires a minimum theoretical voltage (reversible voltage, Urev) of 1.23 V that is related to the change in Gibbs free energy as expressed in Equation (13), where z is the number of moles of electrons per mole of products and F is the Faraday constant. Instead, the thermoneutral voltage (Uth) is the minimum voltage for the ideal water-splitting reaction without heat integration. The thermoneutral voltage is proportional to the enthalpy of the overall reaction (Equation (14)) and is approximately 1.47–1.48 V if the water inlet temperature is below 100 °C and 1.26–1.29 V if steam is supplied at temperatures up to 1000 °C. If the cell operates at a voltage above the thermoneutrality, external cooling is needed [154].
Δ H = Δ G + Δ Q
U r e v = Δ G z F
U t h = Δ H z F
Nevertheless, in real condition, an extra voltage is involved in overcoming energy losses due to irreversibility. The cell voltage is defined as the sum of the reversible cell voltage and all the overpotentials that may occur in the cell.
U = U r e v + η o h m + η a c t + η d i f f
Energy losses are mainly due to: (i) ohmic overvoltage (ηohm) that is related to resistances to ion conduction in the electrolyte and through the membrane, bubbles formation and resistances to electrons transfer in electrodes and external circuit; (ii) activation overvoltage (ηact) that is related to the kinetics of electrochemical reactions at both electrodes, and (iii) diffusion overvoltage (ηdiff) due to mass transport of molecules that diffuses through the electrodes pores [155]. The polarization curve (Figure 6) is the plot of the voltage across the electrodes and the current density. The slope of the polarization curve provides information about the overpotential losses [156].
A relevant issue is the formation of bubbles that promotes high overpotential and ohmic voltage drop. Bubbles nucleate and grow on electrodes surface through the supersaturation of H2 and O2 produced [158]. The coverage of the active sites reduces the area of the electrodes available for the reaction, forming an insulating layer. Further, when the detachment of bubbles from the electrode occurs, the mass transport of electrolyte is reduced, and the diffusion overvoltage increases due to bubble dispersion and rapid movement [159]. Therefore, the rapid detachment and removal of the bubble are needed to reduce overpotential and ohmic losses and increase ion conductivity [160]. The process intensification by external fields such as rotating electrodes, centrifugal or supergravity, magnetic and ultrasonic fields and zero-gap configuration is an attractive approach to overcome bubble problems and enhance mass transport and, thus, electrolyzers performances [161].
The total mass production rate ( m ˙ H 2 ) is defined as the product of the Faraday efficiency (ratio of the real hydrogen flow-rate to its theoretical value), the number of cell stack (nc) and the current (I) divided by the Faraday constant multiplied by two [162].
m ˙ H 2 = η F n c I 2 F
The electrolyzer efficiency depends on operational parameters. If the current density decreases, efficiency rises due to fewer overpotential losses, but the mass rate of the hydrogen production decreases and the active surface area required increases [163].
The temperature has a substantial impact on process efficiency that increases with temperature growth since the mass transfer phenomena are enhanced, but materials and degradation issues restrict the feasible operational range [164]. Instead, the increase in pressure slightly influences efficiency that declines but is attractive to avoid the subsequent compression stage that enlarges energy and economic costs [165].
The electrolysis module is established connecting cells in series or parallel. When cells are connected in parallel, each electrode is connected to the power generator, so has a single polarity and the module is called monopolar. Otherwise, when cells are connected in series, the current from the power supply is driven into the first cell and circulates through all electrodes. Each interconnector is subjected to two polarities, so in series-configuration is named bipolar module or cell stack and the materials used must be chemically stable in both oxidizing and reducing environments [152]. Unipolar design is simple, reliable and flexible. The bipolar configuration is more compact, induces lower ohmic losses and are more suitable for high-pressure electrolyzers. Still, the requirement of electrolyte circulation and, therefore, of channels or the need for gas/electrolyte separators increases losses due to parasitic currents [166].

3.1.1. Alkaline Electrolysis Cells

Alkaline electrolysis is a mature technology, characterized by good stability, long lifetime and cost-effectiveness. The large-scale hydrogen production via alkaline electrolysis started in the first years of the 20th century [154]. Alkaline cells are typically connected in series through a bipolar plate establishing a stack. However, the drawback is the low maximum power density due to the limited mass transport in a liquid electrolyte and the bubble formation [167]. Low-cost nickel-based electrodes are tolerated as a result of the non-corrosiveness of the electrolyte. Electrodes are fully immersed in an aqueous solution containing a strong base compound, such as sodium hydroxide (NaOH) or potassium hydroxide (KOH) [166]. The ionic transfer and electric conductivity of the electrolyte strongly depend on type and concentration [168]. Typically, 20%–40%wt of KOH or NaOH is adopted, since a higher concentration reduces the water activity [169]. The partition of the product gases is ensured by a separator that generally is a porous diaphragm or a polymeric membrane. The characteristics required to a porous separator are high porosity and wettability to be filled by the electrolyte as well as high electrical resistance, high selective ionic conductivity and low ohmic drop [170]. Diaphragm materials are porous ceramics (e.g., asbestos and glass frits), and porous polymers (e.g., porous polyvinyl chloride (PVC), polyolefins, and PTFE). Polymeric membranes are exclusively permeable to either anion or cation and are realized dispersing into a polymeric matrix the functional groups devolved to enhance the ion mobility [166].
The hydrogen evolution reaction that occurs at the cathode consist on the water dissociation (Equation (17)) through the Volmer step (Equation (18)) which involves the absorption (e.g., Ni-based catalysts) or adsorption (e.g., Pt-based materials) of protons into the electrode active sites, and the hydrogen desorption via Heyrovsky (Equation (19)) or Tafel (Equation (20)) reactions. The overall oxygen evolution reaction, expressed by Equation (21), occurs at the anode. The hydroxide is oxidized involving multiple intermediate steps [171].
2 H 2 O + 2 e H 2 + 2 OH   ( overall   HER   reaction )
H 2 O + e H ad + OH   ( Volmer   step )
H ad + H 2 O + e H 2 + OH   ( Heyrovsky   step )
2 H ad H 2   ( Tafel   step )
2 OH 1 2 O 2 + H 2 O + 2 e   ( overall   OER   reaction )
The product gas quality is in the range of 99.5%–99.9% for H2 and can be increased up to 99.999% with gas purification treatments [154]. The operational power density is restricted to 20%–100% of the available nominal power as at low loads the crossover effect (oxygen diffuses across the diaphragm and reacts back with hydrogen) could lead to dangerous mixtures [172]. The coupling with intermittent and fluctuant energy sources is possible although problems occur when the power density is below 20% of the nominal load and during the start up of the system since the cold start time that ranges between minutes and hours is relatively high [173].
Nowadays, the research is focused on improving the efficiency of the process, reducing cell resistance and enhancing ion and electric conductivity. The main improvements are: (i) new cell configurations including a zero-gap design and low-resistance diaphragms, (ii) high operational temperature, and (iii) new catalysts such as mixed-metal coating with cobalt oxide and Raney nickel [174].
The “zero-gap” configuration or gas diffusion layer (GDL) is adopted to avoid bubble formation near the electrodes. The zero-gap design uses porous electrodes deposited onto an anion exchange membrane reducing the inter-electrode gap (lower than 0.5 mm rather than above 2 mm). The catalyst can be deposited directly on the polymeric membrane, forming the catalyst-coated membrane (CCM). Otherwise, the catalyst can be coated on a porous substrate and compressed onto the membrane, forming the catalyst-coated substrates (CCS) [175]. Zero gap solution reduces the electrolyte resistance and facilitates the gas bubbles releasing from the backside of the electrodes [176]. The gas diffusion layer is a porous layer with large carbon or nickel particles incorporated in a binder. The function is the transport of fuel and products and the electric connection between the electrodes and the external circuit. The GDL is carved into the metal body in which are placed the porous electrodes and the polymeric separator [177]. The electrolyte flow across the gas diffusion layer within a recirculation loop promoting the gas bubble detachment and removal [159].
The overpotential can also be reduced, introducing a third intermediate electrode. The hydrogen and oxygen production steps take place in successive processes obtaining a production of hydrogen of higher purity and lower ohmic resistance due to the lower thickness of the diaphragm [178].
The typical operating temperature and pressure are 70–100 °C and 1–30 bar, respectively [174]. The temperature enhances the entropy energy and, therefore, reduces the electric energy required [179]. The activation overpotential and ohmic drop are strictly related to operating temperatures: high temperatures positively affect the electrolyte ion-conductivity and electrode kinetics, but negatively affect the corrosion resistance of electrocatalysts [180]. At a given temperature, the pressure has to be suitably set since too high pressure induces condensation of steam, but too low pressure could result in the evaporation of the electrolyte [181]. The required voltage slightly increases with pressure increase, but the main advantage is the reduction of energy demand for hydrogen compression.
The rate-determining step of the water electrolysis is the adsorption reaction that occurs at the cathode. Catalysts under investigation for both improved activity and stability of the electrodes could be classified in three groups: (i) noble metals such as Pt, Pd, Ir, Ru, Ag and their alloys including binary-alloy based on Pt with Sm, Ho, Ce or alloys with low-cost transition metals or doped with non-metal compounds, (ii) transition metals including Ni, Mn, Cu, Mo, W, Co, Fe and their alloys, and (iii) non-metal elements e.g., C, N, S, O, P and their alloys [182].
The inexpensive nickel-based catalyst is the most studied materials as an alternative to precious and low-abundant platinum-based materials. The Ni-based catalyst offers a good catalytic activity but is affected by long-term instability due to the formation of nickel hydride compounds that induce the overpotential increment [183]. The electrode instability is provoked by the nickel hydride formation that reduces the active surface area of the catalyst materials [184]. Electrocatalytic activity and stability can be improved with the synthesis of electrocatalytic materials such as metals or metal oxides or modifying the nanostructure of the surface area [185]. Ni-Mo alloy electrocatalyst is widely explored because of their high corrosion resistance, low hydrogen overvoltage, long-term stability, good hardness and good resistance to wear [186]. Brown et al. [187] explore the electrochemical properties of a variety of nickel-based binary or ternary alloys (Ni, Co, Mo, W, V) on a metallic substrate. Ni-Mo catalyst results in the most active and stable electrode material. Arul Raj [188] explores the electrocatalytic activity of numerous binary-composite, confirming the highest catalytic activity of Ni-Mo alloys and ranking in the following order: Ni-Mo > Ni-Zn > Ni-Co > Ni-W > Ni-Fe > Ni-Cr. Raney-alloys are composed by Ni, Co and F doped with active materials (Al, Zn) that enhance the active surface area and electrocatalytic activity of electrodes [186]. A drawback is the dissolution of active compound that reduces the performance over time. Electrode coating are deposited via vapor plasma spraying [189], electrodeposition [190] or chemical and vapor deposition [170].
The characteristic of the nanostructured morphology of electrocatalyst is an essential parameter for the catalytic activity of electrodes, even if the ohmic voltage arises due to gas bubble formation inside the nanostructure. However, gas bubble resistance could be minimized with optimal cell configuration or operational temperature enhancement [191]. The material nanostructure increases the specific active area available for the catalysis of reactions, encourages chemical reactions since the chemical activity is higher at discontinuities or defects and enhances the charge transfer kinetics due to shorter electron-transfer distances and rapid diffusion rate [192]. Ganci et al. [193] demonstrate that the surface area of a Ni-based catalyst electrodeposited inside the pores of a polycarbonate membrane increases of approximately two orders of magnitude with a favorable effect on electrocatalytic activity.
Finally, catalyst-based heterostructures are realized, forming a heterojunction between two catalytic compounds (e.g., Ni and Pt) to realize a more active catalyst tuning the adsorption and desorption energy [183]. Subbaraman et al. [194] first proposed a heterojunction device with Ni(OH)2 nanoparticles on a platinum substrate and demonstrated the increase of 8 times the catalytic activity of the hydrogen evolution reaction.

3.1.2. Polymer Electrolyte Membrane Electrolysis Cells

The polymer electrolyte membrane (PEM) electrolyzer was first developed by General Electrics in the 1960s [195] when Grubb [196] applied the ion-exchange membranes as solid electrolytes in batteries. The hydrogen purity is higher than 99.99% without post-treatment [154]. The low operating temperatures (50–80 °C), the rapid cold start up (from seconds to minutes) and the wide operating range (5%–100% of the nominal load) make the dynamic operation possible [195,197].
The main PEM components are the membrane electrode assembly (MEA), the gas diffusion layer, the interconnector plate, and a carbon gasket that seals the cell (see Figure 7). The membrane electrode assembly consists of a perfluorosulfonic acid polymer membrane (Nafion®, Fumapem®, Aciplex®, Flemion®), an ionomer solution and the electrocatalyst at anode and cathode [198].
The properties of the proton exchange membrane, also known as polymer electrolyte membrane or solid polymer electrolyte, are the high proton conductivity, low gas crossover effect, high operational pressure and compact system design [195]. The low membrane thickness (120–170 µm) and the solid electrolyte reduce the ohmic overpotential and allow the operation in a load-following mode with 100% turndown potential of the specific power input since the crossover rate is low and the response to power change is rapid [199]. Nafion, generally used as a membrane polymer due to its high stability, consist of a hydrophobic poly(tetrafluoroethylene) with a lateral branch of hydrophilic sulfonic acid functional group (-SO3H) [200]. Proton transport across the electrolyte is a combination of proton hopping (structural diffusion) among water molecules and diffusion in solution by forming a hydrated ion [201]. When the concentration of the sulfuric acid solution is higher at the cathode than at the anode, the ion diffusion effect is improved [202]. In the hydrated Nafion configuration, clusters of water are generated, making effective the proton transport mechanism. The compact and resistant cell design enables the operation at high pressure up to 350 bar and high differential pressure (to pressurize hydrogen but not oxygen) [203]. The high differential pressure increases the crossover permeation, and so a thicker membrane is required [204]. Nevertheless, a membrane with higher thickness reduces the efficiency loss due to cross-permeation but increases ohmic drop due to the membrane resistance [162].
The main drawback is the corrosivity of the acid environment provided by the proton exchange membrane and thus, the need of expensive and rare materials such as noble metals for electrocatalyst and metallic materials (e.g., titanium, stainless steel) coated with noble metals or nitride-based alloys for collectors and separator plates [160]. The electrocatalyst slurry is deposited directly on the membrane surface (CCM) or the gas diffusion layer [198]. The catalytic and stable material is placed on a support of oxides and ceramics at the anode and carbon at the cathode [205]. Moreover, an ionomer solution of Nafion is added to the catalyst layers of CCM fabrications to enhance the ion conduction, provide numerous gas channels and mechanical stability acting as a binder. Further, Nafion maintains the catalyst layer wet since it is a hydrophilic agent [206]. For hydrogen evolution electrodes Pt and Pd are generally used, while at oxygen evolution side IrO2 and RuO2 mixed with inert compounds (Ta2O5, TiO2 or SnO2) are preferred because of the higher stability [205]. Miles and Thomason [207] investigate the electrocatalytic activity of metals adopted as electrodes. For the hydrogen evolution reactions, the catalytic activity order is: Pd > Pt ≈ Rh > Ir > Re > Os ≈ Ru > Ni. For the oxygen evolution reactions, the order is: Ir ≈ Ru > Pd > Rh > Pt > Au > Nb. The employment of nanoscale composites of catalytic materials and their homogeneous deposition on the membrane surface improves the electrolytic cell efficiency [208].
Usually, the gas diffusion layer is a titanium plate or porous graphite that have good electrical conductivity, mechanical stability and corrosion resistance. In contrast, the separation plate is realized with titanium, stainless steel or dense graphite and has to be highly conductive and chemically inert [198].
The electrochemical reactions (Equations (22)–(26)) occur only on triple-phase boundaries (TPBs), that are active sites at which the gas diffusion layer, the active catalyst and the electrolyte are connected. Channels, at the gas diffusion layer, transport water and product gases and conduct electrons for the reaction, at the active layer, reactions are performed, and protons are transported through the electrolyte [210].
2 H + + 2 e H 2   ( Overall   HER   reaction )
H + + e H ad   ( Volmer   step )
H ad + H + + e H 2   ( Heyrovsky   step )
2 H ad H 2   ( Tafel   step )
H 2 O 1 2 O 2 + 2 H + + 2 e   ( Overall   OER   reaction )
High temperature operation reduces the required activation energy and improves the cell performance, leading to high current density with smaller electrode area and hence low investment cost. However, if temperatures are higher than the liquid saturation temperature at the operational pressure, the membrane becomes dry and the proton diffusion inefficient [163]. Two pathways are viable: (i) the slight temperature increase matched with pressure increase to modify the saturation point, and (ii) the elevate increase in temperature modifying the materials used such as the polybenzimidazole membranes (PBI) doped with phosphoric acid which are suitable for operational temperature up to 200 °C at ambient pressure [211]. High-pressure operation is attractive for both the practicability to operate at high temperatures and the direct hydrogen storage at high pressure. The main issue is the crossover permeation that is intensified by the pressure gradient between anode and cathode [212].

3.1.3. High-Temperature Electrolysis Cells

Two types of high temperature electrolysis cells exist: with solid oxide and molten carbonate electrolytes. The typical operating temperature ranges between 723 and 1273 K at atmospheric pressure or higher [213]. High temperature electrolyzers are commonly assembled with two electrodes separated by a dense electrolyte that conveys ions. Since both electrolytes conduct anions, the solid oxide O2− and the molten carbonate CO32− ions, they can also electrolyze carbon dioxide to carbon monoxide [157]. The co-electrolysis of H2O and CO2 generates syngas as a product. Carbon dioxide and steam could be electrolyzed separately and afterwards their products mixed to form syngas. However, the co-electrolysis reaction exhibits the highest performance and operational advantages [214].
The high operating temperatures improve the transport phenomena since the kinetics of electrochemical reactions is faster (lower activation overpotential), the ohmic overpotential decreased, and the diffusion conductivity is enhanced [215]. Main drawbacks are the high-quality steel needed for auxiliary components, slow load following and start up (several hours), and the requirement for continuous operation as suffers the thermal cycles [216]. Therefore, high temperature electrolyzers are not well suited to be coupled with fluctuant and intermittent energy sources.
Molten carbonate electrolyzers are not researched systematically because of the high corrosivity of the electrolyte and the high-cost post-process treatments for separation and recirculation of CO2 as the mixed product of CO2 and O2 are released jointly [157]. However, their features are based on fuel cell devices with the same electrolyte. Molten carbonate devices are typically fabricated with Ni-based porous electrodes.
The overall hydrogen evolution reaction is described by Equation (27). Though the kinetics of CO2 electrolysis is slower than water splitting, CO could be produced through the CO2 reduction (Equation (28)). At the anode, CO32− ions oxidize, generating CO2 and O2 (Equation (29)) [217]. However, there is an intrinsic drawback.
H 2 O + CO 2 + 2 e H 2 + CO 3 2   ( Hydrogen   evolution   reaction :   H 2   production )
2 CO 2 + 2 e CO + CO 3 2   ( Hydrogen   evolution   reaction :   CO   production )
CO 3 2 2 e + 1 2 O 2 + CO 2   ( Oxidation   evolution   reaction )
Solid oxide electrolysis cells (SOECs) were first developed in the 1970s by General Electric and Brookhaven National Laboratory [154]. Solid oxide electrolyzers perform steam electrolysis, which is an efficient process due to the advantageous thermodynamic and kinetic conditions derived from high operational temperature [218].
The common electrolyte of SOECs is 8 mol% Y2O3 stabilized ZrO2 (yttria-stabilized zirconia), the electrode most used is Ni/YSZ cermet for the cathode and lanthanum strontium manganite (LSM)/YSZ composite for the anode [219].
As the electrolyte is solid, the thermal expansion coefficients of electrodes and electrolyte should be similar to avoid the material failure, and electrodes should be porous to enable gas transport and provide enough triple-phase boundary in addition to typical requirements of good chemical stability, ionic conductivity, tightness to gas permeation and poor electronic conductivity [220].
The ion conductivity is performed via two pathways: the diffusion through vacancies (bulk conductivity) and the intergranular diffusion (grain boundary conductivity) [221]. The temperature effect on conductivity follows the Arrhenius equation (Equation (30)).
σ = σ o exp ( E k B T )
where σo is the conductivity of pre-exponential factor, E is the activation energy, kB is the Boltzmann constant, and T is the absolute temperature. This relation states that the ion conductivity increases with high temperature [222].
The most critical element of solid oxide electrolyzers is the electrolyte. Zirconia dioxide has good ionic conductivity but suffers phase transformation from the monoclinic form, stable at low temperature, to the tetragonal and cubic structures stable at highest temperatures [223]. The monoclinic phase is stabilized to cubic fluorite structure by doping the material with alkaline earth, rare earth or lanthanide oxides. The oxides additive includes calcia (CaO), magnesia (MgO), scandia (Sc2O3) and yttria (Y2O3) [224]. The maximum ion conductivity is a function of the dopant content and corresponds to the minimum amount of the dopant required to stabilize the zirconia structure completely. When the dopant concentration further increases, the oxygen vacancy and the dopant cations introduce defects and resulting in a lower ion conductivity [225]. Moreover, the ion conductivity is enhanced with the addition of dopant size close to the Zr4+ radius since the elastic energy is lower [226]. Meng Ni et al. [220] review some experimental data of ion conductivity of doped zirconia finding this additive order: Sc2O3 > Yb2O3 > Y2O3 > MgO > CaO > La2O3. Although the ion conductivity of scandia stabilized zirconia (ScSZ) is highest, the yttria is most used due to the cost-effectiveness and the high abundance [227]. The grain size also affects the ion conductivity of zirconia. Ivanov et al. [228] demonstrate that the bulk conductivity is not controlled by grain size, but grain boundary conductivity decreases with grain size.
Ceria-alkaline-earth and ceria-rare-earth oxides are suitable materials for intermediate temperature applications (500–700 °C). At intermediate temperature, the ion conductivity of Ce-based oxides is much higher than that of YSZ. Analogously to zirconia, the ion conductivity of doped Ce-oxides is a function of temperature, ion radius mismatch between Ce4+ and cation additives, dopant concentration and charge valence [229]. Some of dopant tested as solid electrolyte are Gd3+ [230,231], Sm3+ [230,232], Y3+ [233], Sc3+ [234], Nd3+ [235] and Lu3+ [230]. Samaria and gadolinia-doped ceria exhibit high conductivity because the ionic radii of Sm3+ and Gd3+ are close to Ce4+ ion size [236].
However, the high temperature needed for ceria-doped material induces to a partial reduction of Ce4+ to Ce3+ which increases the electronic conductivity and the segregation of defects that obstructs the ion diffusion through the grain boundaries [237]. The aforementioned dopants are combined in multiple doped structures such as Ce0.85Gd0.15-ySmyO1.925 [238], Ce1-x(Y0.5Dy0.5)xO2-δ [239], Sm0.075Nd0.075Ce0.85O2-δ [240] etc.
Doped lanthanum gallate (LaGaO3) based perovskites are also studied as an alternative electrolyte material for intermediate temperature. The ion conductivity is comparable to ceria-based oxides, and also for this material, doping is adopted to enhance the properties of the electrolyte [241]. Good ion conductivity and stability over a wide range of oxygen partial pressure is reached with LaGaO3 doped with Sr for La, and Mg for Ga, synthesizing the La0.9Sr0.1Ga0.8Mg0.2O2.85 (LSGM) molecules [242]. Adding also Co for Ga of LSGM, La0.8Sr0.2Ga0.8Mg0.115Co0.085O3-δ is obtained [243]. The main drawbacks are the impurity segregation and the reactivity with nickel typically used as anode material [244].
Furthermore, the proton-conducting electrolyte is studied for the intermediate temperature range (400–700 °C) to overcome the problem of low conductivity of metal oxides at these temperatures [245]. BaCeO3-based proton conductors and Y-doped BaZrO3 (BZY) are widely studied. The former is highly conductive but instable in CO2 and H2O atmosphere, the latter is chemically stable, but the sintering is difficult due to the high temperatures required [246]. Co-electrolysis with proton-conducting SOECs has also been tested by Xie et al. [247] which perform the co-electrolysis introducing H2O at the oxygen evolution electrode and CO2 at the hydrogen electrode. Mainly carbon monoxide (61%), a low fraction of hydrogen (8%) and methane (1.2%) are produced [248].
Finally, in recent years, hybrid-SOEC devices have been introduced. Hybrid-SOECs are systems with an electrolyte that conducts both O2− and H+ ions. This configuration allows the water-splitting reaction occurs at both electrodes, enhancing the overall efficiency [249].
Perovskite (ABO3) compounds are widely applied as anode materials for SOECs. Perovskites are mixed ionic electronic conductor (MIEC) materials with rare-earth compounds (lanthanum and strontium) at the A-site and transition metals (Ni, Co, Fe, Mn, Cr, V) at the B-site [153]. In general, the electrochemical performance of these materials is satisfactory, but the thermal expansion—a fundamental parameter in high temperature electrolyzers-of many MIEC is non-compatible with the thermal expansion of the typically used electrolyte YSZ [250]. Sr-doped lanthanum-manganite oxide (LSM) is the most used and traditional material as the thermal expansion coefficient is similar to that of YSZ but experiences a low oxide-ion and electronic conductivity. Therefore, LSM is not an appropriate material for the operation at intermediate temperatures and new MIEC have been tested [251]. Sr-doped LaCoO3 is a good oxide-ion conductor, but the thermal expansion coefficient is too high in comparison with YSZ, and the chemical reactivity with zirconia causes the formation of a blocking layer of La2Zr2O7 [252]. Sr-doped lanthanum ferrite (LaFeO3) is another material studied for intermediate temperatures SOEC application. LaFeO3 has a lower thermal expansion coefficient and higher compatibility with TSZ electrolytes [253]. A critical degradation issue during long-term operation is the anode delamination that occurs at the electrolyte-electrode interface due to high pressure of oxygen produced by electrochemical reactions [254].
The good electrocatalytic activity, low-cost chemical stability and suitable thermal expansion and good electrical and ionic conductivity make the porous Ni-YSZ cermet the material commonly used as hydrogen evolution electrode. The high porosity allows the transport of reactants to the triple-phase-boundaries and the removal of product gases from the reaction site [255], and the fine microstructure enlarges the TPB length [256]. Anyhow, irreversible degradation processes occur on the cathode. The microstructure of the Ni-YSZ material changes due to coarsening and agglomeration of Ni compounds at the triple-phase boundary. This degradation process provokes the reduction of the length of the TPB and, thus, reduces the active site surface [257]. In addition to the common Ni-YSZ electrode, perovskites are selected as cathode materials including LSM and Sr-doped LaFeO3 that are highly compatible with YSZ electrolyte, have good electric and ionic conductivity and thermal stability [258].
The interconnector is usually made of Fe–Cr stainless steel alloy because it has high thermal conductivity, low cost and the fabrication is not tricky. A drawback is the Cr deposition and poisoning of the oxygen evolution electrode [259].
Finally, numerous materials might be applied as a sealant, including glass and glass–ceramic joints, high temperature metal, ceramic and glass–metal composite and cement [260].
The overall co-electrolysis reaction is summarized as Equation (31). At the triple-phase boundary (TPB) of the cathode–electrolyte interface, water and carbon dioxide are electrolyzed according to Equations (32) and (33), and the reverse water gas shift (Equation (34)) occurs. The oxide ions produced at the cathode are transported through the dense electrolyte and are reduced into oxygen (Equation (35)) at the TPB of the electrolyte–anode interface. In addition two reaction occurs: the CO-methanation reaction (Equation (36)), and the undesired coke formation reaction (Equation (37)) [261].
H 2 O + CO 2 H 2 + O 2 + CO   ( Overall   co - electrolysis   reaction )
H 2 O + 2 e H 2 + O 2   ( Water   oxidation   reaction )
CO 2 + 2 e CO + O 2   ( Carbon   dioxide   oxidation   reaction )
CO 2 + H 2 CO + H 2 O   ( Reverse   water   gas   shift   reaction )
O 2 O 2 + 2 e   ( Oxide   ions   reduction   reaction )
CO + 3 H 2 CH 4 + H 2 O   ( CO - methanation   reaction )
CO C + 1 2 O 2     ( Carbon   cracking   reaction )
The electrochemical kinetics and the activation energy for dry CO2 electrolysis are remarkably higher than co-electrolysis. Higher performances are ensured by the reverse water gas shift (RWGS) that converts a considerable amount of CO2 to CO and reduces the electrical consumption for the overall reaction as the water splitting involves lower polarization resistance and overpotentials [262]. At 873 K, 25% of the CO produced is ascribable to RWGS [263]. Accordingly, the lower cell voltage required for co-electrolysis and the methanation reaction reduce the coke formation and carbon deposition on the electrolyzer surfaces and, therefore, the degradation process [264].
The product gas composition and the performance of the overall process strictly depend on cell operating conditions (inlet gas composition, operational temperature and pressure, applied voltage and current) (see Figure 8). Indeed, CO-methanation and reverse water gas shift reactions occur only at specific operating temperature and pressure. The methanation is a quite exothermal reaction, occurs at a temperature below 1073 K, quickly increases with pressure raising, and is enhanced by the commonly used Ni-based electrode that has good catalytic activity. Methane molar fraction in the outlet gas is negligible at ambient pressure but significantly increases with pressure rise at the expense of hydrogen and carbon monoxide production. However, the RWGS is slightly endothermic, is thermodynamically advantageous at 1073 K, is enhanced by the high concentration of hydrogen and is not affected by pressure variations [265]. The operating voltage also affects the gas composition: at a low voltage, the RWGS decreases and the methanation increases. However, high voltage increases the power requirements and so the efficiency declines. Thus, the operating temperature of SOECs has to be a balance between the operation at the thermal-neutral voltage in which the energy for isothermal operation is supplied by heat generated from ohmic losses, and the operation below the thermal-neutral voltage that decreases the outlet temperature and, thus increases methanation reaction and decreases the amount of CO produced via RWGS [266]. Hence, if syngas is produced for methane synthesis, the operation at low temperatures and high pressures is advantageous, even though the methanation reaction is exothermic and effective heat removal is required [267].
Finally, the carbon formation on electrolyzer surfaces is a critical issue for SOEC performance since the carbon deposition obstructs the reaction sites and prevents inlet gas from reaching the TPB. The coke formation occurs when the voltage is high enough and is facilitated by nickel-based electrodes since Ni is a suitable catalyst for carbon deposition [268]. Carbon formation is also affected by operating temperature and pressure and reactant composition and utilization rate. Carbon is easily constituted with increasing pressure, CO2 concentration and reactant utilization rate, and decreasing temperature [264]. Further, impurities derived from inlet gasses (sulfur in CO2 inlet gas [269]), cell materials (e.g., glass sealing and chromium interconnector) and gas atmosphere might accumulate at the TPB of Ni-YSZ [270]. The migration to the grain boundaries leads to the active sites blocking with an increase in the cell overpotential and degradation of performances [271].

3.1.4. Microbial Electrolysis Cells

Microbial electrolysis cell (MEC) is a new promising technology that produces hydrogen through the oxidation of organic compounds exploiting electrochemically active bacteria as catalysts and a low input voltage (0.2–0.8 V) [272]. MEC was first disclosed in 2005 by two independent research group, Rozendal et al. [273] at the Wageningen University and Hong et al. [274] at the Penn State University. The metabolism of the anode respiring bacteria (ARB) in the biofilm of the electrode produces CO2, protons and electrons. Hydrogen is produced by the binding between electrons driven by the applied voltage to the cathode through the external circuit, and protons migrated across the membrane (see Figure 9) [275]. The conversion of acetate into hydrogen exceeds 90% and the recovery of electrons from acetate ranges between 60% and 78%. This result in an overall maximum yield of 2.9 mol H2/mol acetate [274]. If the substrate is acetate, reactions that occur at electrodes are summarized in Equations (38) and (39) [276].
C 2 H 4 O 2 + 2 H 2 O 2   CO 2 + 8 e + 8 H +
8 H + + 8 e 4 H 2
Exoelectrogens are electroactive microorganisms able to generate electrons through the anaerobic respiration from compounds of different environments including sludge, sediments, wastewater, lignocellulosic biomass and acetate [279]. The electron transfer from exoelectrogens to electrode can occur with two different pathways: (i) direct transfer through the outer membrane cytochrome and conductive pili proteins (e.g., Geobacter sulfurreducens, Rhodoferax ferrireducens and Shewanella putrefaciens), and (ii) the transfer of electrons between the microorganism cells and electrodes via electron shuttling compounds in the electrolyte (Escherichia coli, Propionibacterium freunreichii Proteus vulgaris and Actinobacillus succinogenes) [280,281].
The bacteria inoculum establishes the biofilm formation, acclimatization and growth. Pure microbial cultures are very efficient as electrons donor in a simple organic substrate (e.g., acetate), but in a heterogeneous environment are not as effective as a mixed microbial population [282]. The co-existence of different bacteria allows them to break down more complex molecules. Wastewater is widely used as inoculum since it includes a high concentration of electroactive bacteria, but also fermentative bacteria, methanogens and sulphate reducers [283]. The hydrogen yield does not depend on the concentration of electron-donor substrate but is related to the microorganism metabolism rate (the type of bacteria, substrate utilization, biomass synthesis, respiration, and decay), type of substrate and interface resistance between electrode and electrolyte [284].
An efficient anode material is expected to be a good electrical conductor with low resistance and large active surface, biocompatible for the support of strong microbial attachment and high electron transfer, chemically stable and inert, and with adequate mechanical strength and toughness [285]. Metal-based materials such as stainless steel are suitable for microbial electrolysis application, but carbon is broadly used in a different configuration, including graphite plates, rods and felt, carbon fiber, paper, foam and cloth [286]. The electrode properties could be improved by modifying the anode surface microstructure to increase surface area and porosity or adding conductive compounds, including carbon nanotube (CNT), graphene (GR) and conducting polymers (e.g., PANI, PEDOT) [281,287].
A metal catalyst (e.g., platinum, nickel, stainless steel) is needed at the cathode to increase the biohydrogen production and reduce the required voltage supply [288]. A cost-effective, viable alternative is the use of microbial biocathode. Indeed, electrotrophic microorganisms are able to accept electrons by reducing protons to H2 [276].
Anion-exchange membranes (AEM), proton-exchange membrane (PEM) or nanofiber-reinforced composite proton-exchange membrane (NFR-PEM) are typically used in a two-chambered reactor [289]. Membranes physically divide the anode and the cathode vessels of the reactor, avoiding mass transport, short circuit and hydrogen consumption. Indeed, a membrane is crucial for the production of pure hydrogen to avoid the contamination by CO2, CH4, H2S, and other compounds, the consumption of hydrogen by methanogenesis and the hydrogen crossover to the anode [290].
A critical issue reported [283,291] in long term operation of single-chamber microbial electrolysis cells is the methane contamination. Indeed, methane production increases due to methanogens growth promoted by high hydrogen concentrations. Methanogens (e.g., Methanosarcina) compete with exoelectrogenic bacteria (e.g., Geobacter) at the expense of organic substrates at the anode and hydrogen produced at the cathode [292,293].
Anyhow, the production of biomethane via CO2 reduction (Equation (40)) elicits interest for the favorable process of carbon capture into a fuel [294]. A microbial electrolyzer can also be combined with an anaerobic digestor to produce a fuel with a high fraction of both hydrogen and methane [295]. Indeed, CO2 reduction enables the biogas upgrading, avoiding expensive post-treatment process such as amine scrubbing or pressure swing adsorption [296].
8 H + + CO 2 + 4 e CH 4 + 2 H 2 O
In conclusion, microbial electrolysis cells are highly sensitive to environmental and operating condition. The optimal condition to rapid microbial growth and metabolism is at a temperature of 25–35 °C, a near-neutral pH between 6 and 7, and the external resistance of approximately 100–1000 Ω [297]. Wang et al. [298] investigate the initial anolyte condition for high hydrogen production yield. Low values of pH and high temperatures enhance the hydrolysis of cellulose, while at high pH levels and low temperatures the device environment is favorable to hydrogen production.

3.2. Photoelectrochemical Cell

Photoelectrochemical cells (PECs) exploit the energy of solar irradiance to enhance the water-splitting reaction in the solution. Recently, PECs have also been developed for the production of syngas from water and CO2 [299]. Photoelectrochemical cells are realized with a photo-electrode, and a counter-electrode dipped in an electrolyte solution (see Figure 10). The photo-electrode is assembled with a thin film of a photocatalyst material that is deposited on a transparent substrate. The photocatalyst promotes water-splitting chemical reactions induced by photoirradiation without being consumed or transformed [300]. The electrodes are connected by an external electrical circuit that transfers photogenerated electrons from the photo-anode to the counter-electrode. Typically, semiconductor materials (e.g., titanium dioxide) are utilized in an electrochemical cell for the photo-anode and a conductive catalyst (e.g., platinum) for the cathode [301]. When the photo-electrode is irradiated by photons with energies that exceed the semiconductor bandgap (BG), electrons are excited from the valence band (VB) to the conduction band (CB), inducing electron (e) and hole (p+) pairs in the semiconductor particles and thus charge separation (43). The potential difference due to charge separation allows the transfer of photogenerated electrons from the conduction band to the counter-electrode through the external circuit. Whereas, holes chemically react with water on the semiconductor surface. The oxidation of H2O molecules gives O2 and H+ (44). H+ ions migrate through the electrolyte and are reduced on the cathode surface by photogenerated electrons to generate H2 (45) [302]. The electrolyte is an aqueous solution with suitable ionic conductivity and inert in contact with the photoanode. For electrodes that need an acidic electrolyte, H2SO4 is used; for alkaline electrolytes, KOH and NaOH are used; Na2SO4, K2SO4 or KH2PO4/K2HPO4 are used for neutral electrolytes [303]. Since H2 and O2 generation occurs on different electrodes, products are collected separately, avoiding the need of post-treatments.
An alternative technology solution is the design of photocatalytic reactors with a single or a dual electrolyte-filled bed containing colloidal suspensions of photosensitive semiconductor powders [305].
The overall reaction is [306]:
H 2 O + 2 hv 1 2 O 2 + H 2 Δ G = + 237   kJ / mol   ( BG 1.23   eV / e )
This reaction could be split into the following intermediate steps:
TiO 2 + 2 hv 2 e + 2 p +   Titanium   oxide   excitation   by   photons
H 2 O + 2 p + 1 2 O 2 + 2 H +   Water   oxidation   at   the   photo - electrode   under   acidic   conditions
2 OH + 2 p + 1 2 O 2 + H 2 O   OH   oxidation   at   the   photo - electrode   under   alkaline   conditions
2 H + + 2 e H 2   H +   ions   reduction   at   the   counter - electrode   under   acidic   conditions
2 H 2 O + 2 e   H 2 + 2 OH   H 2 O   reduction   at   the   counter - electrode   under   alkaline   conditions
The chemical composition of the photocatalyst is not changed if an equal number of electrons and holes are generated and consumed for water splitting or for recombination [300].
The minimum potential required for the splitting of water molecules is 1.229 eV that corresponds to a wavelength of approximately 1100 nm. However, the practical potential of the bandgap is higher (1.6–2.0 eV) to overcome losses and overpotential [302]. The lowest energy level of the conduction band has to be more negative than the reduction potential of water to produce H2. Moreover, the highest energy level of the valence band has to be more positive than the oxidation potential of water to produce O2 (see Figure 11) [307].
The solar energy conversion efficiency of photocatalytic water-splitting reactions depends on light absorption, charge separation and transfer, recombination processes and electrocatalytic activity of the semiconductor anode [309]. The solar-to-hydrogen (STH) conversion efficiency is defined as the ratio of the chemical energy of hydrogen generated to the solar energy input and is a function of semiconductor bandgap [303]. In Figure 12a is displayed the theoretical maximum efficiency for a variety of semiconductor materials, the upper limit for a single material reaches 16% when the bandgap is near 2.0 eV [309]. A tandem photoelectrochemical device could reach the maximum theoretical efficiency of 29.7% with a bandgap of 1.60 eV and 0.95 eV for the photoanode and the photocathode, respectively [310]. Nowadays, the highest STH efficiency reported is 19.3% for a multi-junction GaAs/GaInAs/AlInP photocathode device, whose maximum theoretical STH efficiency is 22.8% [311].
Recombination reactions occur between electrons in the conduction band and holes in the valence band of the semiconductor. The recombination time of charge carriers is on the order of 10−9 s, whereas chemical reactions are slower (10−8–10−3 s) [312]. The high bandgap of semiconductor material (BG of TiO2 is 3.2 eV) requires short wavelengths to be activated. Therefore, only the ultraviolet region, which represents 4% of the solar spectrum activates the photocatalyst [313]. Moreover, a severe restriction is related to the decay of photoelectrochemical efficiency due to photodegradation of electrode surfaces and corrosion [309].
Fujishima and Honda [314], in 1972, first demonstrated hydrogen generation dissociating water in a photoelectrochemical cell. They manufactured an electrochemical cell with a TiO2 photo-electrode and a platinum counter-electrode. To enhance the decomposition of water Fe3+ ions were added to the cathode and the reaction rate increases. In the last decade, research focuses on the structure and properties of semiconductor photocatalysts and on the configuration of photoelectrochemical cells.
Recently, Tembhurne et al. [304] propose a photoelectrochemical device that operates under concentrated solar irradiation with thermal integration and mass transport optimization. They manufacture a triple-junction cell based on III–V compounds photo-absorber and IrRuOx-Pt electrocatalyst. The maximum STH efficiency obtained is 17.12% that is lower only than the record efficiency reached by the dual-junction GaAs/GaInAs/AlInP. The operation under concentrated solar irradiation reduces cost of hydrogen production (~11 $/kgH2 PEC and ~4 $/kgH2 with solar concentration [315]).
A dual-absorber tandem system could be utilised to overcome the need for an external bias required when the PEC overpotential is not enough for the overall water splitting, or the rate of the reaction is not sufficient. The auxiliary bias can be external, including photovoltaic cell bias and dye-sensitized solar cell (DSSC) or internal. In the external biased configuration, a photocurrent is generated by photovoltaic devices that are connected to the PEC cell external circuit [316]. Instead, the internal bias configuration involves a layered, stacked or hybrid structure that establishes a tandem cell. The internal-biased devices are fabricated by photoelectrode/photoelectrode (PEC/PEC) or photoelectrode/photovoltaic (PEC/PV) or photovoltaic/photovoltaic (PV/PV) coupled devices [317].

3.2.1. Photocatalysts

Photocatalysts are typically realized with semiconductor materials, and the technical requirements are [318]:
  • A broad spectral range for light absorption (the bandgap range should spread between 1.8 and 2.2 eV);
  • Proper valence and conduction band energy level in function of the redox potential of water splitting;
  • Effective electron–hole pairs separation;
  • Effective charge and mass transport and long carrier diffusion length;
  • High chemical, electrochemical and photoelectrochemical stability;
  • Low cost and environmentally friendly.
High bandgap semiconductors are commonly TiO2, WO3, SrTiO3, BaTiO3, SnO2 and ZnO, while small bandgap semiconductors are Si, GaAs, InP, CdTe, CdSe and CuO. The bandgap of Fe3O4 and BiVO4 is at an intermediate level [319].
High bandgap semiconductors, due to the wide bandgap, absorb only ultraviolet light that corresponds to a tight range of the solar irradiation spectrum. TiO2 is the semiconductor most widely researched for photocatalyst application. The high bandgap reduces the solar-to-hydrogen efficiency that results up to 1.3% for Anatase TiO2 (bandgap of 3.15 eV), 2.2% for the Rutile TiO2 structure (bandgap of 3.0 eV) and 4.8% for WO3 (see Figure 12a). WO3 has a bandgap of 2.6 eV and a low energy level of the conduction band that results in the need for an externally applied bias [320]. Dye sensitization and doping with transition metal ions, rare earth metal ions, non-metals and noble metals are some possible solutions to stretch the light absorption range, minimize the recombination between electron and hole pairs and to reduce the semiconductor over-potential [313].
Intermediate bandgap semiconductors have a lower bandgap that results in a wider absorption range of the solar spectrum, and therefore in higher STH efficiency. BiVO4 has a bandgap of 2.4 eV and achieves a theoretical maximum STH efficiency of 9.1%, whereas the STH efficiency of Fe2O3 is up to 12.9% and the bandgap is ~2.2 eV (see Figure 12a). BiVO4 is a suitable photocatalyst since it has a low production cost, low toxicity, high photostability and good resistance to photo-corrosion. Although, BiVO4 requires an external bias since the energy level of the conduction band is less negative than the water reduction potential and experiences a high charge recombination process and a low water oxidation kinetics [321]. Fe2O3 is chemically stable, abundant in nature and cost-effective. However, Fe2O3 suffers for electron–hole recombination, low diffusion length and valence-band poisoning due to the low diffusion length of holes [322].
Co-catalyst and nanostructures are typically used to enhance the oxidation kinetics and the holes migration [309].
Low bandgap semiconductors are suitable materials for water splitting due to their low bandgap and, therefore, high light absorption range. High interest is addressed to group III–V materials such as InGaP, GaAs and InP. Khaselev and Turner [323], in 1998, reported an STH efficiency of 12.4% established in a crystalline GaInP2/GaAs tandem cell developed at the National Renewable Energy Laboratory. The main drawback is the electrode instability due to photo-corrosion at the interface between the semiconductor material and the electrolyte. A coating treatment of the photoelectrode with a catalytic material reduces the photo-corrosion of electrodes and the electron–hole recombination rate. The coating also improves the oxidation kinetics optimizing the PEC efficiency [324].

3.2.2. Modification Techniques

Low light absorption range, electron–hole recombination, the low diffusion length of carriers, slow oxidation and reduction kinetics and photo-corrosion are all drawbacks of photoelectrochemical devices. Some modification techniques have been proposed to improve the efficiency delivered by PEC.
Hierarchical nanostructured photocatalytic materials improve surface to volume ratio, increasing PEC performance through the rise of the light absorption spectrum minimizing the light reflection, the improvement of the charge transfer as a result of the higher surface area in contact with the electrolyte, the increase in the charge carrier collection because of the reduction of the thickness of the semiconductor film and the lowering of the photogenerated charge recombination rate due to the high degree of crystallinity [325]. Nanomaterials are classified as dimensional structures from zero to three [326]. Quantum dots have an ultra-small particle size (<10 nm) and are defined 0 D nanostructures [327]. Quantum dots improve the efficiency of light harvesting and the photocatalytic activity reducing the electron–hole recombination rate [328,329]. Nanorod, nanowire and nanotube form 1 D nanostructures that ensure a rapid diffusion of charge carriers in only one direction lowering the recombination process [330,331,332,333]. 2D nanostructures are realized with nanosheets; they enhance the light absorption and improve the charge carriers transport due to the low thickness and high surface area of the catalytic film [329,332,334]. Finally, 3D nanostructures facilitate the separation of the photogenerated charge carrier, reducing the distance between the electrode and electrolyte [335,336,337,338].
Doping is one method among the modification techniques to enlarge the light absorption spectrum to the visible region for wide bandgap semiconductors and to improve their photocatalytic activity [339]. The photocatalyst efficiency could be enhanced with the introduction of transition-metal cations (W [340], Cr [341], Zr [342], Mn [343,344,345], Fe [346], Ni [341,347,348], Mo [340,349,350]) or anions (N [351], C [352], S [353,354], B [355]). Doping ions are functional in the modification of electronic and optical properties of semiconductors and improve photoelectrical conductivity and charge-carriers transport and separation [356]. However, high quantities of doping elements could act as recombination centers for photo-generated charges that limit the photocatalytic activity [357]. Further, substituting Ti sites of the TiO2 semiconductor, the conduction band of the photocatalyst could shift below the water redox potential requiring an external bias for the water splitting [351].
Plasmonic metallic nanostructures such as Au, Ag, Al and Cu actively interact with resonant photons through the interaction of surface plasmon resonance (SPR) that is an oscillation of valence electrons due to resonant photons [358]. Plasmons are introduced in the photocatalyst to enhance the light-harvesting of photoelectrodes and the photocatalytic efficiency. Furthermore, plasmonic metal nanostructures ensure a good photostability in comparison with dye-sensitizers or quantum dots that are usually subjected to photo-corrosion [359]. Strong light absorption, huge light scattering, strong electromagnetic field, numerous hot carrier generation are the main properties of plasmons and modify the physical and chemical characteristics of the semiconductor [360]. Light absorption and scattering are strongly dependent on the size and morphology of the nanoparticles improve the solar radiation harvesting, the electromagnetic field reduces the charge-carriers recombination, and the hot electron injection increases the photocatalytic efficiency [361].
Dye-sensitized photocatalyst consists of dye molecules anchored to the wide bandgap photoelectrode. Photosensitizer should be characterized by efficient light absorption in a wide solar spectrum and anchoring groups for the linkages to the semiconductor [362]. The solar irradiation of dye molecules induces the injection of an excited electron in the lowest unoccupied molecular orbital (LUMO) level of the photosensitizer into the conduction band of the photoelectrode [363]. The photosensitizer is coupled with a water oxidation catalyst (WOC) that oxidize and regenerate the oxidized dye (see Figure 13) [364]. The interface between semiconductor and dye molecules ensures the charge-carriers separation [365]. The most studied photosensitizers are based on ruthenium polypyridine [366,367] or porphyrin [365,368].
Cocatalyst deposition is a feasible method to enhance the efficiency and the photocatalytic activity [369]. Cocatalysts reduce the overpotential requirement, the electron–hole pairs recombination and the photo-corrosion while increasing the kinetics of the reaction, the light absorption and the number of active sites [370]. Cocatalysts are employed both for the hydrogen evolution reaction (HER) and the oxygen evolution reaction (OER) [371]. Noble metal (e.g., Pt [372]) cocatalyst are usually used for HER and noble metal oxides (e.g., IrO2 [373,374], RuO2 [374,375]) are used for water oxidation reactions [376]. However, due to the high cost and rarity of noble metals, researchers focus on noble metal-free cocatalyst, including cobalt [370,377,378,379] and nickel-based compounds [380,381,382,383,384].
Multijunction integration in a stacked solar cell increases the harvesting of light irradiation in a wide solar spectrum. Two or more cells are stacked together in a series-connected string. Solar beams radiate the high-bandgap top cell and are partially absorbed, and photoconversion occurs. The incident light not converted in the first cell passes through it and reaches the cell with a slightly lower bandgap placed below (see Figure 14) [385]. In multijunction photoelectrochemical devices, the photo-potential is increased. Simultaneously, the photo-current is reduced compared with single cells since only a fraction of the incident solar photons is absorbed but can be tuned by an accurate selection of semiconductor bandgaps [386]. Multijunction photoelectrochemical cells realized with crystalline group III–V heterojunctions, reach the highest theoretical efficiency [387] and the record STH efficiency of 18.3% has been demonstrated by Licht et al. with an AlGaAs/Si RuO2/Ptblack photocell [388]. The theoretical maximum efficiency of a single junction cell with a bandgap of 1.59 eV is 30.6% and increases to 40.0% for a dual junction device with bandgaps of 0.52 and 1.40 eV. The triple junction maximum efficiency is 28.3%, remarkably lower than dual junction efficiency [389].
Z-scheme mimics the biological photosynthesis in green plants in which solar energy is absorbed, and electrons of two reaction center chlorophyll-protein complex (P680 and P700) in photosystems (PS II and PS I, respectively) are excited and injected into charge carrier molecules (see Figure 15a). In photosystem II, water is oxidized, forming oxygen and protons, and the energy generated converts ADP to ATP. Whereas, in photosystem I, the reaction center is reduced and transfers electrons to NADP+ molecule that are reduced to NADPH. ATP and NADPH are used for CO2 fixation [390,391].
The z-scheme photoelectrochemical cell was first proposed by Bard et al. [392] in 1979, developing a two-step water-splitting photoelectrochemical system. Z-scheme is a tandem structured photosystem that consists of two semiconductor photocatalyst with different bandgap and a redox mediator for charge transfer (see Figure 15c) [376]. On the H2-evolution photocatalyst, both hydrogen and oxidative mediators are generated. Electrons of the conduction-band reduce H+ ions, and the holes of the valence band oxidize the redox mediators. On the O2-evolution photocatalyst, the mediator is reduced by photogenerated electrons, and H2O is oxidized by holes of the valence band [393]. Photons are absorbed and converted on a broader energy spectrum. Indeed, the H2-evolution reaction step requires a semiconductor with the minimum energy level of the conduction band higher than the reduction potential of H+ ions, while the O2-evolution semiconductor should have the maximum energy level of the valence band lower than H2O oxidation potential [394]. Since each semiconductor should meet the energy requirement of only half-reaction much more semiconductor materials can be used in the z-scheme device, and a higher light absorption could be achieved through photo-sensitizer [395]. For instance, WO3 is a suitable material for water oxidation, but the conduction band has a low energy level, on the other side non-oxide photocatalyst (sulfides, nitrides and dye) can reduce protons but are not able to oxidize water [394].
Moreover, also redox mediators need to be efficiently coupled with the photosystem. Shuttle redox mediators (e.g., Fe2+/Fe3+ [396,397,398], I/I3− [399]) have been developed in recent years, but drawback such as the low diffusion rates of ions in a liquid media and the competition with water-splitting reactions induce researched to focus on solid-state mediators (e.g., noble metals [400], transition metals [391], carbonaceous materials [401,402]) [403].
Recently, photobiological hydrogen production through semi-artificial systems has been investigated [404]. The photocatalytic action of an enzyme hybrid photoelectrochemical cell is realized coupling enzymes with a semiconductor substrate [405]. Hydrogenases are active microbial enzymes for the catalytic reduction of protons to hydrogen, whereas carbon monoxide dehydrogenases (CODH) and formate dehydrogenase (FDH) are specific enzymes for CO2 reduction [406]. Instead, the light absorbers of a material-cell hybrid are realized with synthetic materials of photosynthetic microorganisms, and photocatalyst with whole cells (e.g., Escherichia Coli cells expressing [FeFe]-Hydrogenase enzymes [407]) avoiding costly manipulations for cell disruption and protein purification [405].

3.3. Technology Readiness Level

3.3.1. Electrolysis

Electrolysis for hydrogen production is a mature technology: suitable industrially manufactured alkaline electrolyzers are available, and demonstration plants are built worldwide. PEM electrolysis cell is extensively researched as the efficiency is higher than alkaline performance, but the high cost and earth scarcity of electrocatalysts hinder the large-scale application. SOECs and microbial fuel cells are still in at the laboratory scale and scale-up research status. The IEA hydrogen project database summarizes all worldwide demonstration plant projects realized since 2000 [409].

Alkaline Electrolysis

Alkaline electrolysis plants recorded in the IEA database are almost one hundred—six of these are planned or under construction. The installed capacity of most of the plants is in the range 1–600 kWel, the capacity of 16 plants is in the range 1–6 MWel and three planned projects will have an installed capacity higher than 10 MWel (20 MWel Fredericia project in Denmark [410], 10 MWel Fukushima plant [411] and H2V plant [412] in France with 700 MWel installed capacity).
The Elygrid European project started in 2011 and is focused on the production of electricity and hydrogen through the integration of a high-pressure alkaline electrolysis stack coupled with renewable energy sources. The objective was to improve the balance of plant efficiency with a megawatt size electrolysis (from 0.5 to 3.5 MWel) [413]. In Germany, in 2013, numerous projects for the storage of wind energy via renewable fuels production started. For example, within the international research project, STORE&GO launched as part of Horizon2020, in Falkenhagen has been built two plants for the production of hydrogen and methane, with an installed capacity of 2 MW each [414].
Moreover, other European projects are INGRID plant [415] under construction in Italy, BioCat project [416] in Denmark, Demo4Grid [417] in Austria that demonstrates the commercial set-up of a pressurized alkaline electrolysis and the Jupiter 1000 project in France that combines an alkaline and a PEM electrolysis device and a methanation process for the gas injection into the grid [418]. In China, McPhy delivered a 4 MWel hydrogen production electrolyzer coupled with wind energy and combined with a solid-state hydrogen storage unit [419].

Proton Exchange Membrane Electrolysis Cells

PEM electrolysis cells are commercially up to the MW scale. Wide commercial diffusion is currently limited by high investment cost, mostly associated with the cost of membranes and noble metal catalysts, limited production capacity and short lifetime [152]. The continuous technological development is expected to deliver within the next few years to a significant increase in demonstration plants with an installed capacity in the order of megawatts. Worldwide, since 2000 have been installed 68 plants with an installed capacity below 1 MWel and only 16 demonstration projects with the installed capacity above 1 MWel.
The Hydrogenics corporation installed two PEM storage facility technologies of 2 MWel (Enbridge P2G) [420] and 2.5 MWel (Markham Energy Storage) [421] in Canada and one plant of 2.5 MWel in the United States (Zero Impact Production) [422]. In China, Guangdong Synergy Hydrogen Power Technology Co., Ltd. installed a 13 MWel electrolysis plant for bus-station hydrogen refuelling [423]. In Germany, since 2015, the worldwide largest power-to-gas plant with PEM electrolysis (6 MWel) has been operating within the project Energiepark Mainz [424]. In 2017, Wind to Gas Energy inaugurated the electrolysis plant with a 5 MWel PEM electrolyzers [425], and the next year it coupled five wind turbines with a total output of 15 MWel with an electrolysis plant that has a capacity of 2.4 MWel [426].
Nowadays, high capacity plants are planned or under construction. The Fuel Cells and Hydrogen Joint Undertaking (FCH JU) funds the fabrication in Austria of a demonstration plant with an installed capacity of 6 MWel within the Siemens H2Future project [427] and the Refhyne project that foresees the realization of a plant with a peak capacity of 10 MWel [428]. Finally, in the United Kingdom, the realization of a 100 MWel PEM electrolysis plant is started with the project Centurion that is expected to explore the production, the storage in a salt cavern and the gas grid injection and transmission [429].

Solid Oxide Electrolysis Cells

Solid oxide electrolyzers are, to date, mostly tested at the laboratory scale. Before commercialization, system components require further development, since the stabilization of materials, new suitable materials and lower operating temperature are needed to avoid degradation issues [430]. Few pilot plants (10) with an installed capacity in the kWel range have been realized, and the operation of two other plants is planned for 2020. Among these, the power level of only two operational pilot plants is above 100 kWel. The German-based Sunfire GmbH in partnership with Boeing Network & Space Systems develops the commercial reversible electrolysis module that is in operation at a US Navy microgrid test facility in California. In electrolysis mode, the maximum capacity is 150 kWel with a system yield of 42 m3/h of hydrogen and efficiency up to 85%. The delivered power by fuel cell mode is 50 kWel, and the efficiency is 60% [431]. The GrinHy project funded by the Fuel Cells and Hydrogen Joint Undertaking (FCH JU) has realized in Germany a 120 kWel pilot plant of high temperature electrolysis stack, able to operate in reverse as a fuel cell. The plant is coupled with a steel production industry to recover the heat generated [432].
Nordic Blue Crude AS, Sunfire GmbH, Climeworks and EDL Anlagenbau have planned to start the construction of the first commercial plant with 20 MWel installed capacity in Norway in 2020. Annual production of 8000 tons of synthetic Blue Crude was estimated. Blue Crude consist of liquid fuel of various hydrocarbons comparable to crude oil [433].

Microbial Electrolysis Cells

MEC still are mainly researched at the laboratory scale, but also some pilot-scale devices have been developed to validate the MEC utilization in the real industry [434]. The employment of microbial electrolysis cells fed with domestic wastewater is the most researched application. Escapa et al. [435] review many laboratory, semi-pilot and pilot-scale experiments. The capacity of a typical laboratory-scale electrolyzer is up to 1 L. In 2010, Rader and Logan [436] scaled the capacity of a MEC device up to 2.5 L, utilizing 8 separate electrode pairs in a multiple-electrode design. In 2011, Cusick et al. [437] demonstrated the operation in a continuous flow of a 1000 L microbial electrolysis reactor. The cell was set-up with 144 electrode pairs in 24 modules. In the large-scale plant, critical issues were found in the initial processes of inoculation and enrichment, and the methanation of most of the hydrogen produced. Heidrich et al. [438] installed a 120 L microbial electrolysis cell for the treatment of domestic wastewater matter for three months. Afterwards, Heidrich et al. [439] tested a pilot-scale 100 L microbial reactor for the treatment of raw domestic wastewater at ambient temperature. The trial was one year long and demonstrated the durability and robustness of microbial devices under realistic conditions. Finally, in 2018, Cotterill et al. [440] developed and tested two pilot-scale MECs fed by domestic wastewater with continuous flow for over six months. One MEC was fabricated with ten separate modules placed in a tank of 135 L, whereas the other device was a 45 L tank containing three separate modules.

3.3.2. Photoelectrochemical Cells

Photoelectrochemical hydrogen production has been successfully demonstrated at the laboratory scale only [441] and research is now focused on photocatalytic materials and PEC design to meet performance, durability and cost requirements for viable large-scale hydrogen production [442]. PEC water-splitting technologies are still under development, and almost exclusively small-size components and prototypes are tested on laboratory experiments [443].
Recently, the scale-up of photoelectrochemical cells from the common area of 1 cm2 of laboratory prototypes to panels up to 1 m2 has been developed.
PECDEMO project is a European collaborative project co-funded by Fuel Cells and Hydrogen Joint Undertaking (FCH JU) for the development of a pilot plant of a hybrid photoelectrochemical-photovoltaic (PEC-PV) tandem cell to produce hydrogen through water splitting. The area of the proposed device is 50 cm2, and photoelectrodes are realized with Fe2O3, Cu2O and BiVO4 metal oxides and Si or perovskite multi-junction PV semiconductors. The measured STH efficiency is 8%–10% [444,445].
Goto et al. [446] research, financed by the Artificial Photosynthesis Project of the New Energy and Industrial Technology Development Organization (NEDO), demonstrates a flat panel reactor with 1 m2 of receiver area with RhCrOx/Al-doped SrTiO3 photocatalyst powder suspended in distilled water without any supporting electrolyte.
Finally, The Artificial Photosynthetic Chemical Process (ARPChemi) Japan research group introduces the plan for a future industrial plant scheduled for 2030. In the research project, photoelectrochemical devices in large-scale reactor panels, product gas separation and transport technologies, and safety measures against explosion are included [447].

4. Bio-to-Gas Routes

Biomass can be considered as one of the renewable and promising energy resources that are suitable as substitutes of fossil fuels. Biomass can be burned directly for the production of heat and electric power as well as synthesize solid, liquid and gas biofuels. Biofuels are derived via a variety of methods such as thermochemical conversion technologies (pyrolysis, gasification, liquefaction, torrefaction) and biological catalytic reactions (anaerobic digestion, fermentation). Biofuels can be synthesized from dedicated cultivation of edible crops including sugar, starch and vegetable oil (first-generation), from lignocellulosic biomass such as agricultural and forestry feedstock and from municipal and industrial waste (second-generation) and cultivated aquatic feedstock such as algae (third-generation) [448].
Biomass is typically referred to as a carbon-neutral fuel since the carbon dioxide emitted from bioenergy use is balanced by carbon sequestration through photosynthesis. Still, it is recognized increasingly that this is incorrect due to carbon-stock changes [449]. The main advantage of biomass among of the rest of the renewable energy sources is to be a predictable energy resource of renewable nature that can be easily stored, transported and utilized far away from the point of origin [450]. Instead, main drawbacks are the impact on natural ecosystems and low power density (0.5 W/m2 of biomass crops) compared to other renewable sources (2 W/m2 of wind power and 10 W/m2 of photovoltaic power) [451]. Compared to coal, biomass has low contents of ash, C, FC, N, S, Si and higher volatile matter, but has also a high content of moisture [452].
The thermochemical conversion of biomass involves pyrolysis and gasification processes employing high temperature to enhance the energy density reducing the oxygen content. The decomposition of biomass converts large complex solid or liquid hydrocarbon compounds of biomass into a solid phase and a gas phase. The gas phase constitutes the syngas with a high heating value and is used for biofuel production or power generation. Instead, the solid phase is the char that is a mixture of the unconverted organic fraction (mostly carbon) and inert materials (ash). Syngas is a blend containing mainly carbon monoxide (CO), hydrogen (H2), methane (CH4), carbon dioxide (CO2), steam and other hydrocarbons such as ethane, propane and tars. Undesirable impurities could also be present such as nitrogen, sulfur and chlorine species [46]. The final product gas composition of biomass gasification depends on feedstock treated, gasification technology (e.g., type of reactor, gasification agent) and operating conditions [453].
The main steps of the biomass gasification process are outlined in Figure 16 and are:
  • Feedstock pre-treatment
  • Pyrolysis
  • Char gasification
  • Syngas clean up.

4.1. Feedstock Pre-Treatment

Feedstock pre-treatment is a fundamental step of the biomass gasification process. The main issues are:
Drying: the typical moisture content of cut wood is in the range from 30 to 60 wt%, and this constitutes a loss of energy and a decrease in gasification temperature. Every kilogram of water needs 2260 kJ of unrecovered energy to vaporize it [454]. The withdrawal of the extrinsic moisture content is a concern, especially for energy applications. Biomass is treated with a preheating process to erase the surface moisture content, while the intrinsic moisture content that ranges from 10% to 20% cannot be easily removed [455]. Svoboda et al. [456] investigate several technological solutions for biomass drying for the minimization of the emission of organic compounds.
Particle size reduction: the size of biomass feedstock affects the gas composition of pyrolysis and gasification processes. When biomass particle size decreased the gas quality, the gas yield, the carbon conversion efficiency and thus, the fuel heating value is enhanced [457,458]. Lv et al. [459] investigate the characteristic of biomass gasification. Results disclose that the larger surface area of smaller particles improves the heating rate producing more light gases (CH4, CO, C2H4) and less char and condensate. The possible explanation of this result is that for small particle, the pyrolysis process is regulated by the reaction kinetics. When the particle size increases the primary mechanism that controls the process is gas diffusion.
Fractionation and leaching: inorganic constituents of the feedstock (K, Na, Cl, S, Ca, Si, P) during thermochemical reactions produce ash particles. Fly ash particles may deposit on heat transfer surfaces or react with inert materials in the gasification reactors resulting in problems such as slagging, fouling, sintering and agglomeration [460]. Fractionation split the biomass material into two different fractions: a “coarse” fraction with an average particle size above 1 mm and a “meal” fraction with an average particle size below 1 mm [461]. Leaching is a treatment with tap water to remove water-soluble inorganic constituents (mainly alkali metals and chlorine) [462]. Arvelakis et al. [461,462,463,464] proposed numerous studies performed in laboratory-scale gasifier on the effect of leaching and fractionation pre-treatment techniques. Results show that fractionation removes a large number of ash-forming elements but deteriorates the quality of the remaining ash, increasing of agglomeration problems. On the contrary, leaching removes a large number of inorganic compounds and improves the ash quality avoiding agglomeration deposition problems.
Torrefaction: is a slow thermal pre-treatment of biomass carried out in an inert atmosphere (commonly nitrogen) in a low-temperature range of 200–300 °C and at near atmospheric pressure. This route enhances the energy density, reduces the atomic O/C and H/C ratios and moisture content, reduces the hygroscopic nature of biomass and improve reactivity and grindability homogenizing biomass properties [465]. The thermal treatment involves the decomposition of hemicellulose, the partial depolymerization of lignin and cellulose supporting the partial devolatilization of biomass but preserving the initial energy content [466].
Densification: the volumetric energy density typically is in the range from 80 to 100 kg/m3 for agricultural straws and grasses and from 150 to 200 kg/m3 for wood chips and sawdust [467]. Biomass densification increases the initial volumetric energy density to 700–1200 kg/m3 by mechanically compressing biomass feedstock [468]. The process enables several advantages such as facilitate transport and handling and improve the uniformity, the density and the quality (low moisture content) of biomass feedstock.

4.2. Pyrolysis

Biomass pyrolysis is a thermochemical decomposition process in which large complex hydrocarbon compounds are broke down in molecules with a lower molecular weight. The thermal degradation of biomass results in the production of gaseous, liquid (bio oil) and solid (char) products. It is always the first step in gasification.
It is carried out either in the total absence of oxidizing agents (air, oxygen or steam) or in an oxygen-limited condition that does not permit gasification or combustion processes. The temperature is in the range from 300 to 1000 °C [469]. The heat required can be provided by solar radiation concentrated by solar collectors [470]. Thermodynamic and kinetic conditions, including temperature, heating rate and residence time, determine the nature and composition of products. Pyrolysis generally occurs in two stages: primary reaction involves the cracking of condensable gas bond linkages by dehydration, decarboxylation and dehydrogenation, resulting in the production of condensable gases, a liquid phase and a solid phase (mainly char). The solid fraction ranges between 5–10 wt% for fluidized bed gasifier and 20–25 wt% for fixed bed gasifier. It has a high heating value, includes char (an aromatic polycyclic carbon formed by condensation of benzene rings) and ash. Tar constitutes the liquid phase, and his fraction ranges from 1 wt% for downdraft gasifiers, and 10–20 wt% for updraft gasifiers [46]. In the secondary stage compounds with high molecular weight are cracked into small molecules of non-condensable gases (CO, CO2, H2 and CH4) through steam reforming, water–gas shift, thermal cracking and tars are thermally cracked in the gasification process [471].

4.2.1. Pyrolysis Process

The following overall reaction may summarize the pyrolytic thermochemical process [472]:
C n H m O p ( Biomass ) liquid C x H y O z + gas C a H b O c + H 2 O + C ( char )
The pyrolysis process can be divided into three subclasses depending on the operating conditions:
Conventional or slow pyrolysis: the process is characterized by an operating temperature of nearly 500 °C, a low heating rate (0.6–6.0 °C/min) and a long residence time (5–30 min) [473]. These conditions allow the repolymerization reaction to maximize char production. Products are composed of solid, liquid and gaseous phase nearly in the same portion: approximately 35%, 30% and 35% respectively. The carbon content of the solid product is very high (~95%) [474]. Particles can be relatively large, with a size range from 5 to 50 mm [475].
Fast pyrolysis: the process is characterized by a very high heating rate (10–200 °C/s), high temperature (500–650 °C) and very short residence time in the reaction zone (1–5 s). The rapid quenching that follows the heating generates intermediate liquid products. Therefore, not only chemical reaction kinetics is important, but also heat and mass transfer process and phase transition phenomena [476]. These conditions promote the liquid (bio oil) production (60–75 wt%), whereas the char fraction constitutes 15–25 wt% of the mass production and incondensable gases are approximately 10–20 wt%, depending on the feedstock quality. The carbon yield is low (0.2–0.26) compared to slow pyrolysis (~0.58) [477,478]. The fast pyrolysis requires a dry pre-treatment to reduce the moisture content up to 10% and a grinding process to decrease the particle size to approximately 2 mm (see Figure 17) [479].
Flash pyrolysis: as fast pyrolysis, the process is used to maximize the liquid yield. The heating rate is very high up to 10,000 °C/s, the temperature ranges from 450 °C to 1000 °C, and the residence time is very short (<0.5 s). If the heating process is carried out at a temperature above 650 °C with subsequent rapid quenching, the main product is bio oil (up to 75%), and char and gaseous products are minimized. Higher temperature favors the gaseous product formation [480]. The minimization of the exposure of particles to low intermediate temperatures that promote the coke formation is crucial. Therefore, either small particles (above 0.2 mm) is required or a very fast heat transfer only to the particle surface [476,481].
Onay et al. [482] compare slow, fast and flash pyrolysis of rapeseed to determine the effects of parameters including temperature, heating rate, particle size and sweep gas flow rate, Kan et al. [483] analyze pyrolysis product properties and the effects of biomass pre-treatment and reaction properties, including reaction atmosphere and vapor residence time. Mahinpey et al. [484] propose a modified devolatilization kinetic model based on the thermogravimetric analysis.

4.2.2. Pyrolysis Reactors

Typical pyrolysis reactor configurations have been reviewed by numerous authors [469,475,481,485,486]. Fixed-bed pyrolysis reactors are normally characterized by slow heating rate and long residence time which denote slow pyrolysis process and provide intimate contact between fuel particles [487,488,489]. Fluidized-bed reactors provide a high heat transfer and uniform temperature fluidizing the bed with inert gas, usually recycled flue gas. Biomass feedstock needs to be fragmented and is fed into a bed of hot sand or other solids. Two types of fluidized-bed reactors are mainly used: the bubbling bed reactor and the circulating bed reactor. The former requires particle size less than 2–3 mm, an operating temperature of 500–550 °C and a residence time of 0.5 s and results in a high bio oil yield. The latter presents continuous recycling of solid matter with an external loop for the circulation of hot fluidizing media between the combustor and the pyrolysis reactor. Particle size is smaller (1–2 mm), and the superficial gas velocity is higher [490,491,492,493,494]. Ultra-rapid pyrolysis reactors provide short residence time (70–200 ms), relatively low temperature (650 °C) and high liquid yield (~90%) [454,495]. Ablative pyrolysis reactors involve high pressure between biomass and reactor wall. The high heat transfer and short residence time enhance the liquid yield [496,497]. Rotating-cone pyrolysis reactors employ centrifugal force to press feedstock particle against reactor walls [498,499]. Finally, in vacuum pyrolysis reactors the feedstock is pyrolyzed under vacuum conditions (3.5–10 kPa) and do not require a carrier gas. The heating rate and the residence time are slow; therefore, the solid yield is high [500,501].

4.3. Gasification

The gasification process thermochemically converts char and heavier hydrocarbons into gas or liquid with a lower molecular weight, such as hydrogen and carbon monoxide. The gasification reaction is an endothermic process that requires high temperatures (higher than 1200 °C). Typically, the energy required to sustain the process is provided by partial oxidation of solid pyrolysis products (mostly char) in a medium (oxygen, air, steam, hydrogen or combinations of these). The partial oxidation involves fuel consumption, either fossil fuel for allothermal gasification or up to 30% of biomass feedstock in autothermal gasification [502].
A viable alternative to the partial combustion is represented by sensible solar heat concentrated to a gasifier fed by only steam [503]. Avoiding the partial oxidation, the product syngas is not contaminated by combustion products such as NOx and SOx, CO2 emissions are erased, and biomass of fossil fuels are not consumed to enhance the reactions [504]. Moreover, the calorific value of the product gas is improved due to the amount of energy provided by the solar irradiation [505]. The biomass can be heated either directly in a cavity reactor configuration. Still, tar, coke or ash formation could foul the glass window or indirectly with an intermediated tubular absorber that conducts the heat to the feedstock but is affected by higher losses [506]. When solar irradiation is absent, the gasification operates with inert gas recycle loops [502].
The gasification medium affects the energy content of the product gas: air holds a high nitrogen fraction that dilutes the product lowering the heating value (4–7 MJ/Nm3), the withdrawal of pure oxygen is cost-effective, but the lower heating value is 10–18 MJ/Nm3. Steam enhances the hydrogen content (higher H/C ratio), and the lower heating value is 10–14 MJ/Nm3, but the water gas reaction is endothermic and requires high temperature [507]. The addition of oxygen to the steam medium provides the heat needed by endothermal reactions though partial oxidation that also enables drying and pyrolysis process. Hydrogenation that results in a product gas with a lower heating value of 40 MJ/Nm3 and catalytic steam gasification is also used [508].

4.3.1. Gasification Process

Main gasification reactions involve carbon, carbon monoxide, carbon dioxide, hydrogen, water and methane. The overall gasification reaction may be summarized by the biomass devolatilization equation [509]. Solar-assisted gasification is fed by steam. Therefore, only reduction reactions (Equations (55)–(62)) occur [510].
C x H y O z ( pyrolysis   products ) + O 2 + H 2 O CH 4 + CO + CO 2 + H 2   + H 2 O + Char + Ta r
In the partial oxidation or combustion zone, heterogeneous reactions occur between pyrolysis products, generating carbon dioxide and water vapor [511,512].
C + 1 2 O 2 CO 394 kJ / mol   Partial   oxidation   reaction
C + O 2 CO 2 394 kJ / mol   Complete   oxidation   reaction
CO + 1 2 O 2 CO 2 284 kJ / mol   CO   oxidation   reaction
CH 4 + 1 2 O 2 CO + 2 H 2 36   kJ / mol   CH 4   partial   oxidation   reaction
CH 4 + 2 O 2 CO 2 + 2 H 2 O 803   kJ / mol   CH 4   oxidation   reaction
H 2 + 1 2 O 2 H 2 O 242 kJ / mol   H 2   oxidation   reaction
In the reduction zone, high-temperature chemical reactions between the char and the reducing atmosphere take place and CO, H2 and CH4 are produced.
C + CO 2 2 CO + 172 kJ / mol   Boudouard   reaction
C + H 2 O CO + H 2 + 131 kJ / mol   Water gas   reaction
C + 2 H 2 CH 4 75 kJ / mol   Hydrogasification   reaction
Other reactions between intermediate gaseous products are involved in the gasification process resulting in the production of CO, CO2, H2, CH4 and water vapor.
CO + H 2 O CO 2 + H 2 41   kJ / mol   Water gas   shift   reaction
2 CO + 2 H 2 CH 4 + CO 2 247   kJ / mol   Methanation   reaction
CO + 3 H 2 CH 4 + H 2 O 206   kJ / mol   Methanation   reaction
CO 2 + 4 H 2 CH 4 + 2 H 2 O 165   kJ / mol   Methanation   reaction
CH 4 + H 2 O CO + 3 H 2 + 206   kJ / mol   Steam   reforming   reaction
A small quantity of NH2, SH2 and HCl are also obtained and are removed during the gas cleaning process [513].
H 2 + S H 2 S 20   kJ / mol   Hydrogen   sulfide   formation   reaction
1 2 N 2 + 3 2 H 2 NH 3 46   kJ / mol   Ammonia   formation   reaction
H 2 + 2 Cl 2 HCl 92   kJ / mol   Hydrochloric   acid   formation   reaction
The equivalence ratio (ER) is defined as the ratio of the amount of oxidizing agent supplied into the gasifier to the stoichiometric value required for complete combustion on a dry ash-free basis. It affects the performance and the product yield of the gasification process [514]. The increase in equivalence ratio enhances the combustion reaction (exothermic) releasing extra heat. Therefore, the operating temperature increases and the total energy conversion of biomass decreases with the consequent reduction of the heating value. The H2 content decreases, CO content grows for ER up to 0.25 and then decreases, whereas the CO2 has an inverse trend. If the oxidizing agent is air, the N2 content increases due to the higher amount of air injected into the gasification reactor [515].
Syngas quality mainly depends on operating temperature since gasification is a thermochemical process. Temperature affected a variety of parameters of gasification process influencing gas yield, heating value, cold gas efficiency, tar production and composition [516]. Higher operational temperature enhances endothermic reactions (steam reforming, Boudouard and water–gas reaction) raising the production of hydrogen and carbon monoxide at the expense of char and methane [517]. The amount of tar decline with temperature increase as a consequence of a higher degree of thermal cracking and steam reforming reactions [518].

4.3.2. Design of Gasifiers

A variety of gasifiers have been developed, and they can be classified in:
  • fixed-bed (or packed-bed) gasifiers;
  • fluidized-bed gasifiers;
  • entrained-flow gasifiers.
Fixed-bed gasifiers are realized with a grate that supports the fuel into the reactor. These gasifiers are inexpensive and are suitable for small-medium scale reactors. The efficiency is not maximized because of the non-uniform distribution of fuel, temperature and gas composition. Updraft fixed-bed reactors (see Figure 18a) are configured for the counterflow of the solid phase that moves downward and the gaseous phase that moves upward. This type of gasification reactor is appropriate for high moisture and high ash biomass content. The syngas near the outlet removes the moisture from the feedstock falling, and the ash drops through the grate simplifying the ash discharge. The cold gas efficiency and the heating value is high, but also, the tar generation is high [519]. Downdraft gasifiers are co-current reactors (see Figure 18b). The biomass feedstock is introduced from the top with the gasification agent and products are released from the bottom. The product gas passes through the reduction and the combustion zone in which tar is cracked due to high temperature. Downdraft gasifiers are simple and reliable, but they require low moisture and low ash content [520,521]. In the cross-draft gasifier, biomass is fed from the top and the oxidizing medium form the side of the reactor. Ash is removed from the bottom, and the tar content is higher [44,522,523].
Fluidized-bed gasifiers meet a more uniform temperature and mass transfer distribution achieved by a bed of granular materials (such as sand) that is kept semi-suspended by the gasification medium, ensuring a deep mixing of the hot bed material and the feedstock (see Figure 18c). Two main fluidized-bed gasifiers are commercialized: the bubbling and the circulating fluidized-bed gasifier. The former consists of a vessel with a fine-grained material on the moving bed with a fluidization velocity of 0.5–1.0 m/s [454,524]. The latter is characterized by a circulation of the hot gas between the vessel and the cyclone, which separates solid particles [525]. The size of particles is a critical issue for the corrosion of internal walls, but the gaseous product has a low tar content, and the main difference between circulating and bubbling fluidized-bed gasifiers is the much higher fluidization velocity (3.5–5.5 m/s) [454,521,526]. Dual fluidized-bed reactors have two separate beds in which combustion and gasification are separated. The feedstock is fed to the gasifier bed fluidized with the stream. The second bed behave as char combustor [527].
Entrained-flow gasifiers are not suitable for biomass because the feedstock requires to be very fine and for fibrous biomass is difficult, and ash require to be molten [46]. Entrained-flow gasifiers operate at high temperature and pressure and water slurry, or dry feeds can be used [528,529].

4.4. Syngas Clean Up

In the resultant syngas, there are traces of undesired compounds including ash, alkali, acid gas, inorganic components, carbon dioxide and tar. Tar is a critical product of pyrolysis formed through condensation of gaseous pyrolysis products, including single or multiple ring aromatic compounds and polycyclic aromatic hydrocarbon (PAHs). Evans and Milne [531] classify tar into four classes according to their molecular beam:
  • Primary products: cellulose-derived products (levoglucosan, furfurals, hydroxy-acetaldehyde), hemicellulose-derived products and lignin-derived methoxyphenols;
  • Secondary products: phenolics and olefins;
  • Tertiary products: methyl derivates, toluene and indene;
  • Condensed tertiary products: polycyclic aromatic hydrocarbon (benzene, naphthalene, pyrene, anthracene, acenaphthylene).
The project report coordinated by SDE agency [532] classify tar in five groups: (i) tar compounds that are not detectable with a gas chromatographic analysis, (ii) heterocyclic compounds (phenol, pyridine), (iii) aromatic compounds(xylene, styrene, toluene), (iv) light polyaromatic hydrocarbons (2–3 ring PAHs) and (v) heavy polyaromatic hydrocarbons (4–7 ring PAHs).
The three main tar removal methods are: scrubbing with an organic liquid, catalyst and high temperature cracking [533].
Primary methods limit the tar formation or convert tar in the gasification reactor via the regulation of operational conditions and employment of catalyst and additive. High temperature influences the stability of tar, reducing the tar generation yield and increasing the yield of gaseous products [534]. The regulation of operational conditions includes the increase in residence time and equivalence ratio, the direct contact with a heated surface and the partial oxidation by adding a gasification agent. Tar cracking reactions are kinetically limited and involve high temperatures, but this increases ash agglomeration and consequently corrosion and sintering on fluidized bed gasifiers [44]. The catalyst may be used in the gasification process to remove tar from gaseous products and to reduce the methane content if the main desire is to improve the syngas yield (methane reforming). Numerous catalysts have been studied including the Ni-based catalyst, metal oxide, alkaline earth metal oxides, olivine, dolomite and char [535,536,537]. Catalyst can be placed in the gasifier or a secondary reactor to avoid deactivation via carbon deposition, fouling and sintering. They should be easily regenerated, durable and inexpensive [538]. Plasma method removes CH4, SO2, NOx and tar. Plasma method can be used as an alternative clean-up process as is effective in the removal of tar, but the lifetime is short, and costs are high [539].
Gasifier type and other variables including biomass feedstock, gasification agent, bed materials also influence the tar yield. The updraft gasifier produces a gas with high tar content (50 g/Nm3) since pyrolysis products are removed without passing through the reduction and the combustion zone and primary tar conversion into the gaseous product is low. In the downdraft gasifier pyrolysis products are forced to pass through the reduction and combustion zone enhancing the tar conversion into gases (<20 g/Nm3). The fluidized bed gasifier has a high conversion efficiency of the carbon content from biomass so that the tar yield is lower (5–20 g/Nm3 for bubbling and 1–5 g/Nm3 for circulating fluidized bed reactor) [540].
Secondary methods involve post-treatments gas clean up that also removes other undesired traces. After the gas cooling typically at 20–60 °C, a conventional gas process is used: the cold wet gas cleaning that includes wet cyclones, wet filters, wet scrubbers and wet precipitators to remove particulates, tar and condensed alkali metals. Chemical solvents (MDEA) or physical solvents (Selexol and Rectisol) may withdraw acid gas (H2S and CO2) and inorganic components. Adsorption, absorption or cryogenic membranes are also used for CO2 removal and amine unit for H2S and COS removal [45]. Conventional clean-up technologies are thermally inefficient and produce wastewater sludge. An alternative is the dry hot-gas cleaning, more efficient and reliable, usually used before gas cooling with the temperature between 200 and 500 °C. Ceramic or catalytic candle filters and metallic filters remove solid contaminants, safeguard filter or catalyst remove fluid contaminants by sorbents chloride and other traces components [541,542].

4.5. Technology Readiness Level

The thermal conversion of biomass through pyrolysis and gasification is a mature technology. The IEA BioEnergy Agreement Task 33 database [543] reports the current status of gasification facilities and plants concerning technology readiness level (TRL), technology type, input and output of the facilities and additional information, including partners and a technology brief. The Country Reports analyze the status of biomass gasification of 16 countries: Austria, Denmark, Finland, Germany, Italy, Japan, Netherlands, New Zealand, Norway, Sweden, Switzerland, United Kingdom, Turkey and the United States. Among the gasification plants for the fuel synthesis, there are 14 pilot plants (TRL 4–5) whose production ranges between 1 and 100 m3/h—half of which are operational. The first pilot plant was realized in 1985 by NREL in the United States and is still in operation. The gasifier is capable of producing a variety of products including biogas, syngas, chemicals and hydrogen from a lignocellulosic feedstock [544]. Nine demonstration plants (TRL 6–7) with a production capacity between 100 and 1000 m3/h are reported in the database. Two demonstration plants are idle, four are operational, two are under construction, and one is planned. Only one over the seven first-of-a-kind commercial demonstration plants (TRL 8) is operational. The plant converts organic residues, and waste streams in fuel synthesis such as ethanol (30,000 t/y), methanol and other chemicals. Whereas, among the five commercial plants (TRL 9), three are planned (two in Sweden and one in the U.S. is scheduled for 2019), and the others are idle.
Most of these plants are realized to produce liquid fuels (mainly Fischer Tropsch liquids, methanol and ethanol). Only three facilities are supposed to produce gaseous fuels (synthetic natural gas). The one in operation began in 2003 in Canada. The pilot plant is realized by Enerkem in collaboration with the University of Sherbrooke for the processing of municipal solid waste and residuals from forest and agricultural industries. The outputs are cellulosic ethanol (375 t/y), methanol (475 m3/y) and SNG for the transportation sector [545]. In the Netherlands, the MILENA gasifier, developed by ECN, has produced clean syngas (200 m3/h) since 2009 from wood and waste in a pilot plant. Nowadays, ECN with the partnership of Gasunie and Royal Dahlman has planned the realization of a demonstration plant for the generation of SNG (300 MW) [546]. In the United Kingdom, Go Green Fuels Ltd. In partnership with Cadent, Advanced Plasma Power and Progressive Energy and Carbotech is developing a new first-of-a-kind commercial demonstration facility that is scheduled to start up in 2019. The aim of this project is the conversion of refuse-derived fuel and biomass feedstock into SNG (1500 t/y) for gas grid injection through a fluidized bed gasifier and a plasma converter for tar removal [547].
In Denmark, the Viking demonstration plant was installed at DTU in 2002. The plant is realized with a two-stage gasification process fed with wood chips (see Figure 19). The thermal input is 75 kW, and the overall efficiency from biomass to electricity is approximately 25%. In the two-step gasification process, the pyrolysis and char gasification processes are carried out in two separated reactors. Between the reactors, the preheated air partially oxidizes the pyrolysis products. The partial oxidation increases the operating temperature reducing the amount of tar that are decomposed [548,549].

4.6. Catalytic Methanation

The catalytic methanation is an exothermic process that converts carbon oxides and hydrogen into methane and water through hydrogenation [551]. The methanation reaction was discovered by Sabatier and Senderens in 1902, using a nickel-based catalyst and was further researched in the 1970s during the oil crisis [552,553]. Commonly, catalytic methanation is adopted to improve the quality of fuel gas such as the syngas produced by biomass gasification and pyrolysis, the hydrogen generated by power-to-gas technologies, and the biogas derived from anaerobic digestion. Two pathways are available to conduct methanation reaction: (i) CO methanation that converts carbon monoxide and hydrogen (Equation (66)), and (ii) CO2 methanation whose reactants are carbon dioxide and hydrogen (Equation (67)). CO2 methanation is the linear combination between the reverse water–gas shift reaction (Equation (68)) and CO methanation. However, the increasing concentration of CO inhibits the CO2 methanation reaction [554].
CO + 3 H 2 CH 4 + H 2 O 206   kJ / mol   CO   methanation   reaction
CO 2 + 4 H 2 CH 4 + 2 H 2 O   164   kJ / mol   CO 2   methanation   reaction
CO 2 + H 2 CO + H 2 O   41   kJ / mol   Reverse   water gas   shift   reaction
Although the Gibbs free energy value of methanation reactions is highly negative in a wide temperature range, the reaction rate is aided by catalysts addition [555]. The selection of the catalyst material regulates the reaction activity and selectivity to methane products, avoiding the generation of heavier hydrocarbon compounds. The nickel-based catalyst was first used by Sabatier and Senderens for hydrogenation of carbon oxides and numerous organic compounds (i.e., ketones, aldehydes, alkenes, aromatics) [556]. Elements mainly located in groups 8–10 of the periodic system of elements are suitable materials for methanation catalysis. Mills and Steffgen investigate the catalytic activity and methane selectivity of the most suitable metals for methanation reactions. The activity order is: Ru > Fe > Ni > Co > Mo, while the selectivity ranking is Ni > Co > Fe > Ru [557].
Ruthenium and rhodium are among the most active catalysts for carbon oxides methanation. Yet, the high cost of noble metals obstructs their use in commercial-scale plants [558]. The nickel-based catalyst is highly selective towards methane production, is relatively cost-effective, and the catalytic activity is suitable for enhancing the reaction at low temperature [559]. The high activity of iron-based metals promotes the carbon oxides conversion, but nickel-based catalysts are preferred for the higher selectivity [560]. Finally, the catalytic activity of molybdenum compounds (MoS2, MoO2) is lower than that of the other metal-based materials considered suitable for methanation reaction, and the selectivity is toward higher hydrocarbons production [561]. However, molybdenum experiences a high resistance to acids compared to nickel and are commonly used in sulfidic environments [562].
Supports and promotors and preparation techniques are a fundamental feature for an efficient methanation process and a high methane yield [563].
Typically, the support is made of porous material to increase the number of the active site and the surface area of the catalyst nanoparticles exposed to reactants [564]. Several metal oxides such as TiO2, SiO2, Al2O3, CeO2 and ZrO2 are adopted [565]. Zeolites are commonly used as supports to the metal catalyst as they improve the methane selectivity [566]. Although the methanation catalysts are mostly supported, Raney nickel and MoS2 compounds are prepared without support material. Raney nickel is a Ni-Al alloy prepared with the alkaline dissolution of Al that has high activity in hydrogenation and methanation reactions. Indeed, the enhanced ability to dissociate CO increases the activity and selectivity [567]. Molybdenum sulfides are active catalytic materials attractive for the high resistance to sulfuric acid poisoning [568].
Dopants act as electronic or structural promoters. Structural promoters alter the formation and stabilization of catalytic materials to promote a finer nanoparticles dispersion and thus, a higher conversion yield. The electronic promoter, instead, alters the electron density of the catalyst promoting the conversion rate and modifying the product selectivity [569]. Promotors are also able to prevent catalyst deactivation, including sintering, fouling and poisoning mechanisms. Dopants are typically metal oxides such as Zr, Ce, La, V and Mg. The addition of zirconia to catalyst materials reduces the carbon formation and the activity deactivation due to sintering [570]. Ceria remarkably prevents the formation of coke deposits and improves the catalytic activity and stability [571]. Magnesium incorporation increases the dispersion of the catalytic particles, enhancing activity and stability [572]. Similarly, vanadium oxides addition results in a remarkable increase in thermal stability, resistance to coke formation and activity. Indeed, the catalyst and dopant calcination led to the formation in the substrate of particles small and highly dispersed [573]. Finally, adding lanthanum, the activity is improved since it allows higher CO2 adsorption on the surface, and the selectivity increases up to 100% at low temperature [574].
The metal catalyst is subjected to deactivation processes during methanation reactions, including chemical deactivation due to poisoning and vapor–solid reactions, thermal deactivation due to sintering, and physical deactivation due to fouling and attrition [575].
Poisoning of the catalytic material is due to contaminants in the inlet gas, such as chlorides, tars, ammonia, alkali metals, sulfuric acid and coke [554]. Contaminants are chemisorbed on the catalyst surface, leading to the formation of new compounds and blocking the active sites. The electronic and geometric structure could be modified, altering the catalyst activity and selectivity irreversibly [576]. The poisoning by sulfur compounds (i.e., H2S) is a critical issue in numerous catalytic process, including methanation. Bartholomew et al. [577] explore the effect of operating conditions on H2S poisoning. They found that the increasing of H2/COx ratio and temperature promote sulfur poisoning. Moreover, only the MoO3 promoter increases the sulfur tolerance of nickel catalyst. Catalysts can be regenerated under controlled oxygen atmospheres or with inorganic oxidizing agents (i.e., KMnO4) that oxidize liquid phase and the adsorbed sulfur [578].
Vaporsolid reactions decrease catalyst activity. Catalysts react with inlet gas, support or promoters resulting in the formation of volatile compounds. Nickel reacts with carbon monoxide, generating nickel tetracarbonyls (Ni(CO)4) that increase nickel crystals size [579]. The vapor–solid reaction occurs at temperatures above 300 °C. Normally, the operating temperature of industrial plants are higher, but the problem exists at the start-up and shut-down phase of the methanation plant [580].
Sintering is a thermal degradation enhanced by high temperature and pressure that reduces the activity of catalysts. The total active area is reduced by the support collapse, the nickel encapsulation, and the agglomeration of the catalyst nanoparticles [581]. Steam promotes particles agglomeration, leading to the formation of Ni2+ doped alumina phase that promotes the loss of activity [582]. The particle growth could occur via two mechanisms: the particle migration, collision and coalescence, and the atom migration or vapor transport [583]. The former mechanism occurs at low temperatures, while the atom migration is the dominant sintering mechanism at high temperatures (550–600 °C) [584].
The deposition of dopants (i.e., ZrO2) onto the catalyst surface [585] and the encapsulation of colloidal catalyst nanoparticles prevent the degradation process [586]. Further, the regeneration of the deactivated catalysts due to sintering and carbon deposition is practicable. The calcination of the catalyst removes the carbon deposition, and the reduction of the NiAl2O4 lattice regenerates the metallic Ni particles with small size [587].
Fouling is the mechanical deposition of chemical compounds on the catalyst surface blocking the active sites and pores. Fouling also provokes the detachment of the metal catalyst from the support material [66]. The main deposited species are carbon, produced by CO cracking, and coke, generated by the decomposition or condensation of hydrocarbons. Carbon and coke deposition is restrained by the control of operating conditions [588].
Attrition is the breakage or abrasion of particles induced by the mechanical motion between particles in the feed fluid and the catalytic material. Many variables, including the direction of the collision between the catalyst and moving particles, the velocity and the contact stress, govern the attrition effects [589]. Indeed, either abrasion or fragmentation could occur. Abrasion removes fine particles of the catalyst surface, fragmentation shutter the surface in several parts [590].
The product yield, the gas composition and the carbon deposition depend on operating conditions including temperature, pressure (see Figure 20) and concentration ratio between inlet reactants (H2/COx) (see Figure 21).
Temperature variation significantly affects the equilibrium composition of methane yield, both in isothermal and adiabatic methanation. When temperature increases, the concentration of CO, H2. CO2 and carbon deposition are enhanced at the expense of methane. Contrariwise, pressure increase has a negligible impact on isothermal reaction, and only slightly increase the methane outcome in the adiabatic process [592].
Large H2/COx concentration ratio of the inlet reactants improves the methane yield and reduces carbon deposition. The increase in pressure reduces the minimum ratio required to avoid carbon deposition. Indeed, the limiting boundary ratio, above which no carbon deposition is observed at any operating temperature, is placed at H2/COx ratio of approximately 5 at standard pressure, whereas the concentration ratio drop to 3 (stoichiometric ratio) with pressure higher than 10 atm [555,593].
At standard pressure, the coke formation occurs at a temperature above 400 °C, but with increasing pressure, the carbon deposition is shifted at a higher temperature range (650–800 °C) [595].
Gao et al. [594] broadly investigate the effect of temperature, pressure, H2/COx ratio, and the effect of additional compounds (H2O, O2, CH4, C2H4) that are commonly involved in the inlet gas or added by recirculation of products to limit the temperature increase due to reaction exothermicity. The addition of steam avoids the carbon deposition but slightly decrease methane production. Whereas, CH4 recirculation does not modify the product composition but slightly enhance the carbon deposition due to methane cracking reaction. C2H4, C2H6 and C2H2 reduce CH4 production because they compete with CO in the hydrogenase reaction.
Carbon oxides commonly coexist in the syngas mixture, so the simultaneous conversion of both compounds was also investigated. The CO conversion rate is faster than that of CO2 since the CO hydrogenation is easier [596]. CO2 addition enhances the occurrence of reverse water gas shift reaction that slightly decreases both the CO conversion and the carbon deposition reactions [597].
Finally, the residence time of the gas in the reaction chamber increases the conversion of CO2 and CH4. The residence time is measured through the gas hourly space velocity (GHSV) that depends on both operating conditions and reactor design [598].
In conclusion, optimal operating conditions to obtain high methane yield, and avoid the carbon deposition, and catalyst sintering are relatively low temperature (200–500 °C), a high pressure (10–30 atm) and an H2/COx ratio above the stoichiometric value of 3 [599].

4.6.1. Reactors

The main issue for reactor design and operation is the control of temperature profiles due to the reaction exothermicity. Reactors operate with an adiabatic, isothermal or polytropic temperature profile [591].
Kiewidt and Thöming [600] distinguish the reactor temperature profiles introducing the Semenov number, defined as the ratio of heat production rate to cooling rate. If the Semenov number assumes values near zero, the temperature profile is isothermal (high cooling rate or low heat generation). Whereas, when the Semenov number tends to infinity, the reactor operates in adiabatic conditions. For intermediate values, the behavior is polytropic.
Fixed-bed reactors with nickel or ruthenium catalyst are typically adopted, but structured and fluidized bed reactors are also developed to overcome temperature hot spots and high-pressure drops [554].
Fixed-bed reactors are typically tubular reactors packed with small catalytic pellets [601]. Packed-bed reactors are the reactor most used industrially due to high conversion efficiency, low operating cost, and continuous operation. Drawbacks are the hot spot formation, high-pressure drop and high exit temperature that could lead to catalyst cracking or sintering [602]. The temperature control on adiabatic fixed-bed reactors is obtained by a series of adiabatic reactors with intercooling, the recirculation of exit product gas or the dilution with inert gases [603,604]. Contrariwise, in cooled fixed-bed reactors, the temperature is tuned by cooling pipes or plates placed in the catalyst bed [453]. The most common industrial processes that employ fixed-bed reactors are Lurgi, TREMP and HICOM. The process developed by Lurgi employs two adiabatic fixed bed reactors with internal recirculation for heat management. Indeed, the TrempTM process recovers the reaction heat at high temperature vaporizing the water at high pressure. The process involves two or more adiabatic reactors with intercooling. Finally, HICOM process employs two or more methanation reactors fed by saturated syngas. The temperature control is obtained by cooled product gas recycling. The heat is recovered by high pressure and temperature steam generation [605,606].
Fluidized-bed reactors operate in near isothermal condition. The catalyst particles are fluidized by the inlet. The uniform mixing of catalyst and reactants guarantees a more uniform temperature profile avoiding the hot spot formation [607]. Drawbacks are the catalyst degradation due to attrition and bubbling formation [606].
Three-phase reactors as fluidized-bed reactors operate in near isothermal condition. The catalyst particles are suspended in a liquid phase. The high heat capacity of the liquid phase guarantees a uniform temperature in the reactor and the efficient removal of heat [173]. Drawbacks are the evaporation or decomposition of the liquid suspension and the mass-transfer resistance of the liquid phase [608].
Structured reactors are polytropic reactors realized with an internal metallic structure coated with the catalyst. The most employed structured reactor has a monolithic catalyst realized with several parallel channels [609]. Microchannel reactors are compact reactors with a high specific surface area that enhance the mass and heat transfer [610]. The temperature profile is uniform as the metal walls have high thermal conductivity, and the pressure drop is low [611]. Moreover, the scale-up is relatively simple since it is possible to increase easily the number of microchannels placed in the reactor [612]. The main drawbacks are related to the catalyst deposition and replacing on the metallic structure and the high cost [173].

4.6.2. Technology Readiness Level

Catalytic methanation technologies are well known and adopted in industrial plants. Thema et al. [64], Augustyn et al. [613] and Bailera et al. [614] broadly review power-to-gas projects. More than 30 chemical methanation pilot plants are investigated by Thema et al. [64]. Among these, 9 plants are coupled with an electrolyzer with a capacity above 100 kWel.
In 2009, Etogas installed a 25 kWel methanation plant (alpha-plant) in Germany. In the following years, Etogas has installed three plants with the same capacity in Germany, and one in Switzerland. In 2012, an up scale to 250 kWel installed capacity was proposed (alpha-plus-plant), and in 2013 the beta-plant with 6 MWel installed capacity was realized by co-operation partners Etogas, IWES, Audi, EWE and ZSW [615,616]. In 2015, the same co-operation partners developed the WOMBAT research project in Germany to demonstrate the operation of the first industrial power-to-gas plant for gas grid injection with an annual methane production of 3 MNm3. Three alkaline electrolyzers with a capacity of 2 MWel each produce hydrogen, exploiting the renewable energy surplus. The carbon dioxide required for the methanation reaction is generated in the biogas plant [617]. MeGa-StoRE project has proposed a one-step methanation process for biogas upgrading. Electrolyzer modules produce the hydrogen requested for the catalytic methanation. In 2015, the first proof of concept plant was built in Denmark. Three additional plants are planned: a 250 kWel size demonstration plant in 2020, and two commercial plants with 10 MWel installed capacity in 2035 and 2050 [618].
Three demonstration plants have been planned within Store&GO project in Italy (200 kW), Germany (1 MW) and Switzerland (700 kW, under construction). In Italy the methanation modular micro-reactor is coupled with the electrolyzer modules realized by the INGRID project, while the carbon dioxide required for the catalytic reaction is absorbed and captured from the atmosphere. In Germany, the honeycomb reactor is fed by the CO2 captured in a bioethanol plant and the hydrogen generated by the electrolyzer coupled with wind facilities [619].
GoBiGas project is the first-of-its-kind at the industrial scale, built in Sweden by Göteborg Energi AB and the Swedish Energy Agency for the commercial production of 20 MW of biomethane. GoBiGas plant combines the biomass gasification and methanation processes for the biomethane grid injection. The plant was decommissioned in 2018 [620].
Finally, other projects with installed capacity above 100 kWel are in operation such as CO2RRECT, RenerG2 and W2P2G. The CO2RRECT project was developed in 2013 in Germany. The methanation reactor is fed by the hydrogen produced by a 300 kWel electrolyzer and the carbon dioxide from the flue gas conveyed from a lignite-fired power plant [621]. RENERG2 project has been constructed in 2015 in Switzerland. A PEM electrolysis cell with non-noble metal catalysts produces the hydrogen for the hydrogen-rich methanation of CO2 containing gases [622]. Moreover, the W2P2G (waste to power-to-gas) project (400 kWel) in the Netherland has been promoted by several project partners including Attero, Gasunie, Audi, the Ministry of Economics and the Ministry of Infrastructures. The Attero biogas production plant is combined with an electrolyzer and a methanation reactor. The biomethane produced is injected into the natural gas grid [623].

5. Green Synthetic Fuels Supply Chain

Synthetic fuels can be stored, injected into the natural gas network, burned or converted in electricity through the fuel cell technologies. The hydrogen supply chain can follow three pathways: (i) the on-board storage in tanks for road mobility application through fuel cells, (ii) the transport through dedicated pipelines and its subsequent utilization in fuel cells for building heat and power generation and in combustor for high-heat industrial processes, and (iii) the injection in existing pipelines blended with natural gas and its utilization for typical natural gas end uses. Instead, synthetic natural gas can be stored on-board for vehicle application or injected in the natural gas grid and then burned or used in fuel cells.
The fuel storage provides a high energy density, large size, and long-term storage capacity. The injection of synthetic fuels into the gas network is a possible pathway to overcome the problem of not only temporal but also spatial discrepancies between the power supplied by intermittent and distributed renewable energy sources and the power requested by the loads. Combustion and reaction in fuel cells reconvert the energy stored in the chemical bond of fuel molecules into thermal or electrical energy, respectively.

5.1. Gas Quality and Interchangeability

The quality and composition of the gas injected into the natural gas grid are subject to restrictions imposed by national standards due to safety and technological issues. The gas quality specifications are established for the safe operation of domestic appliances, such as the prevention of carbon monoxide emission, the continuity of pilot flame and the reliability of burner flames, and the minimization of emissions and particulates. Furthermore, the gas composition also impacts on chemical processes, combustion efficiency, NOx emissions, and gas transport [624]. Thus, the transition from natural gas to hydrogen transport in the gas grid requires the compatibility with high pressure and distribution network and end-user appliances [625].
However, the gas quality specifications are different across the European Union [626]. The inhomogeneities of gas grid injection European legislation is a critical issue for cross-border gas transport. Therefore, the European Commission has commissioned projects for the harmonization of the gas grid injection normative [627]. The EASEE-gas (European Association for the Streamlining of Energy Exchange-gas) establishes and promotes standard natural gas quality specification at cross-border points in Europe, recommends gas quality parameters, parameter ranges and implementation plans [628]. The gas quality specifications proposed in the EASEE-gas Common Business Practice 2005-001/02 are summarized in Table 1. The adaptation to the new directives could affect appliances efficiency and emissions and transport capacity of the gas network.
Given the substantial difference between hydrogen and methane that is the main natural gas component (Table 2), the admixture of hydrogen and natural gas discloses some critical issues for end-use applications. Nevertheless, technological solutions are available to overcome most of these problems. Indeed, blending the hydrogen into natural gas, several admixture properties are modified such as the Wobbe index, density, net calorific value and combustion air [629].
The NATURALHY project, supported by the European Commission, investigated the effect of hydrogen addition to natural gas in terms of feasibility, safety and critical issues. The goal was to establish the conditions under which hydrogen can be injected into the natural gas grid. Results demonstrate that safety is generally ensured with a hydrogen concentration of 20% if measures are adopted to overcome the criticalities observed [630]. Below are summarized the main considerations on the possible effects of hydrogen and natural gas blend on sensitive components.
Burner technologies are sensitive to gas composition and low tolerant of gas composition fluctuation. The gas composition could affect the residential appliance operation resulting in soot formation, a higher level of polluting emissions and safety issues (i.e., flame stability). Atmospheric burner adaptation depends on the air excess and the initial Wobbe index [631].
In the gas engines, a low fraction of hydrogen (<5%) enhances flame stability and combustion efficiency. Nevertheless, the hydrogen admixture provokes a higher knocking (detonation) propensity reducing the engine performance and lifetime. The methane number denotes the resistance of fuel gas to knock. Pure methane represents the knock resistance reference fuel with methane number 100, while the methane number of pure hydrogen is 0 [632]. Thus, the addition of hydrogen into the natural gas blend reduces the methane number. The Gas Infrastructure Europe (GIE) suggests a methane number above 80 since lower values could reduce the efficiency and increase the emissions of gas engines [633]. Anyway, a concentration of up to 10% in volume is feasible with additional control systems.
Similarly, gas turbines are susceptible to gas quality variations due to the lean premixed combustion processes. Many gas turbines are guaranteed for a blend with 1%–5% of hydrogen in volume. However, simple modification can increase the acceptable concentration of up to 15% [634].
Finally, non-combustion applications in several industrial processes that adopt natural gas as a chemical and manufacturing feedstock (i.e., ammonia fertilizers, reforming, fuel cells) are sensitive to the gas composition that could impact on safety and efficiency [631]. A possible solution is the downstream extraction of hydrogen that concerns the separation of hydrogen and methane that are mixed in the gas pipeline. Gas separation is a feasible way to supply natural gas to industrial facilities that cannot accept hydrogen for manufacturing processes. Moreover, it can also be used to provide pure hydrogen to applications such as fuel cells for transportation [635,636]. The pressure swing adsorption system is a well-established technology for gas separation. However, it is economically and energetically non-affordable. An alternative is the selective membrane separation technology that is very efficient with relatively high hydrogen concentration, but at a low level, the high pressure required is a challenge [637].
The safety issue associated with hydrogen is not more critical than that related to other fuels. Hydrogen is colorless, odorless and difficult to detect. Moreover, the flammability range is broad (4%–75% by volume), and the minimum ignition energy is low (0.017 mJ), resulting in an easy ignition. Anyway, the low density (0.0873 kg/m3 at normal temperature and pressure) makes it buoyant in air. So, in an open environment, hydrogen is easily and quickly dispersed. Though, in enclosed spaces, the hydrogen accumulation near the ceiling has to be prevented to avoid gas ignition and deflagration [638,639].
Furthermore, leak detection is challenging for hydrogen. Indeed, the flame is invisible, and odorants such as mercaptans that are typically used for natural gas odorization are not suitable for hydrogen as well as many gas sensors and analyzers [640]. The gas sensor that is generally employed by transmission system operators (TSOs) is the flame ionization detector (FID). The FID is designed for the detection of hydrocarbons but is not sensitive to hydrogen compounds [641,642]. Further, gas chromatography with a thermal conductivity detector and helium as a gas carrier are inadequate for hydrogen detection since their thermal conductivity is comparable and the response is non-linear. Therefore, argon or nitrogen gas carriers or alternative gas sensors have to be adopted [643]. New sensors are studied and developed to detect blends of hydrogen and natural gas. For example, detectors based on electrochemical cells [644], semiconductors [645], the combination of calorimeter and thermoelectric gas sensors [646] and selective membranes [647] are proposed.
In conclusion, it is possible to establish that an admixture of hydrogen and natural gas with a hydrogen concentration up to 10% by volume can generally be injected into the natural gas grid with no significant problems of safety and efficiency [648,649].

5.2. Gas Network Injection

Synthetic natural gas grid injection does not involve specific issues apart from respecting the gas quality requirements. Therefore, synthetic natural gas upgrading is commonly necessary. Indeed, especially water and carbon dioxide have to be removed to match gas network specifications, and LPG has to be added to tune the heating value [650].
Instead, hydrogen injection into the gas network presents several critical issues. The natural gas network cannot be used for pure hydrogen transport without modification of network components since the physical and chemical properties of hydrogen and natural gas are different. Anyhow, in the current natural gas grid could be injected a blend of natural gas and hydrogen. The maximum concentration admissible depends on pipeline material, operating pressure and national legislation. The upper limit established according to pipeline resistance is in the range of 20%–30% [2]. However, the maximum hydrogen content by volume accepted in the natural gas transmission system ranges in the United States between 5% and 15%, and in Europe between 0.1% and 12% [640].
Hydrogen injection into the natural gas grid can impact on transport capacity and pipeline properties.
The natural gas energy density is more than three times higher than that of hydrogen. The higher heating value is approximately 13 MJ/Nm3 for hydrogen and 40 MJ/Nm3 for natural gas. Therefore, a higher amount of hydrogen is needed to satisfy the same energy requirement [651]. However, this reduces the pipeline transport capacity since the maximum allowed pressure is imposed by safety constraints [652].
The linepack capacity is also reduced. Linepack is an essential aspect of the gas transmission network that consists of short-term storage into the pipeline of a volume of gas for peak demands coverage. The linepack capacity for hydrogen is approximately 65%–70% of natural gas linepack on a volume basis and nearly four times less on energy base [653].
Moreover, pipelines mechanical properties are affected by hydrogen embrittlement. The hydrogen diffuses easily through the pipeline material due to the low molecular radius and combines in submicroscopic voids of the carbon steel, leading to trapped molecules and subsurface fissuring [654]. The hydrogen embrittlement of steel facilitates the degradation of mechanical properties (fracture toughness, crack propagation and fatigue resistance and ductility) and promotes the crack growth in pipeline walls [655]. Indeed, the hydrogen diffusion through dislocation and accumulation in the metal lattice leads to an increase in internal pressure and crack initiation and propagation [656]. The metal embrittlement is enhanced by high hydrogen concentration, high operating pressure and temperature, cyclic loads and low steel resistance [657]. Therefore, the embrittlement depends on the composition of pipeline material as well as the pressure fluctuation. The higher the pressure fluctuation, the higher the hydrogen embrittlement and the material fatigue [658].
Furthermore, in the transmission line, gas compression stations are installed to increase the pressure of the gas mixture. Indeed, the pressure of the gas flowing in the pipeline drops due to distributed and concentrated losses. The pressure losses of gas blend with hydrogen are lower than that of natural gas due to the lower friction coefficient. Thus, the power required for compression is reduced [659]. Reciprocating compressors are not sensible to gas admixture composition, while centrifugal compressors operation is affected by the higher rotational speed required to compress a higher volume of gas. Therefore, the rotational velocity is increased by 1.75 times and suitable materials are required [625].
Contrariwise, pressure-reduction stations reduce the gas pressure for the injection of the blend into a pipeline with lower operating pressure. The gas expansion in a throttle valve reduces the pressure. The gas temperature is changed due to the Joule-Thompson effect. At room temperature, the Joule-Thompson coefficient of natural gas is positive (0.5 K/bar) resulting in a temperature decrease with isenthalpic expansion and therefore, is preheated to avoid condensation. Whereas, the hydrogen coefficient is negative (−0.035 K/bar) and does not need preheating treatment [660].
The Joule-Thomson effect also occurs during hydrogen injection into the natural gas grid. When pressurized hydrogen is introduced into the pipeline, the temperature increases for the Joule-Thomson expansion but is balanced by the temperature decrease due to intermolecular forces which reduce the kinetic energy–the overall effect results in a decrease in temperature [661].
Finally, leakage is a critical issue in hydrogen transportation since the hydrogen diffusion coefficient is up to four times higher than that of natural gas. Indeed, the hydrogen easily permeates seals and plastic pipes due to its small size, high diffusivity and low viscosity. Fugitive emissions occur from valves, seals, gasket and also through the pipeline walls. On a volume basis, if the leak is tiny and the predominant mechanism of transport is the molecular diffusion, the relative leak rate for two gases is inversely proportional to the square root of their molecular weight [662]. Therefore, the rate of loss of pure hydrogen through pipeline orifices or leaky seals is up to three times higher than that of natural gas. However, on energy basis hydrogen loses are lower. The diffusion and leakage through the pipeline walls are mainly related to plastic (polyethylene) pipelines used in the distribution grid. Although the annual loss of hydrogen due to leakage is negligible compared to the total volume transported (0.0005%–0.001%) [663].

5.3. Combustion

Combustion parameters such as the Wobbe index, methane number and laminar flame speed are crucial indicators of the interchangeability of different fuel gases.
The Wobbe index (WI) is defined as the ratio of the calorific value (higher or lower heating value) on a volumetric basis to the square root of the relative density ( H H V / d ) at specified reference conditions [664].
The hydrogen addition to the natural gas blend changes the Wobbe index non-linearly due to the linear decrease in heating value and the non-linear decrease in the square root of density (see Figure 22). A natural gas blend with the high Wobbe index accepts a hydrogen concentration of approximately 55% before achieving the lower limit, and the minimum value of the Wobbe index is reached at a hydrogen concentration of approximately 80% in natural gas. However, when the hydrogen concentration of 20%, the higher heating value is significantly reduced [665].
The hydrogen addition causes the increase in the laminar flame velocity and reactivity. The hydrogen flame velocity is higher than that of methane and typical natural gas injected in the gas network. When the burning velocity in the primary flame front exceeds the velocity of the unburned mixture, the flame becomes unstable. The flame propagates upstream into the burner, causing the so-called flame flashback [666]. The flame instability could also lead to flame-lift lifting, flame blow-off, escape of explosive mixture and excess of CO emissions [667]. Typically, the laminar flame velocity increases of approximately 5% with a hydrogen concentration of 10% in natural gas [648].
Moreover, the laminar flame velocity of atmospheric burners is also affected by primary excess air ratio (see Figure 23). The excess air ratio is defined as the ratio of the actual air supplied to the burner to the stoichiometric air needed for the complete theoretical combustion [668]. Therefore, the excess air ratio rises with hydrogen addition since the amount of intake air for combustion in atmospheric gas burner depends only on fuel pressure that is not affected by fuel composition. Whereas, the stoichiometric hydrogen-air requirement is four times lower than that of natural gas [669]. For rich premixed combustion, the higher air ratio results in an increase in burning velocity and therefore, in lower flame stability. Whereas, in a lean gas, the flame velocity slightly decrease due to the air ratio growth that compensates the increase in burning velocity [670]. Moreover, the flashback occurs more likely at a ratio near the stoichiometric air point where is reached the maximum flame velocity.
The hydrogen addition to natural gas reduces the CO2 emissions as there is a lower quantity of carbon in the blend to oxidize (see Figure 24). However, since the hydrogen heating value is lower than that of natural gas, the CO2 emission decrease is non-linear due to the higher amount of fuel required to generate the same heat of combustion [672]. Further, the addition of hydrogen reduces the number of unburned hydrocarbons and CO due to displacement of carbon-containing fuel, and high flammability limits and rapid flame propagation that favor complete combustion [652,673].
Finally, the addition of hydrogen to natural gas blend increases the formation of NOx. Indeed, at a constant equivalence ratio, the hydrogen combustion increases the flame temperature. Thermal NOx generation occurs at a temperature above 1900 K and is enhanced by temperature increase. Moreover, the hydrogen addition promotes the formation of intermediate compounds (e.g., OH and H) that support the reactions of thermal NOx generation. Anyhow, the overall NOx formation increase is slightly smoothed by the lower production of prompt NOx. Prompt NOx derives from the reaction between N2 and hydrocarbon radicals [661].

5.4. Fuel Cells Gas Quality

Hydrogen can be used in fuel cells both for transport and heat and power generation (CHP) for domestic and larger commercial systems [674].
PEM fuel cells are an emerging technology in the transport and small power generation sectors mainly due to their fast start-up time and high efficiency. However, contaminants including carbon monoxide, hydrogen sulfide and ammonia affect fuel cell degradation and durability [675]. Contaminants mainly deteriorate the performance of catalyst materials (typically platinum) due to dissolution and sintering, the carbon supports and the membranes [676]. The normative ISO 14687-2 specifies the quality requirements and maximum limits of contaminant compounds in the fuel [677].
Carbon monoxide is a critical contaminant due to carbon formation and deposition on the catalyst active surface. Addition of dopants or suitable supported materials decreases the effects of CO impurities [678,679]. High operating temperature and introduction of oxygen into the gas flow are methods to reduce the CO poisoning [680].
Furthermore, hydrogen sulfide and ammonia poison the catalyst surface reducing the activity [681]. Further, ammonium ions could migrate to the Nafion® membrane and compete with hydrogen ions reducing the cell conductivity [682]. PSA units and quench efficiently remove sulfurs and ammonia contaminants [683].
Finally, carbon dioxide, as well as inert gases (e.g., N2) provoke a dilution effect of fuel, limiting the diffusion of the hydrogen [684]. However, CO2 also increases the CO content through the reverse water gas shift reaction increasing losses due to carbon deposition [685].
Contrariwise, solid oxide fuel cells and molten carbonate fuel cells are used for industrial power generation (CHP) since they operate at high temperatures. High temperature fuel cells (HTFC) are not suitable for the transport sector since they operate with a slow start up and suffer thermal cycles [686]. However, the main advantage is fuel flexibility. Indeed, HTFC can operate with hydrocarbons, but fuels are typically reformed in an external unit to avoid coke formation [687].
Hydrogen sulfides and halogens are adsorbed on Ni/YSZ active surface inhibiting the catalytic reactions [688]. H2S and HCl are removed by adsorption in materials, such as activated carbon, metal oxides (ZnO, MnO, CuO), silica gel and zeolites [689], or chemical absorption in water [690]. The hydrogen sulfide solubility is improved by alkaline compounds or by H2S catalytic oxidation [690].
Furthermore, siloxanes are dangerous since they decompose to silica that deposits on catalyst surface [691]. Siloxanes are removed by adsorption in activated carbon, silica gel or zeolites, absorption in water or more effective organic solvents such as Selexol™, that is a blend of polyethylene glycol or dimethyl ethers. Siloxanes are also removed through the cryogenic separation or biological removal [692].
Moreover, tars promote the carbon deposition and pore-blocking of catalyst materials [693]. Tars are catalytically removed directly into the gasification reactor of with downstream treatments. Catalysts appropriate for tar removal application are calcined rocks, zeolites, iron ores, alkali metals, noble metals and nickel-based materials [694].
Finally, particulate and ash removal is also required to control alkali metal contamination and pore-blocking of the electrodes. Several technologies exist for particles removals such as cyclones, electrostatic filters and barrier filters [695].

5.5. Storage

Green synthetic fuels represent a promising solution for large-size and high energy capacity daily and seasonal storage. Indeed, super-capacitors, flywheels and batteries show small hydrogen capacity and short discharge time, as shown in Figure 25. Compressed air storage and pumped hydro storage are capable of storing a large amount of electricity but are limited by geographical constraints and usually used for weekly storage [696,697]. Moreover, gas storage is required for transportation when the natural gas grid is not available and to carry vehicle fuel. Indeed, the low volumetric density of gases that is 0.7–0.9 kg/Nm3 for natural gas, depending on composition, and 0.0899 kg/Nm3 for hydrogen, requires high pressures or low temperatures to reduce the occupied volume and economically store or transport.

5.5.1. Compressed Gas Storage

Natural Gas

Gas can be stored and transported in containers at high pressures. The natural gas vehicle fuel is typically stored up to 250 bar that corresponds to a volumetric density of 175–225 kg/Nm3 [698]. However, at a pressure above 150 bar, the content of higher hydrocarbons can increase dramatically due to compressor oil carry-over. Therefore, rich gas (i.e., gas with a high hydrocarbon content) is compressed at a pressure below this limit [699]. The energy consumed for compressed natural gas is approximately 40% lower than that required for liquefy the gas. However, the gas compression generates heat thus are required multistage and intercooler that increase the operational and maintenance costs [700].

Hydrogen

Hydrogen is compressed at a pressure between 200 and 700 bar (20–60 kg/Nm3). The energy consumption for compression is up to 15% of the energy content of hydrogen (high hydrogen isobaric specific heat) and clearly, increase with pressure [701]. Tanks for vehicle fuel are subjected to hydrogen embrittlement of steel and gas leakage through the sealant. These problems are also encountered in the natural gas pipeline, but in tanks are enhanced by the higher pressure. Thus, restriction to 2% of the hydrogen volume fraction is currently imposed on tanks for vehicle fuel [634]. Moreover, the selection of suitable materials for vessel walls is crucial. The most common solution is a four-layer structure. The internal layer is a high-density polymer coating that covers the aluminum-alloy tank structure. Externally is applied a protective layer of carbon fiber-reinforced plastic coated by a shock-absorbing protective layer of fiberglass [702].

5.5.2. Liquefied Gas Storage

The gas liquefaction is a viable way to store and transport with ships or tracks the gas where the gas pipelines are not available (e.g., transport across the oceans). However, the process is costly because of high energy consumption, the need for expensive cryogenic catalysts, well-insulated containers and refrigerated transport, and safety issues. Moreover, the liquefied gas has to be regasified before local distribution [703]. Commonly, vessels are constituted by two concentric shells (primary and secondary barrier) to contain leakage. Between shells is placed an insulator layer or vacuum is generated to avoid thermal losses [704].

Natural Gas

Natural gas is liquefied by cooling at temperatures below −162 °C at atmospheric pressure. The volume is approximately 600 times lower than that of the gas at room temperature [700]. Natural gas is liquefied through compressions and intermediate cooling. At the last step, the gas is enthalpically expanded in a throttle valve and the temperature decreases due to the Joule-Thompson effect generating liquid phase. The cooled gas not liquefied is recirculated [703].

Hydrogen

Hydrogen is liquefied at −253 °C at ambient pressure. The volumetric density of the stored gas reaches 70 kg/m3, but the energy consumption for the liquefaction process of hydrogen is up to 30% of the lower heating value [701]. Thus, hydrogen is generally liquefied only when a high storage density (e.g., aerospace applications) is required. The cryogenic cycle adopted for natural gas liquefaction is not suitable for hydrogen because the inversion temperature is above the room temperature. Therefore, hydrogen is commonly precooled with liquid nitrogen or helium before the first expansion step, and further expansion units with intercooling are required [705].

5.5.3. Gas Solid Storage

Gas can be stored into materials via two pathways: the physical adsorption (physisorption) in porous solid materials and the chemisorption in solid structures. The main advantage is that the molecular desorption of the stored gas occurs only when energy input is supplied [706].

Natural Gas

Natural gas can be stored and transported in solid-phase adsorbed into solid structures or by forming gas hydrate [707].
The physisorption consists of the weak interaction (Van der Waals forces) between the hydrogen molecules and the adsorbent material [708]. Adsorbed natural gas is a promising gas storage technology in which natural gas is adsorbed into a porous solid material at relatively low pressure (35–40 bar) and room temperature [709]. Compared with compressed and liquefied natural gas storage, the energy consumption is lower, whereas safety is increased, especially for transport fuel application [710]. Adsorbent materials should have a high surface area that ranges between 1000 m2/g for low-grade materials and 3000 m2/g for high quality upgraded materials, high porosity and fast rate of charge and discharge [711]. Adsorbent materials considered viable for gas storage are activated carbon, metal-organic framework and activated carbon fiber. Physical and chemical activation are adopted to increase the adsorbent properties and develop micropores to enhance the specific surface area. Physical activation uses steam or carbon dioxide, while chemical activation exploits potassium hydroxide, potassium chloride or phosphoric acid treatments [712]. Thermal and hydrodynamic management are crucial issues that affect storage capacity. The heat of adsorption increases during the charging phase. The problem could be overcome by cooling the gas before the injection into the reservoir and by the recirculation of not adsorbed gas. Instead, during the discharge phase, the temperature drop has to be avoided [713].
However, the desorption of high molecular weight hydrocarbons is ineffective, and they have to be removed before the gas injection into the reservoir [714,715].
Natural gas hydrate is a crystalline ice-like solid in which the natural gas compound is surrounded by a cage of water molecules [716]. The hydrate structure is stabilized when gas molecules create a weak interaction (Van der Waals forces) with the liquid water leading to a crystalline phase. Gas hydrate store large quantities of natural gas up to 180 m3 per one volume of gas hydrate [717]. The storage of gas in hydrate occurs at low temperatures or high pressures. The natural gas hydrate can be formed at 80–100 bar and 2–10 °C [718]. Moreover, the hydrate slurry is chemically stable at temperatures below −10 °C [719]. Processes for hydrate formation includes mixing of gas-saturated water, fine water jet, wave impact on a water-bubble medium and vibratory and supersonic technologies [720]. High agitation, high surface area, miscible hydrate promoter introduction increases the storage capacity reducing the amount of water occluded by the solid hydrate [721].

Hydrogen

The adsorption of a suitable amount of hydrogen into the solid structure requires cryogenic temperatures. Materials used for physical adsorption should have a high specific surface area, a low bulk density and high enthalpy. Therefore, porous solid materials are used such as carbon materials (activated carbon, nanotubes, nanofibers, aerogel and templated carbon), porous polymers, zeolites and metal-organic framework [722]. The average energy of the interaction between the hydrogen and the solid structure ranges between 4 and 8 kJ/mol at room temperature. However, the energy of the adsorption enthalpy has to be enhanced for a higher storage capacity since at higher temperatures the stored hydrogen is desorbed, and the cryogenic temperature is required for proper gas storage [723]. The satisfactory binding energy for room temperature storage ranges between 15 and 25 kJ/mol [724]. The storage capacity improvement is reached increasing the available adsorption surface adopting microporous materials for higher porosity or functionalizing the solid structure [725,726]. The structural functionalization is realized through the insertion of dopant materials (B, Ca, Co, Ni, Pd, Li) in the carbon structure. The hydrogen is adsorbed on the defect sites and diffuses into the structure, and the interaction strength is enhanced by the modification of the electronic structure [708,727].
Metal hydride is an efficient and safe way to store a large amount of hydrogen. The highest volumetric density reported is 150 kg/m3 in Mg2FeH6 and Al(BH4)3 [728]. Hydrogen injected in the lattice structure reacts with the metallic material forming hydrides (MH, MH2 or MH3) [729]. Material for hydrogen storage needs a high hydrogen capacity both gravimetric and volumetric, low dissociation temperature and pressure, low heat of formation, reversibility, low energy loss, high stability and fast charge/release rate. Among the suitable materials, light metals such as Li, Be, Na, Mg, B, Al and their complex alloys are referred as interesting for their low weight and high storage capacity [730]. Intermetallic compounds (AB2, A2B, AB, AB5) are also interesting because their properties can be tuned varying the concentration of the two elements [731]. The element A commonly is a rare earth or an alkaline earth metals and establishes a stable bond with hydrogen. The element B is normally a transition metal and establishes an unstable hydride [728]. Moreover, complex metal hydrides such as alanates, amides, imides and borohydrides are viable as solid storage materials for their low weight and high storage capacity [732].
The pressure–composition isotherms describe the thermodynamic behavior of the metal hydride formation (see Figure 26). During the charge phase, at low hydrogen content (low H/M ratio) only the metallic phase (α-phase) exists, and hydrogen is dissolved into the solid structure forming an interstitial solid solution (physisorption). The equilibrium pressure increases with the hydrogen concentration. At higher hydrogen content (H/M > 0.1) the maximum solubility of the gas in the metal is reached. A strong hydrogen-hydrogen interaction occurs (chemisorption), leading to the nucleation and growth of the hydride phase (β-phase). When the solid and the hydride phase coexist a plateau in the isotherm is observed. The length of the range in which the two phases coexist determines the amount of hydrogen that can be stored at the operating temperature. At high hydrogen concentration (H/M > 1) only the hydride phase exists, and hydrogen can be dissolved in the solid structure increasing the pressure. The hydrogen desorption is an endothermal reaction that occurs at higher temperatures. Thus, external heat is required [733,734].

5.5.4. Underground Gas Storage

The natural gas network is typically connected with underground storage facilities. Underground gas storage allows a large amount of natural gas to be stored, providing a solution for short- and long-term storage requirements. Generally, salt caverns, aquifers or depleted oil and gas fields are exploited [735]. A cushion gas that remains in the reservoir is needed as base gas to provide the operational capability, while the working gas is the gas that is injected and release during operating cycles [736].

Natural Gas

Salt caverns are deep caverns (300–2000 m of depth) with a volume capacity that ranges between 5000 and 1,000,000 m3, connected with the ground through a well that allows gas injection and withdrawal [737]. Salt caverns are characterized by low permeability that ensure the sealing of the storage, good mechanical properties that endure the pressure fluctuation safely, good solubility in water that enables the shape control of the cavern sides and abundant distribution of caverns with large storage capacity [738]. Drawbacks are the loss of volume and structural stability due to steady-state and transient creep provoked by constant fluid pressure or rapid pressure change, respectively [739].
The underground gas storage in aquifers is a porous gas reservoir in a low permeable rock filled with water (typically saline) and a caprock to prevent leakages [740]. The storage capacity is affected by the injection flow rate, pressure and salt precipitation. The storage volume increases with the increase in the injection pressure [741]. Further, the storage capacity is affected by the distribution of pore and throat in the reservoir and water lock [742]. Moreover, the salt precipitation in the porous medium reduces the injectivity and induces damage [743]. Finally, the retention time affects the storage process because the gas is trapped in water, and only a small fraction can be recovered [744].
Depleted gas or oil reservoirs are the most suitable way for underground storage due to the broad availability and assured geology [745]. The reservoirs are surrounded by porous solid with a caprock to avoid vertical leakage [746]. Natural gas is injected through wells into depleted gas reservoirs that are at a great depth. The injection requires the gas pressurization to force the gas to permeate in the porous and permeable reservoir. Moreover, after the compression, the gas is cooled [747]. The advantage of the use of depleted oil reservoirs is the existence of wells, gathering systems and pipeline connections [748]. The storage availability is verified case-by-case as a function of the geological and petrophysical characteristics [749]. Indeed, gas storage involves safety issues. The gas injection provokes intergranular stress due to cyclic compression and expansion of the ground, leading to rock fractures and microseismic activity due to reactivation of existing faults of the reservoir [750].

Hydrogen

Hydrogen injected in the natural gas blend will also reach underground gas storages used for seasonal gas storage (gas consumption is indeed higher during the heating season than during summer). Salt caverns are compatible with hydrogen storage, ensuring long-term stability and great tightness [751]. The storage in aquifers and depleted oil and gas reservoirs is also possible, but hazards are related to chemical reactions with minerals, residual oils and biological microorganisms (bacteria and archaea) [752,753]. In 2013, the energy company RAG (Rohöl-Aufsuchungs Aktiengesellschaft) and its project partners started the project Underground Sun Storage to verify the feasibility of gas storage with up to 10% of hydrogen content into underground storage facilities [754]. Results demonstrate that the hydrogen storage is possible, microbial processes can be handled and leakage out of the reservoir and alteration of rocks were not detected [755,756].

6. Discussion

Several routes for hydrogen generation via water splitting are available. Electrochemical processes include photoelectrochemical and electrolysis cells, whereas thermochemical processes involve thermolysis and thermochemical cycles. Table 3 outlines the technology readiness level, the energy conversion efficiency—defined as the ratio of the energy stored in the fuel (low heating value) and the primary energy required to produce the fuel—the fuel production cost and CO2 emissions of hydrogen and syngas generation routes.
The most mature way to produce hydrogen is the electrochemical conversion of renewable power through alkaline (TRL 7–9) and proton exchange membrane electrolyzers (TRL 4–8). Solid oxide electrolysis cells are at an earlier research stage and suffer for thermal cycles due to high operating temperatures. Therefore, SOECs are not well matched with solar or wind power supply that is intermittent and fluctuating. The energy to fuel conversion efficiency of thermochemical cycles (TRL 4–7) enhanced by concentrated solar power is comparable to that of electrolyzers coupled with wind turbines. However, the production cost of hydrogen through electrolysis cells is lower. Instead, thermolysis technologies, photoelectrochemical cells and microbial electrolysis cells were studied only at the laboratory scale (TRL 1–4). Thus, their efficiencies and production cost are not comparable with those of more mature technologies.
The first step of the synthetic natural gas catalytic routes provides syngas as an intermediate product. It is carried out with three main technologies: from biomass feedstock through gasification or from water and carbon dioxide resources via co-electrolysis or thermochemical cycles. The second step consists of the upgrading of the intermediate products by CO or CO2 methanation. The pyrolysis and gasification are well-developed processes (TRL 4–9), and also commercial plants were constructed. The conversion efficiency of biomass gasification is higher than that of processes derived from water and carbon dioxide feedstock (co-electrolysis and thermochemical cycles). Moreover, gasification is a more cost-effective way to generate syngas. However, the partial oxidation generates CO2 emissions that could be avoided by solar-driven gasification.
The hydrogen supply chain can follow different pathways such as the on-board storage in tanks for road mobility, the transport through dedicated pipelines, and the injection in existing pipelines blended with natural gas. Commonly hydrogen is fed in fuel cells for electric power or CHP conversion or employed in typical natural gas facilities (e.g., burners, industrial processes). Instead, synthetic natural gas can be stored on-board for vehicle application or injected in the natural gas grid and then burned or used in fuel cells.
The gas composition of synthetic fuels is a crucial issue for gas grid injection, storage and end uses. Thus, the transition from natural gas to hydrogen requires compatibility with high pressure and distribution networks and end-user appliances. Indeed, gas quality affects burner and gas turbine operations resulting in higher polluting emissions, flame instability and unsafe. Further, gas engines are subjected to high knocking propensity. Moreover, non-combustion applications are sensitive to the gas composition that can impact on process safety and efficiency.
Furthermore, the hydrogen injection in the natural gas grid is a crucial issue since it impacts the transport capacity and pipeline properties. Indeed, a higher amount of hydrogen is needed to satisfy the same energy requirement due to the low energy density, and the mechanical properties of steel pipelines are degraded by hydrogen embrittlement that promotes crack propagation.
Moreover, leakage and leakage detection are challenging issues in hydrogen transportation since the hydrogen quickly permeates seals and plastic pipes due to its small size, high diffusivity and low viscosity. The odorants and gas sensors commonly used for natural gas odorization and detection are not suitable for hydrogen sensing.
It has been established that an admixture of hydrogen and natural gas with a hydrogen concentration up to 10% by volume can generally be injected into the natural gas grid with no significant problems of safety and efficiency. However, the maximum hydrogen volumetric content tolerated in the natural gas transmission system is between 5% and 15% in the United States and between 0.1% and 12% in Europe. Therefore, more efforts are required to clearly understand the effects of hydrogen injection in the natural gas blend to establish a validated limit of hydrogen concentration to overcome the inhomogeneities of gas grid injection legislations.
PEM fuel cells suffer gas contaminants such as CO, H2S and ammonia that deteriorate the catalytic efficiency of electrodes and membranes. Instead, solid oxide fuel cells performances are affected by H2S and halogens poisoning, siloxane and carbon deposition and ash pore-blocking.
Finally, fuel storage provides a high energy density, large size, and long-term storage capacity. Liquefied gas storage requires high energy consumption, expensive cryogenic catalysts and well-insulated vessels. Albeit the volumetric density of compressed gas storage is lower than that obtained with liquefaction, also the energy consumption is reduced. The chemical absorption of hydrogen in solid materials is an intrinsically safe alternative. Indeed, thermal energy supply is necessary for the gas desorption since it involves endothermal processes. Instead, underground gas storage allows a large amount of natural gas to be stored, providing a solution for short- and long-term storage. However, the storage into underground porous rocks is not suitable for hydrogen due to its consumption by sulfur-reducing bacteria, whereas salt caverns are compatible with hydrogen.

7. Conclusions

This review provides an overall description of the renewable routes for the conversion of non-fossil feedstocks into gaseous fuels and their supply chains, analyzing not only the production systems but also the alternative pathways for distribution, storage and end uses of the synthetic gas.
Hydrogen and synthetic natural gas could play a crucial role in the decarbonization of energy systems. Power-to-gas facilities ensure flexibility to the electric grid that is influenced by the intermittency and fluctuation of renewable energy sources. Indeed, the long-term and high-capacity gas storage allows the shifting of electricity production to balance the surplus and shortage of the electric grid instantaneously.
The catalytic processes outlined are characterized by different technical, operational and economic features and represent alternative solutions. The gas supply chain also admits various pathways such as storage for vehicle fueling, transportation in pipelines, utilization in fuel cells and combustors or employment for non-combustion applications. These different applications enable the decarbonization of those sectors that are difficult to electrify, such as high-heat industrial processes and transport sectors.
However, more efforts are needed to improve the performance and cost-effectiveness of hydrogen generation devices and clearly understand the effects of hydrogen on the supply chain, since the gas composition of synthetic fuels is a crucial parameter for gas grid injection, storage and end uses.
Investigations on safety, material resistance, combustion efficiency and polluting emissions have led to establishing that an admixture of hydrogen and natural gas with a hydrogen concentration up to 10% by volume can be injected into the natural gas grid with no significant problems. However, a validated limit of hydrogen concentration is needed to overcome the inhomogeneities of gas grid injection legislations.

Author Contributions

Writing—Original Draft Preparation E.R.; Writing—Review & Editing E.R. and A.L.; Methodology and Visualization F.D.M.; Conceptualization and Supervision A.L. and P.L. All authors have read and agreed to the published version of the manuscript.

Funding

This research did not receive any specific grant from funding agencies in the public, commercial, or not-for-profit sectors.

Conflicts of Interest

The authors declare no conflict of interest.

References

  1. IEA. Global Energy & CO2 Status Report; IEA: Paris, France, 2019. [Google Scholar]
  2. International Energy Agency. Technology Roadmap—Hydrogen and Fuel Cells; International Energy Agency: Paris, France, 2015. [Google Scholar]
  3. Cochran, J.; Miller, M.; Zinaman, O.; Milligan, M.; Arent, D.; Palmintier, B.; Malley, M.O.; Mueller, S.; Lannoye, E.; Epri, A.T.; et al. Flexibility in 21st Century Power Systems; National Renewable Energy Lab: Golden, CO, USA, 2014.
  4. IEA. The Future of Hydrogen for G20; IEA: Paris, France, 2019. [Google Scholar]
  5. Teter, J.; Feuvre, P.L.; Gorner, M.; Scheffer, S. Tracking Transport. Available online: https://www.iea.org/reports/tracking-transport-2019 (accessed on 1 December 2019).
  6. IEA. Global Trends and Outlook for Hydrogen; IEA: Paris, France, 2017. [Google Scholar]
  7. Hannula, I.; Reiner, D.M. Near-term potential of biofuels, electrofuels, and battery electric vehicles in decarbonizing road transport. Joule 2019, 3, 2390–2402. [Google Scholar] [CrossRef]
  8. Council of the European Union, European Parliament. Directive 2003/30/EC of the European Parliament and of the Council of 8 May 2003 on the Promotion of the Use of Biofuels or Other Renewable Fuels for Transport; Publications Office of the European Union: Brusselsm, Belgium, 2003. [Google Scholar]
  9. European Parliament, Council of the European Union. Directive 2009/28/EC of the European Parliament and of the Council of 23 April 2009 on the Promotion of the Use of Energy from Renewable Sources and Amending and Subsequently Repealing Directives 2001/77/EC and 2003/30/EC2009; Publications Office of the European Union: Brusselsm, Belgium, 2009. [Google Scholar]
  10. Berndes, G.; Bird, N.; Cowie, A. Bioenergy, Land Use Change and Climate Change Mitigation—Background Technical Report; IEA: Paris, France, 2011. [Google Scholar]
  11. Delucchi, M.A.; Yang, C.; Burke, A.F.; Ogden, J.M.; Kurani, K.; Kessler, J.; Sperling, D. An assessment of electric vehicles: Technology, infrastructure requirements, greenhouse-gas emissions, petroleum use, material use, lifetime cost, consumer acceptance and policy initiatives. Philos. Trans. R. Soc. A Math. Phys. Eng. Sci. 2014, 372. [Google Scholar] [CrossRef] [PubMed] [Green Version]
  12. IRENA. Hydrogen: A Renewable Energy Perspective; IRENA: Abu Dhabi, UAE, 2019. [Google Scholar]
  13. Aarnes, J.; Eijgelaar, M.; Hektor, E. Hydrogen as an Energy Carrier; DNV GL: Oslo, Norway, 2018. [Google Scholar]
  14. Committee on Climate Change. Hydrogen in a Low-Carbon Economy; Committee on Climate Change: London, UK, 2018. [Google Scholar]
  15. Damen, K.; Van Troost, M.; Faaij, A.; Turkenburg, W. A comparison of electricity and hydrogen production systems with CO2 capture and storage. Part A: Review and selection of promising conversion and capture technologies. Prog. Energy Combust. Sci. 2006, 32, 215–246. [Google Scholar] [CrossRef] [Green Version]
  16. Hydrogen Council. Hydrogen Scaling Up; Hydrogen Council: Brussels, Belgium, 2017. [Google Scholar]
  17. Dincer, I.; Acar, C. Review and evaluation of hydrogen production methods for better sustainability. Int. J. Hydrog. Energy 2014, 40, 11094–11111. [Google Scholar] [CrossRef]
  18. Holladay, J.D.; Hu, J.; King, D.L.; Wang, Y. An overview of hydrogen production technologies. Catal. Today 2009, 139, 244–260. [Google Scholar] [CrossRef]
  19. Hosseini, S.E.; Wahid, M.A. Hydrogen production from renewable and sustainable energy resources: Promising green energy carrier for clean development. Renew. Sustain. Energy Rev. 2016, 57, 850–866. [Google Scholar] [CrossRef]
  20. Peña, M.A.; Gómez, J.P.; Fierro, J.L.G. New catalytic routes for syngas and hydrogen production. Appl. Catal. A Gen. 1996, 144, 7–57. [Google Scholar] [CrossRef]
  21. Levalley, T.L.; Richard, A.R.; Fan, M. The progress in water gas shift and steam reforming hydrogen production technologies—A review. Int. J. Hydrog. Energy 2014, 39, 16983–17000. [Google Scholar] [CrossRef]
  22. Gradisher, L.; Dutcher, B.; Fan, M. Catalytic hydrogen production from fossil fuels via the water gas shift reaction. Appl. Energy 2015, 139, 335–349. [Google Scholar] [CrossRef]
  23. Muradov, N. Low to near-zero CO2 production of hydrogen from fossil fuels: Status and perspectives. Int. J. Hydrog. Energy 2017, 42, 14058–14088. [Google Scholar] [CrossRef]
  24. Voldsund, M.; Jordal, K.; Anantharaman, R. Hydrogen production with CO2 capture. Int. J. Hydrog. Energy 2016, 41, 4969–4992. [Google Scholar] [CrossRef]
  25. Uçkun Kiran, E.; Trzcinski, A.P.; Ng, W.J.; Liu, Y. Bioconversion of food waste to energy: A review. Fuel 2014, 134, 389–399. [Google Scholar] [CrossRef]
  26. Nath, K.; Das, D. Biohydrogen production as a potential energy resource—Present state-of-art. J. Sci. Ind. Res. 2004, 63, 729–738. [Google Scholar]
  27. Hallenbeck, P.C.; Benemann, J.R. Biological hydrogen production; fundamentals and limiting processes. Int. J. Hydrog. Energy 2002, 27, 1185–1193. [Google Scholar] [CrossRef]
  28. Das, D.; Veziroǧlu, T.N. Hydrogen production by biological processes: A survey of literature. Int. J. Hydrog. Energy 2001, 26, 13–28. [Google Scholar] [CrossRef]
  29. Kumar Gupta, S.; Kumari, S.; Reddy, K.; Bux, F. Trends in biohydrogen production: Major challenges and state-of-the-art developments. Environ. Technol. 2013, 34, 1653–1670. [Google Scholar] [CrossRef] [PubMed]
  30. Liu, Y.; Lin, R.; Man, Y.; Ren, J. Recent developments of hydrogen production from sewage sludge by biological and thermochemical process. Int. J. Hydrog. Energy 2019, 44, 19676–19697. [Google Scholar] [CrossRef]
  31. Xia, A.; Cheng, J.; Song, W.; Su, H.; Ding, L.; Lin, R.; Lu, H.; Liu, J.; Zhou, J.; Cen, K. Fermentative hydrogen production using algal biomass as feedstock. Renew. Sustain. Energy Rev. 2015, 51, 209–230. [Google Scholar] [CrossRef]
  32. Wang, H.; Xu, J.; Sheng, L.; Liu, X.; Lu, Y.; Li, W. A review on bio-hydrogen production technology. Int. J. Energy Res. 2018, 42, 3442–3453. [Google Scholar] [CrossRef]
  33. Sun, Y.; He, J.; Yang, G.; Sun, G.; Sage, V. A review of the enhancement of bio-hydrogen generation by chemicals addition. Catalysts 2019, 9, 353. [Google Scholar] [CrossRef] [Green Version]
  34. Nikolaidis, P.; Poullikkas, A. A comparative overview of hydrogen production processes. Renew. Sustain. Energy Rev. 2017, 67, 597–611. [Google Scholar] [CrossRef]
  35. Christopher, K.; Dimitrios, R. A review on exergy comparison of hydrogen production methods from renewable energy sources. Energy Environ. Sci. 2012, 5, 6640–6651. [Google Scholar] [CrossRef]
  36. Koumi Ngoh, S.; Njomo, D. An overview of hydrogen gas production from solar energy. Renew. Sustain. Energy Rev. 2012, 16, 6782–6792. [Google Scholar] [CrossRef]
  37. Bičáková, O.; Straka, P. Production of hydrogen from renewable resources and its effectiveness. Int. J. Hydrog. Energy 2012, 37, 11563–11578. [Google Scholar] [CrossRef]
  38. Chaubey, R.; Sahu, S.; James, O.O.; Maity, S. A review on development of industrial processes and emerging techniques for production of hydrogen from renewable and sustainable sources. Renew. Sustain. Energy Rev. 2013, 23, 443–462. [Google Scholar] [CrossRef]
  39. Orhan, M.F.; Babu, B.S. Investigation of an integrated hydrogen production system based on nuclear and renewable energy sources: Comparative evaluation of hydrogen production options with a regenerative fuel cell system. Energy 2015, 88, 801–820. [Google Scholar] [CrossRef]
  40. Dutta, S. A review on production, storage of hydrogen and its utilization as an energy resource. J. Ind. Eng. Chem. 2014, 20, 1148–1156. [Google Scholar] [CrossRef]
  41. Bolat, P.; Thiel, C. Hydrogen supply chain architecture for bottom-up energy systems models. Part 1: Developing pathways. Int. J. Hydrog. Energy 2014, 39, 8881–8897. [Google Scholar] [CrossRef]
  42. Li, L.; Manier, H.; Manier, M.A. Hydrogen supply chain network design: An optimization-oriented review. Renew. Sustain. Energy Rev. 2019, 103, 342–360. [Google Scholar] [CrossRef]
  43. Balcombe, P.; Speirs, J.; Johnson, E.; Martin, J.; Brandon, N.; Hawkes, A. The carbon credentials of hydrogen gas networks and supply chains. Renew. Sustain. Energy Rev. 2018, 91, 1077–1088. [Google Scholar] [CrossRef]
  44. Sikarwar, V.S.; Zhao, M.; Fennell, P.S.; Shah, N.; Anthony, E.J. Progress in biofuel production from gasification. Prog. Energy Combust. Sci. 2017, 61, 189–248. [Google Scholar] [CrossRef]
  45. Göransson, K.; Söderlind, U.; He, J.; Zhang, W. Review of syngas production via biomass DFBGs. Renew. Sustain. Energy Rev. 2011, 15, 482–492. [Google Scholar] [CrossRef]
  46. Molino, A.; Chianese, S.; Musmarra, D. Biomass gasification technology: The state of the art overview. J. Energy Chem. 2016, 25, 10–25. [Google Scholar] [CrossRef]
  47. Babu, B.V. Biomass pyrolysis: A state-of-the-art review. Biofuels Bioprod. Biorefin. 2012, 6, 246–256. [Google Scholar] [CrossRef]
  48. Sikarwar, V.S.; Zhao, M.; Clough, P.; Yao, J.; Zhong, X.; Memon, M.Z.; Shah, N.; Anthony, E.J.; Fennell, P.S. An overview of advances in biomass gasification. Energy Environ. Sci. 2016, 9, 2939–2977. [Google Scholar] [CrossRef] [Green Version]
  49. Farzad, S.; Mandegari, M.A.; Görgens, J.F. A critical review on biomass gasification, co-gasification, and their environmental assessments. Biofuel Res. J. 2016, 3, 483–495. [Google Scholar] [CrossRef]
  50. Ren, J.; Cao, J.P.; Zhao, X.Y.; Yang, F.L.; Wei, X.Y. Recent advances in syngas production from biomass catalytic gasification: A critical review on reactors, catalysts, catalytic mechanisms and mathematical models. Renew. Sustain. Energy Rev. 2019, 116, 109426. [Google Scholar] [CrossRef]
  51. Mao, C.; Feng, Y.; Wang, X.; Ren, G. Review on research achievements of biogas from anaerobic digestion. Renew. Sustain. Energy Rev. 2015, 45, 540–555. [Google Scholar] [CrossRef]
  52. Sugumar, S.; Shanmuga Priyan, R.; Dinesh, S. A review on performance study of anaerobic digestion to enhance the biogas production. Int. J. Civ. Eng. Technol. 2016, 7, 202–206. [Google Scholar]
  53. Yang, Q.; Wu, B.; Yao, F.; He, L.; Chen, F.; Ma, Y.; Shu, X.; Hou, K.; Wang, D.; Li, X. Biogas production from anaerobic co-digestion of waste activated sludge: Co-substrates and influencing parameters. Rev. Environ. Sci. Biotechnol. 2019, 18, 771–793. [Google Scholar] [CrossRef]
  54. Kainthola, J.; Kalamdhad, A.S.; Goud, V.V. A review on enhanced biogas production from anaerobic digestion of lignocellulosic biomass by different enhancement techniques. Process Biochem. 2019, 84, 81–90. [Google Scholar] [CrossRef]
  55. Hagos, K.; Zong, J.; Li, D.; Liu, C.; Lu, X. Anaerobic co-digestion process for biogas production: Progress, challenges and perspectives. Renew. Sustain. Energy Rev. 2017, 76, 1485–1496. [Google Scholar] [CrossRef]
  56. Lora Grando, R.; de Souza Antune, A.M.; da Fonseca, F.V.; Sánchez, A.; Barrena, R.; Font, X. Technology overview of biogas production in anaerobic digestion plants: A European evaluation of research and development. Renew. Sustain. Energy Rev. 2017, 80, 44–53. [Google Scholar] [CrossRef] [Green Version]
  57. Deepanraj, B.; Sivasubramanian, V.; Jayaraj, S. Biogas generation through anaerobic digestion process-an overview. Res. J. Chem. Environ. 2014, 18, 80–94. [Google Scholar]
  58. Jankowska, E.; Sahu, A.K.; Oleskowicz-Popiel, P. Biogas from microalgae: Review on microalgae’s cultivation, harvesting and pretreatment for anaerobic digestion. Renew. Sustain. Energy Rev. 2017, 75, 692–709. [Google Scholar] [CrossRef]
  59. Leonzio, G. State of art and perspectives about the production of methanol, dimethyl ether and syngas by carbon dioxide hydrogenation. J. CO2 Util. 2018, 27, 326–354. [Google Scholar] [CrossRef]
  60. Agrafiotis, C.; Roeb, M.; Sattler, C. A review on solar thermal syngas production via redox pair-based water/carbon dioxide splitting thermochemical cycles. Renew. Sustain. Energy Rev. 2015, 42, 254–285. [Google Scholar] [CrossRef]
  61. Loutzenhiser, P.G.; Meier, A.; Steinfeld, A. Review of the Two-Step H2O/CO2-Splitting solar thermochemical cycle based on Zn/ZnO redox reactions. Materials 2010, 3, 4922–4938. [Google Scholar] [CrossRef] [Green Version]
  62. Foit, S.R.; Vinke, I.C.; de Haart, L.G.J.; Eichel, R.A. Power-to-syngas: An enabling technology for the transition of the energy system? Angew. Chem Int. Ed. 2017, 56, 5402–5411. [Google Scholar] [CrossRef]
  63. Ghaib, K.; Ben-Fares, F.Z. Power-to-methane: A state-of-the-art review. Renew. Sustain. Energy Rev. 2018, 81, 433–446. [Google Scholar] [CrossRef]
  64. Thema, M.; Bauer, F.; Sterner, M. Power-to-gas: Electrolysis and methanation status review. Renew. Sustain. Energy Rev. 2019, 112, 775–787. [Google Scholar] [CrossRef]
  65. Lecker, B.; Illi, L.; Lemmer, A.; Oechsner, H. Biological hydrogen methanation—A review. Bioresour. Technol. 2017, 245, 1220–1228. [Google Scholar] [CrossRef] [PubMed]
  66. Miao, B.; Ma, S.S.K.; Wang, X.; Su, H.; Chan, S.H. Catalysis mechanisms of CO2 and CO methanation. Catal. Sci. Technol. 2016, 6, 4048–4058. [Google Scholar] [CrossRef]
  67. Villafán-Vidales, H.I.; Arancibia-Bulnes, C.A.; Riveros-Rosas, D.; Romero-Paredes, H.; Estrada, C.A. An overview of the solar thermochemical processes for hydrogen and syngas production: Reactors, and facilities. Renew. Sustain. Energy Rev. 2017, 75, 894–908. [Google Scholar] [CrossRef]
  68. Steinfeld, A. Solar thermochemical production of hydrogen-a review. Sol. Energy 2005, 78, 603–615. [Google Scholar] [CrossRef]
  69. Ihara, S. Feasibility of hydrogen production by direct water splitting at high temperature. Int. J. Hydrog. Energy 1978, 3, 287–296. [Google Scholar] [CrossRef]
  70. Kogan, A. Direct solar thermcal on-site separation of the products-II. Experimental feasibility study. Int. J. Hydrog. Energy 1998, 23, 89–98. [Google Scholar] [CrossRef]
  71. Baykara, S.Z. Hydrogen production by direct solar thermal decomposition of water, possibilities for improvement of process efficiency. Int. J. Hydrog. Energy 2004, 29, 1451–1458. [Google Scholar] [CrossRef]
  72. Etiévant, C. Solar high-temperature direct water splitting—A review of experiments in France. Sol. Energy Mater. 1991, 24, 413–440. [Google Scholar] [CrossRef]
  73. Adhikari, S.; Fernando, S. Hydrogen membrane separation techniques. Ind. Eng. Chem. Res. 2006, 45, 875–881. [Google Scholar] [CrossRef]
  74. Grosjean, R.; Delacroix, S.; Gouget, G.; Beaunier, P.; Ersen, O.; Ihiawakrim, D.; Kurakevych, O.; Portehault, D. High pressures pathway toward boron-based nanostructured solids. Dalton Trans. 2017, 47, 7634–7639. [Google Scholar] [CrossRef] [PubMed]
  75. Edlund, D.; Friesen, D.; Johnson, B.; Pledger, W. Hydrogen-permeable metal membranes for high-temperature gas separations. Gas Sep. Purif. 1994, 8, 131–136. [Google Scholar] [CrossRef]
  76. Calise, F.; D’Accadia, M.D.; Santarelli, M.; Lanzini, A.; Ferrero, D. Solar Hydrogen Production: Processes, Systems and Technologies; Elsevier Science: Amsterdam, The Netherlands, 2019. [Google Scholar]
  77. July, D. Direct-Thermal Solar Hydrogen Production from Water Using Nozzles/Skimmers and Glow Discharge in the Gas Phase at Low Pressure and High Temperature; H-Ion Solar Company: Richmond, CA, USA, 1994. [Google Scholar]
  78. Warner, J.W.; Stephen Berry, R. Injection quenching and the high temperature water-splitting reactor. Sol. Energy 1985, 35, 535–537. [Google Scholar] [CrossRef]
  79. Lapicque, F.; Lédé, J.; Villermaux, J. Design and optimization of a reactor for high temperature dissociation of water and carbon dioxide using solar energy. Chem. Eng. Sci. 1986, 41, 677–684. [Google Scholar] [CrossRef]
  80. Rao, C.N.R.; Dey, S. Solar thermochemical splitting of water to generate hydrogen. Proc. Natl. Acad. Sci. USA 2017, 114, 13385–13393. [Google Scholar] [CrossRef] [Green Version]
  81. Kodama, T.; Gokon, N. Thermochemical cycles for high-temperature solar hydrogen production. Chem. Rev. 2007, 107, 4048–4077. [Google Scholar] [CrossRef]
  82. D’Souza, L. Thermochemical hydrogen production from water using reducible oxide materials: A critical review. Mater. Renew. Sustain. Energy 2013, 2, 7. [Google Scholar] [CrossRef] [Green Version]
  83. Bin, Z. CO2 valorisation based on Fe3O4/FeO thermochemical redox reactions using concentrated solar energy. Int. J. Energy Res. 2009, 31, 135–147. [Google Scholar]
  84. Chen, K.S.; Hogan, R.E. A two-phase model for solar thermochemical water splitting with FeO/Fe3O4. In Proceedings of the 3rd International Conference of Energy Sustainability, San Francisco, CA, USA, 19–23 July 2009; pp. 1–8. [Google Scholar]
  85. Steinfeld, A.; Sanders, S.; Palumbo, R. Design aspects of solar thermochemical engeneering-A case study: Two-step water-splitting cycle using the Fe3O4/FeO redox system. Sol. Energy 1999, 65, 43–53. [Google Scholar] [CrossRef]
  86. Stamatiou, A.; Loutzenhiser, P.G.; Steinfeld, A. Solar syngas production via H2O/CO2-splitting thermochemical cycles with Zn/ZnO and FeO/Fe3O4 redox reactions. Chem. Mater. 2010, 22, 851–859. [Google Scholar] [CrossRef]
  87. Steinfeld, A.; Palumbo, R. Solar thermochemical process technology. Encycl. Phys. Sci. Technol. 2003, 15, 237–256. [Google Scholar]
  88. Alonso, E.; Hutter, C.; Romero, M.; Steinfeld, A.; Gonzalez-Aguilar, J. Kinetics of Mn2O3-Mn3O4 and Mn3O4-MnO redox reactions performed under concentrated thermal radiative flux. Energy Fuels 2013, 27, 4884–4890. [Google Scholar] [CrossRef]
  89. Alonso, E.; Gallo, A.; Pérez-Rábago, C.; Fuentealba, E. Thermodynamic study of CuO/Cu2O and Co3O4/CoO redox pairs for solar energy thermochemical storage. In Proceedings of the AIP Conference Proceedings, Penang, Malaysia, 10–12 April 2018. [Google Scholar]
  90. Abanades, S.; Charvin, P.; Flamant, G.; Neveu, P. Screening of water-splitting thermochemical cycles potentially attractive for hydrogen production by concentrated solar energy. Energy 2006, 31, 2805–2822. [Google Scholar] [CrossRef]
  91. Wegner, K.; Ly, H.C.; Weiss, R.J.; Pratsinis, S.E.; Steinfeld, A. In situ formation and hydrolysis of Zn nanoparticles for H2 production by the 2-step ZnO/Zn water-splitting thermochemical cycle. Int. J. Hydrog. Energy 2006, 31, 55–61. [Google Scholar] [CrossRef]
  92. Steinfeld, A. Solar hydrogen production via a two-step water-splitting thermochemical cycle based on Zn/ZnO redox reactions. Int. J. Hydrog. Energy 2002, 27, 611–619. [Google Scholar] [CrossRef]
  93. Abanades, S.; Charvin, P.; Lemont, F.; Flamant, G. Novel two-step SnO2/SnO water-splitting cycle for solar thermochemical production of hydrogen. Int. J. Hydrog. Energy 2008, 33, 6021–6030. [Google Scholar] [CrossRef]
  94. Abanades, S. CO2 and H2O reduction by solar thermochemical looping using SnO2/SnO redox reactions: Thermogravimetric analysis. Int. J. Hydrog. Energy 2012, 37, 8223–8231. [Google Scholar] [CrossRef]
  95. Bhosale, R.R.; Kumar, A.; Sutar, P. Thermodynamic analysis of solar driven SnO2/SnO based thermochemical water splitting cycle. Energy Convers. Manag. 2017, 135, 226–235. [Google Scholar] [CrossRef]
  96. Furler, P.; Scheffe, J.R.; Steinfeld, A. Syngas production by simultaneous splitting of H2O and CO2 via ceria redox reactions in a high-temperature solar reactor. Energy Environ. Sci. 2012, 5, 6098–6103. [Google Scholar] [CrossRef]
  97. Portarapillo, M.; Aronne, A.; Benedetto, A.D.; Imparato, C.; Landi, G.; Luciani, G. Syngas production through H2O/CO2 thermochemical splitting. Chem. Eng. Trans. 2019, 74, 43–48. [Google Scholar]
  98. Bowman, G. Interfacing Primary Heat Sources and Cycles for Thermochemical Hydrogen Production. In Hydrogen Energy Progress, Proceedings of the 3rd World Hydrogen Energy Conference, Tokyo, Japan, 23–26 June 1980; Pergamon Press: Oxford, UK; New York, NY, USA, 1981; Volume 1, pp. 335–344. [Google Scholar]
  99. Whaley, T.; Yudow, B.; Remick, R.; Pangborn, J.; Sammells, A. Status of the cadmium thermoelectrochemical hydrogen cycle. Int. J. Hydrog. Energy 1983, 8, 767–771. [Google Scholar] [CrossRef]
  100. Milshtein, J.D.; Gratz, E.; Basu, S.N.; Gopalan, S.; Pal, U.B. Study of the two-step W/WO3 solar to fuel conversion cycle for syngas production. J. Power Sources 2013, 236, 95–102. [Google Scholar] [CrossRef]
  101. Nakamura, T. Hydrogen production from water utilizing solar heat at high temperatures. Sol. Energy 1977, 19, 467–475. [Google Scholar] [CrossRef]
  102. Miller, J.E.; McDaniel, A.H.; Allendorf, M.D. Considerations in the design of materials for solar-driven fuel production using metal-oxide thermochemical cycles. Adv. Energy Mater. 2014, 4, 1–19. [Google Scholar] [CrossRef]
  103. Block, T.; Knoblauch, N.; Schmücker, M. The cobalt-oxide/iron-oxide binary system for use as high temperature thermochemical energy storage material. Thermochim. Acta 2014, 577, 25–32. [Google Scholar] [CrossRef]
  104. Gokon, N.; Mizuno, T.; Nakamuro, Y.; Kodama, T. Iron-containing yttria-stabilized zirconia system for two-step thermochemical water splitting. J. Sol. Energy Eng. Trans. ASME 2008, 130, 0110181–0110186. [Google Scholar] [CrossRef]
  105. Bhosale, R.R.; Kumar, A.; AlMomani, F.; Ghosh, U.; Sutar, P.; Takalkar, G.; Ashok, A.; Alxneit, I. Effectiveness of Ni incorporation in iron oxide crystal structure towards thermochemical CO2 splitting reaction. Ceram. Int. 2017, 43, 5150–5155. [Google Scholar] [CrossRef]
  106. Carrillo, A.J.; Serrano, D.P.; Pizarro, P.; Coronado, J.M. Understanding redox kinetics of iron-doped manganese oxides for high temperature thermochemical energy storage. J. Phys. Chem. C 2016, 120, 27800–27812. [Google Scholar] [CrossRef]
  107. Miller, J.E.; Allendorf, M.D.; Diver, R.B.; Evans, L.R.; Siegel, N.P.; Stuecker, J.N. Metal oxide composites and structures for ultra-high temperature solar thermochemical cycles. J. Mater. Sci. 2008, 43, 4714–4728. [Google Scholar] [CrossRef]
  108. Lorentzou, S.; Pagkoura, C.; Zygogianni, A.; Karagiannakis, G.; Konstandopoulos, A.G. Thermochemical cycles over redox structured reactors. Int. J. Hydrog. Energy 2017, 42, 19664–19682. [Google Scholar] [CrossRef] [Green Version]
  109. Le Gal, A.; Abanades, S.; Bion, N.; Le Mercier, T.; Harlé, V. Reactivity of doped ceria-based mixed oxides for solar thermochemical hydrogen generation via two-step water-splitting cycles. Energy Fuels 2013, 27, 6068–6078. [Google Scholar] [CrossRef]
  110. Le Gal, A.; Abanades, S. Dopant incorporation in ceria for enhanced water-splitting activity during solar thermochemical hydrogen generation. J. Phys. Chem. C 2012, 116, 13516–13523. [Google Scholar] [CrossRef]
  111. Haeussler, A.; Abanades, S.; Jouannaux, J.; Drobek, M.; Ayral, A.; Julbe, A. Recent progress on ceria doping and shaping strategies for solar thermochemical water and CO2 splitting cycles. Aims Mater. Sci. 2019, 6, 657–684. [Google Scholar] [CrossRef]
  112. Muhich, C.; Steinfeld, A. Principles of doping ceria for the solar thermochemical redox splitting of H2O and CO2. J. Mater. Chem. A 2017, 5, 15578–15590. [Google Scholar] [CrossRef] [Green Version]
  113. Muhich, C.L.; Blaser, S.; Hoes, M.C.; Steinfeld, A. Comparing the solar-to-fuel energy conversion efficiency of ceria and perovskite based thermochemical redox cycles for splitting H2O and CO2. Int. J. Hydrog. Energy 2018, 43, 18814–18831. [Google Scholar] [CrossRef]
  114. Lapp, J.; Davidson, J.H.; Lipiński, W. Efficiency of two-step solar thermochemical non-stoichiometric redox cycles withheat recovery. Energy 2012, 37, 591–600. [Google Scholar] [CrossRef]
  115. Perkins, C.; Weimer, A.W. Likely near-term solar-thermal water splitting technologies. Int. J. Hydrog. Energy 2004, 29, 1587–1599. [Google Scholar] [CrossRef]
  116. Charvin, P.; Stéphane, A.; Florent, L.; Gilles, F. Analysis of solar chemical processes for hydrogen production from water splitting thermochemical cycles. Energy Convers. Manag. 2008, 49, 1547–1556. [Google Scholar] [CrossRef]
  117. Palumbo, R.; Lédé, J.; Boutin, O.; Ricart, E.E.; Steinfeld, A.; Möller, S.; Weidenkaff, A.; Fletcher, E.A.; Bielicki, J. The production of Zn from ZnO in a high-temperature solar decomposition quench process—I. The scientific framework for the process. Chem. Eng. Sci. 1998, 53, 2503–2517. [Google Scholar] [CrossRef]
  118. Charvin, P.; Abanades, S.; Beche, E.; Lemont, F.; Flamant, G. Hydrogen production from mixed cerium oxides via three-step water-splitting cycles. Solid State Ion. 2009, 180, 1003–1010. [Google Scholar] [CrossRef]
  119. Liberatore, R.; Lanchi, M.; Giaconia, A.; Tarquini, P. Energy and economic assessment of an industrial plant for the hydrogen production by water-splitting through the sulfur-iodine thermochemical cycle powered by concentrated solar energy. Int. J. Hydrog. Energy 2012, 37, 9550–9565. [Google Scholar] [CrossRef]
  120. Caple, K.; Kreider, P.; Auyeung, N.; Yokochi, A. Experimental modeling of hydrogen producing steps in a novel sulfur-sulfur thermochemical water splitting cycle. Int. J. Hydrog. Energy 2015, 40, 2484–2492. [Google Scholar] [CrossRef]
  121. Yilmaz, F.; Selbaş, R. Thermodynamic performance assessment of solar based sulfur-iodine thermochemical cycle for hydrogen generation. Energy 2017, 140, 520–529. [Google Scholar] [CrossRef]
  122. Naterer, G.F.; Suppiah, S.; Stolberg, L.; Lewis, M.; Wang, Z.; Daggupati, V.; Gabriel, K.; Dincer, I.; Rosen, M.A.; Spekkens, P.; et al. Canada’s program on nuclear hydrogen production and the thermochemical Cu-Cl cycle. Int. J. Hydrog. Energy 2010, 35, 10905–10926. [Google Scholar] [CrossRef]
  123. Wang, Z.L.; Naterer, G.F.; Gabriel, K.S.; Gravelsins, R.; Daggupati, V.N. Comparison of sulfur-iodine and copper-chlorine thermochemical hydrogen production cycles. Int. J. Hydrog. Energy 2010, 35, 4820–4830. [Google Scholar] [CrossRef]
  124. Wang, Z.; Naterer, G.F.; Gabriel, K.S.; Secnik, E.; Gravelsins, R.; Daggupati, V. Thermal design of a solar hydrogen plant with a copper-chlorine cycle and molten salt energy storage. Int. J. Hydrog. Energy 2011, 36, 11258–11272. [Google Scholar] [CrossRef]
  125. Naterer, G.F.; Gabriel, K.; Wang, Z.L.; Daggupati, V.N.; Gravelsins, R. Thermochemical hydrogen production with a copper-chlorine cycle. I: Oxygen release from copper oxychloride decomposition. Int. J. Hydrog. Energy 2008, 33, 5439–5450. [Google Scholar] [CrossRef]
  126. Balta, M.T.; Dincer, I.; Hepbasli, A. Energy and exergy analyses of a new four-step copper-chlorine cycle for geothermal-based hydrogen production. Energy 2010, 35, 3263–3272. [Google Scholar] [CrossRef]
  127. Simpson, M.F.; Herrmann, S.D.; Boyle, B.D. A hybrid thermochemical electrolytic process for hydrogen production based on the reverse deacon reaction. In Proceedings of the 2004 AIChE Spring National Meeting, New Orleans, LA, USA, 25–29 April 2004; Volume 31, pp. 2700–2704. [Google Scholar]
  128. Ozcan, H.; Dincer, I. Performance investigation of magnesium-chloride hybrid thermochemical cycle for hydrogen production. Int. J. Hydrog. Energy 2014, 39, 76–85. [Google Scholar] [CrossRef]
  129. Ozcan, H.; Dincer, I. Energy and exergy analyses of a solar driven Mg-Cl hybrid thermochemical cycle for co-production of power and hydrogen. Int. J. Hydrog. Energy 2014, 39, 15330–15341. [Google Scholar] [CrossRef]
  130. Balta, M.T.; Dincer, I.; Hepbasli, A. Energy and exergy analyses of magnesium-chlorine (Mg-Cl) thermochemical cycle. Int. J. Hydrog. Energy 2012, 37, 4855–4862. [Google Scholar] [CrossRef]
  131. Tamaura, Y.; Steinfeld, A.; Kuhn, P.; Ehrensberger, K. Production of solar hydrogen by a novel, 2-step, water-splitting thermochemical cycle. Energy 1995, 20, 325–330. [Google Scholar] [CrossRef]
  132. Gokon, N.; Takahashi, S.; Yamamoto, H.; Kodama, T. Thermochemical two-step water-splitting reactor with internally circulating fluidized bed for thermal reduction of ferrite particles. Int. J. Hydrog. Energy 2008, 33, 2189–2199. [Google Scholar] [CrossRef]
  133. Agrafiotis, C.; Roeb, M.; Konstandopoulos, A.G.; Nalbandian, L.; Zaspalis, V.T.; Sattler, C.; Stobbe, P.; Steele, A.M. Solar water splitting for hydrogen production with monolithic reactors. Sol. Energy 2005, 79, 409–421. [Google Scholar] [CrossRef]
  134. Dahl, J.K.; Buechler, K.J.; Weimer, A.W.; Lewandowski, A.; Bingham, C. Solar-thermal dissociation of methane in a fluid-wall aerosol flow reactor. Int. J. Hydrog. Energy 2004, 29, 725–736. [Google Scholar] [CrossRef]
  135. Wyss, J.; Martinek, J.; Kerins, M.; Dahl, J.K.; Weimer, A.; Lewandowski, A.; Bingham, C. Rapid solar-thermal decarbonization of methane in a fluid-wall aerosol flow reactor—Fundamentals and application. Int. J. Chem. React. Eng. 2007, 5. [Google Scholar] [CrossRef]
  136. Tapia, E.; González-Pardo, A.; Iranzo, A.; Romero, M.; González-Aguilar, J.; Vidal, A.; Martín-Betancourt, M.; Rosa, F. Multi-tubular reactor for hydrogen production: CFD thermal design and experimental testing. Processes 2019, 7, 31. [Google Scholar] [CrossRef] [Green Version]
  137. Furler, P.; Steinfeld, A. Heat transfer and fluid flow analysis of a 4kW solar thermochemical reactor for ceria redox cycling. Chem. Eng. Sci. 2015, 137, 373–383. [Google Scholar] [CrossRef] [Green Version]
  138. Kaneko, H.; Miura, T.; Fuse, A.; Ishihara, H.; Taku, S.; Fukuzumi, H.; Naganuma, Y.; Tamaura, Y. Rotary-type solar reactor for solar hydrogen production with two-step water splitting process. Energy Fuels 2007, 21, 2287–2293. [Google Scholar] [CrossRef]
  139. Schunk, L.O.; Haeberling, P.; Wept, S.; Wuillemin, D.; Meier, A.; Steinfeld, A. A receiver-reactor for the solar thermal dissociation of zinc oxide. J. Sol. Energy Eng. Trans. ASME 2008, 130, 1–6. [Google Scholar] [CrossRef]
  140. Diver, R.B.; Miller, J.E.; Allendorf, M.D.; Siegel, N.P.; Hogan, R.E. Solar thermochemical water-splitting ferrite-cycle heat engines. J. Sol. Energy Eng. Trans. ASME 2008, 130, 041001. [Google Scholar] [CrossRef] [Green Version]
  141. Nalbandian, L.; Evdou, A.; Zaspalis, V. La1-xSrxMO3 (M=Mn, Fe) perovskites as materials for thermochemical hydrogen production in conventional and membrane reactors. Int. J. Hydrog. Energy 2009, 34, 7162–7172. [Google Scholar] [CrossRef]
  142. Kaneko, H.; Lee, C.; Ishikawa, Y.; Hosogoe, K.; Tamaura, Y. Solar H2 production with Tokyo Tech rotary-type solar reactor to be tested using solar concentration system at CSIRO in Australia. In Proceedings of the 3rd International Conference of Energy Sustainability, San Francisco, CA, USA, 19–23 July 2009; pp. 1–6. [Google Scholar]
  143. Gonzalez-Pardo, A.; Denk, T.; Vidal, A. Thermal tests of a multi-tubular reactor for hydrogen production by using mixed ferrites thermochemical cycle. In Proceedings of the AIP Conference Proceedings, Penang, Malaysia, 10–12 April 2018; pp. 1–8. [Google Scholar]
  144. Villasmil, W.; Brkic, M.; Wuillemin, D.; Meier, A.; Steinfeld, A. Pilot scale demonstration of a 100-kWth solar thermochemical plant for the thermal dissociation of ZnO. J. Sol. Energy Eng. Trans. ASME 2014, 136, 1–11. [Google Scholar] [CrossRef]
  145. Koepf, E.; Villasmil, W.; Meier, A. Pilot-scale solar reactor operation and characterization for fuel production via the Zn/ZnO thermochemical cycle. Appl. Energy 2016, 165, 1004–1023. [Google Scholar] [CrossRef]
  146. Roeb, M.; Monnerie, N.; Schmitz, M.; Sattler, C.; Konstandopoulos, A.G.; Agrafiotis, C.; Zaspalis, V.T. Thermo-chemical production of hydrogen from water by metal oxides fixed on ceramic substrates. In Proceedings of the World Hydrogen Energy Conference, Lyon, France, 13–16 June 2006; pp. 1–12. [Google Scholar]
  147. Roeb, M.; Säck, J.P.; Rietbrock, P.; Prahl, C.; Schreiber, H.; Neises, M.; de Oliveira, L.; Graf, D.; Ebert, M.; Reinalter, W.; et al. Test operation of a 100 kW pilot plant for solar hydrogen production from water on a solar tower. Sol. Energy 2011, 85, 634–644. [Google Scholar] [CrossRef]
  148. Säck, J.; Breuer, S.; Cotelli, P.; Houaijia, A.; Lange, M.; Wullenkord, M.; Spenke, C.; Roeb, M.; Sattler, C. High temperature hydrogen production: Design of a 750 KW demonstration plant for a two step thermochemical cycle. Sol. Energy 2016, 135, 232–241. [Google Scholar] [CrossRef] [Green Version]
  149. Siegel, N.P.; Miller, J.E.; Ermanoski, I.; Diver, R.B.; Stechel, E.B. Factors affecting the efficiency of solar driven metal oxide thermochemical cycles. Ind. Eng. Chem. Res. 2013, 52, 3276–3286. [Google Scholar] [CrossRef]
  150. Riahi, A.; Atashkari, K.; Mahmoudimehr, J.; Rodat, S. The influences of major geometrical parameters on detailed radiative performance of a multi-tubular solar thermochemical reactor. Appl. Therm. Eng. 2019, 159, 113793. [Google Scholar] [CrossRef]
  151. Schiebahn, S.; Grube, T.; Robinius, M.; Tietze, V.; Kumar, B.; Stolten, D. Power to gas: Technological overview, systems analysis and economic assessment for a case study in Germany. Int. J. Hydrog. Energy 2015, 40, 4285–4294. [Google Scholar] [CrossRef]
  152. Ursúa, A.; Gandía, L.M.; Sanchis, P. Hydrogen production from water electrolysis: Current status and future trends. Proc. IEEE 2011, 100, 410–426. [Google Scholar] [CrossRef]
  153. Sapountzi, F.M.; Gracia, J.M.; Weststrate, C.J.; Kee, J.; Fredriksson, H.O.A.; Niemantsverdriet, J.W. Electrocatalysts for the generation of hydrogen, oxygen and synthesis gas. Prog. Energy Combust. Sci. 2017, 58, 1–35. [Google Scholar] [CrossRef] [Green Version]
  154. Buttler, A.; Spliethoff, H. Current status of water electrolysis for energy storage, grid balancing and sector coupling via power-to-gas and power-to-liquids: A review. Renew. Sustain. Energy Rev. 2018, 82, 2440–2454. [Google Scholar] [CrossRef]
  155. Rashid, M.M.; Mesfer, M.K.; Naseem, H.; Danish, M. Hydrogen production by water electrolysis: A review of alkaline water electrolysis, PEM water electrolysis and high temperature water electrolysis. Int. J. Eng. Adv. Technol. 2015, 4, 2249–8958. [Google Scholar]
  156. Malkow, T.; Pilenga, A.; Tsotridis, G.; De Marco, G. EU Harmonised Polarisation Curve Test Method for Low Temperature Water Electrolysis; Publications Office of the European Union: Brusselsm, Belgium, 2018. [Google Scholar]
  157. Graves, C.; Ebbesen, S.D.; Mogensen, M.; Lackner, K.S. Sustainable hydrocarbon fuels by recycling CO2 and H2O with renewable or nuclear energy. Renew. Sustain. Energy Rev. 2011, 15, 1–23. [Google Scholar] [CrossRef]
  158. Wang, M.; Wang, Z.; Gong, X.; Guo, Z. The intensification technologies to water electrolysis for hydrogen production-A review. Renew. Sustain. Energy Rev. 2014, 29, 573–588. [Google Scholar] [CrossRef]
  159. Marini, S.; Salvi, P.; Nelli, P.; Pesenti, R.; Villa, M.; Berrettoni, M.; Zangari, G.; Kiros, Y. Advanced alkaline water electrolysis. Electrochim. Acta 2012, 82, 384–391. [Google Scholar] [CrossRef]
  160. Feng, Q.; Yuan, X.Z.; Liu, G.; Wei, B.; Zhang, Z.; Li, H.; Wang, H. A review of proton exchange membrane water electrolysis on degradation mechanisms and mitigation strategies. J. Power Sources 2017, 366, 33–55. [Google Scholar] [CrossRef]
  161. Scott, K. Process intensification: An electrochemical perspective. Renew. Sustain. Energy Rev. 2018, 81, 1406–1426. [Google Scholar] [CrossRef] [Green Version]
  162. Tijani, A.S.; Rahim, A.H.A. Numerical modeling the effect of operating variables on Faraday efficiency in PEM electrolyzer. Procedia Technol. 2016, 26, 419–427. [Google Scholar] [CrossRef] [Green Version]
  163. Kai, J.; Saito, R.; Terabaru, K.; Li, H.; Nakajima, H.; Ito, O. Effect of temperature on the performance of polymer electrolyte membranewater electrolysis: Numerical analysis of electrolysis voltage considering gas/liquid two-phase flow. J. Electrochem. Soc. 2019, 166, F246–F254. [Google Scholar] [CrossRef]
  164. Buelvas, W.L.; Ávila, K.C.P.; Jiménez, Á.R. Temperature as a factor determining on water electrolysis. Int. J. Eng. Trends Technol. 2014, 7, 5–9. [Google Scholar] [CrossRef]
  165. Roy, A.; Watson, S.; Infield, D. Comparison of electrical energy efficiency of atmospheric and high-pressure electrolysers. Int. J. Hydrog. Energy 2006, 31, 1964–1979. [Google Scholar] [CrossRef]
  166. Santos, D.M.F.; Sequeira, C.A.C.; Figueiredo, J.L. Hydrogen production by alkaline water electrolysis. Quim. Nova 2013, 36, 1176–1193. [Google Scholar] [CrossRef]
  167. Bodner, M.; Hofer, A.; Hacker, V. H2 generation from alkaline electrolyzer. Wiley Interdiscip. Rev. Energy Environ. 2015, 4, 365–381. [Google Scholar] [CrossRef]
  168. Zeng, K.; Zhang, D. Recent progress in alkaline water electrolysis for hydrogen production and applications. Prog. Energy Combust. Sci. 2010, 36, 307–326. [Google Scholar] [CrossRef]
  169. Colli, A.N.; Girault, H.H.; Battistel, A. Non-precious electrodes for practical alkaline water electrolysis. Materials 2019, 12, 1336. [Google Scholar] [CrossRef] [Green Version]
  170. Schalenbach, M.; Zeradjanin, A.R.; Kasian, O.; Cherevko, S.; Mayrhofer, K.J.J. A perspective on low-temperature water electrolysis—Challenges in alkaline and acidic technology. Int. J. Electrochem. Sci. 2018, 13, 1173–1226. [Google Scholar] [CrossRef]
  171. Hu, C.; Zhang, L.; Gong, J. Recent progress made in the mechanism comprehension and design of electrocatalysts for alkaline water splitting. Energy Environ. Sci. 2019, 12, 2620–2645. [Google Scholar] [CrossRef]
  172. Letcher, T. Storing energy, with special reference to renewable energy sources. Chem. Int. 2016, 38, 28. [Google Scholar]
  173. Götz, M.; Lefebvre, J.; Mörs, F.; McDaniel Koch, A.; Graf, F.; Bajohr, S.; Reimert, R.; Kolb, T. Renewable Power-to-Gas: A technological and economic review. Renew. Energy 2016, 85, 1371–1390. [Google Scholar] [CrossRef] [Green Version]
  174. Ulleberg, Ø. Modeling of advanced alkaline electrolyzers a system. Hydrog. Energy 2003, 28, 21–33. [Google Scholar] [CrossRef]
  175. Faid, A.Y.; Barnett, A.O.; Seland, F.; Sunde, S. Highly active nickel-based catalyst for hydrogen evolution in anion exchange membrane electrolysis. Catalysts 2018, 8, 614. [Google Scholar] [CrossRef] [Green Version]
  176. Phillips, R.; Dunnill, C.W. Zero gap alkaline electrolysis cell design for renewable energy storage as hydrogen gas. RSC Adv. 2016, 6, 100643–100651. [Google Scholar] [CrossRef] [Green Version]
  177. Pletcher, D.; Li, X. Prospects for alkaline zero gap water electrolysers for hydrogen production. Int. J. Hydrog. Energy 2011, 36, 15089–15104. [Google Scholar] [CrossRef] [Green Version]
  178. David, M.; Ocampo-Martínez, C.; Sánchez-Peña, R. Advances in alkaline water electrolyzers: A review. J. Energy Storage 2019, 23, 392–403. [Google Scholar] [CrossRef] [Green Version]
  179. Diéguez, P.M.; Ursúa, A.; Sanchis, P.; Sopena, C.; Guelbenzu, E.; Gandía, L.M. Thermal performance of a commercial alkaline water electrolyzer: Experimental study and mathematical modeling. Int. J. Hydrog. Energy 2008, 33, 7338–7354. [Google Scholar] [CrossRef]
  180. Ganley, J.C. High temperature and pressure alkaline electrolysis. Int. J. Hydrog. Energy 2009, 34, 3604–3611. [Google Scholar] [CrossRef]
  181. Allebrod, F.; Chatzichristodoulou, C.; Mogensen, M.B. Alkaline electrolysis cell at high temperature and pressure of 250 °C and 42 bar. J. Power Sources 2013, 229, 22–31. [Google Scholar] [CrossRef]
  182. Mahmood, N.; Yao, Y.; Zhang, J.W.; Pan, L.; Zhang, X.; Zou, J.J. Electrocatalysts for hydrogen evolution in alkaline electrolytes: Mechanisms, challenges, and prospective solutions. Adv. Sci. 2018, 5, 1700464. [Google Scholar] [CrossRef]
  183. Gong, M.; Wang, D.Y.; Chen, C.C.; Hwang, B.J.; Dai, H. A mini review on nickel-based electrocatalysts for alkaline hydrogen evolution reaction. Nano Res. 2016, 9, 28–46. [Google Scholar] [CrossRef]
  184. Mauer, A.E.; Kirk, D.W.; Thorpe, S.J. The role of iron in the prevention of nickel electrode deactivation in alkaline electrolysis. Electrochim. Acta 2007, 52, 3505–3509. [Google Scholar] [CrossRef]
  185. Cardoso, D.S.P.; Amaral, L.; Santos, D.M.F.; Šljukić, B.; Sequeira, C.A.C.; Macciò, D.; Saccone, A. Enhancement of hydrogen evolution in alkaline water electrolysis by using nickel-rare earth alloys. Int. J. Hydrog. Energy 2015, 40, 4295–4302. [Google Scholar] [CrossRef]
  186. Safizadeh, F.; Ghali, E.; Houlachi, G. Electrocatalysis developments for hydrogen evolution reaction in alkaline solutions—A review. Int. J. Hydrog. Energy 2015, 40, 256–274. [Google Scholar] [CrossRef]
  187. Brown, D.E.; Mahmood, M.N.; Man, M.C.M.; Turner, A.K. Preparation and characterization of low overvoltage transition metal alloy electrocatalysts for hydrogen evolution in alkaline solutions. Electrochim. Acta 1984, 29, 1551–1556. [Google Scholar] [CrossRef]
  188. Arul Raj, I. Nickel-based, binary-composite electrocatalysts for the cathodes in the energy-efficient industrial production of hydrogen from alkaline-water electrolytic cells. J. Mater. Sci. 1993, 28, 4375–4382. [Google Scholar]
  189. Kim, J.E.; Bae, K.K.; Park, C.S.; Jeong, S.U.; Baik, K.H.; Kim, J.W.; Kim, Y.H.; Kang, K.S.; Lee, K.B. Data on the characterization of Raney nickel powder and Raney-nickel-coated electrodes prepared by atmospheric plasma spraying for alkaline water electrolysis. Data Brief 2018, 21, 2059–2062. [Google Scholar] [CrossRef]
  190. Shetty, S.; Mohamed Jaffer Sadiq, M.; Bhat, D.K.; Hegde, A.C. Electrodeposition and characterization of Ni-Mo alloy as an electrocatalyst for alkaline water electrolysis. J. Electroanal. Chem. 2017, 796, 57–65. [Google Scholar] [CrossRef]
  191. Ganci, F.; Baguet, T.; Aiello, G.; Cusumano, V.; Mandin, P.; Sunseri, C.; Inguanta, R. Nanostructured Ni based anode and cathode for alkaline water electrolyzers. Energies 2019, 12, 3669. [Google Scholar] [CrossRef] [Green Version]
  192. Pomerantseva, E.; Resini, C.; Kovnir, K.; Kolen’ko, Y.V. Emerging nanostructured electrode materials for water electrolysis and rechargeable beyond Li-ion batteries. Adv. Phys. X 2017, 2, 211–253. [Google Scholar] [CrossRef] [Green Version]
  193. Ganci, F.; Lombardo, S.; Sunseri, C.; Inguanta, R. Nanostructured electrodes for hydrogen production in alkaline electrolyzer. Renew. Energy 2018, 123, 117–124. [Google Scholar] [CrossRef]
  194. Subbaraman, R.; Tripkovic, D.; Strmcnik, D.; Chang, K.-C.; Uchimura, M.; Paulikas, A.P.; Stamenkovic, V.; Markovic, N.M. Enhancing hydrogen evolution activity in water splitting by tailoring Li+-Ni(OH)₂-Pt interfaces. Science 2011, 334, 1256–1260. [Google Scholar] [CrossRef] [PubMed]
  195. Carmo, M.; Fritz, D.L.; Mergel, J.; Stolten, D. A comprehensive review on PEM water electrolysis. Int. J. Hydrog. Energy 2013, 38, 4901–4934. [Google Scholar] [CrossRef]
  196. Grubb, W.T. Ionic migration in ion-exchange membranes. J. Phys. Chem. 1959, 63, 55–58. [Google Scholar] [CrossRef]
  197. Gahleitner, G. Hydrogen from renewable electricity: An international review of power-to-gas pilot plants for stationary applications. Int. J. Hydrog. Energy 2013, 38, 2039–2061. [Google Scholar] [CrossRef]
  198. Shiva Kumar, S.; Himabindu, V. Hydrogen production by PEM water electrolysis—A review. Mater. Sci. Energy Technol. 2019, 2, 442–454. [Google Scholar] [CrossRef]
  199. Siracusano, S.; Baglio, V.; Van Dijk, N.; Merlo, L.; Aricò, A.S. Enhanced performance and durability of low catalyst loading PEM water electrolyser based on a short-side chain perfluorosulfonic ionomer. Appl. Energy 2017, 192, 477–489. [Google Scholar] [CrossRef]
  200. Wang, R.; Liu, S.; Wang, L.; Li, M.; Gao, C. Understanding of nanophase separation and hydrophilic morphology in Nafion and SPEEK membranes: A combined experimental and theoretical studies. Nanomaterials 2019, 9, 869. [Google Scholar] [CrossRef] [Green Version]
  201. Devanathan, R.; Venkatnathan, A.; Rousseau, R.; Dupuis, M.; Frigato, T.; Gu, W.; Helms, V. Atomistic simulation of water percolation and proton hopping in Nafion fuel cell membrane. J. Phys. Chem. B 2010, 114, 13681–13690. [Google Scholar] [CrossRef]
  202. Sun, C.W.; Hsiau, S.S. Effect of electrolyte concentration difference on hydrogen production during PEM electrolysis. J. Electrochem. Sci. Technol. 2018, 9, 99–108. [Google Scholar] [CrossRef] [Green Version]
  203. Ayers, K.E.; Anderson, E.B.; Capuano, C.B.; Carter, B.D.; Dalton, L.T.; Hanlon, G.; Manco, J.; Niedzwiecki, M. Research advances towards low cost, high efficiency PEM electrolysis. ECS Trans. 2010, 33, 3–15. [Google Scholar]
  204. Schalenbach, M.; Carmo, M.; Fritz, D.L.; Mergel, J.; Stolten, D. Pressurized PEM water electrolysis: Efficiency and gas crossover. Int. J. Hydrog. Energy 2013, 38, 14921–14933. [Google Scholar] [CrossRef]
  205. Rasten, E.; Hagen, G.; Tunold, R. Electrocatalysis in water electrolysis with solid polymer electrolyte. Electrochim. Acta 2003, 48, 3945–3952. [Google Scholar] [CrossRef]
  206. Xu, W.; Scott, K. The effects of ionomer content on PEM water electrolyser membrane electrode assembly performance. Int. J. Hydrog. Energy 2010, 35, 12029–12037. [Google Scholar] [CrossRef]
  207. Miles, M.H.; Thomason, M.A. Periodic variations of overvoltages for water electrolysis in acid solutions from cyclic voltammetric studies. J. Electrochem. Soc. 1976, 123, 1459–1461. [Google Scholar] [CrossRef]
  208. Bessarabov, D.G.; Wang, H.H.; Li, H.; Zhao, N. PEM Electrolysis for Hydrogen Production: Principles and Applications; CRC Press: Boca Raton, FL, USA, 2016. [Google Scholar]
  209. Chisholm, G.; Kitson, P.J.; Kirkaldy, N.D.; Bloor, L.G.; Cronin, L. 3D printed flow plates for the electrolysis of water: An economic and adaptable approach to device manufacture. Energy Environ. Sci. 2014, 7, 3026–3032. [Google Scholar] [CrossRef] [Green Version]
  210. Mo, J.; Kang, Z.; Retterer, S.T.; Cullen, D.A.; Toops, T.J.; Green, J.B.; Mench, M.M.; Zhang, F.Y. Discovery of true electrochemical reactions for ultrahigh catalyst mass activity in water splitting. Sci. Adv. 2016, 2, 1–7. [Google Scholar] [CrossRef] [Green Version]
  211. Nikiforov, A.; Petrushina, I.M.; Jensen, J.O.; Bjerrum, N.J.; Christensen, E. Advanced Construction Materials for High Temperature Steam PEM Electrolysers. In Electrolysis; Linkov, V., Kleperis, J., Eds.; IntechOpen: London, UK, 2012; pp. 61–86. [Google Scholar]
  212. Millet, P.; Ngameni, R.; Grigoriev, S.A.; Mbemba, N.; Brisset, F.; Ranjbari, A.; Etiévant, C. PEM water electrolyzers: From electrocatalysis to stack development. Int. J. Hydrog. Energy 2010, 35, 5043–5052. [Google Scholar] [CrossRef]
  213. Stempien, J.P.; Sun, Q.; Chan, S.H. Solid oxide electrolyzer cell modeling: A review. J. Power Technol. 2013, 93, 216–246. [Google Scholar]
  214. Wang, Y.; Liu, T.; Lei, L.; Chen, F. High temperature solid oxide H2O/CO2 co-electrolysis for syngas production. Fuel Process. Technol. 2017, 161, 248–258. [Google Scholar] [CrossRef]
  215. Bo, Y.; Wenqiang, Z.; Jingming, X.; Jing, C. Status and research of highly efficient hydrogen production through high temperature steam electrolysis at INET. Int. J. Hydrog. Energy 2010, 35, 2829–2835. [Google Scholar] [CrossRef]
  216. Pandiyan, A.; Uthayakumar, A.; Subrayan, R.; Cha, S.W.; Krishna Moorthy, S.B. Review of solid oxide electrolysis cells: A clean energy strategy for hydrogen generation. Nanomater. Energy 2019, 8, 2–22. [Google Scholar] [CrossRef]
  217. Hu, L.; Lindbergh, G.; Lagergren, C. Electrode kinetics of the NiO porous electrode for oxygen production in the molten carbonate electrolysis cell (MCEC). Faraday Discuss. 2015, 182, 493–509. [Google Scholar] [CrossRef] [PubMed] [Green Version]
  218. Brisse, A.; Schefold, J.; Zahid, M. High temperature water electrolysis in solid oxide cells. Int. J. Hydrog. Energy 2008, 33, 5375–5382. [Google Scholar] [CrossRef]
  219. Laguna-Bercero, M.A.; Skinner, S.J.; Kilner, J.A. Performance of solid oxide electrolysis cells based on scandia stabilised zirconia. J. Power Sources 2009, 192, 126–131. [Google Scholar] [CrossRef] [Green Version]
  220. Ni, M.; Leung, M.K.H.; Leung, D.Y.C. Technological development of hydrogen production by solid oxide electrolyzer cell (SOEC). Int. J. Hydrog. Energy 2008, 33, 2337–2354. [Google Scholar] [CrossRef]
  221. Han, M.; Tang, X.; Yin, H.; Peng, S. Fabrication, microstructure and properties of a YSZ electrolyte for SOFCs. J. Power Sources 2007, 165, 757–763. [Google Scholar] [CrossRef]
  222. Rathod, S.G.; Bhajantri, R.F.; Ravindrachary, V.; Pujari, P.K.; Nagaraja, G.K.; Naik, J.; Hebbar, V.; Chandrappa, H. Temperature-dependent ionic conductivity and transport properties of LiClO4-doped PVA/modified cellulose composites. Bull. Mater. Sci. 2015, 38, 1213–1221. [Google Scholar] [CrossRef] [Green Version]
  223. Bocanegra-bernal, M.H.; Díaz de la torre, S. Phase transitions in zirconium dioxide and related materials for high performance engineering ceramics. J. Mater. Sci. 2002, 37, 4947–4971. [Google Scholar] [CrossRef]
  224. Badwal, S.P.S. Zirconia-based solid electrolytes: Microstructure, stability and ionic conductivity. Solid State Ion. 1992, 52, 23–32. [Google Scholar] [CrossRef]
  225. Butler, E.P.; Bonanos, N. The characterization of ZrO2 engineering ceramics by A.C. impedance spectroscopy. Mater. Sci. Eng. 1985, 71, 49–56. [Google Scholar] [CrossRef]
  226. Kilner, J.A. Fast anion transport in solids. Solid State Ion. 1983, 8, 201–207. [Google Scholar] [CrossRef]
  227. Biswas, M.; Sadanala, K.C. Electrolyte materials for solid oxide fuel cell. J. Powder Metall. Min. 2013, 2, 10–15. [Google Scholar] [CrossRef] [Green Version]
  228. Ivanov, V.; Shkerin, S.; Rempel, A.; Khrustov, V.; Lipilin, A.; Nikonov, A. The grain size effect on the yttria stabilized Zirconia grain boundary conductivity. J. Nanosci. Nanotechnol. 2010, 10, 7411–7415. [Google Scholar] [CrossRef] [PubMed]
  229. Omar, S. Doped Ceria for Solid Oxide Fuel Cells. In Cerium Oxide—Applications and Attributes; Khan, S.B., Akhtar, K., Eds.; IntechOpen: London, UK, 2019; p. 17. [Google Scholar]
  230. Artini, C.; Pani, M.; Carnasciali, M.M.; Plaisier, J.R.; Costa, G.A. Lu-, Sm-, and Gd-doped ceria: A comparative approach to their structural properties. Inorg. Chem. 2016, 55, 10567–10579. [Google Scholar] [CrossRef] [PubMed]
  231. Hayashi, H.; Kanoh, M.; Quan, C.J.; Inaba, H.; Wang, S.; Dokiya, M.; Tagawa, H. Thermal expansion of Gd-doped ceria and reduced ceria. Solid State Ion. 2000, 132, 227–233. [Google Scholar] [CrossRef]
  232. Mangalaraja, R.V.; Ananthakumar, S.; Paulraj, M.; Pesenti, H.; López, M.; Camurri, C.P.; Barcos, L.A.; Avila, R.E. Electrical and thermal characterization of Sm3+ doped ceria electrolytes synthesized by combustion technique. J. Alloys Compd. 2011, 510, 134–140. [Google Scholar] [CrossRef]
  233. Wang, D.Y.; Park, D.S.; Griffith, J.; Nowick, A.S. Oxigen-ion conductivity and defect interactions in yttria-doped ceria. Solid State Ion. 1981, 2, 95–105. [Google Scholar] [CrossRef]
  234. Gerhardt, R.; Lee, W.-K.; Nowick, A.S. Anelastic and dielectric relaxation of scandia-doped ceria. J. Phys. Chem. Solids 1987, 48, 563–569. [Google Scholar] [CrossRef]
  235. Sachdeva, A.; Chavan, S.V.; Goswami, A.; Tyagi, A.K.; Pujari, P.K. Positron annihilation spectroscopic studies on Nd-doped ceria. J. Solid State Chem. 2005, 178, 2062–2066. [Google Scholar] [CrossRef]
  236. Eguchi, K.; Setoguchi, T.; Inoue, T.; Arai, H. Electrical properties of ceria-based oxides and their application to solid oxide fuel cells. Solid State Ion. 1992, 52, 165–172. [Google Scholar] [CrossRef]
  237. Singh, M.; Singh, A.K. Studies on structural, morphological, and electrical properties of Ga3+ and Cu2+ co-doped ceria ceramics as solid electrolyte for IT-SOFCs. Int. J. Hydrog. Energy 2019, 1–12. [Google Scholar] [CrossRef]
  238. Wang, F.Y.; Chen, S.; Cheng, S. Gd3+ and Sm3+ co-doped ceria based electrolytes for intermediate temperature solid oxide fuel cells. Electrochem. Commun. 2004, 6, 743–746. [Google Scholar] [CrossRef]
  239. Tadokoro, S.K.; Muccillo, E.N.S. Effect of Y and Dy co-doping on electrical conductivity of ceria ceramics. J. Eur. Ceram. Soc. 2007, 27, 4261–4264. [Google Scholar] [CrossRef]
  240. Omar, S.; Wachsman, E.D.; Nino, J.C. Higher conductivity Sm3+ and Nd3+ co-doped ceria-based electrolyte materials. Solid State Ion. 2008, 178, 1890–1897. [Google Scholar] [CrossRef]
  241. Ishihara, T.; Shibayama, T.; Honda, M.; Nishiguchi, H.; Takita, Y. Intermediate temperature solid oxide fuel cells using LaGaO3 electrolyte II. Improvement of oxide ion conductivity and power density by doping Fe for Ga site of LaGaO3. J. Electrochem. Soc. 2000, 147, 1332–1337. [Google Scholar] [CrossRef]
  242. Yamaji, K.; Horita, T.; Ishikawa, M.; Sakai, N.; Yokokawa, H. Chemical stability of the La0.9Sr0.1Ga0.8Mg0.2O2.85 electrolyte in a reducing atmosphere. Solid State Ion. 1999, 121, 217–224. [Google Scholar] [CrossRef]
  243. Bozza, F.; Polini, R.; Traversa, E. Electrophoretic deposition of dense La0.8Sr0.2Ga0.8Mg0.115Co0.085O3−δ electrolyte films from single-phase powders for intermediate temperature solid oxide fuel cells. J. Am. Ceram. Soc. 2009, 92, 1999–2004. [Google Scholar] [CrossRef]
  244. Peña-Martínez, J.; Marrero-López, D.; Pérez-Coll, D.; Ruiz-Morales, J.C.; Núñez, P. Performance of XSCoF (X = Ba, La and Sm) and LSCrX′ (X′ = Mn, Fe and Al) perovskite-structure materials on LSGM electrolyte for IT-SOFC. Electrochim. Acta 2007, 52, 2950–2958. [Google Scholar] [CrossRef]
  245. Hossain, S.; Abdalla, A.M.; Jamain, S.N.B.; Zaini, J.H.; Azad, A.K. A review on proton conducting electrolytes for clean energy and intermediate temperature-solid oxide fuel cells. Renew. Sustain. Energy Rev. 2017, 79, 750–764. [Google Scholar] [CrossRef]
  246. Bi, L.; Da’as, E.H.; Shafi, S.P. Proton-conducting solid oxide fuel cell (SOFC) with Y-doped BaZrO3 electrolyte. Electrochem. Commun. 2017, 80, 20–23. [Google Scholar] [CrossRef]
  247. Xie, K.; Zhang, Y.; Meng, G.; Irvine, J.T.S. Electrochemical reduction of CO2 in a proton conducting solid oxide electrolyser. J. Mater. Chem. 2011, 21, 195–198. [Google Scholar] [CrossRef]
  248. Peters, R.; Deja, R.; Blum, L.; Nguyen, V.N.; Fang, Q.; Stolten, D. Influence of operating parameters on overall system efficiencies using solid oxide electrolysis technology. Int. J. Hydrog. Energy 2015, 40, 7103–7113. [Google Scholar] [CrossRef]
  249. Kim, J.; Jun, A.; Gwon, O.; Yoo, S.; Liu, M.; Shin, J.; Lim, T.H.; Kim, G. Hybrid-solid oxide electrolysis cell: A new strategy for efficient hydrogen production. Nano Energy 2018, 44, 121–126. [Google Scholar] [CrossRef]
  250. Tietz, F. Thermal expansion of SOFC materials. Ionics 1999, 5, 129–139. [Google Scholar] [CrossRef]
  251. Xu, X.; Wang, C.; Fronzi, M.; Liu, X.; Bi, L. Modification of a first-generation solid oxide fuel cell cathode with Co3O4 nanocubes having selectively exposed crystal planes. Mater. Renew. Sustain. Energy 2019, 8, 1–8. [Google Scholar] [CrossRef] [Green Version]
  252. Huang, K.; Feng, M.; Goodenough, J.B.; Schmerling, M. Characterization of Sr-doped LaMnO3 and LaCoO3 as cathode materials for a doped LaGaO3 ceramic fuel cell. J. Electrochem. Soc. 1996, 143, 3630–3636. [Google Scholar] [CrossRef]
  253. Maguire, E.; Gharbage, B.; Marques, F.M.B.; Labrincha, J.A. Cathode materials for intermediate temperature SOFCs. Solid State Ion. 2000, 127, 329–335. [Google Scholar] [CrossRef]
  254. Nerat, M.; Juričić, Đ. Modelling of anode delamination in solid oxide electrolysis cell and analysis of its effects on electrochemical performance. Int. J. Hydrog. Energy 2018, 43, 8179–8189. [Google Scholar] [CrossRef]
  255. Zheng, Y.; Wang, J.; Yu, B.; Zhang, W.; Chen, J.; Qiao, J.; Zhang, J. A review of high temperature co-electrolysis of H2O and CO2 to produce sustainable fuels using solid oxide electrolysis cells (SOECs): Advanced materials and technology. Chem. Soc. Rev. 2017, 46, 1427–1463. [Google Scholar] [CrossRef]
  256. Ivers-Tiffée, E.; Weber, A.; Herbstritt, D. Materials and technologies for SOFC-components. J. Eur. Ceram. Soc. 2001, 21, 1805–1811. [Google Scholar] [CrossRef]
  257. Marina, O.A.; Pederson, L.R.; Williams, M.C.; Coffey, G.W.; Meinhardt, K.D.; Nguyen, C.D.; Thomsen, E.C. Electrode performance in reversible solid oxide fuel cells. J. Electrochem. Soc. 2007, 154, 452–459. [Google Scholar] [CrossRef]
  258. Kong, J.; Zhang, Y.; Deng, C.; Xu, J. Synthesis and electrochemical properties of LSM and LSF perovskites as anode materials for high temperature steam electrolysis. J. Power Sources 2009, 186, 485–489. [Google Scholar] [CrossRef]
  259. Jiang, S.P. Challenges in the development of reversible solid oxide cell technologies: A mini review. Asia-Pac. J. Chem. Eng. 2016, 11, 386–391. [Google Scholar] [CrossRef]
  260. Lessing, P.A. A review of sealing technologies applicable to solid oxide electrolysis cells. J. Mater. Sci. 2007, 42, 3465–3476. [Google Scholar] [CrossRef]
  261. Redissi, Y.; Bouallou, C. Valorization of carbon dioxide by co-electrolysis of CO2/H2O at high temperature for syngas production. Energy Procedia 2013, 37, 6667–6678. [Google Scholar] [CrossRef] [Green Version]
  262. Chen, X.; Guan, C.; Xiao, G.; Du, X.; Wang, J.Q. Syngas production by high temperature steam/CO2 coelectrolysis using solid oxide electrolysis cells. Faraday Discuss. 2015, 182, 341–351. [Google Scholar] [CrossRef] [PubMed]
  263. Ni, M. An electrochemical model for syngas production by co-electrolysis of H2O and CO2. J. Power Sources 2012, 202, 209–216. [Google Scholar] [CrossRef] [Green Version]
  264. Sun, X.; Chen, M.; Jensen, S.H.; Ebbesen, S.D.; Graves, C.; Mogensen, M. Thermodynamic analysis of synthetic hydrocarbon fuel production in pressurized solid oxide electrolysis cells. Int. J. Hydrog. Energy 2012, 37, 17101–17110. [Google Scholar] [CrossRef]
  265. Hansen, J.B. Solid oxide electrolysis—A key enabling technology for sustainable energy scenarios. Faraday Discuss. 2015, 182, 9–48. [Google Scholar] [CrossRef]
  266. Becker, W.L.; Braun, R.J.; Penev, M.; Melaina, M. Production of Fischer-Tropsch liquid fuels from high temperature solid oxide co-electrolysis units. Energy 2012, 47, 99–115. [Google Scholar] [CrossRef]
  267. Wang, L.; Chen, M.; Küngas, R.; Lin, T.E.; Diethelm, S.; Maréchal, F.; Van herle, J. Power-to-fuels via solid-oxide electrolyzer: Operating window and techno-economics. Renew. Sustain. Energy Rev. 2019, 110, 174–187. [Google Scholar] [CrossRef]
  268. Bian, L.Z.; Chen, Z.Y.; Wang, L.J.; Li, F.S.; Chou, K.C. Electrochemical performance and carbon deposition of anode-supported solid oxide fuel cell exposed to H2/CO fuels. Int. J. Hydrog. Energy 2017, 42, 14246–14252. [Google Scholar] [CrossRef]
  269. Skafte, T.L.; Blennow, P.; Hjelm, J.; Graves, C. Carbon deposition and sulfur poisoning during CO2 electrolysis in nickel-based solid oxide cell electrodes. J. Power Sources 2018, 373, 54–60. [Google Scholar] [CrossRef] [Green Version]
  270. Graves, C.; Ebbesen, S.D.; Mogensen, M. Co-electrolysis of CO2 and H2O in solid oxide cells: Performance and durability. Solid State Ion. 2011, 192, 398–403. [Google Scholar] [CrossRef]
  271. Ebbesen, S.D.; Graves, C.; Hauch, A.; Jensen, S.H.; Mogensen, M. Poisoning of solid oxide electrolysis cells by impurities. J. Electrochem. Soc. 2010, 157, B1419–B1429. [Google Scholar] [CrossRef] [Green Version]
  272. Kadier, A.; Simayi, Y.; Abdeshahian, P.; Azman, N.F.; Chandrasekhar, K.; Kalil, M.S. A comprehensive review of microbial electrolysis cells (MEC) reactor designs and configurations for sustainable hydrogen gas production. Alex. Eng. J. 2016, 55, 427–443. [Google Scholar] [CrossRef] [Green Version]
  273. Rozendal, R.A.; Buisman, C.J.N. Process for Producing Hydrogen; Patent and Trademark Office: Washington, DC, USA, 2005; pp. 1–13.
  274. Liu, H.; Grot, S.; Logan, B.E. Electrochemically assisted microbial production of hydrogen from acetate. Environ. Sci. Technol. 2005, 39, 4317–4320. [Google Scholar] [CrossRef]
  275. Escapa, A.; San-Martín, M.I.; Morán, A. Potential use of microbial electrolysis cells in domestic wastewater treatment plants for energy recovery. Front. Energy Res. 2014, 2, 19. [Google Scholar] [CrossRef] [Green Version]
  276. Waqas, M.; Rehan, M.; Aburiazaiza, A.S.; Nizami, A.-S. Wastewater Biorefinery Based on the Microbial Electrolysis Cell: Opportunities and Challenges. In Progress and Recent Trends in Microbial Fuel Cells; Elsevier: Amsterdam, The Netherlands, 2018; pp. 347–374. [Google Scholar]
  277. Chen, Y.; Chen, M.; Shen, N.; Zeng, R.J. H2 production by the thermoelectric microconverter coupled with microbial electrolysis cell. Int. J. Hydrog. Energy 2016, 41, 22760–22768. [Google Scholar] [CrossRef]
  278. Santoro, C.; Arbizzani, C.; Erable, B.; Ieropoulos, I. Microbial fuel cells: From fundamentals to applications. A review. J. Power Sources 2017, 356, 225–244. [Google Scholar] [CrossRef]
  279. Feng, C.; Li, J.; Qin, D.; Chen, L.; Zhao, F.; Chen, S.; Hu, H.; Yu, C.P. Characterization of exoelectrogenic bacteria enterobacter strains isolated from a microbial fuel cell exposed to copper shock load. PLoS ONE 2014, 9, 1–10. [Google Scholar] [CrossRef] [PubMed]
  280. Gregory, K.B.; Bond, D.R.; Lovley, D.R. Graphite electrodes as electron donors for anaerobic respiration. Environ. Microbiol. 2004, 6, 596–604. [Google Scholar] [CrossRef]
  281. Rathinam, N.K.; Salem, D.R.; Sani, R.K. Biofilm Engineering for Improving the Performance of Microbial Electrochemical Technologies. In Microbial Electrochemical Technology; CRC: Boca Raton, FL, USA, 2019; pp. 315–338. [Google Scholar]
  282. Mathuriya, A.S. Inoculum selection to enhance performance of a microbial fuel cell for electricity generation during wastewater treatment. Environ.Technol. 2013, 34, 1957–1964. [Google Scholar] [CrossRef] [PubMed]
  283. Logan, B.E.; Call, D.; Cheng, S.; Hamelers, H.V.M.; Sleutels, T.H.J.A.; Jeremiasse, A.W.; Rozendal, R.A. Microbial electrolysis cells for high yield hydrogen gas production from organic matter. Environ. Sci. Technol. 2008, 42, 8630–8640. [Google Scholar] [CrossRef] [PubMed]
  284. Yasri, N.; Roberts, E.P.L.; Gunasekaran, S. The electrochemical perspective of bioelectrocatalytic activities in microbial electrolysis and microbial fuel cells. Energy Rep. 2019, 5, 1116–1136. [Google Scholar] [CrossRef]
  285. Xie, X.; Criddle, C.; Cui, Y. Design and fabrication of bioelectrodes for microbial bioelectrochemical systems. Energy Environ. Sci. 2015, 8, 3418–3441. [Google Scholar] [CrossRef]
  286. Logan, B.E.; Hamelers, B.; Rozendal, R.; Schröder, U.; Keller, J.; Freguia, S.; Aelterman, P.; Verstraete, W.; Rabaey, K. Microbial fuel cells: Methodology and technology. Environ. Sci. Technol. 2006, 40, 5181–5192. [Google Scholar] [CrossRef]
  287. Hindatu, Y.; Annuar, M.S.M.; Gumel, A.M. Mini-review: Anode modification for improved performance of microbial fuel cell. Renew. Sustain. Energy Rev. 2017, 73, 236–248. [Google Scholar] [CrossRef]
  288. Kundu, A.; Sahu, J.N.; Redzwan, G.; Hashim, M.A. An overview of cathode material and catalysts suitable for generating hydrogen in microbial electrolysis cell. Int. J. Hydrog. Energy 2013, 38, 1745–1757. [Google Scholar] [CrossRef]
  289. Kadier, A.; Logroño, W.; Rai, P.K.; Kalil, M.S.; Mohamed, A.; Hasan, H.A.; Hamid, A.A. None-platinum electrode catalysts and membranes for highly efficient and inexpensive H2 production in microbial electrolysis cells (MECs): A review. Iran. J. Catal. 2017, 7, 89–102. [Google Scholar]
  290. Rozendal, R.A.; Hamelers, H.V.M.; Molenkamp, R.J.; Buisman, C.J.N. Performance of single chamber biocatalyzed electrolysis with different types of ion exchange membranes. Water Res. 2007, 41, 1984–1994. [Google Scholar] [CrossRef] [PubMed]
  291. Call, D.; Logan, B.E. Hydrogen production in a single chamber microbial electrolysis cell lacking a membrane. Environ. Sci. Technol. 2008, 42, 3401–3406. [Google Scholar] [CrossRef] [PubMed]
  292. Zhang, J.; Zhang, Y.; Quan, X.; Chen, S.; Afzal, S. Enhanced anaerobic digestion of organic contaminants containing diverse microbial population by combined microbial electrolysis cell (MEC) and anaerobic reactor under Fe(III) reducing conditions. Bioresour. Technol. 2013, 136, 273–280. [Google Scholar] [CrossRef] [PubMed]
  293. Wrana, N.; Sparling, R.; Cicek, N.; Levin, D.B. Hydrogen gas production in a microbial electrolysis cell by electrohydrogenesis. J. Clean. Prod. 2010, 18, S105–S111. [Google Scholar] [CrossRef]
  294. Cheng, S.; Xing, D.; Call, D.F.; Logan, B.E. Direct biological conversion of electrical current into methane by electromethanogenesis. Environ. Sci. Technol. 2009, 43, 3953–3958. [Google Scholar] [CrossRef] [PubMed]
  295. Clauwaert, P.; Tolêdo, R.; van der Ha, D.; Crab, R.; Verstraete, W.; Hu, H.; Udert, K.M.; Rabaey, K. Combining biocatalyzed electrolysis with anaerobic digestion. Water Sci. Technol. 2008, 57, 575–579. [Google Scholar] [CrossRef] [Green Version]
  296. Nelabhotla, A.B.T.; Dinamarca, C. Bioelectrochemical CO2 reduction to methane: MES integration in biogas production processes. Appl. Sci. 2019, 9, 1056. [Google Scholar] [CrossRef] [Green Version]
  297. Li, S.; Chen, G. Factors affecting the effectiveness of bioelectrochemical system applications: Data synthesis and meta-analysis. Batteries 2018, 4, 34. [Google Scholar] [CrossRef] [Green Version]
  298. Wang, Y.Z.; Zhang, L.; Xu, T.; Ding, K. Influence of initial anolyte pH and temperature on hydrogen production through simultaneous saccharification and fermentation of lignocellulose in microbial electrolysis cell. Int. J. Hydrog. Energy 2017, 42, 22663–22670. [Google Scholar] [CrossRef]
  299. Andrei, V.; Reuillard, B.; Reisner, E. Bias-free solar syngas production by integrating a molecular cobalt catalyst with perovskite–BiVO4 tandems. Nat. Mater. 2019. [Google Scholar] [CrossRef]
  300. Liao, C.H.; Huang, C.W.; Wu, J.C.S. Hydrogen production from semiconductor-based photocatalysis via water splitting. Catalysts 2012, 2, 490–516. [Google Scholar] [CrossRef] [Green Version]
  301. Li, Z.; Luo, W.; Zhang, M.; Feng, J.; Zou, Z. Photoelectrochemical cells for solar hydrogen production: Current state of promising photoelectrodes, methods to improve their properties, and outlook. Energy Environ. Sci. 2013, 6, 347–370. [Google Scholar] [CrossRef]
  302. Ahmad, H.; Kamarudin, S.K.; Minggu, L.J.; Kassim, M. Hydrogen from photo-catalytic water splitting process: A review. Renew. Sustain. Energy Rev. 2015, 43, 599–610. [Google Scholar] [CrossRef]
  303. Shi, X.; Cai, L.; Ma, M.; Zheng, X.; Park, J.H. General Characterization Methods for Photoelectrochemical Cells for Solar Water Splitting. ChemSusChem 2015, 8, 3192–3203. [Google Scholar] [CrossRef] [PubMed]
  304. Tembhurne, S.; Nandjou, F.; Haussener, S. A thermally synergistic photo-electrochemical hydrogen generator operating under concentrated solar irradiation. Nat. Energy 2019, 4, 399–407. [Google Scholar] [CrossRef]
  305. Inoue, T.; Fujishima, A.; Konishi, S.; Honda, K. Photoelectrocatalytic reduction of carbon dioxide in aqueous suspensions of semiconductor powders. Nature 1979, 277, 637–638. [Google Scholar] [CrossRef]
  306. Sharma, G.P.; Upadhyay, A.P.; Behara, D.K.; Sivakumar, S.; Pala, R.G.S. Fundamental Aspect of Photoelectrochemical Water Splitting. In The Water-Food-Energy Nexus: Processes, Technologies, and Challenges; Mujtaba, I.M., Srinivasan, R., Elbashir, N.O., Eds.; CRC: Boca Raton, FL, USA, 2017; pp. 677–689. [Google Scholar]
  307. Ismail, A.A.; Bahnemann, D.W. Photochemical splitting of water for hydrogen production by photocatalysis: A review. Sol. Energy Mater. Sol. Cells 2014, 128, 85–101. [Google Scholar] [CrossRef]
  308. Maeda, K.; Domen, K. New non-oxide photocatalysts designed for overall water splitting under visible light. J. Phys. Chem. C 2007, 111, 7851–7861. [Google Scholar] [CrossRef]
  309. Li, J.; Wu, N. Semiconductor-based photocatalysts and photoelectrochemical cells for solar fuel generation: A review. Catal. Sci. Technol. 2015, 5, 1360–1384. [Google Scholar] [CrossRef]
  310. Chiu, Y.-H.; Lai, T.-H.; Kuo, M.-Y.; Hsieh, P.-Y.; Hsu, Y.-J. Photoelectrochemical cells for solar hydrogen production: Challenges and opportunities. Appl. Mater. 2019, 7, 080901. [Google Scholar] [CrossRef] [Green Version]
  311. Cheng, W.H.; Richter, M.H.; May, M.M.; Ohlmann, J.; Lackner, D.; Dimroth, F.; Hannappel, T.; Atwater, H.A.; Lewerenz, H.J. Monolithic photoelectrochemical device for direct water splitting with 19% efficiency. ACS Energy Lett. 2018, 3, 1795–1800. [Google Scholar] [CrossRef]
  312. Adán-Más, A.; Wei, D. Photoelectrochemical properties of graphene and its derivatives. Nanomaterials 2013, 3, 325–356. [Google Scholar] [CrossRef] [PubMed]
  313. Lalitha, K.; Reddy, J.K.; Phanikrishna Sharma, M.V.; Kumari, V.D.; Subrahmanyam, M. Continuous hydrogen production activity over finely dispersed Ag2O/TiO2 catalysts from methanol: water mixtures under solar irradiation: A structure-activity correlation. Int. J. Hydrog. Energy 2010, 35, 3991–4001. [Google Scholar] [CrossRef]
  314. Fujishima, A.; Honda, K. Electrochemical photolysis of water at a semiconductor electrode. Nature 1972, 238, 37–38. [Google Scholar] [CrossRef] [PubMed]
  315. James, B.D.; Baum, G.N.; Perez, J.; Baum, K.N. Technoeconomic Analysis of Photoelectrochemical (PEC) Hydrogen Production; Office of Energy Efficiency and Renewable Energy: Washington, DC, USA, 2009.
  316. Zhang, J.; Zhang, L.; Liu, H.; Sun, A.; Liu, R.S. Electrochemical Technologies for Energy Storage and Conversion; Wiley: Hoboken, NY, USA, 2012. [Google Scholar]
  317. Chen, Q.; Fan, G.; Fu, H.; Li, Z.; Zou, Z. Tandem photoelectrochemical cells for solar water splitting. Adv. Phys. X 2018, 3, 863–884. [Google Scholar] [CrossRef] [Green Version]
  318. Acar, C.; Dincer, I. A review and evaluation of photoelectrode coating materials and methods for photoelectrochemical hydrogen production. Int. J. Hydrog. Energy 2016, 41, 7950–7959. [Google Scholar] [CrossRef]
  319. Choudhary, S.; Upadhyay, S.; Kumar, P.; Singh, N.; Satsangi, V.R.; Shrivastav, R.; Dass, S. Nanostructured bilayered thin films in photoelectrochemical water splitting—A review. Int. J. Hydrog. Energy 2012, 37, 18713–18730. [Google Scholar] [CrossRef]
  320. Miller, E.L.; Gaillard, N.; Kaneshiro, J.; DeAngelis, A.; Garland, R. Progress in new semiconductor materials classes for solar photoelectrolysis. Int. J. Energy Res. 2010, 34, 1215–1222. [Google Scholar] [CrossRef]
  321. Gan, J.; Lu, X.; Rajeeva, B.B.; Menz, R.; Tong, Y.; Zheng, Y. Efficient photoelectrochemical water oxidation over hydrogen-reduced nanoporous BiVO4 with Ni-B electrocatalyst. ChemElectroChem 2015, 2, 1385–1395. [Google Scholar] [CrossRef]
  322. Mishra, M.; Chun, D.M. α-Fe2O3 as a photocatalytic material: A review. Appl. Catal. A Gen. 2015, 498, 126–141. [Google Scholar] [CrossRef]
  323. Khaselev, O.; Turner, J.A. A monolithic photovoltaic-photoelectrochemical device for hydrogen production via water splitting. Science 1998, 280, 425–427. [Google Scholar] [CrossRef] [PubMed]
  324. Jiang, C.; Wu, J.; Moniz, S.J.A.; Guo, D.; Tang, M.; Jiang, Q.; Chen, S.; Liu, H.; Wang, A.; Zhang, T.; et al. Stabilization of GaAs photoanodes by in situ deposition of nickel-borate surface catalysts as hole trapping sites. Sustain. Energy Fuels 2019, 3, 814–822. [Google Scholar] [CrossRef] [Green Version]
  325. Fang, M.; Dong, G.; Wei, R.; Ho, J.C. Hierarchical nanostructures: Design for sustainable water splitting. Adv. Energy Mater. 2017, 7, 1–25. [Google Scholar]
  326. Joy, J.; Mathew, J.; George, S.C. Nanomaterials for photoelectrochemical water splitting—Review. Int. J. Hydrog. Energy 2018, 43, 4804–4817. [Google Scholar] [CrossRef]
  327. Zeng, Z.; Chen, S.; Tan, T.T.Y.; Xiao, F.X. Graphene quantum dots (GQDs) and its derivatives for multifarious photocatalysis and photoelectrocatalysis. Catal. Today 2018, 315, 171–183. [Google Scholar] [CrossRef]
  328. Kandi, D.; Martha, S.; Parida, K.M. Quantum dots as enhancer in photocatalytic hydrogen evolution: A review. Int. J. Hydrog. Energy 2017, 42, 9467–9481. [Google Scholar] [CrossRef]
  329. Ye, M.Y.; Zhao, Z.H.; Hu, Z.F.; Liu, L.Q.; Ji, H.M.; Shen, Z.R.; Ma, T.Y. 0D/2D heterojunctions of vanadate quantum dots/graphitic carbon nitride nanosheets for enhanced visible-light-driven photocatalysis. Angew. Chem. Int. Ed. 2017, 56, 8407–8411. [Google Scholar] [CrossRef] [Green Version]
  330. Lou, Y.; Chen, J. Recent developments in one dimensional (1D) nanostructured TiO2 for photoelectrochemical water splitting. Nanosci. Nanotechnol. Lett. 2014, 6, 361–371. [Google Scholar] [CrossRef]
  331. Zheng, G.; Wang, J.; Liu, H.; Murugadoss, V.; Zu, G.; Che, H.; Lai, C.; Li, H.; Ding, T.; Gao, Q.; et al. Tungsten oxide nanostructures and nanocomposites for photoelectrochemical water splitting. Nanoscale 2019, 11, 18968–18994. [Google Scholar] [CrossRef]
  332. Babu, V.J.; Vempati, S.; Uyar, T.; Ramakrishna, S. Review of one-dimensional and two-dimensional nanostructured materials for hydrogen generation. Phys. Chem. Chem. Phys. 2015, 17, 2960–2986. [Google Scholar] [CrossRef]
  333. Chen, J.; Guo, L. Size effect of one-dimensional nanostructures on bubble nucleation in water splitting. Appl. Phys. Lett. 2019, 115, 101602. [Google Scholar] [CrossRef]
  334. Faraji, M.; Yousefi, M.; Yousefzadeh, S.; Zirak, M.; Naseri, N.; Jeon, T.H.; Choi, W.; Moshfegh, A.Z. Two-dimensional materials in semiconductor photoelectrocatalytic systems for water splitting. Energy Environ. Sci. 2019, 12, 59–95. [Google Scholar] [CrossRef]
  335. Kusior, A.; Wnuk, A.; Trenczek-Zajac, A.; Zakrzewska, K.; Radecka, M. TiO2 nanostructures for photoelectrochemical cells (PECs). Int. J. Hydrog. Energy 2015, 40, 4936–4944. [Google Scholar] [CrossRef]
  336. Cai, M.; Fan, P.; Long, J.; Han, J.; Lin, Y.; Zhang, H.; Zhong, M. Large-scale tunable 3D self-supporting WO3 micro-nano architectures as direct photoanodes for efficient photoelectrochemical water splitting. ACS Appl. Mater. Interfaces 2017, 9, 17856–17864. [Google Scholar] [CrossRef] [PubMed]
  337. Han, H.; Riboni, F.; Karlicky, F.; Kment, S.; Goswami, A.; Sudhagar, P.; Yoo, J.; Wang, L.; Tomanec, O.; Petr, M.; et al. α-Fe2O3/TiO2 3D hierarchical nanostructures for enhanced photoelectrochemical water splitting. Nanoscale 2017, 9, 134–142. [Google Scholar] [CrossRef]
  338. Wu, F.; Cao, F.; Liu, Q.; Lu, H.; Li, L. Enhancing photoelectrochemical activity with three-dimensional p-CuO/n-ZnO junction photocathodes. Sci. China Mater. 2016, 59, 825–832. [Google Scholar] [CrossRef]
  339. Yan, H.; Wang, X.; Yao, M.; Yao, X. Band structure design of semiconductors for enhanced photocatalytic activity: The case of TiO2. Prog. Nat. Sci. Mater. Int. 2013, 23, 402–407. [Google Scholar] [CrossRef]
  340. Park, H.S.; Kweon, K.E.; Ye, H.; Paek, E.; Hwang, G.S.; Bard, A.J. Factors in the metal doping of BiVO4 for improved photoelectrocatalytic activity as studied by scanning electrochemical microscopy and first-principles density-functional calculation. J. Phys. Chem. C 2011, 115, 17870–17879. [Google Scholar] [CrossRef]
  341. Yousefi, M.; Alimard, P. Synthesis of M-Nd doped Fe3O4 nanoparticles (M=Co,Ce,Cr, Ni) with tunable magnetic properties. Bull. Chem. Soc. Ethiop. 2013, 27, 49–56. [Google Scholar]
  342. Ikeda, S.; Kawaguchi, T.; Higuchi, Y.; Kawasaki, N.; Harada, T.; Remeika, M.; Islam, M.M.; Sakurai, T. Effects of zirconium doping into a monoclinic scheelite BiVO4 crystal on its structural, photocatalytic, and photoelectrochemical properties. Front. Chem. 2018, 6, 266. [Google Scholar] [CrossRef]
  343. Dass, S.; Chaudhary, Y.S.; AgjrawaP, M.; Shrivastav, A.; Shhvastav, R.; Saisangi-, V.R. Nanostructured Mn-doped and undoped CuO thin films-PEC studies. Indian J. Phys 2004, 78, 229–231. [Google Scholar]
  344. Xu, H.M.; Wang, H.; Shi, J.; Lin, Y.; Nan, C. Photoelectrochemical performance observed in Mn-doped BiFeO3 heterostructured thin films. Nanomaterials 2016, 6, 215. [Google Scholar] [CrossRef] [Green Version]
  345. Liu, S.-Y.; Sheu, J.K.; Lin, Y.-C.; Tu, S.J.; Huang, F.W.; Lee, M.L.; Lai, W.C. Mn-doped GaN as photoelectrodes for the photoelectrolysis of water under visible light. Opt. Express 2012, 20, A678–A683. [Google Scholar] [CrossRef]
  346. Zhang, T.; Zhu, Z.; Chen, H.; Bai, Y.; Xiao, S.; Zheng, X.; Xue, Q.; Yang, S. Iron-doping-enhanced photoelectrochemical water splitting performance of nanostructured WO3: A combined experimental and theoretical study. Nanoscale 2015, 7, 2933–2940. [Google Scholar] [CrossRef]
  347. Kong, D.; Qi, J.; Liu, D.; Zhang, X.; Pan, L.; Zou, J. Ni-doped BiVO4 with V4+ species and oxygen vacancies for efficient photoelectrochemical water splitting. Trans. Tianjin Univ. 2019, 25, 340–347. [Google Scholar] [CrossRef] [Green Version]
  348. Jakub, Z.; Hulva, J.; Mirabella, F.; Kraushofer, F.; Meier, M.; Bliem, R.; Diebold, U.; Parkinson, G.S. Nickel doping enhances the reactivity of Fe3O4(001) to water. J. Phys. Chem.C 2019, 123, 15038–15045. [Google Scholar] [CrossRef]
  349. Tayebi, M.; Tayyebi, A.; Lee, B.K. Improved photoelectrochemical performance of molybdenum (Mo)-doped monoclinic bismuth vanadate with increasing donor concentration. Catal. Today 2019, 328, 35–42. [Google Scholar] [CrossRef]
  350. Kalanur, S.S.; Seo, H. Influence of molybdenum doping on the structural, optical and electronic properties of WO3 for improved solar water splitting. J. Colloid Interface Sci. 2018, 509, 440–447. [Google Scholar] [CrossRef] [PubMed]
  351. Wang, J.; Tafen, D.N.; Lewis, J.P.; Hong, Z.; Manivannan, A.; Zhi, M.; Li, M.; Wu, N. Origin of photocatalytic activity of nitrogen-doped TiO2 nanobelts. J. Am. Chem. Soc. 2009, 131, 12290–12297. [Google Scholar] [CrossRef] [PubMed]
  352. Tayyebi, A.; Soltani, T.; Lee, B.K.; Outokesh, M.; Tayebi, M. Novel visible light photocatalytic and photoelectrochemical (PEC) activity of carbon-doped zinc oxide/reduced graphene oxide: Supercritical methanol synthesis with enhanced photocorrosion suppression. J. Alloys Compd. 2017, 723, 1001–1010. [Google Scholar] [CrossRef]
  353. Khan, A.; Ahmed, M.I.; Adam, A.; Azad, A.M.; Qamar, M. A novel fabrication methodology for sulfur-doped ZnO nanorods as an active photoanode for improved water oxidation in visible-light regime. Nanotechnology 2017, 28, 1–9. [Google Scholar] [CrossRef] [PubMed]
  354. Zhang, R.; Fang, Y.; Chen, T.; Qu, F.-L.; Liu, Z.; Du, G.; Asiri, A.M.; Gao, T.; Sun, X. Enhanced photoelectrochemical water oxidation performance of Fe2O3 nanorods array by S doping. ACS Sustain. Chem. Eng. 2017, 5, 7502–7506. [Google Scholar] [CrossRef]
  355. Sharma, A.; Chakraborty, M.; Anwar, Z.; Sahoo, P.; Thangavel, R. Structural, Optical and Photoelectrochemical Properties of Trivalent Impurity (B3+) Doped ZnO Nanorods Grown by Facile Hydrothermal Technique. In Proceedings of the International Conference on Energy, Communication, Data Analytics and Soft Computing, ICECDS 2017, Chennai, India, 1–2 August 2017; pp. 2491–2493. [Google Scholar]
  356. Kang, X.; Liu, S.; Dai, Z.; He, Y.; Song, X.; Tan, Z. Titanium Dioxide: From Engineering to Applications. Catalysts 2019, 9, 191. [Google Scholar] [CrossRef] [Green Version]
  357. Mao, S.S.; Shen, S.; Guo, L. Nanomaterials for renewable hydrogen production, storage and utilization. Prog. Nat. Sci. Mater. Int. 2012, 22, 522–534. [Google Scholar] [CrossRef] [Green Version]
  358. Wang, G.; Ling, Y.; Wang, H.; Xihong, L.; Li, Y. Chemically modified nanostructures for photoelectrochemical water splitting. J. Photochem. Photobiol. C Photochem. Rev. 2014, 18, 35–51. [Google Scholar] [CrossRef]
  359. Zhang, X.; Liu, Y.; Kang, Z. 3D branched ZnO nanowire arrays decorated with plasmonic Au nanoparticles for high-performance photoelectrochemical water splitting. Acs Appl. Mater. Interfaces 2014, 6, 4480–4489. [Google Scholar] [CrossRef]
  360. Wu, N. Plasmonic metal-semiconductor photocatalysts and photoelectrochemical cells: A review. Nanoscale 2018, 10, 2679–2696. [Google Scholar] [CrossRef]
  361. Xiao, F.X.; Liu, B. Plasmon-dictated photo-electrochemical water splitting for solar-to-chemical energy conversion: Current status and future perspectives. Adv. Mater. Interfaces 2018, 5, 1–21. [Google Scholar] [CrossRef]
  362. Yu, Z.; Li, F.; Sun, L. Recent advances in dye-sensitized photoelectrochemical cells for solar hydrogen production based on molecular components. Energy Environ. Sci. 2015, 8, 760–775. [Google Scholar] [CrossRef]
  363. Li, F.; Fan, K.; Xu, B.; Gabrielsson, E.; Daniel, Q.; Li, L.; Sun, L. Organic dye-sensitized tandem photoelectrochemical cell for light driven total water splitting. J. Am. Chem. Soc. 2015, 137, 9153–9159. [Google Scholar] [CrossRef]
  364. Swierk, J.R.; Mallouk, T.E. Design and development of photoanodes for water-splitting dye-sensitized photoelectrochemical cells. Chem. Soc. Rev. 2013, 42, 2357–2387. [Google Scholar] [CrossRef] [PubMed]
  365. Swierk, J.R.; Méndez-Hernández, D.D.; McCool, N.S.; Liddell, P.; Terazono, Y.; Pahk, I.; Tomlin, J.J.; Oster, N.V.; Moore, T.A.; Moore, A.L.; et al. Metal-free organic sensitizers for use in water-splitting dye-sensitized photoelectrochemical cells. Proc. Natl. Acad. Sci. USA 2015, 112, 1681–1686. [Google Scholar] [CrossRef] [PubMed] [Green Version]
  366. Youngblood, J.W.; Lee, S.H.A.; Kobayashi, Y.; Hernandez-Pagan, E.A.; Hoertz, P.G.; Moore, T.A.; Moore, A.L.; Gust, D.; Mallouk, T.E. Photoassisted overall water splitting in a visible light-absorbing dye-sensitized photoelectrochemical cell. J. Am. Chem. Soc. 2009, 131, 926–927. [Google Scholar] [CrossRef] [PubMed]
  367. Zhang, L.; Gao, Y.; Ding, X.; Yu, Z.; Sun, L. High-performance photoelectrochemical cells based on a binuclear ruthenium catalyst for visible-light-driven water oxidation. ChemSusChem 2014, 7, 2801–2804. [Google Scholar] [CrossRef]
  368. Li, X.; Liu, A.; Chu, D.; Zhang, C.; Du, Y.; Huang, J.; Yang, P. High performance of manganese porphyrin sensitized p-type CuFe2O4 photocathode for solar water splitting to produce hydrogen in a tandem photoelectrochemical cell. Catalysts 2018, 8, 108. [Google Scholar] [CrossRef] [Green Version]
  369. Thorne, J.E.; Zhao, Y.; He, D.; Fan, S.; Vanka, S.; Mi, Z.; Wang, D. Understanding the role of co-catalysts on silicon photocathodes using intensity modulated photocurrent spectroscopy. Phys. Chem. Chem. Phys. 2017, 19, 29653–29659. [Google Scholar] [CrossRef]
  370. Li, D.; Shi, J.; Li, C. Transition-metal-based electrocatalysts as cocatalysts for photoelectrochemical water splitting: A mini review. Small 2018, 14, 1–22. [Google Scholar] [CrossRef]
  371. Xu, X.-T.; Pan, L.; Zhang, X.; Wang, L.; Zou, J.-J. Rational design and construction of cocatalysts for semiconductor-based photo-electrochemical oxygen evolution: A comprehensive review. Adv. Sci. 2019, 6, 1801505. [Google Scholar] [CrossRef]
  372. Song, J.T.; Iwasaki, T.; Hatano, M. Pt co-catalyst effect on photoelectrochemical properties of 3C-SiC photo-anode. Jpn. J. Appl. Phys. 2014, 53, 2–6. [Google Scholar] [CrossRef]
  373. Haschke, S.; Zhuo, Y.; Schlicht, S.; Barr, M.K.S.; Kloth, R.; Dufond, M.E.; Santinacci, L.; Bachmann, J. Enhanced oxygen evolution reaction activity of nanoporous SnO2/Fe2O3/IrO2 thin film composite electrodes with ultralow noble metal loading. Adv. Mater. Interfaces 2019, 6, 1–8. [Google Scholar]
  374. Lee, Y.; Suntivich, J.; May, K.J.; Perry, E.E.; Shao-Horn, Y. Synthesis and activities of rutile IrO2 and RuO2 nanoparticles for oxygen evolution in acid and alkaline solutions. J. Phys. Chem. Lett. 2012, 3, 399–404. [Google Scholar] [CrossRef] [PubMed]
  375. Han, J.; An, H.J.; Kim, T.-W.; Lee, K.-Y.; Kim, H.J.; Kim, Y.; Chae, H.-J. Effect of structure-controlled ruthenium oxide by nanocasting in electrocatalytic oxygen and chlorine evolution reactions in acidic conditions. Catalysts 2019, 9, 549. [Google Scholar] [CrossRef] [Green Version]
  376. Peerakiatkhajohn, P.; Yun, J.-H.; Wang, S.; Wang, L. Review of recent progress in unassisted photoelectrochemical water splitting: From material modification to configuration design. J. Photonics Energy 2016, 7, 1–21. [Google Scholar] [CrossRef]
  377. Dong, G.; Hu, H.; Huang, X.; Zhang, Y.; Bi, Y. Rapid activation of Co3O4 cocatalysts with oxygen vacancies on TiO2 photoanodes for efficient water splitting. J. Mater. Chem. A 2018, 6, 21003–21009. [Google Scholar] [CrossRef]
  378. Wan, X.; Su, J.; Guo, L. Enhanced photoelectrochemical water oxidation on BiVO4 with mesoporous cobalt nitride sheets as oxygen-evolution cocatalysts. Eur. J. Inorg. Chem. 2018, 2018, 2557–2563. [Google Scholar] [CrossRef]
  379. Zhang, W.; Li, R.; Zhao, X.; Chen, Z.; Law, A.W.K.; Zhou, K. A cobalt-based metal–organic framework as cocatalyst on BiVO4 photoanode for enhanced photoelectrochemical water oxidation. ChemSusChem 2018, 11, 2710–2716. [Google Scholar] [CrossRef]
  380. Dang, K.; Wang, T.; Li, C.; Zhang, J.; Liu, S.; Gong, J. Improved oxygen evolution kinetics and surface states passivation of Ni-Bi co-catalyst for a hematite photoanode. Engineering 2017, 3, 285–289. [Google Scholar] [CrossRef]
  381. Xu, D.; Fu, Z.; Wang, D.; Lin, Y.; Sun, Y.; Meng, D.; Feng Xie, T. A Ni(OH)2-modified Ti-doped α-Fe2O3 photoanode for improved photoelectrochemical oxidation of urea: The role of Ni(OH)2 as a cocatalyst. Phys. Chem. Chem. Phys. 2015, 17, 23924–23930. [Google Scholar] [CrossRef]
  382. Rosser, T.E.; Gross, M.A.; Lai, Y.H.; Reisner, E. Precious-metal free photoelectrochemical water splitting with immobilised molecular Ni and Fe redox catalysts. Chem. Sci. 2016, 7, 4024–4035. [Google Scholar] [CrossRef] [Green Version]
  383. Guan, H.; Zhang, S.; Cai, X.; Gao, Q.; Yu, X.; Zhou, X.; Peng, F.; Fang, Y.; Yang, S. CdS@Ni3S2 core-shell nanorod arrays on nickel foam: A multifunctional catalyst for efficient electrochemical catalytic, photoelectrochemical and photocatalytic H2 production reaction. J. Mater. Chem. A 2019, 7, 2560–2574. [Google Scholar] [CrossRef]
  384. Fan, R.; Cheng, S.; Huang, G.; Wang, Y.; Zhang, Y.; Vanka, S.; Botton, G.A.; Mi, Z.; Shen, M. Unassisted solar water splitting with 9.8% efficiency and over 100 h stability based on Si solar cells and photoelectrodes catalyzed by bifunctional Ni-Mo/Ni. J. Mater. Chem. A 2019, 7, 2200–2209. [Google Scholar] [CrossRef]
  385. Van de Krol, R.; Grätzel, M. Photoelectrochemical Hydrogen Production; Springer: Berlin/Heidelberg, Germany, 2011. [Google Scholar]
  386. Young, J.L.; Steiner, M.A.; Döscher, H.; France, R.M.; Turner, J.A.; Deutsch, T.G. Direct solar-to-hydrogen conversion via inverted metamorphic multi-junction semiconductor architectures. Nat. Energy 2017, 2, 17028. [Google Scholar] [CrossRef]
  387. Rocheleau, R.E.; Miller, E.L.; Misra, A. High-efficiency photoelectrochemical hydrogen production using multijunction amorphous silicon photoelectrodes. Energy Fuels 1998, 12, 3–10. [Google Scholar] [CrossRef]
  388. Licht, S.; Wang, B.; Mukerji, S.; Soga, T.; Umeno, M.; Tributsch, H. Over 18% solar energy conversion to generation of hydrogen fuel; theory and experiment for efficient solar water splitting. Int. J. Hydrog. Energy 2001, 26, 653–659. [Google Scholar] [CrossRef]
  389. Fountaine, K.T.; Lewerenz, H.J.; Atwater, H.A. Efficiency limits for photoelectrochemical water-splitting. Nat. Commun. 2016, 7, 1–9. [Google Scholar] [CrossRef]
  390. Ipek, B.; Uner, D. Artificial Photosynthesis from a Chemical Engineering Perspective. In Artificial Photosynthesis; IntechOpen: London, UK, 2012; pp. 13–36. [Google Scholar]
  391. Arifin, K.; Majlan, E.H.; Wan Daud, W.R.; Kassim, M.B. Bimetallic complexes in artificial photosynthesis for hydrogen production: A review. Int. J. Hydrog. Energy 2012, 37, 3066–3087. [Google Scholar] [CrossRef]
  392. Bard, A.J. Photoelectrochemistry and heterogeneous photo-catalysis at semiconductors. J. Photochem. 1979, 10, 59–75. [Google Scholar] [CrossRef]
  393. Wang, Z.; Li, C.; Domen, K. Recent developments in heterogeneous photocatalysts for solar-driven overall water splitting. Chem. Soc. Rev. 2019, 48, 2109–2125. [Google Scholar] [CrossRef]
  394. Wang, Y.; Suzuki, H.; Xie, J.; Tomita, O.; Martin, D.J.; Higashi, M.; Kong, D.; Abe, R.; Tang, J. Mimicking natural photosynthesis: Solar to renewable H2 fuel synthesis by z-scheme water splitting systems. Chem. Rev. 2018, 118, 5201–5241. [Google Scholar] [CrossRef] [Green Version]
  395. Bard, A.J.; Fox, M.A. Artificial photosynthesis: Solar splitting of water to hydrogen and oxygen. Acc. Chem. Res. 1995, 28, 141–145. [Google Scholar] [CrossRef]
  396. Kato, H.; Sasaki, Y.; Shirakura, N.; Kudo, A. Synthesis of highly active rhodium-doped SrTiO3 powders in Z-scheme systems for visible-light-driven photocatalytic overall water splitting. J. Mater. Chem. A 2013, 1, 12327–12333. [Google Scholar] [CrossRef]
  397. Kato, H.; Hori, M.; Konta, R.; Shimodaira, Y.; Kudo, A. Construction of Z-Scheme type heterogeneous photocatalysis systems for water splitting into H2 and O2 under visible light irradiation. Chem. Lett. 2004, 33, 1348–1349. [Google Scholar] [CrossRef]
  398. Sasaki, Y.; Iwase, A.; Kato, H.; Kudo, A. The effect of co-catalyst for z-scheme photocatalysis systems with an Fe3+/Fe2+ electron mediator on overall water splitting under visible light irradiation. J. Catal. 2008, 259, 133–137. [Google Scholar] [CrossRef]
  399. Sayama, K.; Mukasa, K.; Abe, R.; Hironori, A. A new photocatalytic water splitting system under visible light irradiation mimicking a z-scheme mechanism in photosynthesis. J. Photochem. Photobiol. A Chem. 2002, 148, 71–77. [Google Scholar] [CrossRef]
  400. Sekizawa, K.; Maeda, K.; Domen, K.; Koike, K.; Ishitani, O. Artificial Z-scheme constructed with a supramolecular metal complex and semiconductor for the photocatalytic reduction of CO2. J. Am. Chem. Soc. 2013, 135, 4596–4599. [Google Scholar] [CrossRef]
  401. Wang, J.; Shen, H.; Dai, X.; Li, C.; Shi, W.; Yan, Y. Graphene oxide as solid-state electron mediator enhanced photocatalytic activities of GO-Ag3PO4/Bi2O3 Z-scheme photocatalyst efficiently by visible-light driven. Mater. Technol. 2018, 33, 421–432. [Google Scholar] [CrossRef]
  402. Iwase, A.; Ng, Y.H.; Ishiguro, Y.; Kudo, A.; Amal, R. Reduced graphene oxide as a solid-state electron mediator in Z-scheme photocatalytic water splitting under visible light. J. Am. Chem. Soc. 2011, 133, 11054–11057. [Google Scholar] [CrossRef]
  403. Xia, X.; Song, M.; Wang, H.; Zhang, X.; Sui, N.; Zhang, Q.; Colvin, V.L.; Yu, W.W. Latest progress in constructing solid-state Z scheme photocatalysts for water splitting. Nanoscale 2019, 11, 11071–11082. [Google Scholar] [CrossRef]
  404. Winkler, M.; Kawelke, S.; Happe, T. Light driven hydrogen production in protein based semi-artificial systems. Bioresour. Technol. 2011, 102, 8493–8500. [Google Scholar] [CrossRef]
  405. Kornienko, N.; Zhang, J.Z.; Sakimoto, K.K.; Yang, P.; Reisner, E. Interfacing nature’s catalytic machinery with synthetic materials for semi-artificial photosynthesis. Nat. Nanotechnol. 2018, 13, 890–899. [Google Scholar] [CrossRef]
  406. Lee, C.Y.; Zou, J.; Bullock, J.; Wallace, G.G. Emerging approach in semiconductor photocatalysis: Towards 3D architectures for efficient solar fuels generation in semi-artificial photosynthetic systems. J. Photochem. Photobiol. C Photochem. Rev. 2019, 39, 142–160. [Google Scholar] [CrossRef]
  407. Honda, Y.; Hagiwara, H.; Ida, S.; Ishihara, T. Application to photocatalytic H2 production of a whole-cell reaction by recombinant Escherichia coli cells expressing [FeFe]-hydrogenase and maturases genes. Angew. Chem. Int. Ed. 2016, 55, 8045–8048. [Google Scholar] [CrossRef] [PubMed]
  408. Tachibana, Y.; Vayssieres, L.; Durrant, J.R. Artificial photosynthesis for solar water-splitting. Nat. Photonics 2012, 6, 511–518. [Google Scholar] [CrossRef]
  409. IEA Hydrogen Project Database. Available online: ieahydrogen.org/Activities/National-Projects-%281%29/Netherlands/NL-Power-Plant-Delfzijl.aspx (accessed on 1 December 2019).
  410. Krogsgaard, J.; Løkke, J.A. Regarding Potential Large Scale Energy Storage Project in Fredericia, Denmark; NEL: Oslo, Norway, 2017. [Google Scholar]
  411. Ipek, B.; Uner, D. Construction begins on Fukushima hydrogen energy research Fieldfuel. Cells Bull. 2018, 2018, 9. [Google Scholar]
  412. H2V. Projet H2V59-Usine de Production D’hydrogène Vert Dans les Hauts-de-France et Son Raccordement Électrique; H2V: Paris, France, 2019. [Google Scholar]
  413. Marcuello, P.; Embid, D.; Albertín, E.; García, G. Improvements to integrate high pressure alkaline electrolyzers for electricity/H2 production from renewable energies to balance the GRID—ELYGRID project. In Proceedings of the 20th World Hydrogen Energy Conference, WHEC 2014, Gwangju, Korea, 15–20 June 2014; pp. 13–18. [Google Scholar]
  414. Kolb, T.; Kleinschmidt, R.; Freytag, K. Windgas for the Energy Transition: Uniper Lays Cornerstone for Methanation Plant 2017. Available online: https://www.storeandgo.info/fileadmin/press_releases/20160705_PM_Grundstein_Falkenhagen_StoreGo_ENG.pdf (accessed on 1 December 2019).
  415. Arnone, D.; Arcaya, A.D.; Caldarola, C.G.; Guenoux, L.; Rossi, A.; Vaes, J. INGRID Project-High-Capacity Hydrogen-Based Green-Energy Storage Solutions for Grid Balancing; Deutscher Industrieverlag GmbH: Munich, Germany, 2016. [Google Scholar]
  416. Skøtt, A.T. Bakterier Kan Lave Brint og Kuldioxid om til Metangas 2016. Available online: http://biocat-project.com/wp-content/uploads/2016/09/Article-from-grand-opening.pdf (accessed on 1 December 2019).
  417. Hassl, M. Wasserstoff-Initiative bei MPREIS in Völs. 2019. Available online: https://www.green-energy-center.com/wp-content/uploads/2019/10/19-10-19-BEZIRKSBLATT-Wasserstoff-Initiative-bei-MPREIS-in-Völs-Westliches-Mittelgebirge.pdf (accessed on 1 December 2019).
  418. ZePros News. RTE et GRTgaz Accélèrent le Développement de Solutions Multi-Énergies Pour Les Territoires. 2017. Available online: http://www.grtgaz.com/medias/communiques-de-presse/rte-et-grtgaz-accelerent-le-developpement-de-solutions-multi-energies-pour-les-territoires.html (accessed on 1 December 2019).
  419. Power-To-Gas: McPhy delivers 4 MW of H2 Production Units to China’s Hebei Province and Strengthens its Position for Multi-MW International Projects. Available online: https://mcphy.com/en/press-releases/power_to_gas_mcphy_hebei_delivery/ (accessed on 1 December 2019).
  420. Hydrogenics selected for 2 MW Ontario energy storage facility. Fuel Cells Bull. 2014, 8, 9. [CrossRef]
  421. Canadian multi-MW P2G facility enters service. Fuel Cells Bull. 2018, 7, 1. [CrossRef]
  422. Hydrogenics links with StratosFuel on 2.5 MW California project. Fuel Cells Bull. 2016, 11, 7–8. [CrossRef]
  423. Liu, Z.; Kendall, K.; Yan, X. China progress on renewable energy vehicles: Fuel cells, hydrogen and battery hybrid vehicles. Energies 2019, 12, 54. [Google Scholar] [CrossRef] [Green Version]
  424. Kopp, M.; Coleman, D.; Stiller, C.; Scheffer, K.; Aichinger, J.; Scheppat, B. Energiepark Mainz: Technical and economic analysis of the worldwide largest Power-to-Gas plant with PEM electrolysis. Int. J. Hydrog. Energy 2017, 42, 13311–13320. [Google Scholar] [CrossRef]
  425. Sampson, J. H&R Inaugurates World’s Largest Dynamic Hydrogen Electrolysis Plant. Available online: https://www.gasworld.com/handr-inaugurates-hydrogen-electrolysis-plant-/2013848.article (accessed on 1 December 2019).
  426. Petersen, N.H.; Geitmann, S. H2 International Wind Power Boosts Hydrogen Transportation. Available online: https://www.h2-international.com/2019/03/11/wind-power-boosts-hydrogen-transportation/ (accessed on 1 December 2019).
  427. Voestalpine, A.G.; VERBUND. Siemens European Commission Funds H2FUTURE Project. 2017. Available online: https://www.h2future-project.eu/images/news/H2FUTURE-Press-Release-070217.pdf (accessed on 1 December 2019).
  428. Zeese, J. Launch of Refhyne, Word’s Largest Electrolysis Plant in Rhineland Refinery. Available online: https://www.fch.europa.eu/news/launch-refhyne-worlds-largest-electrolysis-plant-rhineland-refinery (accessed on 1 December 2019).
  429. Bellini, E. ITM Power Plans 100 MW Power-To-Gas Storage Project in the UK. Available online: https://www.pv-magazine.com/2018/10/01/itm-power-plans-100-mw-power-to-gas-storage-project-in-the-uk/ (accessed on 1 December 2019).
  430. Tichler, R.; Lehner, M.; Steinmüller, H.; Koppe, M. Power-To-Gas: Technology and Business Models; Springer: Berlin/Heidelberg, Germany, 2014. [Google Scholar]
  431. Sunfire supplies Boeing with largest reversible solid oxide electrolyser/fuel cell System. Cells Bull. 2016, 2016, 1. [CrossRef]
  432. GrinHy project demos high-temp Electrolysis. fuel Cells Bull. 2016, 2016, 10. [CrossRef]
  433. First Commercial Plant for the Production of Blue Crude Planned in Norway. Available online: https://www.sunfire.de/en/company/news/detail/first-commercial-plant-for-the-production-of-blue-crude-planned-in-norway (accessed on 1 December 2019).
  434. Kim, K.N.; Lee, S.H.; Kim, H.; Park, Y.H.; In, S. Improved microbial electrolysis cell hydrogen production by hybridization with a TiO2 nanotube array photoanode. Energies 2018, 11, 3184. [Google Scholar] [CrossRef] [Green Version]
  435. Escapa, A.; Mateos, R.; Martínez, E.J.; Blanes, J. Microbial electrolysis cells: An emerging technology for wastewater treatment and energy recovery. From laboratory to pilot plant and beyond. Renew. Sustain. Energy Rev. 2016, 55, 942–956. [Google Scholar] [CrossRef]
  436. Rader, G.K.; Logan, B.E. Multi-electrode continuous flow microbial electrolysis cell for biogas production from acetate. Int. J. Hydrog. Energy 2010, 35, 8848–8854. [Google Scholar] [CrossRef]
  437. Cusick, R.D.; Bryan, B.; Parker, D.S.; Merrill, M.D.; Mehanna, M.; Kiely, P.D.; Liu, G.; Logan, B.E. Performance of a pilot-scale continuous flow microbial electrolysis cell fed winery wastewater. Appl. Microbiol. Biotechnol. 2011, 89, 2053–2063. [Google Scholar] [CrossRef]
  438. Heidrich, E.S.; Dolfing, J.; Scott, K.; Edwards, S.R.; Jones, C.; Curtis, T.P. Production of hydrogen from domestic wastewater in a pilot-scale microbial electrolysis cell. Appl. Microbiol. Biotechnol. 2013, 97, 6979–6989. [Google Scholar] [CrossRef]
  439. Heidrich, E.S.; Edwards, S.R.; Dolfing, J.; Cotterill, S.E.; Curtis, T.P. Performance of a pilot scale microbial electrolysis cell fed on domestic wastewater at ambient temperatures for a 12 month period. Bioresour. Technol. 2014, 173, 87–95. [Google Scholar] [CrossRef] [Green Version]
  440. Cotterill, S.E.; Dolfing, J.; Curtis, T.P.; Heidrich, E.S. Community assembly in wastewater-fed pilot-scale microbial electrolysis cells. Front. Energy Res. 2018, 6, 98. [Google Scholar] [CrossRef]
  441. Miller, E.L.; Garland, R.; Peterson, D. Photoelectrochemical Hydrogen Production: DOE PEC Working Group Overview; Hawaii Natural Energy Institute University of Hawaii at Manoa: Honolulu, HI, USA, 2011. [Google Scholar]
  442. Miller, E.L. IEA-HIA Task 26 Research and Development Progress in Renewable Hydrogen Production Through Photoelectrochemical Water Splitting. Energy Procedia 2012, 29, 438–444. [Google Scholar] [CrossRef] [Green Version]
  443. Rothschild, A.; Dotan, H. Beating the efficiency of photovoltaics-powered electrolysis with tandem cell photoelectrolysis. ACS Energy Lett. 2017, 2, 45–51. [Google Scholar] [CrossRef]
  444. Abdi, F.F.; Jang, J.; Ma, Y.; Ahmet, I.; van de Krol, R.; Stannowski, B.; Mayer, M.; Son, M.-K.; Rothschild, A.; Dotan, H.; et al. Photoelectrochemical Demonstrator Device for Solar Hydrogen Generation; Helmholtz-Zentrum Berlin: Berlin, Germany, 2013. [Google Scholar]
  445. Van De Krol, R. Project Final Report. 2016. Available online: https://cordis.europa.eu/project/id/621252/reporting (accessed on 1 December 2019).
  446. Goto, Y.; Hisatomi, T.; Wang, Q.; Higashi, T.; Ishikiriyama, K.; Maeda, T.; Sakata, Y.; Okunaka, S.; Tokudome, H.; Katayama, M.; et al. A particulate photocatalyst water-splitting panel for large-scale solar hydrogen generation. Joule 2018, 2, 509–520. [Google Scholar] [CrossRef] [Green Version]
  447. Yamada, T.; Domen, K. Development of sunlight driven water splitting devices towards future artificial photosynthetic industry. Chem. Eng. 2018, 2, 36. [Google Scholar] [CrossRef] [Green Version]
  448. Saladini, F.; Patrizi, N.; Pulselli, F.M.; Marchettini, N.; Bastianoni, S. Guidelines for emergy evaluation of first, second and third generation biofuels. Renew. Sustain. Energy Rev. 2016, 66, 221–227. [Google Scholar] [CrossRef]
  449. Johnson, E. Goodbye to carbon neutral: Getting biomass footprints right. Environ. Impact Assess. Rev. 2009, 29, 165–168. [Google Scholar] [CrossRef]
  450. Demirbas, A. Biofuels sources, biofuel policy, biofuel economy and global biofuel projections. Energy Convers. Manag. 2008, 49, 2106–2116. [Google Scholar] [CrossRef]
  451. Buceti, G. Sustainable power density in electricity generation. Manag. Environ. Qual. Int. J. 2014, 25, 5–18. [Google Scholar] [CrossRef]
  452. Vassilev, S.V.; Vassileva, C.G.; Vassilev, V.S. Advantages and disadvantages of composition and properties of biomass in comparison with coal: An overview. Fuel 2015, 158, 330–350. [Google Scholar] [CrossRef]
  453. Kopyscinski, J.; Schildhauer, T.J.; Biollaz, S.M.A. Production of synthetic natural gas (SNG) from coal and dry biomass - A technology review from 1950 to 2009. Fuel 2010, 89, 1763–1783. [Google Scholar] [CrossRef]
  454. Basu, P. Gasification theory and modeling of gasifiers. In Biomass Gasification Design Handbook; Elsevier: Amsterdam, The Netherlands, 2010; pp. 117–165. [Google Scholar]
  455. Peter, M. Energy production from biomass (part 1): Overview of biomass. Bioresour. Technol. 2001, 83, 37–46. [Google Scholar]
  456. Svoboda, K.; Martinec, J.; Pohořelý, M.; Baxter, D. Integration of biomass drying with combustion/gasification technologies and minimization of emissions of organic compounds. Chem. Pap. 2009, 63, 15–25. [Google Scholar] [CrossRef]
  457. Hernández, J.J.; Aranda-Almansa, G.; Bula, A. Gasification of biomass wastes in an entrained flow gasifier: Effect of the particle size and the residence time. Fuel Process. Technol. 2010, 91, 681–692. [Google Scholar] [CrossRef]
  458. Wang, Z.; Yang, J.; Li, Z.; Xiang, Y. Syngas composition study. Front. Energy Power Eng. China 2009, 3, 369–372. [Google Scholar] [CrossRef]
  459. Lv, P.M.; Xiong, Z.H.; Chang, J.; Wu, C.Z.; Chen, Y.; Zhu, J.X. An experimental study on biomass air-steam gasification in a fluidized bed. Bioresour. Technol. 2004, 95, 95–101. [Google Scholar] [CrossRef] [PubMed]
  460. Vuthaluru, H.B.; Zhang, D.K.; Linjewile, T.M. Behaviour of inorganic constituents and ash characteristics during fluidized-bed combustion of several Australian low-rank coals. Fuel Process. Technol. 2000, 67, 165–176. [Google Scholar] [CrossRef]
  461. Arvelakis, S.; Koukios, E.G. Physicochemical upgrading of agroresidues as feedstocks for energy production via thermochemical conversion methods. Biomass Bioenergy 2002, 22, 331–348. [Google Scholar] [CrossRef]
  462. Arvelakis, S.; Gehrmann, H.; Beckmann, M.; Koukios, E.G. Preliminary results on the ash behavior of peach stones during fluidized bed gasification: Evaluation of fractionation and leaching as pre-treatments. Biomass Bioenergy 2005, 28, 331–338. [Google Scholar] [CrossRef]
  463. Arvelakis, S.; Gehrmann, H.; Beckmann, M.; Koukios, E.G. Agglomeration problems during fluidized bed gasification of olive-oil residue: Evaluation of fractionation and leaching as pre-treatments. Fuel 2003, 82, 1261–1270. [Google Scholar] [CrossRef]
  464. Arvelakis, S.; Vourliotis, P.; Kakaras, E.; Koukios, E.G. Effect of leaching on the ash behavior of wheat straw and olive residue during fluidized bed combustion. Biomass Bioenergy 2001, 20, 459–470. [Google Scholar] [CrossRef]
  465. Chen, W.H.; Peng, J.; Bi, X.T. A state-of-the-art review of biomass torrefaction, densification and applications. Renew. Sustain. Energy Rev. 2015, 44, 847–866. [Google Scholar] [CrossRef]
  466. Svoboda, K.; Pohořelý, M.; Hartman, M.; Martinec, J. Pretreatment and feeding of biomass for pressurized entrained flow gasification. Fuel Process. Technol. 2009, 90, 629–635. [Google Scholar] [CrossRef]
  467. Sokhansanj, S. Cost Benefit of Biomass Supply and Pre-Processing; BIOCAP Canada Foundation: Kingston, ON, Canada, 2006. [Google Scholar]
  468. Axelsson, L.; Franzén, M.; Ostwald, M.; Berndes, G.; Lakshmi, G.; Ravindranath, N.H. A review of biomass densification systems to develop uniform feedstock commodities for bioenergy application. Biofuels Bioprod. Biorefin. 2012, 6, 246–256. [Google Scholar] [CrossRef]
  469. Jouhara, H.; Ahmad, D.; van den Boogaert, I.; Katsou, E.; Simons, S.; Spencer, N. Pyrolysis of domestic based feedstock at temperatures up to 300 °C. Therm. Sci. Eng. Prog. 2018, 5, 117–143. [Google Scholar] [CrossRef]
  470. Zeng, K.; Gauthier, D.; Minh, D.P.; Weiss-Hortala, E.; Nzihou, A.; Flamant, G. Characterization of solar fuels obtained from beech wood solar pyrolysis. Fuel 2017, 188, 285–293. [Google Scholar] [CrossRef] [Green Version]
  471. Widyawati, M.; Church, T.L.; Florin, N.H.; Harris, A.T. Hydrogen synthesis from biomass pyrolysis with in situ carbon dioxide capture using calcium oxide. Int. J. Hydrog. Energy 2011, 36, 4800–4813. [Google Scholar] [CrossRef]
  472. Basu, P. Chapter 5—Pyrolysis. In Biomass Gasification, Pyrolysis and Torrefaction, 2nd ed.; Elsevier: Amsterdam, The Netherlands, 2013; pp. 147–176. [Google Scholar]
  473. Yadav, K.; Jagadevan, S. Influence of Process Parameters on Synthesis of Biochar by Pyrolysis of Biomass: An Alternative Source of Energy; IntechOpen: London, UK, 2019. [Google Scholar]
  474. Zhang, Z.; Bei, H.; Li, H.; Li, X.; Gao, X. Understanding the co-pyrolysis behavior of indonesian oil sands and corn straw. Energy Fuels 2017, 31, 2538–2547. [Google Scholar] [CrossRef]
  475. Hu, X.; Gholizadeh, M. Biomass pyrolysis: A review of the process development and challenges from initial researches up to the commercialisation stage. J. Energy Chem. 2019, 39, 109–143. [Google Scholar] [CrossRef] [Green Version]
  476. Bridgwater, T. Review biomass for energy. J. Sci. Food Agric. 2006, 86, 1755–1768. [Google Scholar] [CrossRef]
  477. Mohan, D.; Pittman, C.U.; Steele, P.H. Pyrolysis of wood/biomass for bio-oil: A critical review. Energy Fuels 2006, 20, 848–889. [Google Scholar] [CrossRef]
  478. Gupta, A.K.; De, A.; Aggarwal, S.K.; Kushari, A.; Runchal, A. Innovations in Sustainable Energy and Cleaner Environment; Springer: Berlin/Heidelberg, Germany, 2019. [Google Scholar]
  479. Bridgwater, A.V. The production of biofuels and renewable chemicals by fast pyrolysis of biomass. Int. J. Glob. Energy Issues 2007, 27, 160–203. [Google Scholar] [CrossRef]
  480. Horne, P.A.; Williams, P.T. Influence of temperature on the products from the flash pyrolysis of biomass. Fuel 1996, 75, 1051–1059. [Google Scholar] [CrossRef]
  481. Jahirul, M.I.; Rasul, M.G.; Chowdhury, A.A.; Ashwath, N. Biofuels production through biomass pyrolysis-A technological review. Energies 2012, 5, 4952–5001. [Google Scholar] [CrossRef]
  482. Onay, O.; Kockar, O.M. Slow, fast and flash pyrolysis of rapeseed. Renew. Energy 2003, 28, 2417–2433. [Google Scholar] [CrossRef]
  483. Kan, T.; Strezov, V.; Evans, T.J. Lignocellulosic biomass pyrolysis: A review of product properties and effects of pyrolysis parameters. Renew. Sustain. Energy Rev. 2016, 57, 1126–1140. [Google Scholar] [CrossRef]
  484. Mani, T.; Murugan, P.; Abedi, J.; Mahinpey, N. Pyrolysis of wheat straw in a thermogravimetric analyzer: Effect of particle size and heating rate on devolatilization and estimation of global kinetics. Chem. Eng. Res. Des. 2010, 88, 952–958. [Google Scholar] [CrossRef]
  485. Garcia-Nunez, J.A.; Pelaez-Samaniego, M.R.; Garcia-Perez, M.E.; Fonts, I.; Abrego, J.; Westerhof, R.J.M.; Garcia-Perez, M. Historical developments of pyrolysis reactors: A review. Energy Fuels 2017, 31, 5751–5775. [Google Scholar] [CrossRef]
  486. Lewandowski, W.M.; Januszewicz, K.; Kosakowski, W. Efficiency and proportions of waste tyre pyrolysis products depending on the reactor type—A review. J. Anal. Appl. Pyrol. 2019, 140, 25–53. [Google Scholar] [CrossRef]
  487. Park, D.K.; Kim, S.D.; Lee, S.H.; Lee, J.G. Co-pyrolysis characteristics of sawdust and coal blend in TGA and a fixed bed reactor. Bioresour. Technol. 2010, 101, 6151–6156. [Google Scholar] [CrossRef]
  488. Zhuo, Y.; Zhuo, Y.; Dugwell, D.R.; Dugwell, D.R.; Kandiyoti, R.; Kandiyoti, R. Co-pyrolysis and co-gasi cation of coal and biomass in bench-scale xed- bed and uidised bed reactors. Chem. Eng. 1999, 78, 667–679. [Google Scholar]
  489. Onay, O.; Koçkar, O.M. Fixed-bed pyrolysis of rapeseed (Brassica napus L.). Biomass Bioenergy 2004, 26, 289–299. [Google Scholar] [CrossRef]
  490. Isahak, W.N.R.W.; Hisham, M.W.M.; Yarmo, M.A.; Yun Hin, T.Y. A review on bio-oil production from biomass by using pyrolysis method. Renew. Sustain. Energy Rev. 2012, 16, 5910–5923. [Google Scholar] [CrossRef]
  491. Xu, R.; Ferrante, L.; Briens, C.; Berruti, F. Flash pyrolysis of grape residues into biofuel in a bubbling fluid bed. J. Anal. Appl. Pyrolysis 2009, 86, 58–65. [Google Scholar] [CrossRef]
  492. Lee, S.H.; Eom, M.S.; Yoo, K.S.; Kim, N.C.; Jeon, J.K.; Park, Y.K.; Song, B.H.; Lee, S.H. The yields and composition of bio-oil produced from Quercus Acutissima in a bubbling fluidized bed pyrolyzer. J. Anal. Appl. Pyrolysis 2008, 83, 110–114. [Google Scholar] [CrossRef]
  493. Dai, X.; Yin, X.; Wu, C.; Zhang, W.; Chen, Y. Pyrolysis of waste tires in a circulating fluidized-bed reactor. Energy 2001, 26, 385–399. [Google Scholar] [CrossRef]
  494. Lappas, A.A.; Samolada, M.C.; Iatridis, D.K.; Voutetakis, S.S.; Vasalos, I.A. Biomass pyrolysis in a circulating fluid bed reactor for the production of fuels and chemicals. Fuel 2002, 81, 2087–2095. [Google Scholar] [CrossRef]
  495. Sivell, A.; Beeckmans, J.M.; Webster, A.R. Ultrarapid pyrolysis of biomass using an electrical discharge. J. Anal. Appl. Pyrolysis 1984, 7, 185–191. [Google Scholar] [CrossRef]
  496. Luo, G.; Eng, R.J.; Jia, P.; Resende, F.L.P. Ablative pyrolysis of wood chips: Effect of operating conditions. Energy Technol. 2017, 5, 2128–2137. [Google Scholar] [CrossRef]
  497. Peacocke, G.V.C.; Bridgwater, A.V. Ablative plate pyrolysis of biomass for liquids. Biomass Bioenergy 1994, 7, 147–154. [Google Scholar] [CrossRef]
  498. Wagenaar, B.M.; Kuipers, J.A.M.; Prins, W.; van Swaaij, W.P.M. The Rotating Cone Flash Pyrolysis Reactor. In Advances in Thermochemical Biomass Conversion; Bridgwater, A.V., Ed.; Springer: Dordrecht, The Netherlands, 1993; pp. 1122–1133. [Google Scholar]
  499. Wagenaar, B.M.; Prins, W.; van Swaaij, W.P.M. Pyrolysis of biomass in the rotating cone reactor: Modelling and experimental justification. Chem. Eng. Sci. 1994, 49, 5109–5126. [Google Scholar] [CrossRef] [Green Version]
  500. Wentrup, C. Flash vacuum pyrolysis: Techniques and reactions. Angew. Chem. Int. Ed. 2017, 56, 14808–14835. [Google Scholar] [CrossRef]
  501. Zhang, X.; Wang, T.; Ma, L.; Chang, J. Vacuum pyrolysis of waste tires with basic additives. Waste Manag. 2008, 28, 2301–2310. [Google Scholar] [CrossRef]
  502. Perkins, C.; Woodruff, B.; Andrews, L. Synthesis gas production by rapid solar thermal gasification of corn stover. In Proceedings of the 14th Biennial CSP SolarPACES Symposium, Las Vegas, NV, USA, 4–7 March 2008; pp. 4–7. [Google Scholar]
  503. Arribas, L.; Arconada, N.; González-Fernández, C.; Löhrl, C.; González-Aguilar, J.; Kaltschmitt, M.; Romero, M. Solar-driven pyrolysis and gasification of low-grade carbonaceous materials. Int. J. Hydrog. Energy 2017, 42, 13598–13606. [Google Scholar] [CrossRef]
  504. Chuayboon, S.; Abanades, S.; Rodat, S. Co-production of syngas and zinc via combined solar-driven biomass gasification and ZnO carbo-thermal reduction in a continuously-operated solar reactor. In Proceedings of the AIP Conference Proceedings, Maharashtra, India, 5–6 July 2018; p. 130004. [Google Scholar]
  505. Nzihou, A.; Flamant, G.; Stanmore, B.; Nzihou, A.; Flamant, G.; Stanmore, B.; Nzihou, A.; Flamant, G.; Stanmore, B. Synthetic fuels from biomass using concentrated solar energy—A review. Energy 2012, 42, 121–131. [Google Scholar] [CrossRef] [Green Version]
  506. Loutzenhiser, P.G.; Muroyama, A.P. A review of the state-of-the-art in solar-driven gasification processes with carbonaceous materials. Sol. Energy 2017, 156, 93–100. [Google Scholar] [CrossRef]
  507. Barrio, M.; Gbel, B.; Rimes, H.; Henriksen, U.; Hustad, J.E.; Srensen, L.H. Steam gasification of wood char and the effect of hydrogen inhibition on the chemical kinetics. In Progress in Thermochemical Biomass Conversion; Blackwell Science Ltd.: Oxford, UK, 2008; pp. 32–46. [Google Scholar]
  508. Mckendry, P. Energy production from biomass (part 3): Gasification technologies. Bioresour. Technol. 2002, 83, 55–63. [Google Scholar] [CrossRef]
  509. Kumar, A.; Jones, D.D.; Hanna, M.A. Thermochemical biomass gasification: A review of the current status of the technology. Energies 2009, 2, 556–581. [Google Scholar] [CrossRef] [Green Version]
  510. Piatkowski, N.; Wieckert, C.; Weimer, A.W.; Steinfeld, A. Solar-driven gasification of carbonaceous feedstock—A review. Energy Environ. Sci. 2011, 4, 73–82. [Google Scholar] [CrossRef]
  511. Sansaniwal, S.K.; Pal, K.; Rosen, M.A.; Tyagi, S.K. Recent advances in the development of biomass gasification technology: A comprehensive review. Renew. Sustain Energy Rev. 2017, 72, 363–384. [Google Scholar] [CrossRef]
  512. Ruiz, J.A.; Juárez, M.C.; Morales, M.P.; Muñoz, P.; Mendívil, M.A. Biomass gasification for electricity generation: Review of current technology barriers. Renew. Sustain. Energy Rev. 2013, 18, 174–183. [Google Scholar] [CrossRef]
  513. Villarini, M.; Marcantonio, V.; Colantoni, A.; Bocci, E. Sensitivity analysis of different parameters on the performance of a CHP internal combustion engine system fed by a biomass waste gasifier. Energies 2019, 12, 688. [Google Scholar] [CrossRef] [Green Version]
  514. Guo, F.; Dong, Y.; Dong, L.; Guo, C. Effect of design and operating parameters on the gasification process of biomass in a downdraft fixed bed: An experimental study. Int. J. Hydrog. Energy 2014, 39, 5625–5633. [Google Scholar] [CrossRef]
  515. Ghassemi, H.; Shahsavan-markadeh, R. Effects of various operational parameters on biomass gasification process; a modified equilibrium model. Energy Convers. Manag. 2014, 79, 18–24. [Google Scholar] [CrossRef]
  516. Kirsanovs, V.; Žandeckis, A.; Blumberga, D.; Veidenbergs, I. The influence of process temperature, equivalence ratio and fuel moisture content on gasification process: A review. In Proceedings of the 27th International Conference on Efficiency, Cost, Optimization, Simulation and Environmental Impact of Energy Systems, ECOS 2014, Turku, Finland, 15–19 June 2014. [Google Scholar]
  517. Parthasarathy, P.; Narayanan, K.S. Hydrogen production from steam gasification of biomass: Influence of process parameters on hydrogen yield-A review. Renew. Energy 2014, 66, 570–579. [Google Scholar] [CrossRef]
  518. Hernández, J.J.; Ballesteros, R.; Aranda, G. Characterisation of tars from biomass gasification: Effect of the operating conditions. Energy 2013, 50, 333–342. [Google Scholar] [CrossRef]
  519. Beenackers, A.A.C.M. Biomass gasification in moving beds, a review of European technologies. Renew. Energy 1999, 16, 1180–1186. [Google Scholar] [CrossRef]
  520. Martínez, D.J.; Mahkamov, K.; Andrade, R.V.; Lora, E.E.S. Syngas production in downdraft biomass gasi fi ers and its application using internal combustion engines. Renew. Energy 2012, 38, 1–9. [Google Scholar] [CrossRef]
  521. Warnecke, R. Gasification of biomass: Comparison of fixed bed and fluidized bed gasifier. Biomass Bioenergy 2000, 18, 489–497. [Google Scholar] [CrossRef]
  522. Basu, P. Chapter 8—Design of Biomass Gasifiers. In Biomass Gasification, Pyrolysis and Torrefaction, 2nd ed.; Elsevier: Amsterdam, The Netherlands, 2013; pp. 249–313. [Google Scholar]
  523. Njikam, F.; Shahbazi, A.; Shirley, V.; Lee, C.; Serre, S.; Lemieux, P. Optimizing Synthesis Gas Yield from the Cross Draft Gasification of Woody Biomass. In Proceedings of the Air and Waste Management Association’s Annual Conference and Exhibition, AWMA, New Orleans, LA, USA, 20–23 June 2006. [Google Scholar]
  524. Rüdisüli, M.; Schildhauer, T.J.; Biollaz, S.M.A.; Van Ommen, J.R. Scale-up of bubbling fluidized bed reactors—A review. Powder Technol. 2012, 217, 21–38. [Google Scholar] [CrossRef]
  525. Kunii, D.; Levenspiel, O. Circulating fluidized-bed reactors. Chem. Eng. Sci. 1997, 52, 2471–2482. [Google Scholar] [CrossRef]
  526. Couto, N.; Rouboa, A.; Silva, V.; Monteiro, E.; Bouziane, K. Influence of the biomass gasification processes on the final composition of syngas. Energy Procedia 2013, 36, 596–606. [Google Scholar] [CrossRef] [Green Version]
  527. Corella, J.; Toledo, J.M.; Molina, G. A review on dual fluidized-bed biomass gasifiers. Ind. Eng. Chem. Res. 2007, 46, 6831–6839. [Google Scholar] [CrossRef]
  528. Zhou, J.; Chen, Q.; Zhao, H.; Cao, X.; Mei, Q.; Luo, Z.; Cen, K. Biomass—oxygen gasification in a high-temperature entrained-flow gasifier. Biotechnol. Adv. 2009, 27, 606–611. [Google Scholar] [CrossRef] [PubMed]
  529. Kolb, T.; Krebs, L.; Santo, U.; Seifert, H.; Kuhn, D.; Wiemer, H.-J.; Pantouflas, E.; Zarzalis, N. Conversion of biomass based slurry in an entrained flow gasifier. Chem. Eng. Technol. 2007, 30, 967–969. [Google Scholar]
  530. Li, F.; Li, Z.; Huang, J.; Fang, Y. Understanding mineral behaviors during anthracite fluidized-bed gasification based on slag characteristics. Appl. Energy 2014, 131, 279–287. [Google Scholar] [CrossRef]
  531. Milne, T.; Evans, R.J. Biomass Gasifier “Tars”: Their Nature, Formation, and Conversion; National Renewable Energy Laboratory: Golden, CO, USA, 1998.
  532. Kiel, J.; Van Paasen, S.; Neeft, J. Primary Measures to Reduce tar Formation in Fluidised-Bed Biomass Gasifiers; Final SDE Project P1999-012; ECN: Putten, The Netherlands, 2004. [Google Scholar]
  533. Woolcock, P.J.; Brown, R.C. A review of cleaning technologies for biomass-derived syngas. Biomass Bioenergy 2013, 52, 54–84. [Google Scholar] [CrossRef]
  534. Wang, L.; Weller, C.L.; Jones, D.D.; Hanna, M.A. Contemporary issues in thermal gasification of biomass and its application to electricity and fuel production. Biomass Bioenergy 2008, 32, 573–581. [Google Scholar] [CrossRef]
  535. Han, J.; Kim, H. The reduction and control technology of tar during biomass gasification/pyrolysis: An overview. Renew. Sustain. Energy Rev. 2008, 12, 397–416. [Google Scholar] [CrossRef]
  536. Devi, L.; Ptasinski, K.J.; Janssen, F.J.J.G. A review of the primary measures for tar elimination in biomass gasification processes. Biomass Bioenergy 2003, 24, 125–140. [Google Scholar] [CrossRef]
  537. Abu El-Rub, Z.; Bramer, E.A.; Brem, G. Review of catalysts for tar elimination in biomass gasification processes. Ind. Eng. Chem. Res. 2004, 43, 6911–6919. [Google Scholar] [CrossRef]
  538. Sutton, D.; Kelleher, B.; Ross, J.R.H. Review of literature on catalysts for biomass gasification. Fuel Process. Technol. 2001, 73, 155–173. [Google Scholar] [CrossRef]
  539. Rueda, Y.G.; Helsen, L. The role of plasma in syngas tar cracking. Biomass Convers. Biorefinery 2019, 9, 1–15. [Google Scholar] [CrossRef]
  540. Valderrama Rios, M.L.; González, A.M.; Lora, E.E.S.; Almazán del Olmo, O.A. Reduction of tar generated during biomass gasification: A review. Biomass Bioenergy 2018, 108, 345–370. [Google Scholar] [CrossRef]
  541. de Diego, L.F.; García-Labiano, F.; Gayán, P.; Abad, A.; Mendiara, T.; Adánez, J.; Nacken, M.; Heidenreich, S. Tar abatement for clean syngas production during biomass gasification in a dual fluidized bed. Fuel Process. Technol. 2016, 152, 116–123. [Google Scholar] [CrossRef]
  542. Anis, S.; Zainal, Z.A. Tar reduction in biomass producer gas via mechanical, catalytic and thermal methods: A review. Renew. Sustain. Energy Rev. 2011, 15, 2355–2377. [Google Scholar] [CrossRef]
  543. IEA Bioenergy Task 33. Available online: http://www.ieabioenergytask33.org/content/taks_description (accessed on 1 December 2019).
  544. NREL. National Renewable Energy Laboratory Institutional Plan: 2001-2005; DIANE Publishing: Collingdale, PA, USA, 2001. [Google Scholar]
  545. Lemieux, A.; Lavoie, J.-M. Conversion of Non-Homogeneous Biomass to Ultraclean Syngas and Catalytic Conversion to Ethanol. In Biofuel’s Engineering Process Technology; IntechOpen: London, UK, 2011. [Google Scholar]
  546. Van der Meijden, C.M.; Könemann, J.W.; Sierhuis, W.; van der Drift, A.; Rietveld, G. Wood to Bio-Methane demonstration project in the Netherlands; ECN Report Number ECN-M–13-009; Energy research Centre of the Netherlands ECN: Petten, The Netherlands, 2013; Volume 21, pp. 1–10. [Google Scholar]
  547. Gogreengas-First Project Progress Report 2016. Available online: https://gogreengas.com/wp-content/uploads/2015/11/BioSNG-Demonstration-Plant-June-2016-Project-Progress-Report.pdf (accessed on 1 December 2019).
  548. Gøbel, B.; Henriksen, U.B.; Ahrenfeldt, J.; Jensen, T.K.; Hindsgaul, C.; Bentzen, J.D.; Sørensen, L.H. Status—2000 hours of operation with the Viking gasifier. In Proceedings of the 2nd World Conference and Technology Exhibition on Biomass for Energy and Industry, Rome, Italy, 10–14 May 2004; pp. 1–5. [Google Scholar]
  549. Henriksen, U.; Ahrenfeldt, J.; Jensen, T.K.; Gøbel, B.; Bentzen, J.D.; Hindsgaul, C.; Sørensen, L.H. The design, construction and operation of a 75 kW two-stage gasifier. Energy 2006, 31, 1542–1553. [Google Scholar] [CrossRef] [Green Version]
  550. Gadsbøll, R.Ø.; Sárossy, Z.; Jørgensen, L.; Ahrenfeldt, J.; Henriksen, U.B. Oxygen-blown operation of the two stage Viking gasifier. Energy 2018, 158, 495–503. [Google Scholar] [CrossRef]
  551. Kuznecova, I.; Gusca, J. Property based ranking of CO and CO2 methanation catalysts. Energy Procedia 2017, 128, 255–260. [Google Scholar] [CrossRef]
  552. Wang, H.; Pei, Y.; Qiao, M.; Zong, B. Advances in methanation catalysis. Catalysis 2017, 29, 1–28. [Google Scholar]
  553. Sabatier, P.; Senderens, J. New synthesis of methane. Comptes Rendus Hebd. Des Séances De L’académie Des Sci. 1902, 134, 514–516. [Google Scholar]
  554. Rönsch, S.; Schneider, J.; Matthischke, S.; Schlüter, M.; Götz, M.; Lefebvre, J.; Prabhakaran, P.; Bajohr, S. Review on methanation—From fundamentals to current projects. Fuel 2016, 166, 276–296. [Google Scholar] [CrossRef]
  555. Mills, G.A.; Steffgen, F.W. Catalytic methanation. Catal. Rev. Sci. Eng. 1974, 8, 159–210. [Google Scholar] [CrossRef]
  556. Wang, Z. Sabatier-Senderens reduction. In Comprehensive Organic Name Reactions and Reagents; American Cancer Society: Atlanta, GA, USA, 2010; pp. 2454–2457. [Google Scholar]
  557. Rajendran, S.; Naushad, M.; Raju, K.; Boukherroub, R. Emerging Nanostructured Materials for Energy and Environmental Science, 1st ed.; Springer: Berlin/Heidelberg, Germany, 2019. [Google Scholar]
  558. Frontera, P.; Macario, A.; Ferraro, M.; Antonucci, P.L. Supported catalysts for CO2 methanation: A review. Catalysts 2017, 7, 59. [Google Scholar] [CrossRef]
  559. Martínez, J.; Hernández, E.; Alfaro, S.; Medina, R.L.; Aguilar, G.V.; Albiter, E.; Valenzuela, M.A. High selectivity and stability of nickel catalysts for CO2 methanation: Support effects. Catalysts 2019, 9, 24. [Google Scholar] [CrossRef] [Green Version]
  560. Iglesias, G.M.; De Vries, C.; Claeys, M.; Schaub, G. Chemical energy storage in gaseous hydrocarbons via iron Fischer-Tropsch synthesis from H2/CO2—Kinetics, selectivity and process considerations. Catal. Today 2015, 242, 184–192. [Google Scholar] [CrossRef]
  561. Saito, M.; Anderson, R.B. The activity of several molybdenum compounds for the methanation of CO. J. Catal. 1980, 63, 438–446. [Google Scholar] [CrossRef]
  562. Tapia, J.; Acelas, N.Y.; López, D.; Moreno, A. NiMo-sulfide supported on activated carbon to produce renewable diesel. Univ. Sci. 2017, 22, 71–85. [Google Scholar] [CrossRef]
  563. Chang, F.W.; Kuo, M.S.; Tsay, M.T.; Hsieh, M.C. Hydrogenation of CO2 over nickel catalysts on rice husk ash-alumina prepared by incipient wetness impregnation. Appl. Catal. A Gen. 2003, 247, 309–320. [Google Scholar] [CrossRef]
  564. Jiajian, G.; Gu, F.; Zhang, M. Effect of nickel nanoparticle size in Ni/α-Al2O3 on CO methanation reaction for the production of synthetic natural gas. Catal. Sci. Technol. 2013, 3, 2009–2015. [Google Scholar]
  565. Wang, W.; Gong, J. Methanation of carbon dioxide: An overview. Front. Chem. Eng. China 2011, 5, 2–10. [Google Scholar]
  566. Delmelle, R.; Duarte, R.B.; Franken, T.; Burnat, D.; Holzer, L.; Borgschulte, A.; Heel, A. Development of improved nickel catalysts for sorption enhanced CO2 methanation. Int. J. Hydrog. Energy 2016, 41, 20185–20191. [Google Scholar] [CrossRef] [Green Version]
  567. Lee, G.D.; Moon, M.J.; Park, J.H.; Park, S.S.; Hong, S.S. Raney ni catalysts derived from different alloy precursors part II. CO and CO2 methanation activity. Korean J. Chem. Eng. 2005, 22, 541–546. [Google Scholar] [CrossRef]
  568. Wang, H.; Li, Z.; Wang, E.; Lin, C.; Shang, Y.; Ding, G.; Ma, X.; Qin, S.; Sun, Q. Effect of composite supports on the methanation activity of Co-Mo-based sulphur-resistant catalysts. J. Nat. Gas Chem. 2012, 21, 767–773. [Google Scholar] [CrossRef]
  569. Dorner, R.W.; Hardy, D.R.; Williams, F.W.; Willauer, H.D. Heterogeneous catalytic CO2 conversion to value-added hydrocarbons. Energy Environ. Sci. 2010, 3, 884–890. [Google Scholar] [CrossRef]
  570. Barrientos, J.; Gonzalez, N.; Boutonnet, M.; Järås, S. Deactivation of Ni/Γ-Al2O3 catalysts in CO methanation: Effect of Zr, Mg, Ba and Ca oxide promoters. Top. Catal. 2017, 60, 1276–1284. [Google Scholar] [CrossRef] [Green Version]
  571. Daza, C.E.; Gamba, O.A.; Hernández, Y.; Centeno, M.A.; Mondragón, F.; Moreno, S.; Molina, R. High-stable mesoporous Ni-Ce/clay catalysts for syngas production. Catal. Lett. 2011, 141, 1037–1046. [Google Scholar] [CrossRef]
  572. Bacariza, M.C.; Graça, I.; Bebiano, S.S.; Lopes, J.M.; Henriques, C. Magnesium as promoter of CO2 methanation on Ni-based USY zeolites. Energy Fuels 2017, 31, 9776–9789. [Google Scholar] [CrossRef] [Green Version]
  573. Liu, Q.; Gu, F.; Lu, X.; Liu, Y.; Li, H.; Zhong, Z.; Xu, G.; Su, F. Enhanced catalytic performances of Ni/Al2O3 catalyst via addition of V2O3 for CO methanation. Appl. Catal. A Gen. 2014, 488, 37–47. [Google Scholar] [CrossRef]
  574. Garbarino, G.; Wang, C.; Cavattoni, T.; Finocchio, E.; Riani, P.; Flytzani-Stephanopoulos, M.; Busca, G. A study of Ni/La-Al2O3 catalysts: A competitive system for CO2 methanation. Appl. Catal. B Environ. 2019, 248, 286–297. [Google Scholar] [CrossRef]
  575. Younas, M.; Loong Kong, L.; Bashir, M.J.K.; Nadeem, H.; Shehzad, A.; Sethupathi, S. Recent advancements, fundamental challenges, and opportunities in catalytic methanation of CO2. Energy Fuels 2016, 30, 8815–8831. [Google Scholar] [CrossRef]
  576. Gumerov, F.; Le Neindre, B. Regeneration of spent catalyst and impregnation of catalyst by supercritical fluid. Int. J. Anal. Mass Spectrom. Chromatogr. 2016, 4, 51–65. [Google Scholar] [CrossRef] [Green Version]
  577. Bartholomew, C.H.; Weatherbee, G.D.; Jarvi, G.A. Sulfur poisoning of nickel methanation catalysts. I. in situ deactivation by H2S of nickel and nickel bimetallics. J. Catal. 1979, 60, 257–269. [Google Scholar] [CrossRef]
  578. Argyle, M.D.; Bartholomew, C.H. Heterogeneous catalyst deactivation and regeneration: A review. Catalysts 2015, 5, 145–269. [Google Scholar] [CrossRef] [Green Version]
  579. Shen, W.M.; Dumesic, J.A.; Hill, C.G. Criteria for stable Ni particle size under methanation reaction conditions: Nickel transport and particle size growth via nickel carbonyl. J. Catal. 1981, 68, 152–165. [Google Scholar] [CrossRef]
  580. Nguyen, T.T.M.; Wissing, L.; Skjøth-Rasmussen, M.S. High temperature methanation: Catalyst considerations. Catal. Today 2013, 215, 233–238. [Google Scholar] [CrossRef]
  581. Wanke, S.E.; Flynn, P.C. The sintering of supported metal catalysts. Catal. Rev. 1975, 12, 93–135. [Google Scholar] [CrossRef]
  582. Bai, X.; Wang, S.; Sun, T.; Wang, S. The sintering of Ni/Al2O3 methanation catalyst for substitute natural gas production. React. Kinet. Mech. Catal. 2014, 112, 437–451. [Google Scholar] [CrossRef]
  583. Sehested, J. Four challenges for nickel steam-Reforming catalysts. Catal. Today 2006, 111, 103–110. [Google Scholar] [CrossRef]
  584. Rostrup-Nielsen, J.R.; Pedersen, K.; Sehested, J. High temperature methanation. Sintering and structure sensitivity. Appl. Catal. A Gen. 2007, 330, 134–138. [Google Scholar] [CrossRef]
  585. Liu, Q.; Gu, F.; Zhong, Z.; Xu, G.; Su, F. Anti-sintering ZrO2-modified Ni/α-Al2O3 catalyst for CO methanation. RSC Adv. 2016, 6, 20979–20986. [Google Scholar] [CrossRef]
  586. Vrijburg, W.L.; Van Helden, J.W.A.; Van Hoof, A.J.F.; Friedrich, H.; Groeneveld, E.; Pidko, E.A.; Hensen, E.J.M. Tunable colloidal Ni nanoparticles confined and redistributed in mesoporous silica for CO2 methanation. Catal. Sci. Technol. 2019, 9, 2578–2591. [Google Scholar] [CrossRef] [Green Version]
  587. Du, J.; Gao, J.; Gu, F.; Zhuang, J.; Lu, B.; Jia, L.; Xu, G.; Liu, Q.; Su, F. A strategy to regenerate coked and sintered Ni/Al2O3 catalyst for methanation reaction. Int. J. Hydrog. Energy 2018, 43, 20661–20670. [Google Scholar] [CrossRef]
  588. Bartholomew, C.H. Mechanisms of catalyst deactivation. Appl. Catal. A Gen. 2001, 212, 17–60. [Google Scholar] [CrossRef]
  589. Bemrose, C.R.; Bridgwater, J. A review of attrition and attrition test methods. Powder Technol. 1987, 49, 97–126. [Google Scholar] [CrossRef]
  590. Kalman, H.; Goder, D. Design criteria for particle attrition. Adv. Powder Technol. 1998, 9, 153–167. [Google Scholar] [CrossRef]
  591. Seemann, M.; Thunman, H. Methane synthesis. In Substitute Natural Gas from Waste; Elsevier Inc.: Amsterdam, The Netherlands, 2019; pp. 221–243. [Google Scholar]
  592. Porubova, J.; Klemm, M.; Kiendl, I.; Valters, K.; Markova, D.; Repele, M.; Bazbauers, G. Influence of temperature and pressure change on adiabatic and isothermal methanation processes. Environ. Clim. Technol. 2012, 9, 22–27. [Google Scholar] [CrossRef] [Green Version]
  593. Kang, W.R.; Lee, K.B. Effect of operating parameters on methanation reaction for the production of synthetic natural gas. Korean J. Chem. Eng. 2013, 30, 1386–1394. [Google Scholar] [CrossRef]
  594. Gao, J.; Wang, Y.; Ping, Y.; Hu, D.; Xu, G.; Su, F. A thermodynamic analysis of methanation reactions of carbon oxides for the production of synthetic natural gas. RCS Adv. 2012, 2, 2358–2368. [Google Scholar] [CrossRef]
  595. Bartholomew, C.H. Catalysis reviews: Science and reforming and methanation carbon deposition in steam reforming and methanation. Catal. Rev. Sci. Eng. 1982, 24, 67–112. [Google Scholar] [CrossRef]
  596. Eckle, S. Investigations of the Kinetics and Mechanism of the Selective Methanation of CO in CO2 and H2-Rich Reformates Over Ru Supported Catalysts. Ph.D. Thesis, Universität Ulm, Ulm, Germany, 2012. [Google Scholar]
  597. Er-rbib, H.; Bouallou, C. Modelling and simulation of methanation catalytic reactor for renewable electricity storage. Chem. Eng. Trans. 2013, 35, 541–546. [Google Scholar]
  598. Lazdans, A.; Dace, E.; Gusca, J. Development of the experimental scheme for methanation process. Energy Procedia 2016, 95, 540–545. [Google Scholar] [CrossRef] [Green Version]
  599. Stangeland, K.; Kalai, D.Y.; Li, H.; Yu, Z. Active and stable Ni based catalysts and processes for biogas upgrading: The effect of temperature and initial methane concentration on CO2 methanation. Appl. Energy 2018, 227, 206–212. [Google Scholar] [CrossRef]
  600. Kiewidt, L.; Thöming, J. Predicting optimal temperature profiles in single-stage fixed-bed reactors for CO2-methanation. Chem. Eng. Sci. 2015, 132, 59–71. [Google Scholar] [CrossRef]
  601. Richardson, R.C. Design of Fixed Bed Catalytic Reactors. 1963. Available online: https://lib.dr.iastate.edu/cgi/viewcontent.cgi?article=3554&context=rtd (accessed on 1 December 2019).
  602. Danaci, S. Optimisation and Integration of Catalytic Porous Structures into Structured Reactors for CO2 Conversion to Methane. Ph.D. Thesis, Université Grenoble Alpes, Grenoble, France, 2017. [Google Scholar]
  603. Heyne, S.; Seemann, M.C.; Harvey, S. Integration study for alternative methanation technologies for the production of synthetic natural gas from gasified biomass. Chem. Eng. Trans. 2010, 21, 409–414. [Google Scholar]
  604. Fries, L.; Antonyuk, S.; Heinrich, S.; Palzer, S. Performance comparison of syngas methanation on fluidized and fixed bed reactors. In Proceedings of the 13th International Conference on Fluidization—New Paradigm in Fluidization Engineering, Gyeong-ju, Korea, 16–21 May 2010; pp. 1–9. [Google Scholar]
  605. Sudiro, M.; Bertucco, A. Synthetic Natural Gas (SNG) from Coal and Biomass: A Survey of Existing Process Technologies, Open Issues and Perspectives. In Natural Gas; IntechOpen: London, UK, 2010; pp. 105–126. [Google Scholar]
  606. Götz, M.; Koch, A.M.; Graf, F. State of the art and perspectives of CO2 methanation process concepts for power-to-gas applications. Int. Gas Res. Conf. Proc. 2014, 1, 314–327. [Google Scholar]
  607. Kopyscinski, J.; Schildhauer, T.J.; Biollaz, S.M.A. Methanation in a fluidized bed reactor with high initial CO partial pressure: Part I-Experimental investigation of hydrodynamics, mass transfer effects, and carbon deposition. Chem. Eng. Sci. 2011, 66, 924–934. [Google Scholar] [CrossRef]
  608. Lefebvre, J.; Götz, M.; Bajohr, S.; Reimert, R.; Kolb, T. Improvement of three-phase methanation reactor performance for steady-state and transient operation. Fuel Process. Technol. 2015, 132, 83–90. [Google Scholar] [CrossRef]
  609. Moulijn, J.A.; Kapteijn, F. Monolithic reactors in catalysis: Excellent control. Curr. Opin. Chem. Eng. 2013, 2, 346–353. [Google Scholar] [CrossRef]
  610. Pérez, S.; Aragón, J.J.; Peciña, I.; Garcia-Suarez, E.J. Enhanced CO2 methanation by new microstructured reactor concept and design. Top. Catal. 2019, 62, 518–523. [Google Scholar] [CrossRef] [Green Version]
  611. Brooks, K.P.; Hu, J.; Zhu, H.; Kee, R.J. Methanation of carbon dioxide by hydrogen reduction using the Sabatier process in microchannel reactors. Chem. Eng. Sci. 2007, 62, 1161–1170. [Google Scholar] [CrossRef]
  612. Liu, Z.; Chu, B.; Zhai, X.; Jin, Y.; Cheng, Y. Total methanation of syngas to synthetic natural gas over Ni catalyst in a micro-channel reactor. Fuel 2012, 95, 599–605. [Google Scholar] [CrossRef]
  613. Augustyn, A.; Gawlik, L.; Pepłowska, M. Power to gas—An innovative energy conversion and storage solution. IOP Conf. Ser. Earth Environ. Sci. 2019, 214, 1. [Google Scholar] [CrossRef]
  614. Bailera, M.; Lisbona, P.; Romeo, L.M.; Espatolero, S. Power to gas projects review: Lab, pilot and demo plants for storing renewable energy and CO2. Renew. Sustain. Energy Rev. 2017, 69, 292–312. [Google Scholar] [CrossRef]
  615. Rieke, S. Solar Fuel GmbH—Solar Fuels and Power-To-Gas Technologies; Springer: Berlin/Heidelberg, Germany, 2012. [Google Scholar]
  616. Specht, M.; Zuberbühler, U.; Bandi, A. Experimental Data on Renewable Methanol/Methane Generation from Atmospheric CO2 in Pilot Plants. 2011. Available online: https://www.iass-potsdam.de/sites/default/files/files/specht_zsw_p2g.pdf (accessed on 1 December 2019).
  617. Otten, R.; Forster, S.; Block, T.; Gosda, H.; Dieminger, F. Wirkungsgrad-Optimierung von Methanisierungs-und Biogasanlagen-Technologie im Rahmen Eines EE-Speicherungs-Pilotprojekts. 2016. Available online: https://www.tib.eu/suchen/id/TIBKAT:88124936X/ (accessed on 1 December 2019).
  618. GreenHydrogen.dk; Elplatek A/S; Lemvig Biogasanlæg A.m.b.A; DTU Mekanik; AU-Herning MeGa-stoRE Final Report. 2015. Available online: https://www.lemvigbiogas.com/MeGa-stoREfinalreport.pdf (accessed on 1 December 2019).
  619. Stähr, D.; Rasmusson, H.; Gerstein, D. STORE&GO: Das größte power-to-gas-forschungsprojekt in Europa befindet sich auf der zielgeraden. Energie 2019, 11, 62–65. [Google Scholar]
  620. Larsson, A.; Gunnarsson, I.; Tengberg, F. The GoBiGas Project—Demonstration of the Production of Biomethane from Biomass via Gasification. 2018. Available online: https://research.chalmers.se/en/publication/509030 (accessed on 1 December 2019).
  621. Bünger, U.; Landinger, H.; Pschorr-Schoberer, E.; Schmidt, P.; Weindorf, W.; Jöhrens, J.; Lambrecht, U.; Naumann, K.; Lischke, A. Power-to-Gas (PtG) in Transport Status Quo and Perspectives for Development. Energy Procedia 2015, 73, 182–189. [Google Scholar]
  622. Bach, C. Renewable Energy in the Future Energy System. 2015. Available online: http://www.ccem.ch/renerg2.html (accessed on 1 December 2019).
  623. Kwak, M. Attero Power(ed) to (by) Gas—The Waste to Power to Gas W2P2G Project 2014. Available online: https://docplayer.net/19872136-Attero-power-ed-to-by-gas-the-waste-to-power-to-gas-w2p2g-project-marco-kwak-project-business-development.html (accessed on 1 December 2019).
  624. GL Noble Denton; Pöyry Management Consulting. Gas Quality Harmonisation-Cost Benefit Analysis; European Commission: Brussels, Belgium, 2012. [Google Scholar]
  625. Gondal, I.A.; Sahir, M.H. Prospects of natural gas pipeline infrastructure in hydrogen transportation. Int. J. Energy Res. 2011, 36, 1338–1345. [Google Scholar] [CrossRef]
  626. Thema, M.; Weidlich, T.; Hörl, M.; Bellack, A.; Mörs, F.; Hackl, F.; Kohlmayer, M.; Gleich, J.; Stabenau, C.; Trabold, T.; et al. Biological CO2-methanation: An approach to standardization. Energies 2019, 12, 1670. [Google Scholar] [CrossRef] [Green Version]
  627. Tractebel; Engie; Hinicio. Study on Early Business Cases for H2 in Energy Storage and More Broadly Power to H2 Applications; FCH JU: Bruxelles, Belgium, 2017. [Google Scholar]
  628. EASEE-Gas. Common Business Practice 2005-001/02 2005. Available online: https://easee-gas.eu/download_file/DownloadFile/4/cbp-2005-001-02-harmonisation-of-natural-gas-quality/ (accessed on 1 December 2019).
  629. Marcogaz. Impact of Hydrogen in Natural Gas on End-Use Applications 2017. Available online: https://www.marcogaz.org/app/download/7928117663/UTIL-GQ-17-29.pdf?t=1541666775 (accessed on 1 December 2019).
  630. NATURALHY. Using the Existing Natural Gas System for Hydrogen 2009. Available online: https://www.fwg-gross-bieberau.de/fileadmin/user_upload/Erneuerbare_Energie/Naturalhy_Brochure.pdf (accessed on 1 December 2019).
  631. NGC; Interchangeability Work Group. White Paper on Natural Gas Interchangeability and Non-Combustion End Use; NGC: Sarasota, FL, USA, 2005. [Google Scholar]
  632. CIMAC WG17 “Gas Engines”. Impact of Gas Quality on Gas Engine Performance 2015. Available online: https://www.cimac.com/cms/upload/workinggroups/WG17/CIMAC_WG17_Position_Paper_Impact_Gas_Quality_on_Gas_Engine_Performance_2015_Jul.pdf (accessed on 1 December 2019).
  633. Gas Infrastructure Europe. GIE Position Paper on Impact of Including Methane Number in the European Standard for Natural Gas; Gas Infrastructure Europe: Bruxelles, Belgium, 2012. [Google Scholar]
  634. Höcher, T.; Sterner, M.; Mlaker, H.; Köppel, W.; Müller-Syring, G.; Henel, M. Entwicklung von Modularen Konzepten Zur Erzeugung, Speicherung und Einspeisung von Wasserstoff und Methan ins Erdgasnetz 2013. Available online: https://www.dvgw.de/medien/dvgw/forschung/berichte/g1_07_10.pdf (accessed on 1 December 2019).
  635. Melaina, M.; Penev, M.; Steward, D.; Antonia, O.; Bush, B.; Daniel, B.; Heimiller, D.; Melius, J. Hydrogen Infrastructure Cost Estimates and Blending Hydrogen into Natural Gas Pipelines 2012. Available online: https://www.hydrogen.energy.gov/pdfs/htac_nov12_3_melaina.pdf (accessed on 1 December 2019).
  636. PG&E gas R&D and innovation. Pipeline Hydrogen 2018. Available online: https://www.pge.com/pge_global/common/pdfs/for-our-business-partners/interconnection-renewables/interconnections-renewables/Whitepaper_PipelineHydrogenAnalysis.pdf (accessed on 1 December 2019).
  637. Melaina, M.; Antonia, O.; Penev, M. Blending Hydrogen into Natural Gas Pipeline Networks: A Review of Key Issues; National Renewable Energy Laboratory: Golden, CO, USA, 2013.
  638. Saffers, J.B.; Molkov, V.V. Hydrogen safety engineering framework and elementary design safety tools. Int. J. Hydrog. Energy 2014, 39, 6268–6285. [Google Scholar] [CrossRef]
  639. Saffers, J.B.; Molkov, V.V. Towards hydrogen safety engineering for reacting and non-reacting hydrogen releases. J. Loss Prev. Process Ind. 2013, 26, 344–350. [Google Scholar] [CrossRef]
  640. Ogden, J.; Jaffe, A.M.; Scheitrum, D.; McDonald, Z.; Miller, M. Natural gas as a bridge to hydrogen transportation fuel: Insights from the literature. Energy Policy 2018, 115, 317–329. [Google Scholar] [CrossRef]
  641. Holm, T. Aspects of the mechanism of the flame ionization detector. J. Chromatogr. A 1999, 842, 221–227. [Google Scholar] [CrossRef]
  642. Ongkiehong, L. The Hydrogen Flame Ionization Detector. Ph.D. Thesis, Technische Hogeschool Eindhoven, Eindhoven, The Netherlands, 1960. [Google Scholar]
  643. Toonen, A.; van Loon, R. Hydrogen Detection with a TCD Using Mixed Carrier Gas on the Agilent Micro GC; Agilent Technologies, Inc.: Santa Clara, CA, USA, 2013. [Google Scholar]
  644. Emerson. Electrochemical vs. Semiconductor Gas Detection—A Critical Choice; Patent and Trademark Office: Washington, DC, USA, 2019.
  645. Trinchi, A.; Kandasamy, S.; Wlodarski, W. High temperature field effect hydrogen and hydrocarbon gas sensors based on SiC MOS devices. Sens. Actuators B Chem. 2008, 133, 705–716. [Google Scholar] [CrossRef]
  646. Park, N.H.; Akamatsu, T.; Itoh, T.; Izu, N.; Shin, W. Calorimetric thermoelectric gas sensor for the detection of hydrogen, methane and mixed gases. Sensors 2014, 14, 8350–8362. [Google Scholar] [CrossRef] [PubMed]
  647. Rego, R.; Caetano, N.; Mendes, A. Hydrogen/methane and hydrogen/nitrogen sensor based on the permselectivity of polymeric membranes. Sens. Actuators B Chem 2005, 112, 150–159. [Google Scholar] [CrossRef]
  648. Altfeld, K.; Pinchbeck, D. Admissible hydrogen concentrations in natural gas systems. Gas Energy 2013, 2103, 1–16. [Google Scholar]
  649. Leicher, J.; Nowakowski, T.; Giese, A.; Görner, K. Power-to-gas and the consequences: Impact of higher hydrogen concentrations in natural gas on industrial combustion processes. Energy Procedia 2017, 120, 96–103. [Google Scholar] [CrossRef]
  650. Graf, F.; Götz, M.; Bajohr, S. Injection of biogas, SNG and hydrogen. Gwf-Gas ErdgasInt. Issue 2011, 2, 30–40. [Google Scholar]
  651. Haeseldonckx, D.; D’haeseleer, W. The use of the natural-gas pipeline infrastructure for hydrogen transport in a changing market structure. Int. J. Hydrog. Energy 2007, 32, 1381–1386. [Google Scholar] [CrossRef]
  652. IEA. Reduction of CO2 Emission by Adding Hydrogen to Natural Gas; IEA: Paris, France, 2003. [Google Scholar]
  653. Dodds, P.E.; Demoullin, S. Conversion of the UK gas system to transport hydrogen. Int. J. Hydrog. Energy 2013, 38, 7189–7200. [Google Scholar] [CrossRef] [Green Version]
  654. Branan, C.R. Metallurgy. In Rules of Thumb for Chemical Engineers, 4th ed.; Branan, C.R., Ed.; Gulf Professional Publishing: Burlington, NY, USA, 2005; pp. 277–299. [Google Scholar]
  655. PG&E gas R&D and innovation. Hydrogen Technical Analysis 2018. Available online: https://www.pge.com/pge_global/common/pdfs/for-our-business-partners/interconnection-renewables/interconnections-renewables/Hydrogen_TechnicalAnalysis.pdf (accessed on 1 December 2019).
  656. Revie, R.W. Uhlig’s Corrosion Handbook; Wiley: Hoboken, NJ, USA, 2011. [Google Scholar]
  657. Robertson, I.M.; Sofronis, P.; Nagao, A.; Martin, M.L.; Wang, S.; Gross, D.W.; Nygren, K.E. Hydrogen embrittlement understood. Metall. Mater. Trans. B 2015, 46, 1085–1103. [Google Scholar] [CrossRef]
  658. Cabrini, M.; Lorenzi, S.; Marcassoli, P.; Pastore, T. Hydrogen embrittlement behaviour of HSLA linepipe steels under cathodic protection. Corros. Rev. 2011, 29, 261–274. [Google Scholar] [CrossRef]
  659. Zabrzeski, L.; Janusz, P.; Liszka, K.; Łaciak, M.; Szurlej, A. Hydrogen-Natural Gas mixture compression in case of transporting through high-pressure gas pipelines. Iop Conf. Ser. Earth Environ. Sci. 2019, 214, 012137. [Google Scholar] [CrossRef]
  660. Haeseldonckx, D. Concrete Transition Issues Towards a Fully-Fledged Use of Hydrogen as an Energy Carrier. Ph.D. Thesis, KU Leuven, Leuven, Belgium, 2009. [Google Scholar]
  661. Mcdonell, V.; Colorado, A. Effect of Variable Fuel Composition on Emissions and Lean Blowoff Stability Performance Analysis of Nine Industrial Combustion Applications; California Energy Commission: Sacramento, CA, USA, 2016.
  662. U.S. Department of Energy. Blending of Hydrogen in Natural Gas Distribution Systems; U.S. Department of Energy: Washington, DC, USA, 1978.
  663. Scholten, F.L.; Wolters, M. Hydrogen diffusion throught plastic pipes. In Proceedings of the 17th International Plastic Fuel-Gas Pipe Symposium 2002, San Francisco, CA, USA, 20–23 October 2002; pp. 280–284. [Google Scholar]
  664. UNI EN ISO 14532:2017—“Natural gas- Vocabulary” 2017. Available online: http://store.uni.com/catalogo/index.php/catalog/product/view/id/265256/s/en-iso-14532-2017/category/6693/?___store=en&josso_back_to=http%3A%2F%2Fstore.uni.com%2Fjosso-security-check.php&josso_cmd=login_optional&josso_partnerapp_host=store.uni.com&___from_store=it (accessed on 1 December 2019).
  665. Kuczynski, S.; Łaciak, M.; Olijnyk, A.; Szurlej, A.; Włodek, T. Thermodynamic and technical issues of hydrogen and methane-hydrogen mixtures pipeline transmission. Energies 2019, 12, 569. [Google Scholar] [CrossRef] [Green Version]
  666. Kurdyumov, V.N.; Fernández, E.; Liñán, A. Flame flashback and propagation of premixed flames near a wall. In Proceedings of the Combustion Institute, Edinburgh, UK, 30 July–4 August 2000; pp. 1883–1889. [Google Scholar]
  667. BP; IGU. Guidebook to Gas Interchangeability and Gas Quality; BP: London, UK, 2011. [Google Scholar]
  668. Youcai, Z. Municipal solid waste incineration process and generation of bottom ash and fly ash. In Pollution Control and Resource Recovery: Municipal Solid Wastes Incineration; Youcai, Z., Ed.; Butterworth-Heinemann: Oxford, UK, 2017; pp. 1–59. [Google Scholar]
  669. Sterlepper, J.; Orrzewalla, J. Recovery of Commercially Valuable Products from Used Rubber. Tires. Patent EP0643264A1, 27 February 1995. [Google Scholar]
  670. Nitschke-kowsky, P. Impact of Hydrogen Admixture on Installed Gas Appliances 2012. Available online: http://members.igu.org/old/IGU%20Events/wgc/wgc-2012/wgc-2012-proceedings/working-committee-papers/working-committee-woc5/expert-forum-5.b/impact-of-hydrogen-admixture-on-installed-gas-appliances/view/++widget++form.widgets.download/@@download/Petra-Nitschke-Kowsky-%25E2%2580%2593-Werner-We%25C3%259Fing.pdf. (accessed on 1 December 2019).
  671. Huth, M.; Heilos, A. Fuel flexibility in gas turbine systems: Impact on burner design and performance. In Modern Gas Turbine Systems; Jansohn, P., Ed.; Woodhead Publishing: Cambridge, UK, 2013; pp. 635–684. [Google Scholar]
  672. De Vries, H.; Mokhov, A.V.; Levinsky, H.B. The impact of natural gas/hydrogen mixtures on the performance of end-use equipment: Interchangeability analysis for domestic appliances. Appl. Energy 2017, 208, 1007–1019. [Google Scholar] [CrossRef]
  673. Khatir, N.; Abdelkrim, L. Effect of hydrogen addition to methane on ICE emissions and performances: A brief review. J. Sci. Res. Rev. 2013, 2, 75–80. [Google Scholar]
  674. Staffell, I.; Scamman, D.; Velazquez Abad, A.; Balcombe, P.; Dodds, P.E.; Ekins, P.; Shah, N.; Ward, K.R. The role of hydrogen and fuel cells in the global energy system. Energy Environ. Sci. 2019, 12, 463–491. [Google Scholar] [CrossRef] [Green Version]
  675. Benesch, R.; Jacksier, T. Hydrogen and material quality issues for PEM fuel cells. In Proceedings of the 2005 IEEE Vehicle Power and Propulsion Conference, Chicaco, IL, USA, 7–9 September 2005; pp. 646–651. [Google Scholar]
  676. U.S. Department of Energy; Ohi, J.M.; Vanderborgh, N.; Voecks, G. Hydrogen Fuel Quality Specifications for Polymer Electrolyte Fuel Cells in Road Vehicles; Office of Energy Efficiency and Renewable Energy: Washington, DC, USA, 2016.
  677. ISO 14687-2-“Hydrogen fuel—Product specification” 2012. Available online: https://www.iso.org/standard/55083.html (accessed on 1 December 2019).
  678. Haque, M.A.; Sulong, A.B.; Loh, K.S.; Majlan, E.H.; Husaini, T.; Rosli, R.E. Acid doped polybenzimidazoles based membrane electrode assembly for high temperature proton exchange membrane fuel cell: A review. Int. J. Hydrog. Energy 2017, 42, 9156–9179. [Google Scholar] [CrossRef]
  679. Ianniello, R.; Schmidt, V.M.; Stimming, U.; Stumper, J.; Wallau, A. CO adsorption and oxidation on Pt and Pt/Ru alloys: Dependence on substrate composition. Electrochim. Acta 1994, 39, 1863–1869. [Google Scholar] [CrossRef]
  680. Baschuk, J.J.; Li, X. Carbon monoxide poisoning of proton exchange membrane fuel cells. Int. J. Energy Res. 2001, 25, 695–713. [Google Scholar] [CrossRef]
  681. Sethuraman, V.A.; Weidner, J.W. Analysis of sulfur poisoning on a PEM fuel cell electrode. Electrochim. Acta 2010, 55, 5683–5694. [Google Scholar] [CrossRef] [Green Version]
  682. Hongsirikarn, K.; Jr, J.; Greenway, S.; Creager, S. Influence of ammonia on the conductivity of Nafion membranes. J. Power Sources 2010, 195, 30–38. [Google Scholar] [CrossRef]
  683. Besancon, B.M.; Hasanov, V.; Imbault-Lastapis, R.; Benesch, R.; Barrio, M.; Mølnvik, M.J. Hydrogen quality from decarbonized fossil fuels to fuel cells. Int. J. Hydrog. Energy 2009, 34, 2350–2360. [Google Scholar] [CrossRef]
  684. Díaz, M.A.; Iranzo, A.; Rosa, F.; Isorna, F.; López, E.; Bolivar, J.P. Effect of carbon dioxide on the contamination of low temperature and high temperature PEM (polymer electrolyte membrane) fuel cells. Influence of temperature, relative humidity and analysis of regeneration processes. Energy 2015, 90, 299–309. [Google Scholar]
  685. Bruijn, F.; Papageorgopoulos, D.C.; Sitters, E.; Janssen, G. The influence of carbon dioxide on PEM fuel cell anodes. J. Power Sources 2002, 110, 117–124. [Google Scholar] [CrossRef]
  686. Lanzini, A.; Madi, H.; Chiodo, V.; Papurello, D.; Maisano, S.; Santarelli, M.; Van herle, J. Dealing with fuel contaminants in biogas-fed solid oxide fuel cell (SOFC) and molten carbonate fuel cell (MCFC) plants: Degradation of catalytic and electro-catalytic active surfaces and related gas purification methods. Prog. Energy Combust. Sci. 2017, 61, 150–188. [Google Scholar] [CrossRef] [Green Version]
  687. Dayton, D.C.; Ratcliff, M.; Bain, R. Fuel Cell Integraton—A Study of the Impacts of Gas Quality and Impurities; NREL Milestone Report: Golden, CO, USA, 2001.
  688. Cavalli, A.; Bernardini, R.; Del Carlo, T.; Aravind, P.V. Effect of H2S and HCl on solid oxide fuel cells fed with simulated biosyngas containing primary tar. Energy Sci. Eng. 2019, 7, 2456–2468. [Google Scholar] [CrossRef] [Green Version]
  689. Sigot, L.; Ducom, G.; Benadda, B.; Labouré, C. Comparison of adsorbents for H2S and D4 removal for biogas conversion in a solid oxide fuel cell. Environ. Technol. 2016, 37, 86–95. [Google Scholar] [CrossRef] [PubMed]
  690. Weinlaender, C.; Neubauer, R.; Hochenauer, C. Low-temperature H2S removal for solid oxide fuel cell application with metal oxide adsorbents. Adsorp. Sci. Technol. 2017, 35, 120–136. [Google Scholar] [CrossRef] [Green Version]
  691. Elwell, A.C.; Elsayed, N.H.; Kuhn, J.N.; Joseph, B. Design and analysis of siloxanes removal by adsorption from landfill gas for waste-to-energy processes. Waste Manag. 2018, 73, 189–196. [Google Scholar] [CrossRef]
  692. Ryckebosch, E.; Drouillon, M.; Vervaeren, H. Techniques for transformation of biogas to biomethane. Biomass Bioenergy 2011, 35, 1633–1645. [Google Scholar] [CrossRef]
  693. Boldrin, P.; Millan-Agorio, M.; Brandon, N.P. Effect of sulfur- and tar-contaminated syngas on solid oxide fuel cell anode materials. Energy Fuels 2015, 29, 442–446. [Google Scholar] [CrossRef] [Green Version]
  694. Vecchione, L.; Cossio, F.; Longo, L. Comparison of different systems for tar removal for renewable energy derivation from biomass gasification. Contemp. Eng. Sci. 2016, 9, 413–423. [Google Scholar] [CrossRef]
  695. Mcphail, S.J.; Moreno, A.; Belella, E.; Abate, L.; Cigolotti, V. The New Fuel Chain: From Renewables to Fuel Cells; ENEA: Kista, Sweden, 2016. [Google Scholar]
  696. Blanco, H.; Faaij, A. A review at the role of storage in energy systems with a focus on Power to Gas and long-term storage. Renew. Sustain. Energy Rev. 2018, 81, 1049–1086. [Google Scholar] [CrossRef]
  697. Ma, J.; Li, Q.; Kühn, M.; Nakaten, N. Power-to-gas based subsurface energy storage: A review. Renew. Sustain. Energy Rev. 2018, 97, 478–496. [Google Scholar] [CrossRef]
  698. Bang, H.J.; Stockar, S.; Muratori, M.; Rizzoni, G. Modeling and analysis of a CNG residential refueling system. In Proceedings of the ASME 2014 Dynamic Systems and Control Conference, DSCC 2014, San Antonio, TX, USA, 22–24 October 2014; pp. 1–9. [Google Scholar]
  699. Graf, F.; Riedl, J.; Kröger, K.; Reimert, R.; Meyer, J. Monitoring CNG quality in Germany. In Proceedings of the International Gas Union World Gas Conference Papers 2009, Buenos Aires, Argentina, 5–9 October 2009; pp. 3588–3597. [Google Scholar]
  700. Thomas, S.; Dawe, R.A. Review of ways to transport natural gas energy from countries which do not need the gas for domestic use. Energy 2003, 28, 1461–1477. [Google Scholar] [CrossRef]
  701. Hosseini, M.; Dincer, I.; Naterer, G.F.; Rosen, M.A. Thermodynamic analysis of filling compressed gaseous hydrogen storage tanks. Int. J. Hydrog. Energy 2012, 37, 5063–5071. [Google Scholar] [CrossRef]
  702. He, C.; Yu, R.; Sun, H.; Chen, Z. Lightweight multilayer composite structure for hydrogen storage tank. Int. J. Hydrog. Energy 2016, 41, 15812–15816. [Google Scholar] [CrossRef]
  703. Mokhatab, S.; Mak, J.Y.; Valappil, J.V.; Wood, D.A. Handbook of Liquefied Natural Gas; Elsevier: Amsterdam, The Netherlands, 2013. [Google Scholar]
  704. Germanischer Lloyd. Rules for Classification and Construction: Ship Technology-Bridge Arrangement and Equipment on Seagoing Ships; Germanischer Lloyd: Hamborg, Germany, 2008. [Google Scholar]
  705. Aasadnia, M.; Mehrpooya, M. Large-scale liquid hydrogen production methods and approaches: A review. Appl. Energy 2018, 212, 57–83. [Google Scholar] [CrossRef]
  706. Makridis, S.S. Hydrogen storage and compression. In Methane and Hydrogen for Energy Storage; IET: London, UK, 2016; pp. 1–28. [Google Scholar]
  707. Sun, Z.G.; Wang, R.; Ma, R.; Guo, K.; Fan, S. Natural gas storage in hydrates with the presence of promoters. Energy Convers. Manag. 2003, 44, 2733–2742. [Google Scholar] [CrossRef]
  708. Xia, Y.; Yang, Z.; Zhu, Y. Porous carbon-based materials for hydrogen storage: Advancement and challenges. J. Mater. Chem. A 2013, 1, 9365–9381. [Google Scholar] [CrossRef]
  709. Poomisitiporn, K.; Rangsunvigit, P.; Kitiyanan, B.; Kulprathipanja, S. Competitive adsorption of methane and carbon dioxide on different activated carbons. Chem. Eng. Trans. 2016, 52, 121–126. [Google Scholar]
  710. Feroldi, M.; Neves, A.C.; Bach, V.R.; Alves, H.J. Adsorption technology for the storage of natural gas and biomethane from biogas. Int. J. Energy Res. 2016, 40, 1890–1900. [Google Scholar] [CrossRef]
  711. Nie, Z.; Lin, Y.; Jin, X. Research on the theory and application of adsorbed natural gas used in new energy vehicles: A review. Front. Mech. Eng. 2016, 11, 258–274. [Google Scholar] [CrossRef]
  712. Park, J.E.; Lee, G.B.; Hwang, S.Y.; Kim, J.H.; Hong, B.U.; Kim, H.; Kim, S. The effects of methane storage capacity using upgraded activated carbon by KOH. Appl. Sci. 2018, 8, 1596. [Google Scholar] [CrossRef] [Green Version]
  713. Mota, J.P.B.; Rodrigues, A.E.; Saatdjian, E.; Tondeur, D. Dynamics of natural gas adsorption storage systems employing activated carbon. Carbon 1997, 35, 1259–1270. [Google Scholar] [CrossRef]
  714. Mota, J.P.B. Impact of gas composition on natural gas storage by adsorption. Aiche J. 1999, 45, 986–996. [Google Scholar] [CrossRef]
  715. Sun, Y.; Liu, C.; Su, W.; Zhou, Y.; Zhou, L. Principles of methane adsorption and natural gas storage. Adsorption 2009, 15, 133–137. [Google Scholar] [CrossRef]
  716. Taheri, Z.; Shabani, M.R.; Nazari, K.; Mehdizaheh, A. Natural gas transportation and storage by hydrate technology: Iran case study. J. Nat. Gas Sci. Eng. 2014, 21, 846–849. [Google Scholar] [CrossRef]
  717. Rogers, R.E.; Toghiani, R.K. Gas-hydrate storage of natural gas. In Proceedings of the ASEE Annual Conference Proceedings, Albuquerque, Mexico, 24 June 2001; pp. 5195–5201. [Google Scholar]
  718. Sloan, E.D. Clathrate hydrates: The other common solid water phase. Ind. Eng. Chem. Res. 2000, 39, 3123–3129. [Google Scholar] [CrossRef]
  719. Dawe, R.A.; Thomas, S.; Kromah, M. Hydrate technology for transporting natural gas. Eng. J. Univ. Qatar 2004, 16, 11–18. [Google Scholar]
  720. Chernov, A.A.; Pil’Nik, A.A.; Elistratov, D.S.; Mezentsev, I.V.; Meleshkin, A.V.; Bartashevich, M.V.; Vlasenko, M.G. New hydrate formation methods in a liquid-gas medium. Sci. Rep. 2017, 7, 1–9. [Google Scholar] [CrossRef] [Green Version]
  721. Khokhar, A.A.; Gudmundsson, J.S.; Sloan, E.D. Gas storage in structure H hydrates. Fluid Phase Equilibria 1998, 150, 383–392. [Google Scholar] [CrossRef]
  722. Czakkel, O.; Nagy, B.; Dobos, G.; Fouquet, P.; Bahn, E.; László, K. Static and dynamic studies of hydrogen adsorption on nanoporous carbon gels. Int. J. Hydrog. Energy 2019, 44, 18169–18178. [Google Scholar] [CrossRef]
  723. Terranova, M.L.; Orlanducci, S.; Rossi, M. Carbon Nanomaterials for Gas Adsorption; Jenny Stanford Publishing: Boca Raton, FL, USA, 2012. [Google Scholar]
  724. Eckert, J.; Cheetham, A.K. Hydrogen Storage Materials with Binding Intermediate between Physisorption and Chemisorption 2010. Available online: https://www.osti.gov/servlets/purl/1009133 (accessed on 1 December 2019).
  725. Bastos-Neto, M.; Patzschke, C.; Lange, M.; Möllmer, J.; Möller, A.; Fichtner, S.; Schrage, C.; Lässig, D.; Lincke, J.; Staudt, R.; et al. Assessment of hydrogen storage by physisorption in porous materials. Energy Environ. Sci. 2012, 5, 8294–8303. [Google Scholar] [CrossRef]
  726. Burress, J.; Kraus, M.; Beckner, M.; Cepel, R.; Suppes, G.; Wexler, C.; Pfeifer, P. Hydrogen storage in engineered carbon nanospaces. Nanotechnology 2009, 20, 204026. [Google Scholar] [CrossRef] [PubMed] [Green Version]
  727. Reyhani, A.; Mortazavi, S.Z.; Mirershadi, S.; Moshfegh, A.Z.; Parvin, P.; Golikand, A.N. Hydrogen storage in decorated multiwalled carbon nanotubes by Ca, Co, Fe, Ni, and Pd nanoparticles under ambient conditions. J. Phys. Chem. C 2011, 115, 6994–7001. [Google Scholar] [CrossRef]
  728. Brandon, N.N.P.; Thompsett, D. Fuel Cells Compendium.; Elsevier Science: Amsterdam, The Netherlands, 2005. [Google Scholar]
  729. Lototskyy, M.V.; Davids, M.W.; Tolj, I.; Klochko, Y.V.; Sekhar, B.S.; Chidziva, S.; Smith, F.; Swanepoel, D.; Pollet, B.G. Metal hydride systems for hydrogen storage and supply for stationary and automotive low temperature PEM fuel cell power modules. Int. J. Hydrog. Energy 2015, 40, 11491–11497. [Google Scholar] [CrossRef]
  730. Westerwaal, R.J.; Haije, W.G. Evaluation solid-state hydrogen storage systems. ECN Hydrog. Clean Fossil Fuels 2008, 43, 1–75. [Google Scholar]
  731. Kiehne, H.A. Battery Technology Handbook; Taylor & Francis: Abingdon, UK, 2003. [Google Scholar]
  732. Orimo, S.; Nakamori, Y.; Eliseo, J.R.; Züttel, A.; Jensen, C.M. Complex hydrides for hydrogen storage. Chem. Rev. 2007, 107, 4111–4132. [Google Scholar] [CrossRef]
  733. Züttel, A. Materials for hydrogen storage. Mater. Today 2003, 6, 24–33. [Google Scholar] [CrossRef]
  734. Millet, P. Hydrogen storage in hydride-forming materials. In Advances in Hydrogen Production, Storage and Distribution; Woodhead Publishing Limited: Cambridge, UK, 2014; pp. 341–467. [Google Scholar]
  735. Evans, D.J. A review of underground fuel storage events and putting risk into perspective with other areas of the energy supply chain. Geol. Soc. Spec. Publ. 2009, 313, 173–216. [Google Scholar] [CrossRef] [Green Version]
  736. Sunjay, S.; Singh, V.K. P-28 Geological storage: Underground gas storage. In Proceedings of the 8th Biennal International Conference & Exposition on Petroleum Geophysics, SPG Hyderabad, India, 1–3 February 2010; pp. 1–8. [Google Scholar]
  737. Berest, P.; Brouard, B.; Durup, J.G. Tightness tests in salt-cavern wells. Oil Gas Sci. Technol. 2001, 56, 451–469. [Google Scholar] [CrossRef] [Green Version]
  738. Wang, T.; Yan, X.; Yang, H.; Yang, X.; Jiang, T.; Zhao, S. A new shape design method of salt cavern used as underground gas storage. Appl. Energy 2013, 104, 50–61. [Google Scholar] [CrossRef]
  739. Bérest, P.; Bergues, J.; Brouard, B. Review of static and dynamic compressibility issues relating to deep underground salt caverns. Int. J. Rock Mech. Min. Sci. 1999, 36, 1031–1049. [Google Scholar] [CrossRef]
  740. Plaat, H. Underground gas storage: Why and how. In Underground Gas Storage—Worldwide Experiences and Future Development in the UK and Europe; Geological Society Special Publication: London, UK, 2009; pp. 25–37. [Google Scholar]
  741. Tooseh, E.K.; Jafari, A.; Teymouri, A. Experimental investigation of injection pressure effect on the natural gas storage in aquifers. Int. J. Chem. Eng. Appl. 2017, 8, 351–354. [Google Scholar] [CrossRef] [Green Version]
  742. Shi, L.; Wang, J.M.; Liao, G.Z.; Xiong, W.; Gao, S.S. Mechanism of gas-water flow at pore-level in aquifer gas storage. J. Cent. South Univ. 2013, 20, 3620–3626. [Google Scholar] [CrossRef]
  743. Golghanddashti, H.; Saadat, M.; Abbasi, S.; Shahrabadi, A. Experimental investigation of salt precipitation during gas injection into a depleted gas reservoir. In Proceedings of the International Petroleum Technology Conference, Bangkok, Thailand, 15–17 November 2011; p. 8. [Google Scholar]
  744. Tooseh, E.K.; Jafari, A.; Teymouri, A. Gas-water-rock interactions and factors affecting gas storage capacity during natural gas storage in a low permeability aquifer. Pet. Explor. Dev. 2018, 45, 1123–1128. [Google Scholar] [CrossRef]
  745. Verga, F. What’s conventional and what’s special in a reservoir study for underground gas storage. Energies 2018, 11, 1245. [Google Scholar] [CrossRef] [Green Version]
  746. Anyadiegwu, C.I.C. Optimizing the benefits of conversion of depleted oil reservoirs for underground natural gas storage in Nigeria. Int. J. Sci. Technol. 2012, 1, 17–43. [Google Scholar]
  747. Anyadiegwu, C.I.C.; Anyanwu, E.E.; Obah, B.; Ogueke, N.V. Performance analysis of depleted oil reservoirs for underground gas storage. Asia Pac. J. Multidiscip. Res. 2014, 2, 99–114. [Google Scholar]
  748. Sandu, M.; Ernecic, B.; Radu, G.; Iskhakov, A. Study on Underground Gas Storage in Europe and Central Asia; Technical Report; United Nations Economic Commission for Europe: Geneva, Switzerland, 2012. [Google Scholar]
  749. Mazarei, M.; Davarpanah, A.; Ebadati, A.; Mirshekari, B. The feasibility analysis of underground gas storage during an integration of improved condensate recovery processes. J. Pet. Explor. Prod. Technol. 2019, 9, 397–408. [Google Scholar] [CrossRef] [Green Version]
  750. Teatini, P.; Castelletto, N.; Ferronato, M.; Gambolati, G.; Janna, C.; Cairo, E.; Marzorati, D.; Colombo, D.; Ferretti, A.; Bagliani, A.; et al. Geomechanical response to seasonal gas storage in depleted reservoirs: A case study in the Po River basin, Italy. J. Geophys. Res. Earth Surf. 2011, 116, 1–21. [Google Scholar] [CrossRef]
  751. Tarkowski, R. Underground hydrogen storage: Characteristics and prospects. Renew. Sustain. Energy Rev. 2019, 105, 86–94. [Google Scholar] [CrossRef]
  752. Ozarslan, A. Large-scale hydrogen energy storage in salt caverns. Int. J. Hydrog. Energy 2012, 37, 14265–14277. [Google Scholar] [CrossRef]
  753. Gregory, S.P.; Barnett, M.J.; Field, L.P.; Milodowski, A.E. Subsurface microbial hydrogen cycling: Natural occurrence and implications for industry. Microorganisms 2019, 7, 53. [Google Scholar] [CrossRef] [PubMed] [Green Version]
  754. RAG. Underground Sun Storage—Storing Energy from Wind and Solar Power Below Ground 2016. Available online: https://www.underground-sun-storage.at/en/project/project-description.html (accessed on 1 December 2019).
  755. Aktiengesellschaft, R.-A.; Axiom angewandte Prozesstechnik GesmbH; Verbund AG; Montanuniversitat Leoben; Uuniversitat für Bodenkultur Wien; Energieinstitut an der Johannes Kepler Universität Linz. Publizierbarer Endbericht—Underground Sun Conversion; RAG: Vienna, Austria, 2013. [Google Scholar]
  756. RAG. Underground Sun Storage—Storing Sunshine 2016. Available online: https://www.rag-austria.at/fileadmin/bilder/0_NEU_RAG_Austria_AG/Unternehmen/sunconversion_broschuere_engl_180907_fin.pdf (accessed on 1 December 2019).
  757. Kirsanovs, V.; Blumberga, D.; Veidenbergs, I.; Rochas, C.; Vigants, E.; Vigants, G. Experimental investigation of downdraft gasifier at various conditions. Energy Procedia 2017, 128, 332–338. [Google Scholar] [CrossRef]
  758. Sarkar, S.; Kumar, A. Biohydrogen production from forest and agricultural residues for upgrading of bitumen from oil sands. Energy 2010, 35, 582–591. [Google Scholar] [CrossRef]
  759. Dascomb, J.; Krothapalli, A.; Fakhrai, R. Thermal conversion efficiency of producing hydrogen enriched syngas from biomass steam gasification. Int. J. Hydrog. Energy 2013, 38, 11790–11798. [Google Scholar] [CrossRef]
  760. Umeki, K.; Yamamoto, K.; Namioka, T.; Yoshikawa, K. High temperature steam-only gasification of woody biomass. Appl. Energy 2010, 87, 791–798. [Google Scholar] [CrossRef]
  761. Bhattacharya, A.; Bhattacharya, A.; Datta, A. Modeling of hydrogen production process from biomass using oxygen blown gasification. Int. J. Hydrog. Energy 2012, 37, 18782–18790. [Google Scholar] [CrossRef]
  762. Solar Hydrogen Generation Research 2011. Available online: https://www.osti.gov/servlets/purl/1025597 (accessed on 1 December 2019).
  763. Kromer, M.; Roth, K.; Takata, R.; Chin, P. Support for Cost Analyses on Solar-Driven High Temperature Thermochemical Water-Splitting Cycles; TIAX: Lexington, MA, USA, 2011. [Google Scholar]
  764. Yang, W.; Prabhakar, R.R.; Tan, J.; Tilley, S.D.; Moon, J. Strategies for enhancing the photocurrent, photovoltage, and stability of photoelectrodes for photoelectrochemical water splitting. Chem. Soc. Rev. 2019, 48, 4979–5015. [Google Scholar] [CrossRef]
  765. Verkehrswende, A.; Energiewende, A.; Frontier, E. Die Zukünftigen Kosten Strombasierter Synthetischer Brennstoffe; Agora Energiewende: Berlin, Germany, 2018. [Google Scholar]
  766. Ochs, D.; Ahrer, W. Life cycle analysis of hydrogen production from biomass fermentation. Chem. Eng. Trans. 2010, 21, 1159–1164. [Google Scholar]
  767. Gorre, J.; Ortloff, F.; van Leeuwen, C. Production costs for synthetic methane in 2030 and 2050 of an optimized Power-to-Gas plant with intermediate hydrogen storage. Appl. Energy 2019, 253, 113594. [Google Scholar] [CrossRef]
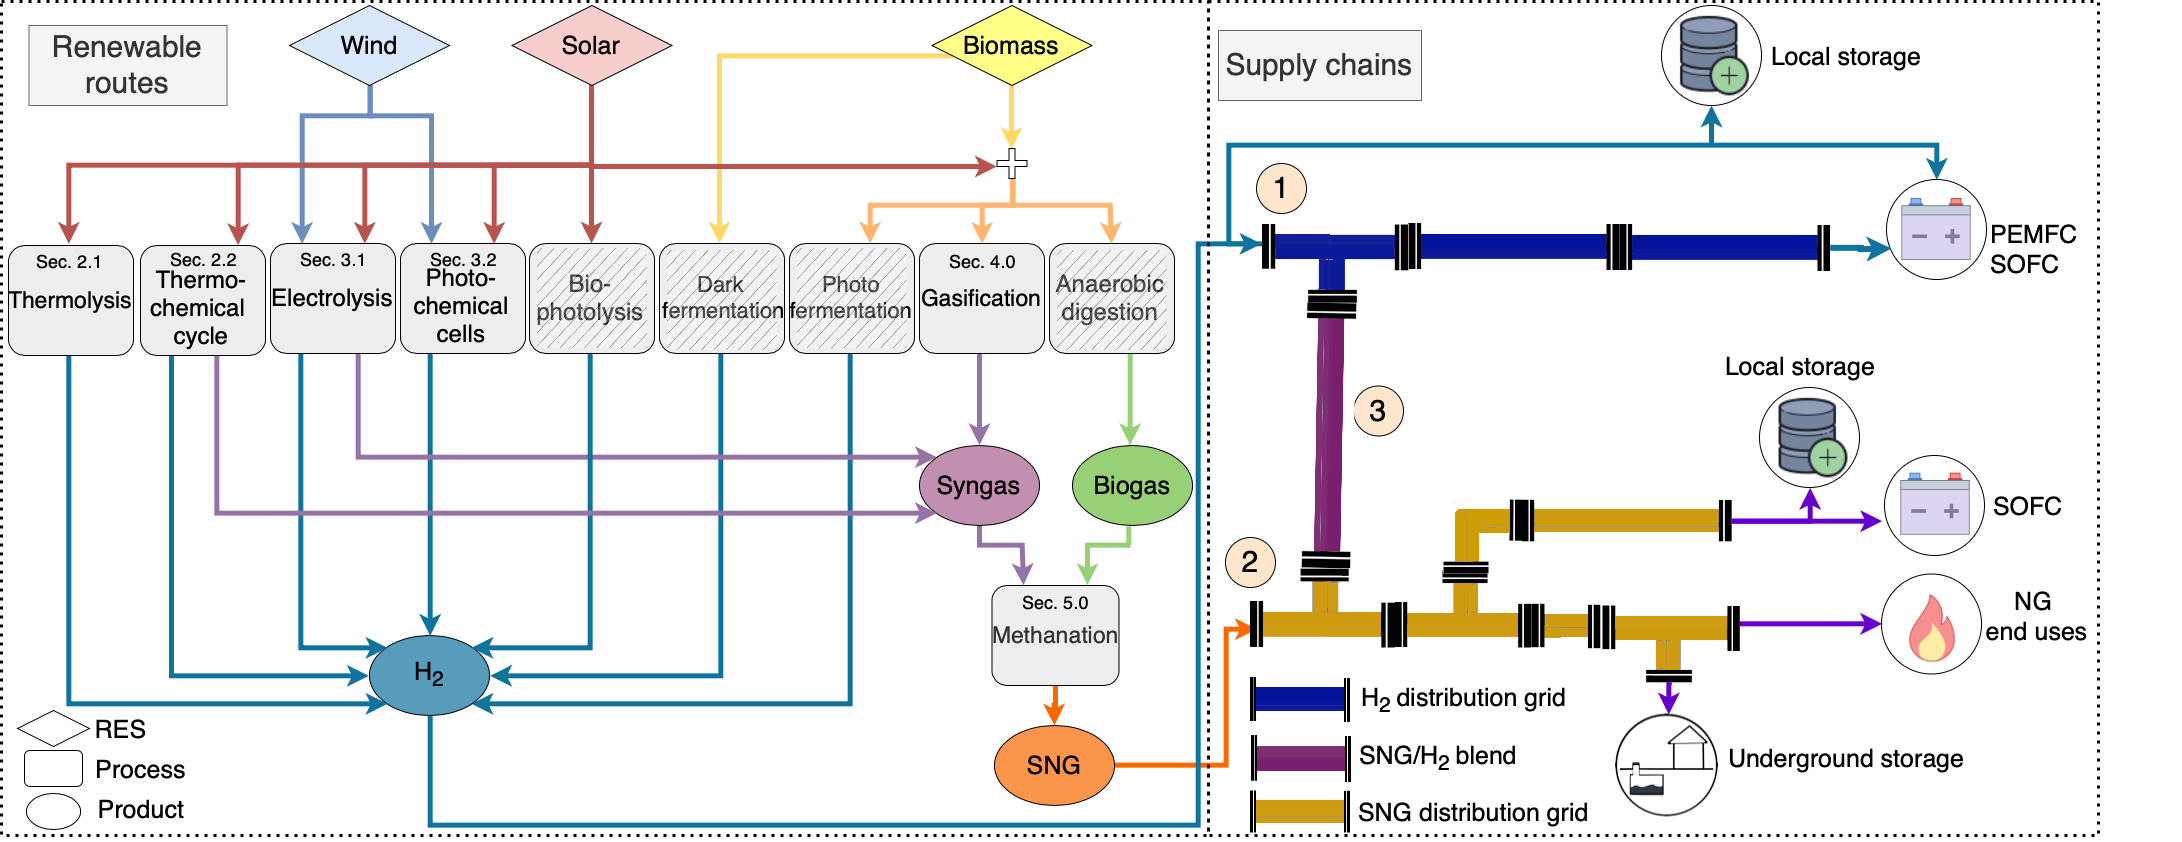
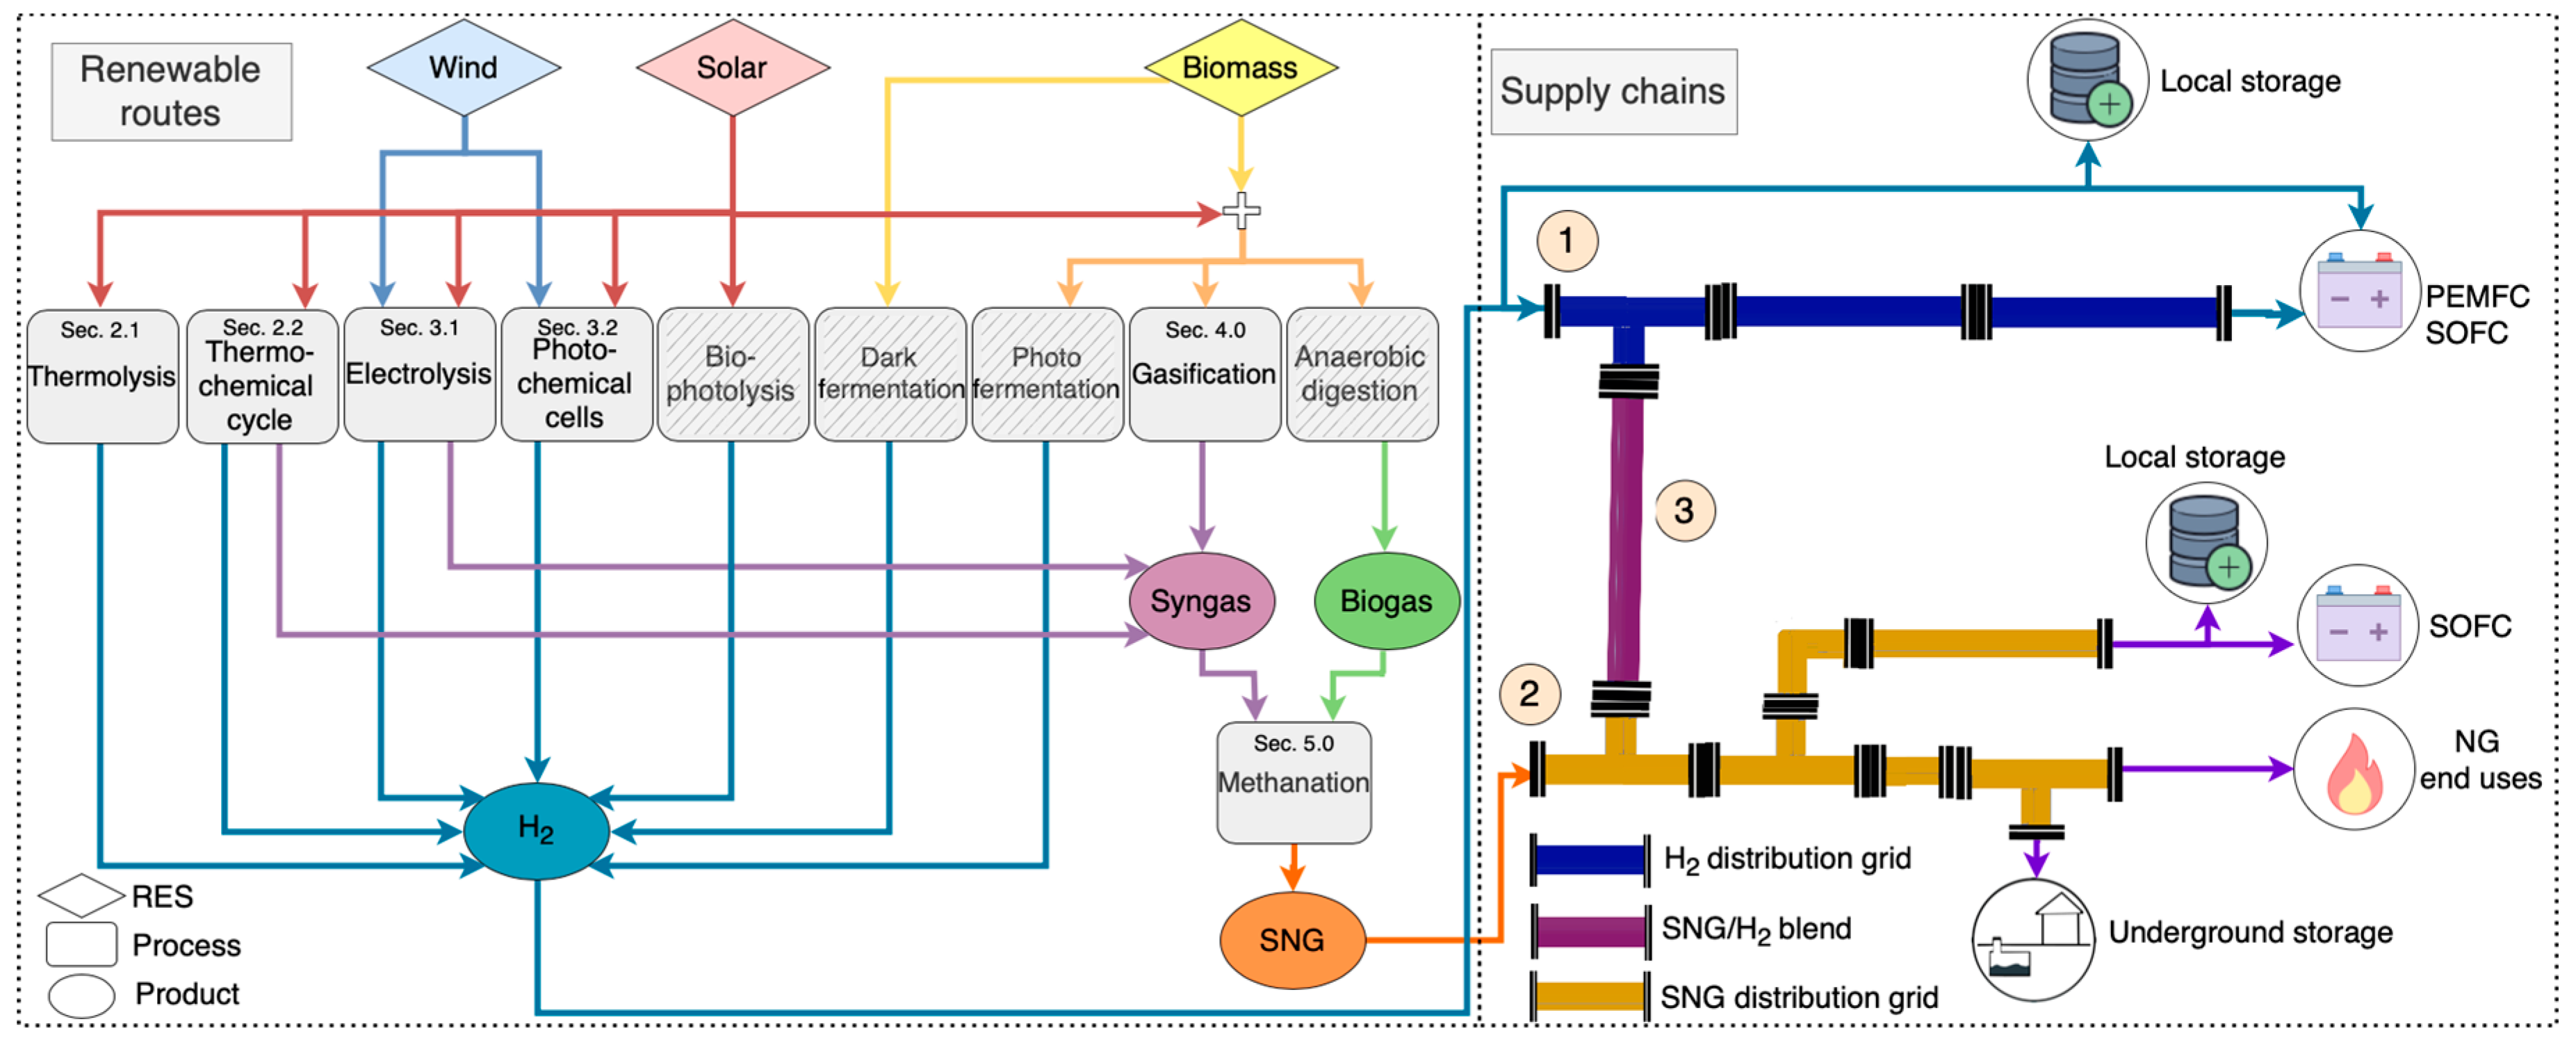
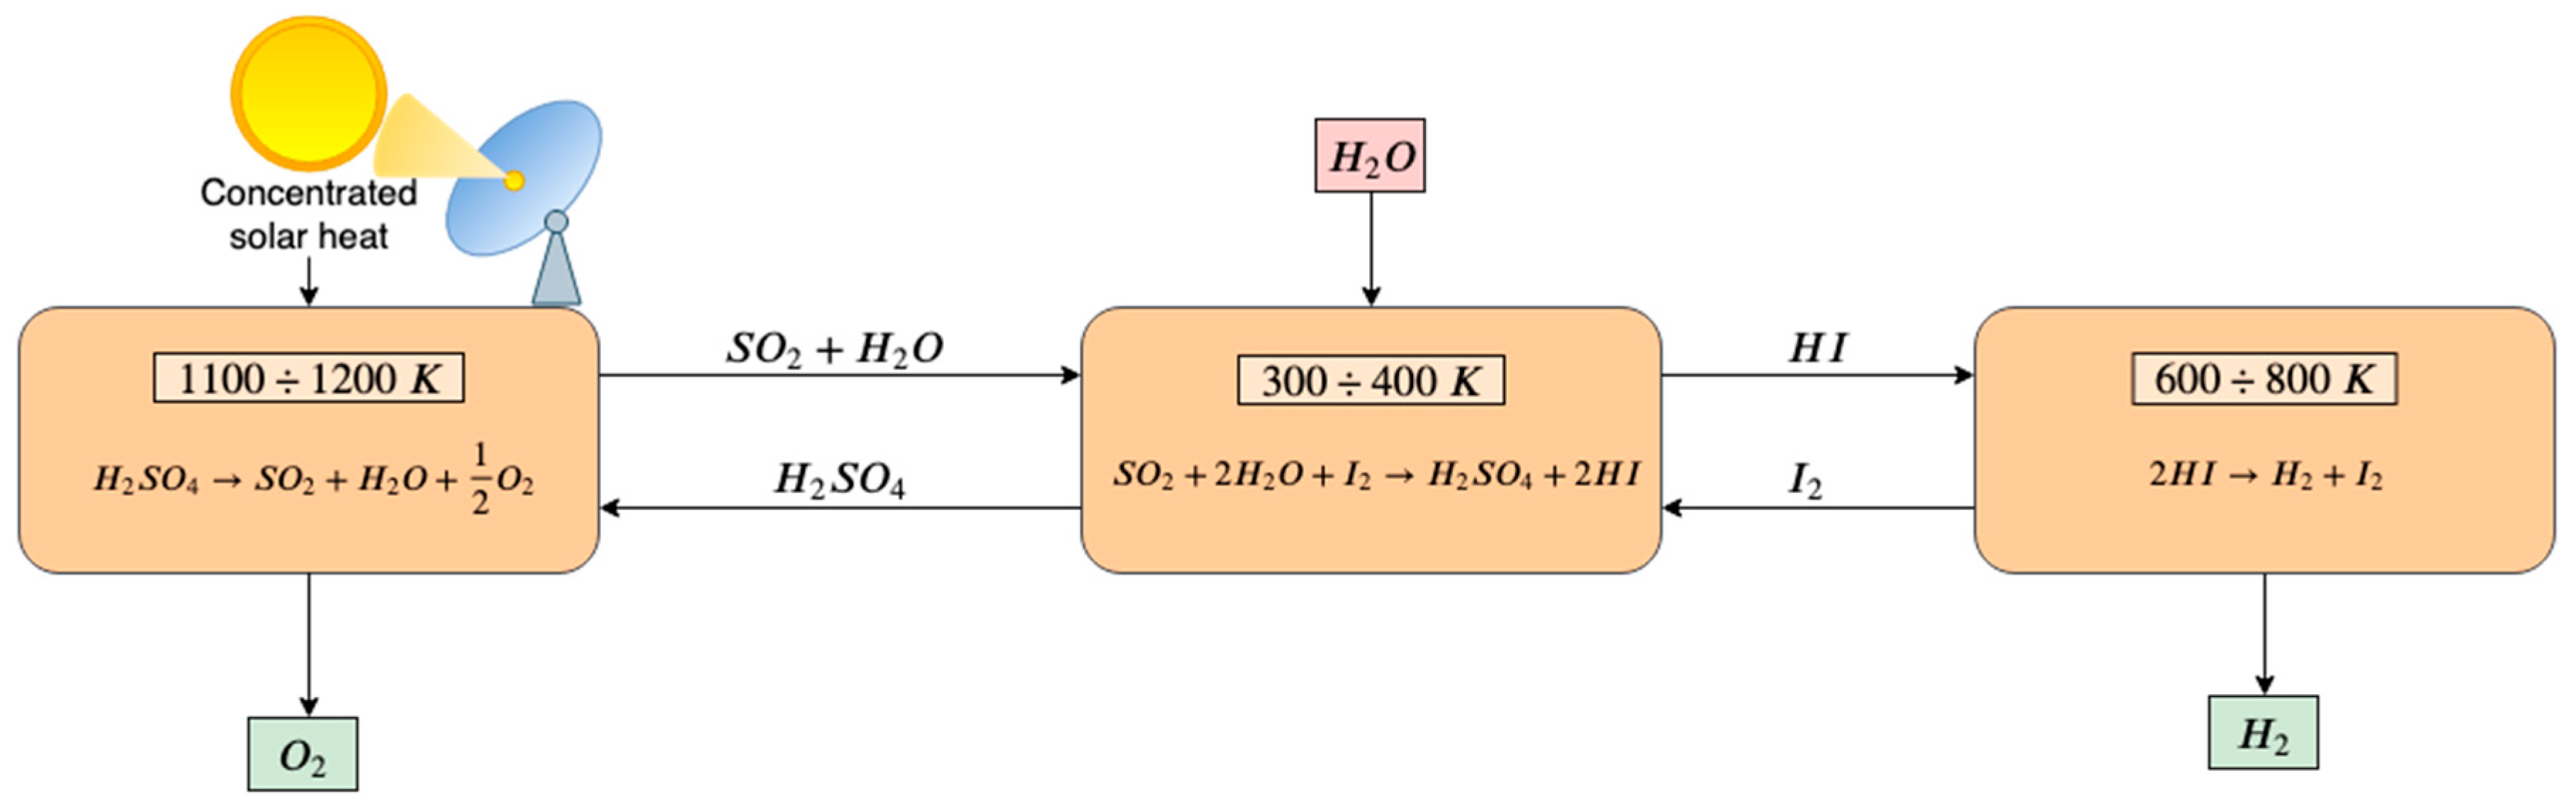
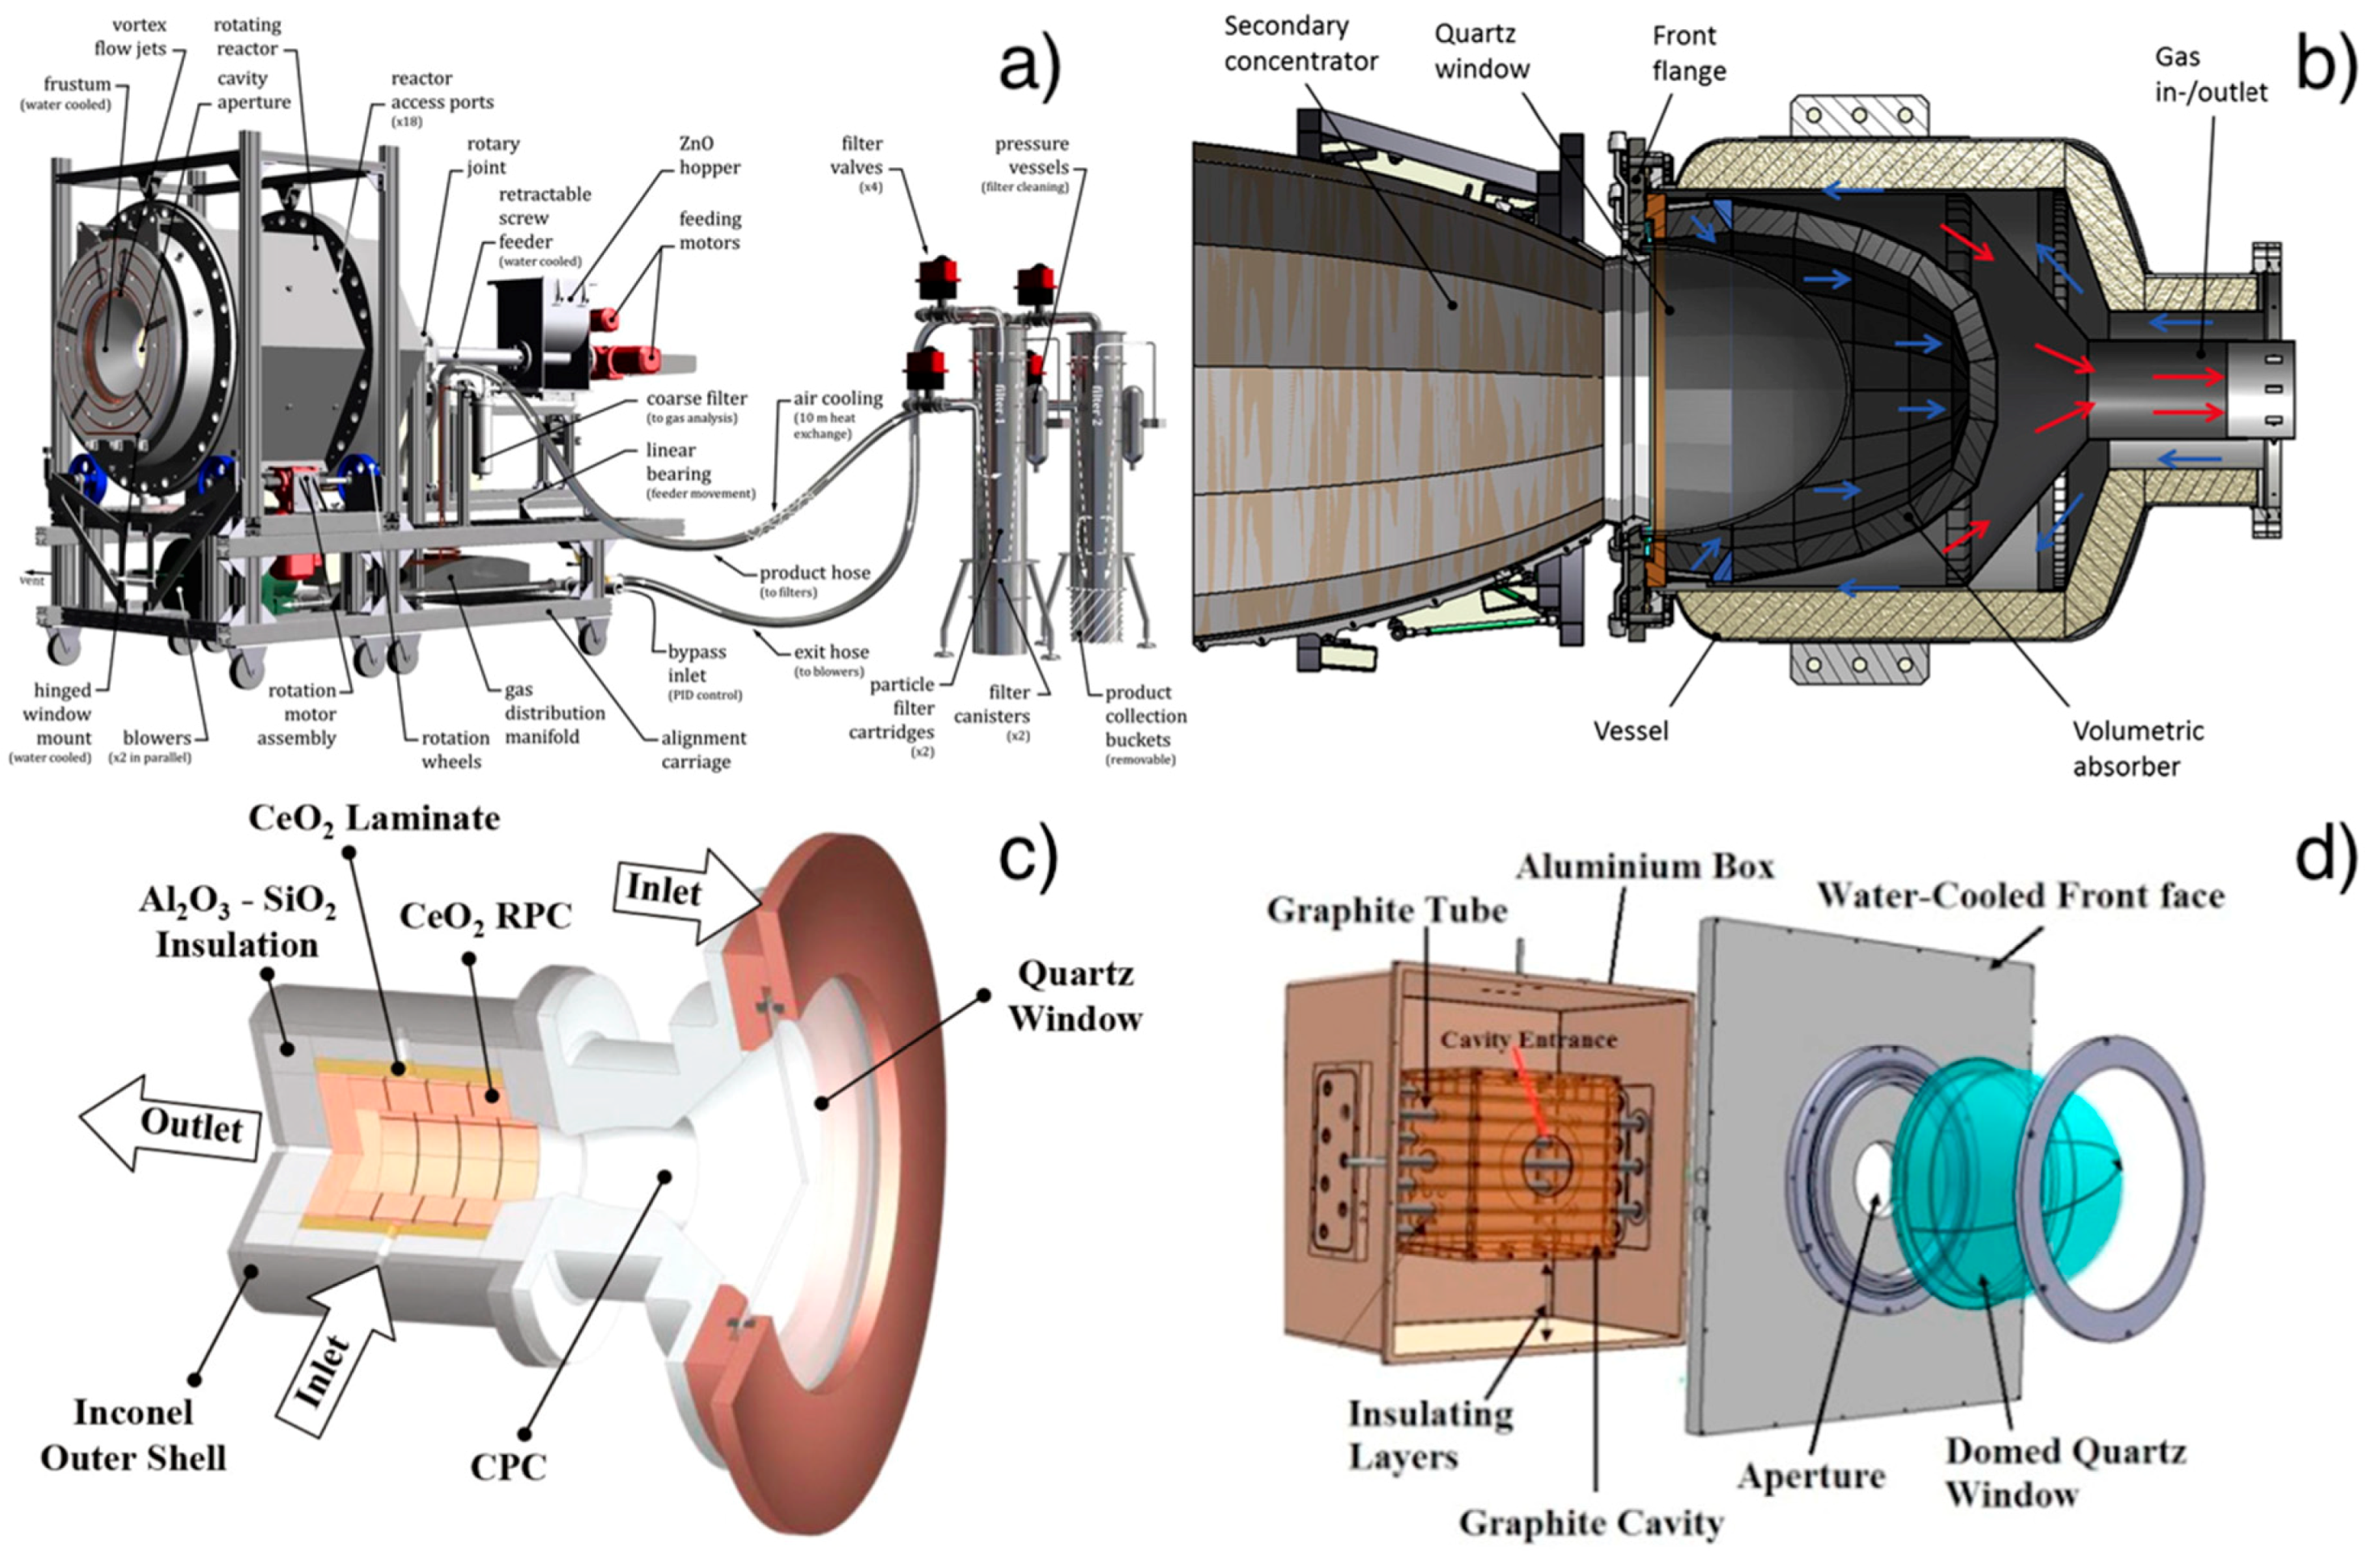
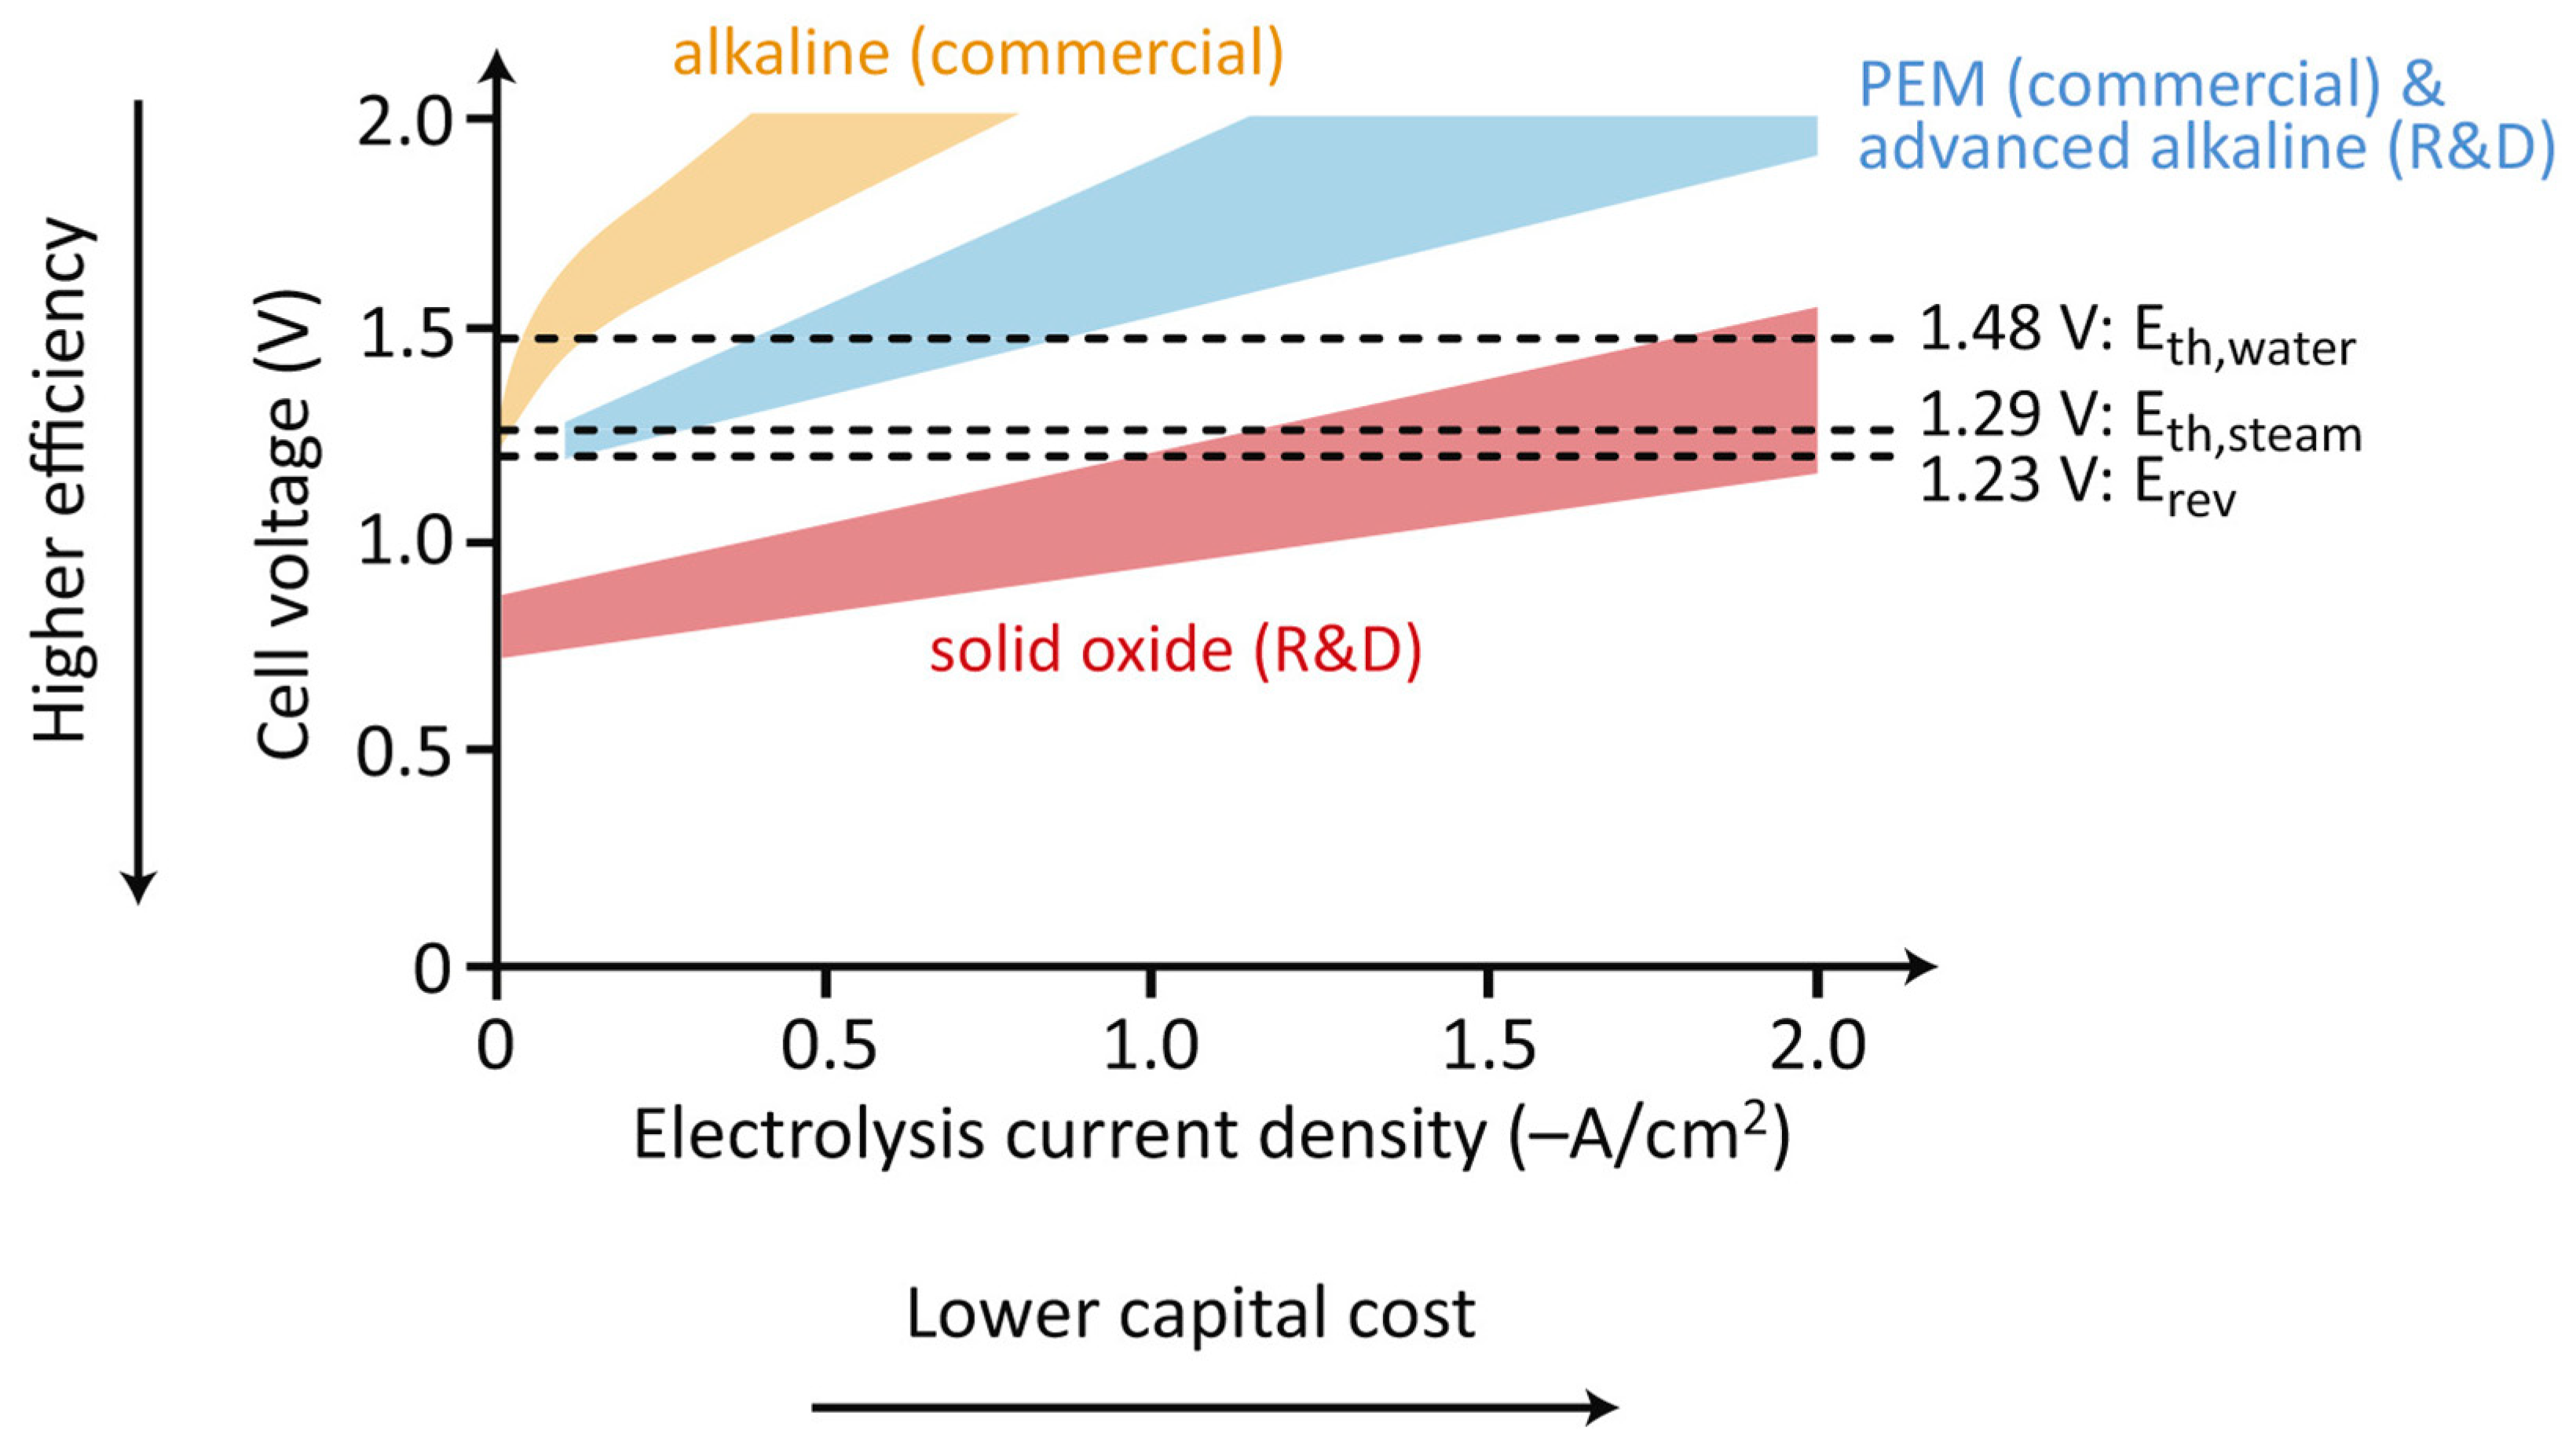
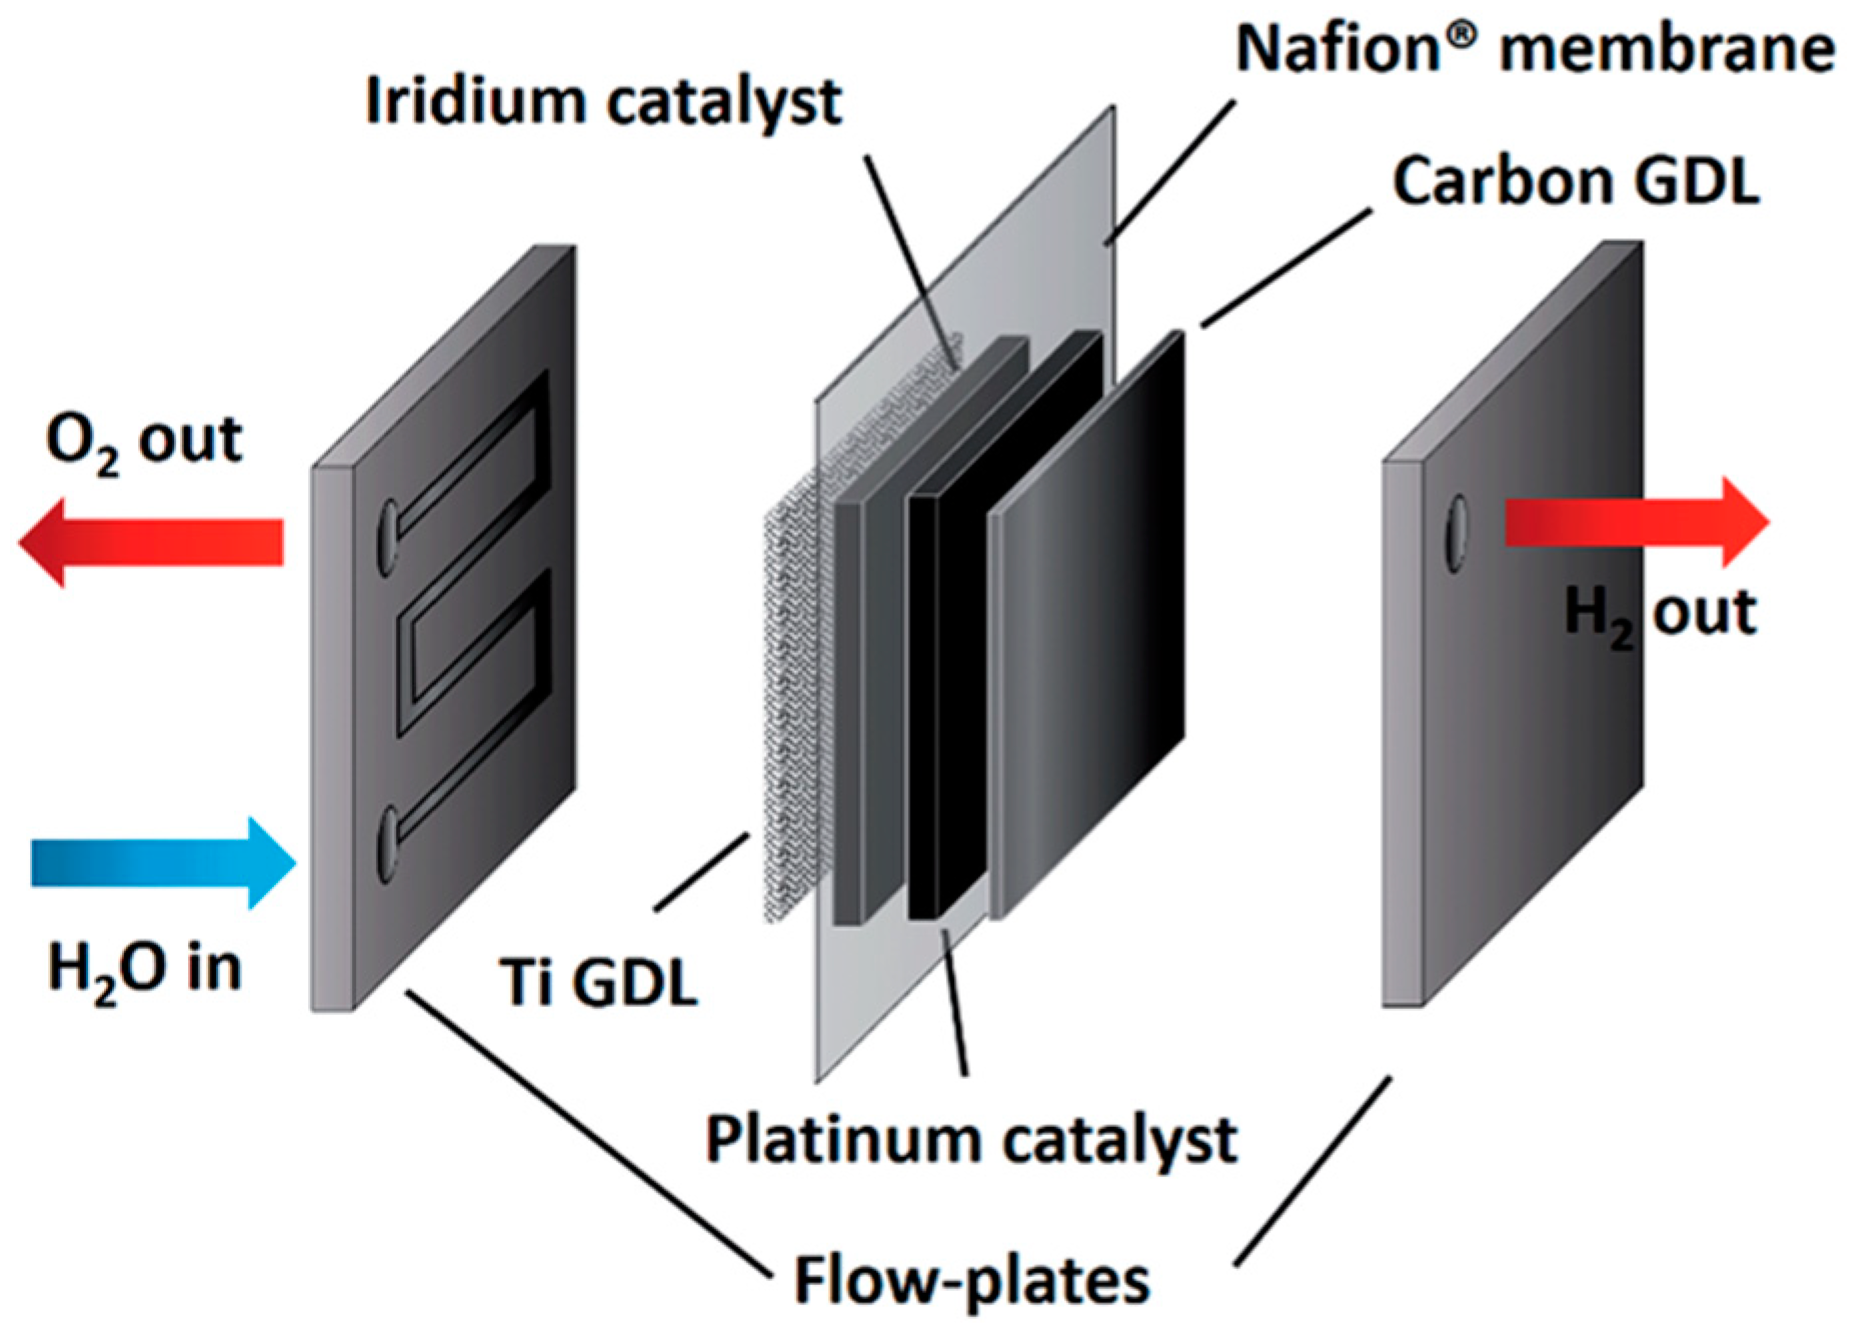
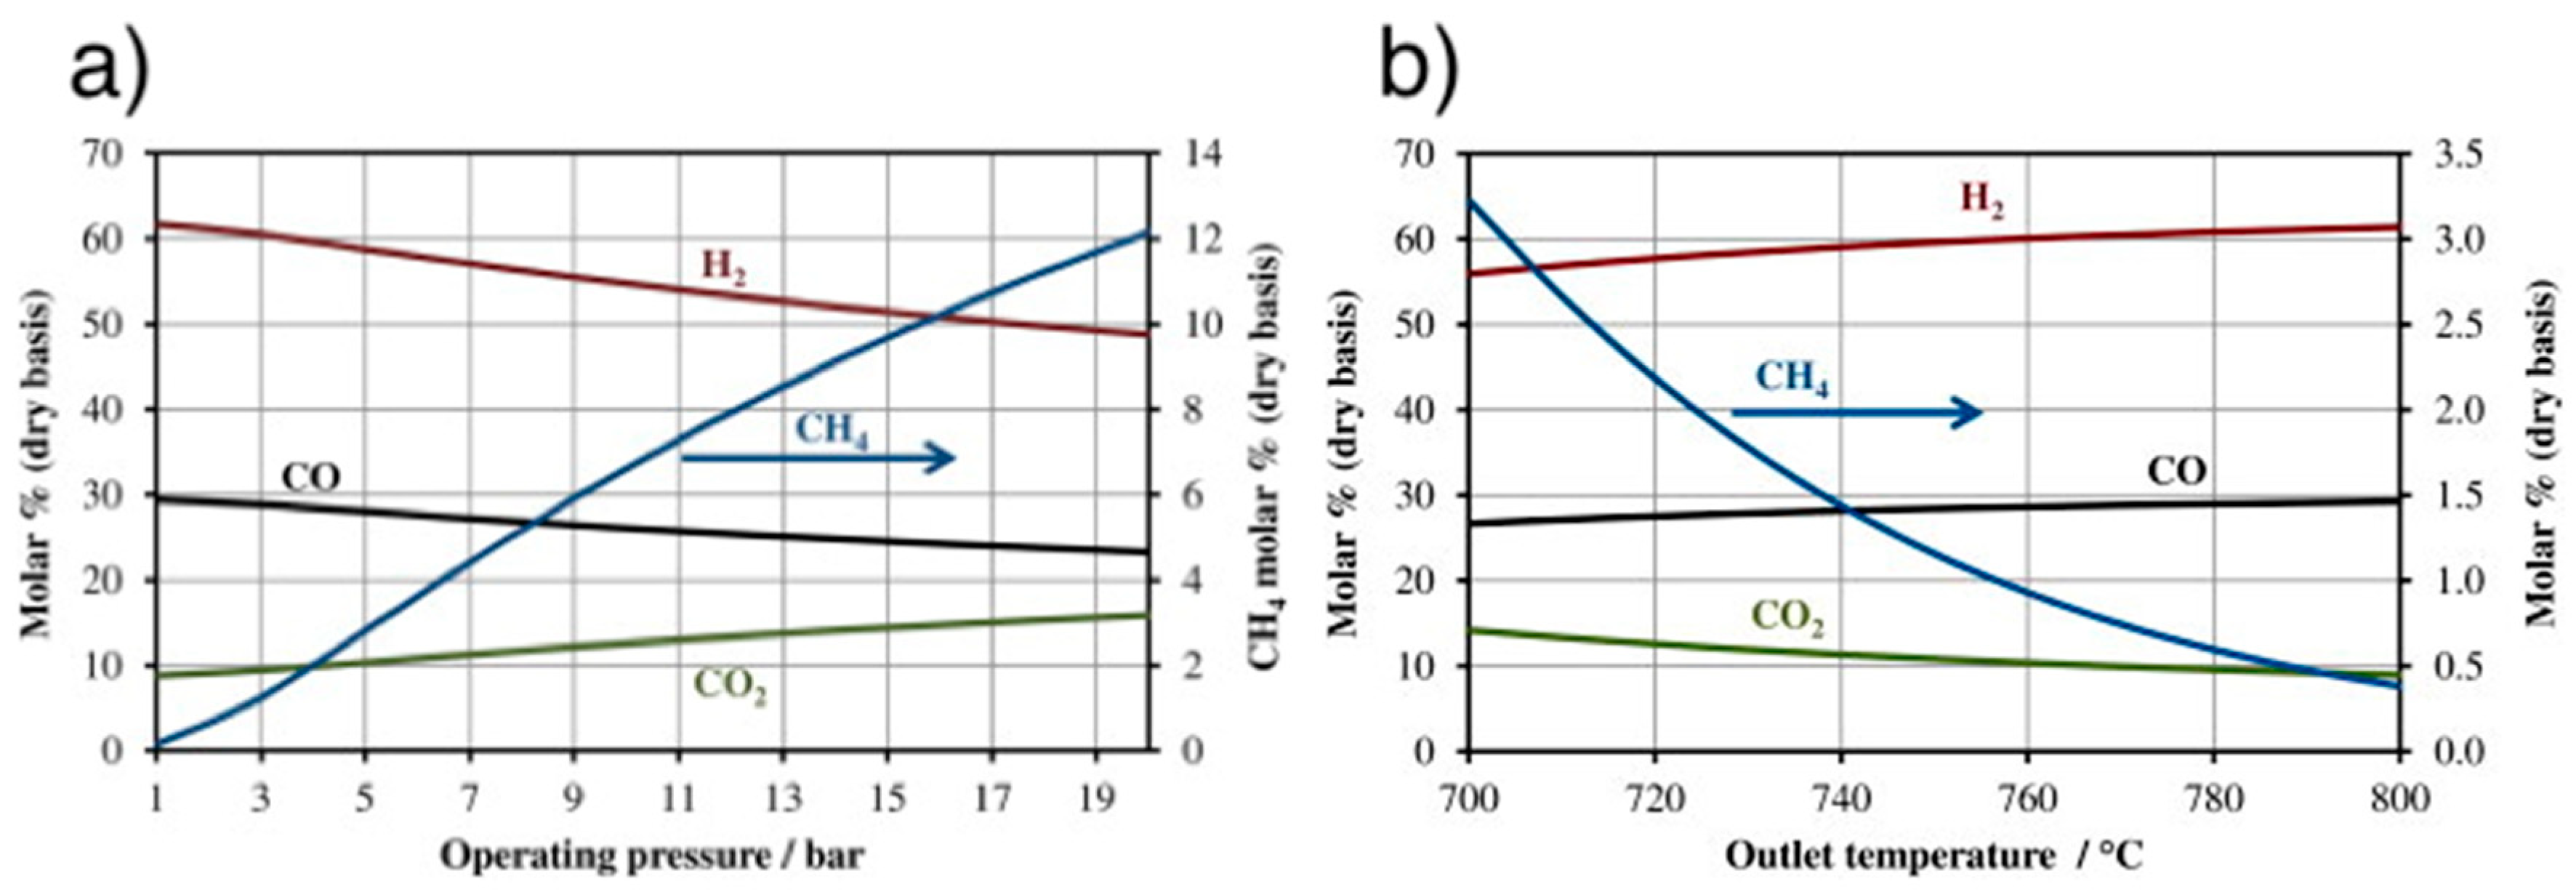
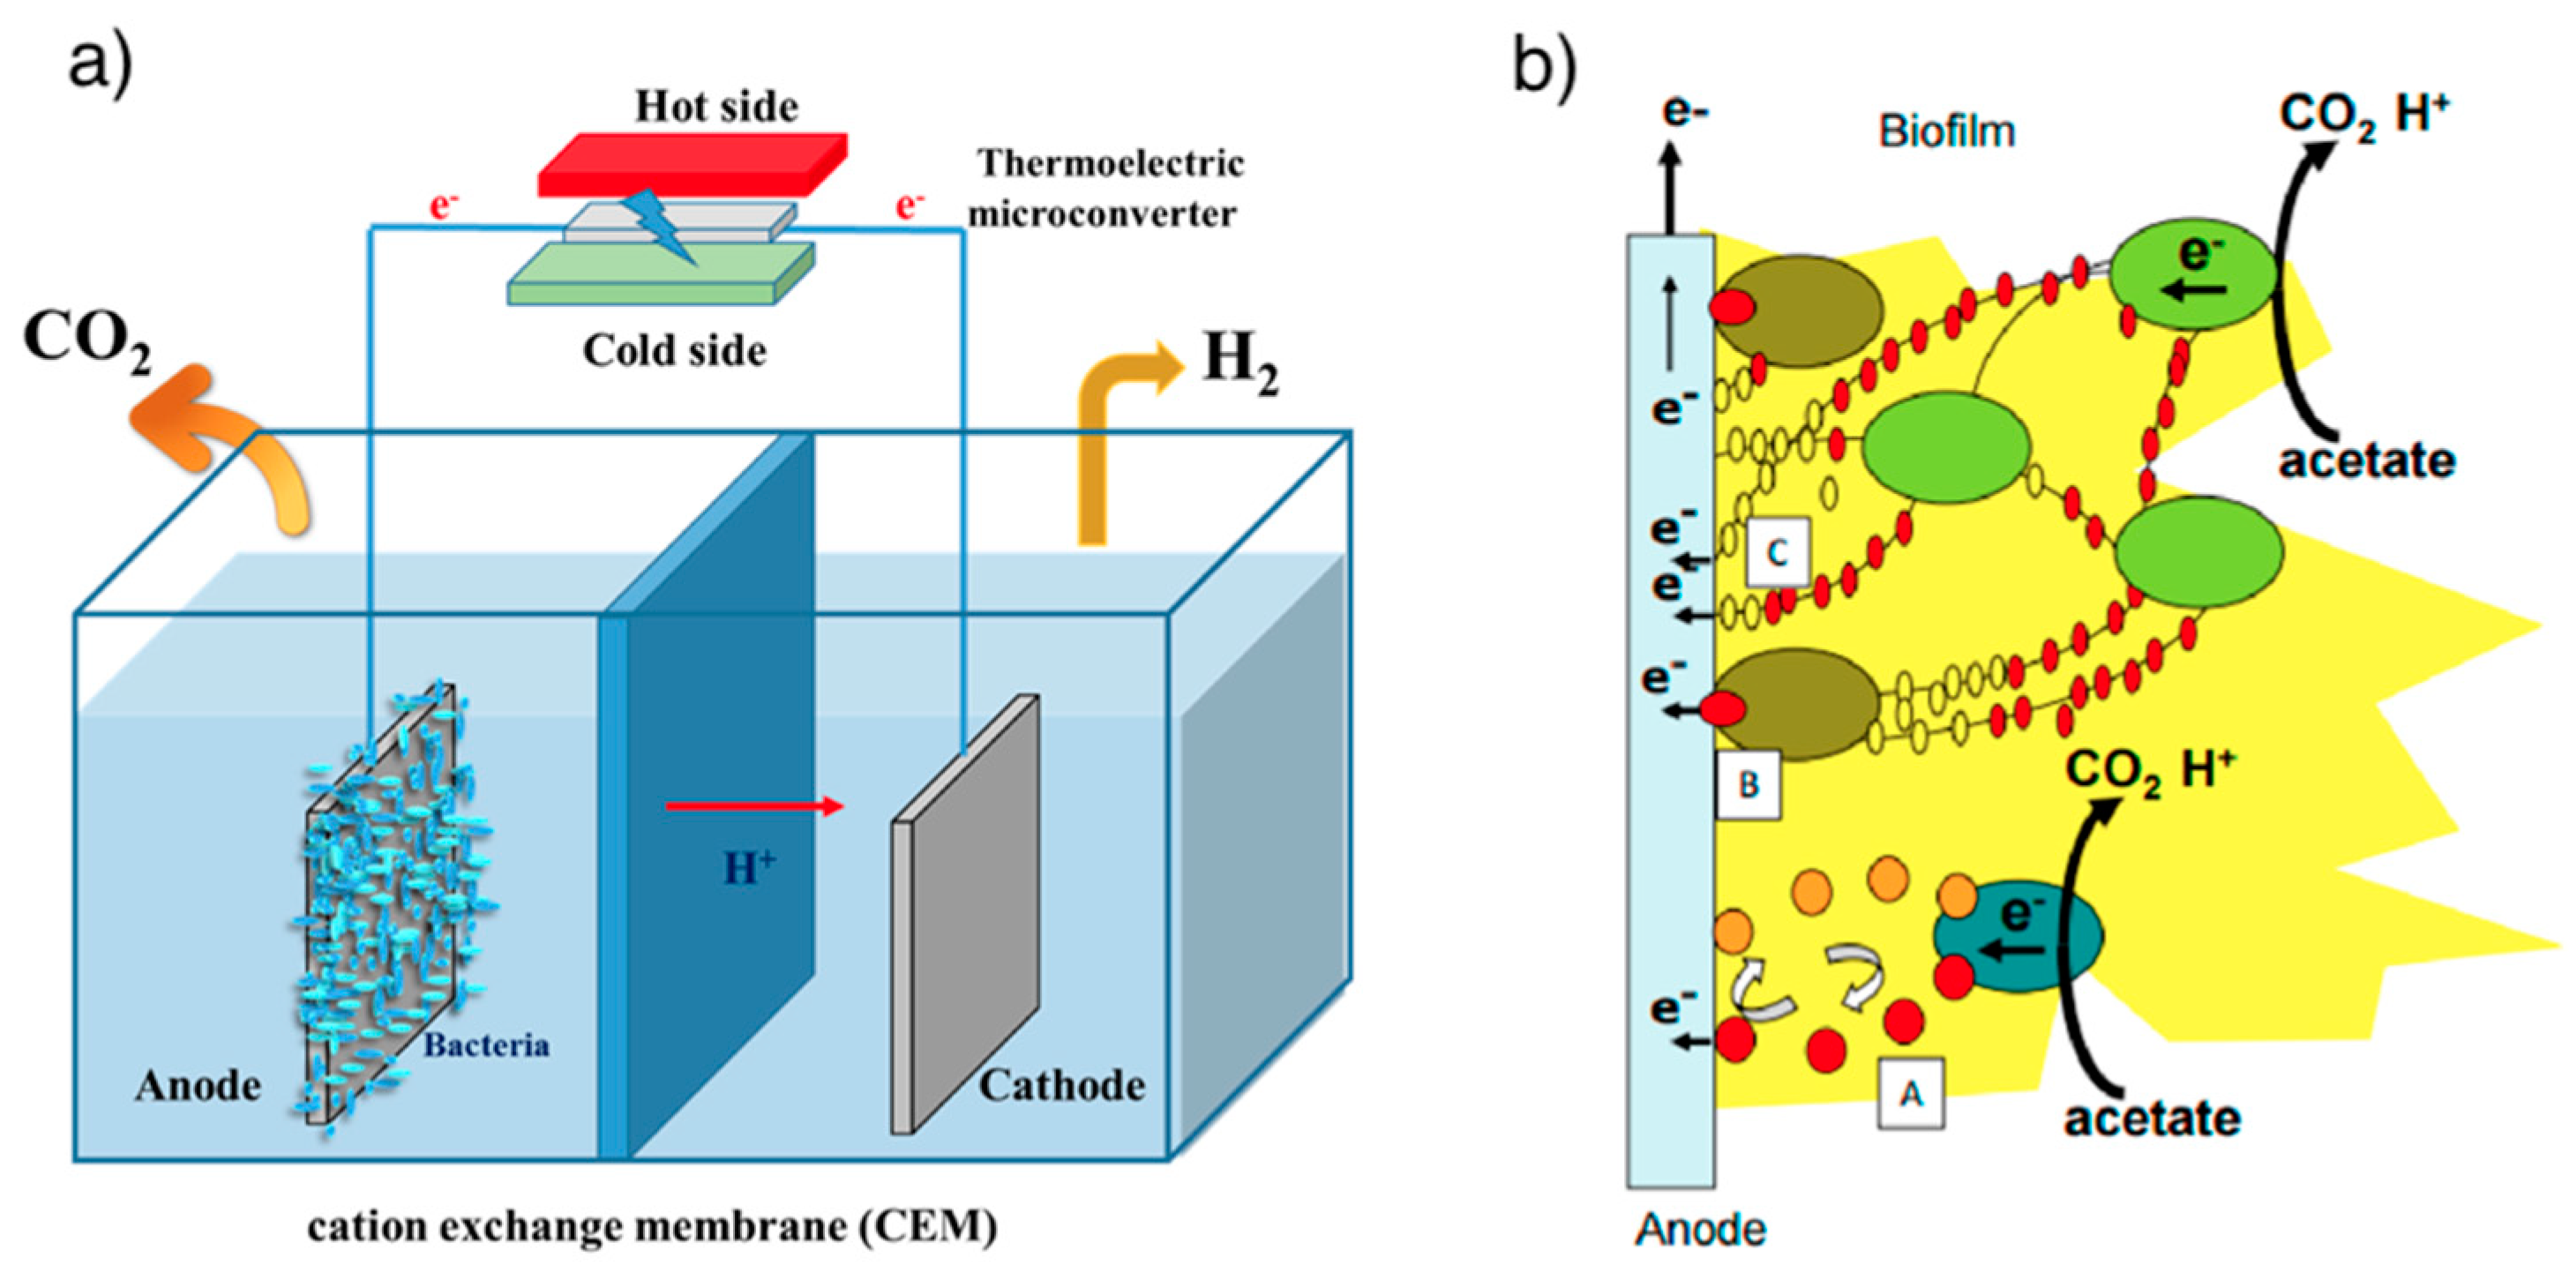
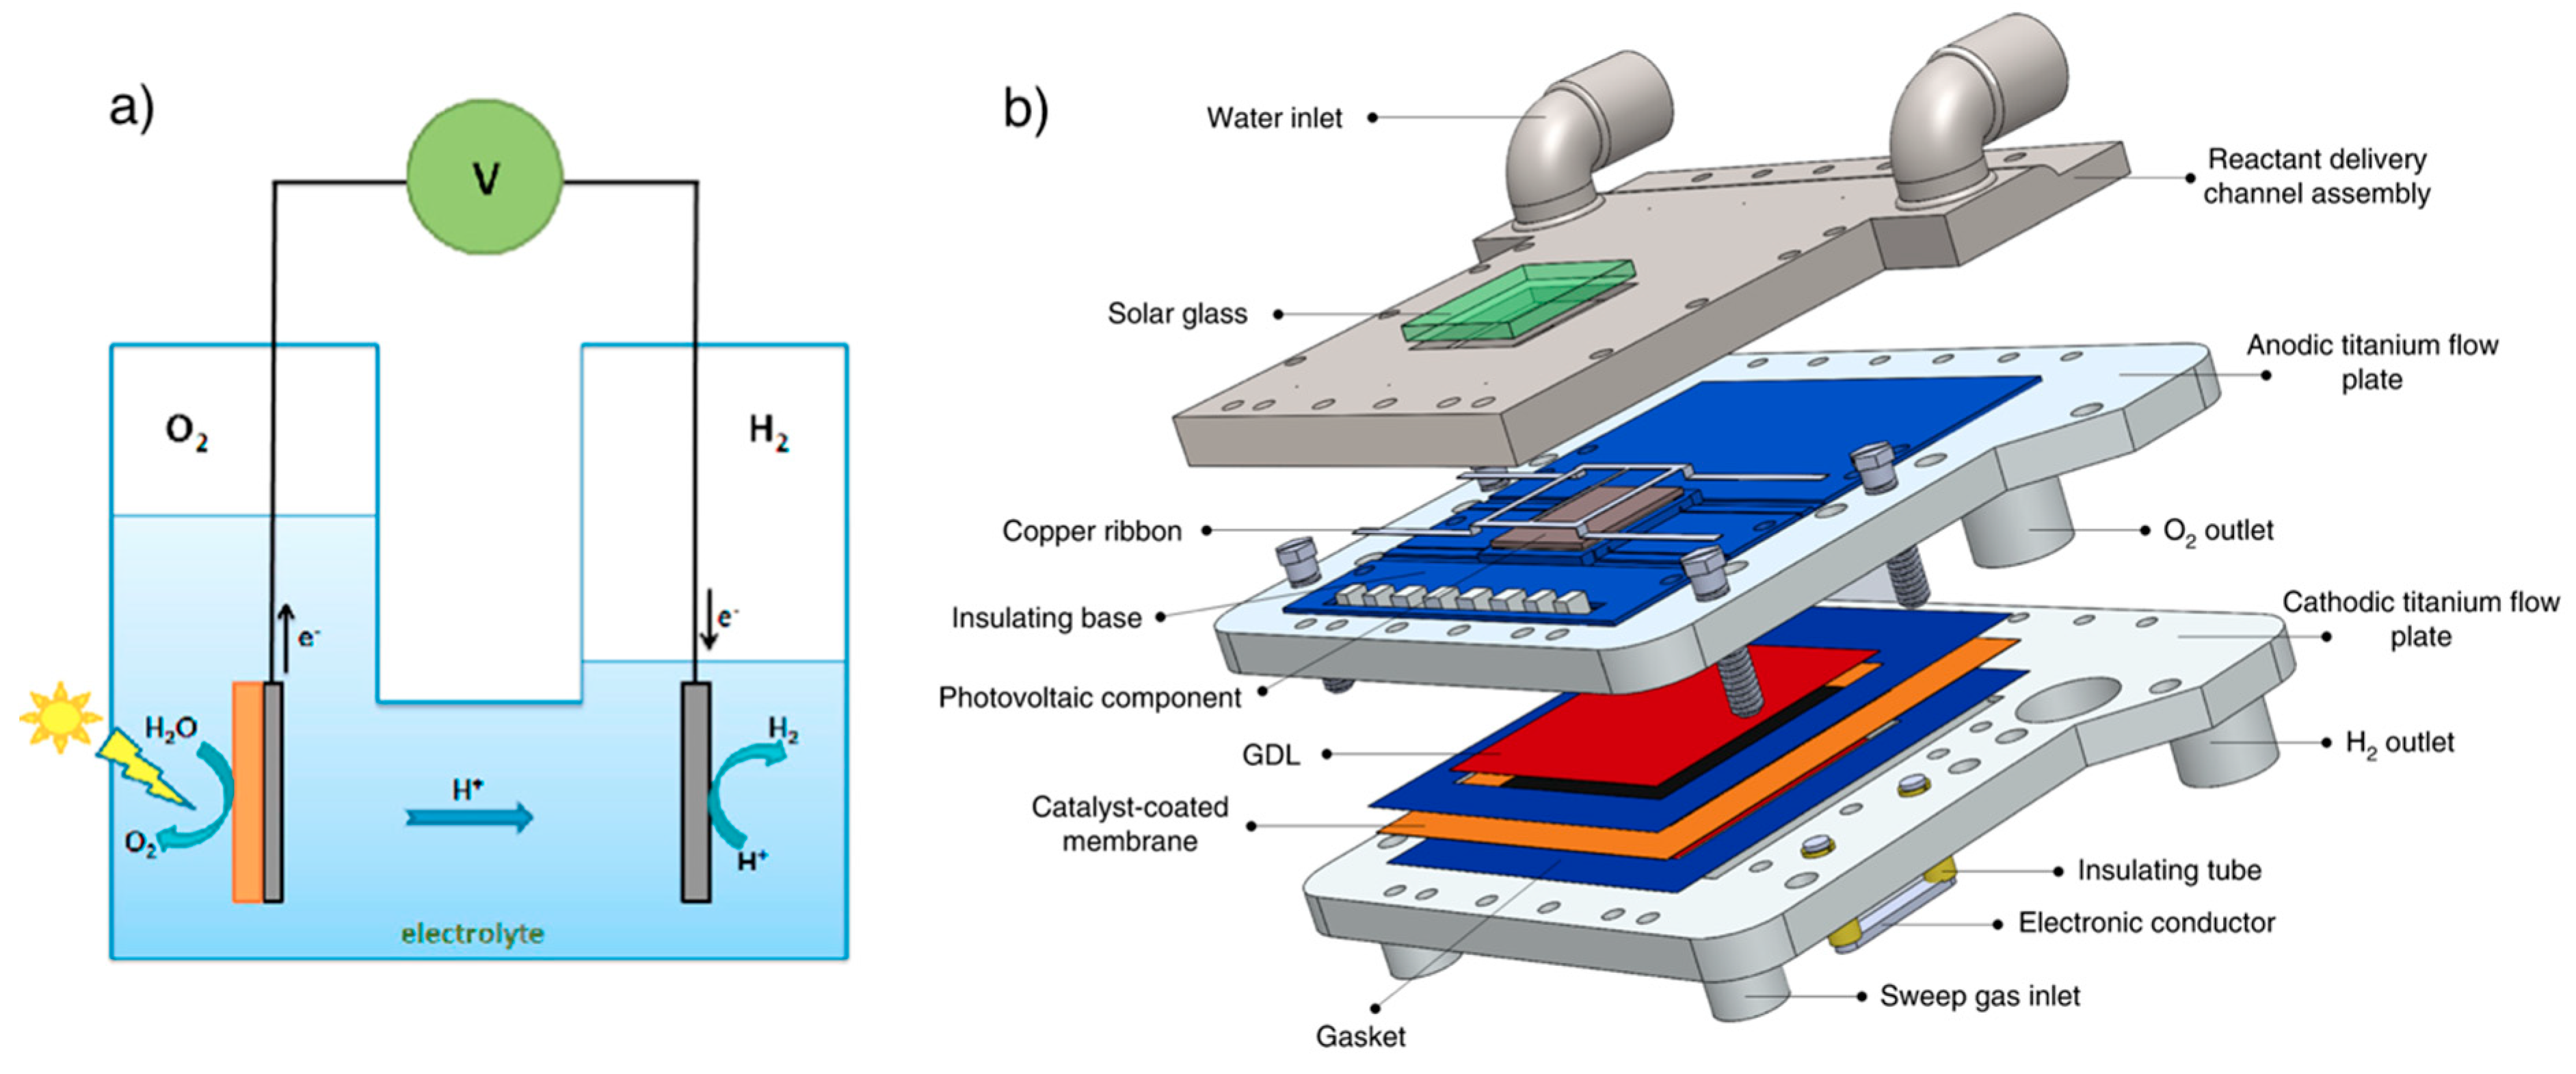
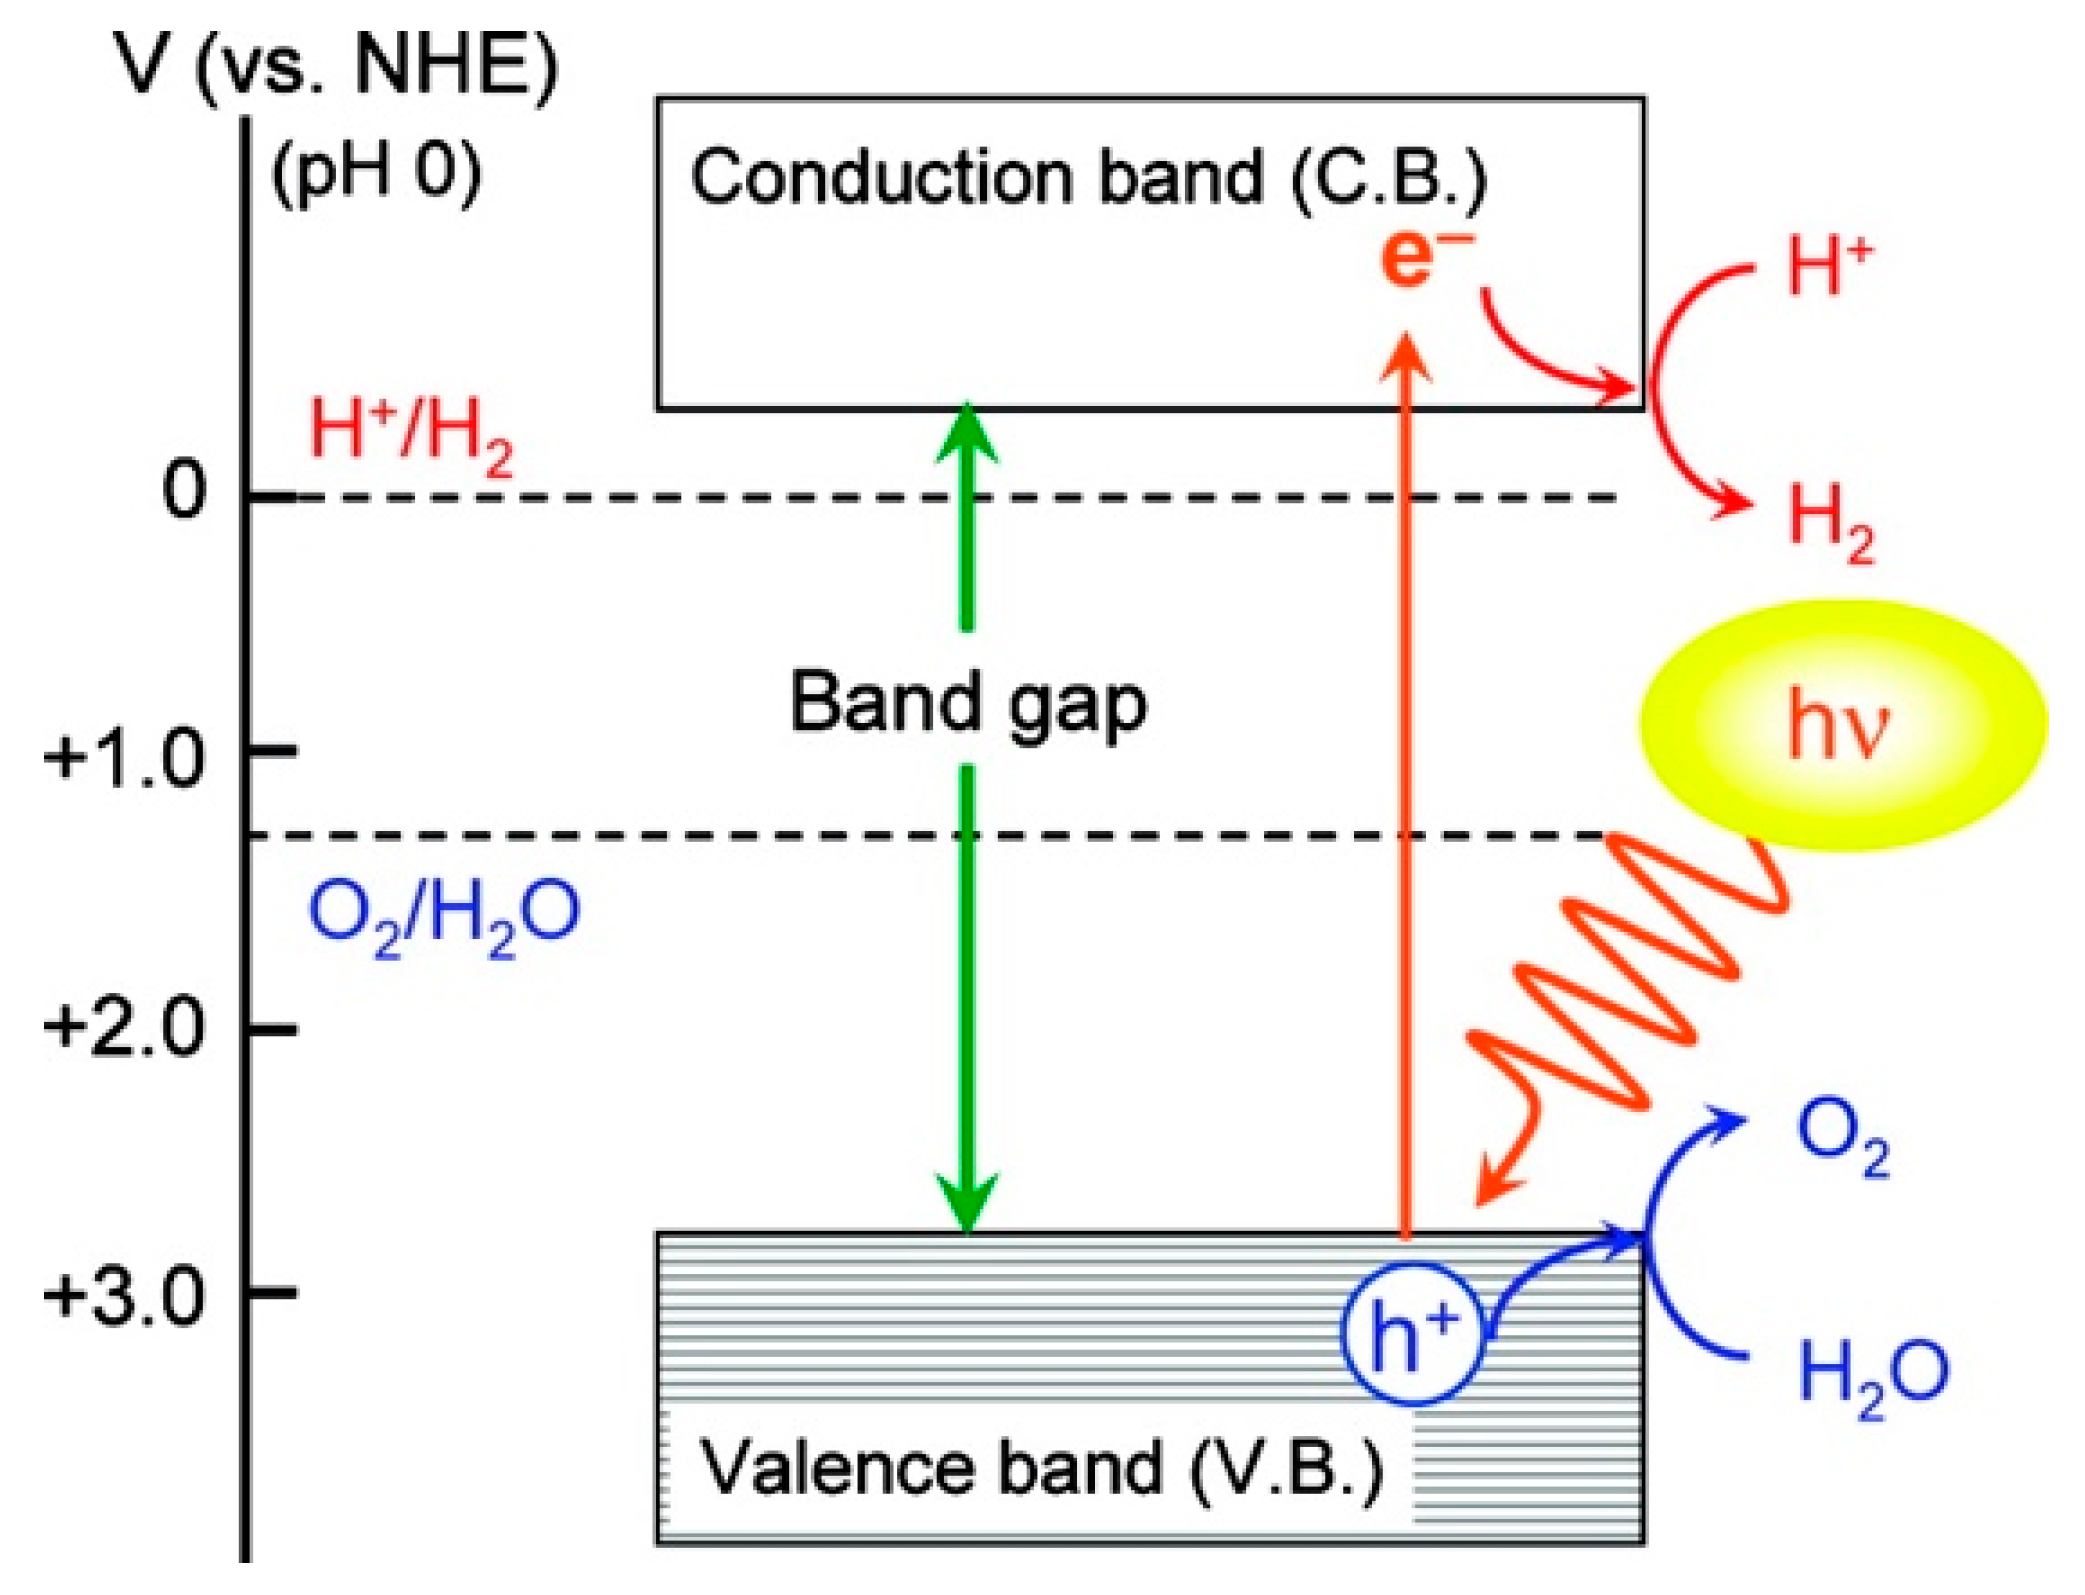
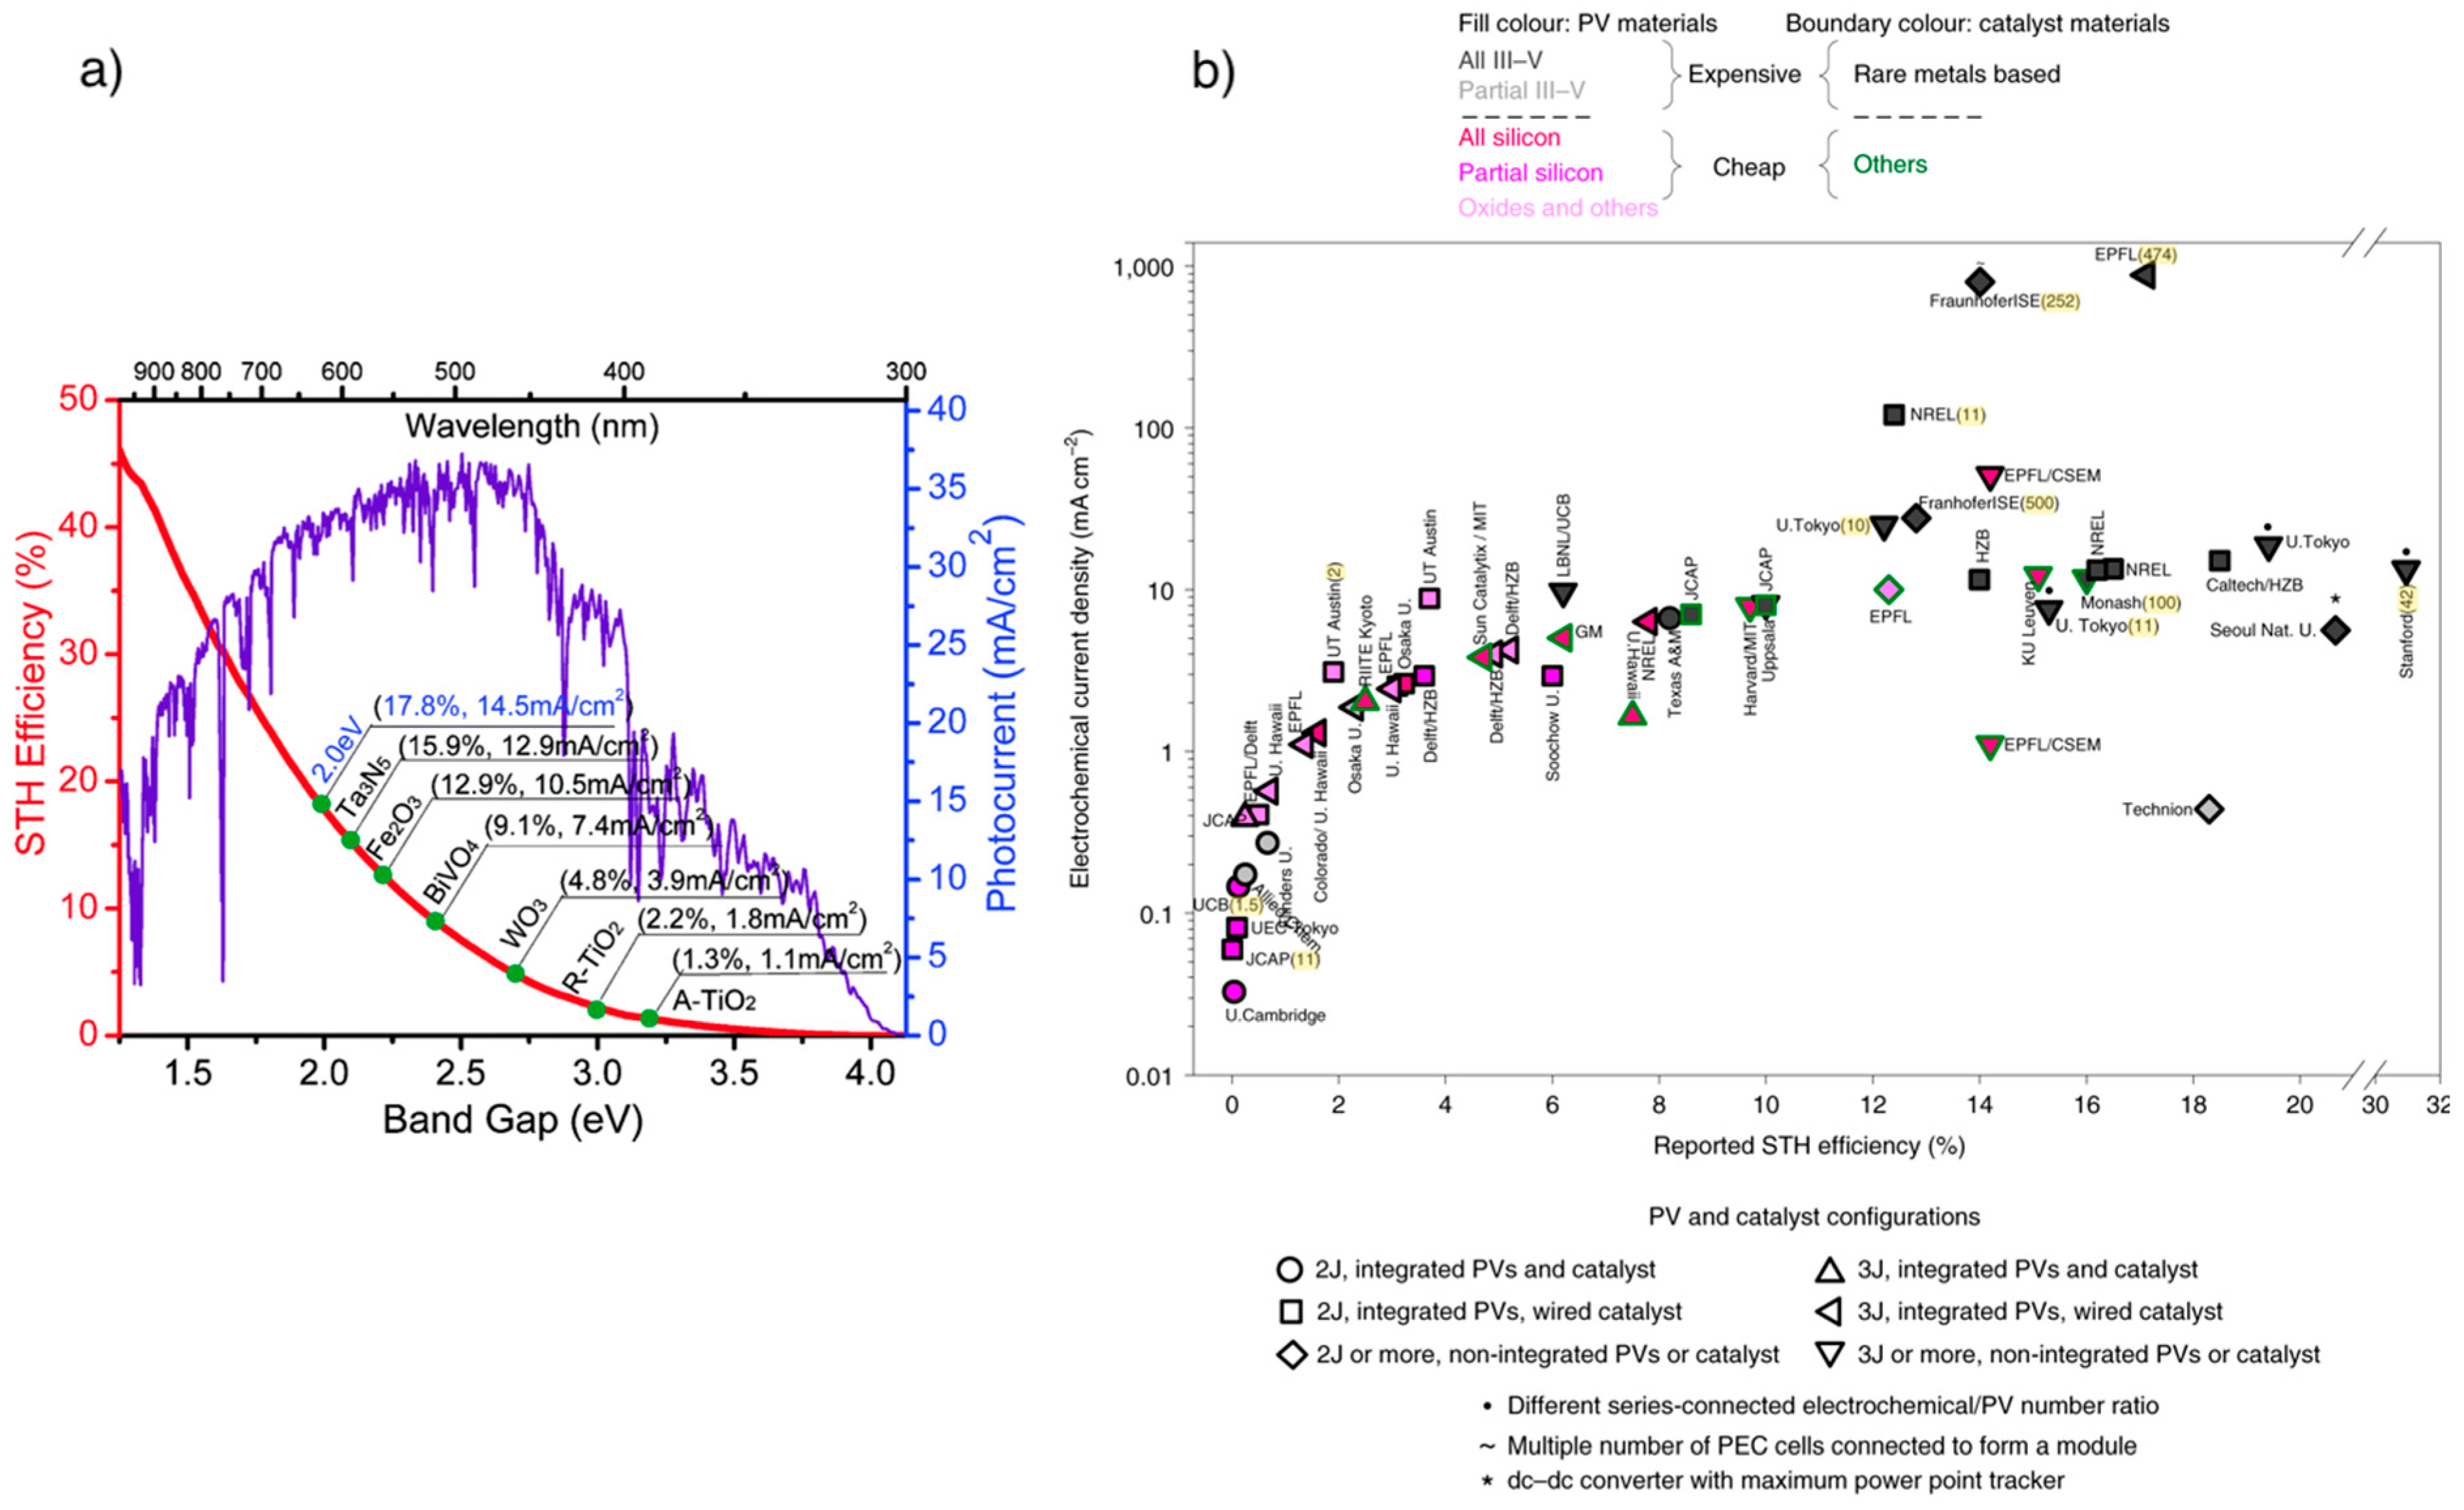
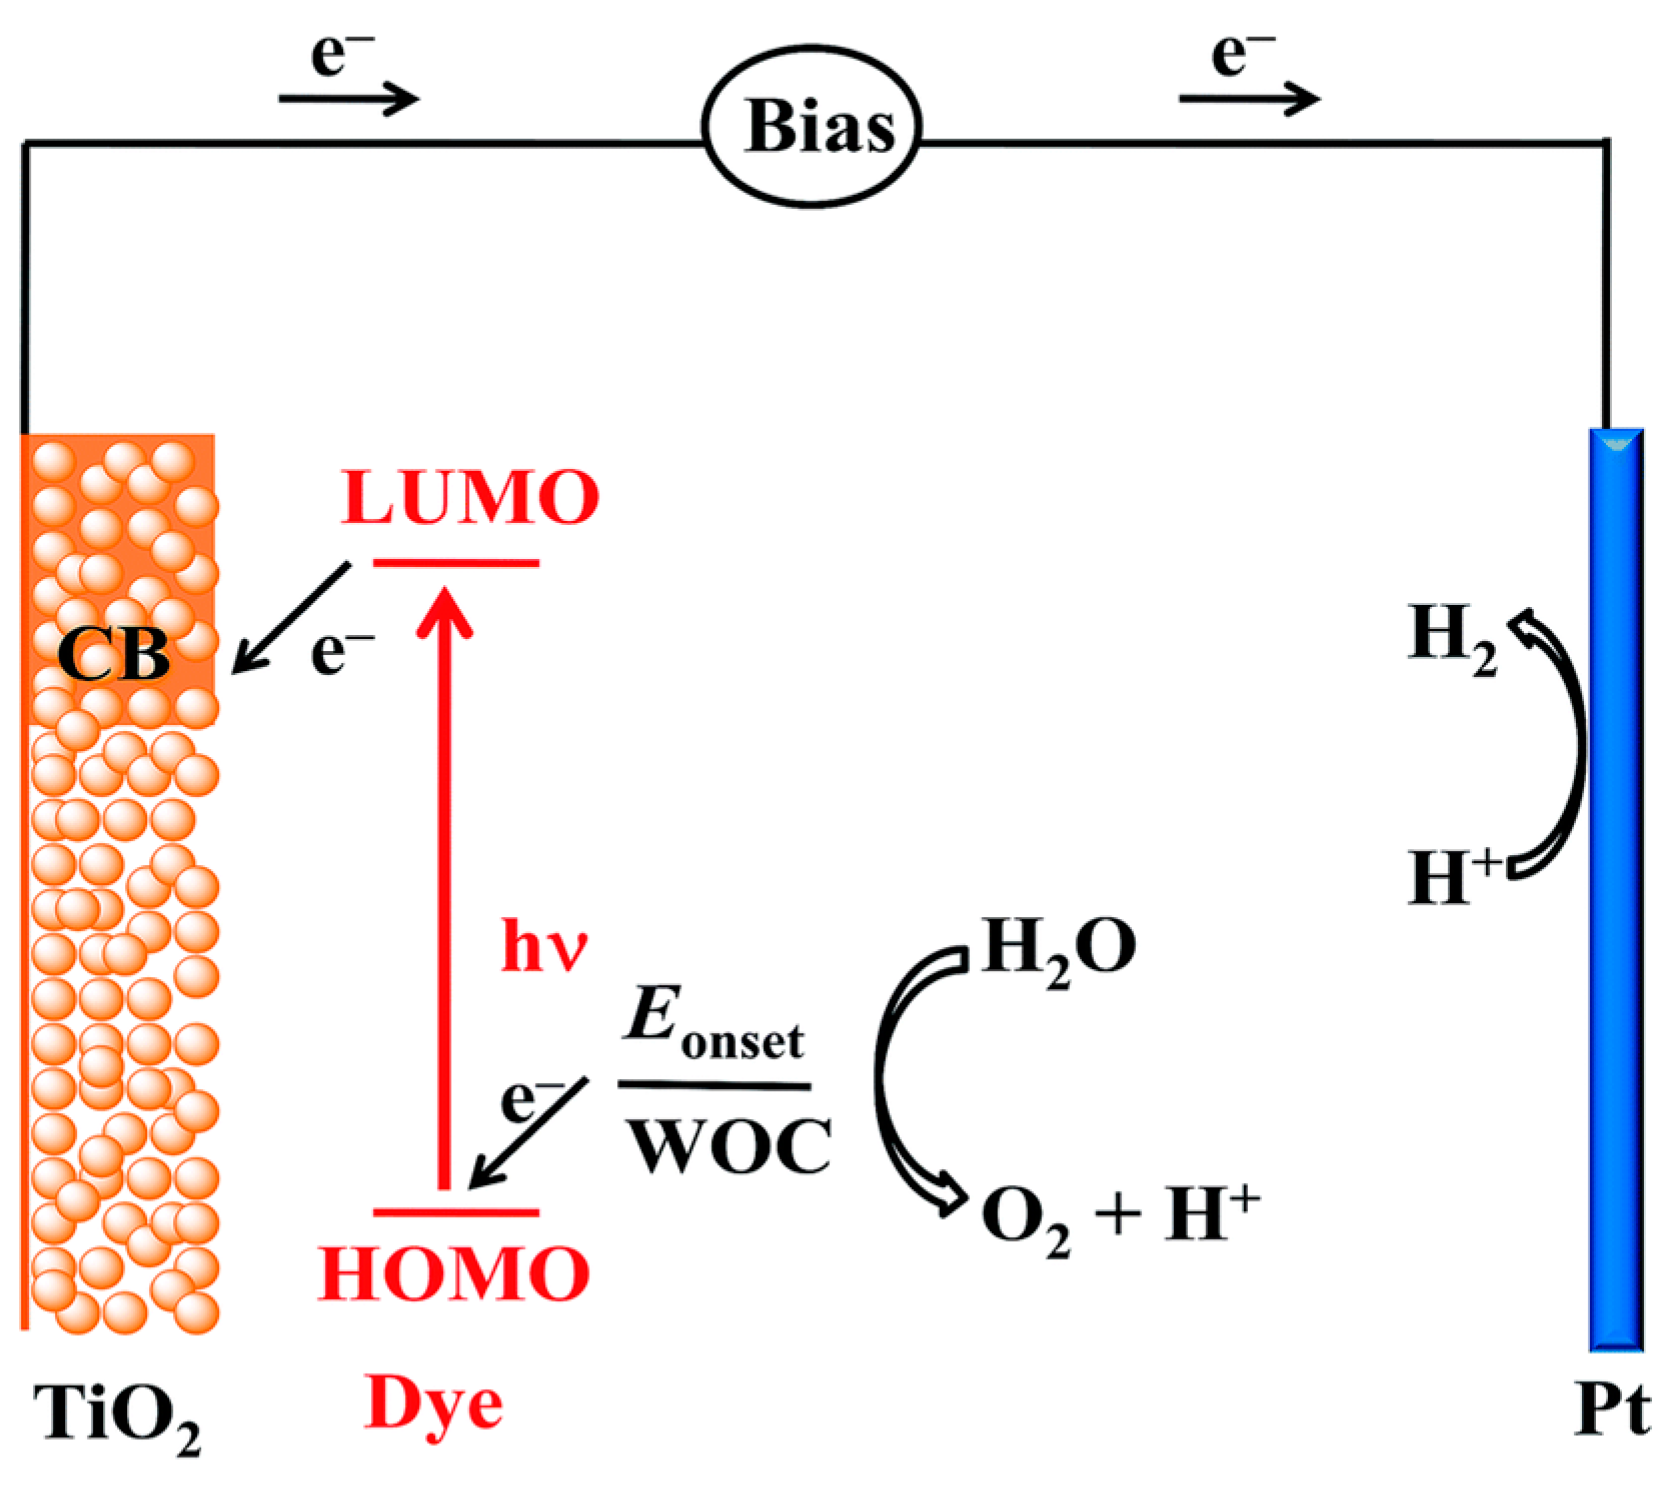
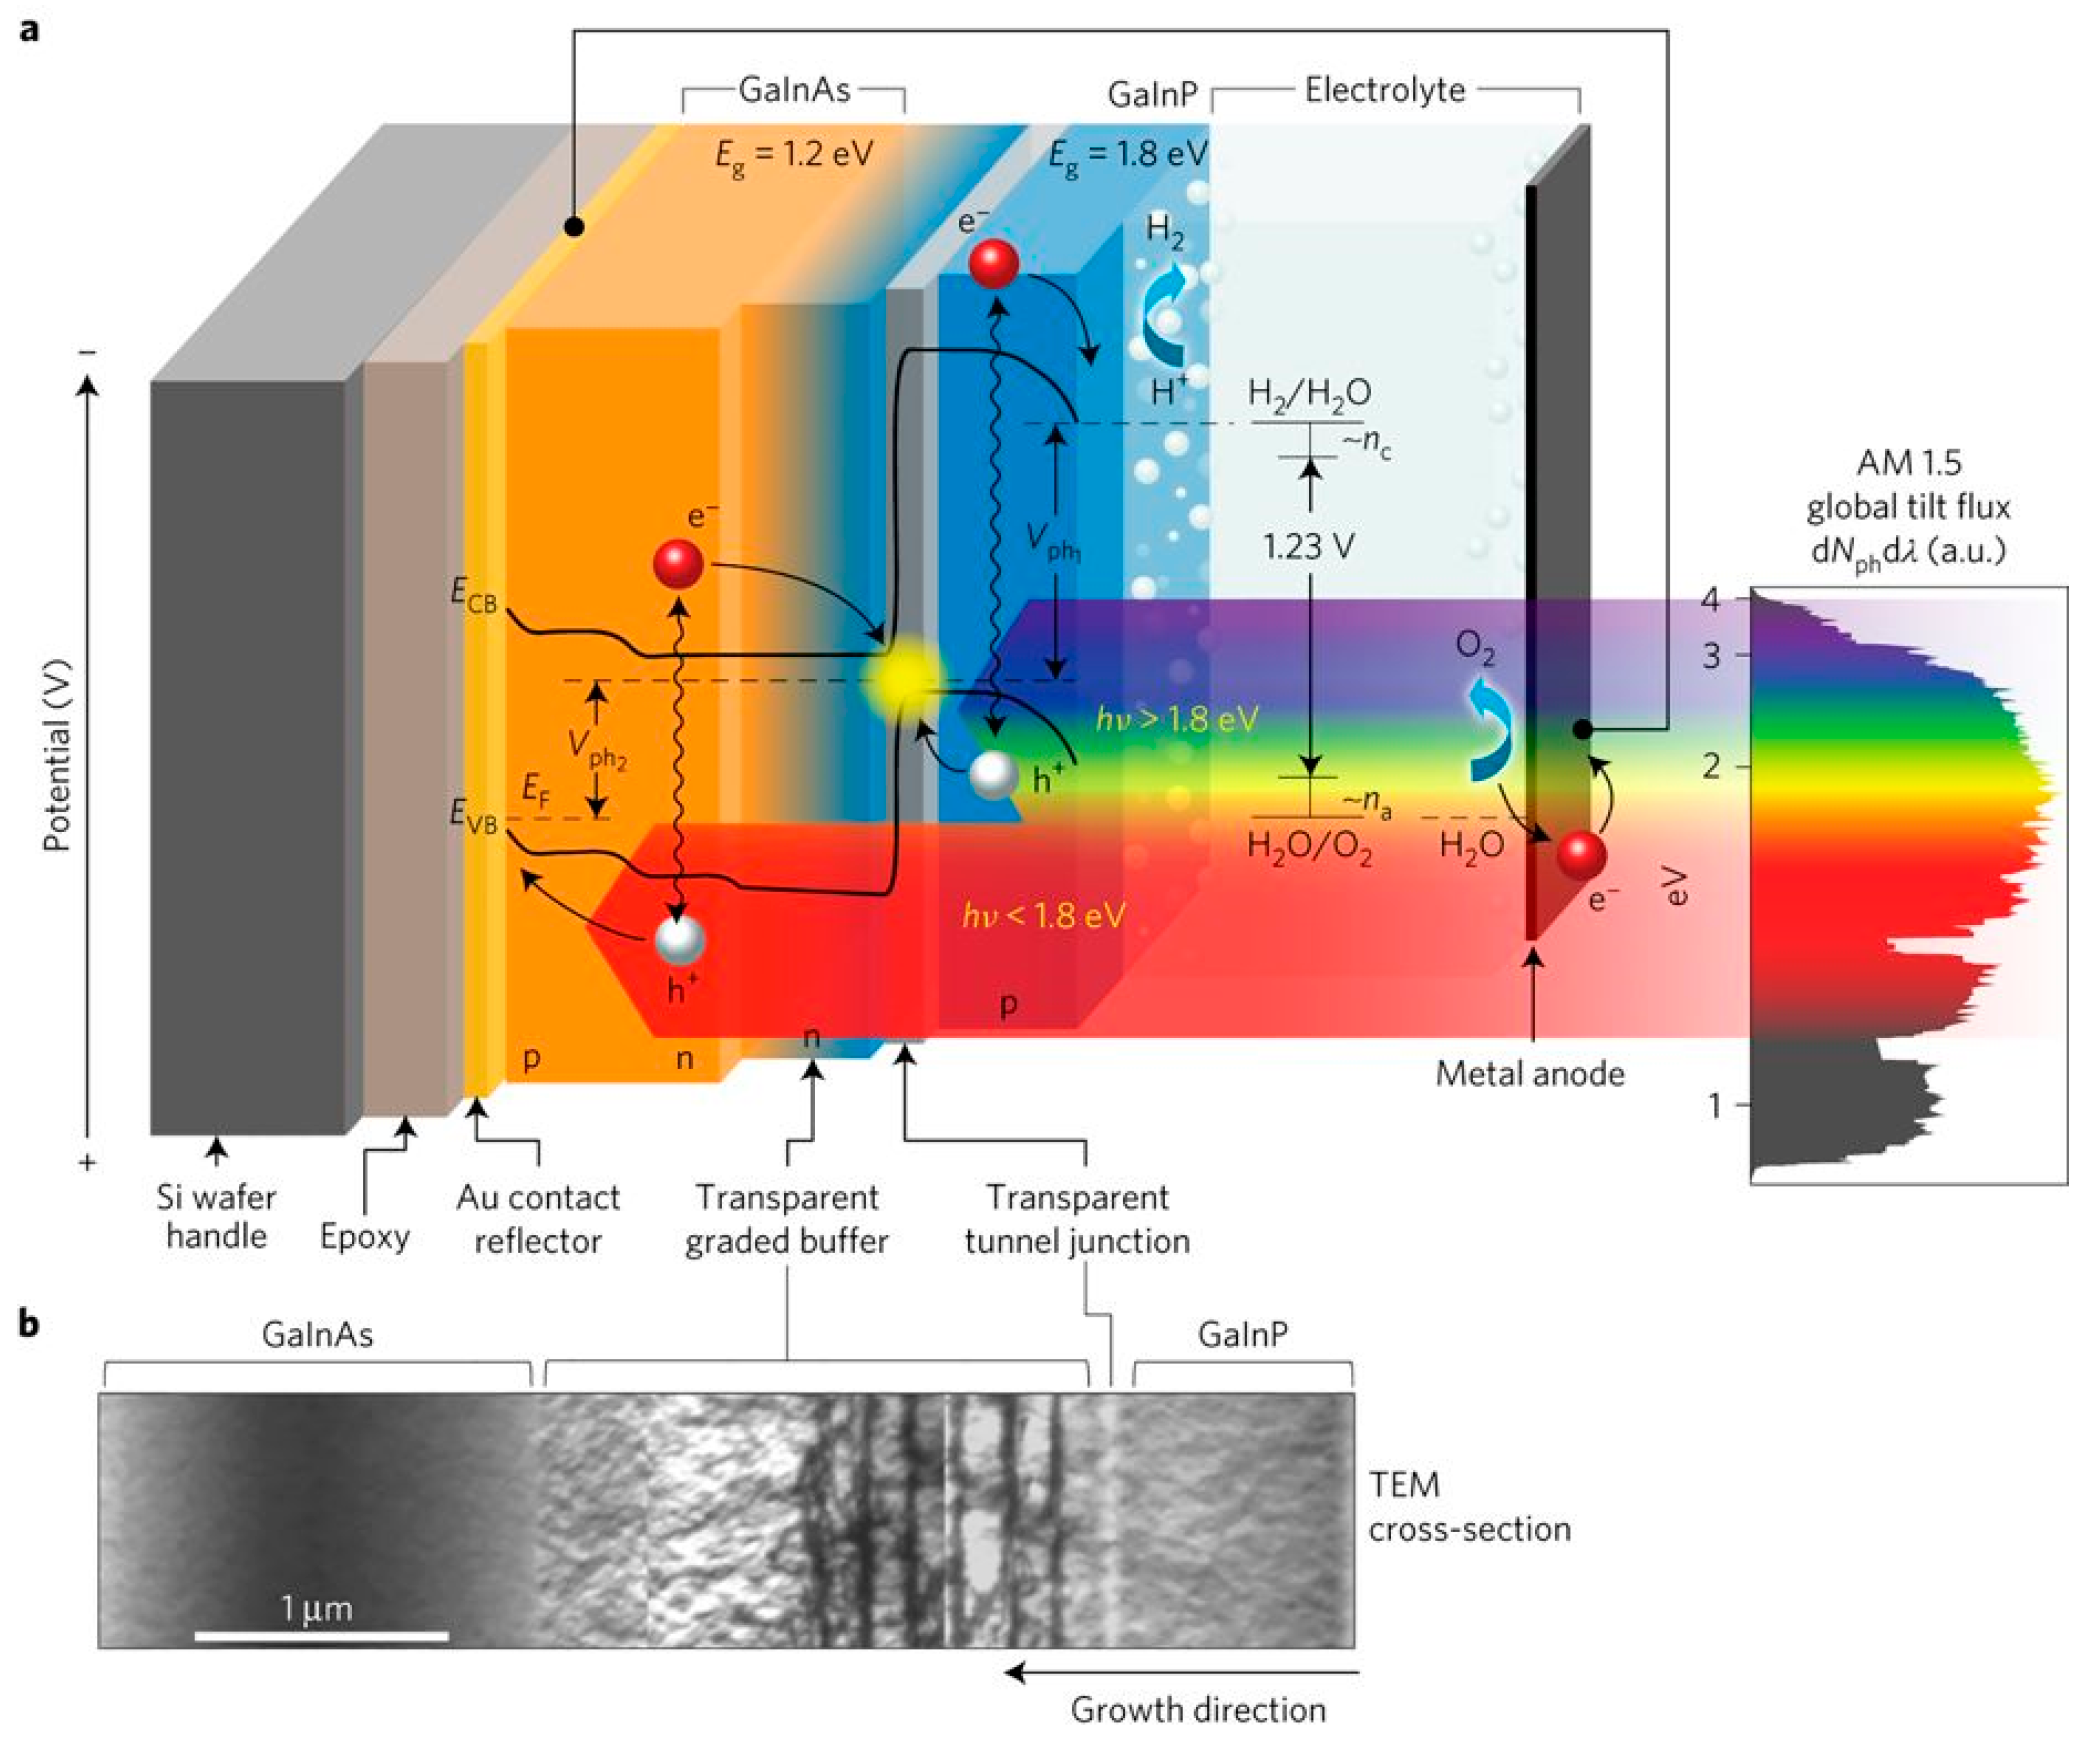
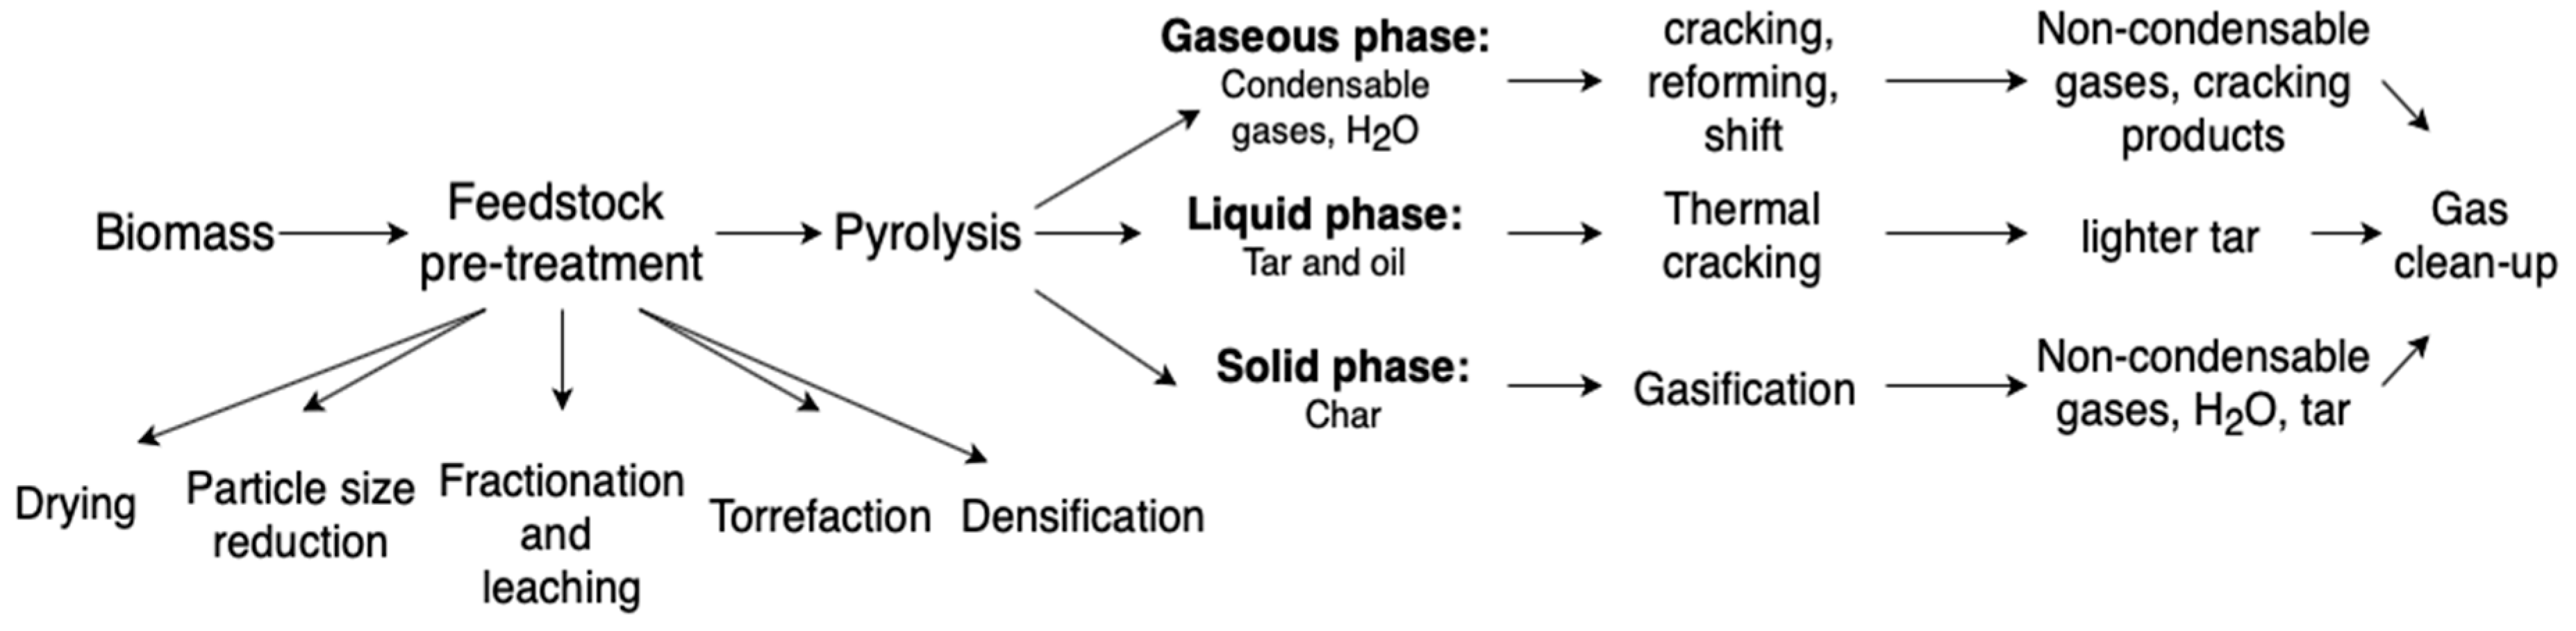
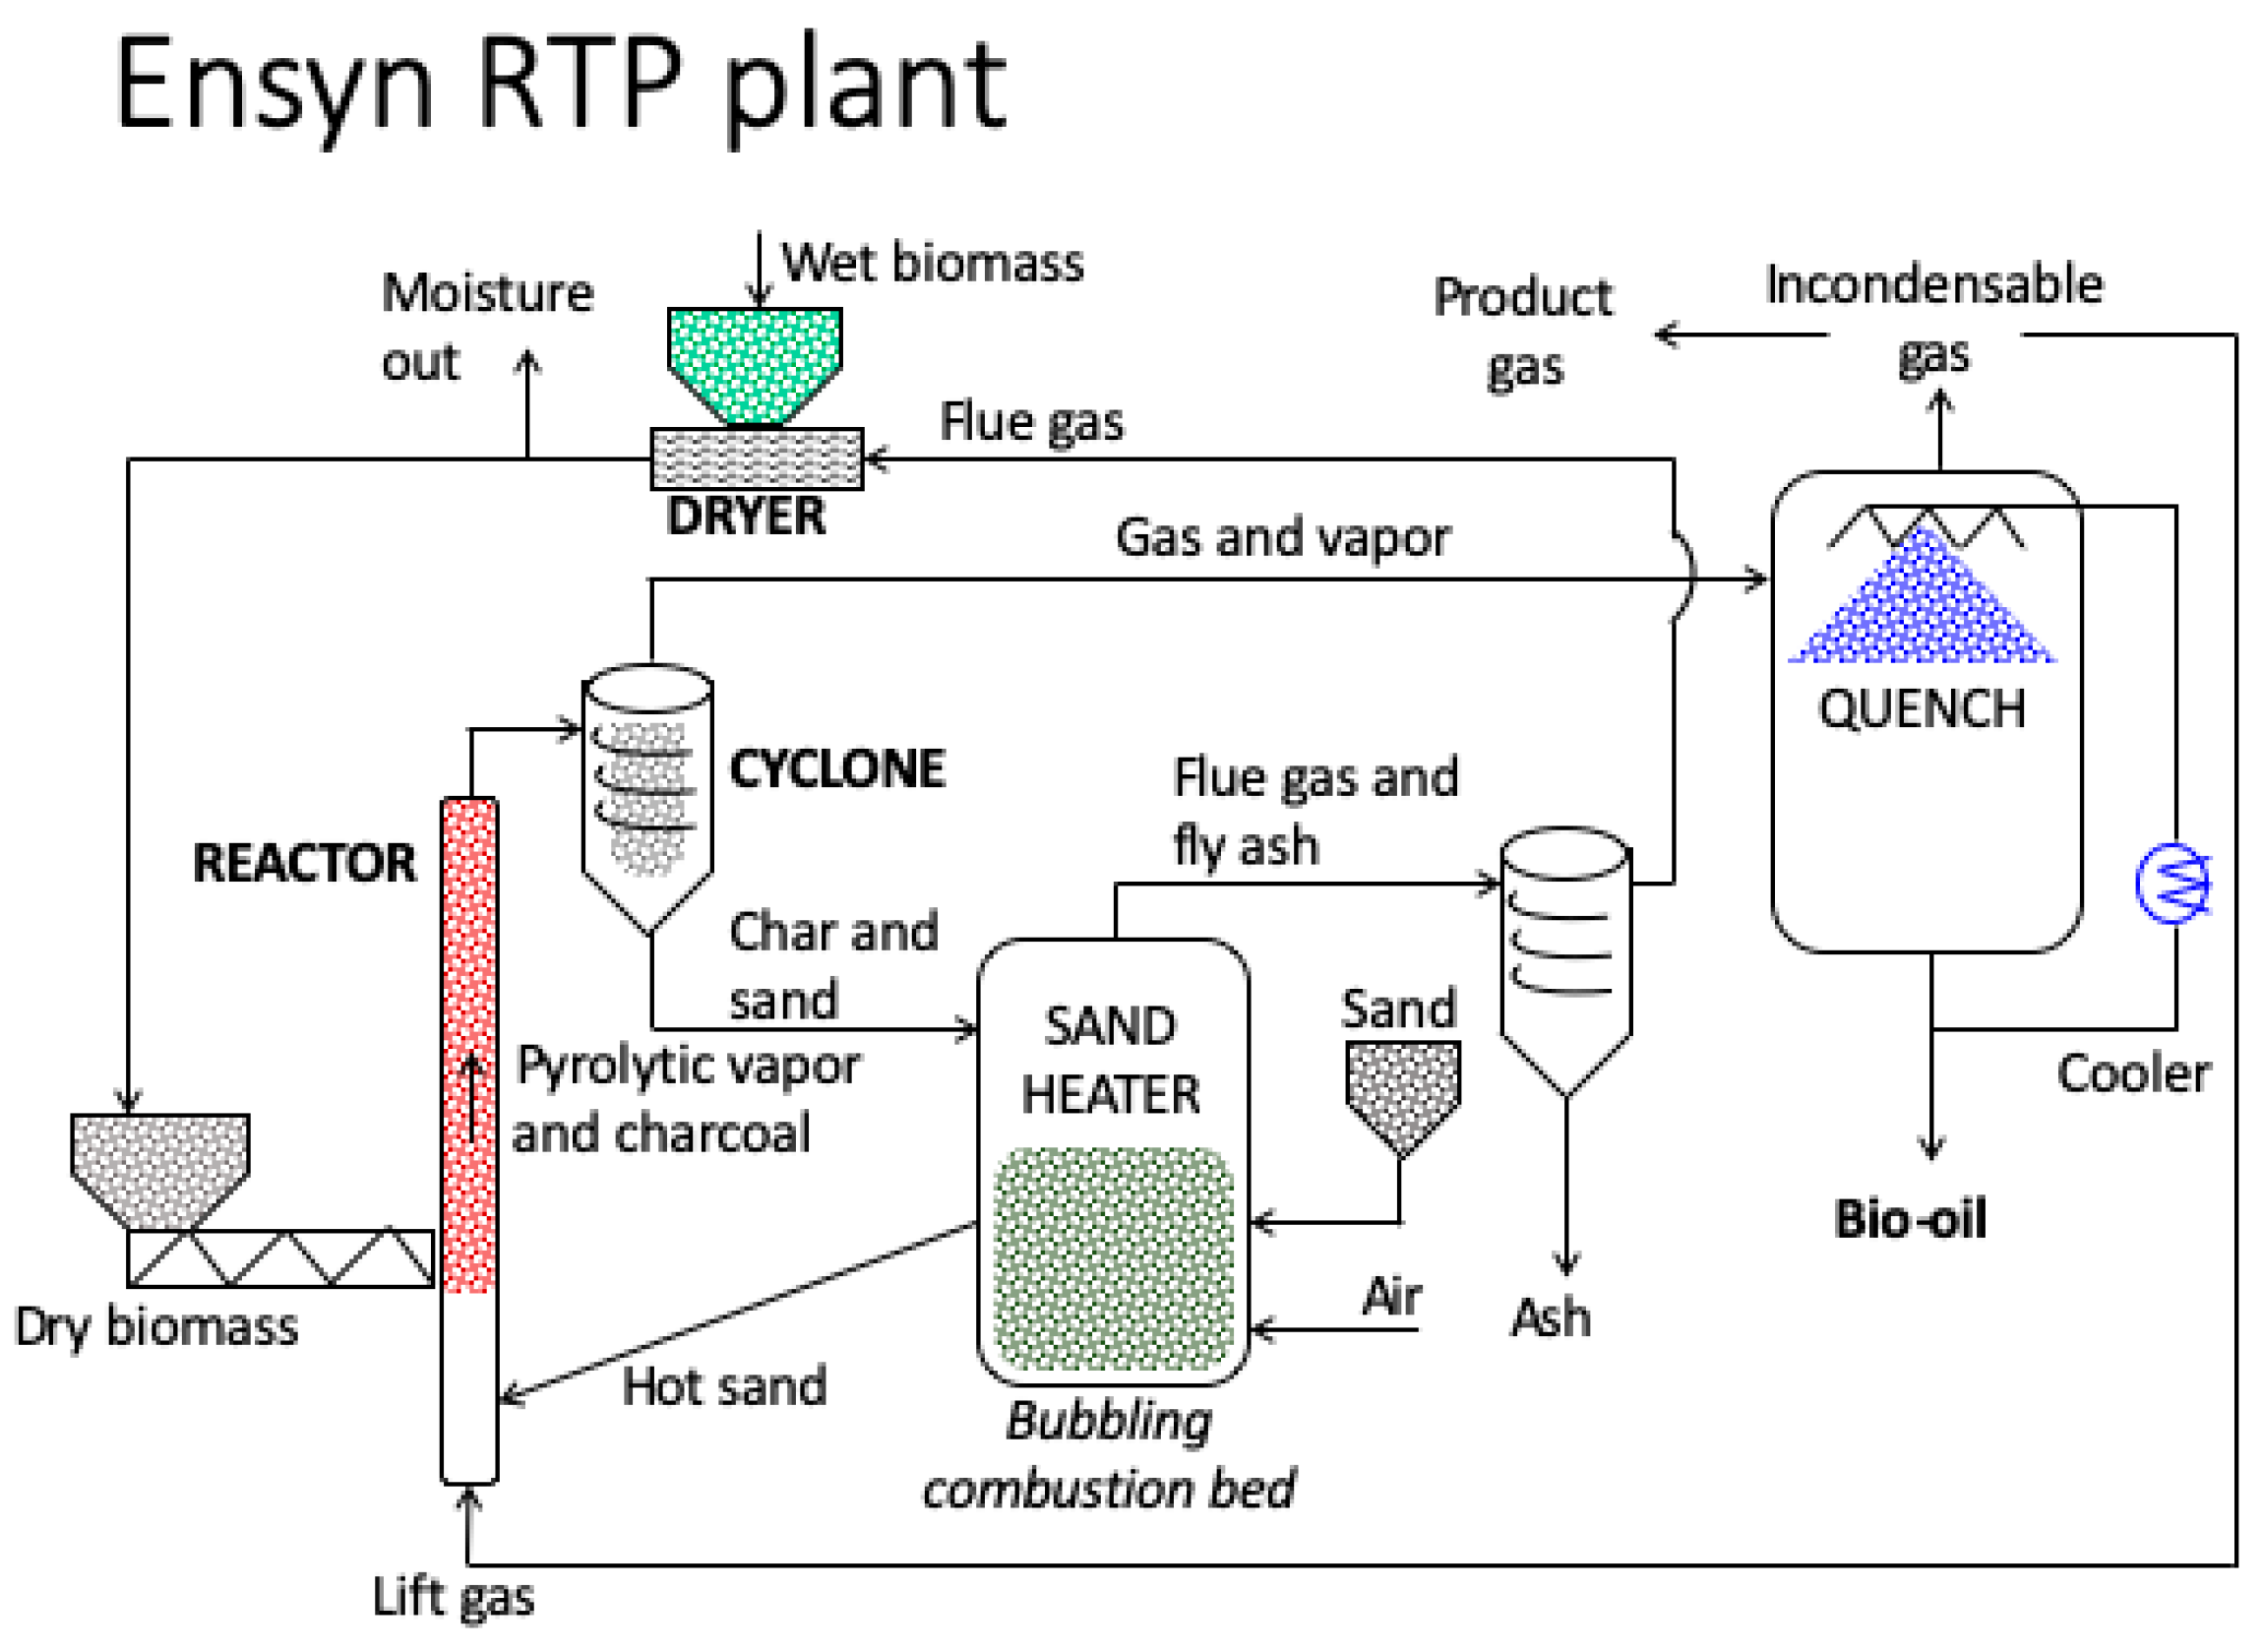
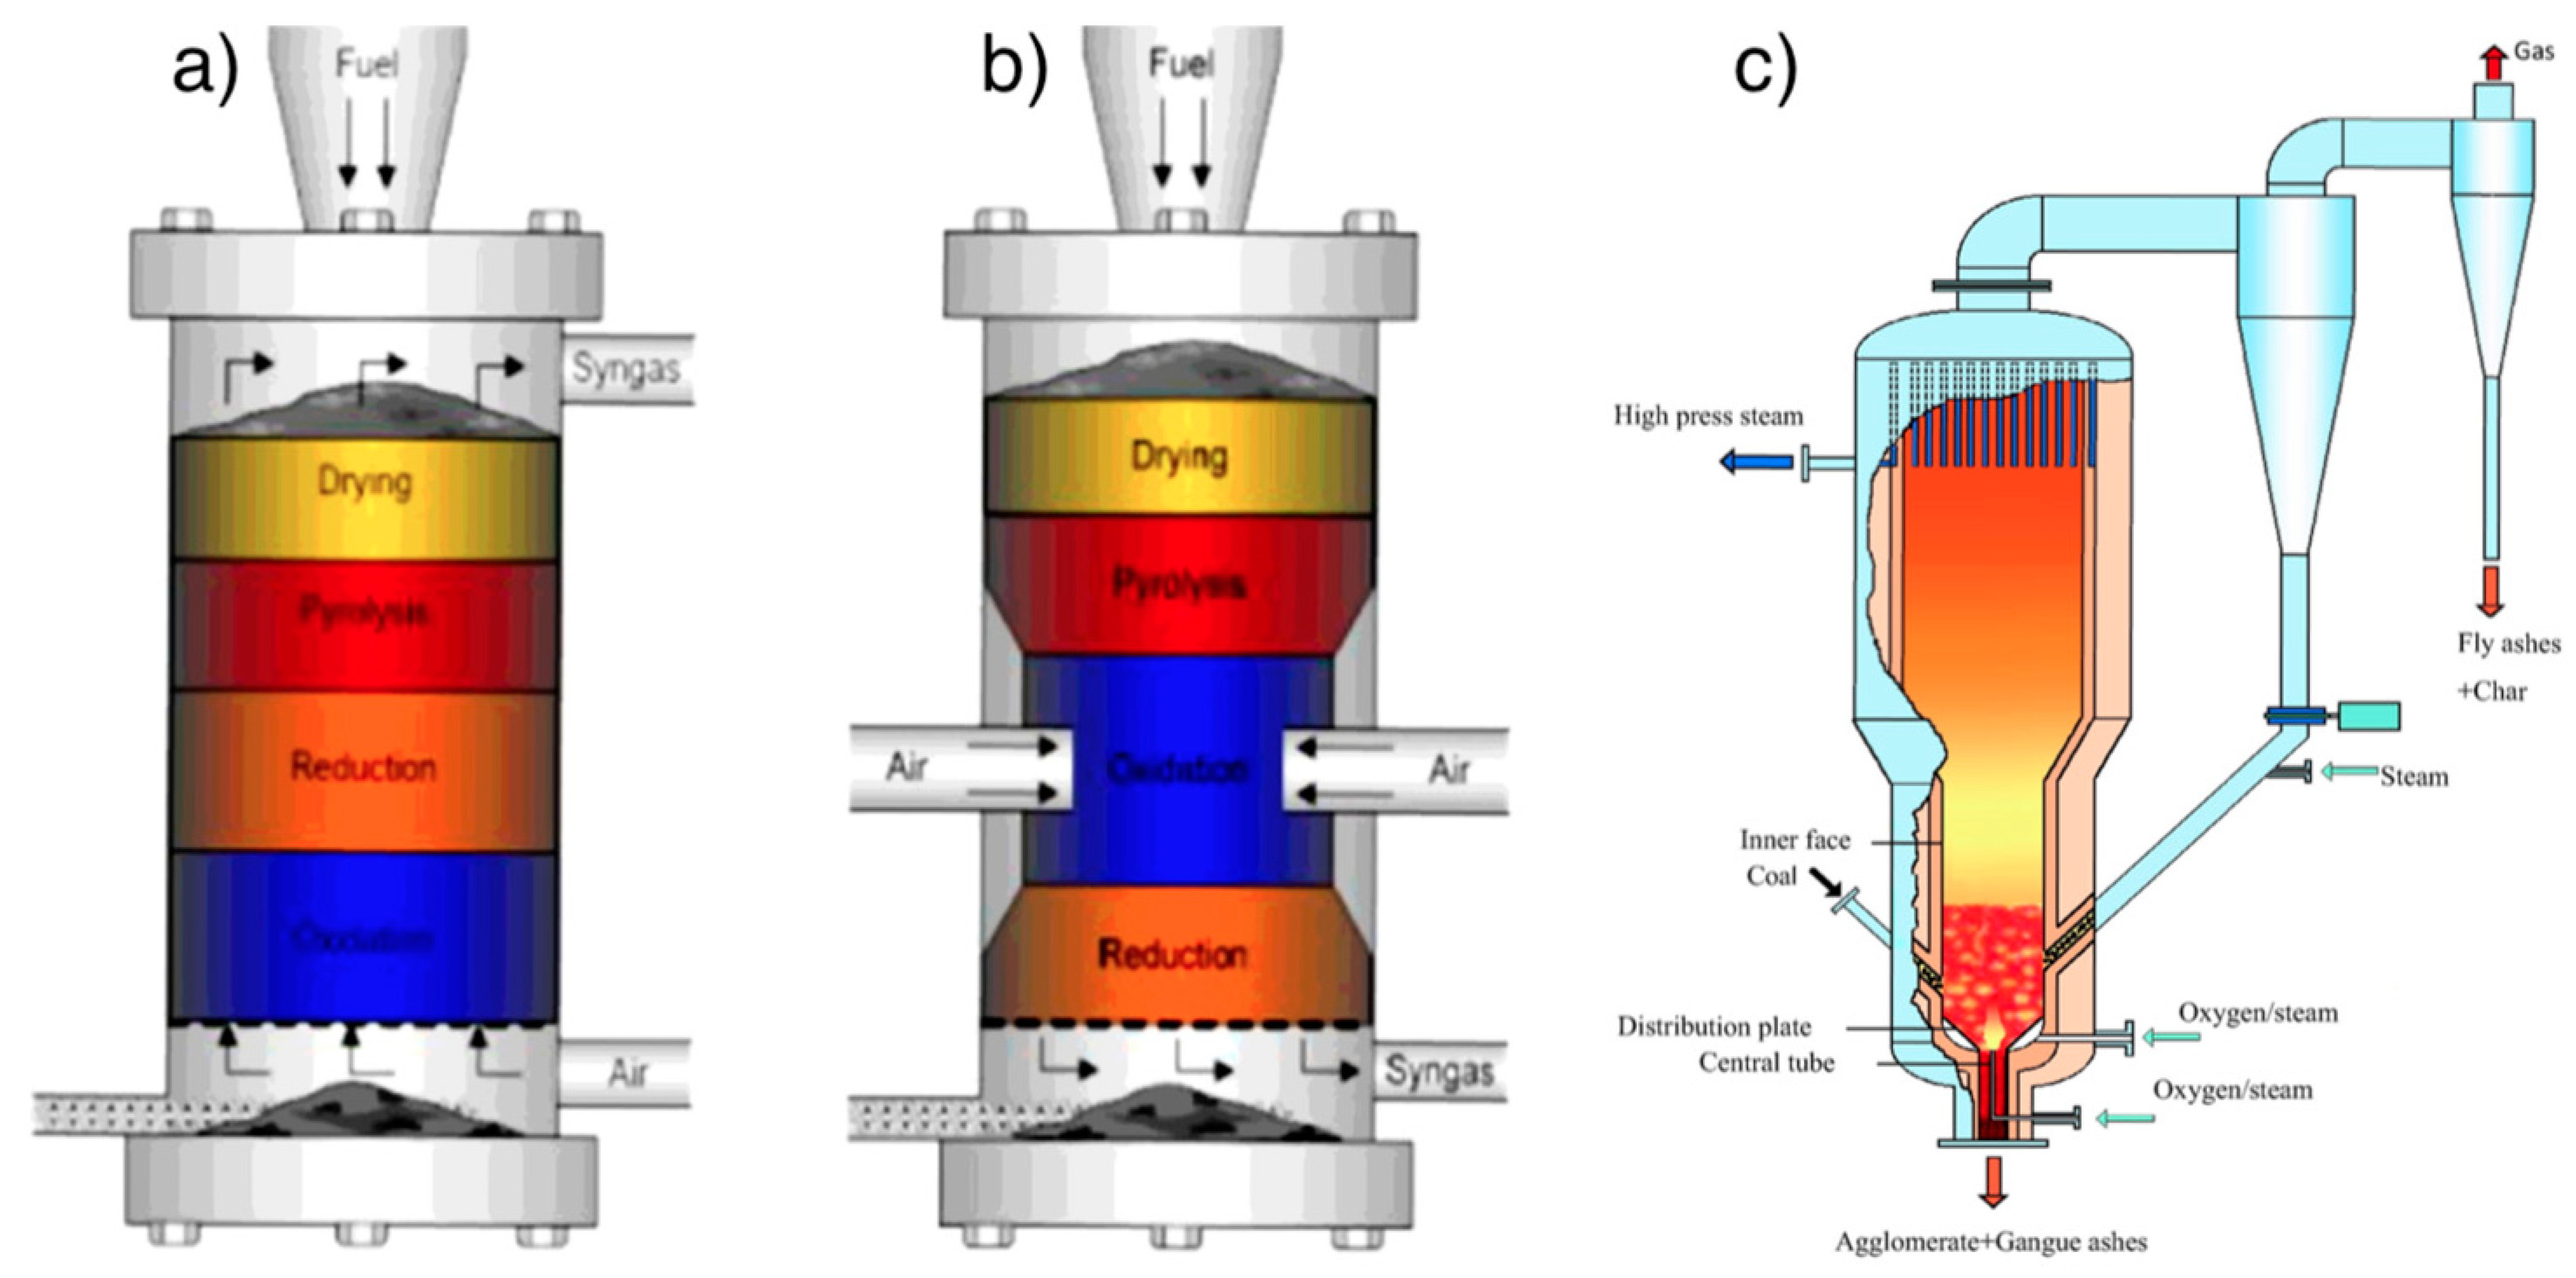
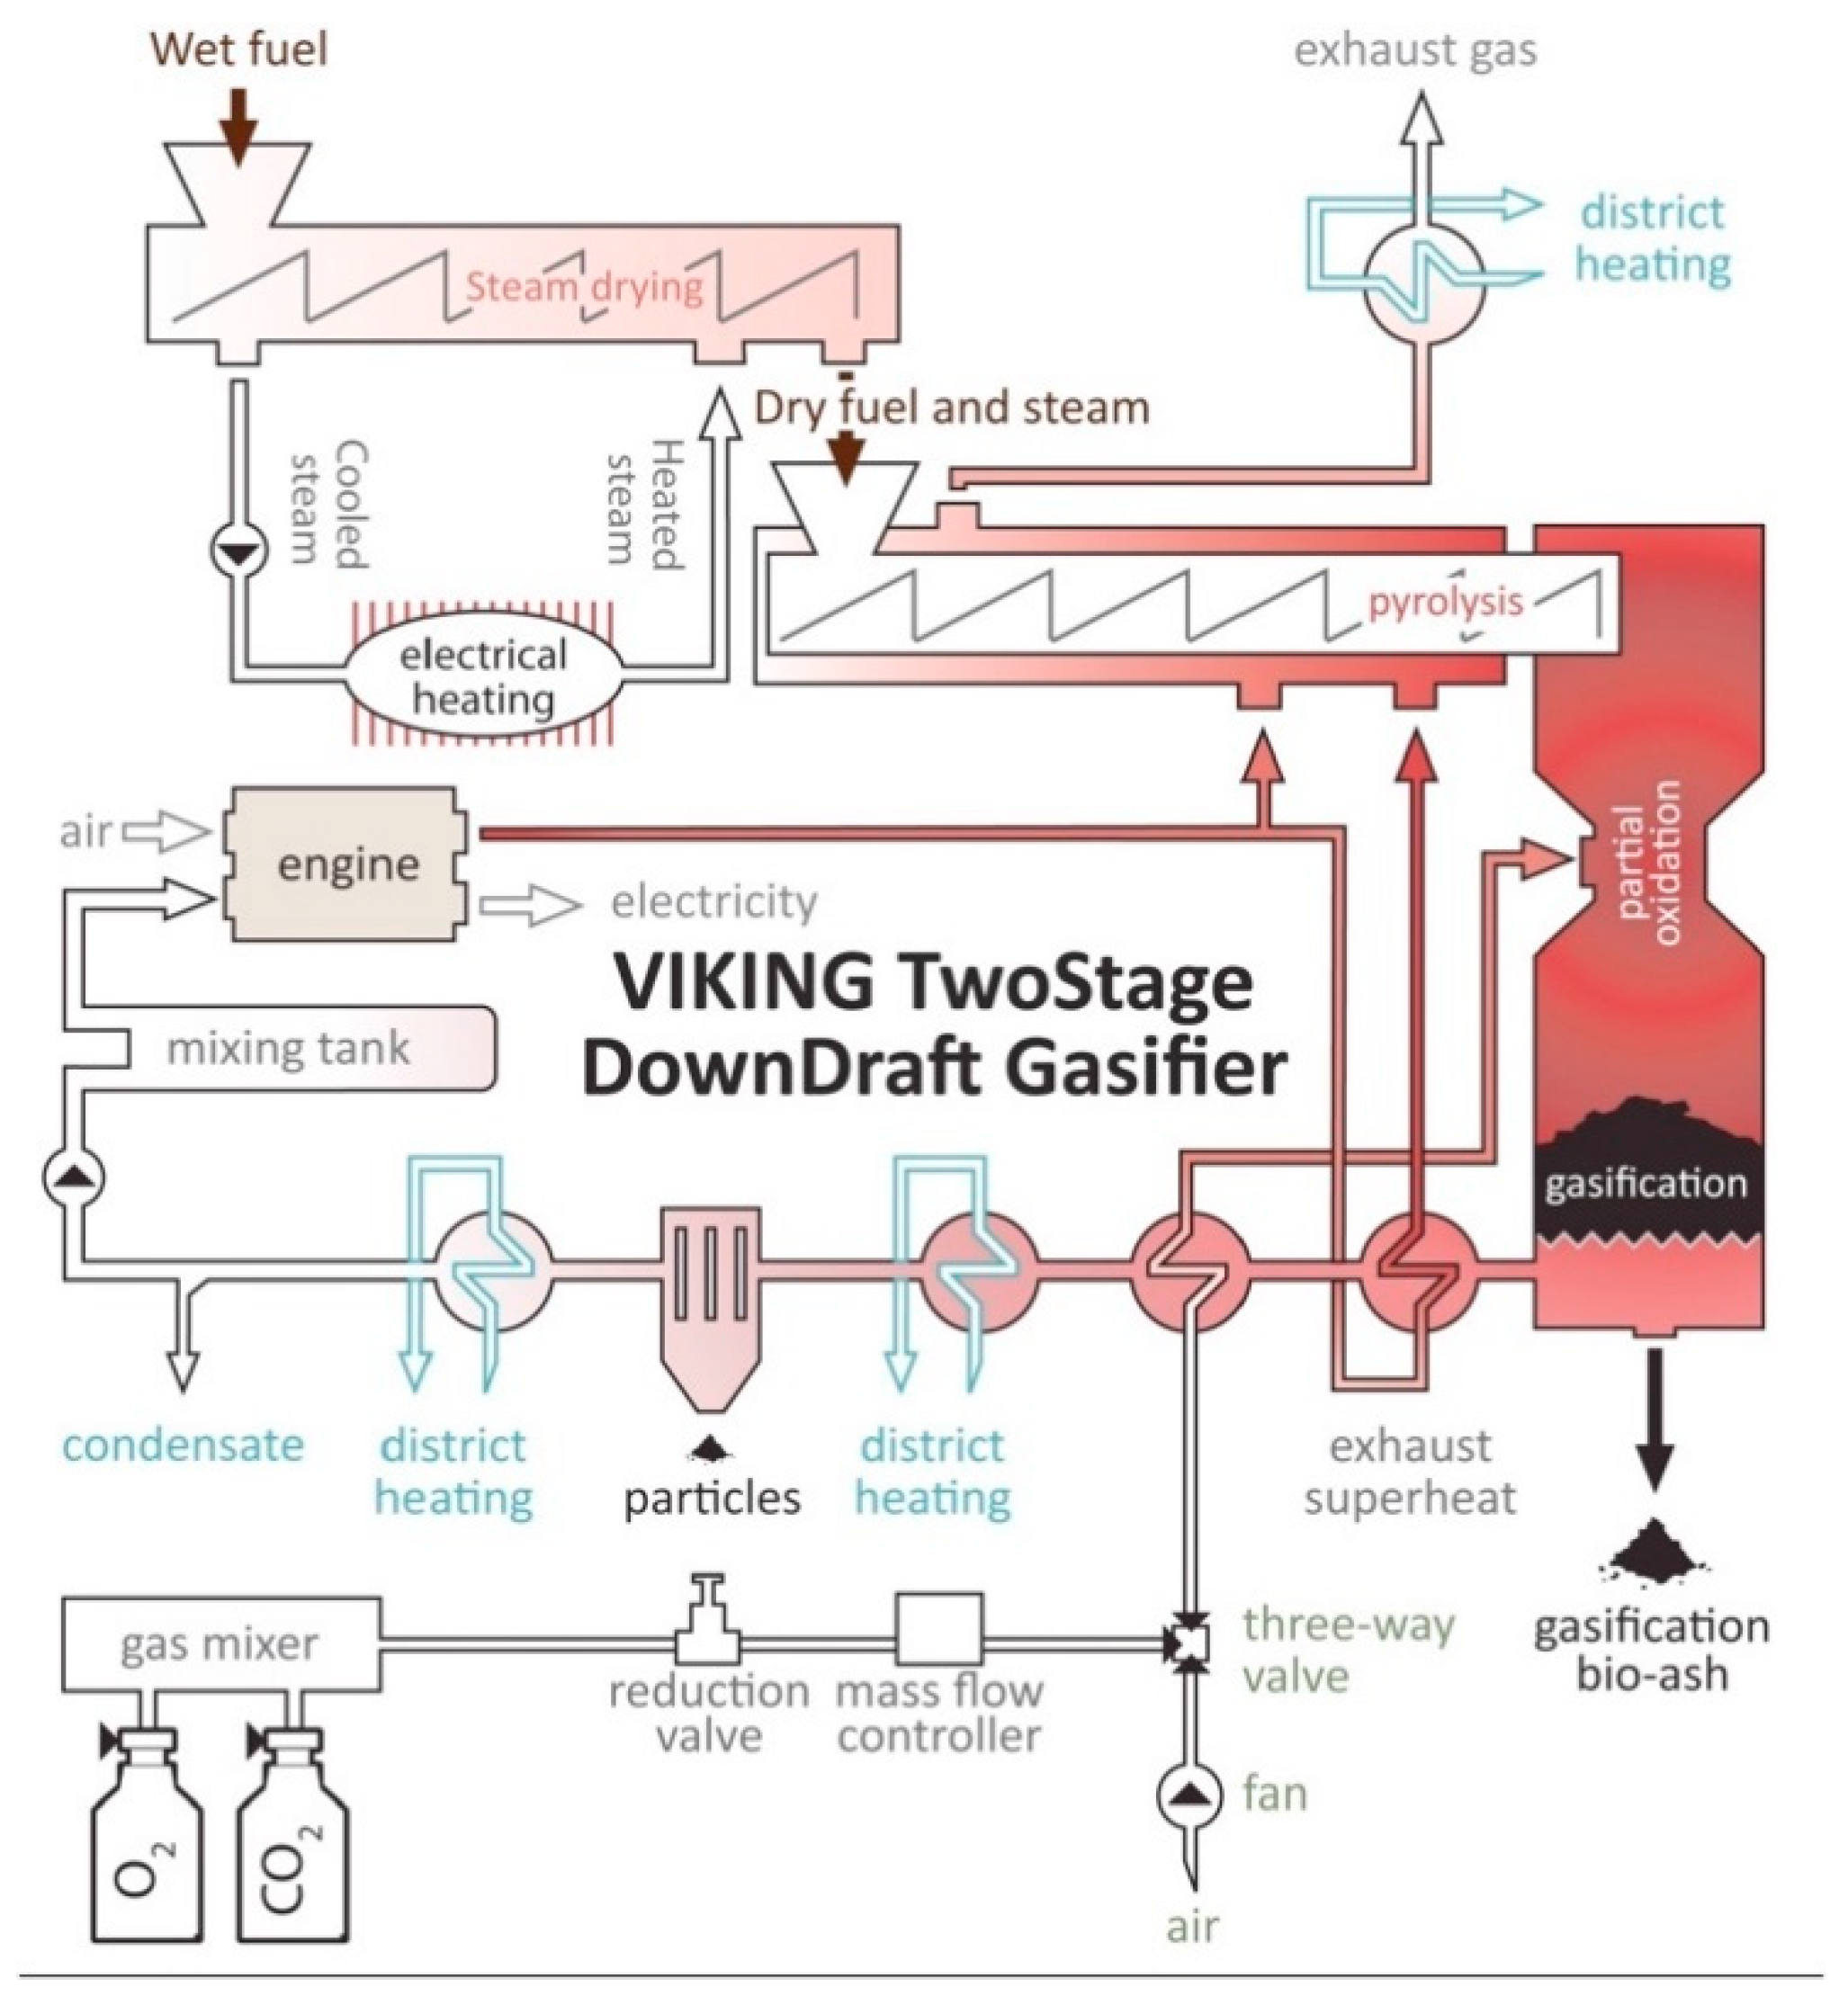
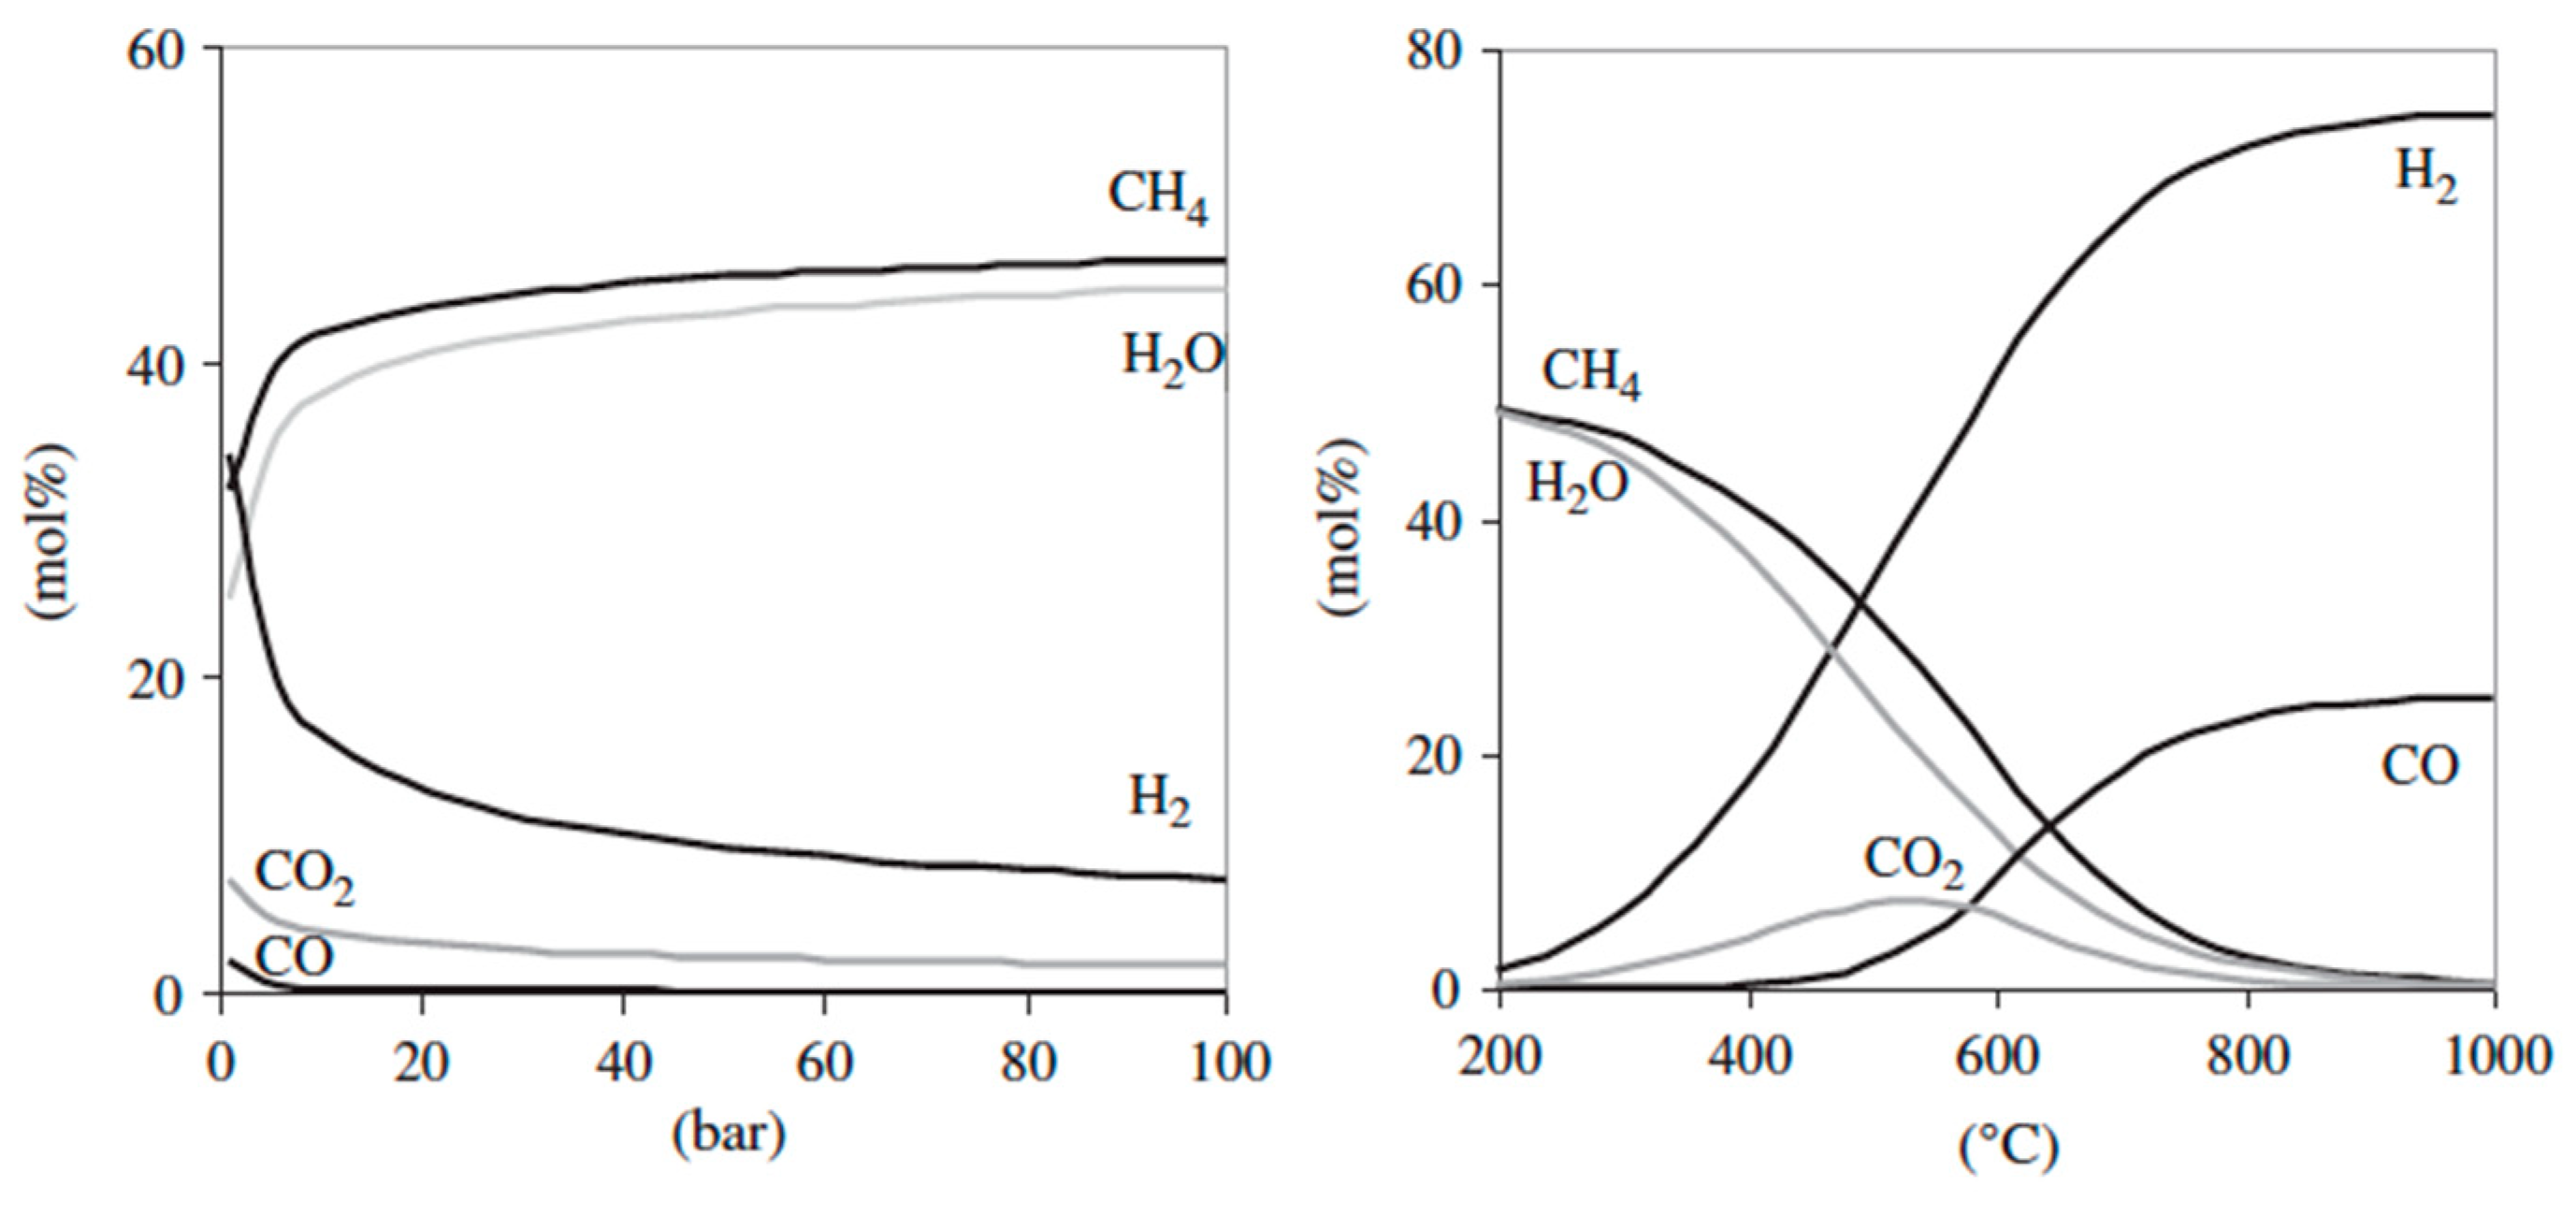
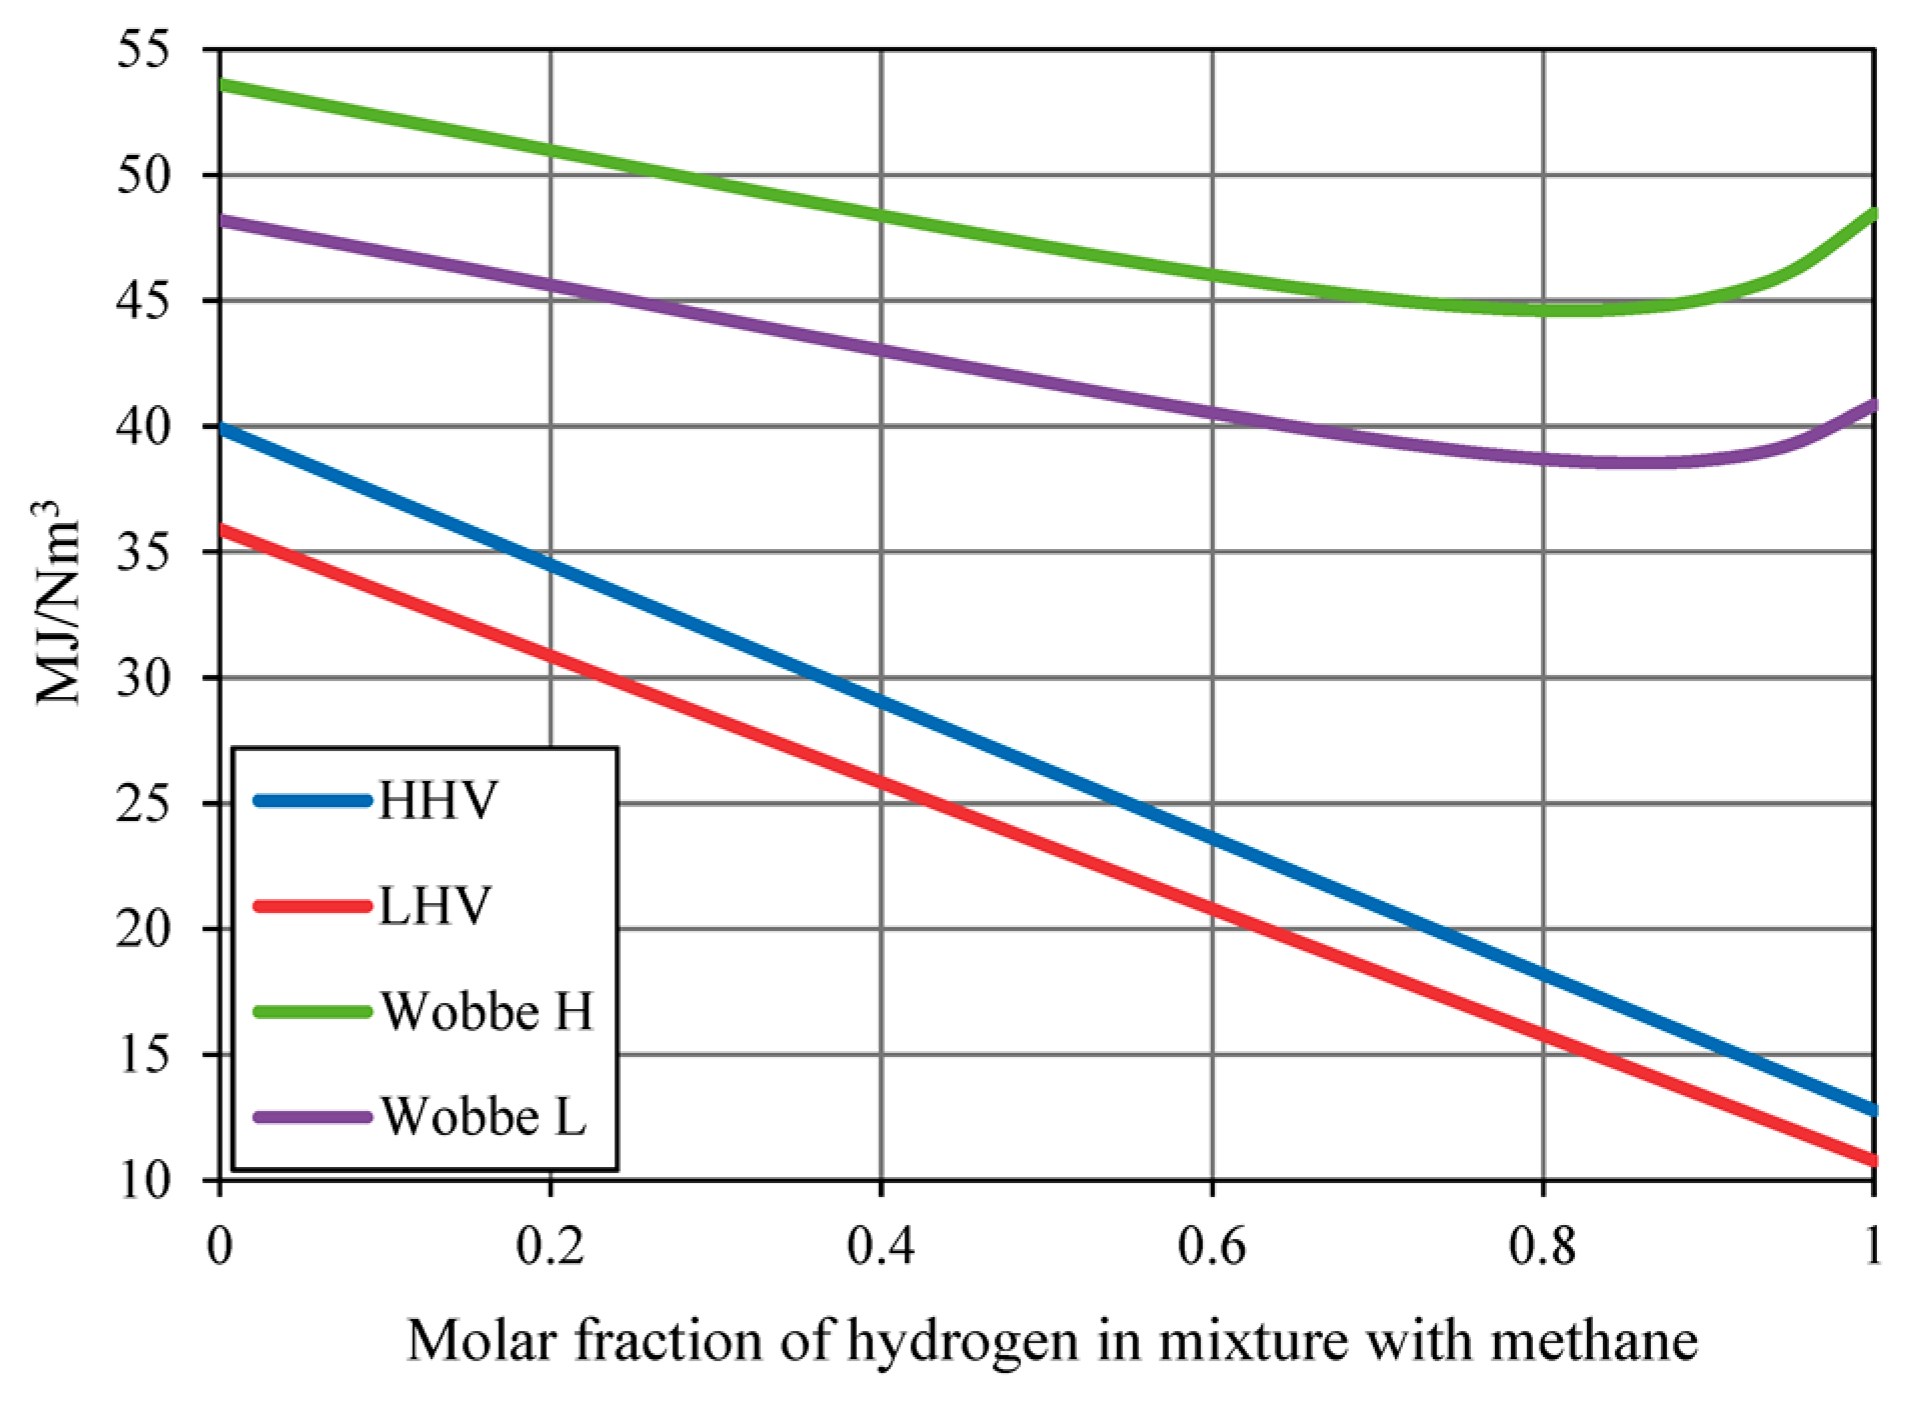
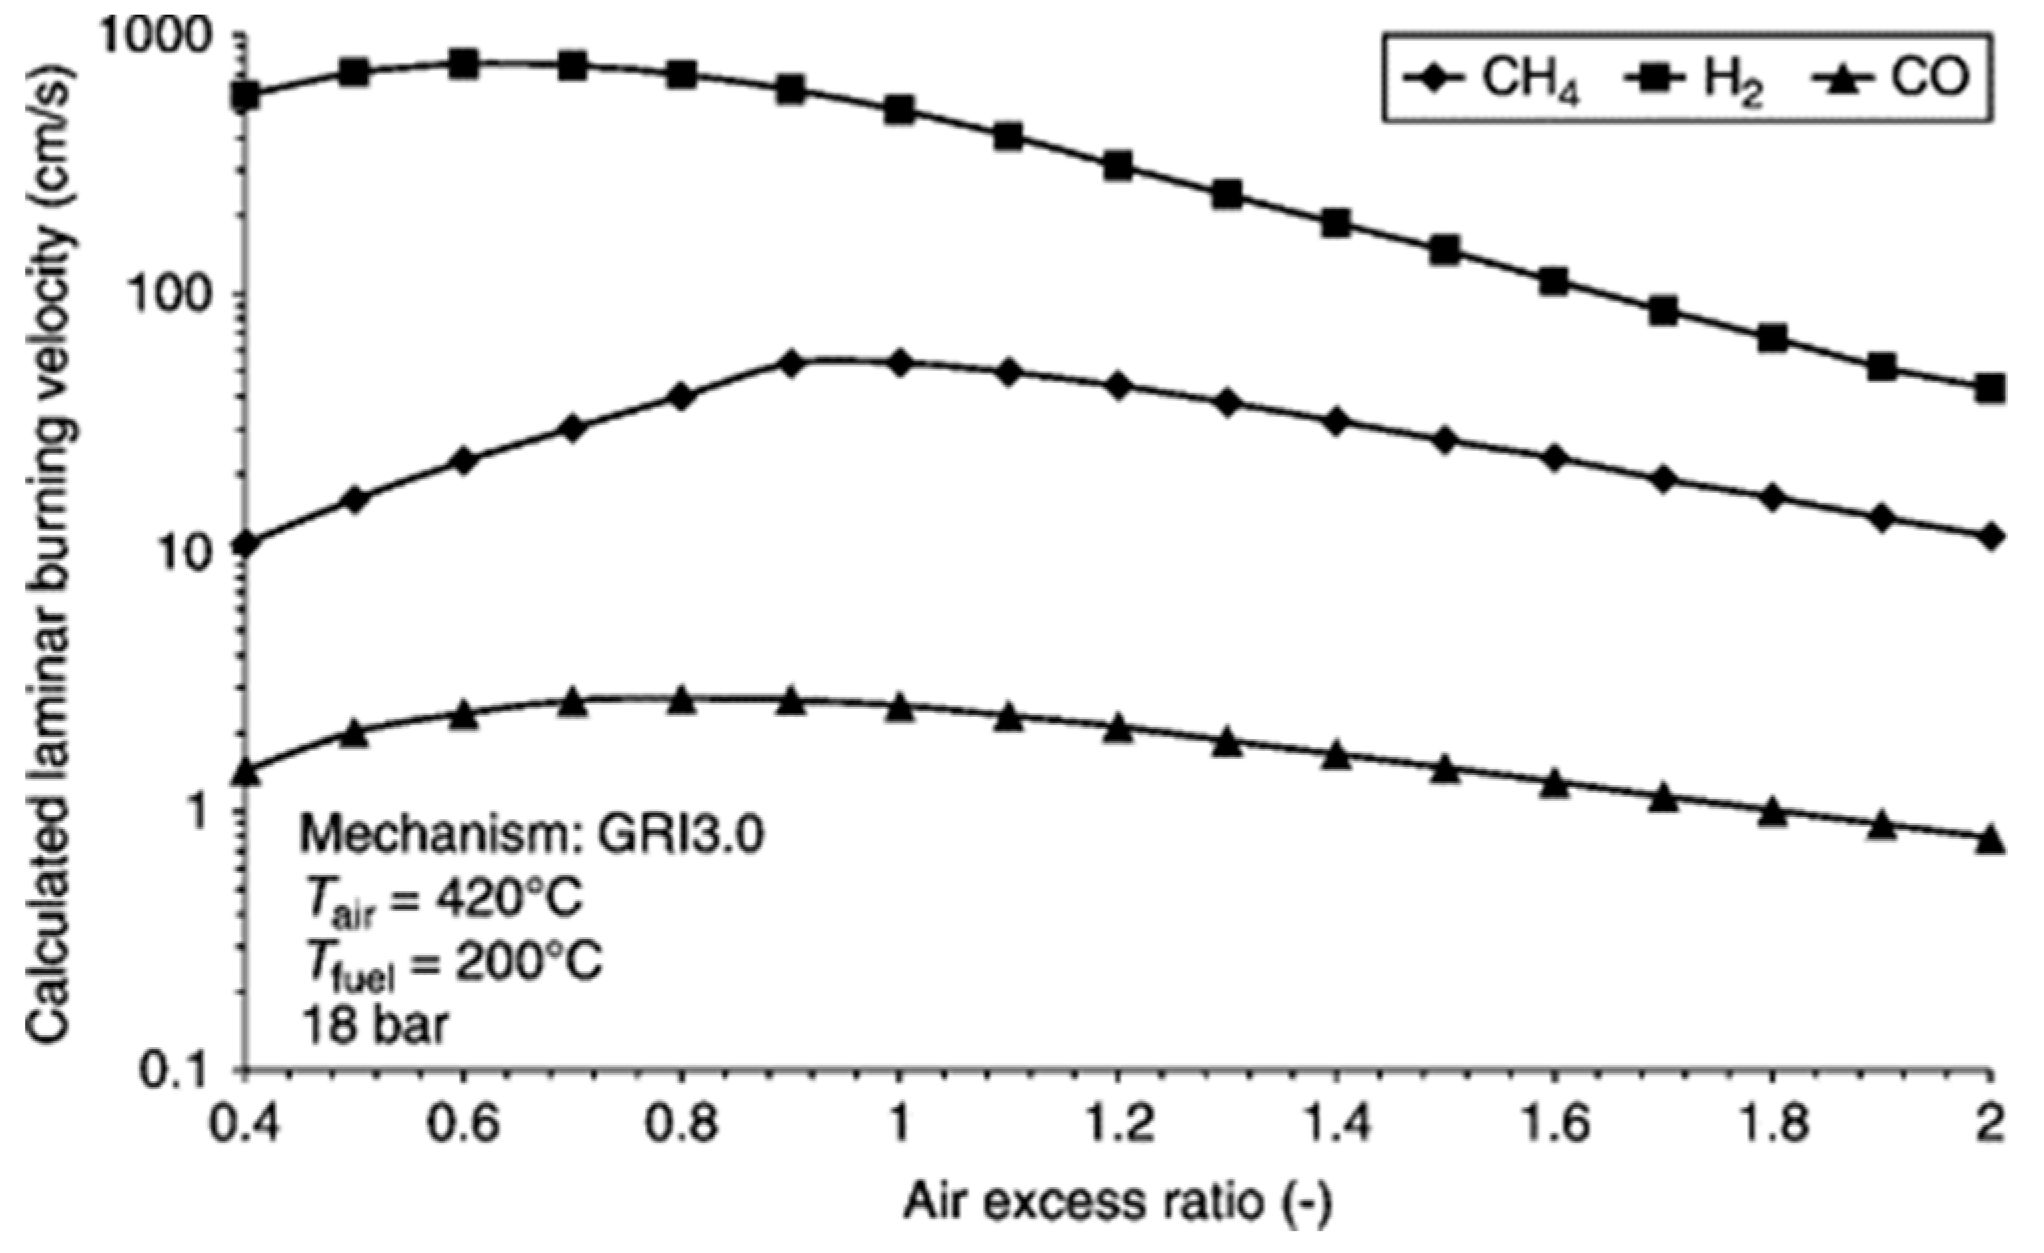
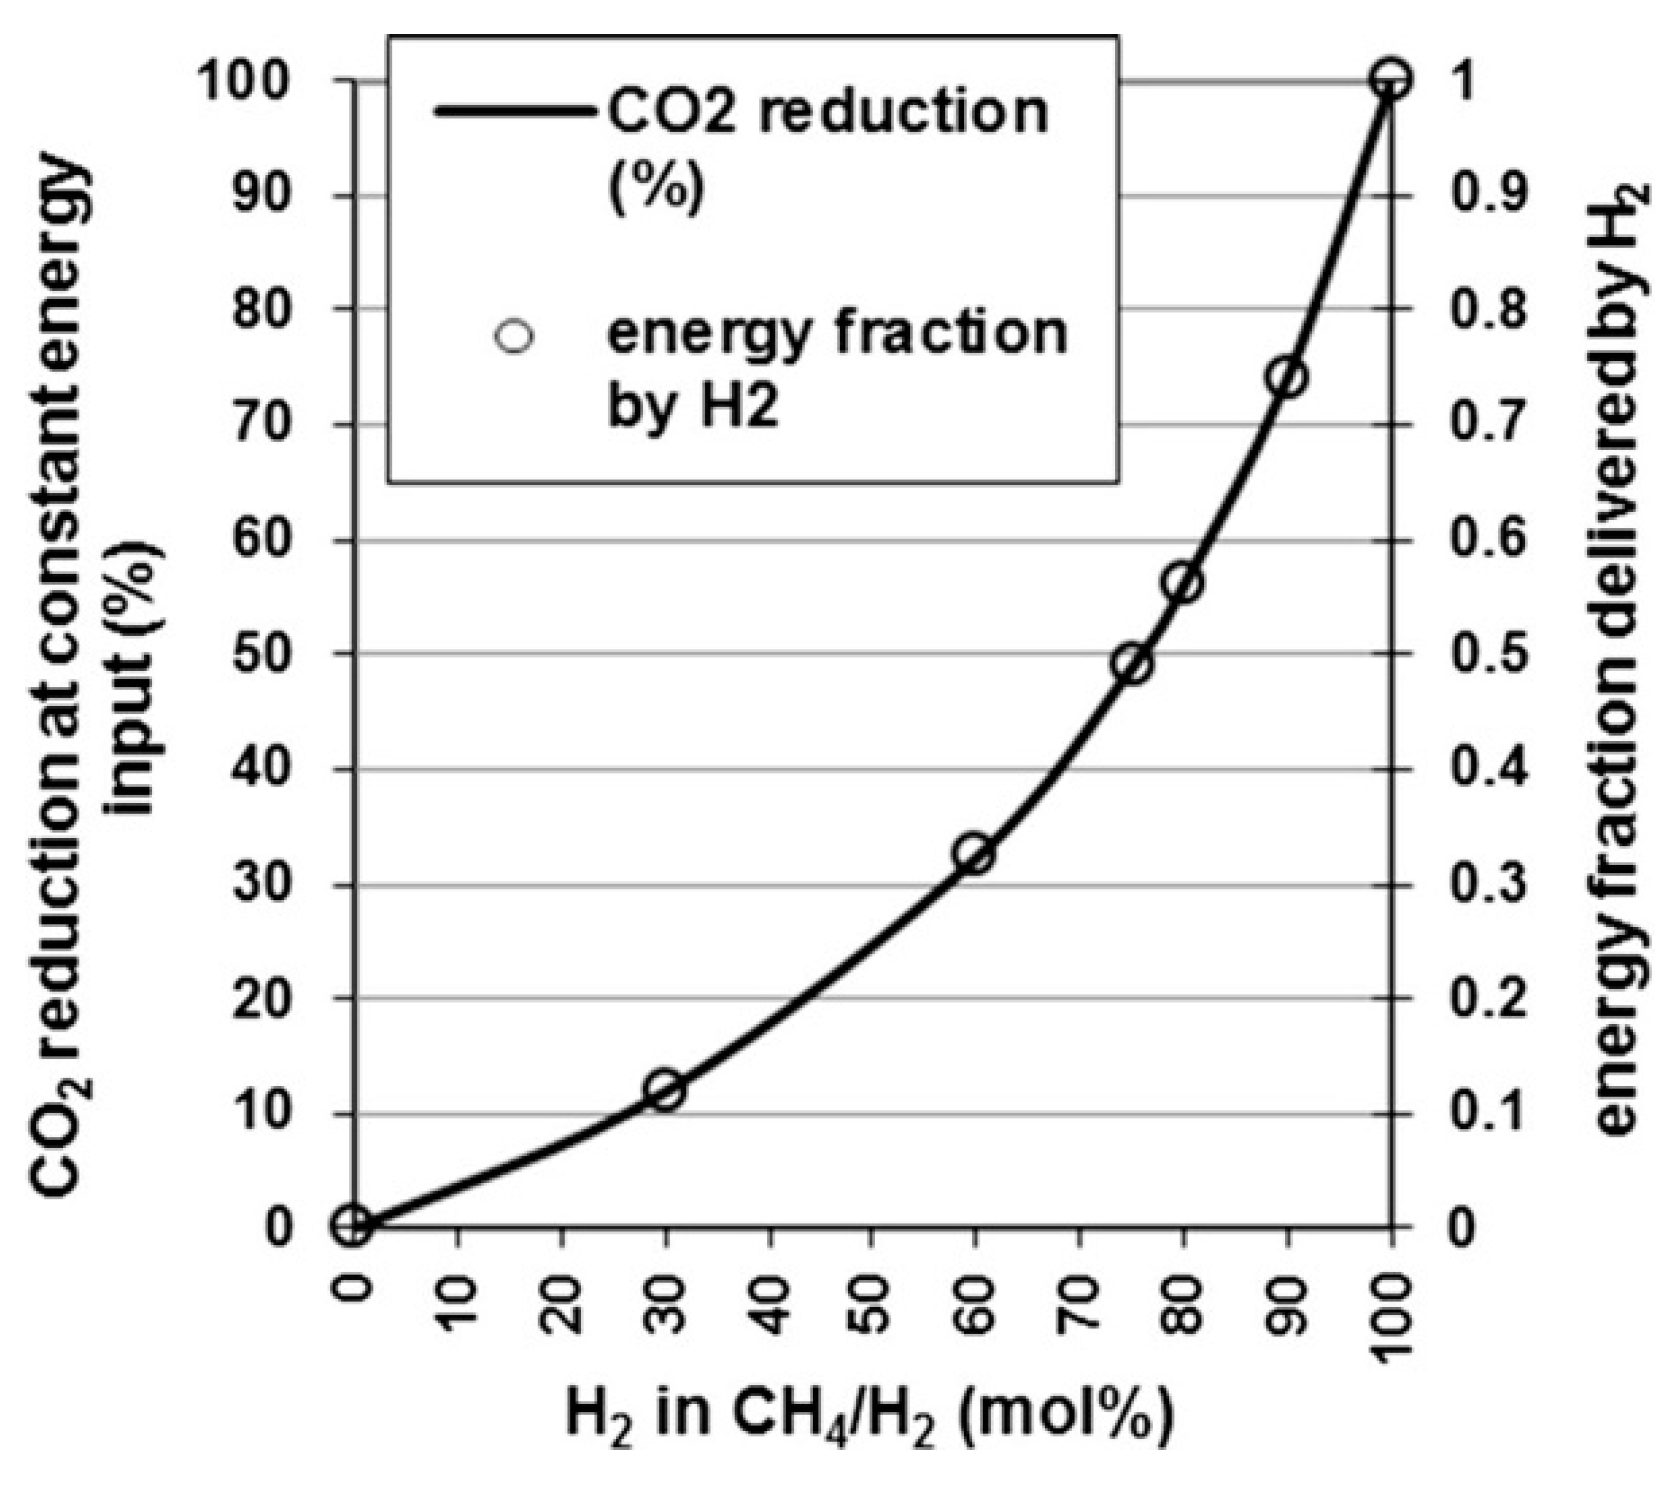
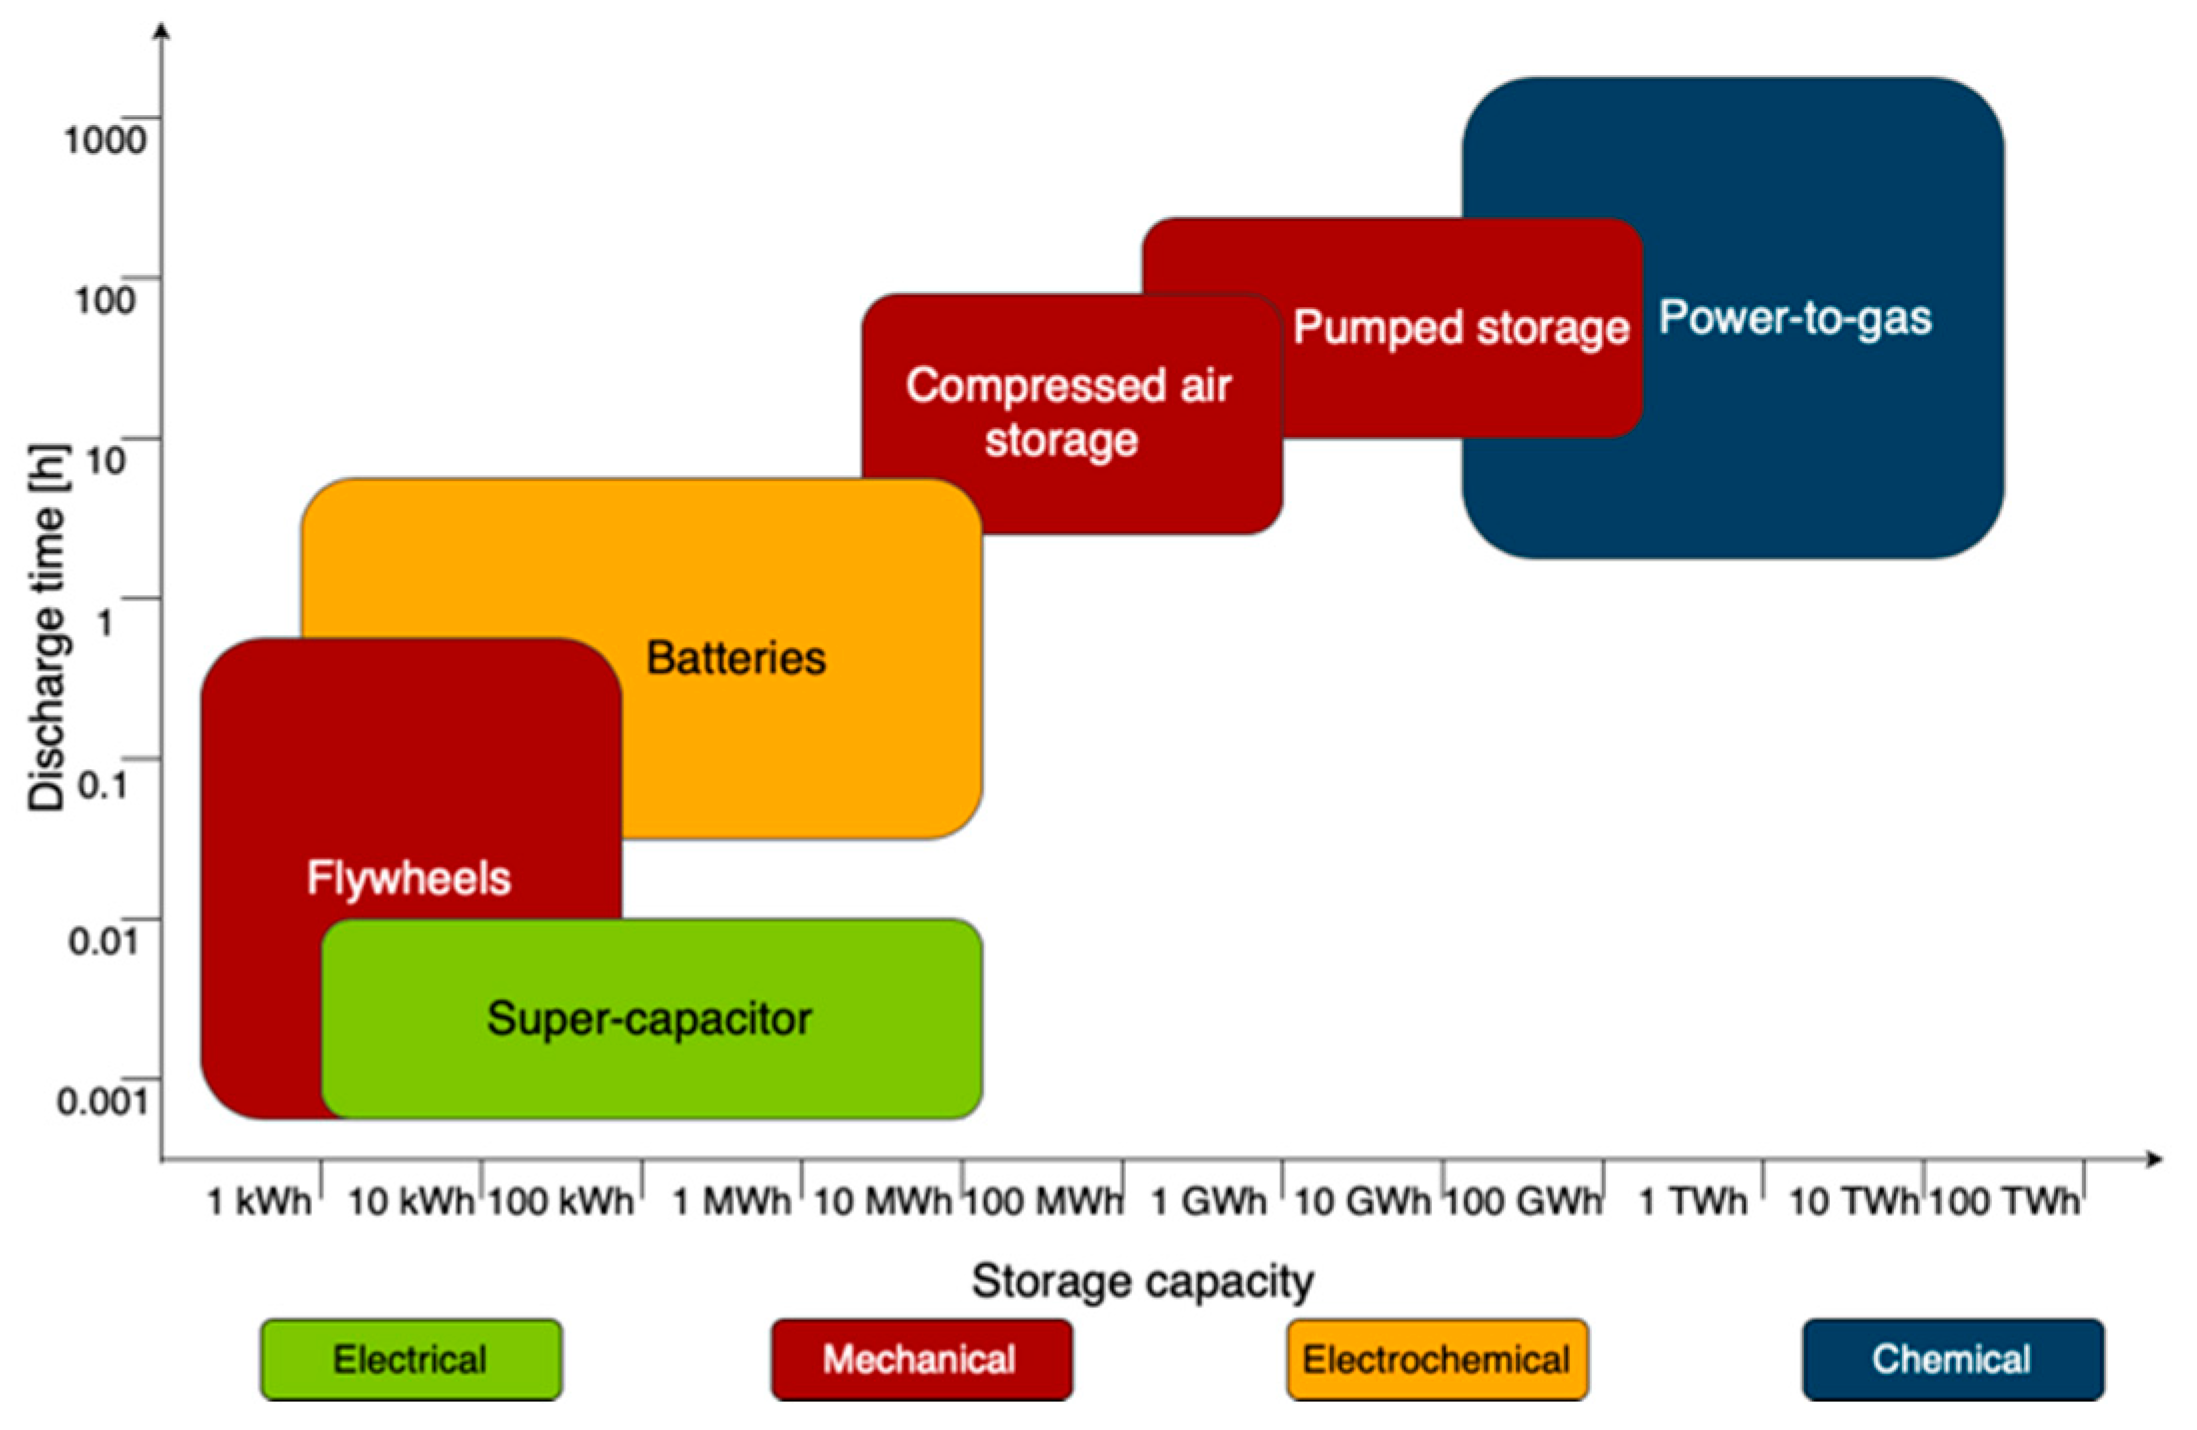
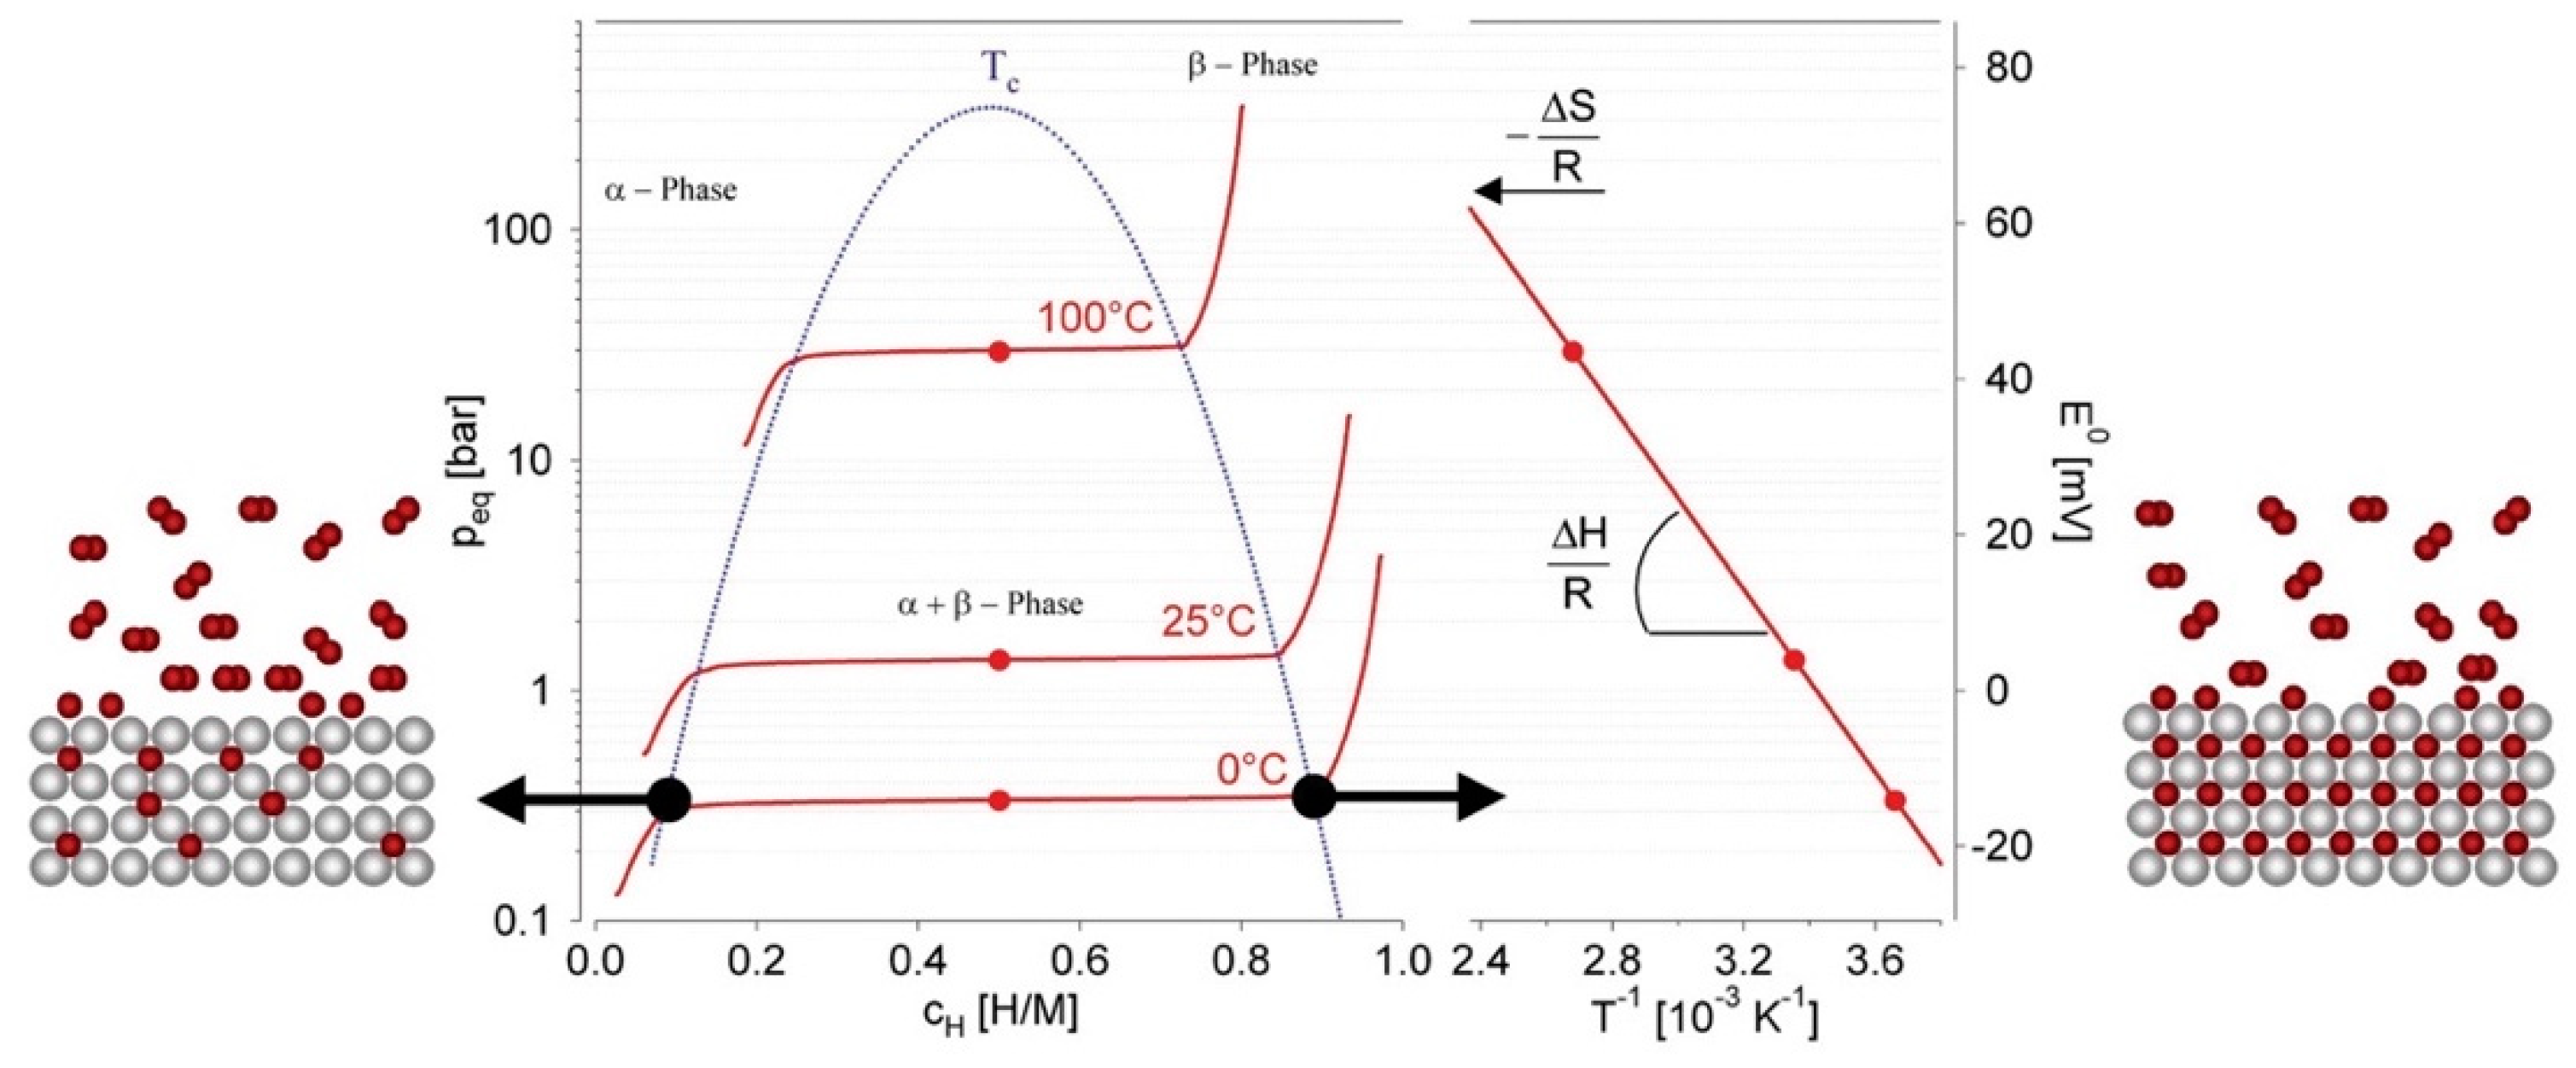
Figure 1. Hydrogen and synthetic natural gas supply chains. Renewable routes for the hydrogen and synthetic natural gas generation, distribution pathways and end-use alternatives.
Energies 13 00420 g001
Figure 2. Scheme of a two-step thermochemical cycle for H2O and CO2 splitting using metal oxide in a redox system. In the activation step, the metal oxide (MOox) is thermally decomposed via an endothermic reaction that requires high-temperature heat provided by concentrated solar power (CSP). In the oxidation step, the reduced metal oxide (MOred) reacts with steam and carbon dioxide producing syngas (H2 and CO). Finally, MOox is recycled.
Energies 13 00420 g002
Figure 3. Scheme of a sulfur–iodine three-step thermochemical water splitting. In the first endothermic step, H2SO4 is decomposed into steam, SO2 and oxygen that is released. Steam and SO2 react in the second reactor with I2, resulting in the formation of H2SO4 that is recirculated to the first-step reactor and HI that enters the third-step reactor. In the third reactor, HI is split into I2 and H2. I2 is recirculated to the second-step reactor and H2 is released.
Energies 13 00420 g003
Figure 4. (a) Rotary cavity receiver of the demonstration plant for ZnO dissociation at PROMES-CNRS (PROcédés, Matériaux et Énergie Solaire-National Centre for Scientific Research) furnace. Reprinted with permission from [145]; (b) Monolithic reactor with a foam structure (HYDROSOL-HYDROgen production in a SOLar monolithic reactor-project). Reprinted with permission from [148]; (c) cavity receiver containing a reticulated porous ceramic foam made of ceria (ETH furnace). Reprinted with permission from [137]; (d) multi-tubular solar thermochemical reactor in a 50 kWth plant for methane dissociation. Reprinted with permission from [150].
Energies 13 00420 g004
Figure 5. Schematic of the operational principle of alkaline, proton exchange membrane and solid oxide electrolysis cells. Reprinted with permission from [153].
Energies 13 00420 g005
Figure 6. Comparison between typical ranges of the polarization curves for a different type of electrolytic cells at the actual state of art. The thermoneutral voltage of the alkaline electrolysis involves low current, and therefore, the operational point is generally in the exothermic regime (higher current density). Solid oxide is performing better due to the high temperature operation that reduces the overvoltage losses. Reprinted with permission from [157].
Energies 13 00420 g006
Figure 7. A simplified schematic of a proton exchange membrane electrolytic cell. Reproduced from [209].
Energies 13 00420 g007
Figure 8. Molar composition on a dry basis of outlet gaseous compounds with a cathode inlet temperature of 800 °C (a) as a function of operating pressure; (b) as a function of outlet temperature at a pressure of 160 kPa. Reprinted with permission from [266].
Energies 13 00420 g008
Figure 9. (a) Operational principle of a microbial electrolysis cell operation. Reproduced with permission from [277]. (b) Schematic electrons transfer mechanism: A. transfer through electron shuttling compounds; B. direct transfer via membrane cytochrome proteins; C. direct transfer via conductive pili proteins. Reproduced from [278].
Energies 13 00420 g009
Figure 10. (a) Scheme of a photoelectrochemical cell. Reprinted from [300]; (b) Illustration of a photoelectrochemical cell. Reprinted with permission from [304].
Energies 13 00420 g010
Figure 11. Basic principle of overall water splitting, pointing out the energy levels of bandgap and water oxidation/reduction potential. Reprinted with permission from [308].
Energies 13 00420 g011
Figure 12. (a) Theoretical maximum solar-to-hydrogen efficiency and photocurrent density as a function of semiconductor bandgap under irradiation of AM (Air Mass) 1.5 G (1000 W/m2). Reproduced with permission from [309]. (b) Reported electrochemical current density as a function of solar-to-hydrogen efficiency. The shape of the points shows the device configuration, the fill color shows the type of material used, and the boundary color shows the type of catalyst material. Reprinted with permission from [304].
Energies 13 00420 g012
Figure 13. Energy scheme of a dye-sensitized photoelectrochemical cell (DS-PEC). Reproduced with permission from [362].
Energies 13 00420 g013
Figure 14. (a) Schematic representation of a multijunction photoelectrochemical cell for water splitting. Photons with an energy level higher than 1.8 eV are absorbed by GaInP, while those with energy level up to 1.8 eV pass through and are absorbed by the bottom GaInAs junction, which absorbs photons with energy higher than 1.2 eV. Electrons in the GaInP conduction band reduce H+ to hydrogen, and holes in the valence band of GaInAs oxidize H2O. A tunnel junction connects the two cells, and holes in GaInP layer recombine with electrons in GaInAs junction; (b) TEM (transmission electron microscope) cross-section of the GaInP and GaInAs cells and tunnel junction. Reprinted with permission from [386].
Energies 13 00420 g014
Figure 15. (a) Natural photosynthesis process in which electrons of reaction centers P680 and P700 are injected into charge-carrier molecules; (b) single-step photoelectrochemical reactions; (c) Z-scheme photoelectrochemical reactions. Reprinted with permission from [408].
Energies 13 00420 g015
Figure 16. Reaction sequence for the thermochemical conversion of biomass.
Energies 13 00420 g016
Figure 17. Layout of Ensyn RTP (rapid thermal processing) fast pyrolysis plant. The process is based on the contact between dried biomass and hot sand which rapidly fragments the biomass into gas, vapor and charcoal. Condensable gases are quenched, producing bio oil and incondensable gas. Char and sand are heated in a second vessel: hot sand is recirculated to the pyrolysis reactor, whereas gas and fly ash are divided in a cyclone, and flue gas is recirculated to the dryer.
Energies 13 00420 g017
Figure 18. Design of different gasification reactors: (a) fixed-bed updraft gasifier; (b) fixed-bed downdraft gasifier. Reprinted with permission from [46]. (c) fluidized-bed gasifier. Reprinted with permission from [530].
Energies 13 00420 g018
Figure 19. Schematic representation of the two-step Viking gasifier. Reprinted with permission from [550].
Energies 13 00420 g019
Figure 20. Influence of pressure and temperature on the chemical equilibrium composition of a mixture with an H2/CO ratio of 3. Reprinted with permission from [591].
Energies 13 00420 g020
Figure 21. Effect of H2/CO ratio on CH4 yield as a function of temperature and pressure: (a) CO methanation; (b) CO2 methanation. Reproduced with permission from [594].
Energies 13 00420 g021
Figure 22. Changes of higher heating value (HHV), lower heating value (LHV), the Wobbe index of a high Wobbe gas (Wobbe H) and the Wobbe index of a low Wobbe gas (Wobbe L). Reprinted from [665].
Energies 13 00420 g022
Figure 23. Laminar flame velocity as a function of the air excess ratio of methane and hydrogen. Reprinted with permission from [671].
Energies 13 00420 g023
Figure 24. Reduction of the CO2 emissions at constant energy input as a function of the mole fraction of H2 and NG (natural gas) and energy fraction delivered by H2. Reprinted with permission from [672].
Energies 13 00420 g024
Figure 25. Relationship between discharge time and storage capacity of energy storage technologies.
Energies 13 00420 g025
Figure 26. Pressure–composition isotherms. Reprinted with permission from [733].
Energies 13 00420 g026
Table 1. Gas quality specification at standard conditions recommended by EASEE-gas (European Association for the Streamlining of Energy Exchange-gas) in the CBP (Common Business Practice) 2005-001/02.
ParameterUnitValue
Wobbe indexMJ/m348.96 ÷ 56.92
Relative densitym3/m30.555 ÷ 0.700
Total sulfurmg/m330
H2S and COSmg/m35
RSHmg/m36
O2mol %0.001
CO2mol %2.5
Water dew point°C at 70 bar−8
Hydrocarbon dew point°C at 1–70 bar−2
Table 2. Methane and hydrogen properties evaluated at NTP (normal temperature and pressure) and stoichiometric air.
ParameterCH4H2
Higher heating value [MJ/m3]39.8212.75
Relative density [m3/m3]0.55480.0695
Wobbe index [MJ/m3]53.5448.37
Stoichiometric air requirement [mol/mol]9.552.39
Laminar flame velocity [cm/s]36.7275
Adiabatic flame temperature [K]19502210
Flammability limits in air by volume [%]5.3 ÷ 154.1 ÷ 74
Diffusion coefficient [cm2/s]0.210.63
Table 3. Technology readiness level, energy conversion efficiency, fuel production cost and CO2 emissions of hydrogen and syngas generation routes.
TRLTRL DescriptionEnergy Conversion Efficiency [%]Production Cost [$/kgfuel]CO2 Emission [kgCO2/kgfuel]Note
Biomass gasificationAir4–9
  • 14 pilot plants
  • Nine demonstration plants
  • Seven first-of-a-kind commercial demonstration plants
  • Five commercial plants
45–60 (cold gas efficiency of energy conversion to syngas) [757]1.17 (2000 dry tons/day plant using forest residues)–1.33 (2000 dry tons/day plant, straw-based biohydrogen) [758]1.10–1.61 [758]
Steam60–70 [759,760]
Oxygen65–80 [528,761]
Thermolysis1–3Laboratory scale10 [68]7.98–8.40 [34]-No pilot plant, more attention for two-step thermochemical cycles
Two-step Thermochemical cycle (ZnO/Zn)4–7
  • 4 kWth ETH
  • 50 kWth CSIRIO
  • 100 kWth PSA
  • 100 kWth PROMES-CNRS
  • 750 kWth HYDROSOL
17(CY 2015 case assuming 70% ZnO dissociation and heliostats cost of 126.5$/m2)–21 (CY 2025 case assuming 85% ZnO dissociation and heliostat cost of 90$/m2) [762]6.07–4.18 [763]-Further research on reactor materials, quenching of products, separation of reactants and solar concentration technologies
Three-step thermochemical cycle (S–I)19 [149]5.01–4.68 [763]-
Photoelectrochemical (PEC) cell1–4Scale-up of PEC reactors3–5 (solar to fuel efficiency demonstrated in single-junction devices based on low cost thin-film materials)12–16 (solar to fuel efficiency demonstrated in tandem devices based on high-quality crystalline semiconductors) [441]11.4 [315,764]-Pilot plants planned for next few year
Electrolysis PVWindPVWind
Alkaline electrolyzer7–9
  • 83 pilot plants
  • 16 demonstration plants
10–1220–24 (photovoltaic efficiency of 20% and the wind power efficiency of 40% multiplied for the electrolyzer efficiency: AEC 50%–60%, PEMEC 55%–70%, SOEC 40%–60%, MEC 78% [178])1.8 (forecasted production cost of hydrogen in 2050 through water electrolysis using electricity from PV or offshore wind)–4.3 (hydrogen production cost in 2020 through water electrolysis using electricity from PV or offshore wind) [765]3–6.7 [765]-Three planned first-of-a-kind commercial demonstration plants (10-20-700 MWel)
PEM electrolyzer4–8
  • 68 pilot plants
  • 16 demonstration plants
11–1422–28-Three planned first-of-a-kind commercial demonstration plants
Solid oxide electrolyzer3–5
  • 150 kWel Sunfire GmbH
  • 120 kWel GrinHy
8–1216–24-Planned the first commercial plant (20 MWel)
Microbial electrolyzer1–4
  • 2.5 L scale-up device
  • 1000 L pilot plant
  • Other semi-pilot plants (>100 L)
15.53111.5 (NREL TEA calculation assuming 90% hydrolysis efficiency) [766]Pilot plants are mostly fed by domestic wastewater
CO/CO2 methanation5–7
  • 6 MWel beta-plant
  • 6 MWel WOMBAT
  • 20 MW GoBiGas
  • Store&GO (IT 200 kW, CH 700 kW, DE 1 MW)
74–82 [606]2.83–4.17 [767]- (No CO2 emissions if the CO2 conversion efficiency is 100%)Two planned demonstration plants of 10 MW (MeGa-StoRE project)

