1. Introduction
Transportation is the biggest emitter of environmental pollution in metropolitan districts [
1], consuming about 62% of the oil produced globally and producing 6892 Mt of CO
2 emissions into the air [
2]. This classifies transportation as the second greatest source of CO
2 [
3]. As per studies conducted by International Energy Outlook, transportation demand will rise till 2035 by 54%, causing a significant global increase in fossil fuels’ demand if alternative eco-friendly solutions are not adopted [
4]. The environmental issues related to fossil-fuel exhaustion have increased worldwide motivation for deploying Electric Vehicles (EVs) as ecological and clean means of transportation. As a result, global EVs’ sales grew from 320,000 in 2014 to 1.04 million in 2017 [
5]. To encourage EV expansion, it is vital to accelerate the expansion of Fast Charging Stations (FCS) where EVs can be charged for 15–20 min [
6]. Supplying FCS from the existing energy system imposes an extra burden on the electrical grid. Moreover, stochastic connections to charge EVs cause overloading at peak demand, creating instability and, ultimately, blackouts [
7]. Those facts necessitate exploring additional resources for securing additional power to supply the rapidly increasing number of FCS [
8]. As electricity is generated predominantly from fossil fuel-based sources such as petroleum, gas and coal, the substantial growth in the energy demand to supply the anticipated large number of FCS will expedite fossil fuel reserve exhaustion and cause severe ecological impacts. This fact triggers the need for expanding the deployment of sustainable renewable energy sources (RES) as alternative non-conventional and non-fossil-fuel-based solutions to fulfill FCS power demand.
RES are considered as the main element in any de-carbonization strategy [
7]. Due to the stochastic nature of RES, their large-scale penetration at the supply end of the existing energy system can stress network performance by reducing power quality, causing voltage deviations and increasing power losses [
4]. The increased penetration of photovoltaics (PV) and wind turbines (WT) in the network threatens the stable operation of distribution networks due to RES output fluctuation [
9]. By contrast, investment costs [
10], losses and voltage fluctuations [
11] can be reduced dramatically by installing them near the load. As a result, the roll-out of grid-independent renewable energy-based FCS to fulfill the rapid expansion of EV adoption around the globe seems to be a promising solution from the technical, economic and environmental perspectives. The hybridization of multiple renewable energy-based subsystems with various energy storage options connected to the grid have been explored and developed for many years. Nevertheless, the study of grid-independent FCS powered by both RES systems and multiple energy storage units is relatively recent.
The opportunities to use locally distributed hybrid renewable energy resources to supply EV charging stations instead of connecting to the grid can be summarized as follows:
Prevent fossil fuel-based power generation expansion to fulfill EVs’ increasing charging demand and associated environmental pollution.
Despite the availability of a national-level power surplus, many cities within the same nation might suffer from excess stress on the local electricity distribution network with no possibility of connecting to the grid.
Avoid costly infrastructure investments due to a lack of nearby connection possibilities for the existing grid.
Promote distributed generation to avoid technical malfunctions and failures due to overloading the existing network and transformers.
Exempt charging station owners from paying carbon taxes by investing in establishing independent renewable energy-based power generation systems instead of connecting EV charging stations to the existing grid.
Improve system resilience against possible grid interruptions during peak demand.
It is important to intensify the theoretical and experimental studies in this field to improve the awareness of these joint subsystems, where the proposed designs must be modeled, simulated and optimized considering real-life conditions to determine their feasibility before practical implementation.
Many studies investigated and modeled grid-dependent EV charging stations, where Genetic Algorithm (GA) and Particle Swarm Optimization (PSO) tools were used considering various economic and technical constraints [
12]. One study [
4] used an improved version of the same tools for the optimal allocation and sizing of RES and EV charging stations, considering voltage fluctuations and EV charging costs among other factors. GA-PSO optimization tools were used as well [
7] to determine Charging Station (CS) locations and capacities when considering distributed RES, EV users’ satisfaction degree and distribution network technical constraints.
The study by Gong et al. [
7] proposed an uncertainty model using Set Pair Analysis (SPA) for predicting RES outputs. Considering EVs as mobile energy storage units, the study evaluated a smart charging strategy for reducing RES fluctuations. The study by Liu et al. [
13] used an Adaptive Particle Swarm Optimization (APSO) algorithm for placing and sizing CSs, considering geographic information, construction and operation costs. Moreover, another study [
14] developed a Mixed-Integer Non-Linear Programming (MINLP) model for the optimal locating and sizing of FCS, considering urban roads, electrical substation locations, development cost and electrical grid loss. The study by Haddadian et al. [
15] proposed a Mixed-Integer Linear Programming (MILP) optimization tool to examine a large-scale integration of wind energy and EVs. The study concluded that aggregated storage facilities assist in reducing grid operation costs and power system peak demands. The simulation results of the Lyapunov optimization technique using different wind power generation profiles in the study by Jin et al. [
16] showed that EV charging scheduling can reduce both charging cost and charging request delays. In a study by Liu et al. [
17], an optimization model was built to determine both peak-valley timing and price, to develop a controlled EV charging strategy considering local PV and WT outputs.
On the other hand, very few studies related to the investigation and modeling of off-grid charging stations have been performed [
18]. The study by Karmaker et al. [
19] used HOMER Pro software [
20] to conduct a techno-economic and environmental feasibility study to offer a low cost charging station based on hybrid renewables, compared against a conventional coal-fired energy-based charging station. In the study by Mehrjerdi [
18], they used an MILP model for finding the optimal rated powers of a solar system and a diesel generator with minimum investment cost for grid-independent RES-based EV and hydrogen vehicle charging stations.
As per reviewed literature, the modeling, simulation and optimization of off-grid charging stations is a crucial topic, which requires additional study to explore intensely. This study’s specific objectives can be summarized as follows:
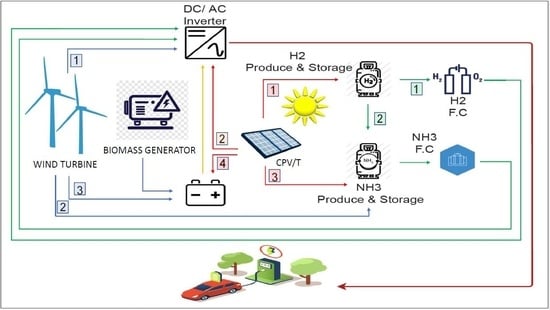
Propose an off-grid, hybrid renewable energy-based FCS powered by solar, wind and biofuel energy.
Select a suitable solar system and wind turbine based on space limitations and site-specific meteorological conditions.
Employ the optimal capacities of electrochemical and chemical energy storage options along with associated Fuel Cells (FC) for sustaining stable operation during night times and based on various environmental conditions.
Develop hourly modeling and simulation programming tools for selecting the optimum capacities of RES and energy storage, and to determine the overall operation strategy to fast-charge a minimum of 50 EVs per day.
Case study application of the developed optimization tool in Qatar to examine its reliability.
3. Methodology
A detailed technical assessment has already been conducted by the authors in a previous study, where the energetic efficiencies of the subsystems and overall system for the proposed design were determined [
30]. The study quantified the efficiency of each subsystem’s component, where the series of energy conversions in each loop within the proposed hybrid design were considered. The Engineering Equation Solver (EES) software [
31] was used for thermodynamic analysis of the proposed system, based on which the efficiencies of the subsystems were simulated and calculated. The resulting electrical efficiencies of the main components and the overall system illustrated in
Table 1 appear to be promising compared to the results of similar studies in the literature.
The methodology followed for developing the optimization tool in Excel for this study is shown in
Figure 4, where each step is subsequently elaborated.
The following steps are considered for an optimization route:
- 1.
Identifying objective function and constraints: The first step is to identify the optimization objective function of the study and the associated constraints for which the formulas and algorithms must be developed as elaborated below:
- 2.
Total daily load demand calculation: The daily load consists of the following types of loads:
EV charging load represents the minimum daily load required to charge 50 EVs with 35 kWh. This load is calculated as per Equation (9) below:
H2 production load represents the additional power required for producing and storing the H2 necessary to produce electricity from the H2 FC during a RES supply shortage. Based on the optimal amount of energy dedicated by the optimization program for H2 production and storage from the total daily surplus energy, the daily electricity produced from the H2 FC can be determined.
NH3 production load represents the additional power required for producing and storing the NH3 necessary to produce electricity from the NH3 FC during a RES supply shortage. Based on the optimal energy amount dedicated by the optimization program from the total daily surplus energy for NH3 production and storage, the daily electricity produced from the NH3 FC can be determined.
The developed optimization program should ensure that the total daily produced energy by the system is sufficient to fulfill the total daily demand, which is expressed by Equation (10) below:
- 3.
Main RES capacity selection: Based on the site-specific conditions, the optimal solar and wind plants are selected, following the steps below:
PV systems: The PVSyst software [
32] is used to select and simulate the maximum possible electricity production per day with different available solar systems and associated battery storage capacities, considering the meteorological conditions of Qatar and typical CS space limitations. As per the PVSyst results, two types of solar systems—namely, PV type and CPV/T type—are recommended for the initial design, along with a 408 kWh Li-ion battery. The optimal PV type and BSS capacity for the overall integrated design shall be investigated eventually in this study.
Wind plant: Based on yearly wind speed profile in Qatar and considering typical charging station aesthetics and space limitations, a 250 kW WT system is selected from the market [
33], where the technical specifications of the selected turbine are in accordance with the wind speed range in Qatar.
The technical characteristics of the initially selected WT, PV, CPV/T and BSS are given in
Table 2 below.
- 4.
Daily RES power production and EV demand modeling:
PV and CPV/T power production modeling: Based on the hourly generated electricity data for a year extracted from PVsyst for the two selected solar PV types, the daily power curves for both PV systems are modeled using the Excel program. Since this fundamental part of the program will guide all the subsequent steps, the modeling results generated from PVSyst for the PV and CPV/T systems for randomly selected days are compared with the ones generated from the developed Excel program for the same respective days. Both programs generated identical graphs, which validate the input modeling accuracy generated with the Excel program. The average daily energy produced by the PV and CPV/T systems is 1415 and 1520 kWh, respectively.
WT power production modeling: Wind data obtained from the Supreme Committee for Delivery & Legacy in Qatar [
34] and Qatar Civil Aviation Authority [
35] are used as inputs for Equation (11), derived from the wind power Equation (12), indicated below, to calculate the hourly power generated by the selected WT.
where P
1 = rated wind turbine power, V
1 = rated wind speed and P
2 = calculated power in V
2 wind speed.
where
= air density in kg/m
3, A = rotor swept area (m
2), Cp = coefficient of performance, V = wind velocity (m/s), Ng = generator efficiency and Nb = gear box bearing efficiency.
The daily power curve for a WT is modeled using Equation (11) in an Excel program, where the average daily energy produced by a 250 kW WT in Qatar in a year is found to be 1450 kWh.
The yearly profiles for the PV, CPV/T and WT systems based on the monthly average data for each are reflected in
Figure 5 below.
EVs’ daily load demand modeling: The total daily load demand of 1750 kWh for charging 50 EVs must be modeled with a realistic curve. Due to the non-availability of EVs and CSs in Qatar, the daily local EV demand profile cannot be obtained. Moreover, it would not be appropriate to represent the data of combustion engine vehicles visiting gas stations in Qatar to model EV charging trips to CSs. Therefore, the probability density function of EV charging demand is extrapolated from a realistic daily demand profile for EVs arriving at CSs in study [
36]. Based on this, a stochastic modeling curve representing a realistic daily demand profile for 50 EVs arriving at CSs is determined.
Figure 6 illustrates the stochastic model used in this study to represent the daily EV demand.
In low voltage networks, a minute-by-minute representation of load and generation would be more appropriate than hourly representation to consider sudden changes in the analysis. However, the main focus of this study is to assess the sizing of each RES and energy storage method incorporated in an off-grid charging station and the optimal management of the energy produced and consumed to fulfill the daily EV fast charging demand. Therefore, an hourly estimation of the average EVs arriving a charging station is considered similar to many other studies in the literature [
36]. In the absence of minute-by-minute EV demand data, it would be difficult to model and simulate the load demand, based on which the entire study is carried out.
Similarly, the solar irradiation and wind speed data available in the literature and specialized software were obtained on an hourly basis. It would be difficult to model and simulate the output from RES in the absence of such data obtained on a minute-by-minute basis, which is a fundamental part of the entire study.
- 5.
Developing a daily operation simulation module: Prior to developing a programing code to simulate the energy produced and consumed hourly by the proposed design for a day, a flowchart prioritizing the sequence of the associated processes is developed, where the following operation priorities are considered:
Since the solar system generates DC power, it is used directly during day times for producing H2.
To better utilize the relatively large power generated from solar and wind sources during day times, first priority is given for producing chemicals (H2 and NH3), followed by EV charging and, finally, battery charging.
Since biomass is a more reliable and available RES with easier storage, a biofuel power generator is incorporated in the design as a stand-by resource to back up the overall system during unfavorable weather conditions.
To avoid large biofuel power generator capacities, the generator is operated for 24 h during supply shortage days and it is only used to charge the BSS instead of for direct EV charging.
The modeling and simulation of energy storage charging is based on the following priority criteria:
Energy from solar system: During the daytime, priority for the energy generated by the solar system is given to producing and storing H2 to directly utilize the generated DC voltage from the PV panels, followed by producing and storing NH3 and, finally, battery storage.
Energy from wind turbine: Priority for the energy generated by wind turbine is given to producing and storing NH3, followed by battery storage.
Energy from biofuel power generator: The energy generated from the backup bio-generator is used for battery storage.
On the other hand, the modeling and simulation of energy storage discharging is based on the principle of using energy storage systems whenever the produced energy from the RES is not sufficient to fulfil EV charging demand, where energy discharging priority is given to the H
2 FC, followed by the NH
3 FC and finally the batteries. Based on the above-stated operation criteria, the operation priority flowchart illustrated in
Figure 7 is developed.
Based on the hourly power supply and demand data along with the predefined operation priorities, formulas and algorithms are developed in Excel software, considering the previously stated objective function and constraints, to calculate and simulate the hourly power production and consumption of the proposed design for a day.
- 6.
Developing an annual operation simulation module: Annual simulation is the aggregation of daily simulation calculations, which, in turn, depends on two factors: the status of the storage systems at the end of the previous day and the varying amount of energy generated from the RES based on the daily metrological conditions. Accordingly, a flowchart representing a step-by-step programing process is developed and illustrated in
Figure 8.
Using Visual Basic programming code, formulas and algorithms are developed to repeat the daily simulation of the produced and consumed energy, considering the above-highlighted two factors for a complete year.
The developed comprehensive simulation model is used to assess the optimal energy storage capacities, PV system type and size, biofuel power generator rating and charging station operation strategy to achieve the desired objectives of this study.
Figure 9 illustrates the seven steps followed to achieve those objectives, where each step’s objective and achieved results are discussed in the following section.
4. Results and Discussions
The program is designed with an interactive dashboard interface, where multiple decision variables can be adjusted to simulate and evaluate different scenarios for optimal decision-making. The decision variables include RES ratings, energy storage, EV battery charging and stochastic EV demand. Based on the steps indicated in
Figure 9, appropriate variables are adjusted with respect to each step, and the results achieved through modeling and simulation are discussed in this section.
Step one—optimal BSS size selection with initial PV and WT: Since the 408 kWh battery capacity suggested by PVSyst is based on integrating only a PV system and prior to incorporating the WT in the design, it is essential to determine the optimal battery size for the system after incorporating the selected WT. The optimal battery size ensures that there is not an undersized battery capacity causing supply shortages despite the availability of storable and non-dispatchable surplus energy from RES. Additionally, it ensures that no additional capacity is installed and left without usage, to avoid unnecessary investment costs and the associated negative environmental impact.
Setting the battery storage capacity to zero initially, the program is simulated to calculate, for each day, the total surplus energy during periods where the produced energy is more than the demand and the total energy shortage during periods where the produced energy is less than the demand. For the days where the surplus energy is found equal to or more than the demand shortage, the energy shortage value is recorded as the optimal battery capacity for those days. For the days where the surplus energy is found less than the demand shortage, the surplus energy value is recorded as the optimal battery capacity for those days. The maximum recorded optimal battery value in a year is found 670 kWh, which is selected as the optimal battery capacity for the whole year. To validate the selected value as the optimal battery size, multiple battery capacities are simulated using the developed program. For each simulated capacity, the number of EVs not able to charge annually is recorded. Starting with no battery storage, the number of EVs that are not able to be charged annually is found to be 4,155 EVs, which represents 22.8% of the annually targeted number of EVs. Multiple simulation with increasing battery capacity gradually verified that 670 kWh is the optimal battery capacity, where the number of EVs that are not able to be charged annually is reduced dramatically to 231 EVs, which represents 1.27% of the annually targeted number of EVs. An additional 10% battery capacity increase from this value reduces the number of EVs that are not able to be charged annually by two EVs only.
Figure 10 illustrates the one-year simulation for the selected RES and BSS so far and the associated results.
Step two—optimal PV system selection: Since two types of PV systems—namely, PV panels and CPV/T—are initially suggested by PVSyst, the developed program is used to investigate which one is the optimal choice after incorporating the wind turbine and the selected BSS size. Replacing the PV system with CPV/T reduces the number of EVs not able to be charged annually from 231 to 186, which represents 1.02% of the annually targeted number of EVs. Moreover, the annual surplus energy from the system is increased considerably from 268,178 to 391,054 kWh. This surplus energy is useful for decreasing the BSS capacity and producing the intended chemicals for energy storage purposes to assist in reducing or eliminating the supply shortage. Another advantage of incorporating the CPV/T subsystem in the design is the utilization of generated thermal energy as an input for an absorption cooling system. This could be used for BSS cooling to maintain its lifetime and reduce operational costs by preventing early BSS replacements. The results of this simulation step are shown in
Figure 11.
Figure 11.
CPV/T, WT and selected BSS size annual simulation results.
Figure 11.
CPV/T, WT and selected BSS size annual simulation results.
Step three—BSS size adjustment based on selected PV system: To better utilize the surplus energy produced by incorporating the CPV/T subsystem, a 10% increase from the previously determined BSS capacity is simulated. Since the percentage of EVs that are not charged annually reduces to about 1%, a following 10% size increase is simulated. Following the same criteria, multiple battery capacities are simulated by increasing the size by 10%. In each iteration, if the percentage of EVs that not able to charge is reduced to more than 1%, the next 10% size increase is simulated. Accordingly, an 811 kWh battery capacity is determined as the optimal size, where the annual number of EVs that are not able to be charged is reduced to 182 EVs, which represents 1% of the annually targeted number of EVs. Since the next 10% battery size increase reduces this number by less than 1%, no further battery size increase is considered beyond 811 kWh.
Figure 12 demonstrates the simulation of the annual system operation and its results with the selected RES and BSS size so far.
Figure 12.
CPV/T, WT and amended BSS size annual simulation results.
Figure 12.
CPV/T, WT and amended BSS size annual simulation results.
Step four—optimal bio-generator size selection: As indicated in
Figure 12, there is no sufficient power supply available to fast charge 50 EVs daily during October with the current RES and BSS mix. A biofuel-driven generator is suggested as the third RES to be hybridized in the proposed design to eliminate this shortage. As per the simulation results of
Figure 12, the maximum number of EVs that are not able to be charged in a day of October is six EVs. Since each EV needs 35 kWh of charging power, six EVs represent a total 210 kWh daily power shortage during October. With a 15% safety margin, a supplementary biofuel power generator capable of producing 250 kWh in a day is required in the system. Since the biomass generator shall operate for 24 h during power shortage days, the appropriate biomass generator rating required for the system is found to be about 10 kW.
Figure 13 demonstrates the one-year system simulation and its results with the selected RES and BSS size so far, indicating zero EVs not able to be charged annually and 392,887 kWh of yearly surplus energy from the system.
Figure 13.
CPV/T, WT, biofuel power generator and BSS annual simulation results.
Figure 13.
CPV/T, WT, biofuel power generator and BSS annual simulation results.
Step five—BSS size adjustment based on selected bio-generator: There could be an opportunity to reduce the selected BSS size via the addition of a biomass generator as a supplementary source. Starting with 811 kWh, multiple battery capacities are simulated through decreasing the size by 5% in each iteration. A 595 kWh battery capacity is determined as the optimal size since it still allows all EVs to be charged. Nevertheless, any further decrease from this value creates a supply shortage. The annual simulation of the system with the obtained results is reflected in
Figure 14.
Figure 14.
CPV/T, WT, biofuel power generator and adjusted BSS annual simulation.
Figure 14.
CPV/T, WT, biofuel power generator and adjusted BSS annual simulation.
Step six—optimal surplus energy amount selection for the chemical storage system (CSS): To sustain the continuous operation of the overall system during dark times and under various environmental circumstances, where RES supply is lessened or interrupted due to RES’ intermittent and volatile nature, integrating chemical energy storage options complementing the BSS is studied. To secure the necessary power for producing the energy carrier chemicals, the optimal daily surplus energy that can be extracted from the system without compromising the minimum number of EVs able to be charged daily is investigated.
Figure 15 depicts the monthly surplus energy generated from the integrated RES and BSS. Based on this, the daily optimal surplus energy shall be assessed and dedicated for a daily chemical production process.
Figure 15.
Available surplus energy from RES and BSS.
Figure 15.
Available surplus energy from RES and BSS.
The optimal daily surplus energy is the fixed amount of surplus energy that can be extracted throughout the year with the minimum days of disruption and attaining the maximum amount of energy annually. Accordingly, the program is configured to simulate and calculate the total annual surplus energy that can be harvested at different energy levels selected from the monthly surplus energy spectrum. At each selected energy level, which represents the daily consumption capacity of the chemical production, the number of days where the surplus energy equals or exceeds the selected energy level is multiplied by the selected energy value to calculate the total annual surplus energy that can be extracted for the chemical production process. On the other hand, during the days where the surplus energy is less than the chemical production capacity, the surplus energy is kept ideal and the chemical production process is switched off during those days due to inadequate power availability.
Starting with the selection of the maximum monthly surplus energy, which occurs during April as illustrated in the first row of
Table 3, the CSS, with the same consumption capacity, can be operated only during this month, while the CSS will be switched off due to the unavailability of the required energy for the rest of the year. The sum of the daily utilized surplus energy chemical production process is calculated and reflected in the last column of
Table 3.
Following the same principle, the total annual extracted surplus energies for the rest of the selected energy levels are calculated and shown in
Table 3. About 868 kWh of energy capacity is found to be the optimal daily surplus energy, where the annual extracted surplus energy for CSS production totals 2109 MWh, which is the maximum value compared to the other selected energy levels as illustrated in
Table 3.
Figure 16 shows that during the first nine months of the year, the CSS with an 868 kWh capacity can be operated daily due to availability of sufficient surplus energy to run the system. However, during the last three months of the year, it cannot be operated daily due to unavailability of sufficient surplus energy caused by RES curtailment during these months.
Accordingly, appropriate chemical production and storage systems with approximately 868 kWh consumption capacities should be investigated and integrated within the design. In the study [
31], a H
2 and NH
3 CSS consuming an 880 kWh load was designed to generate 200 kWh of electricity daily. The mass and storage tank volumes of H
2, NH
3, N
2, O
2 and H
2O for generating electricity with H
2 and NH
3 fuel cells as well as the total electricity requirements for producing the respective masses of H
2 and NH
3 from H
2 and NH
3 FCs were determined using the EES software. Since the power required by the system proposed in our previous work [
31] is equivalent to the available surplus power in this study, the same chemical system was incorporated and simulated in this design. As per the results demonstrated in
Figure 17, the new load demand (EV daily charging demand and H
2 and NH
3 daily production demand) can be fulfilled with no deficit.
Figure 18 shows a comparison between the monthly surplus energy generated from the integrated system before and after incorporating the CSS, where the energy utilized for chemical production has decreased the ideal annual generated surplus energy from 392,857 to 210,336 kWh.
The H
2 and NH
3 produced from renewables in the system are used as an energy storage medium for timely conversion into electricity based on stochastic EV demand. Accordingly, fuel cells are incorporated in the design to convert the chemical energy embedded in the produced and stored H
2 and NH
3 to electrical energy through an electrochemical reaction. This is very useful for addressing demand shortages resulting from RES’ intermittency and volatility. Unlike batteries, fuel cells do not need recharging once consumed and are considered to be more efficient than conventional cycles, where electricity is generated in one step with minimal maintenance due to non-moving parts [
29]. In the proposed design, H
2 and NH
3 are produced, stored and then consumed in fuel cell subsystems for useful electricity production during night times and under unfavorable weather conditions.
Step seven—optimal operation strategy for incorporated CSS: To further enhance the system’s efficiency, the possibility for the partial operation of the integrated H
2 and NH
3 production capacity during the last three months of the year is investigated through multiple simulations, where several operating alternatives are tested. They are indicated in
Table 4.
Table 4.
Overall system monthly simulation with multiple CSS operational scenarios.
Table 4.
Overall system monthly simulation with multiple CSS operational scenarios.
| Simulation | Description | October | November | December |
|---|
| 1 | CSS production capacity | 0% | 0% | 0% |
| EVs not charged | 0 | 0 | 0 |
| 2 | CSS production capacity | 25% | 25% | 25% |
| EVs not charged | 96 | 5 | 0 |
| 3 | CSS production capacity | 0% | 0% | 50% |
| EVs not charged | 0 | 0 | 0 |
| 4 | CSS production capacity | 0% | 0% | 75% |
| EVs not charged | 0 | 0 | 1 |
The results in
Table 4 show that operating the CSS with 25% capacity during the last three months would result in a charging deficit of 96 EVs in October and five EVs in November. Keeping the system off during October and November while operating with 50% capacity during December would not cause any charging deficits. On the other hand, increasing the operating capacity to 75% in last month would cause a charging shortage.
Figure 19 compares the monthly generated surplus energy during normal CSS operation against that during optimized operation, where the ideal generated annual surplus energy from the overall system is reduced from 210,336 to 200,028 kWh. This is due to an additional extracted surplus energy during December for CSS half-capacity production.
The 200 kW generated from January to September and the 100 kW generated during December from the CSS cannot assist in reducing the BSS size further since any reduction will cause supply shortages during October and November when the CSS is kept off. However, the number of BSS charging and discharging cycles is dropped by 38%, from 221 to 136 cycles yearly, contributing in extending the lifetime of the BSS and increasing the overall system’s economic feasibility.
The annual simulation results for the final overall design consisting of an integrated 468 kWp CPV/T, 250 kW WT, 10 kW biomass generator, 595 kWh BSS and 200 kW CSS are illustrated in
Figure 20, where the objective function, constraints and study’s objectives are all fulfilled.
Based on the detailed simulation results for the overall system for a year, the average daily production by RES and consumption by EVs and CSS are reflected in
Table 5, and the amount of energy supplied by each source in the system for EV charging is reflected in
Table 6.
5. Environmental and Economic Perspective Highlights
The focus of the study is on the technical aspects of the proposed stand-alone renewable energy-based fast charging station, where the energy produced and consumed is investigated through modeling and simulation to achieve the optimal energy management of the overall system. However, it is worth highlighting the economic and environmental aspects of the proposed off-grid design through a fundamental comparison with a grid-connected charging station, which is covered below.
Environmental perspective highlights: Integrating RES as alternative options for supplying EV charging stations instead of connecting them to a fossil fuel-based grid would contribute significantly to reducing GHG emissions. This would positively impact the environment and public health in general. Since natural gas is used as fuel for generating electricity in Qatar,
Table 7 compares the carbon emissions generated by drawing the required energy from the grid against those generated by a grid-independent RES-based charging station.
As per the above comparison, the annual CO2 emissions produced from the proposed system are only 3.66 tons, while 115.61 tons of CO2 emissions are produced from a grid-connected charging station where only natural gas is used, annually, to serve the same number of EVs per year.
Economic perspective highlights: To highlight the economic aspects of deploying a renewable energy-based distributed generation system for satisfying fast EV charging station demand rather than connecting to the grid, the range of the Levelized Cost of Electricity (LCOE) for each of the incorporated renewable energy subsystems in the design is acquired from the literature to estimate the LCOE for the overall system. Based on the data downloaded from Open Energy Information Database [
38], a box-and-whisker plot is illustrated in
Figure 21 to help analyze the acquired data.
The first-and-third-quartile LCOE range of the WT is found to be USD 0.06–0.08/kWh, that of CPV is found to be USD 0.15–0.21/kWh, and that of biopower is found to be USD 0.06–0.1/kWh. Based on the amount of energy annually produced by the WT, CPV and bio-generator shown in
Table 7, the estimated LCOE range of the overall system is calculated and found to be USD 0.10–0.14/kWh. Comparing this range with the subsidized tariff in Qatar, which is USD 0.09/kWh [
39], it is found to be 10–55% higher. However, considering imposing a non-subsidized tariff and imposing carbon taxes on grid-dependent CS owners will make the proposed project feasible from an economic perspective.


