Evolution of Production and Transport Characteristics of Steeply-Dipping Ultra-Thick Coalbed Methane Reservoirs

 ,
,  ,
,
Abstract
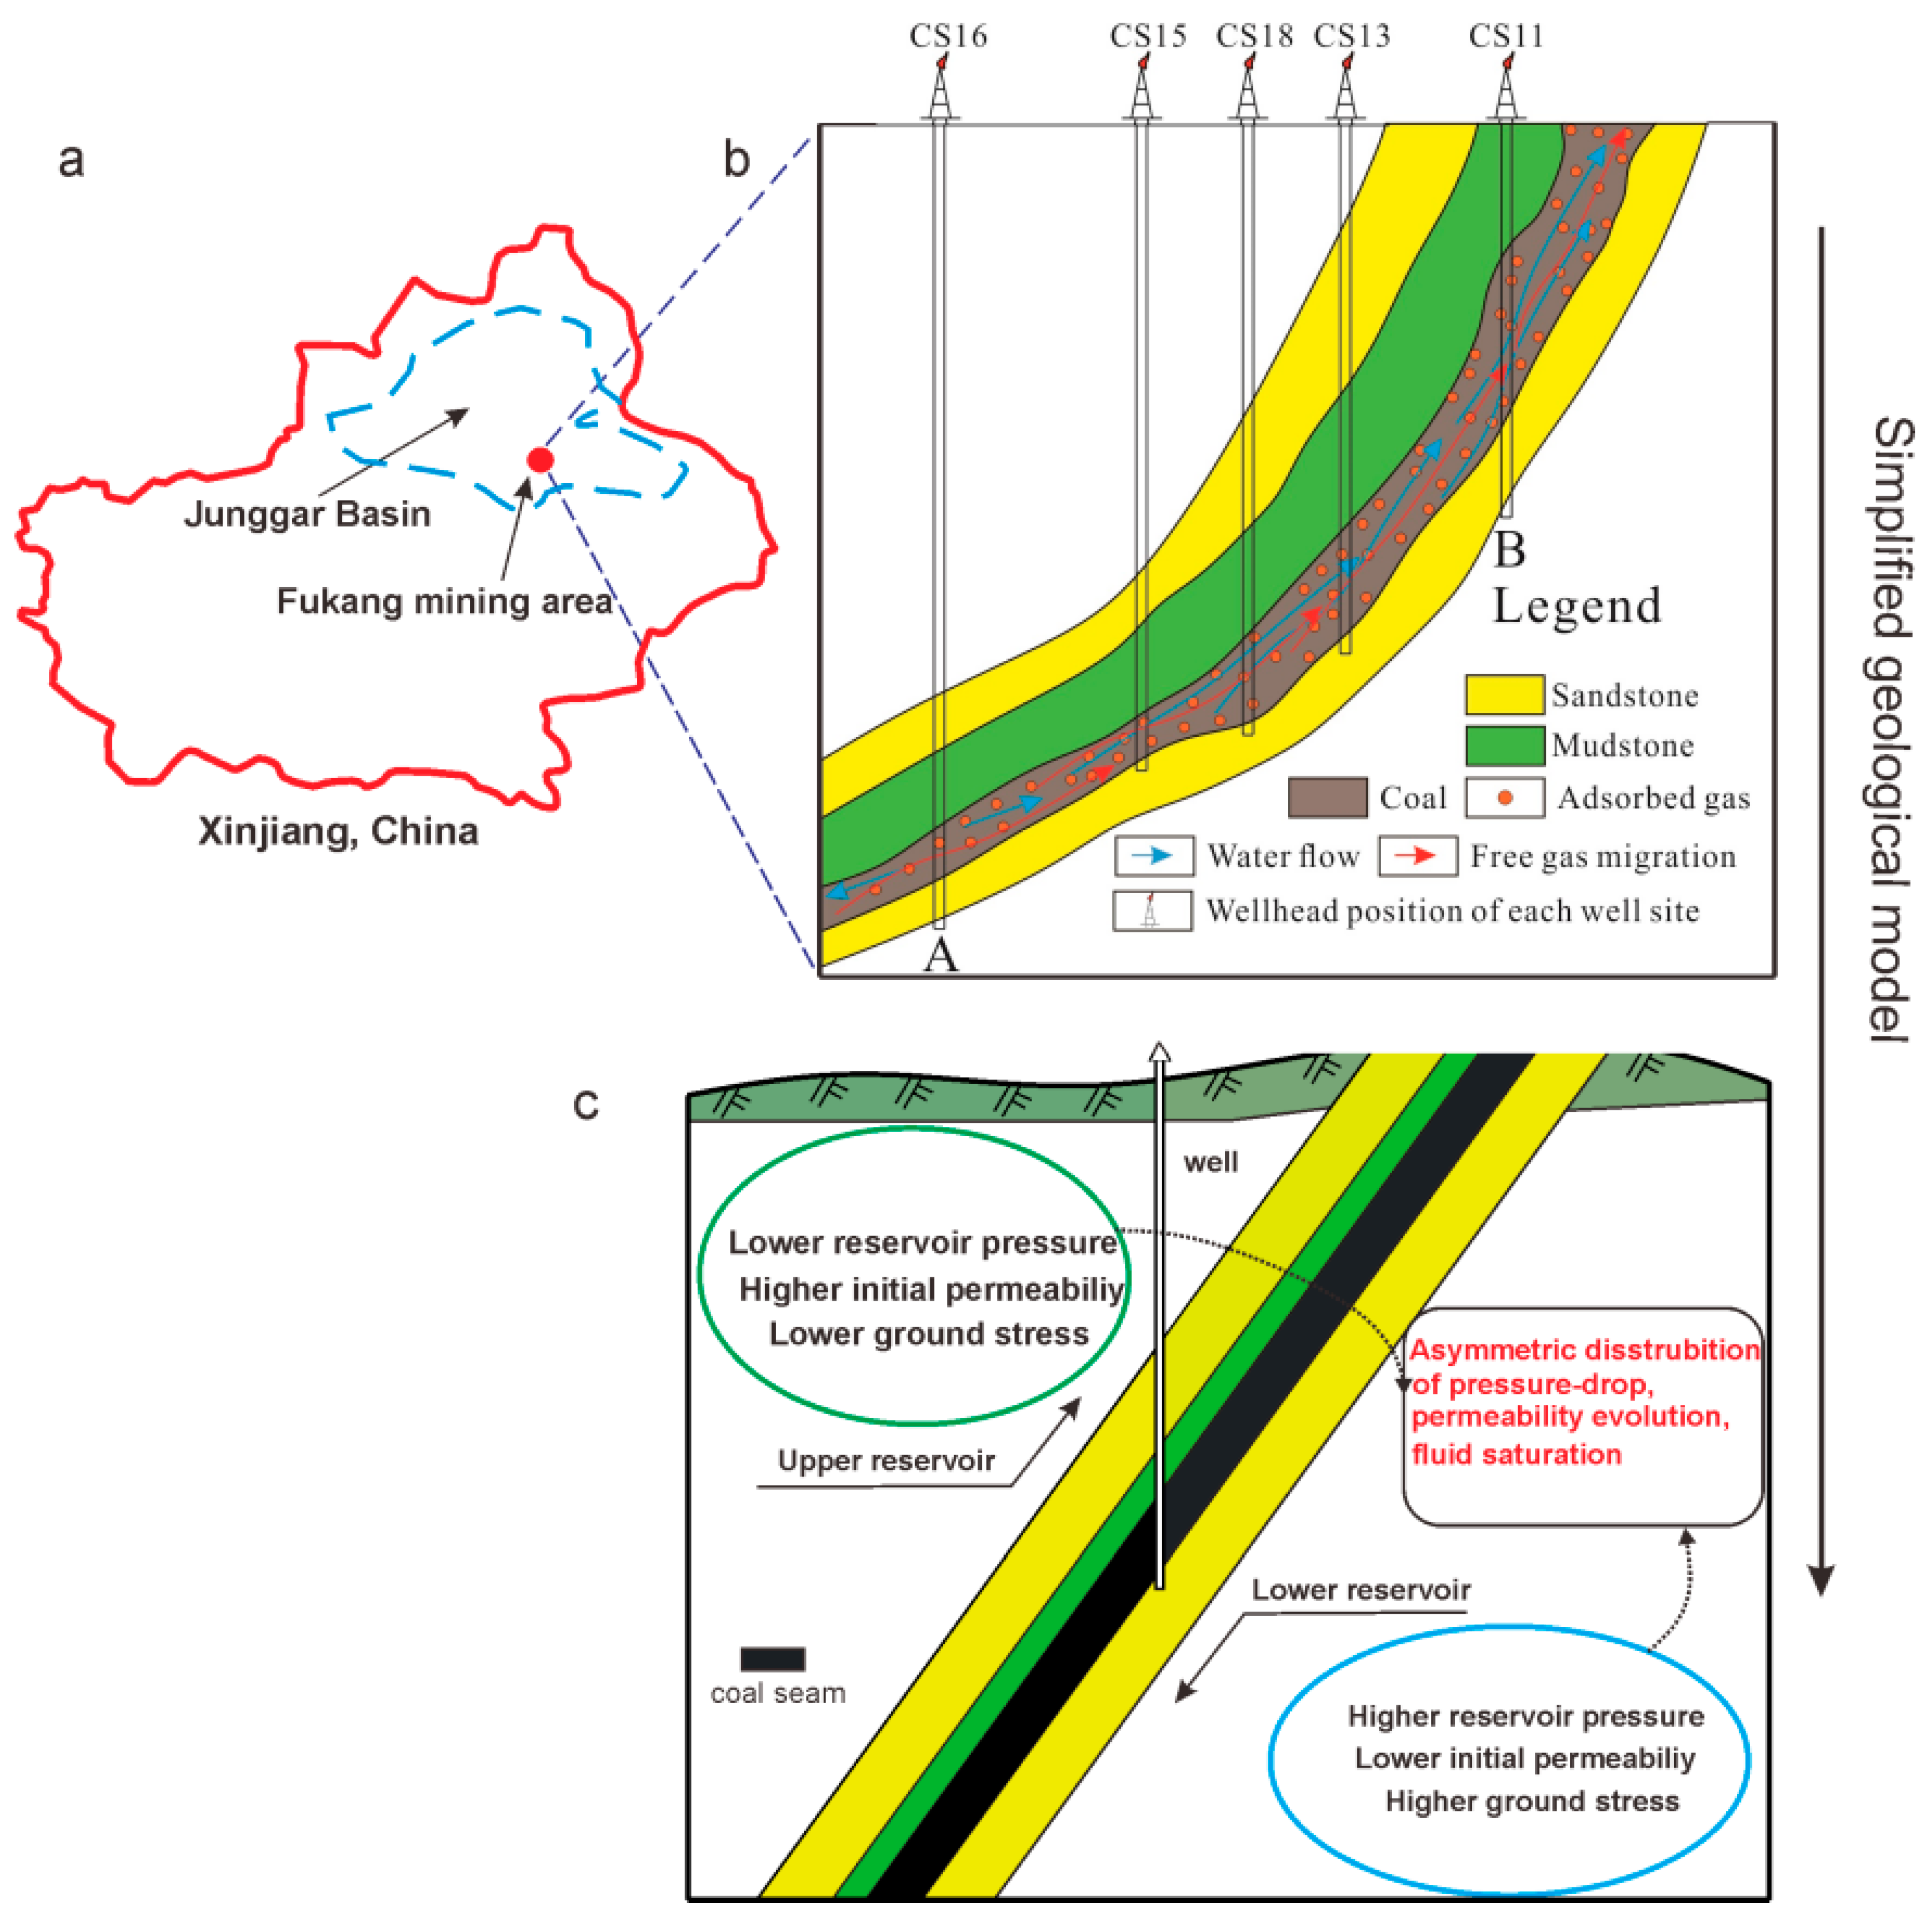
:1. Introduction
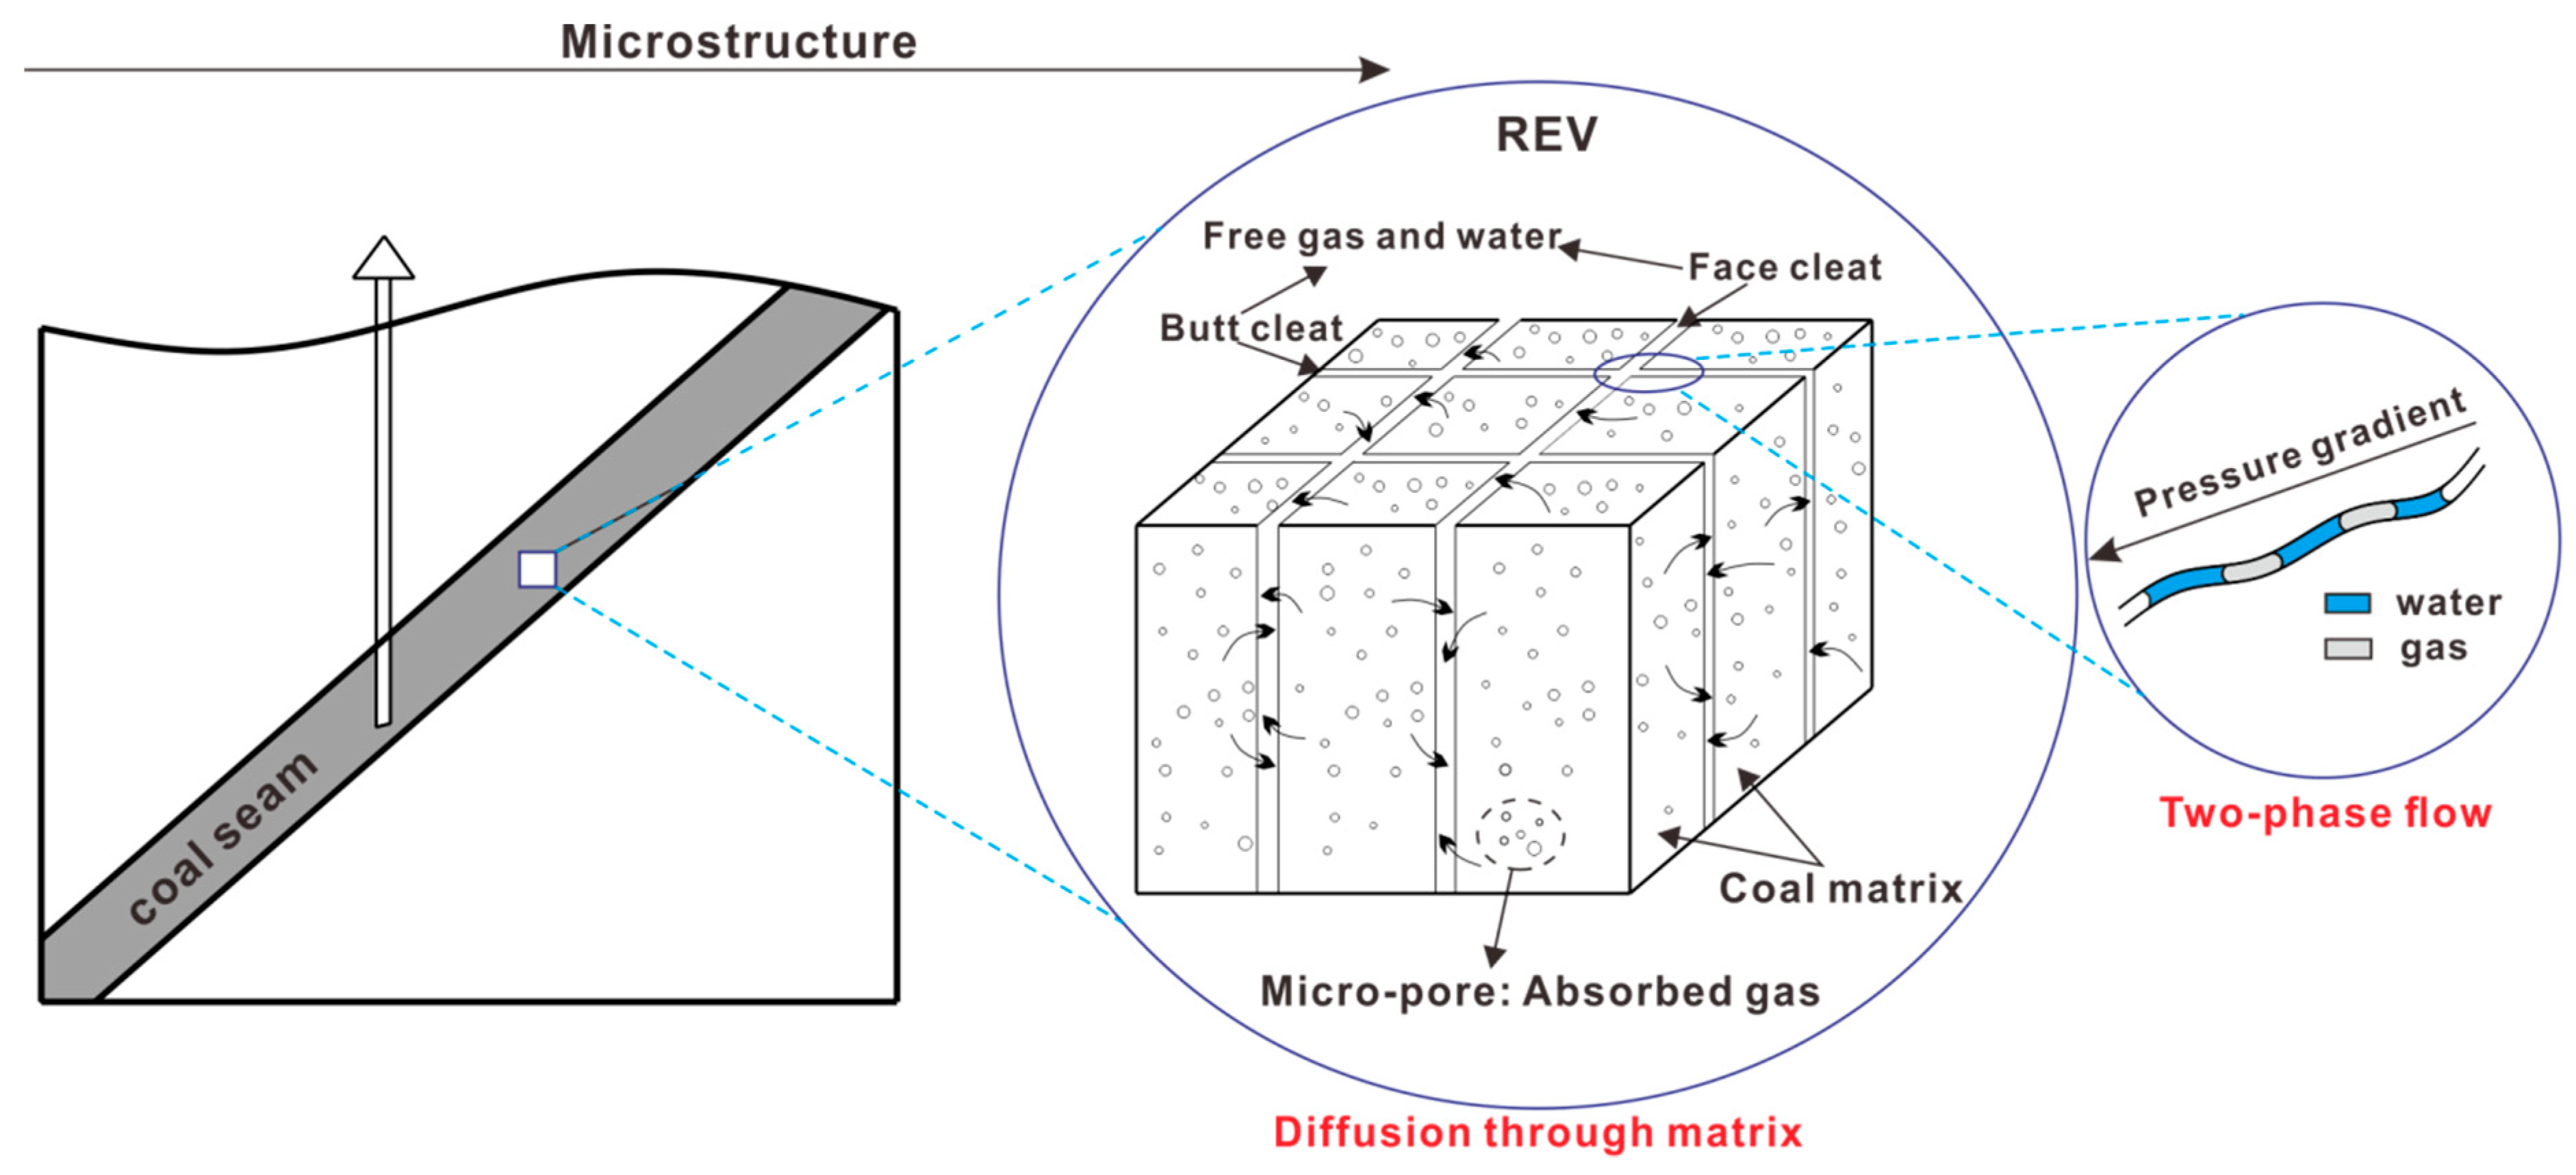
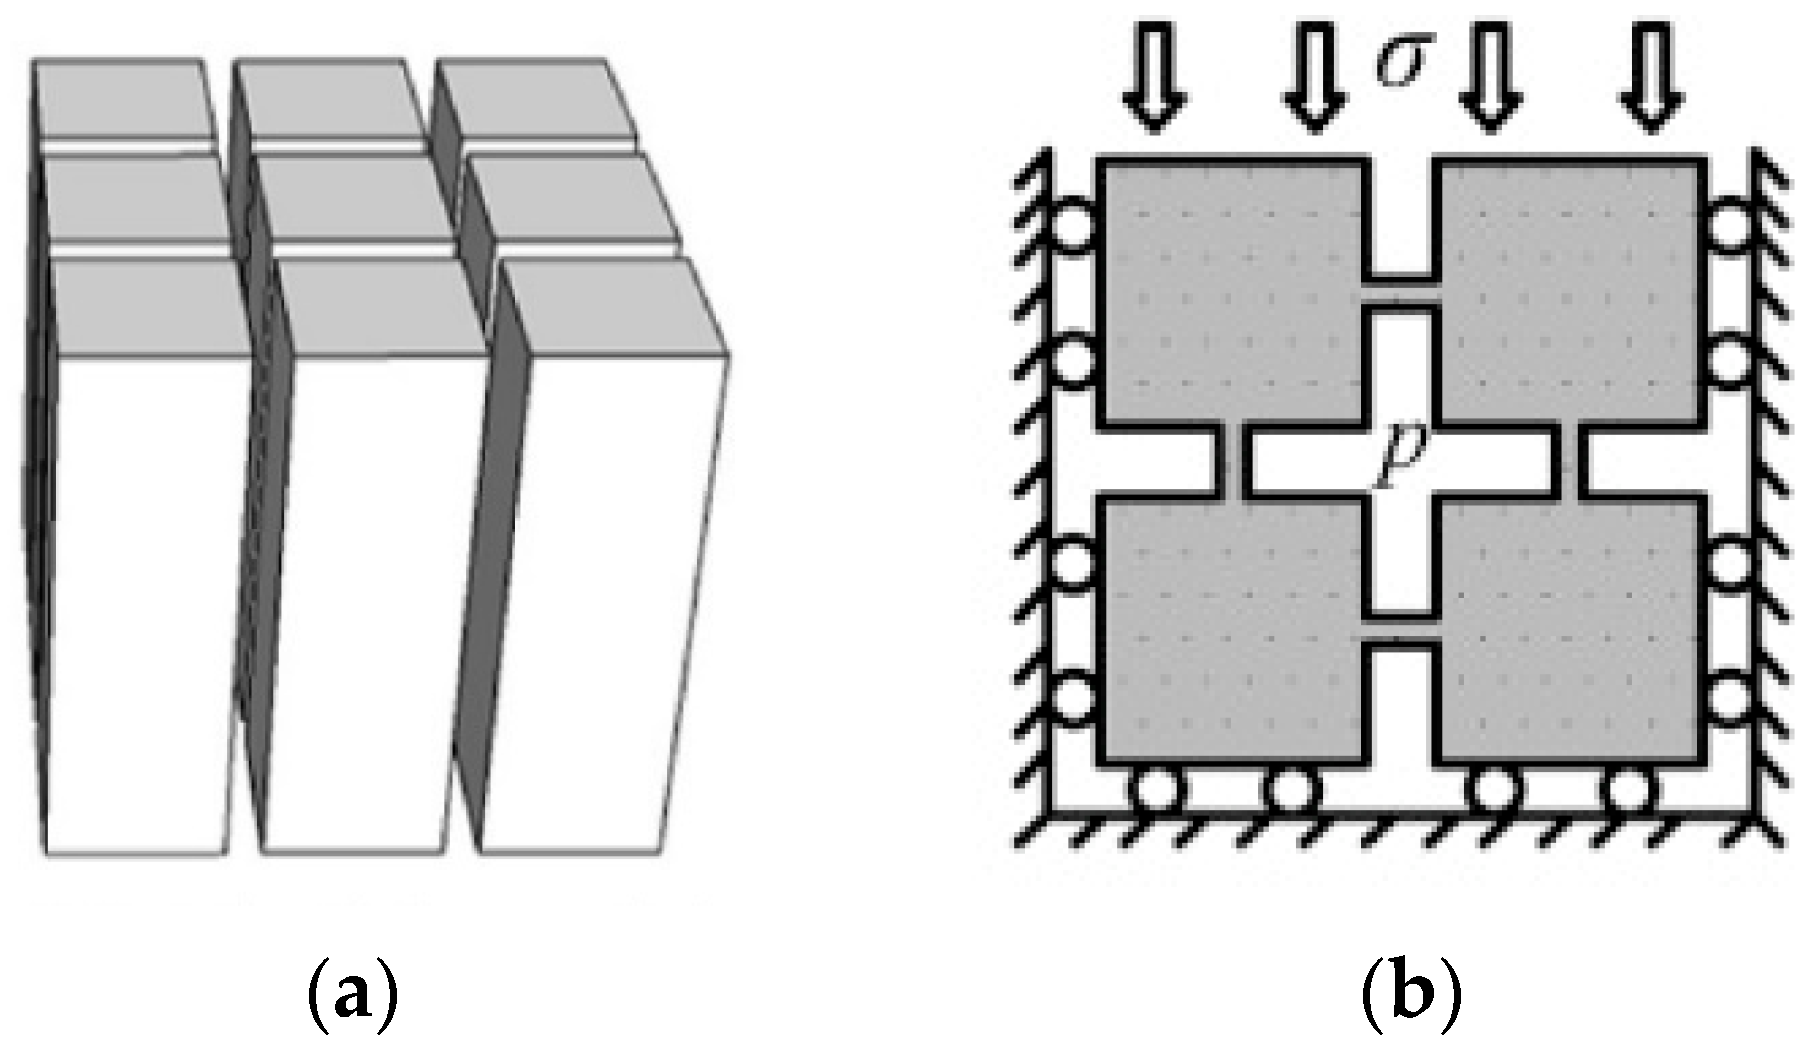
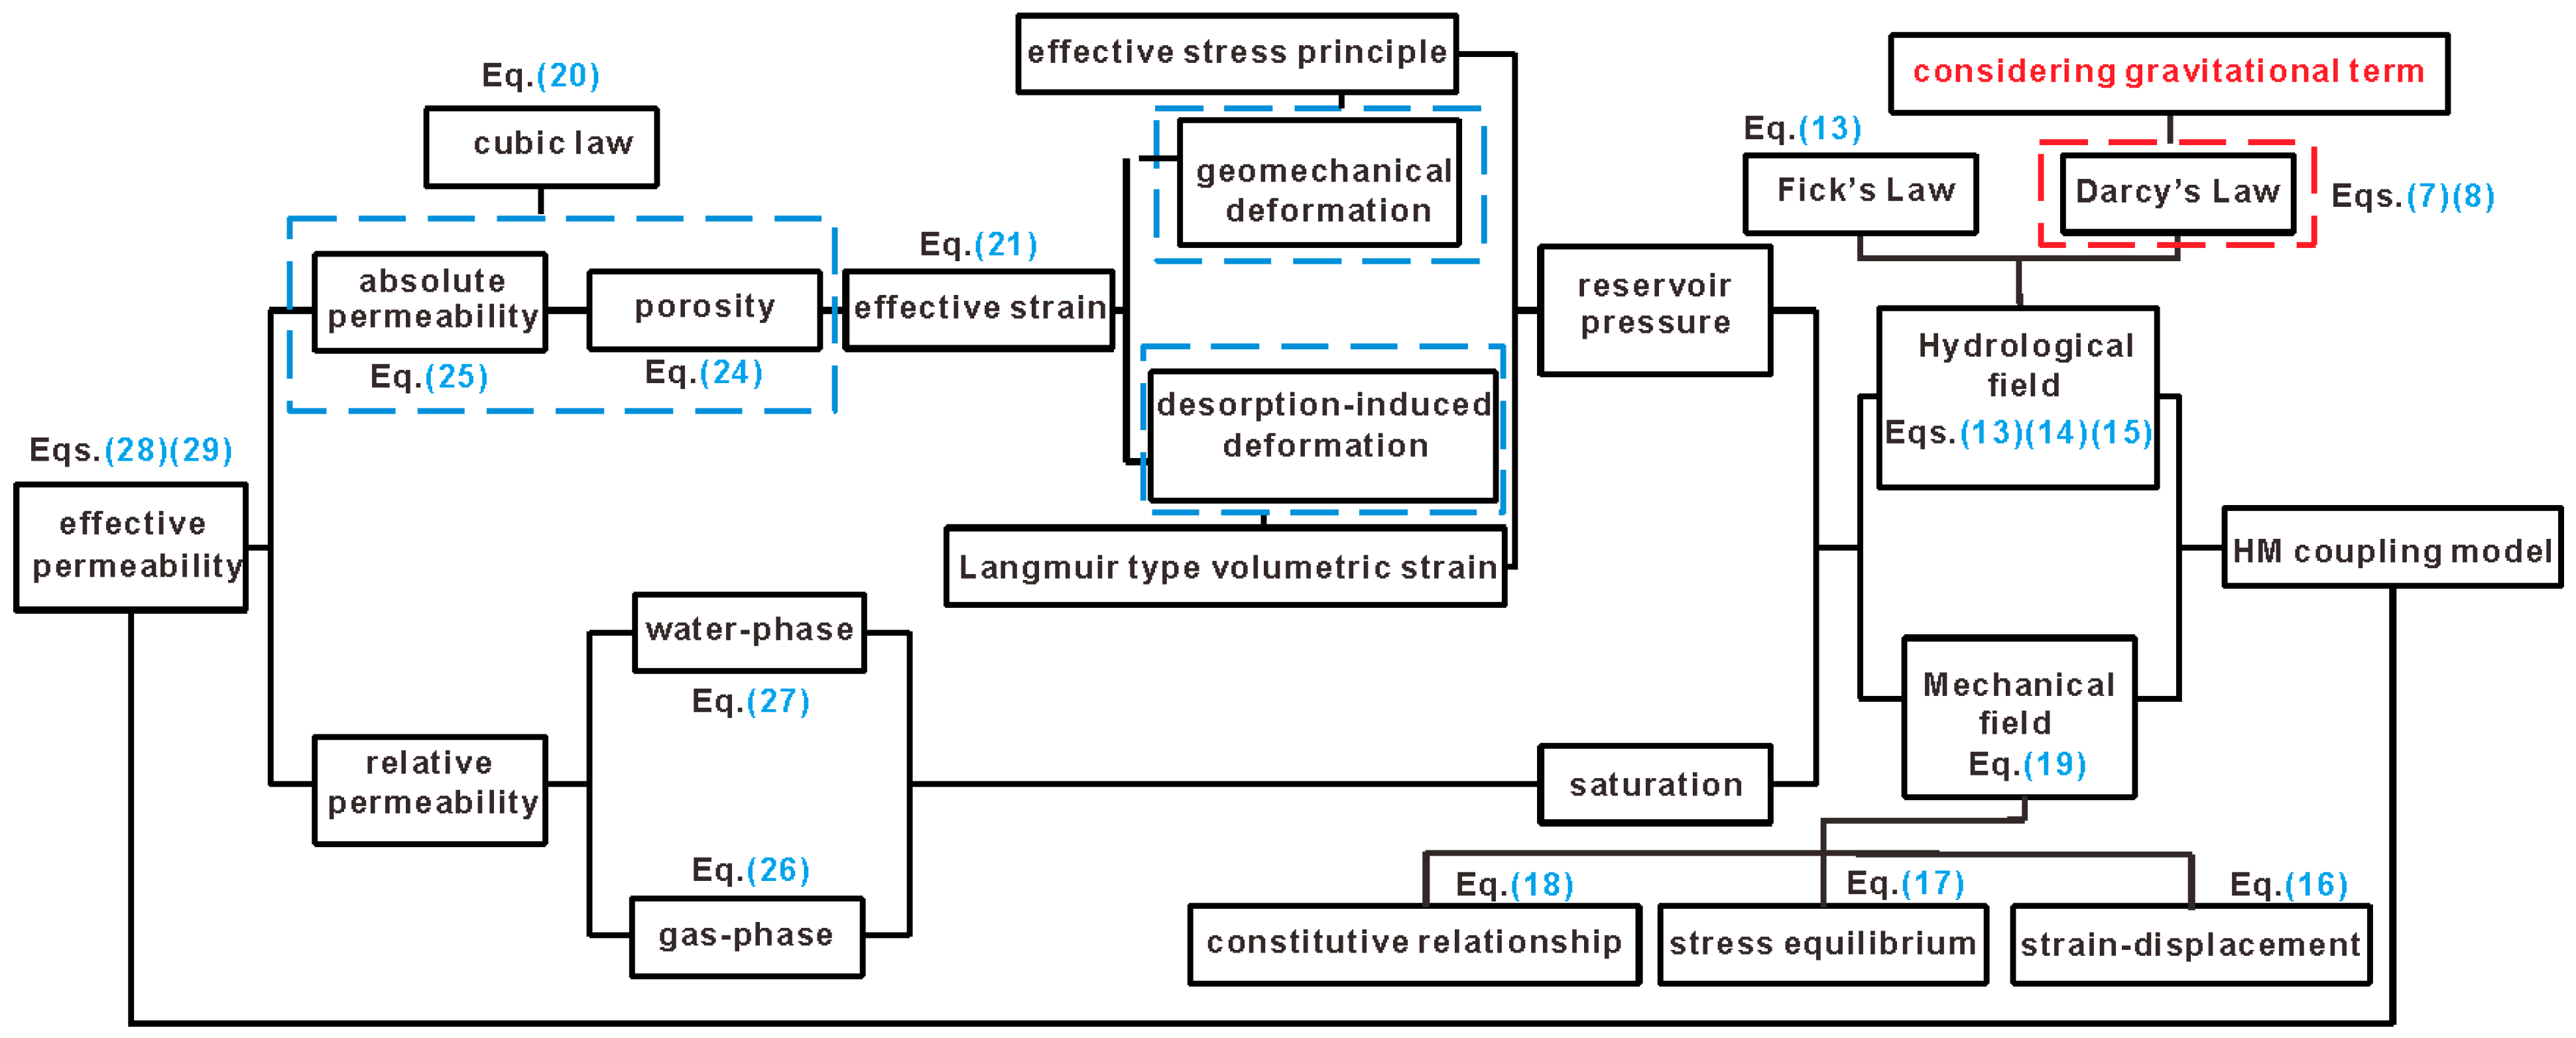
2. Mathematical Model
3. Model Implementation and Analysis Results
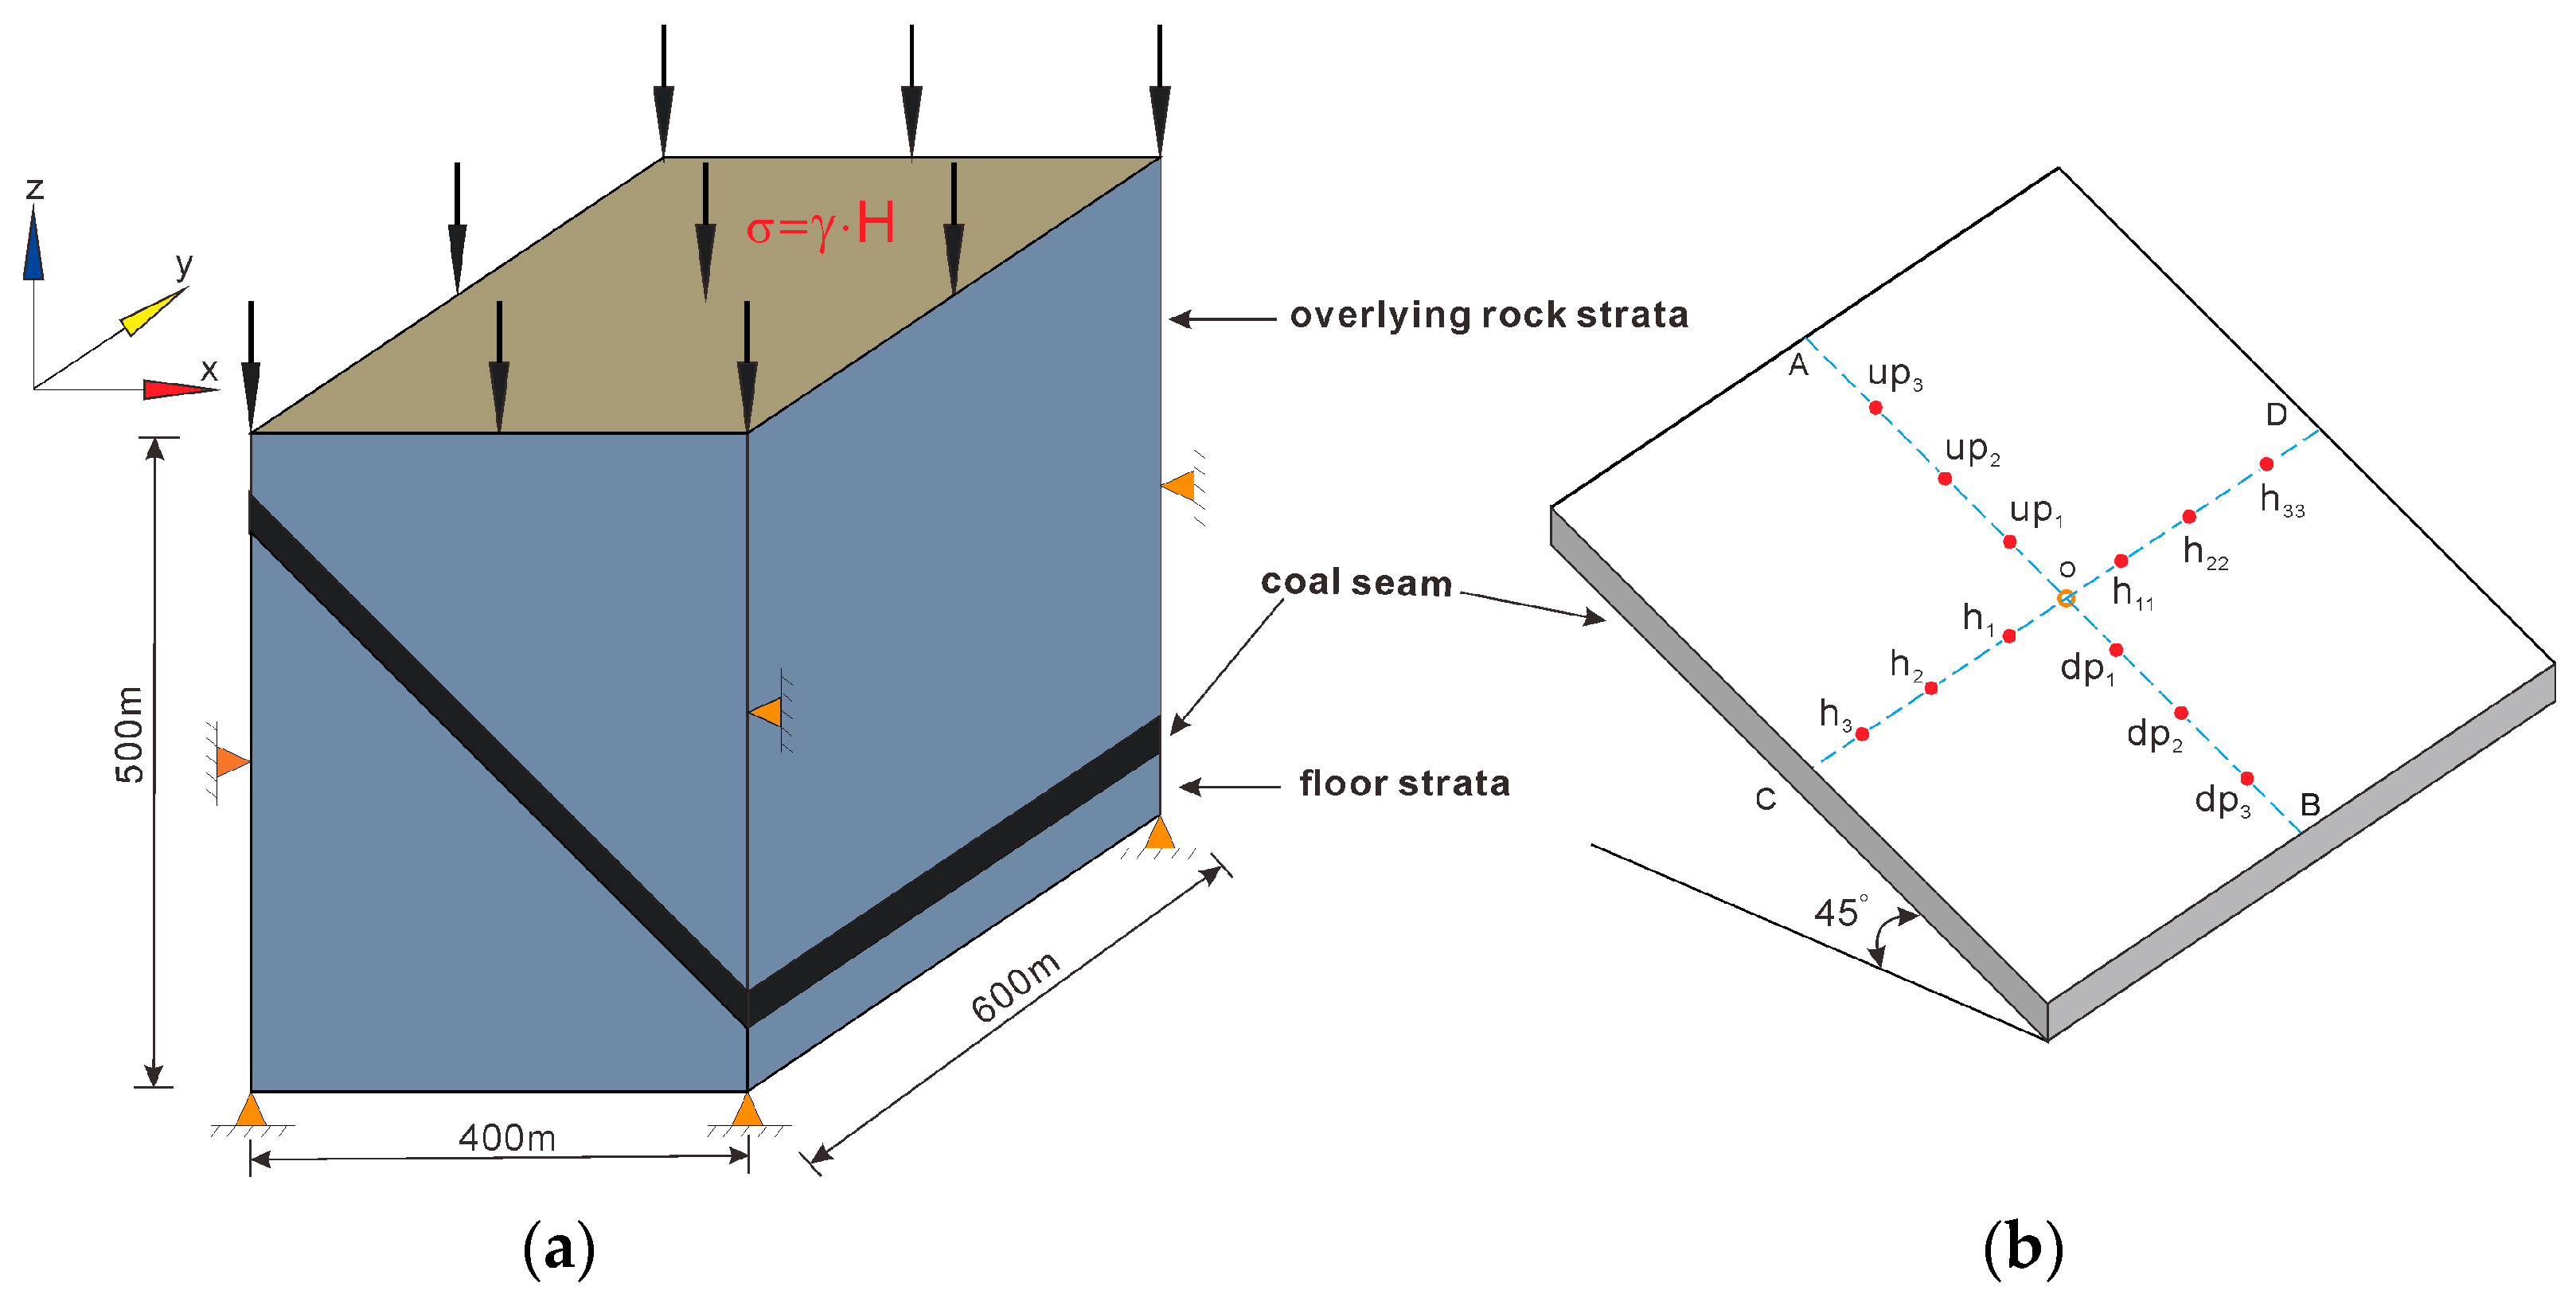
3.1. Model Implementation
Model Implementation
3.2. Results and Analysis
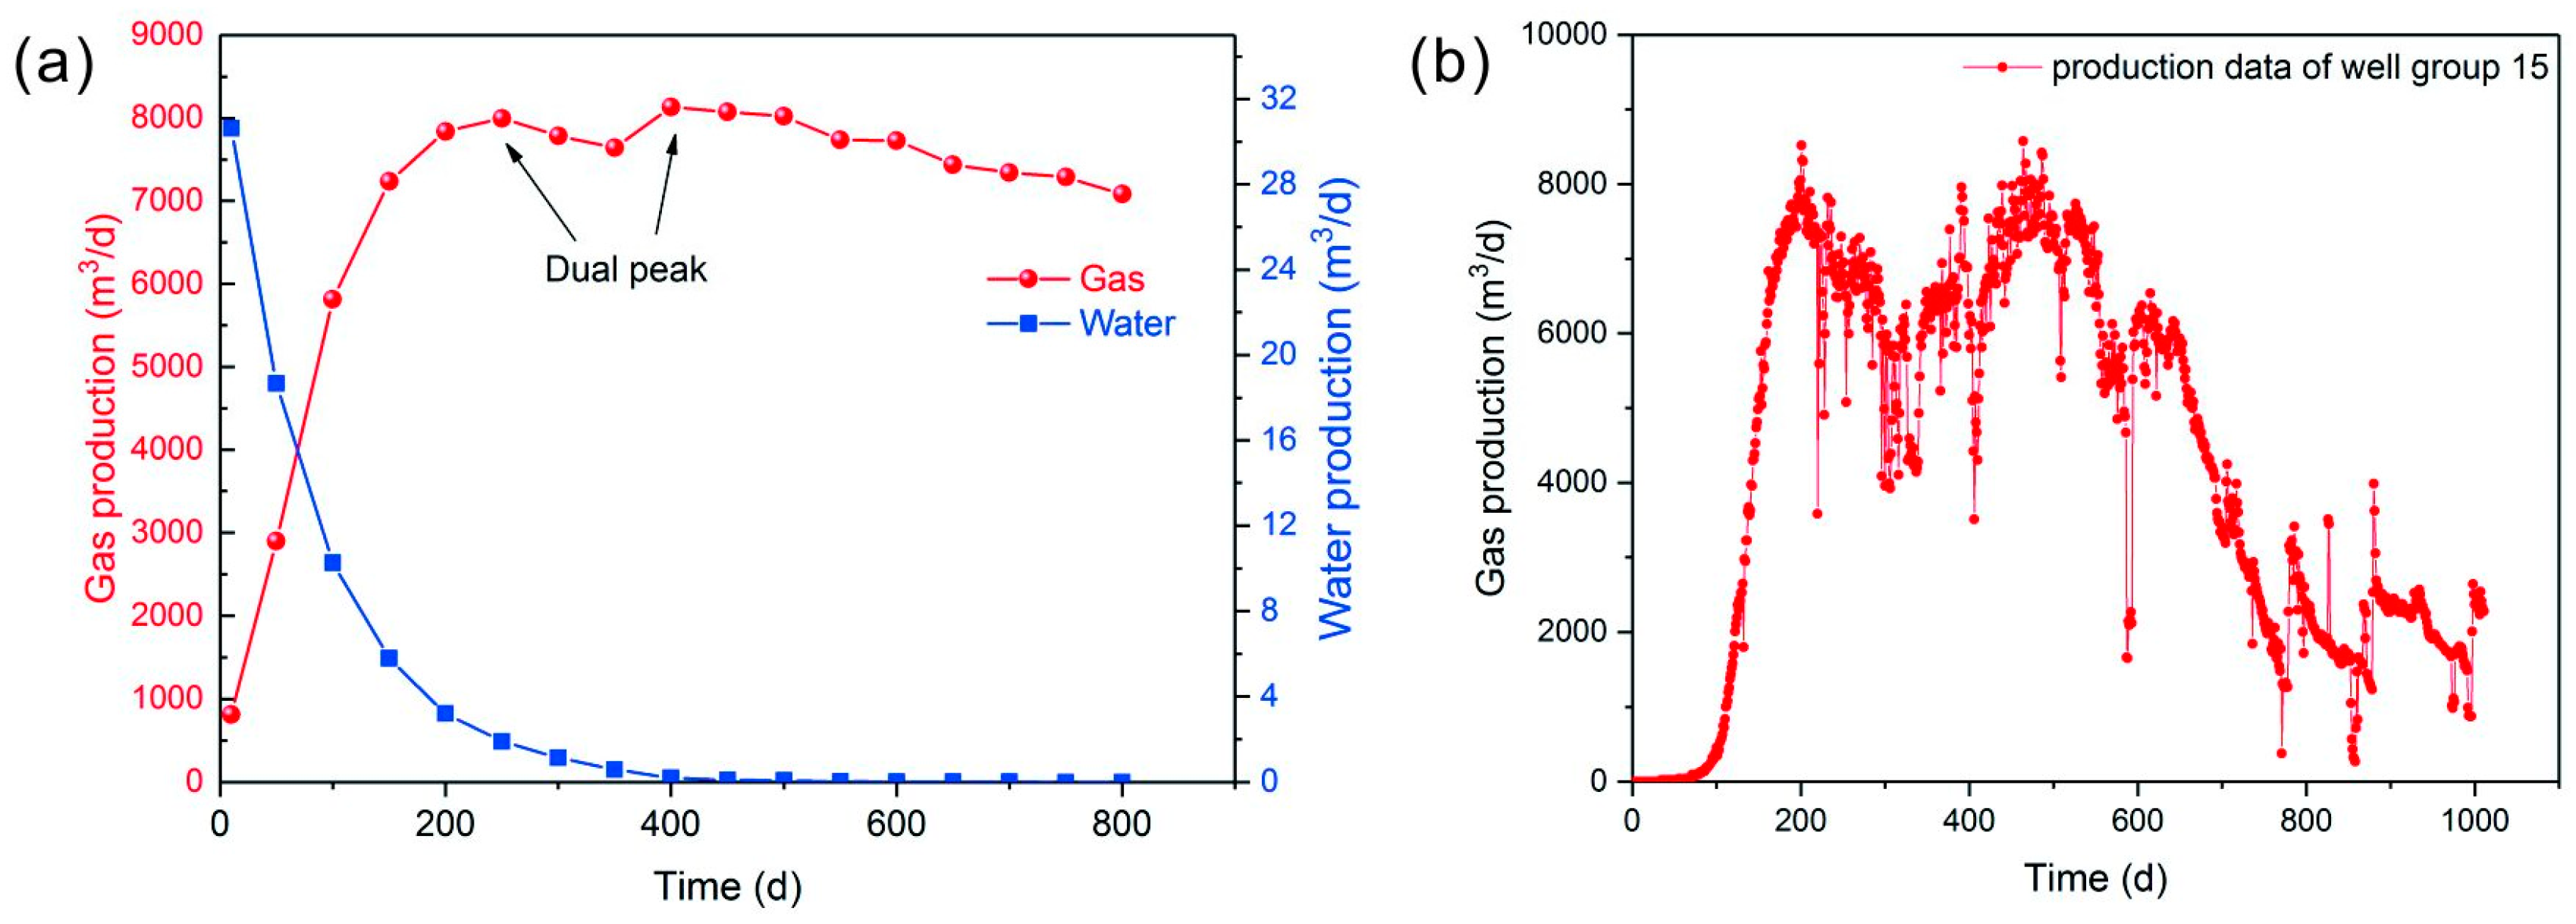
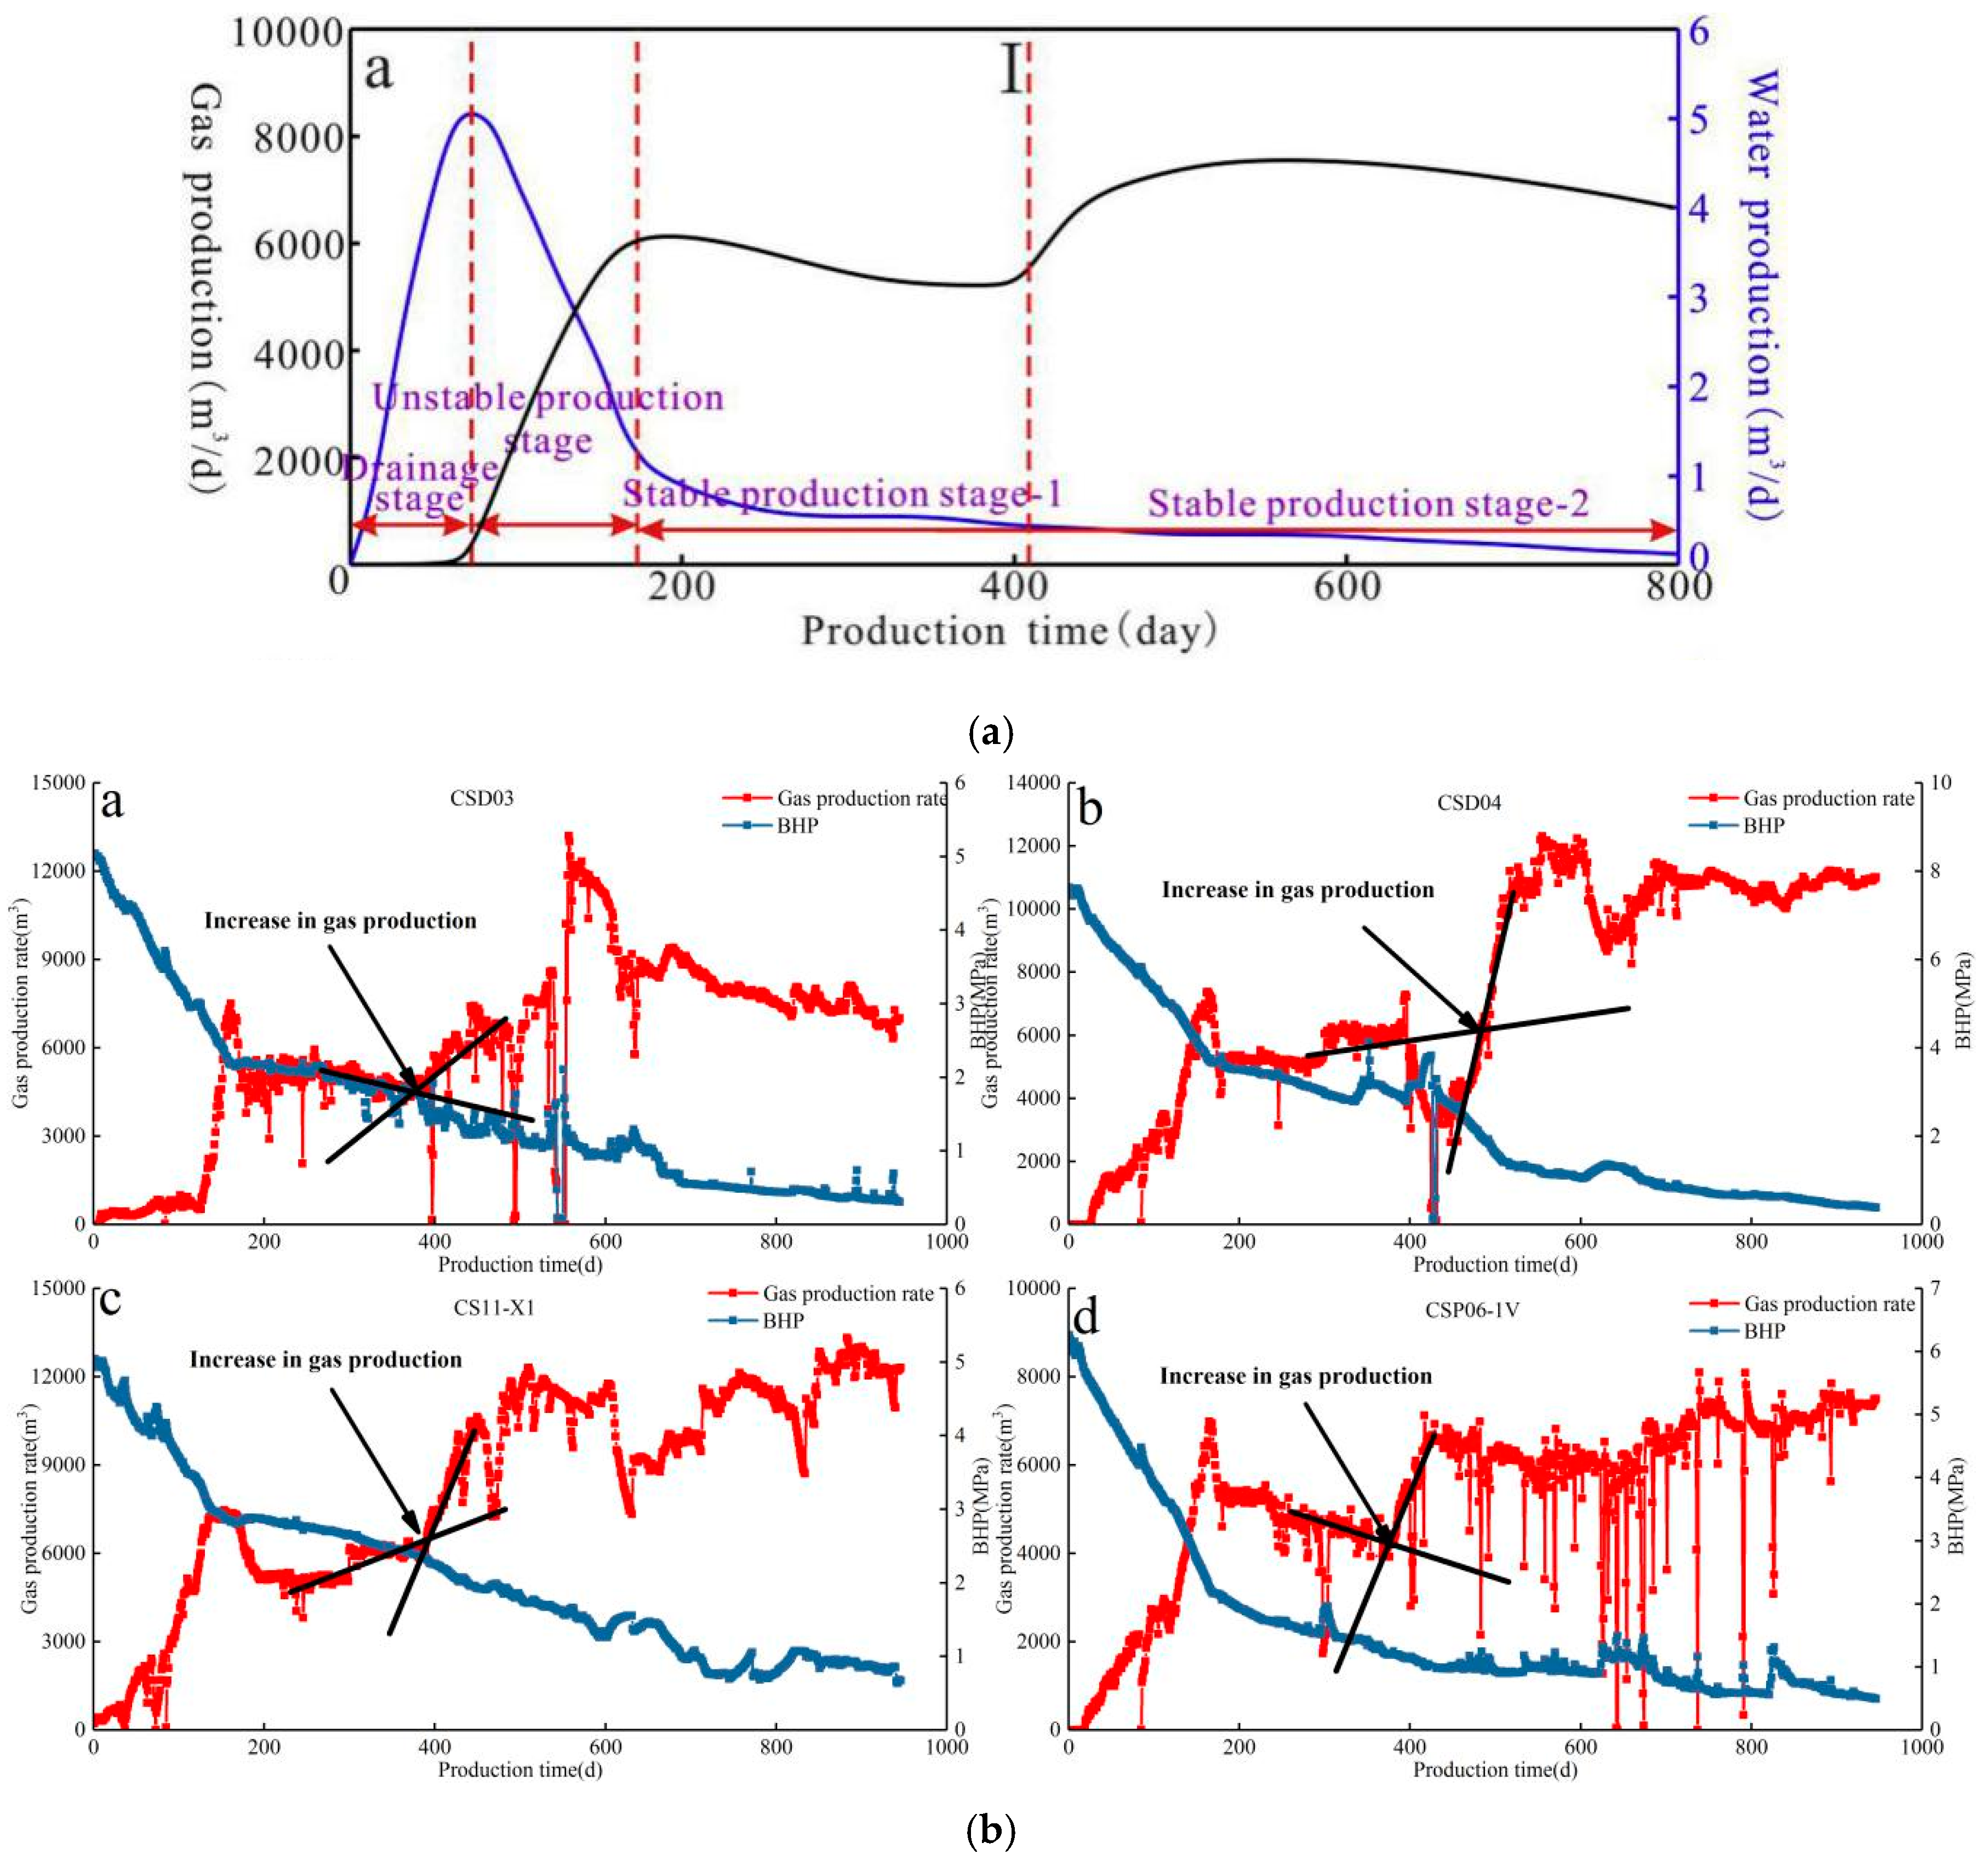
3.2.1. Production Profile Characteristics and Model Validation
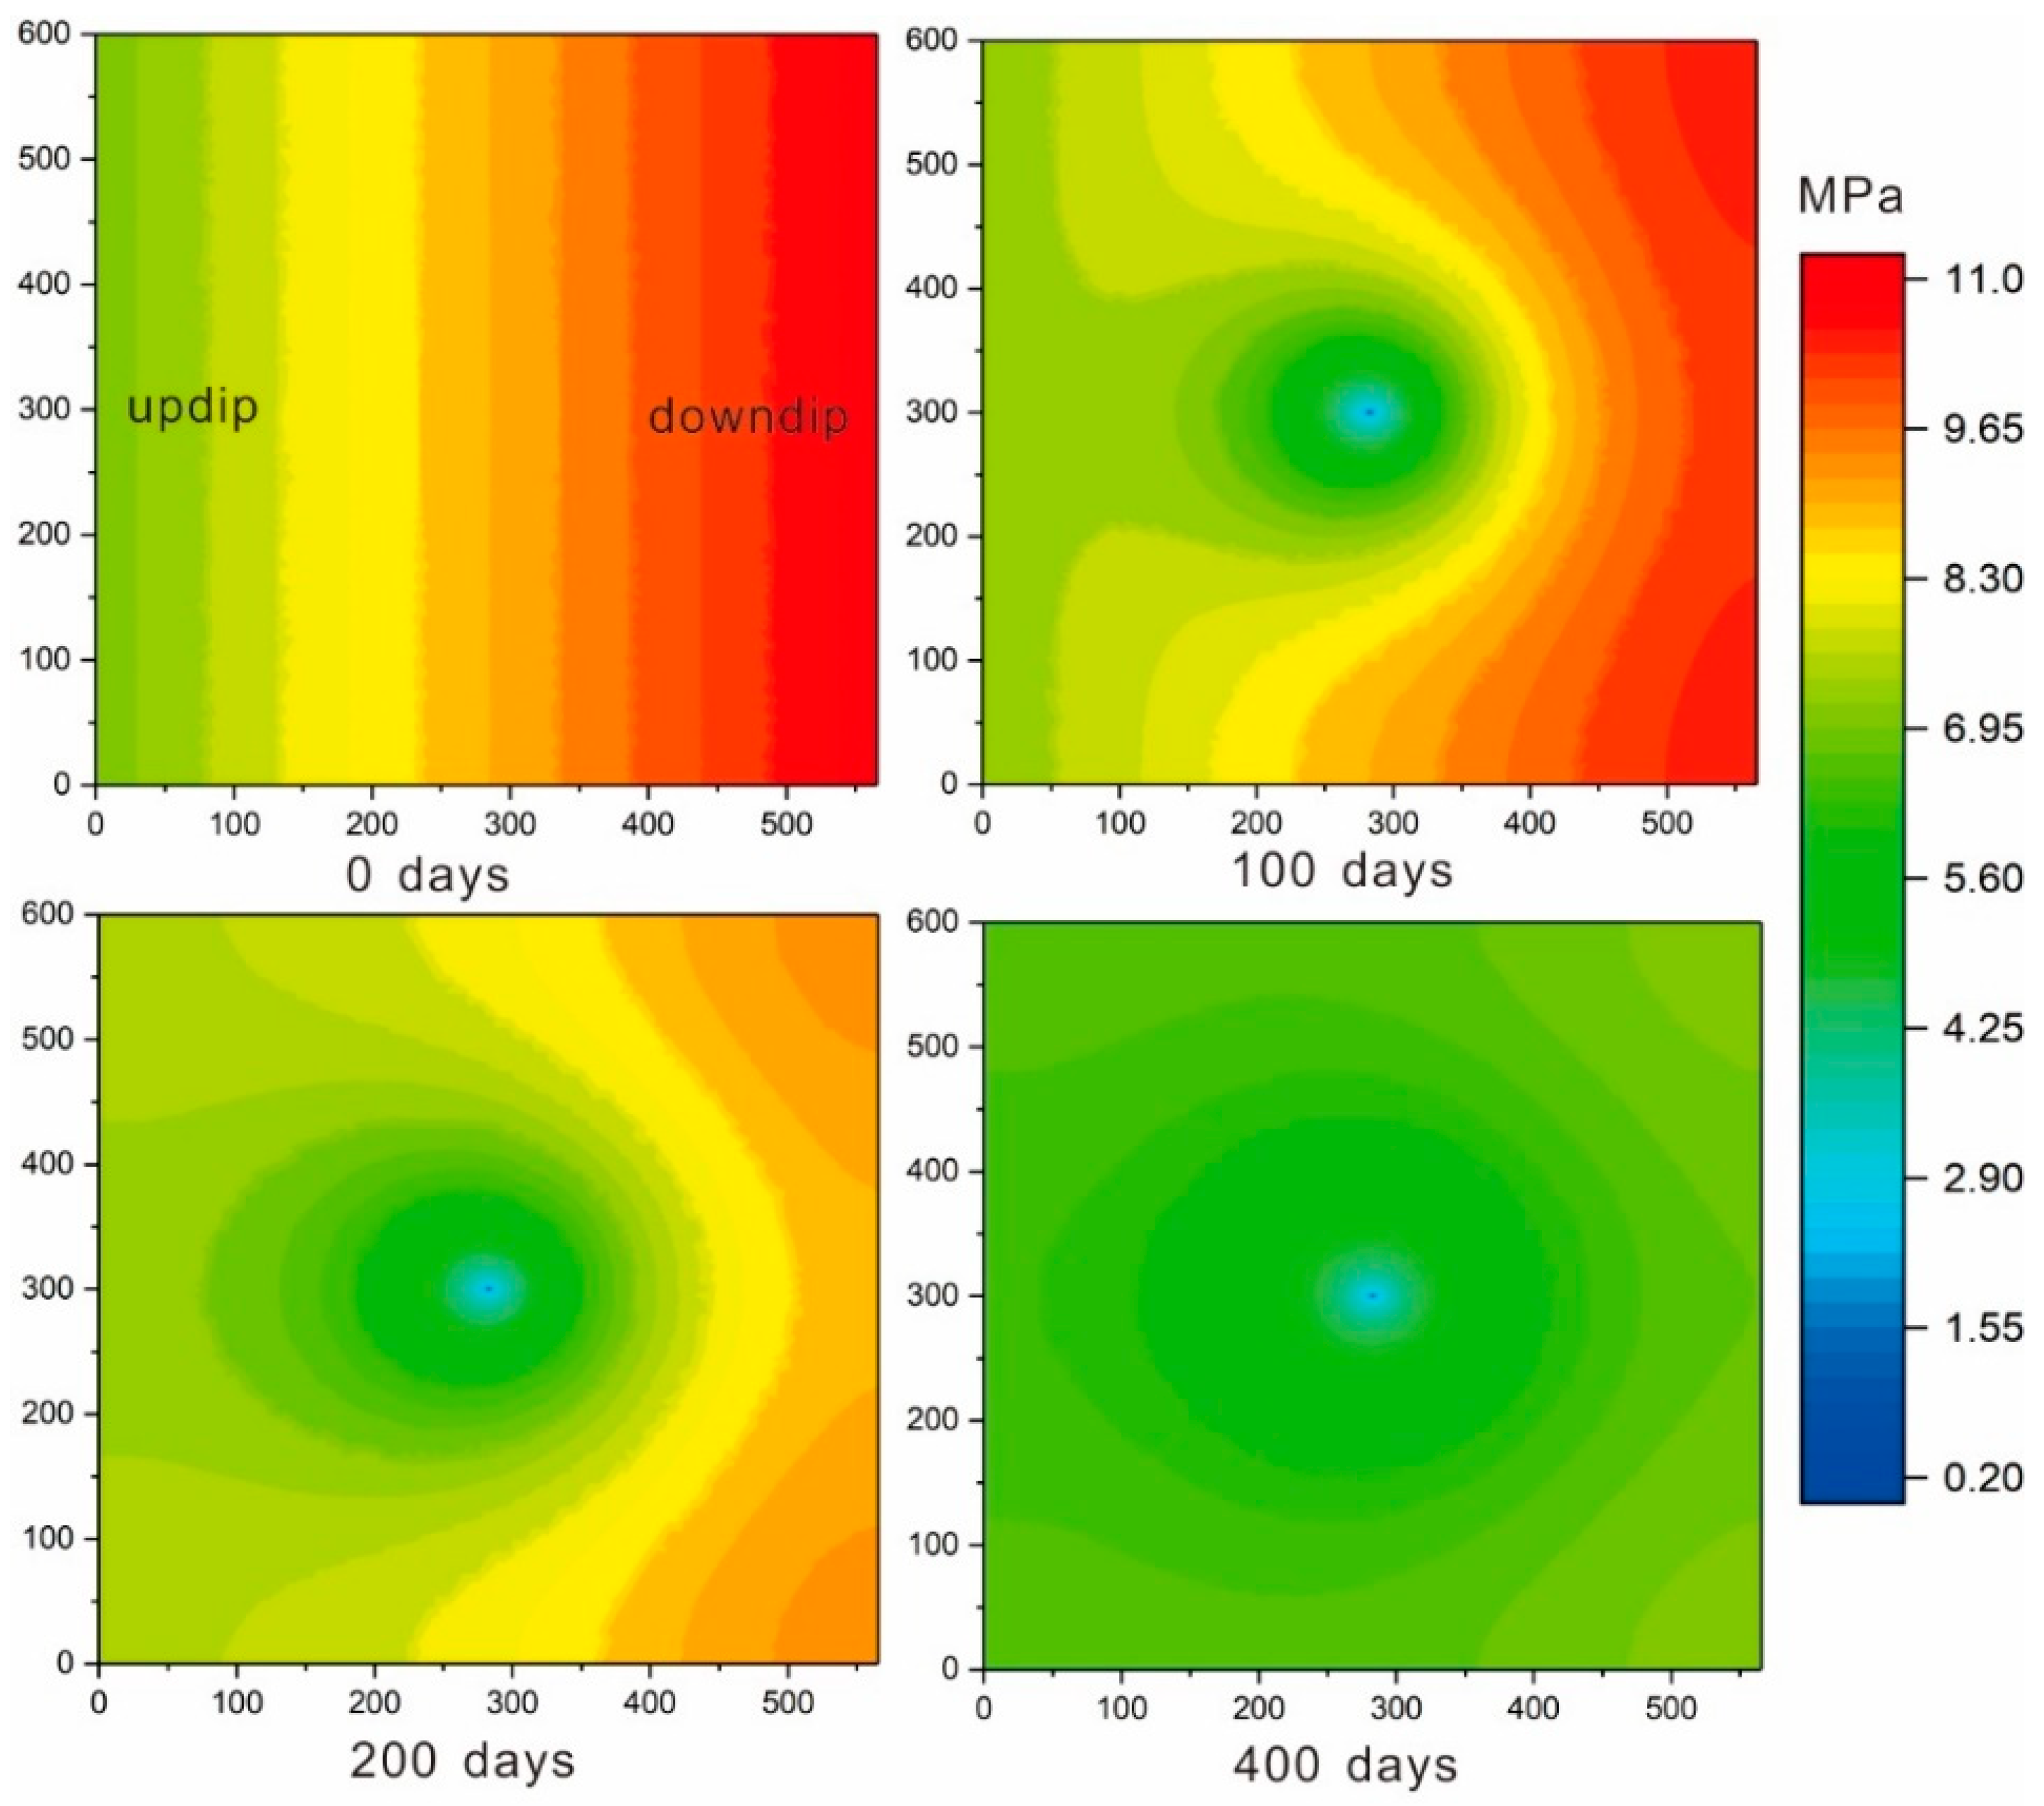
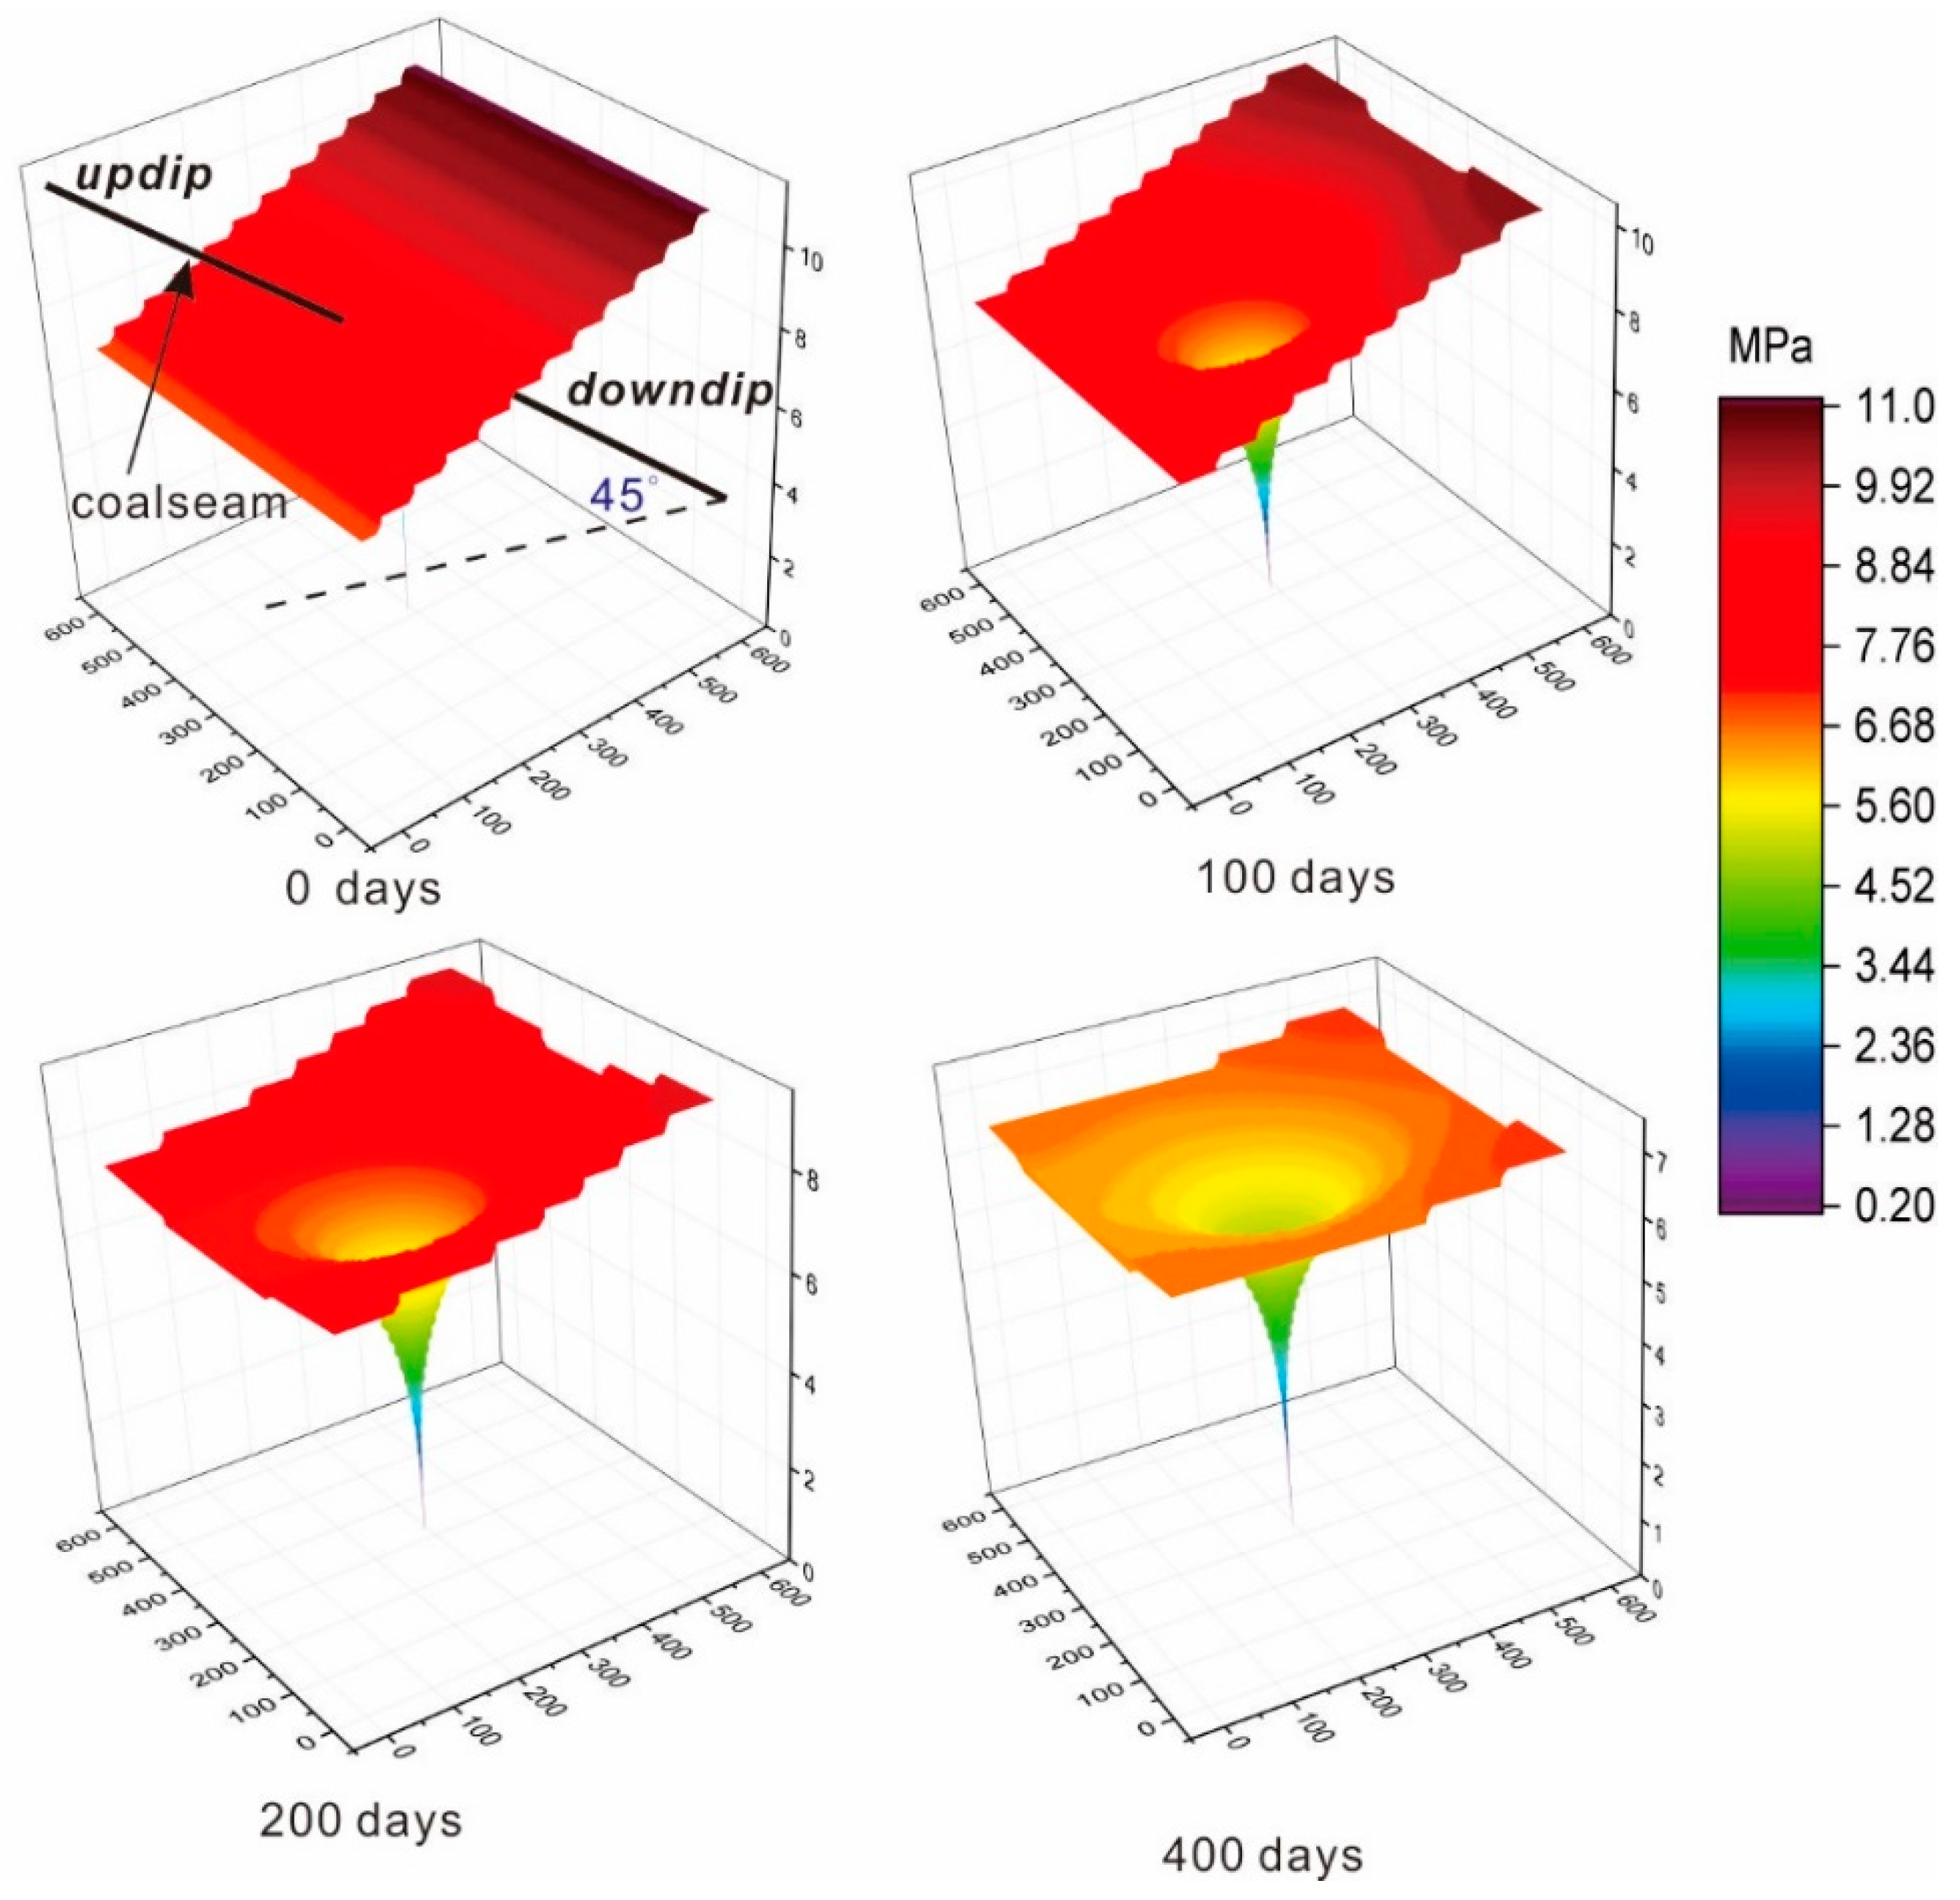
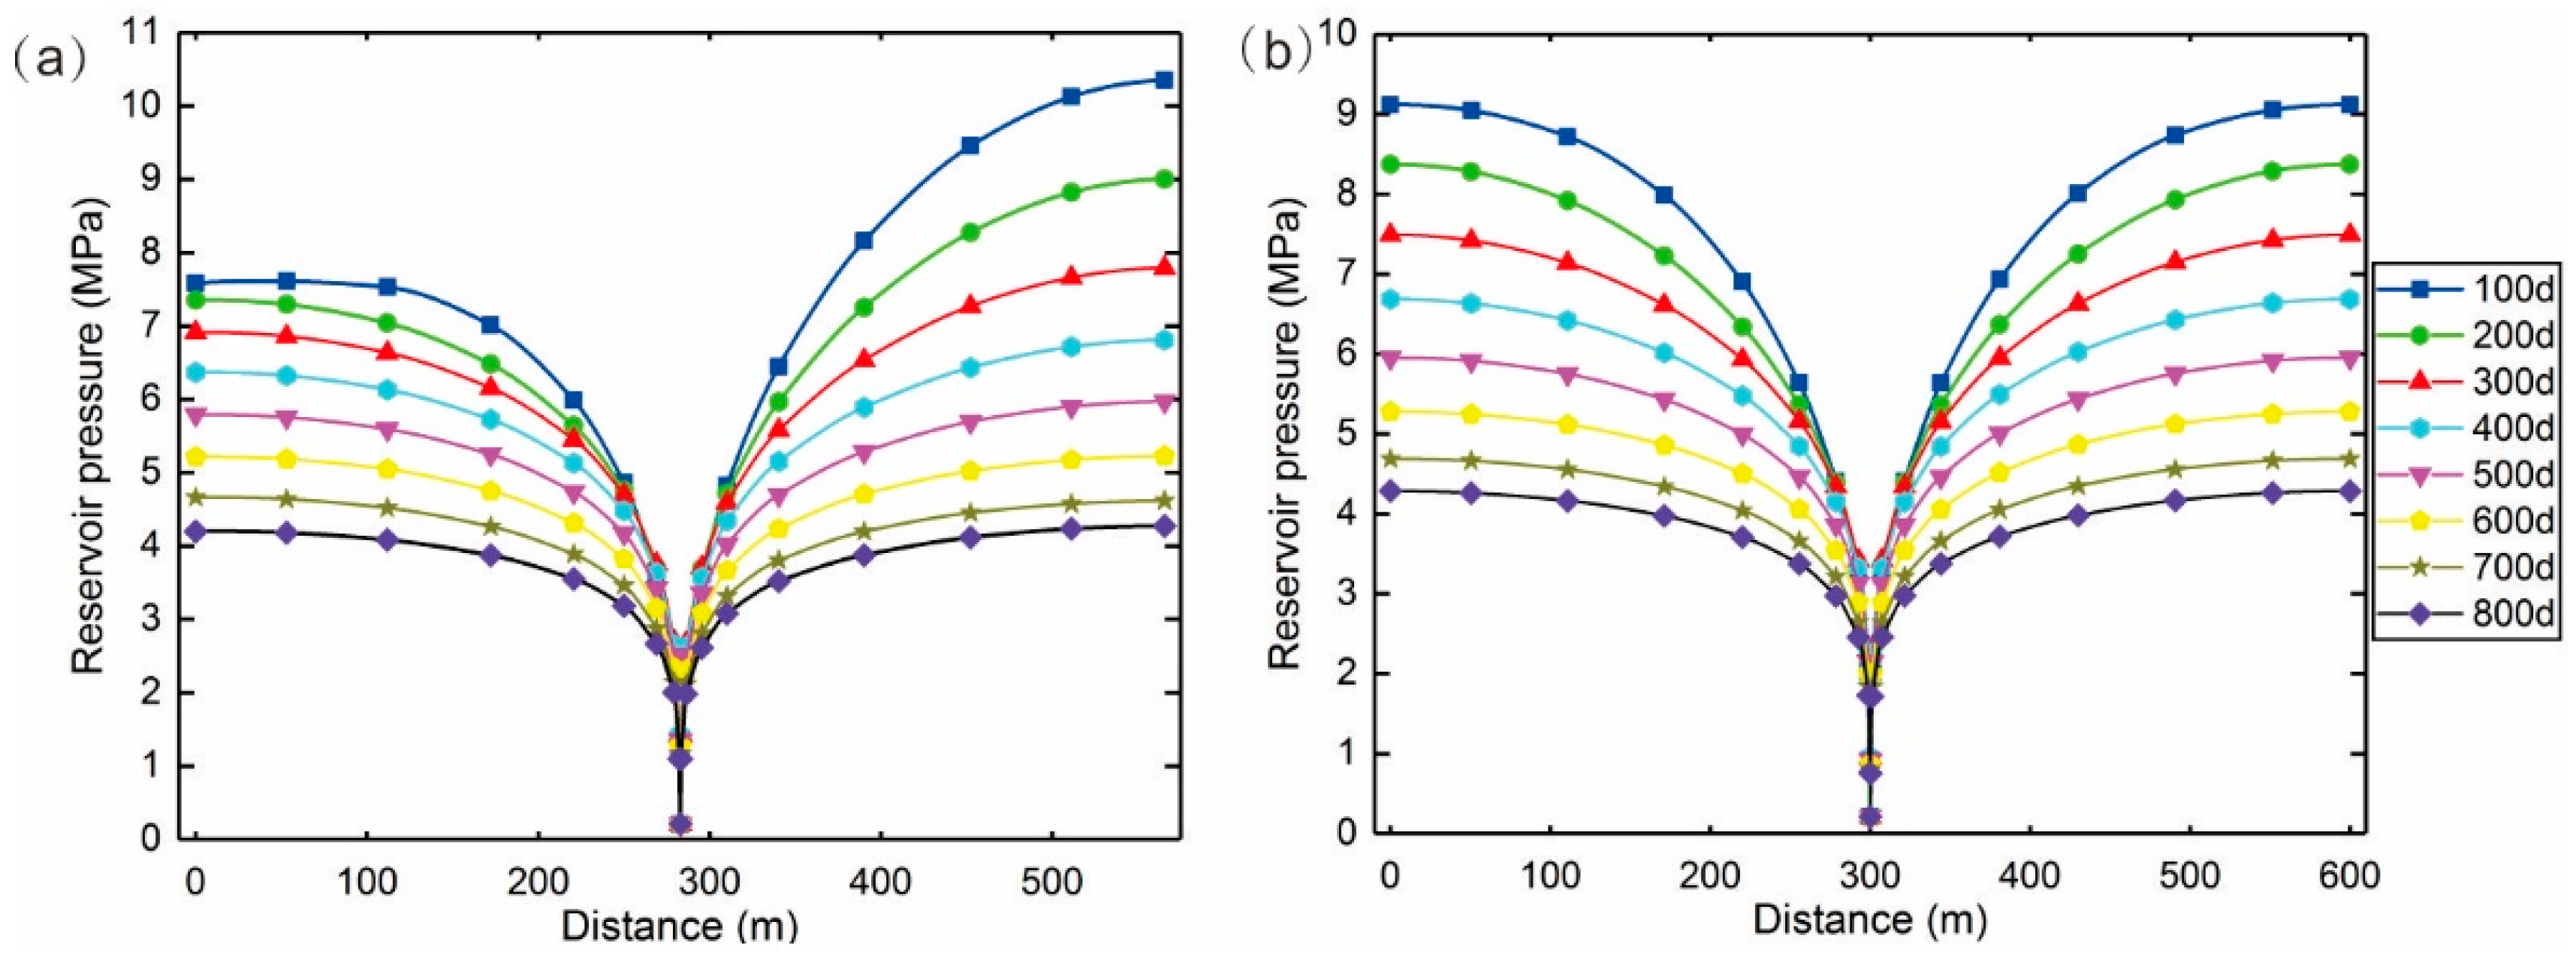
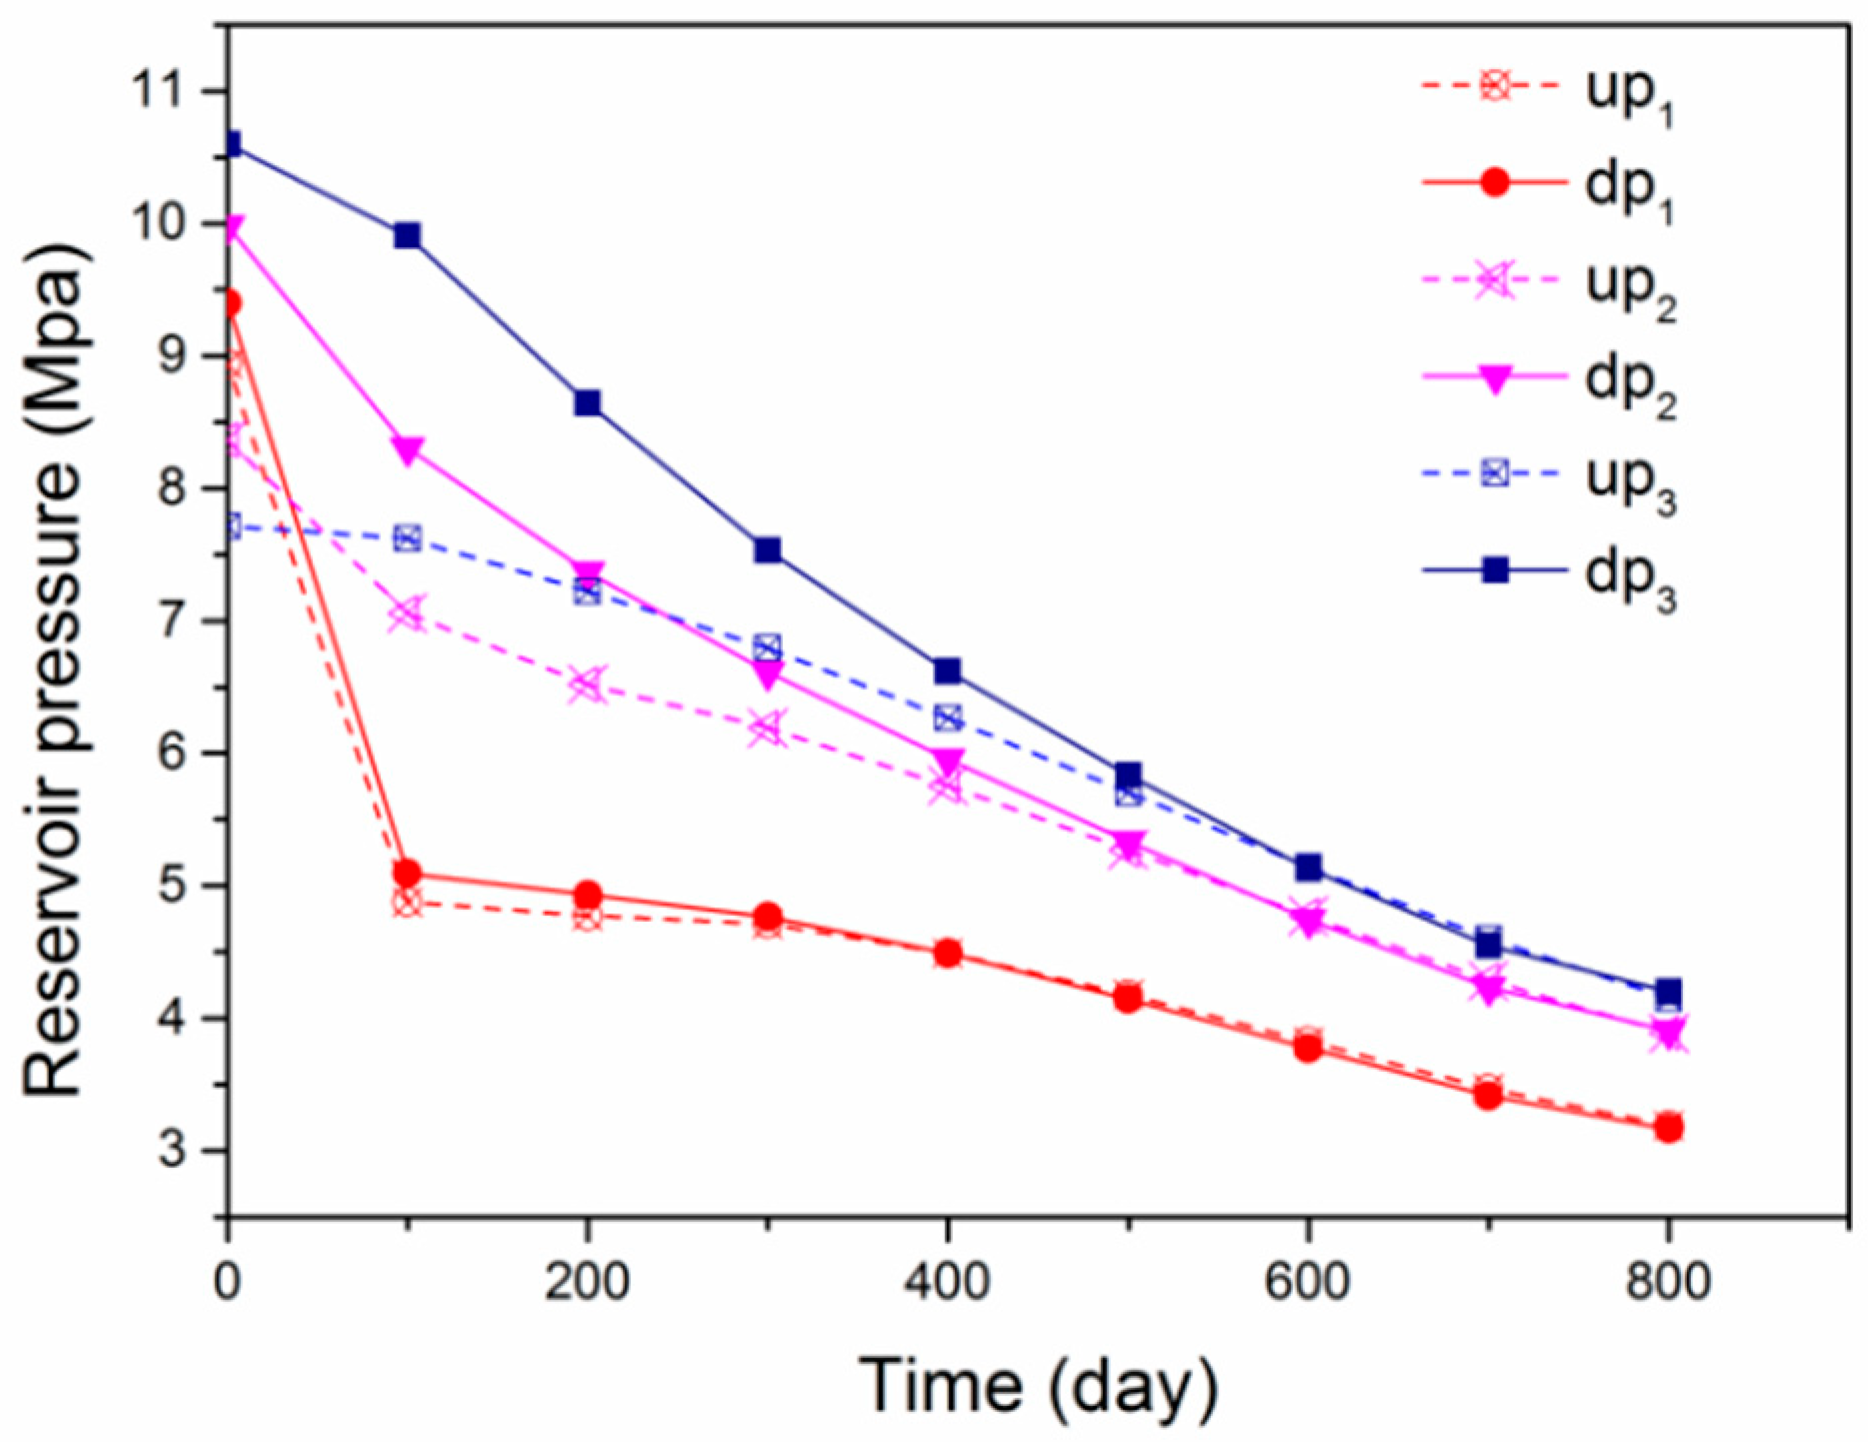
3.2.2. Evolution of the Depressurization
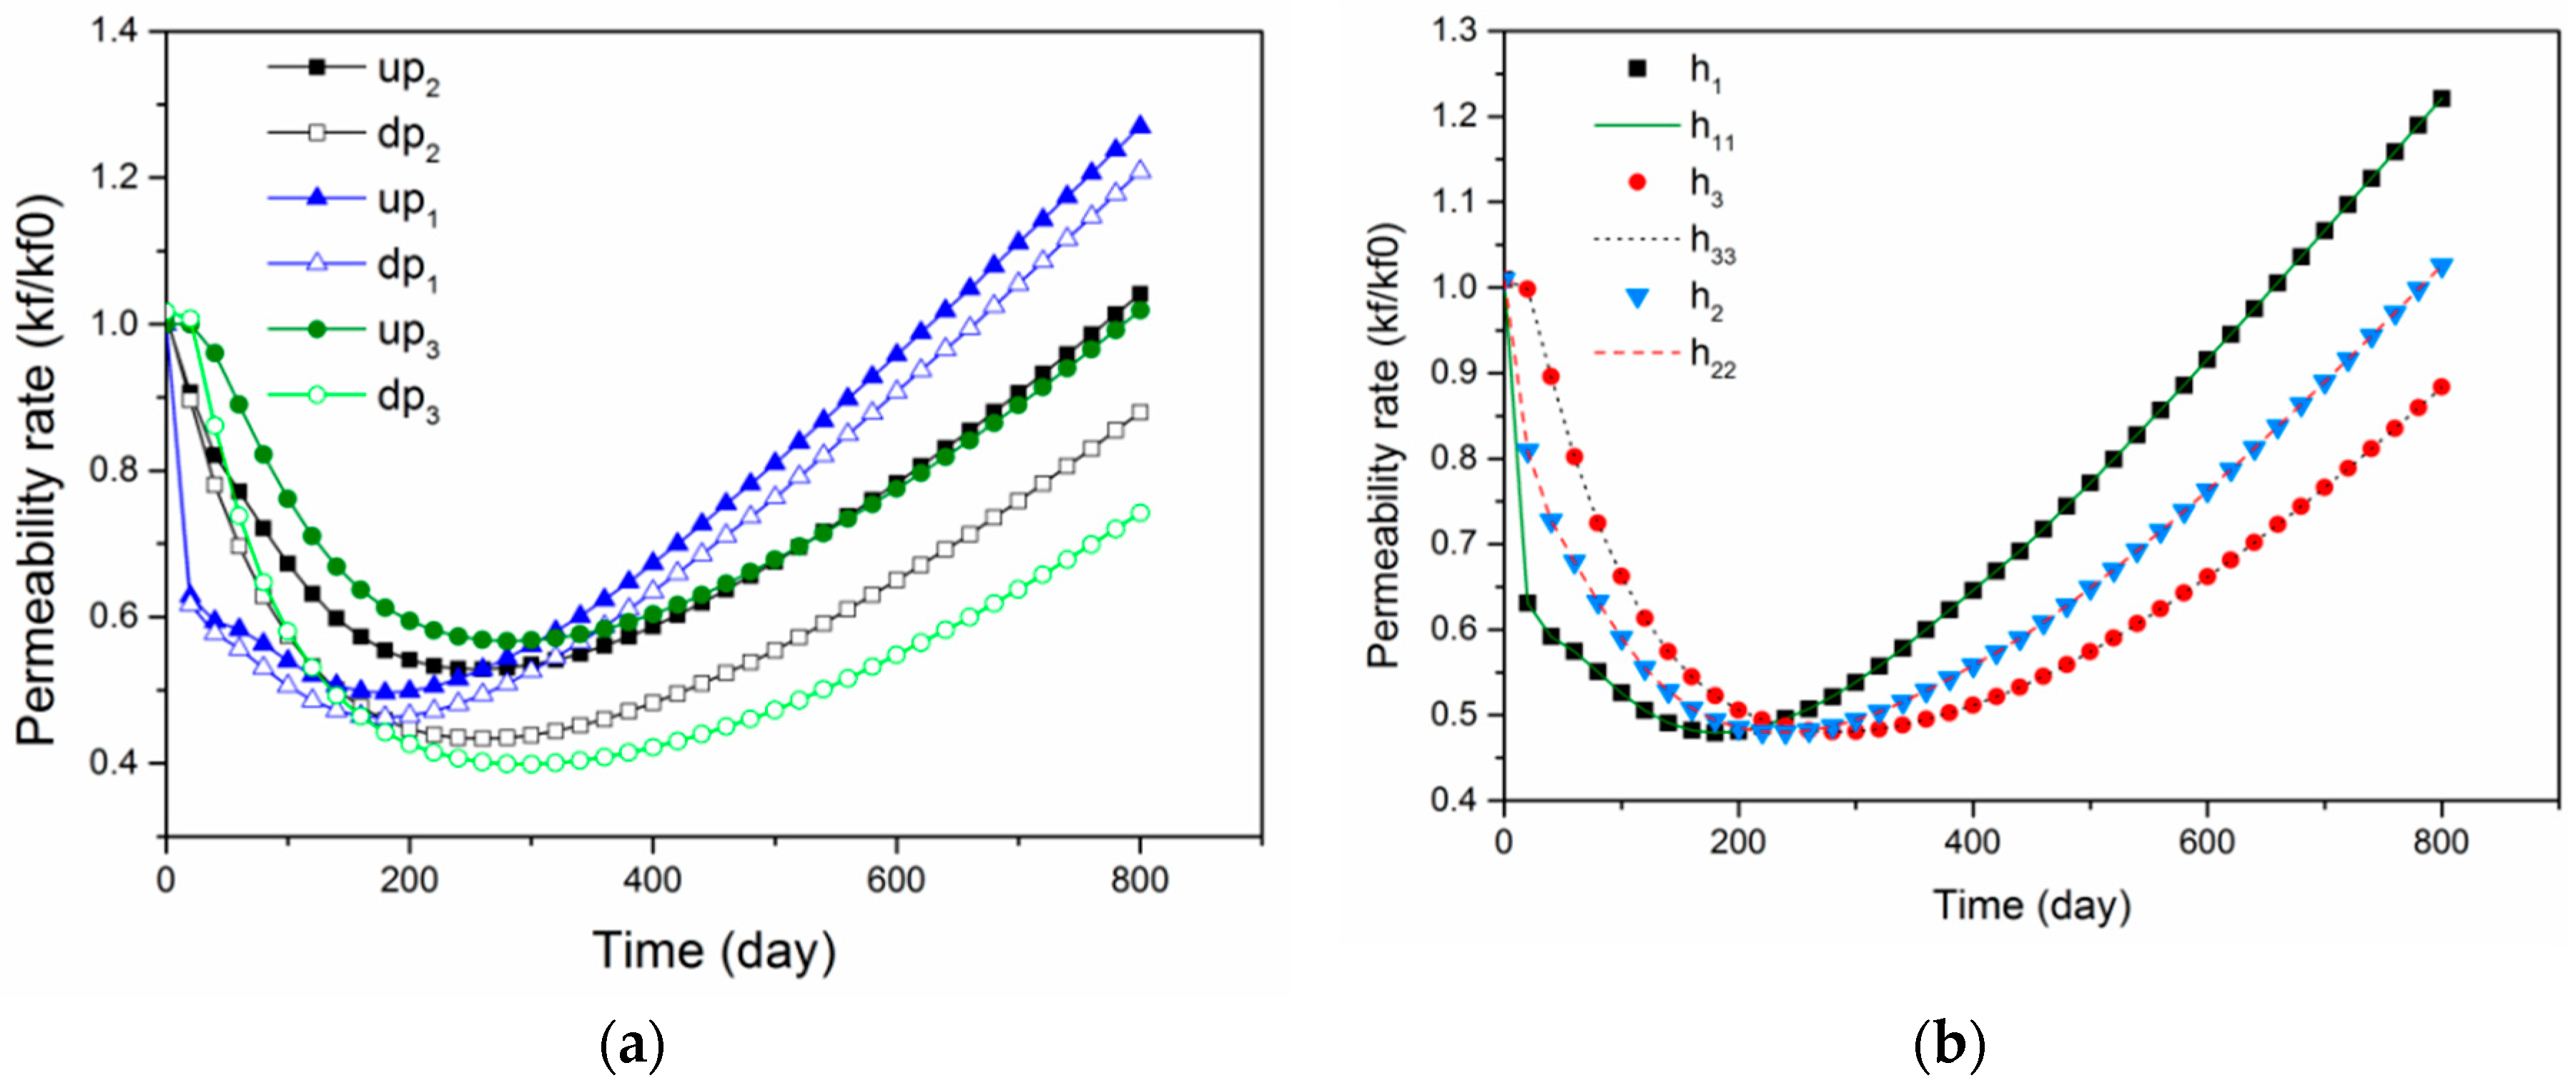
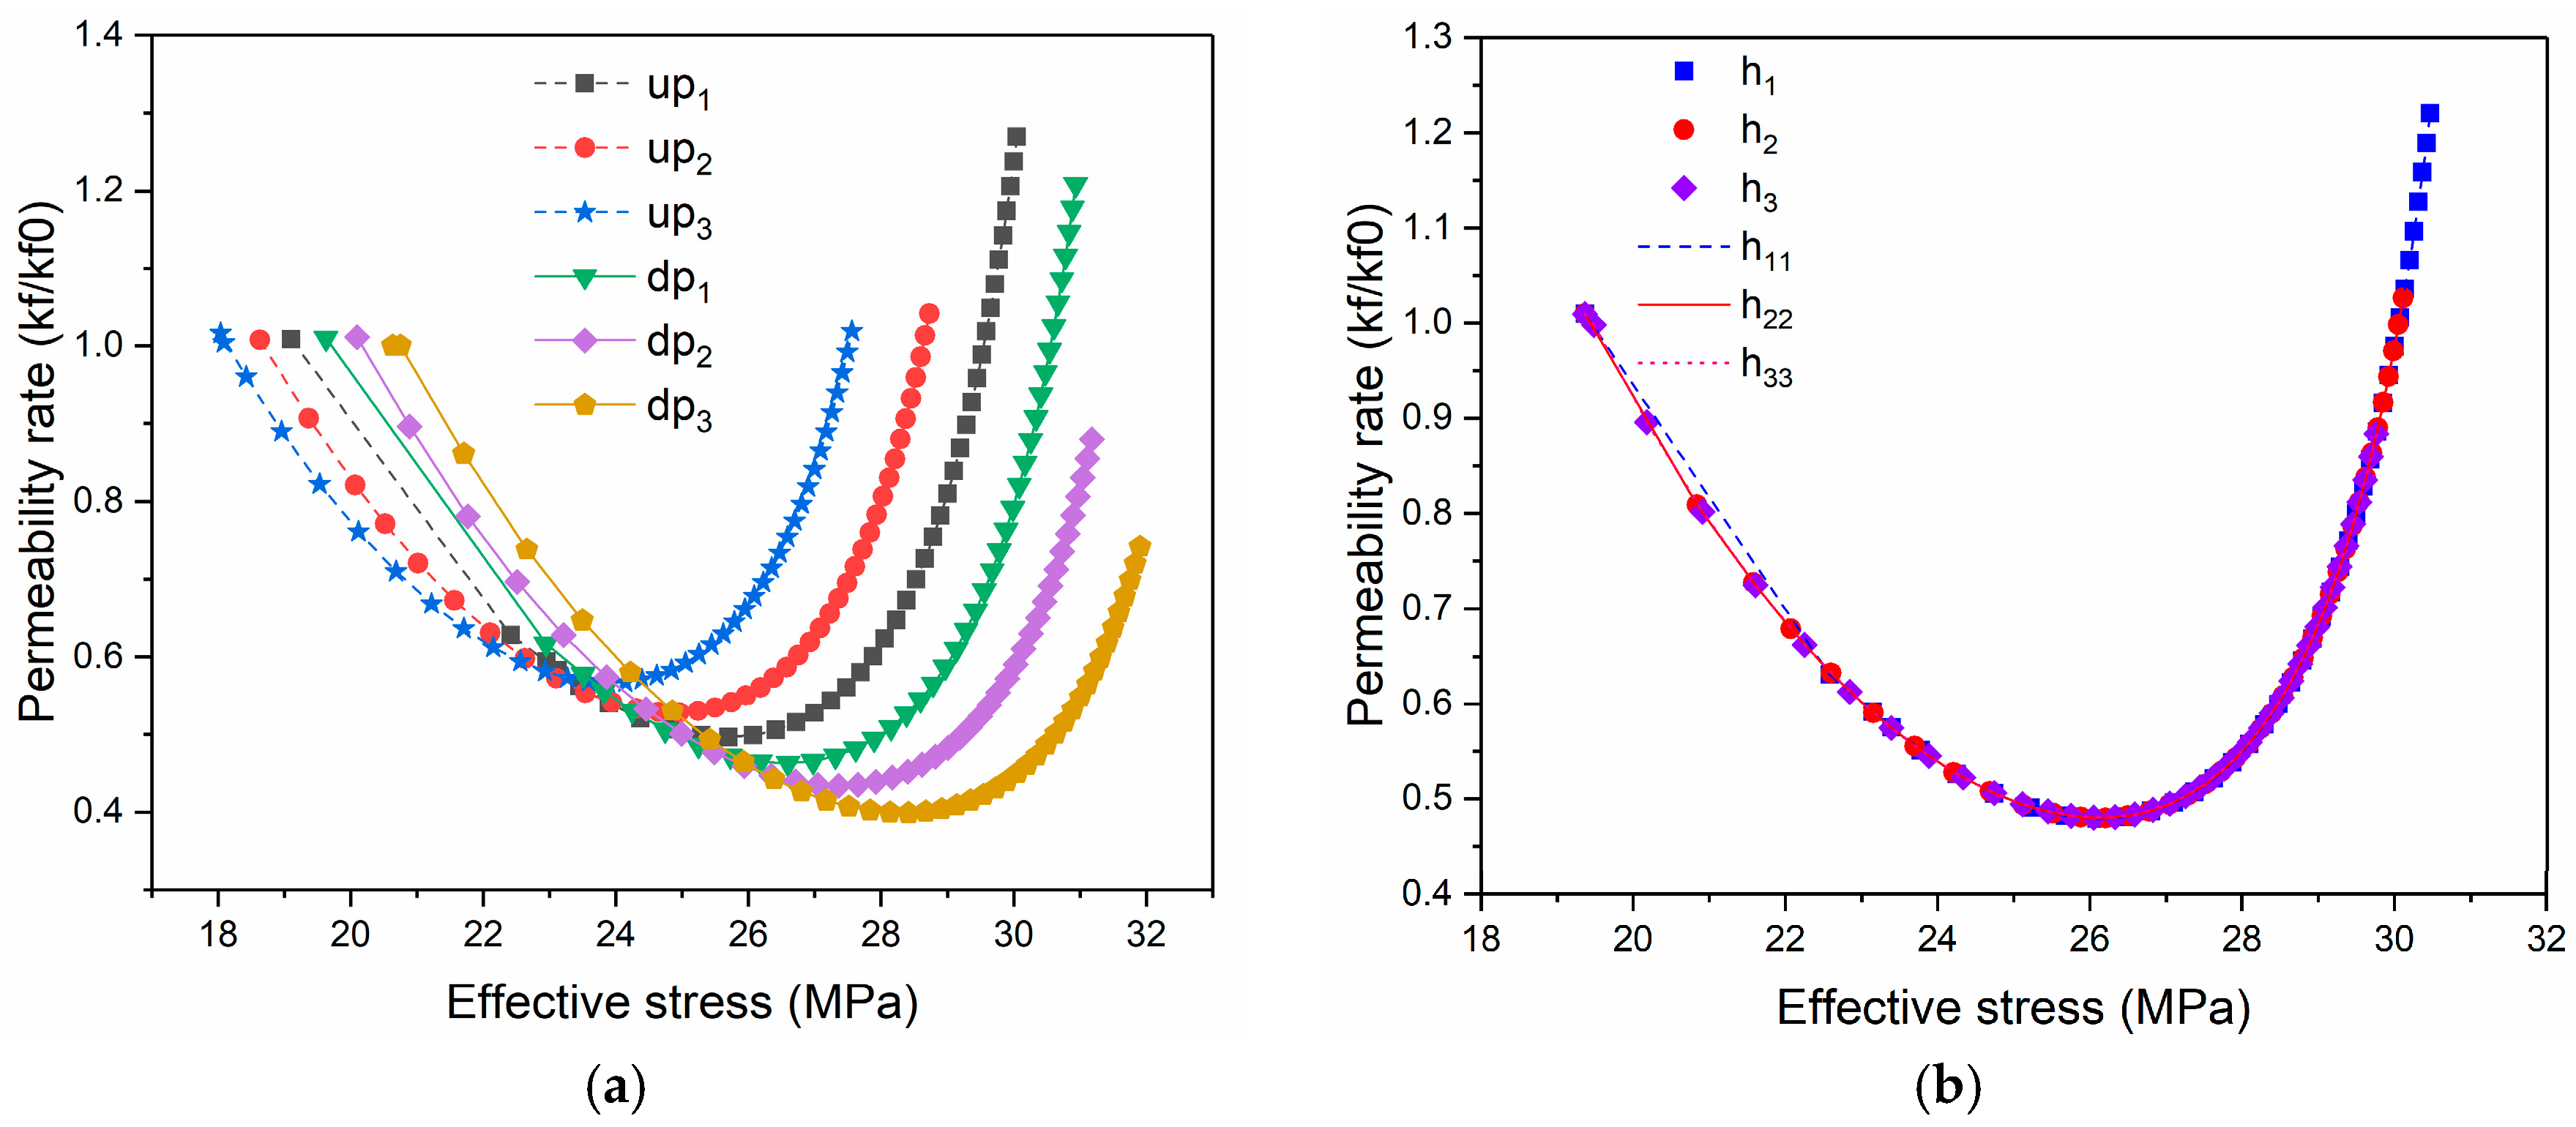
3.2.3. Evolution of the Permeability
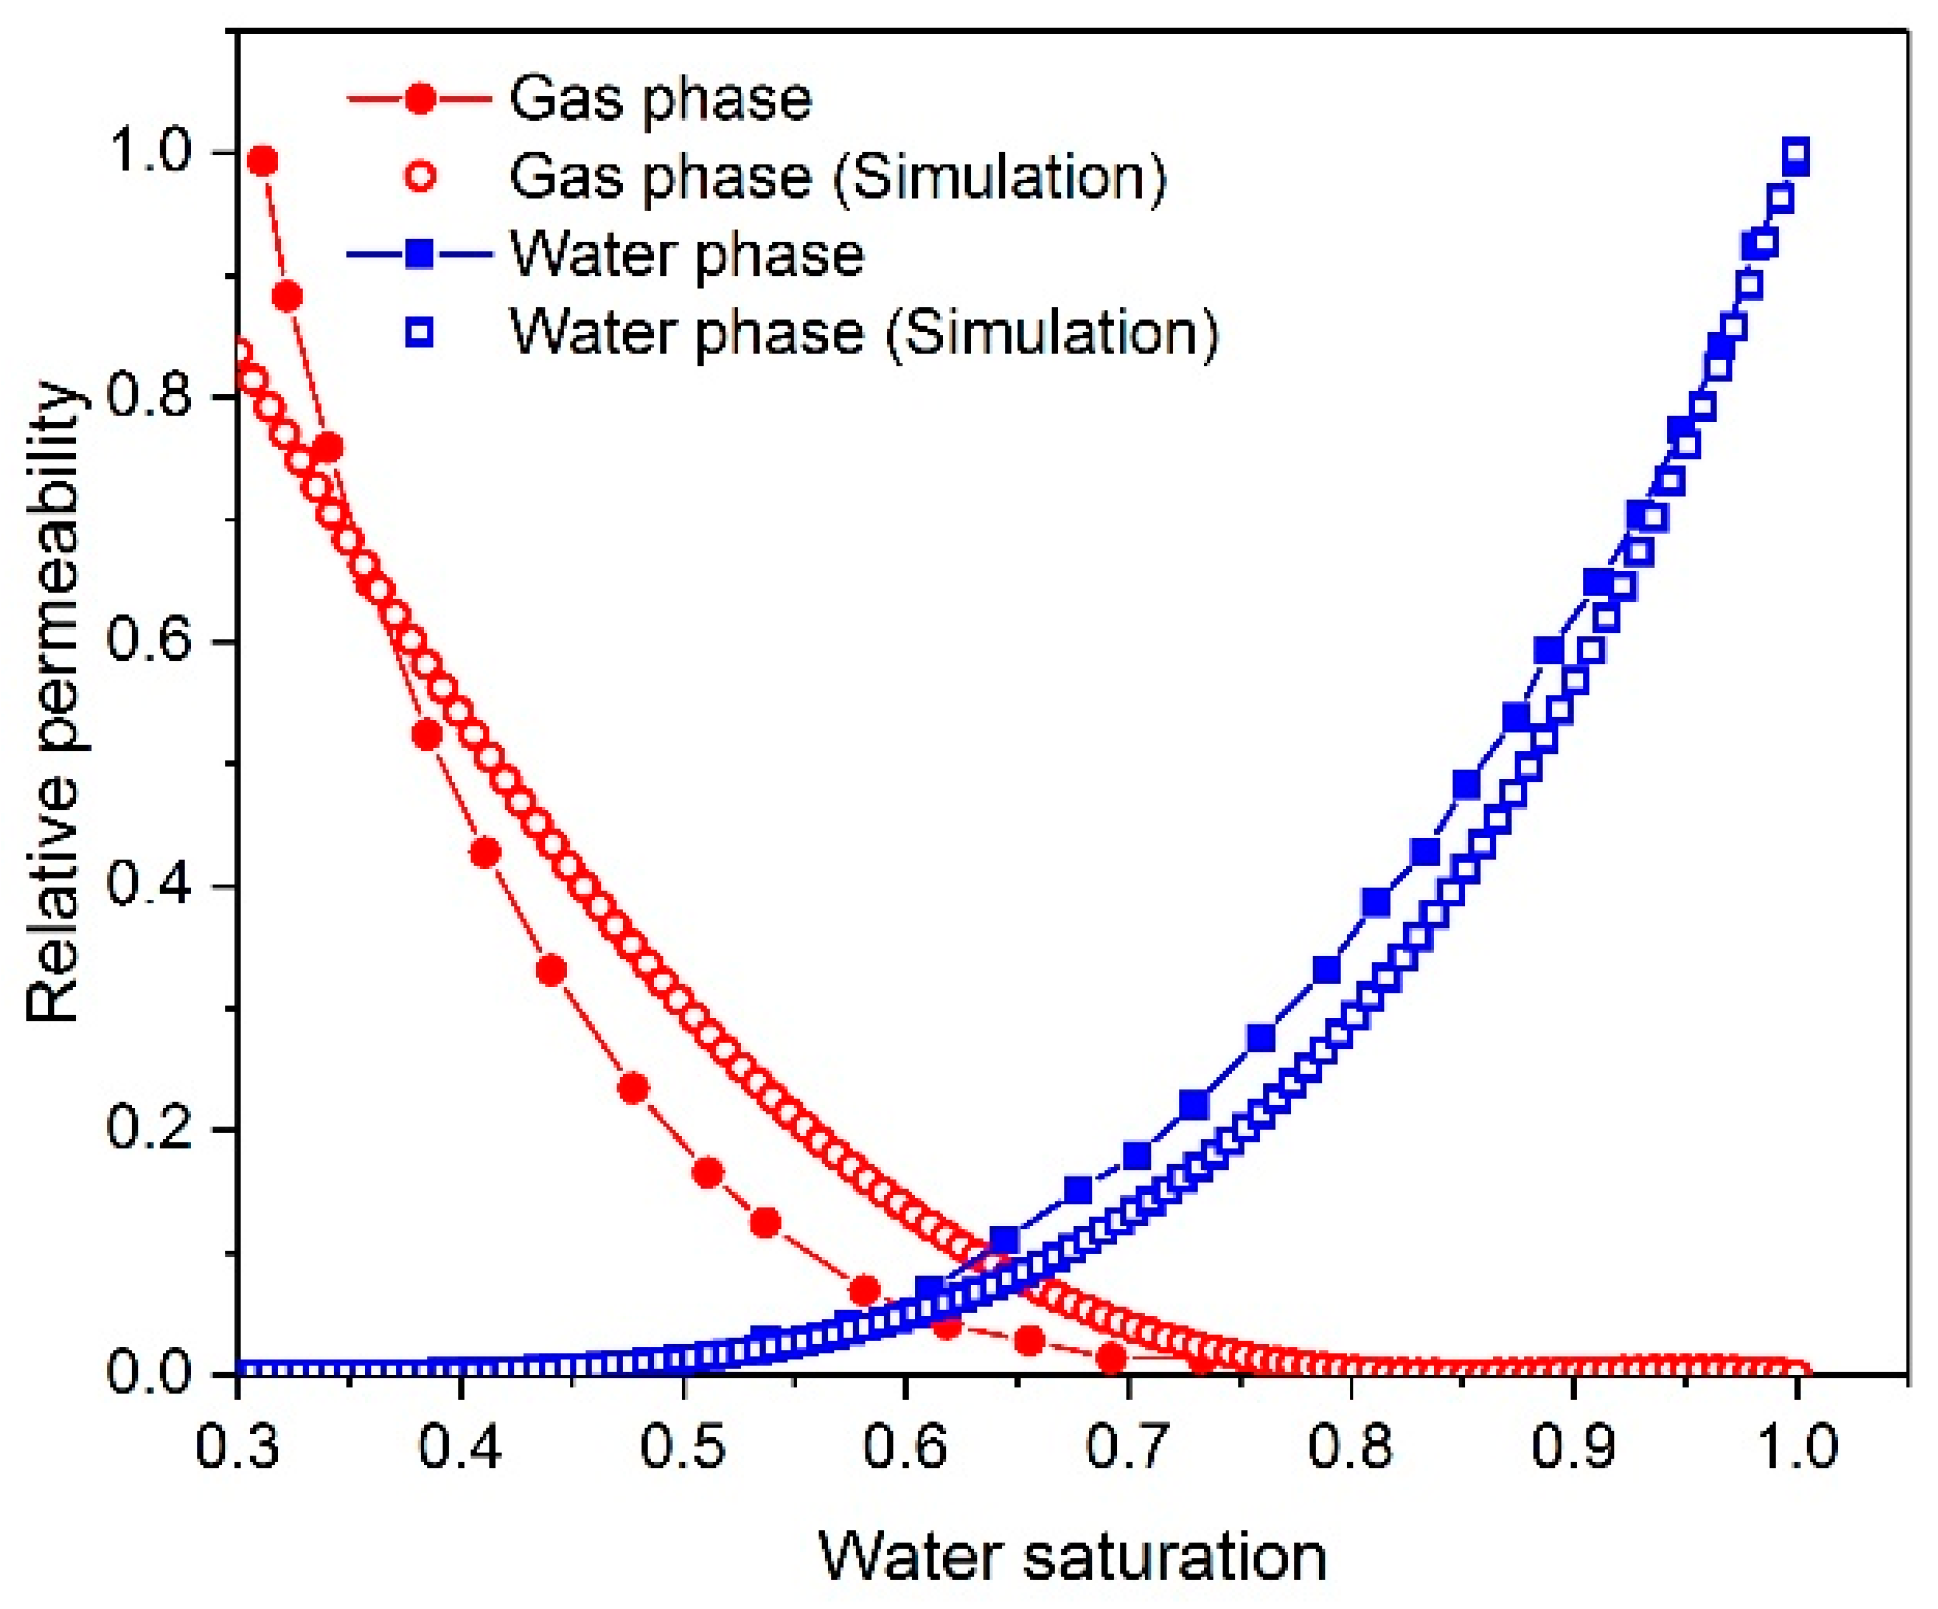
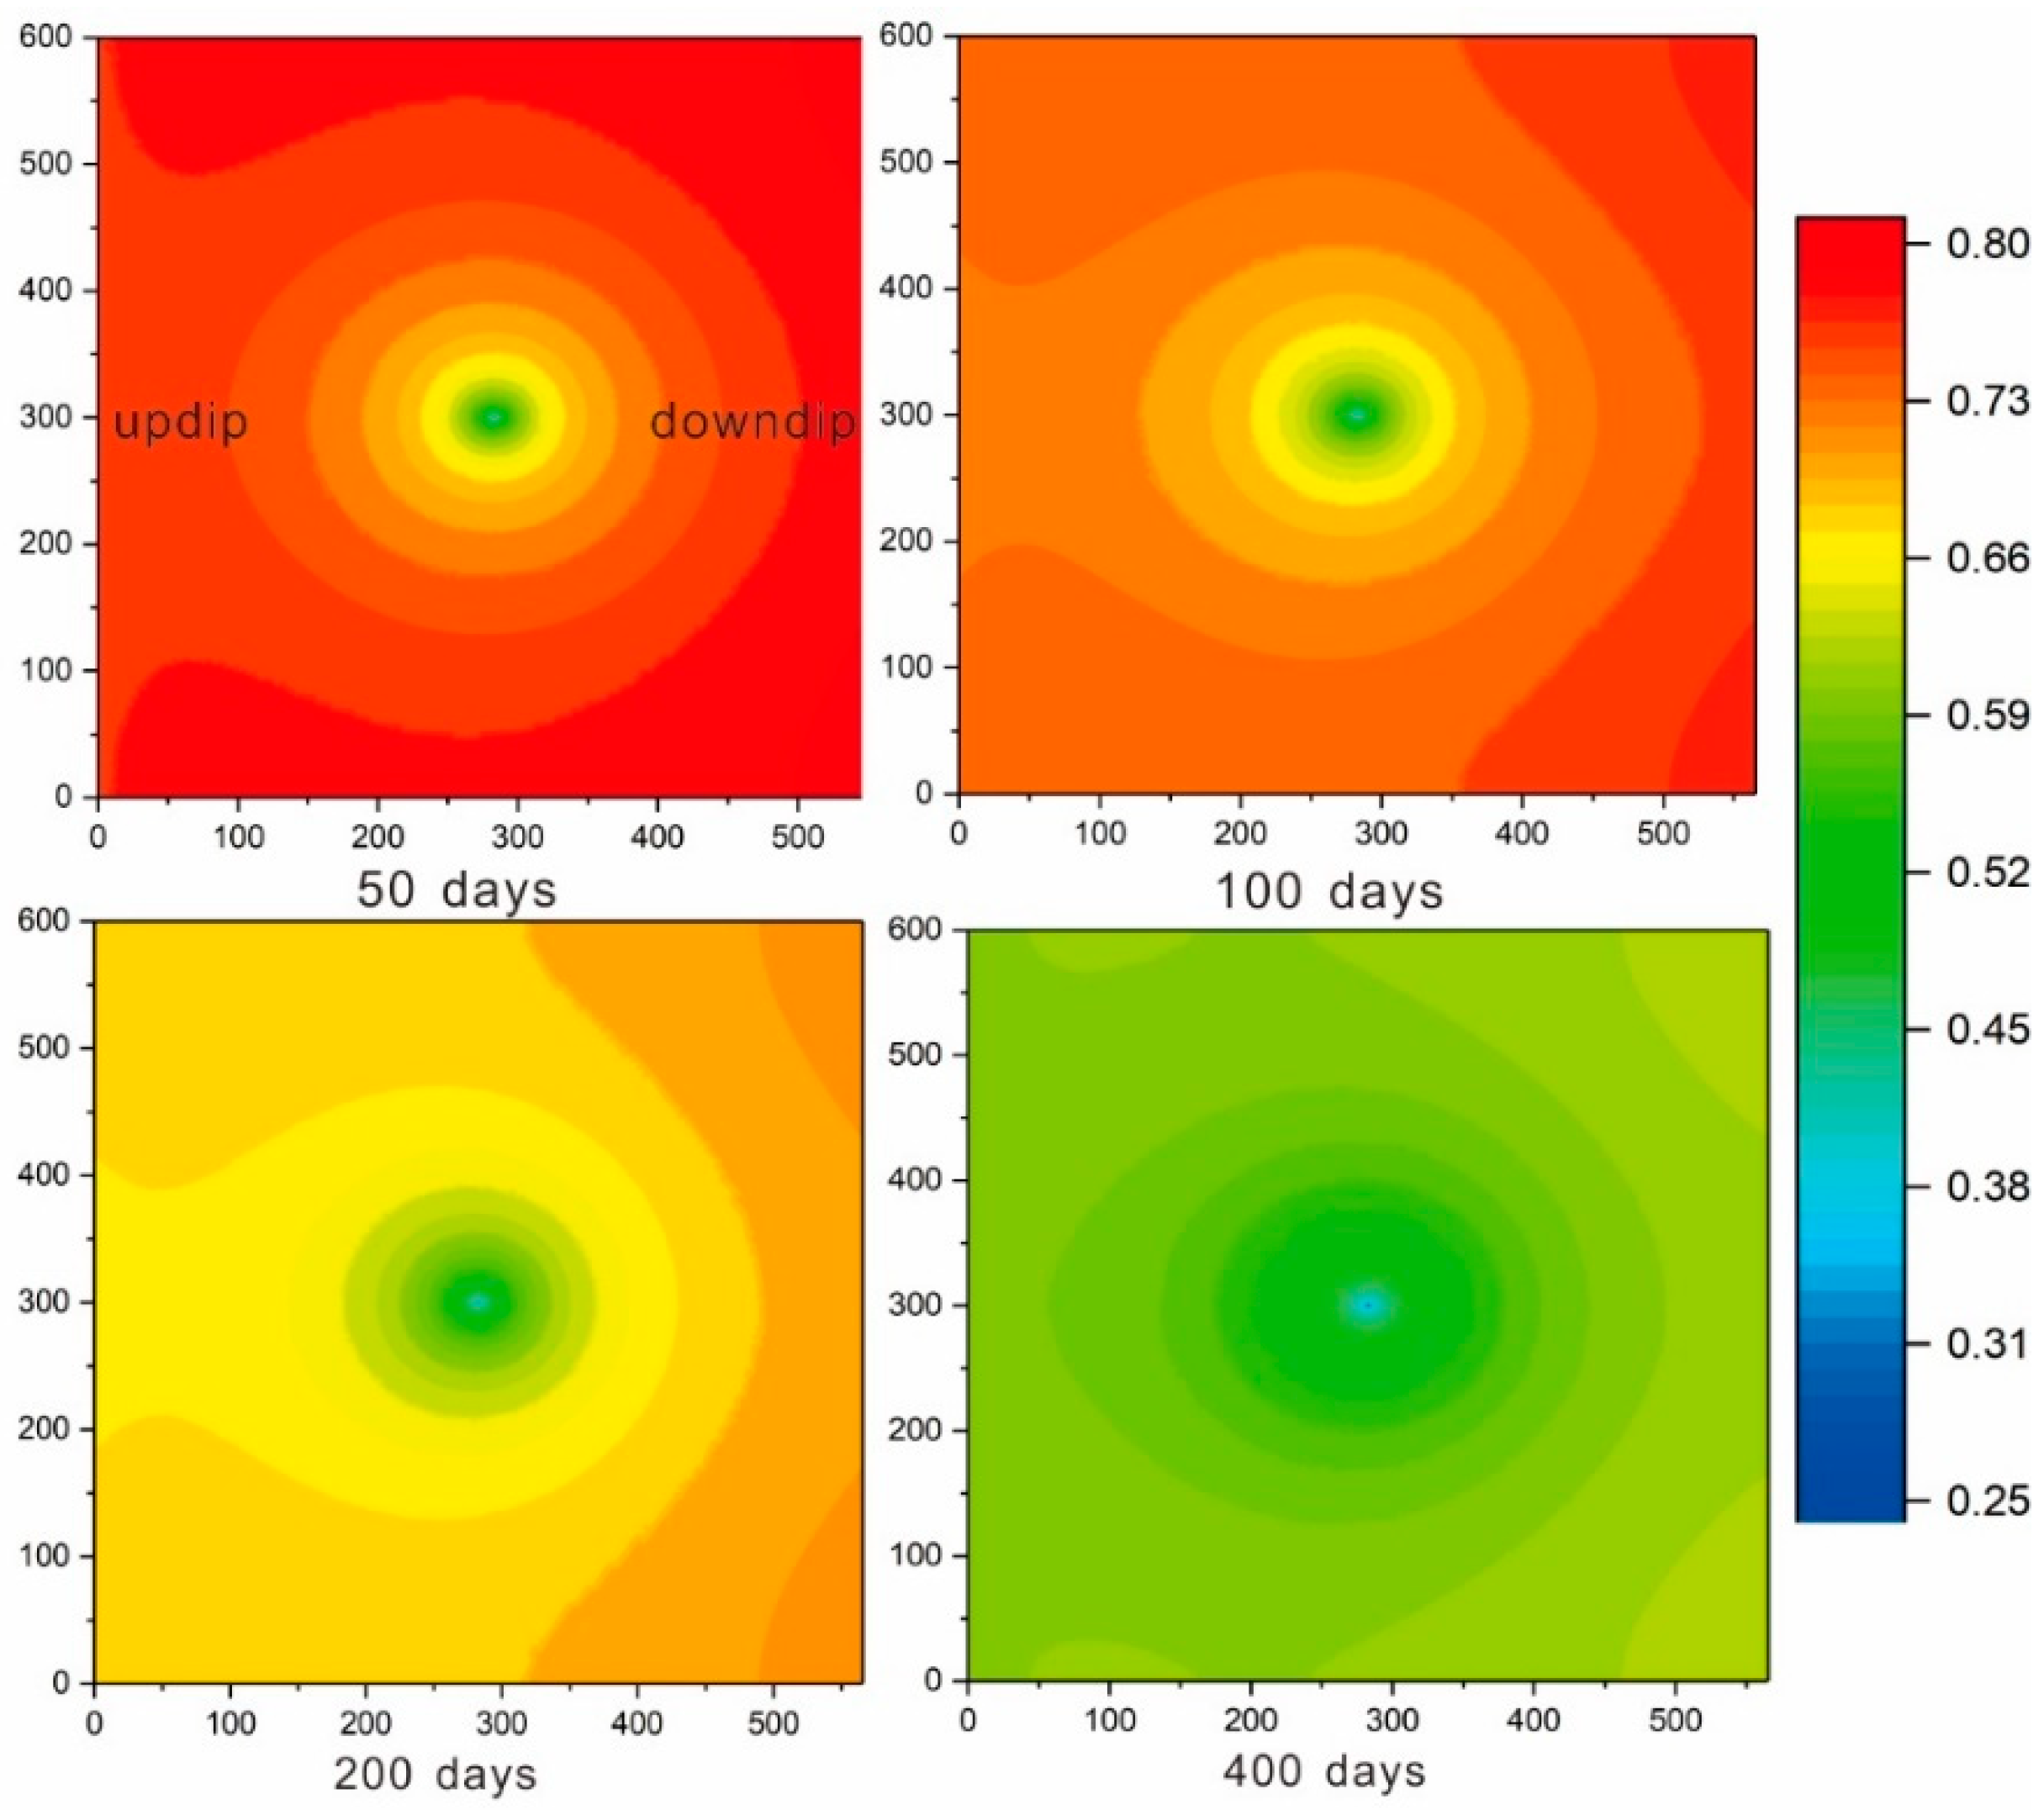
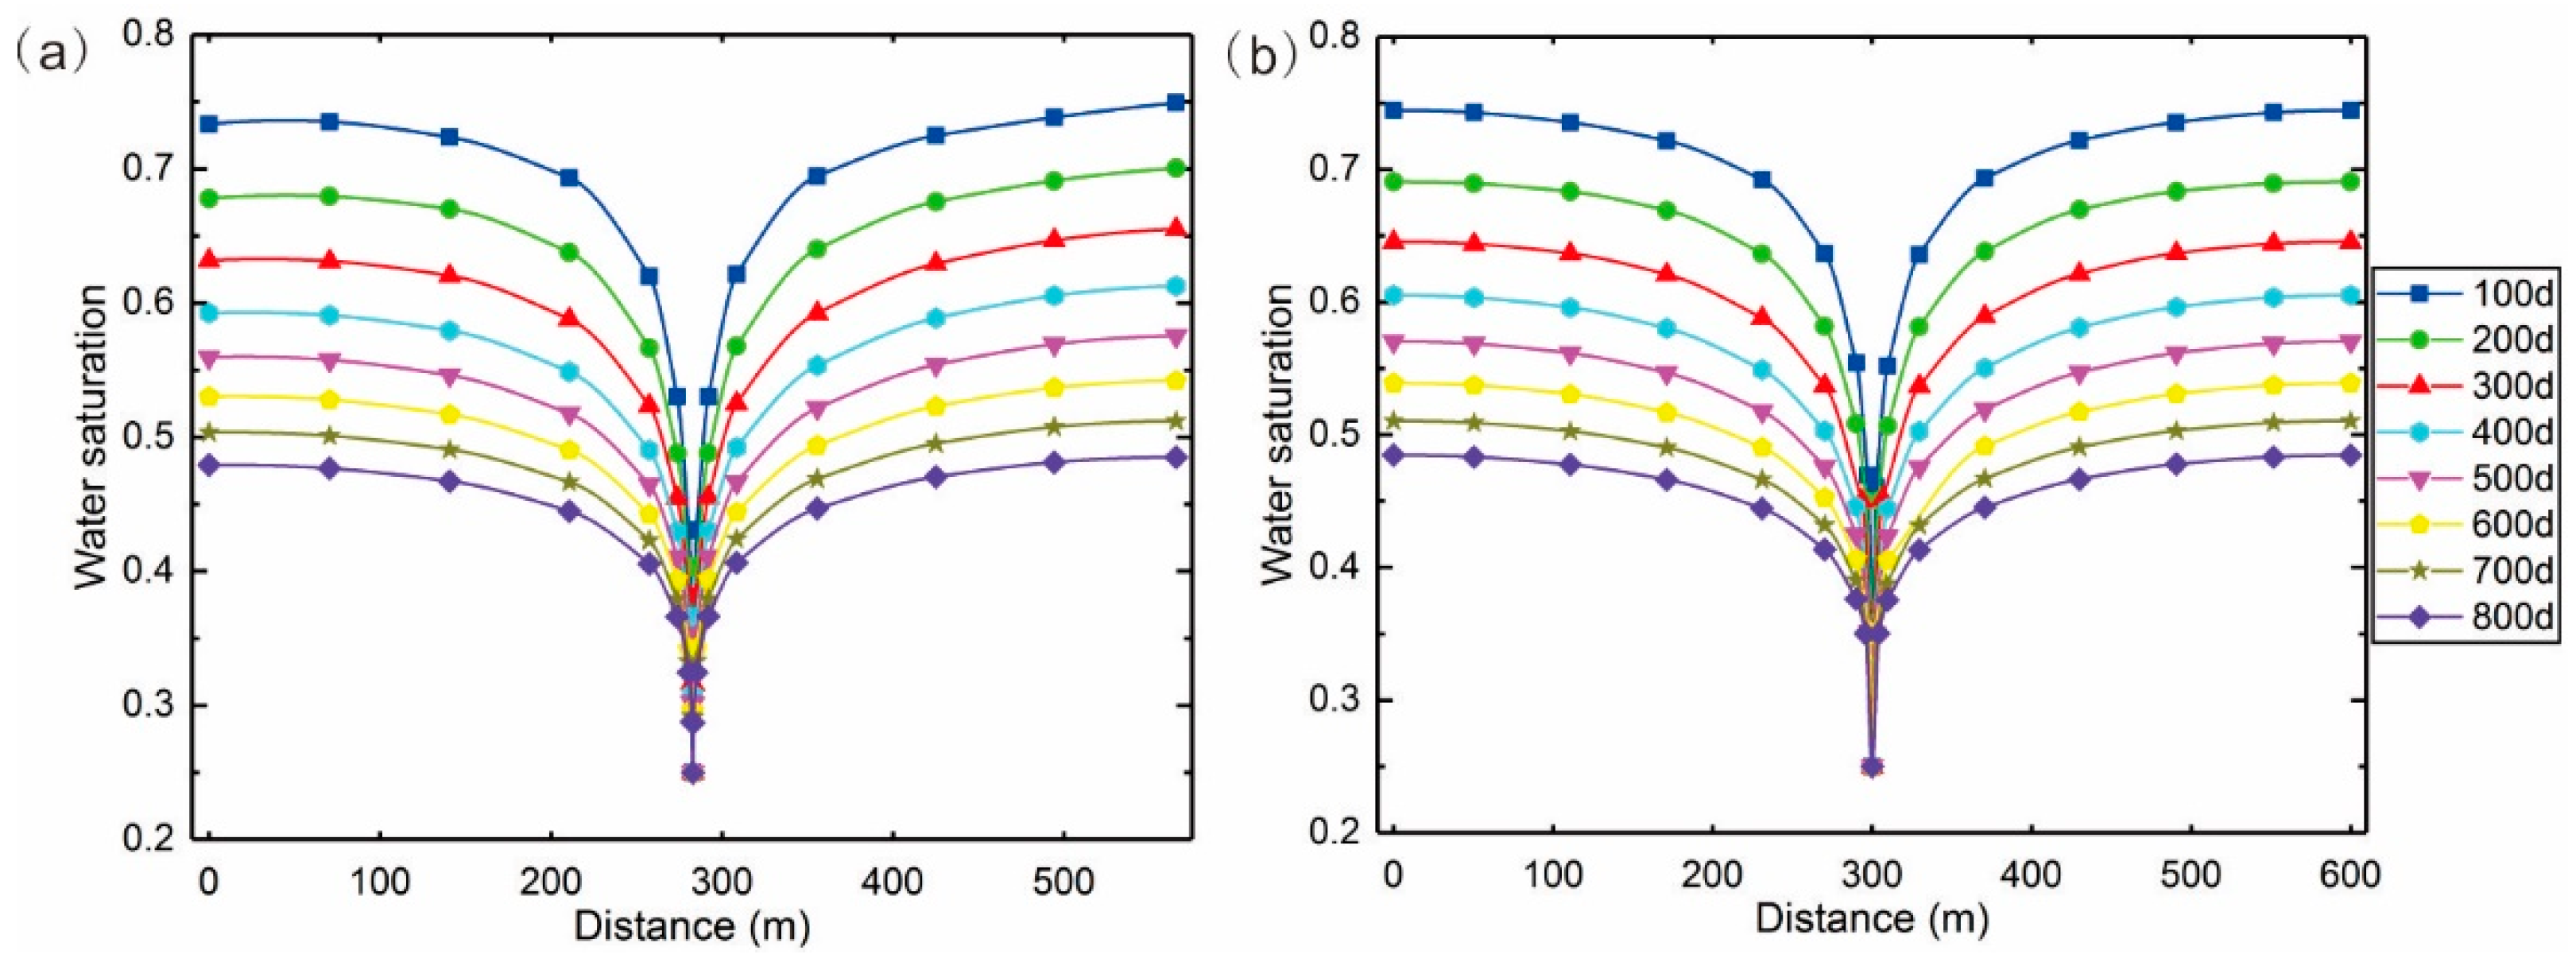
3.2.4. Distribution of the Fluid Saturation
4. Discussion
5. Conclusions
Author Contributions
Funding
Conflicts of Interest
Appendix A
Appendix A.1. Governing Equations
Appendix A.1.1. Governing Equation of the Hydraulic Field
Appendix A.1.2. Governing Equation of the Mechanical Field
Appendix A.1.3. Fracture-Matrix Cross-Coupling

Appendix A.2. Coupled Relationship

References
- Wang, L.; Chen, Z.; Wang, C.; Elsworth, D.; Liu, W. Reassessment of Coal Permeability Evolution Using Steady-state Flow Methods: The Role of Flow Regime Transition. Int. J. Coal Geol. 2019, 211, 103210. [Google Scholar] [CrossRef]
- Lu, M.; Connell, L.D. A model for the flow of gas mixtures in adsorption dominated dual porosity reservoirs incorporating multi-component matrix diffusion: Part I. Theoretical development. J. Petrol. Sci. Eng. 2007, 59, 17–26. [Google Scholar] [CrossRef]
- Aminian, K.; Ameri, S. Predicting production performance of CBM reservoirs. J. Nat. Gas Sci. Eng. 2009, 1, 25–30. [Google Scholar] [CrossRef]
- Du, Y.; Chen, X.; Li, L.; Wang, P. Characteristics of methane desorption and diffusion in coal within a negative pressure environment. Fuel 2018, 217, 111–121. [Google Scholar] [CrossRef]
- Karacan, C.Ö.; Ruiz, F.A.; Cotè, M.; Phipps, S. Coal mine methane: A review of capture and utilization practices with benefits to mining safety and to greenhouse gas reduction. Int. J. Coal Geol. 2011, 86, 121–156. [Google Scholar] [CrossRef]
- Pan, Z.; Wood, D.A. Coalbed methane (CBM) exploration, reservior characterisation, production, and modelling: A collection of published research (2009–2015). J. Nat. Gas Sci. Eng. 2015, 26, 1472–1484. [Google Scholar] [CrossRef]
- Xia, T.; Zhou, F.; Liu, J.; Hu, S.; Liu, Y. A fully coupled coal deformation and compositional flow model for the control of the pre-mining coal seam gas extraction. Int. J. Rock Mech. Min. Sci. 2014, 72, 138–148. [Google Scholar] [CrossRef]
- Wan, Y.; Liu, Y.; Ouyang, W.P.; Liu, W.; Han, G. Desorption area and pressure-drop region of wells in a homogeneous coalbed. J. Nat. Gas Sci. Eng. 2016, 28, 1–14. [Google Scholar] [CrossRef] [Green Version]
- Li, H.; Lau, H.C.; Huang, S. China’s coalbed methane development: A review of the challenges and opportunities in subsurface and surface engineering. J. Petrol. Sci. Eng. 2018, 166, 621–635. [Google Scholar] [CrossRef]
- Kong, X.; Wang, E.; Liu, Q.; Li, D.; Li, Z.; Gao, Z. Dynamic permeability and porosity evolution of coal seam rich in CBM based on the flow-soild coupling theory. J. Nat. Gas Sci. Eng. 2017, 40, 61–71. [Google Scholar] [CrossRef]
- Cui, X.; Bustin, R.M. Volumetric strain associated with methane desorption and its impact on coalbed gas production from deep coal seams. Int. J. Coal Geol. 2005, 89, 1181–1202. [Google Scholar] [CrossRef]
- Li, S.; Tang, D.; Pan, Z.; Xu, H.; Tao, S.; Liu, Y.; Ren, P. Geological conditions of deep coalbed methane in the eastern margin of the Ordos Basin, China: Implications for coalbed methane development. J. Nat. Gas Sci. Eng. 2018, 53, 394–402. [Google Scholar] [CrossRef]
- Wang, S.; Wang, F.; Hou, G.; Wu, X.; Zhang, C.; Zhang, Y.; Hu, Q. CBM development well type for steep seam in Fukang Baiyanghe mining area Xinjiang. J. China Coal Soc. 2014, 39, 1914–1918. [Google Scholar]
- Jiang, R.; Wang, Y.; Li, H.; Yang, M. A numerical simulation on the impact of coal seam dip on productivity of CBM horizontal well. J. China Coal Soc. 2015, 40, 151–157. [Google Scholar]
- Fu, X.; Kang, J.; Liang, S.; Gao, L.; Chen, X. Well type optimization and physical property in gas drainage process of steep inclined coal reservoir in Fukang Western Block. Coal Sci. Technol. 2018, 46, 9–16. [Google Scholar]
- Kang, J.; Fu, X.; Gao, L.; Liang, S. Production profile characteristics of large dip angle coal reservoir and its impact on coalbed methane production: A case study on the Fukang west block, southern Junggar Basin, China. J. Petrol. Sci. Eng. 2018, 171, 99–114. [Google Scholar] [CrossRef]
- Wang, C.; Peng, X.; Zhu, S.; Sun, H.; Zhang, J.; Lin, L. Coalbed methane well-type optimization and well pattern arrangement for thick coal seam with a large dip angle. Chin. J. Rock Mech. Eng. 2019, 38, 1–8. [Google Scholar]
- Reid, G.W.; Towler, B.F.; Harris, H.G. Simulation and economics of coalbed methane production in the powder river basin. In Proceedings of the SPE Rocky Mountain Regional Meeting, Casper, WY, USA, 18–21 May 1992. [Google Scholar]
- Sparks, D.P.; McLendon, T.H.; Saulsberry, J.L.; Lambert, S.W. The effects of stress on coalbed reservoir performance, Black Warrior Basin, U.S.A. In Proceedings of the SPE Annual Technical Conference and Exhibition, Dallas, TX, USA, 2–25 October 1995; Society of Petroleum Engineers, Inc.: Dallas, TA, USA, 1995. [Google Scholar]
- Pan, Z.; Connell, L.D. Modelling permeability for coal reservoirs: A review of analytical models and testing data. Int. J. Coal Geol. 2012, 92, 1–44. [Google Scholar] [CrossRef]
- Shi, J.; Durucan, S. Modelling laboratory horizontal stress and coal permeability data using S&D permeability model. Int. J. Coal Geol. 2014, 131, 172–176. [Google Scholar]
- Connell, L.D.; Lu, M.; Pan, Z.J. An analytical coal permeability model for tri-axial strain and stress conditions. Int. J. Coal Geol. 2010, 84, 103–114. [Google Scholar] [CrossRef]
- Chen, Y.; Liu, D.; Yao, Y.; Chen, L. Dynamic permeability change during coalbed methane production and its controlling factors. J. Nat. Gas Sci. Eng. 2015, 25, 335–346. [Google Scholar] [CrossRef]
- Connell, L.D. A new interpretation of the response of coal permeability to changes in pore pressure, stress and matrix shrinkage. Int. J. Coal Geol. 2016, 162, 169–182. [Google Scholar] [CrossRef]
- Zhang, S.; Liu, J.; Wei, M.; Elsworth, D. Coal permeability maps under the influence of multiple coupled process. Int. J. Coal Geol. 2018, 187, 71–82. [Google Scholar] [CrossRef]
- Shen, J.; Qin, Y.; Wang, G.; Fu, X.; Wei, C.; Lei, B. Relative permeabilities of gas and water for different rank coals. Int. J. Coal Geol. 2011, 86, 266–275. [Google Scholar] [CrossRef]
- Bertrand, F.; Cerfontaine, B.; Collin, F. A fully coupled hydro-mechanical model for the modeling of coalbed methane recovery. J. Nat. Gas Sci. Eng. 2017, 46, 307–325. [Google Scholar] [CrossRef] [Green Version]
- Clarkson, C.R.; Jordan, C.L.; Gierhart, R.R.; Seidle, J.P. Production data analysis of coalbed-methane wells. SPE Reserv. Eval. Eng. 2008, 11, 311–325. [Google Scholar] [CrossRef]
- Minkoff, S.E.; Stone, C.M.; Bryant, S.; Peszynska, M.; Wheeler, M.F. Coupled fluid flow and geomechanical deformation modeling. J. Petrol. Sci. Eng. 2003, 38, 37–56. [Google Scholar] [CrossRef]
- Wu, Y.; Liu, J.; Elsworth, D.; Miao, X.; Mao, X. Development of anisotropic permeability during coalbed methane production. J. Nat. Gas Sci. Eng. 2010, 2, 197–210. [Google Scholar] [CrossRef]
- Zhu, W.; Wei, C.; Liu, J.; Qu, H.; Elsworth, D. A model of coal-gas interaction under variable temperatures. Int. J. Coal Geol. 2011, 86, 213–221. [Google Scholar] [CrossRef]
- Fan, C.; Li, S.; Luo, M.; Yang, Z.; Zhang, H.; Wang, S. Deep CBM extraction numerical simulation based on hydraulic-mechanical-thermal coupled model. J. China Coal Soc. 2016, 41, 3076–3085. [Google Scholar]
- Li, S.; Fan, C.; Han, J.; Luo, M.; Yang, Z.; Bi, H. A fully coupled thermal-hydraulic-mechanical model with two-phase flow for coalbed methane extraction. J. Nat. Gas Sci. Eng. 2016, 33, 324–336. [Google Scholar] [CrossRef] [Green Version]
- Fan, C.; Elsworth, D.; Li, S.; Zhou, L.; Yang, Z.; Song, Y. Thermo-hydro-mechanical-chemical couplings controlling CH4 production and CO2 sequestration in enhanced coalbed methane recovery. Energy 2019, 173, 1054–1077. [Google Scholar] [CrossRef]
- Dong, J.; Chen, Y.; Jin, K.; Zhang, H.; Liu, Q.; Jiang, J.; Hu, B. Effects of diffusion and suction negative pressure on coalbed methane extraction and a new measure to increase the methane utilization rate. Fuel 2017, 197, 70–81. [Google Scholar] [CrossRef]
- Liu, J.; Chen, Z.; Elsworth, D.; Qu, H.; Chen, D. Interactions of multiple processes during CBM extraction: A critical review. Int. J. Coal Geol. 2011, 87, 175–189. [Google Scholar] [CrossRef]
- Zhang, J.; Feng, Q.; Zhang, X.; Wen, S.; Zhai, Y. Relative Permeability of Coal: A Review. Transp. Porous Med. 2015, 106, 63–594. [Google Scholar] [CrossRef]
- Müller, N. Supercritical CO2-brine relative permeability experiments in reservoir rocks-literature review and recommendations. Transp. Porous Med. 2011, 87, 367–383. [Google Scholar] [CrossRef]
- Kang, J.; Fu, X.; Liang, S.; Li, X.; Chen, X.; Wang, Z. A numerical simulation study on the characteristics of the gas production profile and its formation mechanisms for different dip angles in coal reservoirs. J. Petrol. Sci. Eng. 2019, 181, 106198. [Google Scholar] [CrossRef]
- Tao, S.; Pan, Z.; Tang, S.; Chen, S. Current status and geological conditions for the applicability of CBM drilling technologies in China: A review. Int. J. Coal Geol. 2019, 202, 95–108. [Google Scholar] [CrossRef]
- Wang, L.; Vandamme, M.; Pereira, J.M.; Dangla, P.; Espinoz, N. Permeability changes in coal seams: The role of anisotropy. Int. J. Coal Geol. 2018, 199, 52–64. [Google Scholar] [CrossRef] [Green Version]
- Wang, Z.; Pan, J.; Hou, Q.; Niu, Q.; Tian, J.; Wang, H.; Fu, X. Changes in the anisotropic permeability of low-rank coal under varying effective stress in Fukang mining area, China. Fuel 2018, 234, 1484–1497. [Google Scholar] [CrossRef]
- Koenig, R.A.; Stubbs, P.B. Interference testing of a coalbed methane reservoir. In SPE Unconventional Gas Technology Symposium; Society of Petroleum Engineers, Inc.: Louisville, KY, USA, 1986. [Google Scholar]
- Yan, Z.; Wang, K.; Zang, J.; Wang, C.; Liu, A. Anisotropic coal permeability and its stress sensitivity. Int. J. Min. Sci. Technol. 2019, 29, 507–511. [Google Scholar] [CrossRef]
- Zhao, Y.; Lin, B.; Liu, T.; Li, Q.; Kong, J. Gas flow field evolution around hydraulic slotted borehole in anisotropic coal. J. Nat. Gas Sci. Eng. 2018, 58, 189–200. [Google Scholar] [CrossRef]
- Liu, Q.; Cheng, Y.; Wang, H.; Zhou, H.; Wang, L.; Li, W.; Liu, H. Numerical assessment of the effect of equilibration time on coal permeability evolution characteristics. Fuel 2015, 140, 81–89. [Google Scholar] [CrossRef]
- An, F.; Cheng, Y.; Wang, L.; Li, W. A numerical model for outburst including the effect of adsorbed gas on coal deformation and mechanical properties. Comput. Geotech. 2013, 54, 222–231. [Google Scholar] [CrossRef]
- Ziarani, A.S.; Aguilera, R.; Clarkson, C.R. Investigating the effect of sorption time on coalbed methane recovery through numerical simulation. Fuel 2011, 90, 2428–2444. [Google Scholar] [CrossRef]
- Liu, J.; Chen, Z.; Elsworth, D.; Miao, X.; Mao, X. Evolution of coal permeability from stress-controlled to displacement-controlled swelling conditions. Fuel 2011, 90, 2987–2997. [Google Scholar] [CrossRef]
- Liu, J.; Chen, Z.; Elsworth, D.; Miao, X.; Mao, X. Evaluation of stress-controlled coal swelling processes. Int. J. Coal Geol. 2010, 83, 446–455. [Google Scholar] [CrossRef]
- Gao, F.; Xue, Y.; Gao, Y.; Zhang, Z.; Teng, T.; Liang, X. Fully coupled thermo-hydro-mechancil model for extraction of coal seam gas with slotted boreholes. J. Nat. Gas Sci. Eng. 2016, 31, 226–235. [Google Scholar] [CrossRef]
- Chen, M.; Chen, Z. Effective stress laws for multi-porosity media. Appl. Math. Mech. 1999, 20, 1207–1213. [Google Scholar]
- Wu, Y.; Liu, J.; Elsworth, D.; Siriwardane, H.; Miao, X. Evolution of coal permeability: Contribution of heterogeneous swelling processes. Int. J. Coal Geol. 2011, 88, 152–162. [Google Scholar] [CrossRef]
- Lu, S.; Cheng, Y.; Li, W. Model development and analysis of the evolution of coal permeability under different boundary conditions. J. Nat. Gas Sci. Eng. 2016, 31, 129–138. [Google Scholar] [CrossRef] [Green Version]
- Gray, I. Reservoir engineering in coal seams: Part 1-the physical process of gas storage and movement in coal seams. SPE Reserv. Eng. 1987, 2, 28–34. [Google Scholar] [CrossRef]
- Zhang, H.; Liu, J.; Elsworth, D. How sorption-induced matrix deformation affects gas flow in coal seams: A new FE model. Int. J. Rock Mech. Min. Sci. 2008, 45, 1226–1236. [Google Scholar] [CrossRef]
- Palmer, I.; Mansoori, J. How permeability depends on stress and pore pressure in coalbeds: A new model. In Proceedings of the SPE Annual Technical Conference and Exhibition, Denver, CO, USA, 6–9 October 1996. [Google Scholar]
- Palmer, I.; Mansoori, J. How permeability dependence on stress and pore pressure in coalbeds: A new model. SPEREE 1998, 1, 539–544. [Google Scholar] [CrossRef]
- Palmer, I. Permeability changes in coal: Analytical modeling. Int. J. Coal Geol. 2009, 77, 119–126. [Google Scholar] [CrossRef]
- Sun, Z.; Shi, J.; Zhang, T.; Wu, K.; Feng, D.; Sun, F.; Huang, L.; Hou, C.; Li, X. A fully-coupled semi-analytical model for effective gas/water phase permeability during coal-bed methane production. Fuel 2018, 23, 44–52. [Google Scholar] [CrossRef]
- Zhao, J.; Tang, D.; Xu, H.; Meng, Y.; Lv, Y.; Tao, S. A dynamic prediction model for gas-water effective permeability in unsaturated coalbed methane reservoirs based on production data. J. Nat. Gas Sci. Eng. 2014, 21, 496–509. [Google Scholar] [CrossRef]
- Corey, A.T. The interrelation between gas and oil relative permeability. Prod. Mon. 1954, 31, 533–546. [Google Scholar]
- Chen, D.; Pan, Z.; Liu, J.; Connell, L.D. An improved relative permeability model for coal reservoirs. Int. J. Coal Geol. 2013, 109–110, 45–57. [Google Scholar] [CrossRef]
- Xu, H.; Tang, D.; Tang, S.; Zhao, J.; Meng, Y. A dynamic prediction model for gas-water effective permeability based on coalbed methane production data. Int. J. Coal Geol. 2013, 121, 44–52. [Google Scholar] [CrossRef]
- Li, B.; Yang, K.; Xu, P.; Xu, J.; Yuan, M.; Zhang, M. An experimental study on permeability characteristics of coal with slippage and temperature effects. J. Petrol. Sci. Eng. 2019, 175, 294–302. [Google Scholar] [CrossRef]


| Parameters and Variables | Values and Units | Acquisition Approach |
|---|---|---|
| Thickness | 20 m | Field |
| Desorption time τ | 10 days | Experiments |
| Young’s Modulus of coal E | 2.19 GPa | Experiments |
| Poisson’s Ratio of coal ν | 0.33 | Experiments |
| Initial porosity for coal matrix | 0.06 | Experiments |
| Initial porosity for fracture | 0.005 | Experiments |
| Initial permeability | 5.0-0.00125 H/m mD | [16] |
| Gas dynamic viscosity | 1.84 × 10⁻⁵ Pa·s | [33] |
| Water dynamic viscosity | 1.01 × 10⁻³ Pa·s | [33] |
| Density of coal skeleton ρs | 1400 kg/m3 | [33] |
| Density of water at standard condition ρw | 1000 kg/m3 | [33] |
| Average volume weight of the rock layer | 2500 kN/m3 | - |
| Klinkenberg Factor b | 0.15 MPa | [32] |
| Reference temperature for the desorption tests of the gas Tt | 300 K | [33] |
| Langmuir pressure constant PL | 3.29 MPa | [15] |
| Langmuir volume constant VL | 0.0157 m3/kg | [15] |
| Initial water saturation | 0.8 | Estimation |
| Langmuir volumetric strain constant | 0.052 | [15] |
| Endpoint relative permeability of the water krw0 | 1.0 | History match |
| Endpoint relative permeability of the gas | 0.85 | History match |
| Irreducible water saturation | 0.25 | History match |
| Residual gas saturation | 0.15 | History match |
| Capillary pressure pcgw | 0.05 MPa | [32] |
| Molar mass of the methane Mg | 16 g/mol | [33] |
| Standard atmospheric pressure ps | 101 kPa | [33] |
| Universal gas constant R | 8.314 J/(mol·K) | [33] |
| Temperature under standard conditions Ts | 273.5 K | [33] |
| Reservoir pressure gradient | 1 MPa /100m | [16] |
| Well diameter | 0.1 m | Field |
| Bottom hole pressure | 0.2 MPa | Field |
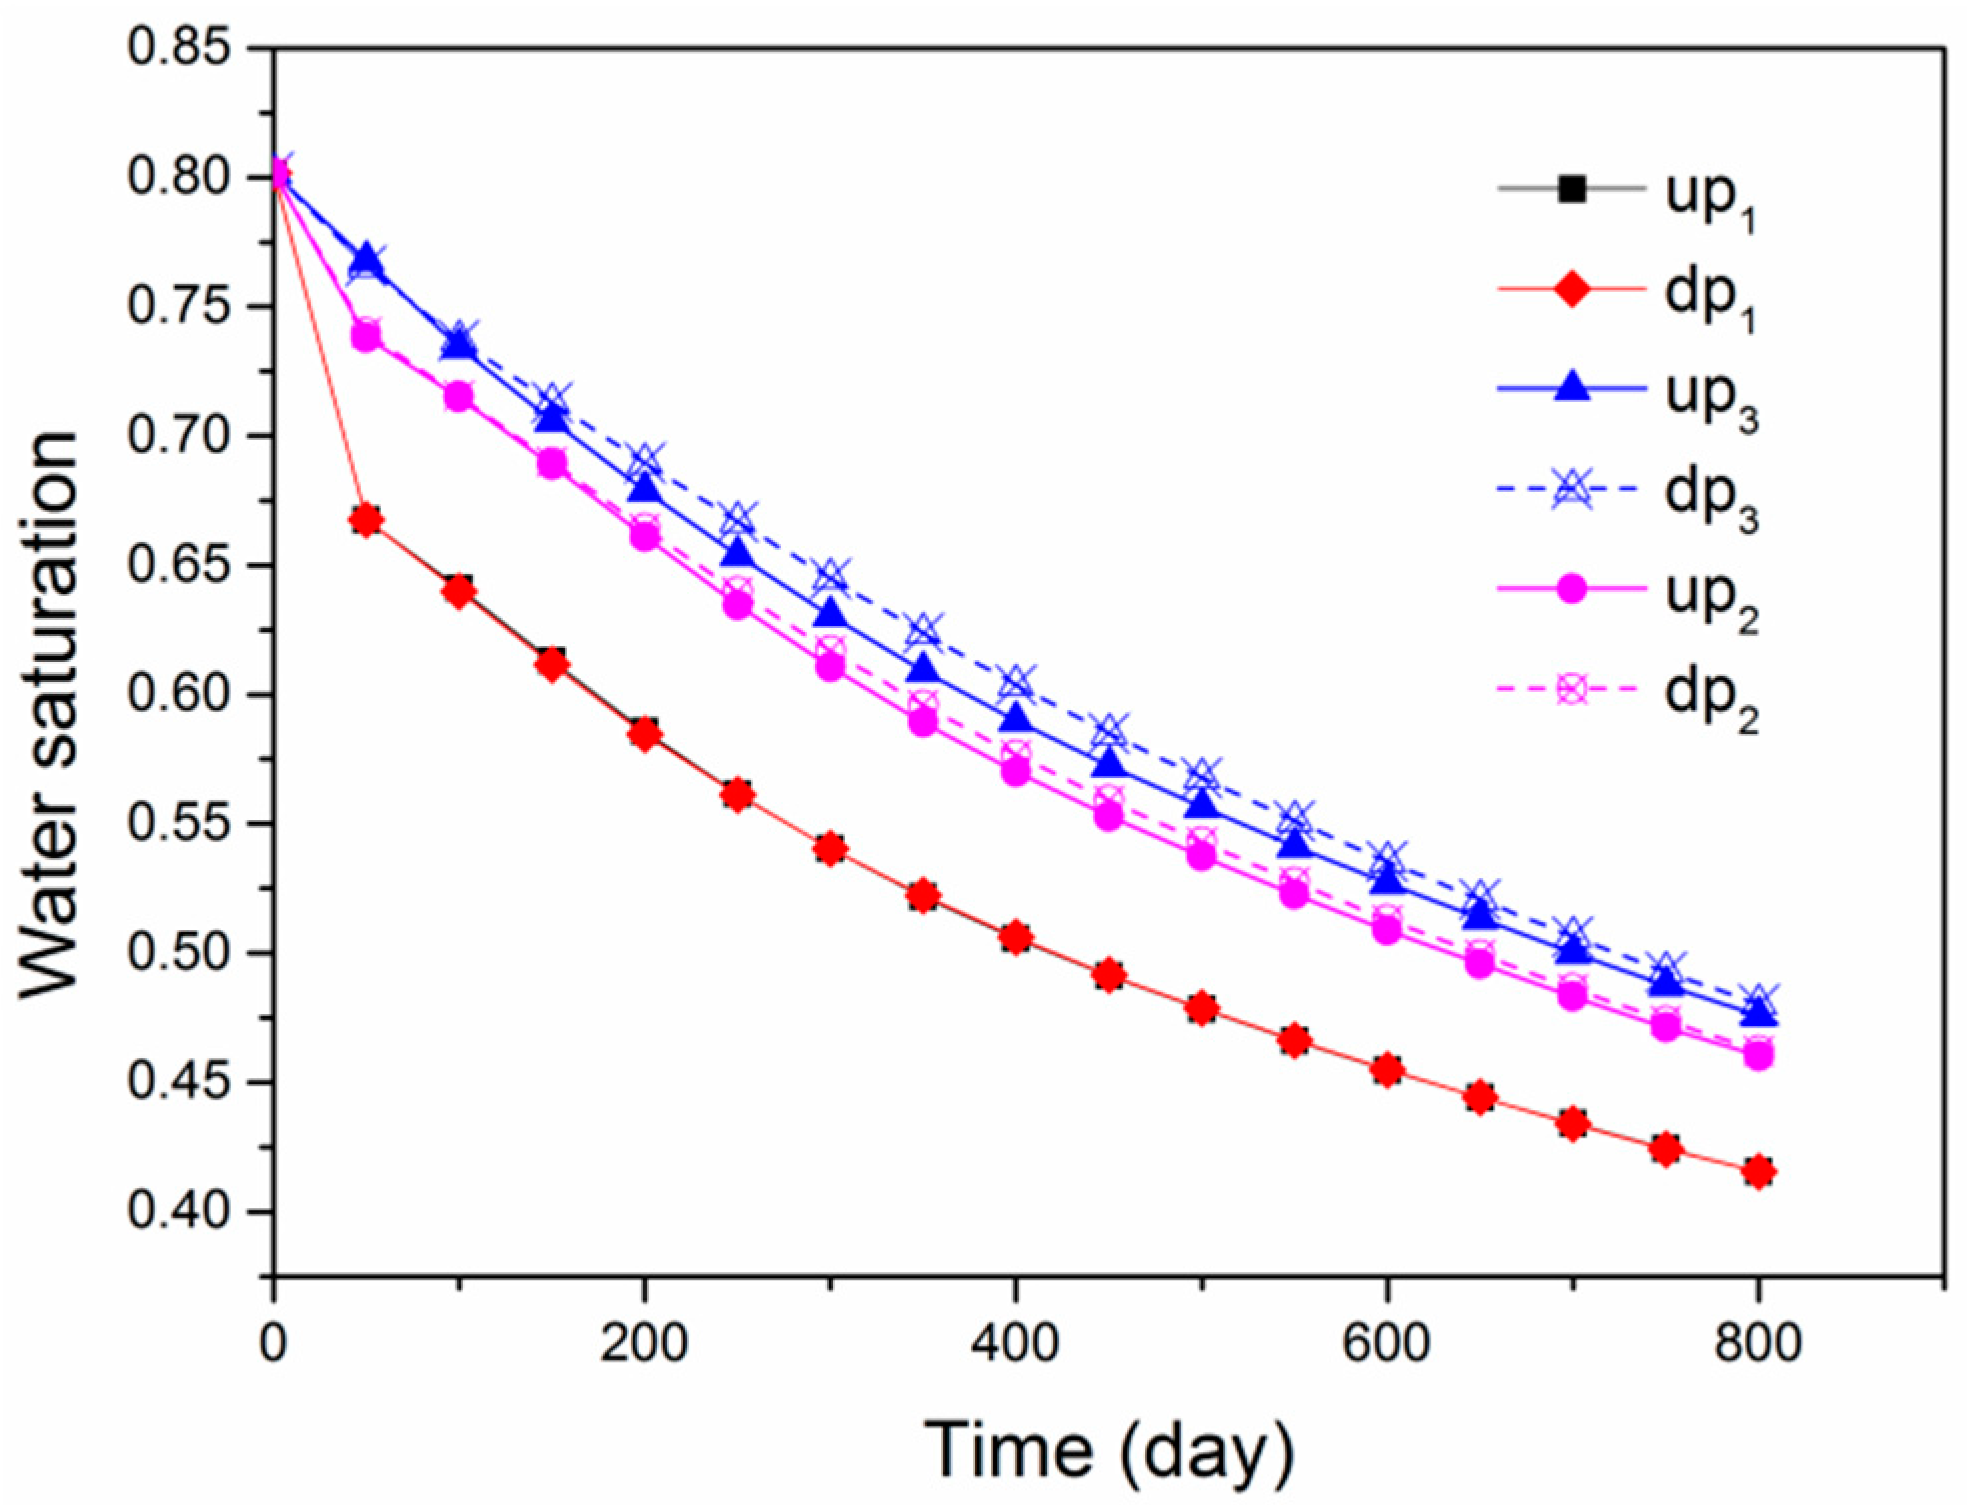
| Observation Point | Initial Pressure/MPa | 100 Days | Percentage Change | 400 Days | New Percentage Change I | 800 Days | New Percentage Change II |
|---|---|---|---|---|---|---|---|
| up1 | 8.9 | 4.87 | −45.2% | 4.49 | −7.8% | 3.18 | −29.2% |
| dp1 | 9.4 | 5.09 | −45.8% | 4.48 | −11.9% | 3.16 | −29.4% |
| up2 | 8.36 | 7.05 | −15.6% | 5.75 | −18.4% | 3.88 | −32.5% |
| dp2 | 9.98 | 8.30 | −16.8% | 5.95 | −28.3% | 3.91 | −34.3% |
| up3 | 7.71 | 7.62 | −1.16% | 6.26 | −17.8% | 4.14 | −33.9% |
| dp3 | 10.6 | 9.91 | −6.5% | 6.62 | −33.1% | 4.19 | −36.7% |
© 2020 by the authors. Licensee MDPI, Basel, Switzerland. This article is an open access article distributed under the terms and conditions of the Creative Commons Attribution (CC BY) license (http://creativecommons.org/licenses/by/4.0/).
Share and Cite
Liang, S.; Han, H.; Elsworth, D.; Fu, X.; Yao, Q.; Kang, J.; Li, X.; Li, X. Evolution of Production and Transport Characteristics of Steeply-Dipping Ultra-Thick Coalbed Methane Reservoirs. Energies 2020, 13, 5081. https://doi.org/10.3390/en13195081
Liang S, Han H, Elsworth D, Fu X, Yao Q, Kang J, Li X, Li X. Evolution of Production and Transport Characteristics of Steeply-Dipping Ultra-Thick Coalbed Methane Reservoirs. Energies. 2020; 13(19):5081. https://doi.org/10.3390/en13195081
Chicago/Turabian StyleLiang, Shun, Hao Han, Derek Elsworth, Xuehai Fu, Qiangling Yao, Junqiang Kang, Xin Li, and Xuehua Li. 2020. "Evolution of Production and Transport Characteristics of Steeply-Dipping Ultra-Thick Coalbed Methane Reservoirs" Energies 13, no. 19: 5081. https://doi.org/10.3390/en13195081