Article

Exergetic, Economic and Exergo-Environmental Analysis of Bottoming Power Cycles Operating with CO2-Based Binary Mixture

1
Department of Mechanical Engineering, International Islamic University Islamabad (IIUI), Islamabad 44000, Pakistan
2
Department of Mechanical and Industrial Engineering, Universita Degli Studi Di Brescia, via Branze 38, 25121 Brescia, Italy
3
Facultad de Ingenieria, Universidad Autonoma de Yucatan, Av. Industrias No Contaminantes por Anillo Periferico Norte, Apdo., Postal 150 Merida, Mérida 97310, Yucatan, Mexico
4
School of Mechanical, Aerospace and Automotive Engineering, Faculty of Engineering, Environmental and Computing, Coventry University, Coventry CV1 5FB, UK
5
Mechanical Engineering Department, Universiti Teknologi PETRONAS, Bandar Seri Iskandar 32610, Perak, Malaysia
6
School of Mechanical, Biomedical and Design Engineering, College of Engineering and Applied Sciences, Aston University, Aston Triangle, Birmingham B4 7ET, UK
*
Author to whom correspondence should be addressed.
Energies 2020, 13(19), 5080; https://doi.org/10.3390/en13195080
Submission received: 27 August 2020 / Revised: 25 September 2020 / Accepted: 26 September 2020 / Published: 29 September 2020
(This article belongs to the Special Issue Low-Temperature Thermodynamic Power Cycles)

Abstract

:
This study focused on investigating the bottoming power cycles operating with CO2-based binary mixture, taking into account exergetic, economic and exergo-environmental impact indices. The main intent is to assess the benefits of employing a CO2-based mixture working fluid in closed Brayton bottoming power cycles in comparison with pure CO2 working fluid. Firstly, selection criteria for the choice of suitable additive compound for CO2-based binary mixture is delineated and the composition of the binary mixture is decided based on required cycle minimum temperature. The decided CO2-C7H8 binary mixture with a 0.9 mole fraction of CO2 is analyzed in two cycle configurations: Simple regenerative cycle (SRC) and Partial heating cycle (PHC). Comparative analysis among two configurations with selected working fluid are carried out. Thermodynamic analyses at varying cycle pressure ratio shows that cycle with CO2-C7H8 mixture shows maximum power output and exergy efficiency at rather higher cycle pressure ratio compared to pure CO2 power cycles. PHC with CO2-C7H8 mixture shows 28.68% increment in exergy efficiency with the levelized cost of electricity (LCOE) 21.62% higher than pure CO2 PHC. Whereas, SRC with CO2-C7H8 mixture shows 25.17% increment in exergy efficiency with LCOE 57.14% higher than pure CO2 SRC. Besides showing lower economic value, cycles with a CO2-C7H8 mixture saves larger CO2 emissions and also shows greater exergo-environmental impact improvement and plant sustainability index.

1. Introduction

Efficiency in heat to power conversion systems is a global concern. Power-generating systems possessing improved thermodynamic, economic, and environmental performances are a top priority of researchers and manufacturers [1]. One key area for improvement is the waste heat utilization and the thermodynamics of such systems, which is getting more attention due to their ability to save energy and improved power generation, resulting in reduced fuel utilization, power production cost, and greenhouse emissions. This is the reason that the amount of power produced along with the type and the cost of technologies used for the recovery of waste heat resources are the essential elements deciding the feasibility of such technologies and resultant energy utilization.
In the past decade, several technologies for energy conversion are being studied, like air Brayton power cycles and organic Rankine power cycles (ORCs) [2,3,4,5]. However, ORCs have efficiency constraints when operating using a waste heat source at moderate (relatively higher) bottoming cycle turbine temperatures due to the limitations related to thermal and physical properties of commonly used organic working fluids [6]. In recent times, stringent developments and modifications in supercritical carbon dioxide (S-CO2) Brayton power cycles are observed due to its capacity of achieving higher thermal efficiencies when operating with low to medium range heat sources [7]. In virtue of less corrosive behavior of CO2, it can be used with relatively higher-temperature heat source applications like S-CO2 Brayton power cycles powered by nuclear heat source [8,9,10] and solar power tower [11,12]. In addition to this, CO2 provides many environmental and thermodynamic benefits, including null ozone depletion potential (ODP = 0) and minimum global warming potential (GWP = 1). CO2 is non-flammable, non-toxic, chemically inert, inexpensive, and shows low compressibility factor closer to critical point (i.e., 31 °C and 7.4 MPa). Several studies are performed on the power production potential of S-CO2 Brayton power cycles in low- and high-grade waste heat utilization applications [13,14].
As per Köppen Climate classification, the typically densely populated regions of the earth having low precipitation and elevated average ambient temperatures are categorized as BWh zones [15]. Zones such as Riyadh, Dubai, Karachi, and many parts of MENA where the highest ambient temperatures are between 40 and 50 °C and constitute 12% of Earth. For higher ambient temperatures, the cycle minimum temperature increases and a clear rise in compressor work and drop in thermal efficiency are observed, as shown in Figure 1 [16].
Therefore, the performance enhancement of S-CO2 Brayton power cycles in high ambient temperature zones can be achievable by relocating the CO2 critical point to higher temperatures by adding the second working fluid in CO2; this can be done by designing a CO2-based binary mixture [17]. Designing a CO2-based binary mixture can be performed by adding inorganic/organic compounds to relocate the mixture critical point to higher temperatures so that cycle minimum temperature can be matched with higher ambient temperature climatic conditions, especially of BWh zones [18].
Invernizzi et al. [19] analyzed Brayton power cycles powered by different CO2-based binary mixtures as operating fluids. A clear performance improvement in Brayton power cycles operating with CO2-based binary operating mixtures in comparison with pure S-CO2 Brayton power cycles is observed. Seungjoon et al. [20] investigated the performance of Brayton power cycles for hot ambient conditions operating with CO2-based binary mixtures. Authors concluded that power cycles operating with CO2/toluene and CO2/R32 binary mixtures are more efficient as compared to simple S-CO2 power cycles.
Due to intrinsic characteristics, the research on power cycles powered by CO2-based binary mixtures has been growing in the selection of working fluids and performance optimization of power cycles for both low and high-temperature heat sources [21,22]. The main challenges are the attainment of appropriate thermodynamic efficiencies, selection, and assessment of admixtures for CO2-based binary mixtures suitable for a large span of heat sources. Moreover, recent researches has been done on thermodynamic properties and thermal stability of pure and mixture working fluids [23,24,25].
Along with thermodynamic aspects, economic and environmental aspects of the power cycles should be considered for comprehensive analysis. Haroon [16] in his thesis performed comparative study and suggested that the CO2-C6F14 mixture is a better option for power generation at higher temperature ambient conditions in comparison with CO2-C7H8 mixture because it performs well in terms of exergy efficiency, less plant-specific cost and environmentally benign working fluid. Manzolini et al. [17] adopted CO2-based mixtures to improve the thermal to power conversion efficiency for solar power plants and to minimize the levelized cost of electricity. The higher conversion efficiencies and lower cost results in a 10% reduction in the levelized cost of electricity with reference to the traditional steam power cycle.
Haroon et al. [26] also conducted a detailed sensitivity analysis for energetic and exergetic efficiencies comparing the simple regenerative and partial heating bottoming power cycles applied to topping gas turbines. The partial heating cycle is suggested as a better option for power production in warm climatic conditions due to better thermodynamic performance, less overall UA, and plant-specific cost. Xia et al. [27] published research on exergo-economic and thermodynamic performances of transcritical power cycles powered by CO2-based binary mixtures. In the case of the low-temperature power cycle, the CO2/R32 mixture produces the maximum exergy efficiency of 52.85% and CO2/R161 presented the minimum levelized cost per unit of exergy product of 47.909 USD/MWh. In the case of the high-temperature power cycle, CO2/C3H8 presented the minimum levelized cost per unit of exergy product of 29.212 USD/MWh.
The utilization of CO2-based binary mixtures as working fluids in heat to power conversion systems is a possible choice due to the favorable characteristics of CO2 and the enhanced efficiency of CO2 power cycles, as mentioned earlier. It is worth noting that the CO2-based binary mixture comprised of additive compound in an appropriate composition can potentially give benefit to the design a mixture with desirable properties [18].
This study investigates the exergetic, economic, and exergo-environmental performance of two different configurations of bottoming power cycles powered by carbon dioxide-based binary mixture for warm climatic conditions. A detailed literature survey indicates that heat to power conversion systems powered by carbon dioxide-based binary mixture is not explored extensively earlier, especially for warm climatic conditions. Bottoming power cycles hold two challenges: firstly, the achievement of maximum efficiency and secondly transformation to effective work. The exhaust heat of GE-LM2500 medium-scale topping gas turbine is employed as a heat source for the comparative performance analysis of bottoming power cycles. Principal parameters considered as a selection criterion of carbon dioxide-based binary mixture are thermodynamic characteristics, heat source compliance, and HSE (health, safety and environment) properties at the first stage. At the second stage, the thermodynamic properties of the binary mixture are computed, and the reliability of the thermodynamic model is ensured. Then, the parametric analysis is conducted to recommend practical conditions (pressure ratio) for power production. Ultimately, the comparative performance analysis is conducted for power cycles operating with pure carbon dioxide and carbon dioxide-based binary mixture. Lastly, the best performing bottoming power cycle is suggested based on exergetic efficiency, energetic efficiency, exergo-environmental analysis, and CO2 emissions savings.

2. Thermodynamic, Economic and Environmental Analysis

2.1. Selection of C7H8 Additive and Properties of CO2/C7H8 Binary Mixture

This study is the extension of a previous study [26], which explored the exergetic performance gain by employing CO2/C7H8 binary mixture in CO2 bottoming power plants. In the present study, for the computation of exergetic, economic, and exergo-environmental performance of bottoming power plants powered by pure CO2 and CO2/C7H8 binary mixture, the thermodynamic properties of CO2/C7H8 binary mixture are employed from the previous study. Thermodynamic and HSE characteristics of pure CO2 and C7H8 are enclosed in Table 1. Detailed selection criteria for the organic additive in CO2 are presented in the previous study. A comprehensive section namely, “Properties of the binary mixture” including Vapor liquid equilibrium (VLE) diagrams at different temperatures, critical points, and dew and bubble lines at different compositions was already included in the previous study. In this section, the importance of toluene as an additive for designing binary mixture and EOS (equation of state) employed for the computation of thermodynamic properties of CO2/C7H8 binary mixture are discussed.
In recent times, the potential of toluene for power generation in ORCs is evaluated for biomass, combustion turbine, and internal combustion engine waste heat utilization applications [28]. Some distinguished properties of toluene are highlighted below:
  • The critical point temperature is greater than CO2, which is advantageous for the designing of a binary mixture having a high critical temperature.
  • Thermochemically stable up to 400 °C in static testing carried out within stainless steel loop [23].
  • Highly flammable having flash point temperature of 3 °C. Nevertheless, its flammability can be restrained by maintaining the lower mole fraction in binary mixture design.
  • Moderately toxic, however, its harmful impacts on humanity may potentially be reduced by using efficient filtration techniques [29].
  • Highly compatible with aluminum and stainless steel at low cycle temperatures.
Owing to favorable thermodynamic, health, safety and environment (HSE) properties, toluene is a suitable additive for designing CO2-based working fluid in bottoming power plants.
The EOS employed for pure CO2 [30,31] and C7H8 [32] are present in the literature. However, for the implementation of CO2/C7H8 binary mixture, it is vital to have adequate mixing rules as well as experimental data of thermodynamic properties of binary mixture for the fitting of the relevant equation of state parameters. To avoid the complication in model development, Peng-Robinson EOS is employed in this study for the computation of CO2/C7H8 binary mixture thermodynamic properties.
Peng-Robinson EOS is extensively used to investigate the thermodynamic properties of pure and mixed working fluids due to its enhanced predictive capability as compared to other equation of states [33,34]. In the present study, all thermodynamic calculations by using Peng-Robinson EOS are performed in the Aspen Plus simulation environment. Aspen Plus computes entropies and enthalpies by calculating the integral of residual functions [35].

2.2. Energy and Exergy Model

A medium-scale gas turbine (GE LM2500) [36] is selected as a referral topping loop for bottoming power cycles, due to thermal stability limitation (i.e., 400 °C) enforced by toluene. The particulars of the topping loop and exhaust gas component mole fractions are enclosed in Table 2.
The analysis of the topping loop is not incorporated because this study emphasizes on exergetic, environmental, and exergo-environmental performance of bottoming power cycles powered by the CO2-C7H8 binary mixture. Two plant architectures are studied for topping power loop exhaust heat utilization; namely, simple regenerative cycle (SRC) and partial heating cycle (PHC). Both architectures are presented in Figure 2. SRC is the simple architecture consists of one integrated heat exchanger (IHX) for waste heat utilization and a recuperator. This architecture is usually employed for waste heat recovery applications to conduct a comparative performance analysis with other complicated architectures. PHC is a marginally complex architecture including a stream with split after compression to enhance the heat utilization of high-temperature exhaust gases and to accomplish improved thermal matching in the recuperator. This architecture proved to be a highly ranked layout for waste heat recovery supercritical carbon dioxide power cycle applications [13,37,38]; therefore, this architecture is selected in this study for bottoming power cycles powered by CO2-C7H8 binary mixture.
Power cycle modeling and specifications are performed by using the ASPEN plus V9 process simulation tool [39]. The minimum temperature difference approach (MITA) is employed for the modeling of recuperator and IHX. According to this approach, the heat exchanger is divided into several internal zones, calculates temperature differences per zone by employing energy balance, and converges the temperatures at design MITA value. This approach is more reliable in comparison with traditional methods that assume the effectiveness of a heat exchanger and calculate the exit temperatures by considering the whole heat exchanger as a black box. In addition to this, the MITA approach provides the conditions of pinch point occurrence within the heat exchanger. Finally, the total UA of the heat exchanger is computed by the summation of the individual UA of each zone.
The range of P.R for sensitivity analysis is set from 2 to 4.4. The parameters studied are energy efficiency, exergy efficiency, mass flow rate of working fluid, heat recovery, net power produced, overall UA (sum of UA of all heat exchangers including IHX1, IHX2, recuperator and cooler), exergy destruction ratio, total components cost, plant-specific cost, levelized cost of electricity and CO2 emissions savings. Recommended P.R for all four cycles are decided based on maximum exergy efficiency and power output. In addition to this, exergy destruction and cost of individual components of power cycles are also investigated. Finally, exergy destruction (irreversibilities) in the components of power cycles operating with 0.9CO2 + 0.1C7H8 binary mixture at the recommended P.R is also investigated.

2.2.1. Energetic Analysis

The thermodynamic model employed to examine the energetic performance of the bottoming power cycles is reported in this section. The energy balance computations are performed by using ASPEN and accompanied by computation of energetic efficiency ( η I ) and net power ( W n e t ˙ ) using Equations (1) and (2).
η I = W n e t ˙ Q i n ˙
where
W n e t ˙ = W t ˙ W c ˙
and ( Q i n ˙ ) is the net heat recovered from the exhaust gas stream of the topping power cycle.

2.2.2. Exergetic Analysis

To evaluate the exergetic performance of the bottoming power cycles, the exergy flow rate of every stream is computed and exergy destruction in power cycle components is determined by employing exergy balance [40]. Table 3 enclosed the exergy balance relations of each power cycle component.
Relations for exergetic efficiency ( η I I ), total exergy destroyed ( E ˙ d ), net exergy in ( E ˙ n e t , i n ) and exergy destruction ratio ( E ˙ d ,   r a t i o ) are presented in Equations (3)–(6) as follows:
η I I = 1   E ˙ d E ˙ n e t , i n
E ˙ d = E ˙ d , c + E ˙ d , t + E ˙ d , r e c + E ˙ d , c o n d + E ˙ d , I H X 1 + E ˙ d , I H X 2
E ˙ n e t ,   i n = E ˙ x , e x h i n E ˙ x , e x h o u t
E ˙ d ,   r a t i o = E ˙ d E ˙ n e t , i n
Table 3. Exergy balance rate equations for components of the sCO2 bottoming power cycles. Adapted from [26].
ComponentExergy Rate Balance EquationsEq. No
Compressor E ˙ d , C = W ˙ C + E ˙ x , 1 E ˙ x , 2 (7)
Turbine E ˙ d , T = W ˙ T + E ˙ x , 3 E ˙ x , 4 (8)
Recuperator E ˙ d , r e c = E ˙ x , 5 E ˙ x , 9 + E ˙ x , 4 E ˙ x , 6 (9)
Condenser E ˙ d , c o n d = E ˙ x , 6 E ˙ x , 1 + E ˙ x , A i r   i n E ˙ x , A i r   o u t (10)
IHX-1 E ˙ d , I H X 1 = E ˙ x , e x h i n E ˙ x , e x h o u t , i + E ˙ x , 10 E ˙ x , 3 (11)
IHX-2 E ˙ d , I H X 2 = E ˙ x , e x h i n , i E ˙ x , e x h o u t + E ˙ x , 7 E ˙ x , 8 (12)

2.2.3. Air Condenser Modeling

For the modeling of bottoming power cycles air condenser, a specific value of temperature difference is considered at the exit stream of condenser, i.e., 10 °C, and the minimum cycle temperature ( T min ) or entry temperature of the compressor is computed using
T min = T a m b + 10   ° C
This model is advantageous to evade a highly low pinch point temperature difference (PPTD) in air condenser for the period of changing ambient temperatures ( T a m b ) [4].

2.3. Economic Analysis

To assess the economic significance of different architectures analyzed, two economic indicators are considered, namely plant-specific cost (PSC) and levelized cost of electricity (LCOE).

2.3.1. Plant-Specific Cost

The PSC is the basic indicator providing the unitary cost of the power production system in terms of USD/kWe and can provide a qualitative concept to compare the cost of similar systems.
PSC is defined as
P S C = C t o t a l w ˙ n e t
In Equation (14), the numerator ( C t o t a l ) provides the capital investment cost of the power production system including total cost of cycle components, cost of auxiliaries, and installation costs (Equation (15)). The models employed for computing capital investment costs of individual cycle components are presented in Equations (16)–(20).
C t o t a l = ( C t + C c + C R e c u p + C   C o n d e n s e r + C I H X 1 + C I H X 2 )   C i n s t
C I H X = 17.5   ( U A   [ W / K ] ) 0.8778
C R e c u p = 5.2   ( U A   [ W / K ] ) 0.8993
C C o n d e n s e r = 76.25   ( U A   [ W / K ] ) 0.8919
C t = 479.34   m ˙ t   ( 1 0.93 η t )   l n   ( P . R t )   ( 1 + e x p   ( 0.036   T I T 54.4 ) )
C c = 71.1   m ˙ c   ( 1 0.92 η c ) ( P . R c )   l n   ( P . R c )
The power plant installation cost is considered as a multiplier of investment cost equivalent to 30% [41]. This coefficient covers the cost of auxiliaries, i.e., motorized valves, refrigeration compressors to remove the drain and electrical connections, etc.

2.3.2. Levelized Cost of Electricity

Unlike PSC, the LCOE is rather a more comprehensive economic indicator that permits to evaluate the profitability level of investment value for a power production system. The LCOE assesses the average price for electricity production from a power plant. This indicator can be computed by using Equation (21) in terms of the proportion of the present Value of plant Expenses ( P V E ) including plant power production over its whole operating time. Operating time includes the net power produced, plant utilization factor ( u ), and the lifetime ( N Y ). These parameter values are enclosed in Table 4 [40].
LCOE = P V E 8760   u   N Y   w ˙ n e t
The formulation for PVE is stated in Equation (22), which includes the cash flow calculations of the plant expenditures by using Equation (23). In this research, operations and maintenance cost of one kWe power installed is taken into consideration by using parameter O M whereas the escalation rate for this cost is taken into consideration by using coefficient e r . These pieces of information are enclosed in Table 4 including the discount rate ( r ).
P V E = C t o t   k = 1 N Y C F X p , k ( 1 + r ) k
C F x , p k = w ˙ n e t   ( O M   ( 1 + e r ) k )

2.4. Exergo-Environmental Analysis

In the current century, it is important to perform a detailed environmental analysis of the power production systems under investigation to assure that they have a least or no harmful effects on the atmosphere. This portion of the paper combines exergetic and environmental analysis to display a modern type of research called exergo-environmental analysis. It is established based on exergetic analysis and considers exergy efficiency and exergy destruction to measure its impact on the environment. Exergo-environmental analysis comprises six indicators, namely, exergo-environmental impact factor, exergo-environmental impact coefficient, exergo-environmental impact index, exergo-environmental impact improvement, exergetic stability factor, and exergetic sustainability index [42,43].

2.4.1. Exergo-Environmental Impact Factor

The exergo-environmental impact factor ( f e i ) identifies the positive impact of the system under investigation on the atmosphere. The reason of considering this indicator is that it assists to minimize the environmental impact of the power production system by reducing the irreversibilities in the system.
The ideal value of f e i is zero, which means that the system possesses no irreversibility. It is the ratio of total exergy rate destroyed ( E ˙ x d e s t , t o t ) by the system and total exergy rate provided to the system ( E ˙ x i n ) as defined in Equation (24).
f e i =   E ˙ x d e s t , t o t E ˙ x i n

2.4.2. Exergo-Environmental Impact Coefficient

The exergo-environmental impact coefficient ( C e i ) is associated with exergy efficiency ( η e x ) of the system. The ideal value of this indicator must be one, demonstrating that the system under consideration is working in ideal circumstances with zero exergy destruction. This indicator is formulated as (Equation (25)).
C e i = 1 η e x 100

2.4.3. Exergo-Environmental Impact Index

The exergo-environmental impact index ( θ e i ) is a significant indicator to study, since it shows whether the system subjected to investigation harms the environment by its unproductive waste exergy and exergy destroyed or not. Its desired value must be as minimum as possible. It is the product of ( f e i ) and ( C e i ) as defined below in Equation (26).
θ e i = f e i × C e i

2.4.4. Exergo-Environmental Impact Improvement

The exergo-environmental impact improvement ( θ e i i ) indicator supports to find the environmental suitability of the system under study. To enhance the environmental suitability level of the analyzed system, its ( θ e i ) value should be reduced. A large value of ( θ e i i ) means, the system is highly beneficial for the environment and is formulated as (Equation (27)).
θ e i i = 1 θ e i

2.4.5. Exergetic Stability Factor

The exergetic stability factor ( f e s ) depends on the total exergy out ( E ˙ x t o t , o u t ), total exergy destroyed ( E ˙ x d e s t , t o t ) and exergy wasted by unproductive fuel ( E ˙ x u u ) as shown in Equation (28). The required value of this indicator should be nearest to one.
f e s = E ˙ x t o t , o u t E ˙ x t o t , o u t + E ˙ x d e s t , t o t + E ˙ x u u

2.4.6. Exergetic Sustainability Index

The exergetic sustainability index ( θ e s t ) is the product of ( f e s ) and ( θ e i i ) of the power production system as enclosed in Equation (29). The required value of this indicator needs to be as higher as possible.
θ e s t = f e s × θ e i i

2.5. CO2 Emissions Savings

Bottoming supercritical carbon dioxide power cycles do not produce any harmful emissions because they are closed-loop power production systems. As a consequence of waste heat utilization, they can benefit the earth ecosystem in terms of minimizing greenhouse emissions compared to fossil fuel power plants of the same power production. For the assessment of environmental impacts, the bottoming supercritical carbon dioxide power cycles examined in this study are compared with the fossil fuel plant of similar power output. The savings in CO2 emissions for a unit hour is evaluated by employing the following relation.
M CO 2   =   α CO 2 × W ˙ n e t
In Equation (30), α CO 2 is the measure of CO2 emitted from fossil fuel power-generating systems for 1 kWh production. This parameter is computed by using Equation (31). The average operating heat rate ( H R N a t u r a l   g a s ) and emissions factor ( E F N a t u r a l   g a s ) of natural gas are extracted from the updated data accessible on the U.S. Energy Information Administration website [44]. From the updated data, the H R N a t u r a l   g a s and E F N a t u r a l   g a s values are 7821 Btu/kWh and 53.07 kgCO2/millions-Btu, respectively.
α CO 2 = H R N a t u r a l   g a s × E F N a t u r a l   g a s

3. Results and Discussion

This section presents the 4E (Energy, Exergy, Economic and Environment) analysis of bottoming power cycles (SRC and PHC) operating with pure CO2 and 0.9CO2 + 0.1C7H8 binary mixture as working fluids. It is essential to study the effect of key performance indicators and their influence on power production. For the sake of fair comparison between four types of power cycles and taking into consideration that exhaust gases of GE LM2500 [36] topping gas turbine is used as a heat source for power generation, the input operating (base) conditions are shown in Table 5.
Figure 3, Figure 4, Figure 5, Figure 6, Figure 7, Figure 8, Figure 9 and Figure 10 demonstrate the results of the comparative study of the four bottoming power cycles. Three types of comparative studies are performed, i.e., (1) comparative study between pure CO2 bottoming power cycles (CO2 SRC vs. CO2 PHC); (2) comparative study between SRCs operating with pure CO2 and CO2-based binary mixture (CO2 SRC vs. 0.9CO2/0.1C7H8 SRC); (3) comparative study between PHCs operating with pure CO2 and CO2-based binary mixture (CO2 PHC vs. 0.9CO2/0.1C7H8 PHC); cycle minimum pressure (Pmin) is the saturation pressure (bubble pressure) at the cycle minimum temperature (Tmin) in case of power cycles operating with 0.9CO2/0.1C7H8 binary mixture. Dead state temperature (313 K) is the average ambient temperature taken from the data of BWh climatic zone regions.

3.1. Comparison between CO2 SRC and CO2 PHC

Figure 3 illustrates the exergy efficiency and exergy destruction ratio of both SRC and PHC operating with pure CO2 as the working fluid. In both configurations, the exergy efficiency and exergy destruction ratios show an inverse relationship with each other. It can be observed that maximum exergetic performance occurs at the pressure ratio of 2.8 for CO2 SRC. For CO2 PHC, maximum exergetic performance occurs at the pressure ratio of 3.1. Therefore, these two pressure ratios are recommended to achieve maximum cycles’ performance. The exergetic performance of SRC is higher than PHC mainly due to the larger exergy destruction ratio in PHC components.
Figure 4 shows the performance curves of power output, plant-specific cost, and levelized cost of electricity for both SRC and PHC operating with pure CO2 with respect to pressure ratio. Both the plant-specific cost and the levelized cost of electricity show inverse relation with the power output of power cycles. It can be observed that maximum power output occurs at the pressure ratio of 2.8 for CO2 SRC. For CO2 PHC, maximum power output occurs at the pressure ratio of 3.1 as in the case of exergy efficiency. The power output of SRC is higher than PHC with less plant-specific cost and the levelized cost of electricity at all pressure ratios.

3.2. Comparison between CO2 SRC and 0.9CO2/0.1C7H8 SRC

Figure 5 presents the exergy efficiency and exergy destruction ratio of both SRCs operating with pure CO2 and 0.9CO2/0.1C7H8 as working fluids. In both power cycles, exergy efficiency and exergy destruction ratio show an inverse relationship with each other. It can be observed that maximum exergetic performance occurs at the pressure ratio of 4.1 for 0.9CO2/0.1C7H8 SRC. Therefore, this pressure ratio is recommended to achieve maximum cycle performance. The exergetic performance of 0.9CO2/0.1C7H8 SRC is higher than pure CO2SRC mainly due to the larger exergy destruction ratio in CO2SRC components.
Figure 6 shows the behavior of power output, plant-specific cost, and levelized cost of electricity for both SRCs operating with pure CO2 and 0.9CO2/0.1C7H8 as working fluids for varying pressure ratio. Both the plant-specific cost and the levelized cost of electricity show a decreasing trend with the increase in pressure ratio in the case of 0.9CO2/0.1C7H8 SRC. It can be observed that maximum power output occurs at the pressure ratio of 4.1 for 0.9CO2/0.1C7H8 SRC as in the case of exergy efficiency. It is evident that the power output of 0.9CO2/0.1C7H8 SRC is higher than pure CO2 SRC at the expense of high plant-specific cost and the levelized cost of electricity at all pressure ratios. In the case of 0.9CO2/0.1C7H8 SRC, a very high values of plant-specific cost and levelized cost of electricity is also visible at lower pressure ratios, which is the sign of very low minimum temperature (MITA) in the cooler, resulting in very high UA values and economic indicators. Therefore, low values of pressure ratios are not suitable for the operation of bottoming power cycles operating with a CO2-based binary mixture.

3.3. Comparison between CO2 PHC and 0.9CO2/0.1C7H8 PHC

Figure 7 presents the exergy efficiency and exergy destruction ratio of both PHCs operating with pure CO2 and 0.9CO2/0.1C7H8 as working fluids. In both power cycles, exergy efficiency and exergy destruction ratio show an inverse relationship with each other. It can be observed that maximum exergetic performance occurs at the pressure ratio of 4.4 for 0.9CO2/0.1C7H8 PHC. Therefore, this pressure ratio is recommended to achieve maximum cycle performance. The exergetic performance of 0.9CO2/0.1C7H8 PHC is better than pure CO2PHC mainly due to the larger exergy destruction ratio in CO2PHC components.
Figure 8 shows the behavior of power output, plant-specific cost, and levelized cost of electricity for both PHCs operating with pure CO2 and 0.9CO2/0.1C7H8 as working fluids for varying pressure ratio. Both plant-specific cost and levelized cost of electricity show a decreasing trend with the increase in pressure ratio in the case of 0.9CO2/0.1C7H8 PHC. It can be observed that maximum power output occurs at the pressure ratio of 4.4 for 0.9CO2/0.1C7H8 PHC as in the case of exergy efficiency. It is evident that the power output of 0.9CO2/0.1C7H8 PHC is higher than pure CO2 PHC at the expense of high plant-specific cost and the levelized cost of electricity at all pressure ratios.
Component wise exergy destruction in power cycles (SRC and PHC) operating with 0.9CO2/0.1C7H8 binary mixture at recommended pressure ratios is illustrated in Figure 9. In both power cycles, maximum exergy is destroyed in cooler. The reason behind this is the large temperature differences between hot and cold stream in the cooler at higher pressure ratios. The second highest exergy destruction component is the turbine for both power cycles due to large turbine work at higher pressure ratios. A greater number of components and very high exergy destruction in the cooler results in a lower exergy efficiency of the PHC compared to SRC, as discussed earlier.
The trend of CO2 emissions savings at varying pressure ratio for both working fluids is shown in Figure 10. SRC with CO2/C7H8 shows maximum savings owing to larger power output in a bottoming cycle. Whereas, both cycle configurations with pure CO2 comparatively show lower CO2 emissions savings especially at higher pressure ratios.
The summary of thermodynamic, economic and environmental results of the considered power cycles with their corresponding recommended pressure ratios are shown in Table 6 and Table 7. Power cycles operating with the CO2-C7H8 mixture show greater power output, exergy efficiency, smaller mass flow rates yet at the expense of larger levelized cost of electricity compared to cycles with pure CO2 working fluid. In terms of environmental impact and sustainability indices, cycles operating with CO2-C7H8 mixture show significant improvement, as is evident from Table 7.
An exhaustive comparison with other thermodynamic power cycles like steam Rankine cycles and organic Rankine cycles is also essential yet difficult because of different design parameters assumed by different authors and different type of sensitivity analysis. Meanwhile, there are some recent studies that deal with a comparative analysis of sCO2 and other traditional power cycles. Manente et al. [45] presented a thorough thermo-economic comparison among different sCO2 cycle layouts for waste heat recovery. There is another current work by Ayub et al. [25] which focuses on thermodynamic comparison between sCO2 cycles and organic Rankine cycles for high temperature waste heat recovery. The work suggests CO2-R134a binary mixture as working fluid in simple recuperative cycle layout owing to higher thermodynamic performance, lower recuperator and turbine sizes and lower maximum operating pressures compared to sCO2 cycle and organic Rankine cycle with R134a working fluid.

4. Conclusions

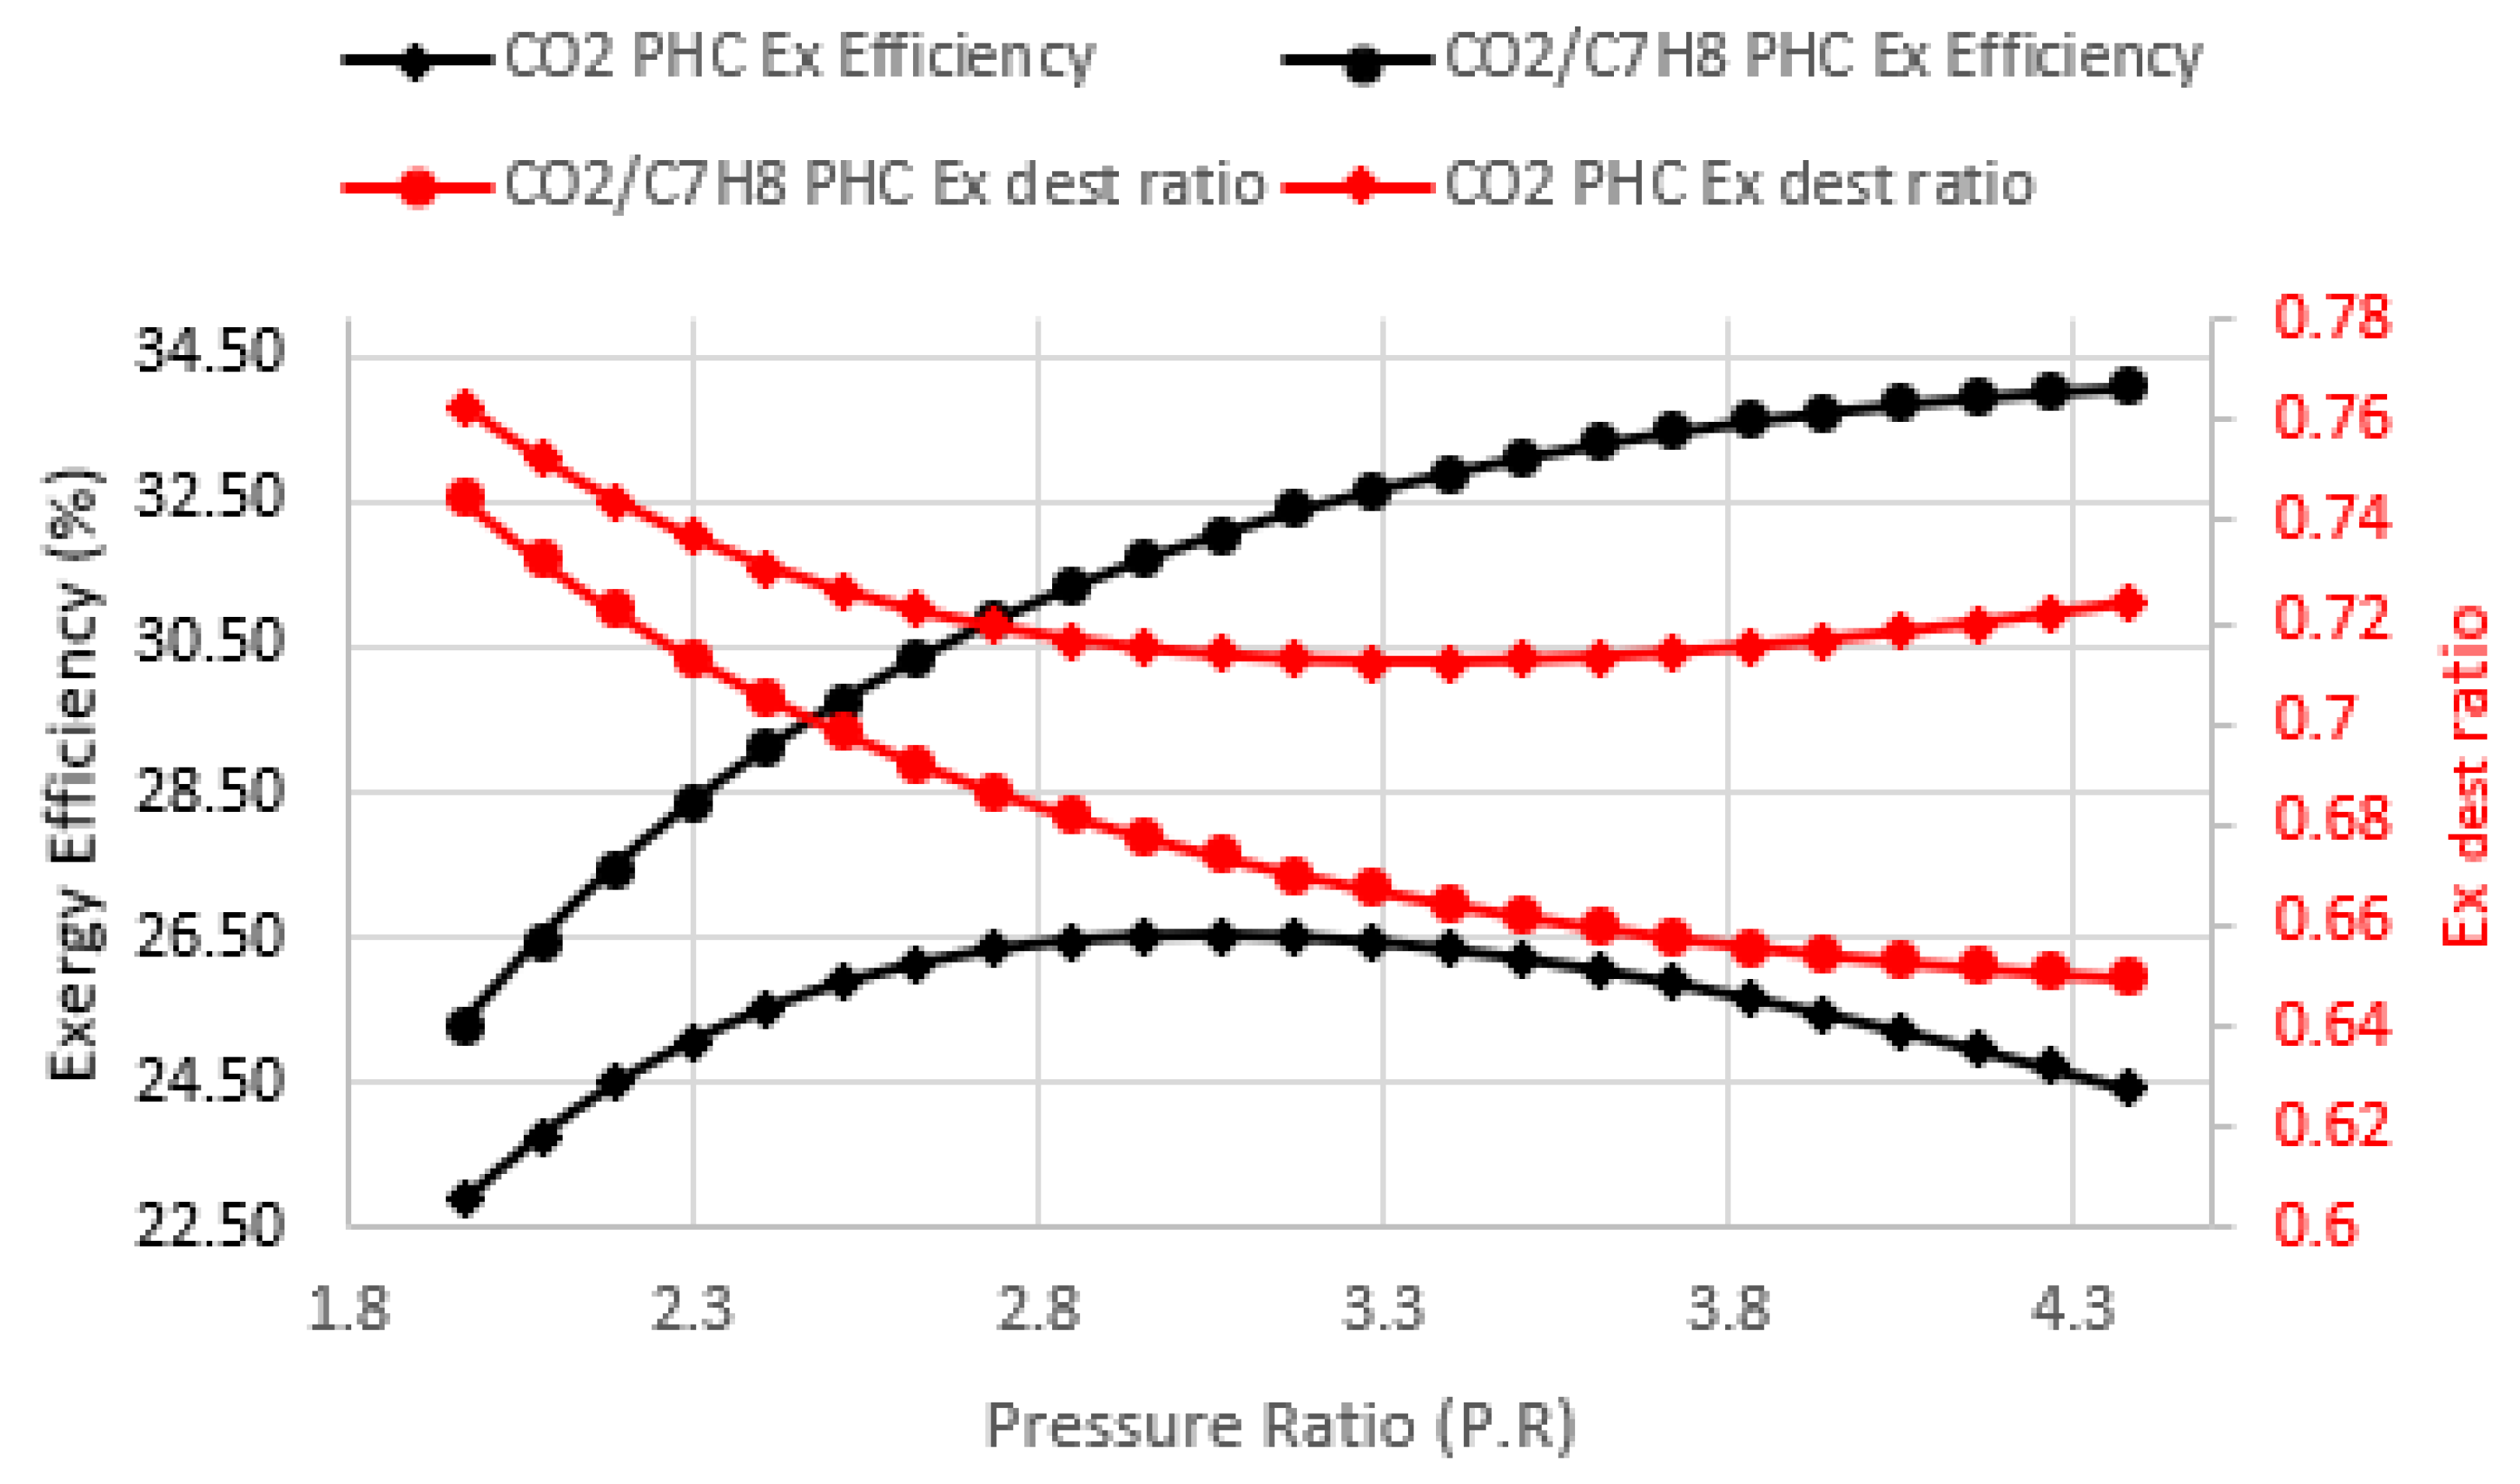
This study analyzes the performance of bottoming power cycles with pure CO2 and CO2-C7H8 mixture as working fluid taking into account the thermodynamic, economic and environmental indices. Thermodynamic analysis at varying cycle pressure ratios show that a cycle with CO2-C7H8 mixture shows maximum power output and exergy efficiency at rather higher cycle pressure ratio compared to pure CO2 power cycles. However, the required mass flowrates of CO2-C7H8 mixture are smaller than pure CO2.
Due to larger heat recovery and exergy efficiency, cycles with a CO2-C7H8 mixture saves larger CO2 emissions, also showing greater exergy-environmental impact improvement, and plant sustainability index. On the contrary, economic analysis shows higher plant-specific cost and levelized cost of electricity mainly due to higher operating pressure ratios and larger recuperator and cooler sizes.
In particular, PHC with CO2-C7H8 mixture shows 28.68% increment in exergy efficiency with LCOE 21.62% higher than pure CO2 PHC. In additions, SRC with CO2-C7H8 mixture shows 25.17% increment in exergy efficiency with LCOE 57.14% higher than pure CO2 SRC.
The key outcome of this work is the better exergy efficiency and environmental sustainability benefit by using CO2-C7H8 binary mixture in bottoming sCO2 cycles. However, the rise in cycle-specific and levelized costs of electricity in the case of CO2-C7H8 working fluid is demanding. Therefore, more comprehensive research studying some new CO2 mixtures in bottoming sCO2 cycles is required. The study on new CO2 mixtures requires experimental VLE properties to optimize the parameters of equation of state (EOS) and information about thermal stability and transport properties of the pure fluids and mixtures.

Author Contributions

Conceptualization, M.H.; methodology, M.H., A.A.; software, M.H.; investigation, M.H., N.A.S., A.A.; writing—original draft preparation, M.H., N.A.S., A.A., R.T.; revision and final editing, A.T.B., M.H., F.S., M.I. All authors have read and agreed to the published version of the manuscript.

Funding

This research received no external funding.

Conflicts of Interest

The authors declare no conflict of interest.

Abbreviations

The following abbreviations, symbols and subscripts are used in this manuscript:
CinstInstallation cost
EFEmission factor (kgCO2/millions-Btu)
EOSEquation of state
GEGeneral electric
GWPGlobal warming potential
HRHeat rate (Btu/kWh)
HSEHealth safety and environment
IHXIntegrated heat exchanger
LCOELevelized cost of electricity (USD/kWe)
MITAMinimum temperature approach (K)
MUSDMega Us dollars
ODPOzone depletion potential
ORCOrganic Rankine cycle
PSCPlant-specific cost (USD/kWe)
PHCPartial heating cycle
P.RPressure ratio
SRCSimple regenerative cycle
TITTurbine inlet temperature (K)
S-CO2Supercritical carbon dioxide
ToDead state temperature (K)
PPTDPinch point temperature difference (K)
NYPlant life (years)
OMOperation and maintenance cost (USD/kWe)
QinNet heat recovered (kW)
η I Energy efficiency (%)
η I I Exergy efficiency (%)
VLEVapor liquid equilibrium
WnetPower output (kW)
RecupRecuperator
CCost (MUSD)
xMass split ratio
ambAmbient
condCondenser
PVEPresent value of plant expenses (USD)
totTotal
tTurbine
cCompressor
minMinimum
erOperation and maintenance escalation rate (%)
uPlant utilization factor (%)
rDiscount rate (%)
CFCash flow
xpexpenditure
TTemperature (K)
expExponent
crCritical
1, 2, 3Numbers specifying various points in the power cycles

References

  1. Siddiqui, M.E.; Almitani, K.H. Proposal and Thermodynamic Assessment of S-CO2 Brayton Cycle Layout for Improved Heat Recovery. Entropy 2020, 22, 305. [Google Scholar] [CrossRef] [Green Version]
  2. Ahmadi, M.H.; Chau, K.-W.; Sadeghzadeh, M.; Pourfayaz, F.; Ghazvini, M.; Ming, T.; Meyer, J.P.; Sharifpur, M. Thermodynamic and economic analysis of performance evaluation of all the thermal power plants: A review. Energy Sci. Eng. 2019, 7, 30–65. [Google Scholar] [CrossRef]
  3. Invernizzi, C.M.; Ayub, A.; Di Marcoberardino, G.; Iora, P. Pure and Hydrocarbon Binary Mixtures as Possible Alternatives Working Fluids to the Usual Organic Rankine Cycles Biomass Conversion Systems. Energies 2019, 12, 4140. [Google Scholar] [CrossRef] [Green Version]
  4. Mohammadi, K.; McGowan, J.G. Thermoeconomic analysis of multi-stage recuperative Brayton cycles: Part II—Waste energy recovery using CO2 and organic Rankine power cycles. Energy Convers. Manag. 2019, 185, 920–934. [Google Scholar] [CrossRef]
  5. Saghafifar, M.; Gadalla, M. A critical assessment of thermo-economic analyses of different air bottoming cycles for waste heat recovery. Int. J. Energy Res. 2018, 43, 1315–1341. [Google Scholar] [CrossRef]
  6. Invernizzi, C.M.; Bonalumi, D. Thermal Stability of Organic Fluids for Organic Rankine Cycle Systems; Elsevier Ltd.: Amsterdam, The Netherlands, 2016. [Google Scholar]
  7. Feher, E. The supercritical thermodynamic power cycle. Energy Convers. 1968, 8, 85–90. [Google Scholar] [CrossRef]
  8. Dostal, V.; Driscoll, M.J.; Hejzlar, P. A Supercritical Carbon Dioxide Cycle for Next Generation Nuclear Reactors. Ph.D. Thesis, Massachusetts Institute of Technology, Cambridge, MA, USA, 2004. [Google Scholar]
  9. Kulhánek, M.; Dostál, V. Thermodynamic Analysis and Comparison of Supercritical Carbon Dioxide Cycles. In Proceedings of the SCCO2 Power Cycle Symposium, Boulder, CO, USA, 24–25 May 2011; pp. 1–7. [Google Scholar]
  10. Yoon, H.J.; Ahn, Y.; Lee, J.I.; Addad, Y. Potential advantages of coupling supercritical CO2 Brayton cycle to water cooled small and medium size reactor. Nucl. Eng. Des. 2012, 245, 223–232. [Google Scholar] [CrossRef]
  11. Al-Sulaiman, F.A.; Atif, M. Performance comparison of different supercritical carbon dioxide Brayton cycles integrated with a solar power tower. Energy 2015, 82, 61–71. [Google Scholar] [CrossRef]
  12. Wang, K.; He, Y.-L.; Zhu, H.-H. Integration between supercritical CO 2 Brayton cycles and molten salt solar power towers: A review and a comprehensive comparison of different cycle layouts. Appl. Energy 2017, 195, 819–836. [Google Scholar] [CrossRef]
  13. Ayub, A.; Sheikh, N.A.; Tariq, R.; Khan, M.M.; Invernizzi, C.M. Exergetic optimization and comparison of combined gas turbine supercritical CO2 power cycles. J. Renew. Sustain. Energy 2018, 10, 044703. [Google Scholar] [CrossRef]
  14. Manente, G.; Costa, M. On the Conceptual Design of Novel Supercritical CO2 Power Cycles for Waste Heat Recovery. Energies 2020, 13, 370. [Google Scholar] [CrossRef] [Green Version]
  15. Kottek, M.; Grieser, J.; Beck, C.; Rudolf, B.; Rubel, F. World Map of the Köppen-Geiger climate classification updated. Meteorol. Z. 2006, 15, 259–263. [Google Scholar] [CrossRef]
  16. Haroon, M. Thermodynamic Analysis of Bottoming Power Cycles Using Supercritical CO2-Based Binary Mixtures as Working Fluids; International Islamic University Islamabad: Islamabad, Pakistan, 2019. [Google Scholar]
  17. Manzolini, G.; Binotti, M.; Bonalumi, D.; Invernizzi, C.; Iora, P. CO2 mixtures as innovative working fluid in power cycles applied to solar plants. Techno-economic assessment. Sol. Energy 2019, 181, 530–544. [Google Scholar] [CrossRef]
  18. Invernizzi, C.M. Prospects of Mixtures as Working Fluids in Real-Gas Brayton Cycles. Energies 2017, 10, 1649. [Google Scholar] [CrossRef] [Green Version]
  19. Invernizzi, C.M.; Van Der Stelt, T. Supercritical and real gas Brayton cycles operating with mixtures of carbon dioxide and hydrocarbons. Proc. Inst. Mech. Eng. Part A J. Power Energy 2012, 226, 682–693. [Google Scholar] [CrossRef]
  20. Baik, S.; Lee, J.-I. Preliminary Study of Supercritical CO2 Mixed With Gases for Power Cycle in Warm Environments. In Proceedings of the ASME Turbo Expo 2018: Turbomachinery Technical Conference and Exposition, Lillestrøm, Norway, 11–15 June 2018. [Google Scholar]
  21. Liu, X.; Xu, Z.; Xie, Y.; Yang, H. CO2-based mixture working fluids used for the dry-cooling supercritical Brayton cycle: Thermodynamic evaluation. Appl. Therm. Eng. 2019, 162, 114226. [Google Scholar] [CrossRef]
  22. Wu, C.; Wang, S.-S.; Jiang, X.; Li, J. Thermodynamic analysis and performance optimization of transcritical power cycles using CO2-based binary zeotropic mixtures as working fluids for geothermal power plants. Appl. Therm. Eng. 2017, 115, 292–304. [Google Scholar] [CrossRef]
  23. Invernizzi, C.M.; Iora, P.; Manzolini, G.; Lasala, S. Thermal stability of n-pentane, cyclo-pentane and toluene as working fluids in organic Rankine engines. Appl. Therm. Eng. 2017, 121, 172–179. [Google Scholar] [CrossRef]
  24. Di Marcoberardino, G.; Invernizzi, C.; Iora, P.; Ayub, A.; Di Bona, D.; Chiesa, P.; Binotti, M.; Manzolini, G. Experimental and analytical procedure for the characterization of innovative working fluids for power plants applications. Appl. Therm. Eng. 2020, 178, 115513. [Google Scholar] [CrossRef]
  25. Ayub, A.; Invernizzi, C.M.; Di Marcoberardino, G.; Iora, P.; Manzolini, G. Carbon Dioxide Mixtures as Working Fluid for High-Temperature Heat Recovery: A Thermodynamic Comparison with Transcritical Organic Rankine Cycles. Energies 2020, 13, 4014. [Google Scholar] [CrossRef]
  26. Haroon, M.; Ayub, A.; Sheikh, N.A.; Imran, M. Exergetic performance and comparative assessment of bottoming power cycles operating with carbon dioxide-based binary mixture as working fluid. Int. J. Energy Res. 2020, 44, 7957–7973. [Google Scholar] [CrossRef]
  27. Xia, J.; Wang, J.; Zhang, G.; Lou, J.; Zhao, P.; Dai, Y. Thermo-economic analysis and comparative study of transcritical power cycles using CO2-based mixtures as working fluids. Appl. Therm. Eng. 2018, 144, 31–44. [Google Scholar] [CrossRef]
  28. Yağlı, H.; Koç, A.; Karakus, C. Comparison of toluene and cyclohexane as a working fluid of an organic Rankine cycle used for reheat furnace waste heat recovery. Int. J. Exergy 2016, 19, 420–438. [Google Scholar] [CrossRef]
  29. Görgülü, A.; Yağli, H.; Koç, Y.; Koç, A.; Baltacioğlu, E. Activated carbon adsorption behaviour of toluene at various temperatures and relative humidity. Environ. Prot. Eng. 2019, 45, 111–126. [Google Scholar] [CrossRef]
  30. Span, R.; Wagner, W. A New Equation of State for Carbon Dioxide Covering the Fluid Region from the Triple-Point Temperature to 1100 K at Pressures up to 800 MPa. J. Phys. Chem. Ref. Data 1996, 25, 1509–1596. [Google Scholar] [CrossRef] [Green Version]
  31. Yang, F.; Liu, Q.; Duan, Y.; Yang, Z. Crossover multiparameter equation of state: General procedure and demonstration with carbon dioxide. Fluid Phase Equilibria 2019, 494, 161–171. [Google Scholar] [CrossRef]
  32. Lemmon, E.W.; Span, R. Short Fundamental Equations of State for 20 Industrial Fluids. J. Chem. Eng. Data 2006, 51, 785–850. [Google Scholar] [CrossRef]
  33. Lopez-Echeverry, J.S.; Reif-Acherman, S.; Araujo-Lopez, E. Peng-Robinson equation of state: 40 years through cubics. Fluid Phase Equilibria 2017, 447, 39–71. [Google Scholar] [CrossRef]
  34. Peng, D.-Y.; Robinson, D.B. A rigorous method for predicting the critical properties of multicomponent systems from an equation of state. AIChE J. 1977, 23, 137–144. [Google Scholar] [CrossRef]
  35. Poling, B.E.; Prausnitz, J.M.; O’Connell, J.P. The Properties of Gases & Liquids, 5th ed.; McGraw-Hill Professional: New York City, NY, USA, 2001. [Google Scholar] [CrossRef]
  36. Gas Turbine World 2013 GTW Handbook; Pequot publishing Inc.: Fairfield, CT, USA, 2013; pp. 1–126.
  37. Sánchez Villafana, E.D.; Vargas Machuca Bueno, J.P. Thermoeconomic and environmental analysis and optimization of the supercritical CO2 cycle integration in a simple cycle power plant. Appl. Therm. Eng. 2019, 152, 1–12. [Google Scholar] [CrossRef]
  38. Kim, M.S.; Ahn, Y.; Kim, B.; Lee, J.I. Study on the supercritical CO2 power cycles for landfill gas firing gas turbine bottoming cycle. Energy 2016, 111, 893–909. [Google Scholar] [CrossRef]
  39. Aspen Technology Inc. Aspen Plus. The Chemical Industry’s Leading Process Simulation Software; Aspen Technology Inc.: Bedford, MA, USA. Available online: https://www.aspentech.com/en/products/engineering/aspen-plus (accessed on 28 September 2020).
  40. Moran, M.J.; Shapiro, H.N.; Boettner, D.D.; Bailey, M. Fundamentals of Engineering Thermodynamics; John Wiley & Sons: Hoboken, NJ, USA, 2010. [Google Scholar]
  41. Marchionni, M.; Bianchi, G.; Tassou, S. Techno-economic assessment of Joule-Brayton cycle architectures for heat to power conversion from high-grade heat sources using CO2 in the supercritical state. Energy 2018, 148, 1140–1152. [Google Scholar] [CrossRef]
  42. Ahmadi, P.; Dincer, I.; Rosen, M.A. Exergo-environmental analysis of an integrated organic Rankine cycle for trigeneration. Energy Convers. Manag. 2012, 64, 447–453. [Google Scholar] [CrossRef]
  43. Dincer, I.; Ratlamwala, T.A.H. Thermodynamic Analysis. Available online: https://www.researchgate.net/publication/306303214_Thermodynamic_Analysis (accessed on 28 September 2020).
  44. US Department of Energy. U.S. Energy Information Administration, Independent Statistics & Analysis. 2017. Available online: https://www.eia.gov/electricity/annual/html/epa_08_01.html (accessed on 24 April 2020).
  45. Manente, G.; Fortuna, F.M. Supercritical CO2 power cycles for waste heat recovery: A systematic comparison between traditional and novel layouts with dual expansion. Energy Convers. Manag. 2019, 197, 111777. [Google Scholar] [CrossRef]
Figure 1. Performance decrement of S-CO2 Brayton power cycles at higher cycle minimum temperatures.
Energies 13 05080 g001
Figure 2. Bottoming cycle configurations: (a) Simple regenerative cycle (SRC); (b) Partial heating cycle (PHC). Adapted from [26].
Energies 13 05080 g002
Figure 3. Exergetic efficiency and exergy destruction ratio of CO2 SRC and PHC with respect to pressure ratio.
Energies 13 05080 g003
Figure 4. Power output, plant-specific cost and levelized cost of electricity for CO2 SRC and PHC with respect to pressure ratio.
Energies 13 05080 g004
Figure 5. Exergetic efficiency and exergy destruction ratio of CO2 SRC and 0.9CO2/0.1C7H8 SRC with respect to pressure ratio.
Energies 13 05080 g005
Figure 6. Power output, plant-specific cost, and levelized cost of electricity for CO2 SRC and 0.9CO2/0.1C7H8 SRC with respect to pressure ratio.
Energies 13 05080 g006
Figure 7. Exergetic efficiency and exergy destruction ratio of CO2 PHC and 0.9CO2/0.1C7H8 PHC concerning pressure ratio.
Energies 13 05080 g007
Figure 8. Power output, plant-specific cost and levelized cost of electricity for CO2 PHC and 0.9CO2/0.1C7H8 PHC with respect to pressure ratio.
Energies 13 05080 g008
Figure 9. (a) Exergy destruction in components of SRC and (b) PHC operating with 0.9CO2/0.1C7H8 binary mixture.
Energies 13 05080 g009
Figure 10. CO2 emissions savings for power cycles operating with CO2 and 0.9CO2/0.1C7H8 binary mixture with respect to pressure ratio.
Energies 13 05080 g010
Table 1. Thermodynamic and HSE characteristics of pure CO2 and Toluene.
FluidMolar Mass (kg/kmol)Pcr (Bars) T cr   ( ° C ) Thermal Stability Limit ( ° C ) ODPGWPAuto Ignition Temperature ( ° C ) Flammability
Toluene92.1441.08318.64000low480Yes
CO244.0173.831.068000Very lowN/ANot flammable
Table 2. Specification of GE-LM2500 topping gas turbine. Adapted from [26].
ParameterValueExhaust Gas Composition
Power Output24.8 MWComponentMole Fractions
Efficiency35.1%CO20.03
Pressure Ratio (P.R)19Nitrogen0.76
Mass Flow Rate of exhaust gases (MFR)71 kg/secOxygen0.14
Exhaust gases Temperature (Texh,in)798 K (525 °C)Water0.07
Table 4. Assumptions for economic comparative analysis.
ParametersValue
Plant installation cost ( C i n s t )1.3
Operation and Maintenance cost ( O M ) (USD/kWe)30
Operation and Maintenance Escalation rate ( e r ) (%)3
Plant lifetime ( N Y ) (years)20
Plant utilization factor ( u ) (%)85
Discount rate ( r ) (%)5
Table 5. Base conditions for the parametric study [25,45].
Input Parameters in the CyclesValueUnit
Dead state temperature (T0)313K
Minimum temperature difference in IHX110K
Minimum temperature difference in IHX210K
Minimum temperature difference in Recuperator30K
Isentropic efficiency of turbine85%
Isentropic efficiency of compressor80%
Turbine inlet temperature (TIT)673K
Compressor inlet temperature (Tmin)323K
Compressor inlet pressure (Pmin)9.14MPa
Table 6. Thermodynamic performance indicators at recommended pressure ratios for all four bottoming power cycles.
Power CyclesRecommended Pressure RatioEnergy Efficiency (%)Exergy Efficiency (%)Power Output (kW)Heat Recovery (kW)Exergy Destruction RatioMass Flow Rate (kg/sec)Mass Split (towards IHX-2)
CO2 SRC2.819.028.64328.222,742.70.631101.3No split
0.9CO2/0.1C7H8 SRC4.123.735.85473.323,053.30.53880.9No split
CO2 PHC3.113.526.54020.829,835.90.71392.10.73
0.9CO2/0.1C7H8 PHC4.415.634.15163.833,165.00.64975.60.68
Table 7. Economic and Environmental performance indicators at recommended pressure ratios for all four bottoming power cycles.
Power CyclesRecommended Pressure RatioOverall UA (kW/K)Total Component Cost (MUSD)Plant-Specific Cost (USD/kWe)Levelized Cost of Electricity (USD/kWe)CO2 Emissions Savings (kg.CO2/hr)Exergo Environmental Impact Improvement ( θ i i ) Exergetic Sustainability Index ( θ e s t )
CO2 SRC2.81524.120.3246950.035814.90.4530.129
0.9CO2/0.1C7H8 SRC4.12812.442.1577010.0551030.40.6670.239
CO2 PHC3.11497.820.3850690.037756.90.3720.0987
0.9CO2/0.1C7H8 PHC4.42228.331.8261610.045972.20.5250.178

