Article

Reduction of Unburned Carbon Release and NOx Emission from a Pulverized Wood Pellet Boiler Retrofitted for Fuel Switching from Coal

1
School of Mechanical Engineering, Sungkyunkwan University, Suwon 16419, Korea
2
Human Resource T/D Institute, Korea South-East Power Co., Jinju 52852, Korea
*
Author to whom correspondence should be addressed.
These authors contributed equally to this work.
Energies 2020, 13(19), 5077; https://doi.org/10.3390/en13195077
Submission received: 7 August 2020 / Revised: 22 September 2020 / Accepted: 22 September 2020 / Published: 28 September 2020
(This article belongs to the Section B: Energy and Environment)

Abstract

:
For renewable electricity production, biomass can fully displace coal in an existing power plant with some equipment modifications. Recently, a 125 MWe power plant burning mainly anthracite in Korea was retrofitted for dedicated wood pellet combustion with a change of boiler configuration from arch firing to wall firing. However, this boiler suffers from operational problems caused by high unburned carbon (UBC) contents in the bottom ash. This study comprises an investigation of some methods to reduce the UBC release while achieving lower NOx emissions. The computational fluid dynamics approach was established and validated for typical operating data. Subsequently, it was applied to elucidate the particle combustion and flow characteristics leading to the high UBC content and to evaluate the operating variables for improving the boiler performance. It was found that the high UBC content in the bottom ash was a combined effect of the poor fuel grindability and low gas velocity in the wide burner zone originating from the arch-firing boiler. This prevented the operation with deeper air staging for lower NOx emissions. Reducing the particle size to <1.5 mm by modifying mills or pretreating the fuel using torrefaction was the only effective way of lowering the UBC and NOx emissions with deeper air staging while increasing the boiler efficiency.

Graphical Abstract

1. Introduction

Biomass is a renewable fuel that can displace coal in power generation via co-firing or fuel switching for a reduction in greenhouse gas emission. As solid fuels, biomass and coal exhibit similar combustion behaviors and, therefore, the existing equipment for coal combustion can be utilized for co-firing of biomass and fuel switching without major retrofitting [1]. However, there are several differences in detailed combustion properties of biomass from those of coal. Biomass has a larger volatile matter content and higher char reactivity than coal, which aids in realizing a good combustion efficiency in a pulverized-fuel furnace. Furthermore, it typically has a lower N content and much lower S content than coal, thus resulting in lower emissions of NOx and SOx [2]. Biomass also comprises several issues that may cause operational problems in combustion plants [3]. Its ash has a high content of alkali metals that increase the slagging and fouling propensity on heat exchanger surfaces [4]. In pulverization, biomass has poor grindability owing to its fibrous structure, which increases the power consumption and deteriorates the coal grindability if co-milled [3]. This can also cause poor burnout of char, which leads to a high unburned carbon (UBC) content in the ash from a large utility boiler adopting pulverized fuel combustion.
In pulverized biomass combustion, the particle sizes could be up to 10 mm depending on the furnace type [3], but the typical particle size is less than 1 mm [5]. In contrast, the typical particle size requirement for pulverized coal is 70−80 wt.% passing 200 mesh (<75 µm). This difference is based on the much shorter burnout time of biomass than that of coal. For example, Saastamoinen et al. [6] compared the single particle burning of pulverized wood to that for coal in the reaction condition of a large utility boiler, and concluded that a 500 µm wood particle has the same burnout time as that of a 200 µm Polish coal particle. Panahi et al. [7] showed that torrefied biomass of 212–300 µm has a burnout time similar to that of 75–90 µm coal particles measured in a drop tube furnace at 1350 K. Magalhães et al. [8] reported that the burnout time of agricultural residue sieved to 212–300 µm was comparable to two lignite coals of 106–125 µm. The burnout time of the biomass particles was influenced to a greater extent by the char conversion than the devolatilization, especially in the case of large particles [9,10]. The ignition delay, volatile flame duration, and char burnout time of the biomass particles in the particle size range of 0.5 mm to 4 mm have been measured by Mason et al. [11] in a 1550 °C flame similar to those in large-scale pulverized fuel furnaces. The char burnout time was linearly correlated with the particle mass, indicating the significant influence of particle size on the UBC in ash.
The shorter burnout time of biomass as compared to that of coal is associated with the high reactivity of char [4]. In addition to the char oxidation, the gasification reactions caused by CO2 and H2O were significant at 800 °C, whereas these become active at a much higher temperature for coal. For example, the gasification reactions were in the regime II condition of the three-zone theory at 900 °C, the rate of which is limited by the combined effects of chemical kinetics and diffusion [4]. For large particles or at high temperatures, the gasification caused by CO2 and H2O played a dominant role in char conversion [12]. Therefore, these reactions must be taken into consideration in the numerical modeling of biomass combustion. Char burnout can vary by the location of fuel injection and corresponding particle residence time. In a large pulverized biomass boiler, large particles from lower burners cause increased bottom ash release with very poor carbon conversion, while those from the top burners have lower burnout in the fly ash [6].
In 2017, a 125 MWe power plant co-firing anthracite and heavy fuel oil located in the eastern coast of Korea was retrofitted to a dedicated wood pellet combustion plant, which is the target plant of this study. Although biomass such as wood pellets is known to have a higher reactivity, the boiler has a major operational issue caused by a large amount of UBC in the bottom ash. This lowers the boiler efficiency and leads to a difficulty in ash disposal. Some bottom ash particles floating in the water bath below the boiler catch fire if air can infiltrate them. One solution is to recycle the bottom ash by drying and blending with fresh wood pellets before pulverization. The bottom ash can also be used as biochar for soil and environmental applications [13]. However, seawater is currently used in the water bath and has to be replaced with freshwater by modifying the facility. Otherwise, recycling the bottom ash as fuel may increase fouling by NaCl in the heat exchangers.
On the other hand, the NOx emissions from combustion in the industry, especially from coal-fired power plants, have become a major concern in Korea because of the frequent severe haze events in recent years. This has resulted in major changes in energy policies including tighter emissions regulations and temporary shutdowns of old plants during severe haze. Therefore, reducing NOx formation from combustion and minimizing its emissions using gas cleaning has become the key issue in all power plants. The second objective of this study is to reduce the NOx emissions from the boiler. NOx reactions during solid fuel combustion such as biomass and coal that contain chemically bound nitrogen (fuel-N) are dominated by the fuel NOx mechanism over the thermal NOx mechanism, whereas prompt NOx is much less significant [14,15]. Fuel-N in biomass is liberated mostly as NH3 during devolatilization and as NO during char conversion [16,17]. NH3 can be oxidized to NO but also acts as a reducing agent of NOx under air-lean conditions [16]. One of the primary measures is to apply air staging with the use of overfire air (OFA) for a fuel-rich condition in the burner zone which minimizes NOx formation and promotes the reduction of NOx into N2 [15]. For pulverized fuel combustion adopting swirl burners, the burner design and swirl intensity are optimized to create a reducing atmosphere after the devolatilization stage at the flame center [15]. As the UBC release and NOx emissions during combustion are often closely associated with each other [14,18,19], a careful evaluation of the reaction and flow characteristics is required before making changes to the design and operating conditions of the boiler.
In this study, computational fluid dynamics (CFD) was applied to reduce the UBC in the bottom ash and NOx emissions of a 125 MWe wood pellet-fired boiler, having a wall-firing configuration retrofitted from arch firing for fuel switching from coal. Based on the operating conditions and fuel analysis, a reference case was established to validate the CFD methodology and understand the flow and reaction characteristics with respect to the UBC release and NOx reactions. Then, the influences of operating parameters including air staging and particle size reduction were evaluated to optimize the boiler performance. The obtained findings can be helpful in the retrofitting of the second unit at the plant having the same boiler configuration but at a doubled capacity.

2. Target Boilers and Numerical Methods

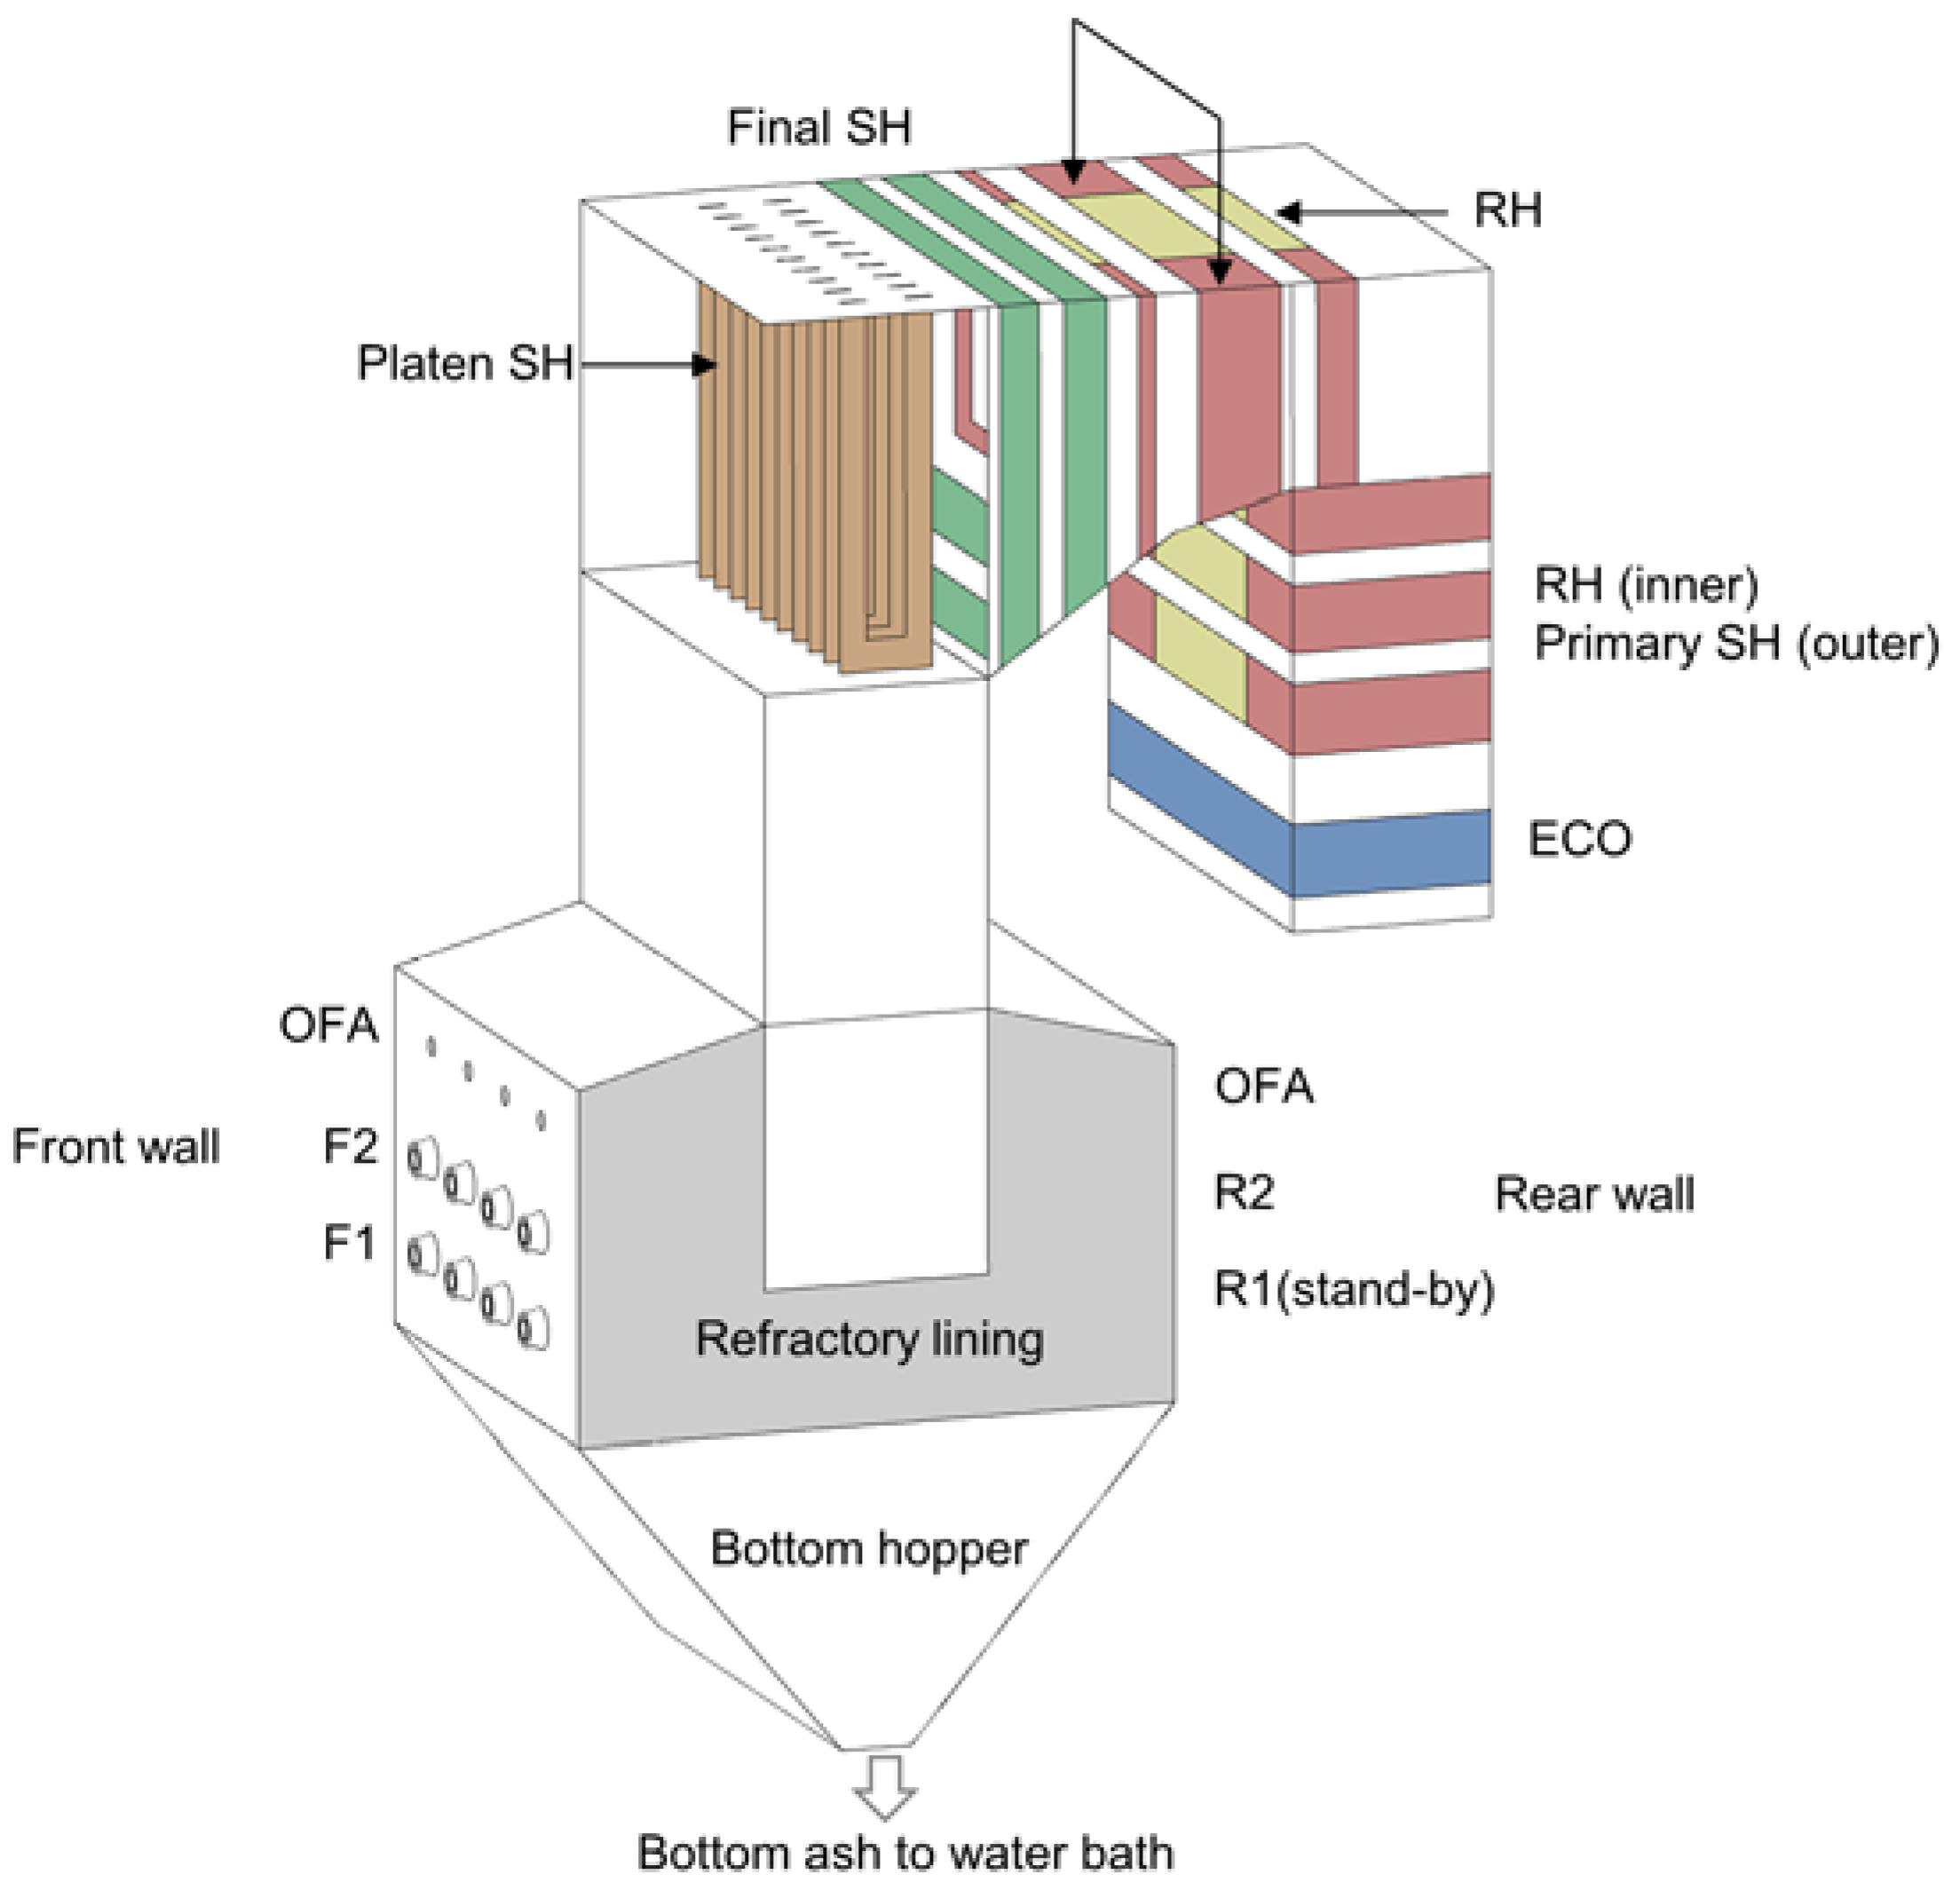
2.1. Target Boiler and Operation Conditions

Figure 1 presents the schematic of a 125 MWe boiler, which is the Yeongdong unit 1 operated by Korea South-East Power Co. Ltd. The outline of the original arch-firing boiler was maintained for anthracite co-firing with heavy fuel oil, which is characterized by a wide burner zone. Due to the low reactivity of anthracite, the burner zone had a wide cross-section to incorporate the W-shaped flame created by the use of many slit burners on the arch for realizing a long particle retention. The water wall was refractory-lined to maintain a high temperature for speeding up the reactions. After the retrofit for fuel switching, the boiler had an opposed wall-firing configuration with 16 swirl burners installed on the front and rear walls. The OFA ports were installed above burner F2 on the front wall and burner R2 on the rear wall. Furthermore, the refractory lining was partially removed, and only the lining on the side wall was retained, as indicated by the shaded area in the figure. In the upper furnace, a series of heat exchangers was installed including a platen superheater (SH), final SH, reheater, primary SH, and economizer (ECO).
Table 1 lists the fuel properties and operating conditions of the boiler, which were established from an on-site survey by acquisition of recorded operation data and samples of wood pellets and ash. The wood pellets were imported from a South Asian country and had a higher heating value of 17.11 MJ/kg. The fuel throughput was 76,800 kg/h, which corresponded to a thermal input of 365.01 MWth. It was transported by primary air at 159 °C at the mill inlet and 63 °C at the outlet. Thereafter, it was supplied to the three burner layers from F1 to R2, while burner R1 was on standby. The OFA ratio was 4.7% of the total combustion air, and the overall excess air ratio was 21.6%. This means that the burner zone was air-rich with a stoichiometric ratio (SR) of 1.16.
Figure 2 presents the measured particle size distribution of the fuel samples obtained from the site after pulverization at the ball mill. The mass-weighted average of the particle size was 712 µm, but the fraction of large particles was significant. For example, the fractions of sizes over 1 mm and 2 mm were 22.8% and 9.3%, respectively.
Table 2 lists eight cases considered in the CFD simulations for the decrease in NOx emissions and UBC in the bottom ash. Case R was the reference case that was based on the actual operating conditions presented in Table 1. Cases 1–3 were evaluated for the adjustment of the combustion air distribution. In Cases 1–3, the OFA ratio was increased from 0% to 18.7% to determine the effect of air staging, which is known to be effective in the reduction of NOx controlling fuel NOx formation [14,15]. In Cases 4–6, the particle size was decreased to less than 1.5 mm by adjusting the larger sizes, as plotted in Figure 2, and the effects of deeper air staging were evaluated for the burner zone SR from 1.16 to 0.99. Several other options were also considered for the alleviation of the high UBC problem, but two of them are presented herein. In Case 7, the swirl intensity of the burners was lowered by changing the tangential to axial velocity ratio (vtan/vax) to 0.7 from 0.8 of Case R. This was intended to create narrower flames that can change the fuel particle trajectories. In Case 8, flue gas recirculation (FGR) was introduced by mixing 20% of the net flue gas recycled from the ECO exit with the combustion air. The facilities for the FGR are available in the plant but are currently not used for some reasons. The FGR added to the combustion air can increase the gas velocity and corresponding particle entrainment while lowering the flame temperature and suppressing the thermal NOx formation. On the other hand, this may enrich the NOx concentration because the recycled flue gas was drawn before the NOx removal by the selective catalytic reactor.

2.2. CFD Modeling Methods

CFD simulations were performed for the boiler by using ANSYS Fluent version 17.2 (ANSYS Inc., Cannonsburg, MI, USA) with user subroutines incorporated for combustion and heat transfer submodels. Since the access to the boiler for various measurements was limited, the modeling strategy comprised first establishing a detailed reaction, heat transfer, and flow submodels that were in good agreement with the available data for the current operating conditions such as the exit O2 and NOx concentrations, UBC content in ash, and heat absorption in all the heat exchangers. Then, the cases comprising different operating parameters or a modified boiler design were assessed in comparison to the reference case.
The mesh for the simulation was constructed using 2,883,090 hexahedral cells concentrated densely around the burners. The mesh had an average volume of 0.0022 m3/cell in the burner zone, equiangle skewness of 0.0863, orthogonality of 0.973, and y+ of 118. Although the mesh sensitivity was not tested, the numerical diffusion caused by the mesh would not be significant because its quality and fineness were better than the fine mesh version evaluated for a 500 MW coal furnace [20].
The solid phase equations were solved using the discrete phase method that tracked the individual particles in the Lagrangian scheme with stochastic tracking for the turbulent dispersion. The particle size of the pulverized fuel was modeled using 13 diameter sizes (dp) ranging from 20.2 to 2700 µm, representing a mass fraction of 5–10% each, as illustrated in Figure 2. The total number of particles was 74,880. The heat and mass transfer interaction with the gas phase was taken into consideration via gradual updates of the source terms with under-relaxation. The drag was calculated using the Haider and Levenspiel model [21] for non-spherical particles with a shape factor of 0.54 [22].
The particle temperature was determined via the energy balance equation over its path.
m p c p d T p d t = h A p ( T T p ) + ε p A p σ ( θ R 4 T p 4 )
The convection between the small particles and the gas phase was estimated using the Nusselt number of 2.0 + 0.6   R e d 1 / 3 P r 1 / 3 [23]. The radiation was calculated with a surface emissivity of 0.9.
Table 3 summarizes the reaction submodels and parameters. The devolatilization of wood particles was solved using the prediction of bio-FLASHCHAIN in PC Coal Lab (Niksa Energy Associates LLC, Palo Alto, CA, USA) [24] for the product yields and reaction kinetics. The volatiles consisted of tar, CO, CO2, H2O, H2, CH4, and CxHy with a total yield of 83.24% daf (dry, ash-free basis). The volatiles composition was introduced in the CFD code using a user subroutine because the built-in model allowed only a single volatile species. This is because the use of multiple volatile species can result in a better prediction of the initial flame formation over that obtained using a single volatile species. The devolatilization rate was calculated using a single Arrhenius rate with the rate constants listed in the table.
The char conversion via reactions with O2, H2O, and CO2 was calculated using the unreacted core shrinking model (UCSM) [25], which was also incorporated using a user subroutine. This model is appropriate for regime III of char conversion in which the surface reaction is very fast such that the overall reaction rate is limited by the boundary layer diffusion [26]. For the biomass char, even the slow gasification reactions of CO2 and H2O are under the regime II condition at 900 °C [4], and therefore, they would be close to the regime III condition at a temperature well above 900 °C, as in the case of the present industrial-scale boiler. However, the original rate constants of UCSM were derived for coal char, which has a much lower reactivity and microscopic surface area than those of wood char. Therefore, the surface kinetic rate (ks,i) and surface area for the char conversion rate (Rchar,i in Table 3) were multiplied with factors of 10 and 5, respectively, to match with the measured UBC contents in both the bottom and fly ash of the reference case (Case R).
The gas-phase reactions were based on the global mechanism of Jones and Lindstedt for hydrocarbon [27] including tar oxidation [26]. The reaction rates were calculated using the kinetic rate/eddy dissipation rate model [28] that takes into consideration the influence of turbulent mixing at high temperatures.
The turbulence was solved using the realizable k–ε model, which can better predict the swirling flow as compared to the standard k–ε model [29] and has a good convergence. The radiation was solved using the discrete ordinate method with the weighted-sum-of-gray-gases model for gaseous absorption [30].
The flow resistance and heat transfer in the tube bundles were considered by calculating the local source terms by using the user subroutines detailed in [31], instead of directly modeling the highly complex tube geometry. Based on the tube geometry in each heat exchanger section, the flow resistances in the transverse and lateral directions were calculated using Jakob’s correlation [32]. The convective heat transfer was calculated using Zukauskas’s correlation [33] for the heat transfer coefficient and average steam properties. The radiation was calculated using the Stefan–Boltzmann equation with a surface emissivity of 0.7. The abovementioned two equations for convection and radiation comprised tuning factors for slagging/fouling that were determined using the measured heat absorption measured for each heat exchanger. As the abovementioned equations pertained to the local velocity and temperature, this approach could take into consideration the spatial variations in the flow resistance and heat transfer in each tube bundle depending on the flow pattern.
In the wall condition, the water wall was assumed to have an average steam temperature of 607.85 K, with an overall heat transfer coefficient of 140 W/m2 and surface emissivity of 0.7. The refractory lining on the sidewall of the burner zone was considered as a thermal resistance with a thickness of 0.035 m and a thermal conductivity of 0.65 W/(m × K).
Finally, additional transport equations for NO and NH3 were solved to calculate NOx reactions by post-processing of the converged solutions. The thermal NOx reactions were calculated using the extended Zeldovich mechanism with partial equilibrium assumptions for the O, H, and OH radicals. The fuel NOx reactions were solved using the De Soete model [34] assuming even distribution of fuel-N between volatile-N and char-N. The volatile-N was released as NH3 via devolatilization, while the char-N was oxidized to NO in the model. The reduction of NO by carbon and catalytic inorganics on the particle surface was also considered for the N2-BET surface area of 200 m2/g.

3. Results and Discussion

3.1. Comparison of CFD Results with Measured Data for the Reference Case

Table 4 compares the key parameters acquired from the CFD simulation with the measured data for Case R. As mentioned previously, the input parameters for the heat transfer and the char reactivity were tuned to match the measured data. Overall, the CFD results were reasonably close to the measured values. This implies that the CFD method was acceptable for predicting the reaction and heat transfer of the target boiler for the reference case and can be employed to evaluate the trends in Cases 1–6 via a comparison. The gas temperature at the boiler exit was overestimated by 13.1 °C as the minor heat loss from the boiler was not considered in the CFD. It should be noted that the UBC in the bottom ash was as high as 61.7% in the measured data. Some of these particles were floating on the water bath below and caught fire.

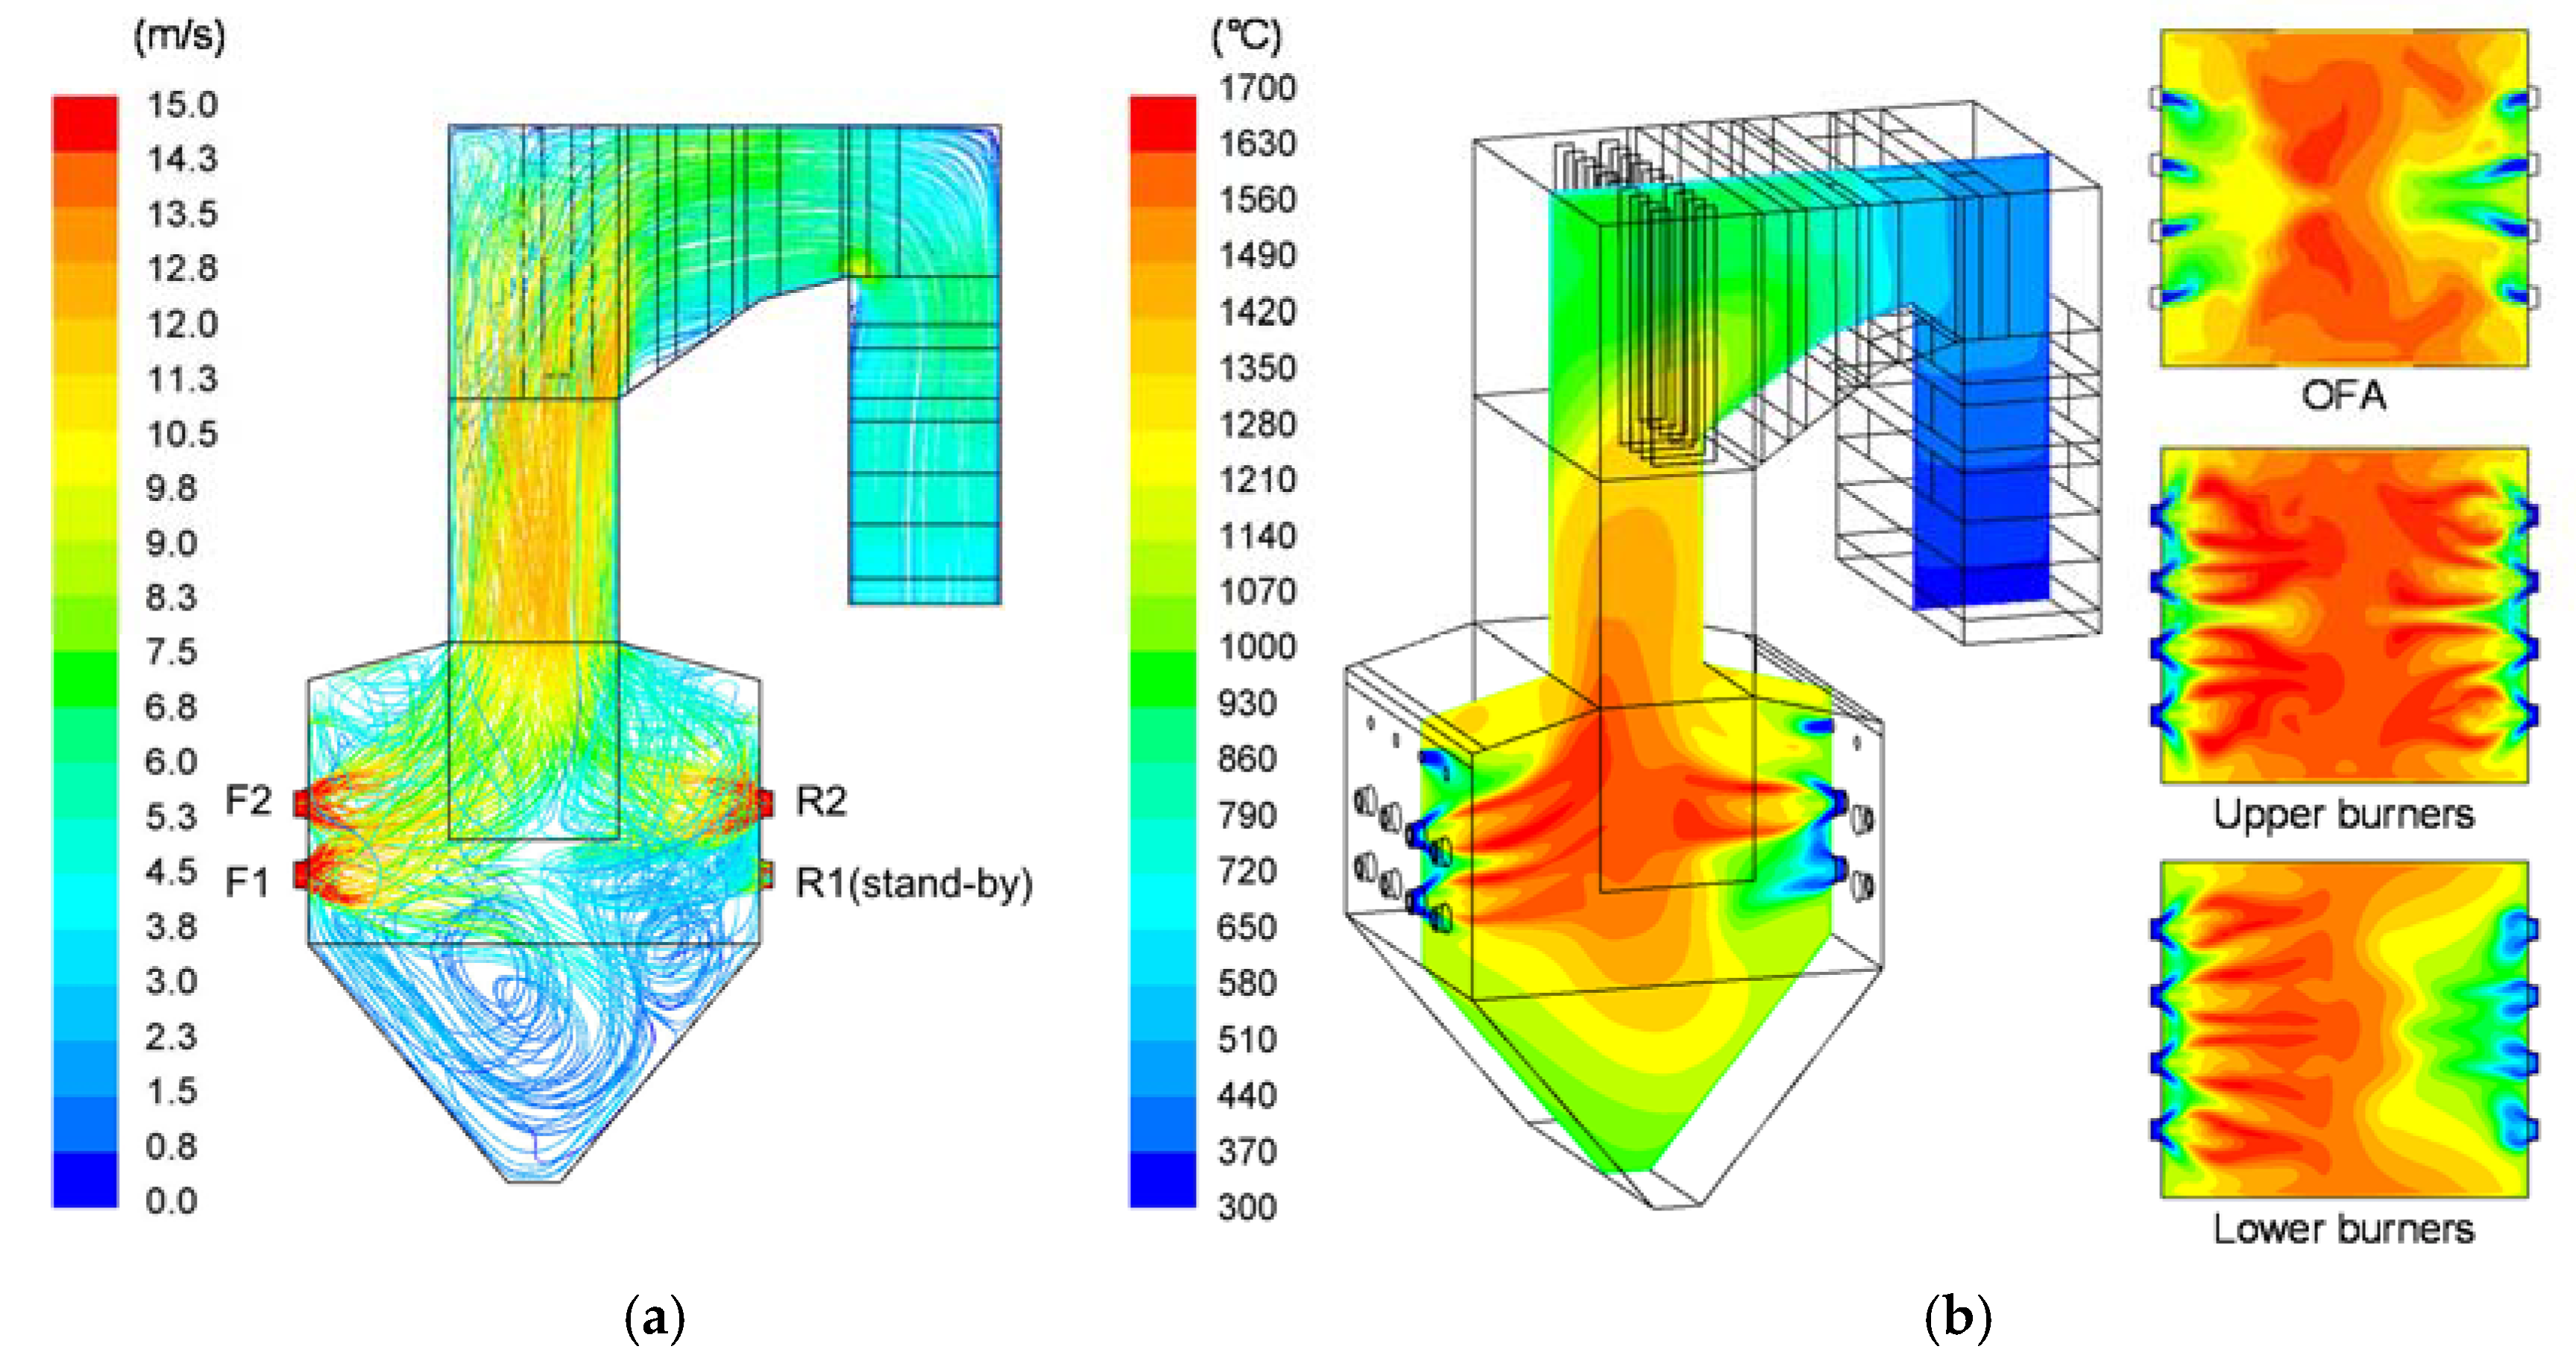
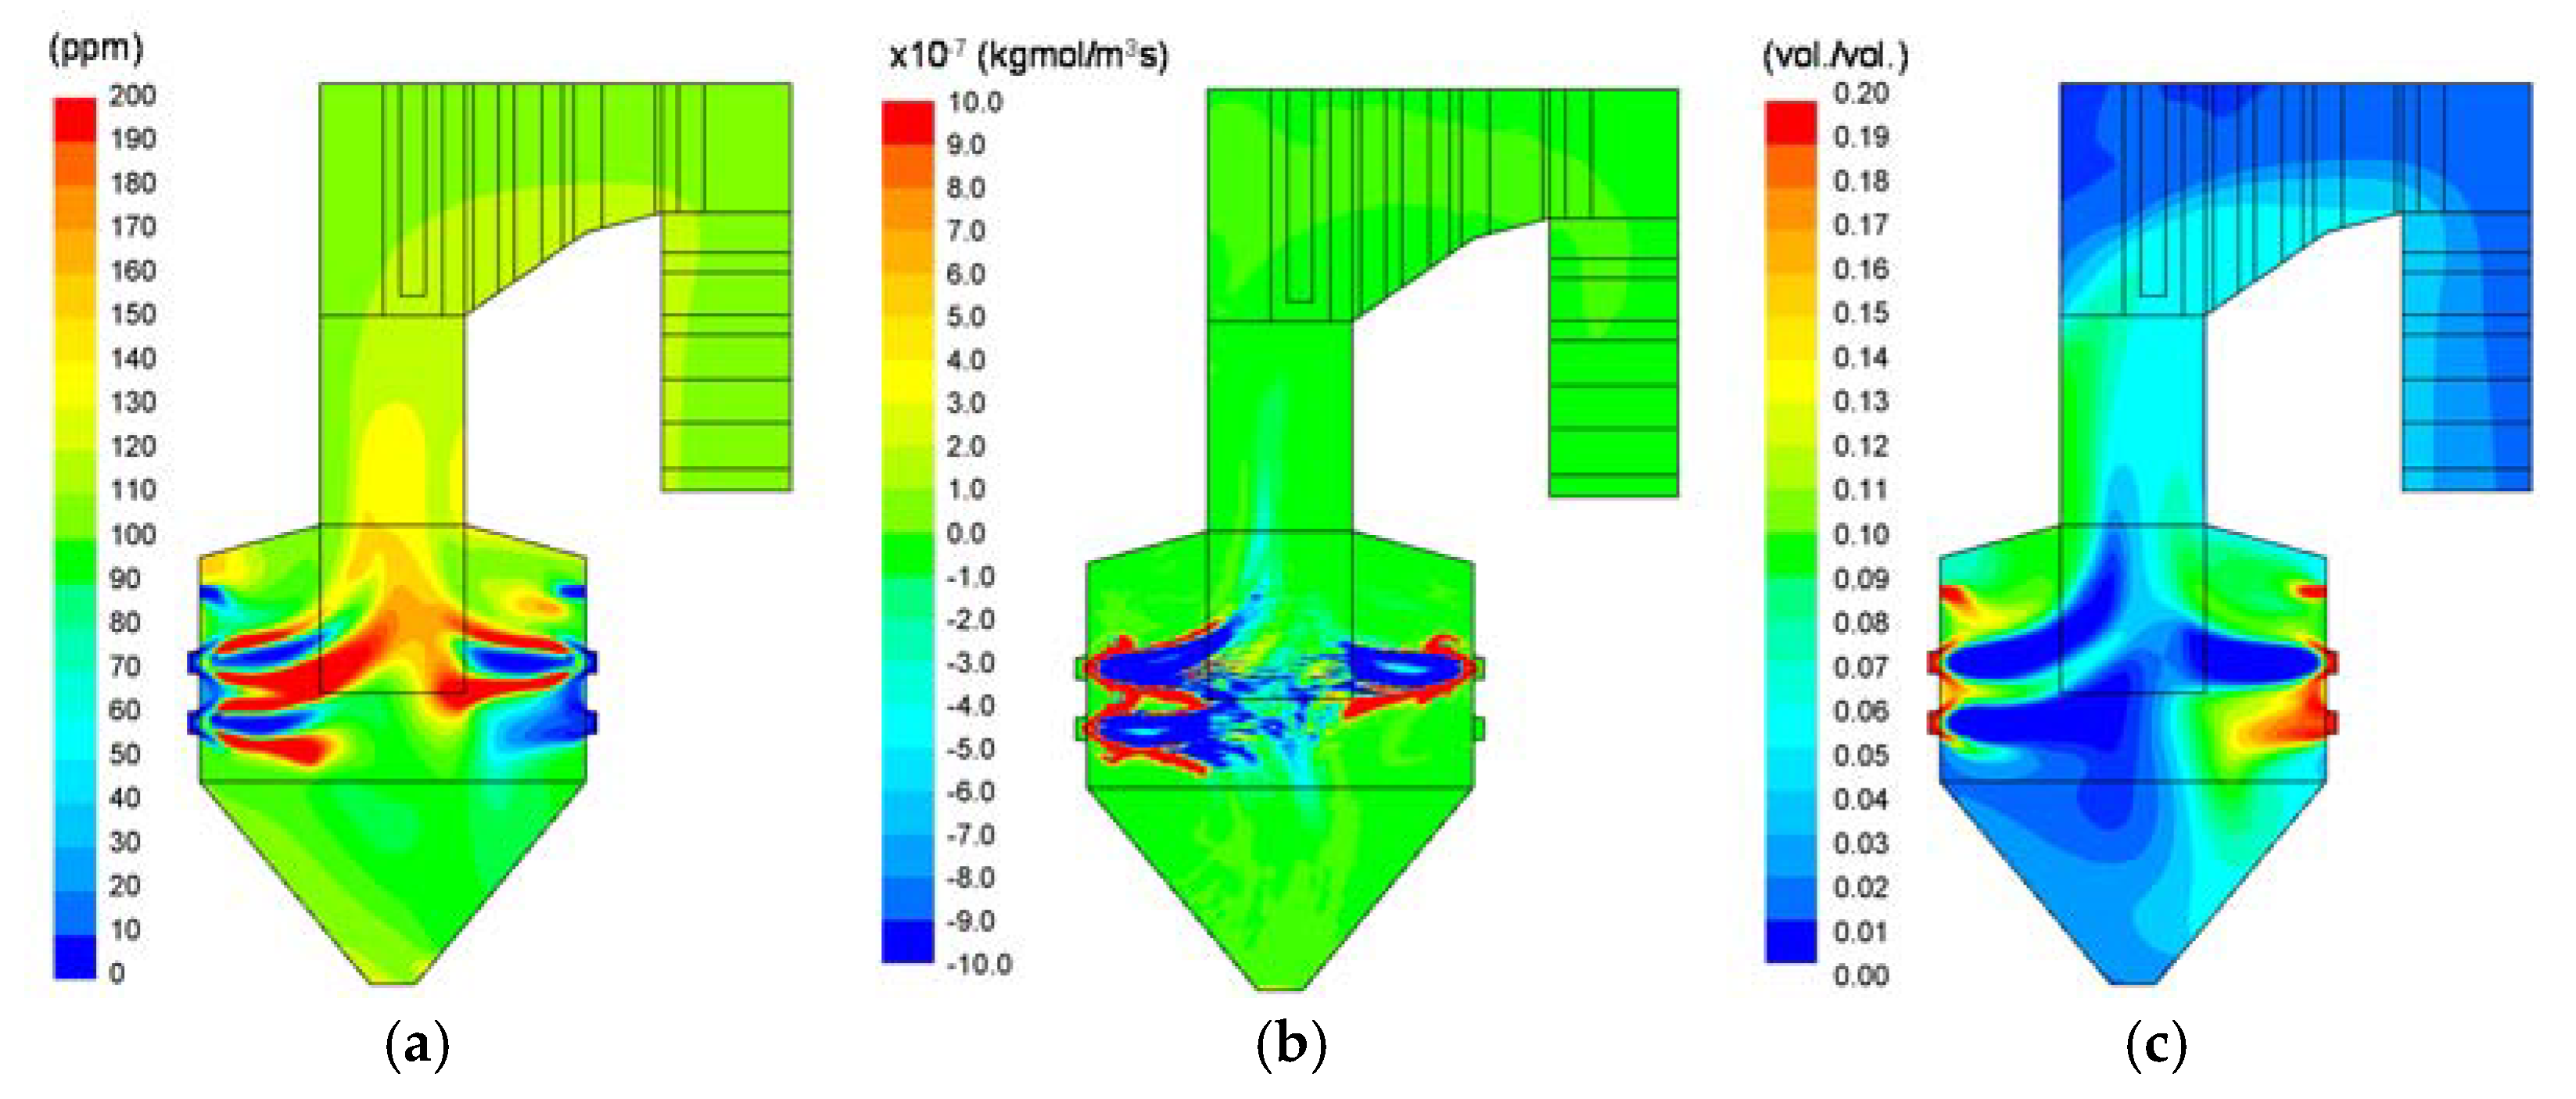
3.2. CFD Results for Flow and Reaction Characteristics in Case R

CFD results for Case R were analyzed in detail to understand the flow and reaction characteristics associated with the reason for the high UBC content in the bottom ash. Figure 3a illustrates the pathlines color-coded based on the velocity magnitude for Case R. Due to the wide cross-section of the burner zone, the opposing jets of the flame from the swirl burners on the front and rear walls did not collide at the center, unlike typical opposed wall-firing boilers. Instead, they turned upward and gathered at the opening of the narrow neck to a strong upward flow of over 10 m/s. In the lower furnace and bottom cone, a large circulation zone with a low velocity (<4 m/s) was created by a small fraction of flows from the burners. This low-velocity region was directly associated with the release of the bottom ash, which is analyzed later. As shown in Figure 3b, flames having a temperature of over 1500 °C developed, and the upper burner level exhibited the highest temperature. The flames from the front wall occupied the central region with aid from another layer of flames from burner F1 below, whereas those from the rear wall were pushed to the sidewall. At the cross-section of the OFA level, the OFA jets did not penetrate deeply because the flow ratio was only 4.7%. Through the neck, the temperature gradually decreased owing to the heat transfer to the wall and then rapidly dropped in the heat exchanger zones. In contrast, the temperature quickly decreased below 1200 °C in the bottom cone because the large circulation zone had a small flow rate and was exposed to the water wall without a refractory lining. Therefore, the particles entering the relatively cold circulation zone were not likely to be entrained to the upward flow nor complete the char conversion, thus resulting in a high UBC in the bottom ash.
Particles should be entrained to a gas flow having a velocity larger than the terminal velocity (vt) to escape the burner zone. Otherwise, they fall into the bottom hopper by gravity and are released as bottom ash. Using the CFD results, the velocity profiles with respect to vt of fresh char particles were analyzed. Figure 4 illustrates the proportion of the area having a z-velocity (vz) lower than vt on two horizontal planes: one between the lower and upper burner levels and the other at the bottom hopper opening. vt was calculated using the drag model for fresh char particles (at the end of devolatilization) having an apparent density of 305 kg/m3. vt increased from 1.7 at dp = 590 μm to 3.41 m/s at 2700 μm. Due to the large width of the burner zone and horizontal burner firing, the proportion of the area with vz < vt was very high. Unless char conversion progressed quickly after heating and devolatilization, a considerable proportion of particles was expected to be released as bottom ash with a high UBC content. In particular, char particles larger than 1344 μm were not able to escape the bottom hopper if they fell into this region.
Figure 5 presents the actual trajectories of fuel particles injected into F1 burners (lower burners on the front wall) in Case R for the three largest particle sizes (dp = 830, 1711, and 2700 µm) among 13 size fractions representing the particle size distribution (Figure 2). The trajectories are color-coded with the normalized char mass (i.e., 1—char conversion), wherein a value of 1.0 (red) represents the heating and devolatilization stages, and values of less than 1 represent char conversion. The smaller particles were easily entrained to the upward flow and released as fly ash with a char conversion of over 99.9%. However, a significant fraction of the large particles was captured in the circulation zone in the bottom cone. For dp = 830 µm, the char conversion was completed in this region, and many particles moved along the gas flow to be entrained back into the flame. For dp = 1711 µm, the char conversion was incomplete in some particles, and more particles were trapped in the bottom cone. In contrast, all the particles with the largest dp values (2700 µm) fell directly into the bottom cone with a low char conversion and were released as bottom ash. Due to the low surface-area-to-volume ratio that influenced the heat transfer and surface reaction, both the devolatilization and char conversion of larger particles were significantly slower than those of smaller ones. Such trends are consistent with the studies of Mason et al. [11], but the different particle trajectories and corresponding temperature O2 histories were additional factors that influenced the char burnout in the actual boiler.
Figure 6 plots the mass fraction, UBC, and carbon conversion in the bottom ash for different particle sizes from each burner in Case R. The mass fraction released as the bottom ash increased rapidly from dp = 1000 µm and became over 95% for dp = 2700 µm. The F1 burners (lower burners on the front wall) contributed the majority of the bottom ash, whereas the F2 burners (upper burners on the front wall) contributed the least. The carbon conversion of the particles having dp ≤ 1056 µm was completed because these particles had longer trajectories and residence times while passing through the high-temperature region in the burner zone. The carbon conversion was 96.5–99.2% for dp = 1711 µm and decreased to 69.0–75.8% for dp = 2700 µm. This corresponded to 84.3% and 81.5% of the UBC in the bottom ash, respectively. Therefore, the contribution of particles having dp > 1000 µm was dominant in the UBC. This value can be used as the criterion of improved grindability if new mills suitable for biomass are introduced.
Figure 7 shows the NO concentration and its reaction rate and the O2 mole fraction in Case R. In each flame from the burners, the NO concentration was greater than 200 ppm at its outer part and very low at its core, as shown in Figure 7a. It was mixed at the opening of the neck to produce a NO concentration of 120 ppm at the exit, which corresponded to 107.6 ppm on a 6% dry O2 basis. Figure 7b shows that the large variations in the NO concentration of the flames were the result of active NO formation and reduction reactions. NO was formed in the region between the inner stream of particle and primary air and the outer stream of burner secondary air, where the N intermediates (NH3) from the devolatilization were oxidized by the secondary air. In contrast, the NO reduction reactions occurred in the inner region of the flame where the internal recirculation zone (IRZ) was formed, and the NO and N intermediates were drawn in and reduced to N2. Figure 7c shows that O2 was depleted in the IRZ and was rich along the secondary air flow, which coincided with the regions of active NO reduction and formation reactions, respectively. The formation of IRZ comprised the characteristic flow pattern of low-NOx swirl burners. However, the air staging with the use of OFA did not contribute to the NO reduction in this boiler as the reduction reactions did not occur above the burners in Figure 7b. Although air staging can be an effective NOx reduction method, the OFA ratio was only 4.7% in the present case, and the burner zone was already air-rich with an SR of 1.16 (Table 2). Moreover, the OFA was located close to the burners, which resulted in an insufficient volume for the NO reduction reactions to occur even if the burner zone is in the fuel-rich condition.

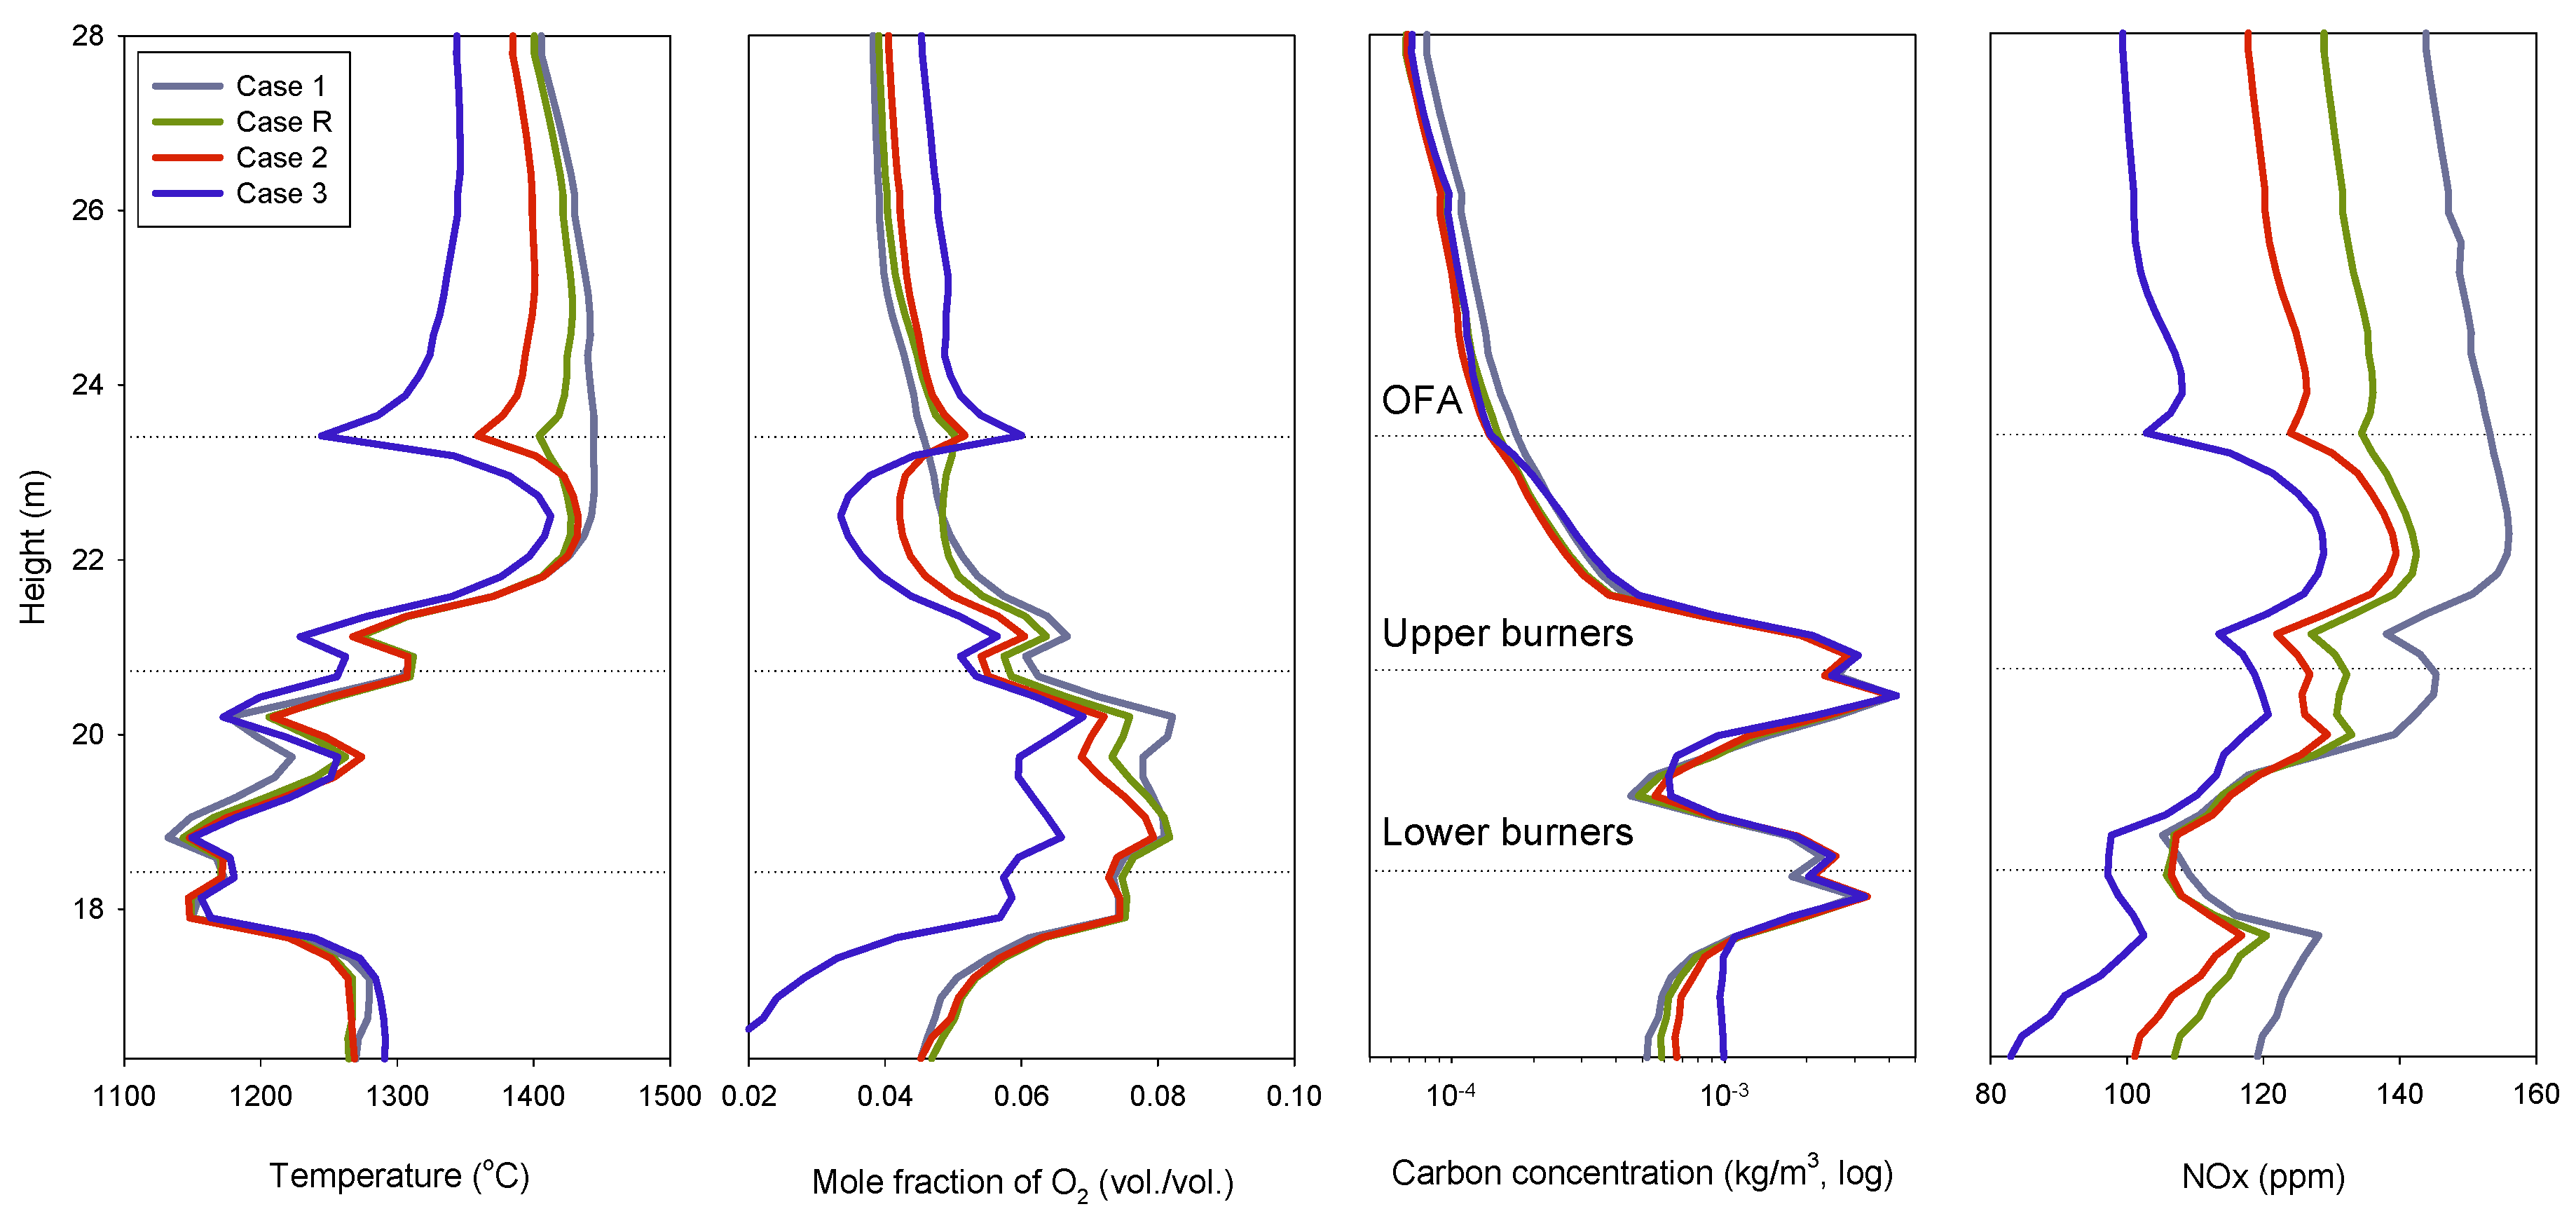
3.3. CFD Results for Influence of Air Staging (Cases 1–3)

The reference case (Case R) comprised a burner zone SR of 1.16, which was in the fuel-lean condition. This is against the common practice of air staging in which the burner zone SR is well below the stoichiometric condition for lower NO emissions [15]. In Cases 1–3, the influence of air staging was tested for a burner zone SR ranging between 1.22 and 0.99, as listed in Table 2.
Figure 8 compares the profiles of temperature, O2 mole fraction, solid carbon concentration, and NO mole fraction in the burner zone calculated using mass-weighted averaging along the horizontal cross-sections. With the decrease in the burner zone SR, the temperature and the O2 and NO concentrations were lowered in the burner zone, and the differences between the values in these cases became greater after the OFA injection. In contrast, the solid carbon concentration increased below the lower burners, which resulted in UBC in the bottom ash, especially in Case 3. This was the result of a lower air flow rate in the burners and a corresponding decrease in the gas velocity.
Table 5 summarizes the key performance parameters for Cases R and 1–3, including the UBC contents in ash, carbon conversion, boiler efficiency, furnace exit gas temperature (FEGT), and NO emission. With the decrease in the burner zone SR from 1.22 (Case 1) to 0.99 (Case 3), the release rate and UBC content of the bottom ash increased, thus resulting in a lower carbon conversion and boiler efficiency. In Case 3, the amount of bottom ash was as large as 1663.9 kg/h with a significant decrease in carbon conversion (96.02%), which led to the lowest boiler efficiency (82.8%). A detailed analysis of particle tracking (not shown) for Case 3 revealed that approximately 97% of the 2178-µm particles and 100% of the 2700-µm particles were released as bottom ash. The FEGT after the platen SH was lowered by the decrease in carbon conversion, which could aid in lowering the high-temperature slagging propensity [4]. The NO emission decreased by approximately 10 ppm with an increase in the degree of air staging, which was consistent with the literature [15,16,19]. Overall, deeper air staging from the current operation practice was unacceptable in terms of the boiler efficiency and UBC, although the lower NO emission and FEGT were favorable.

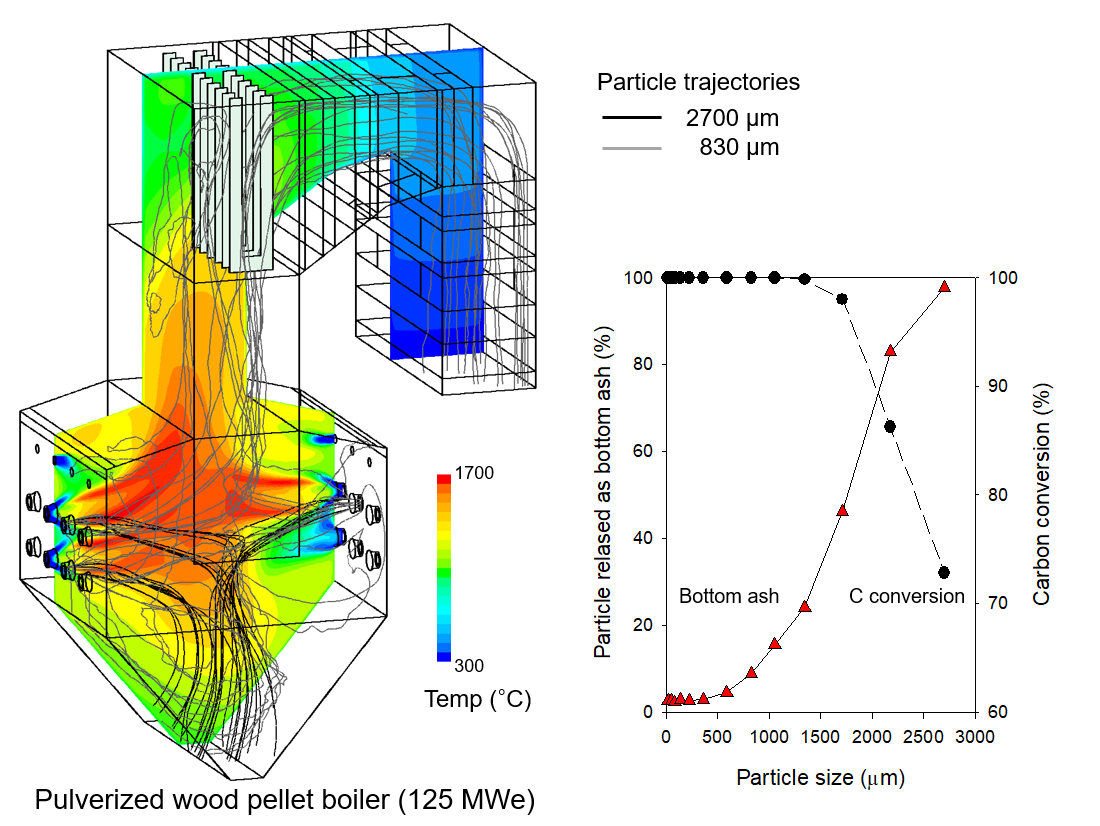
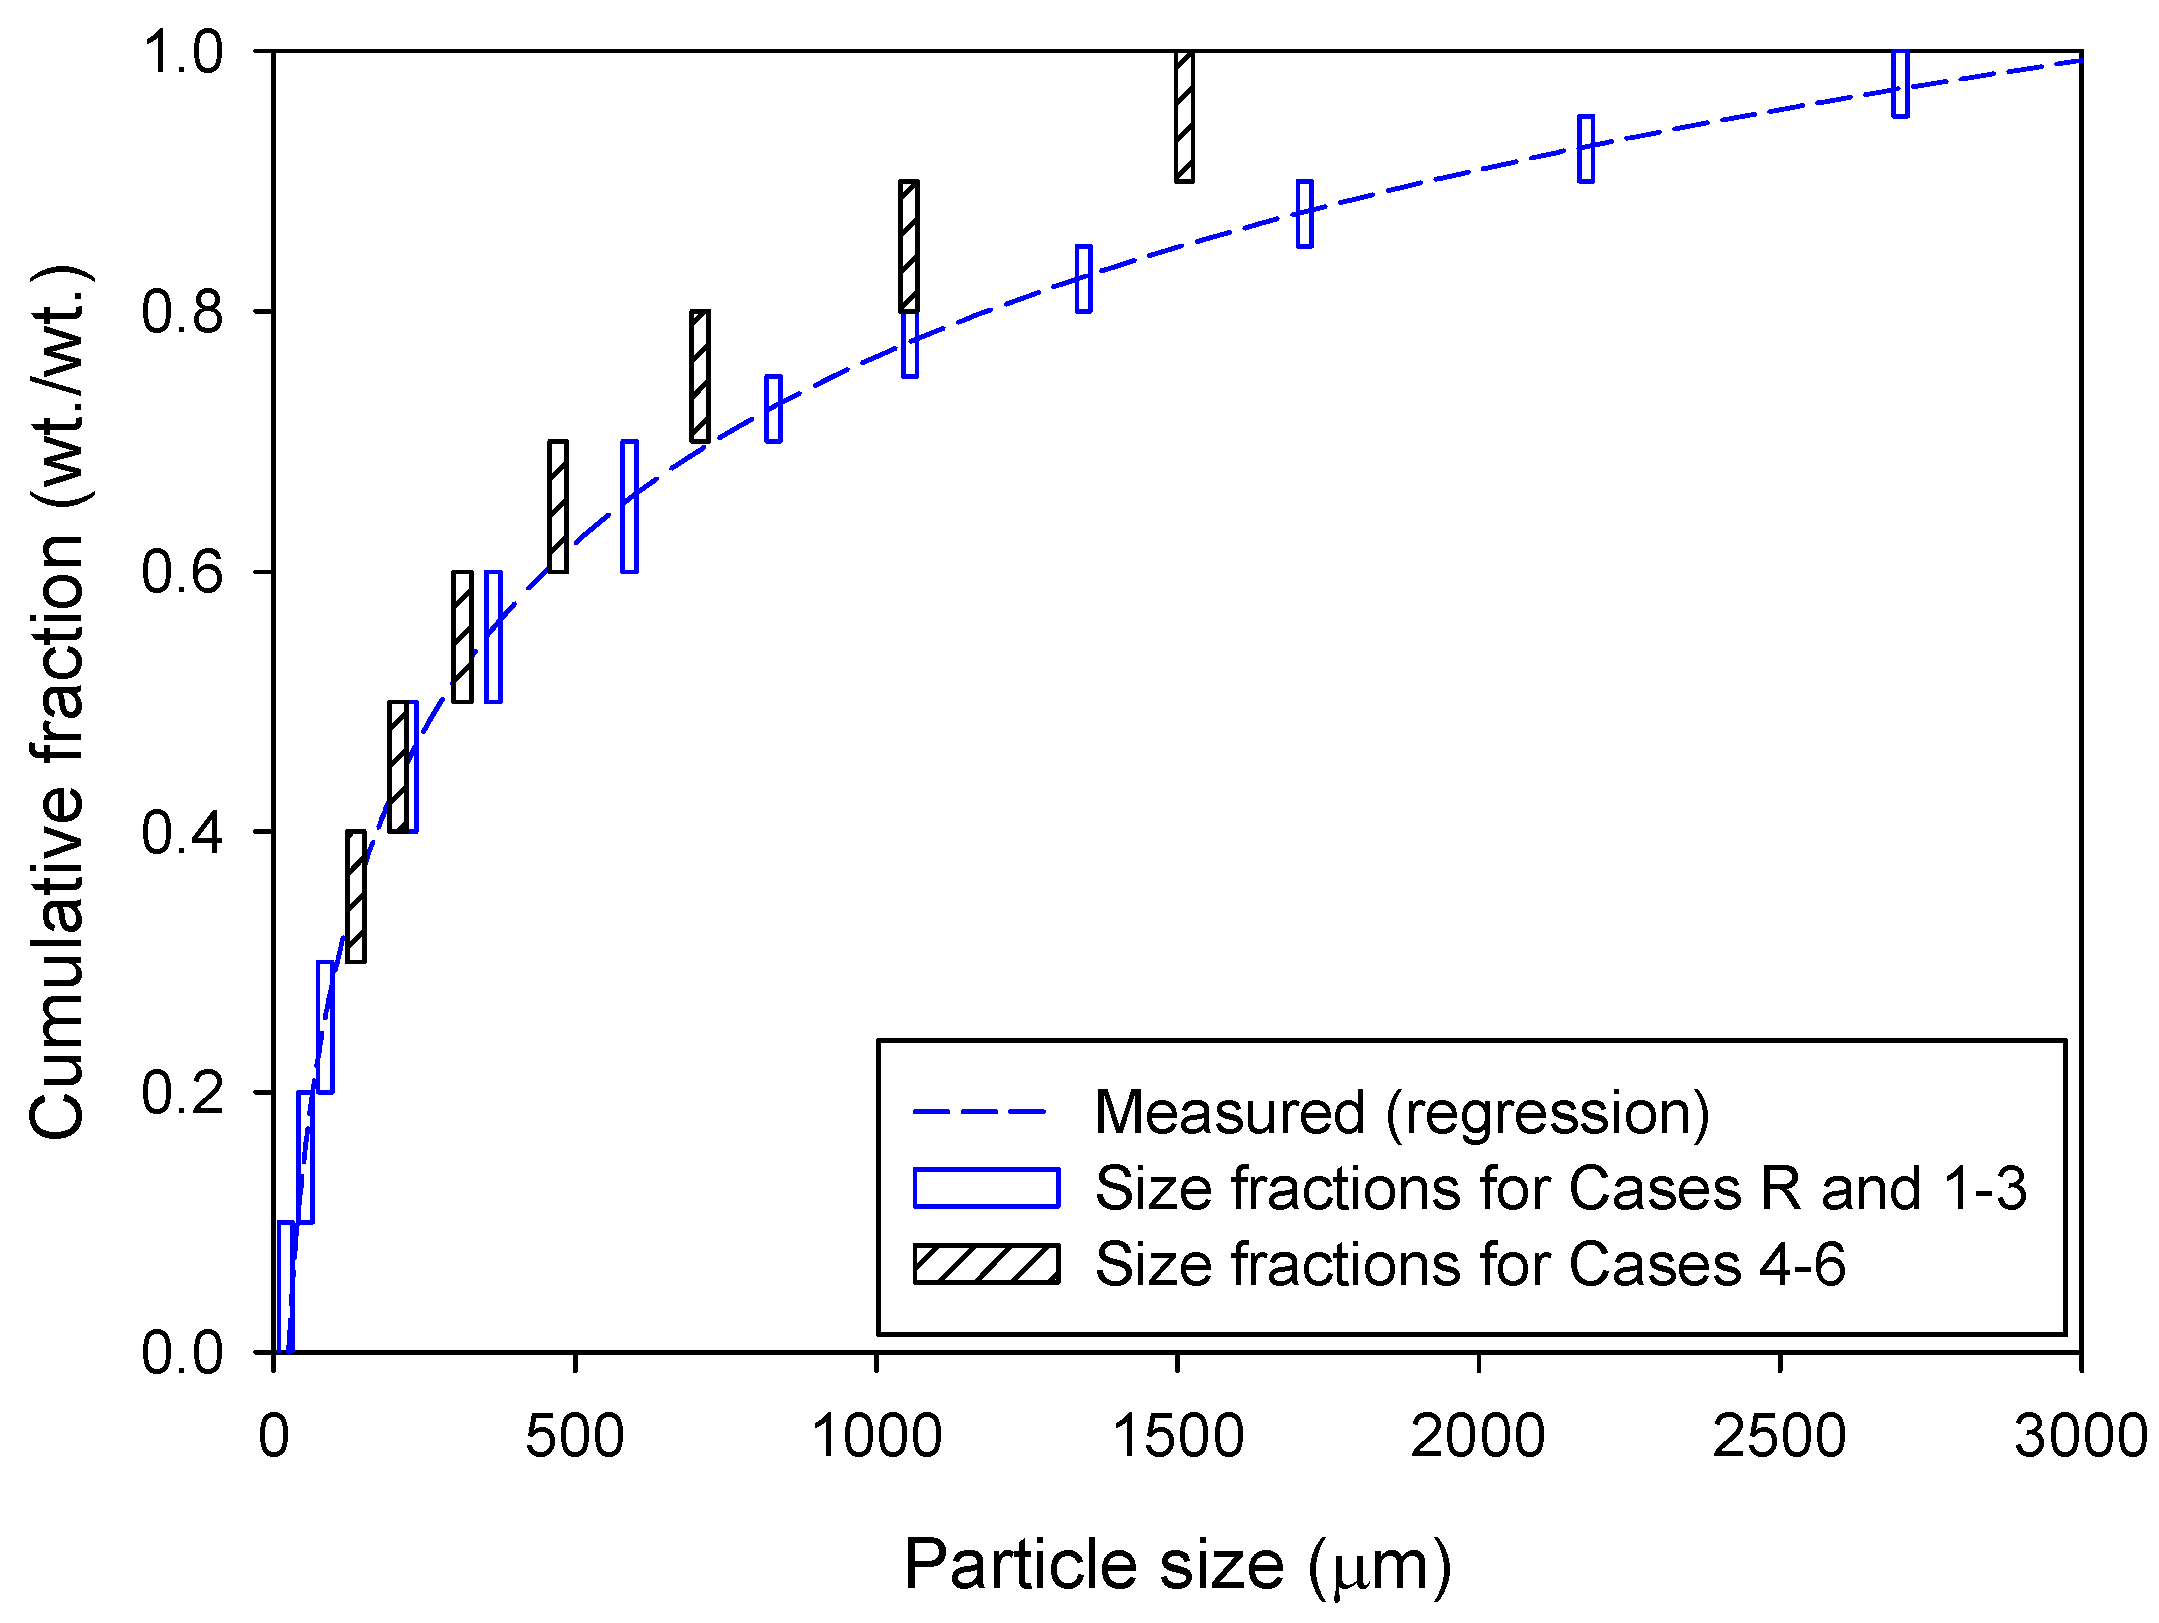
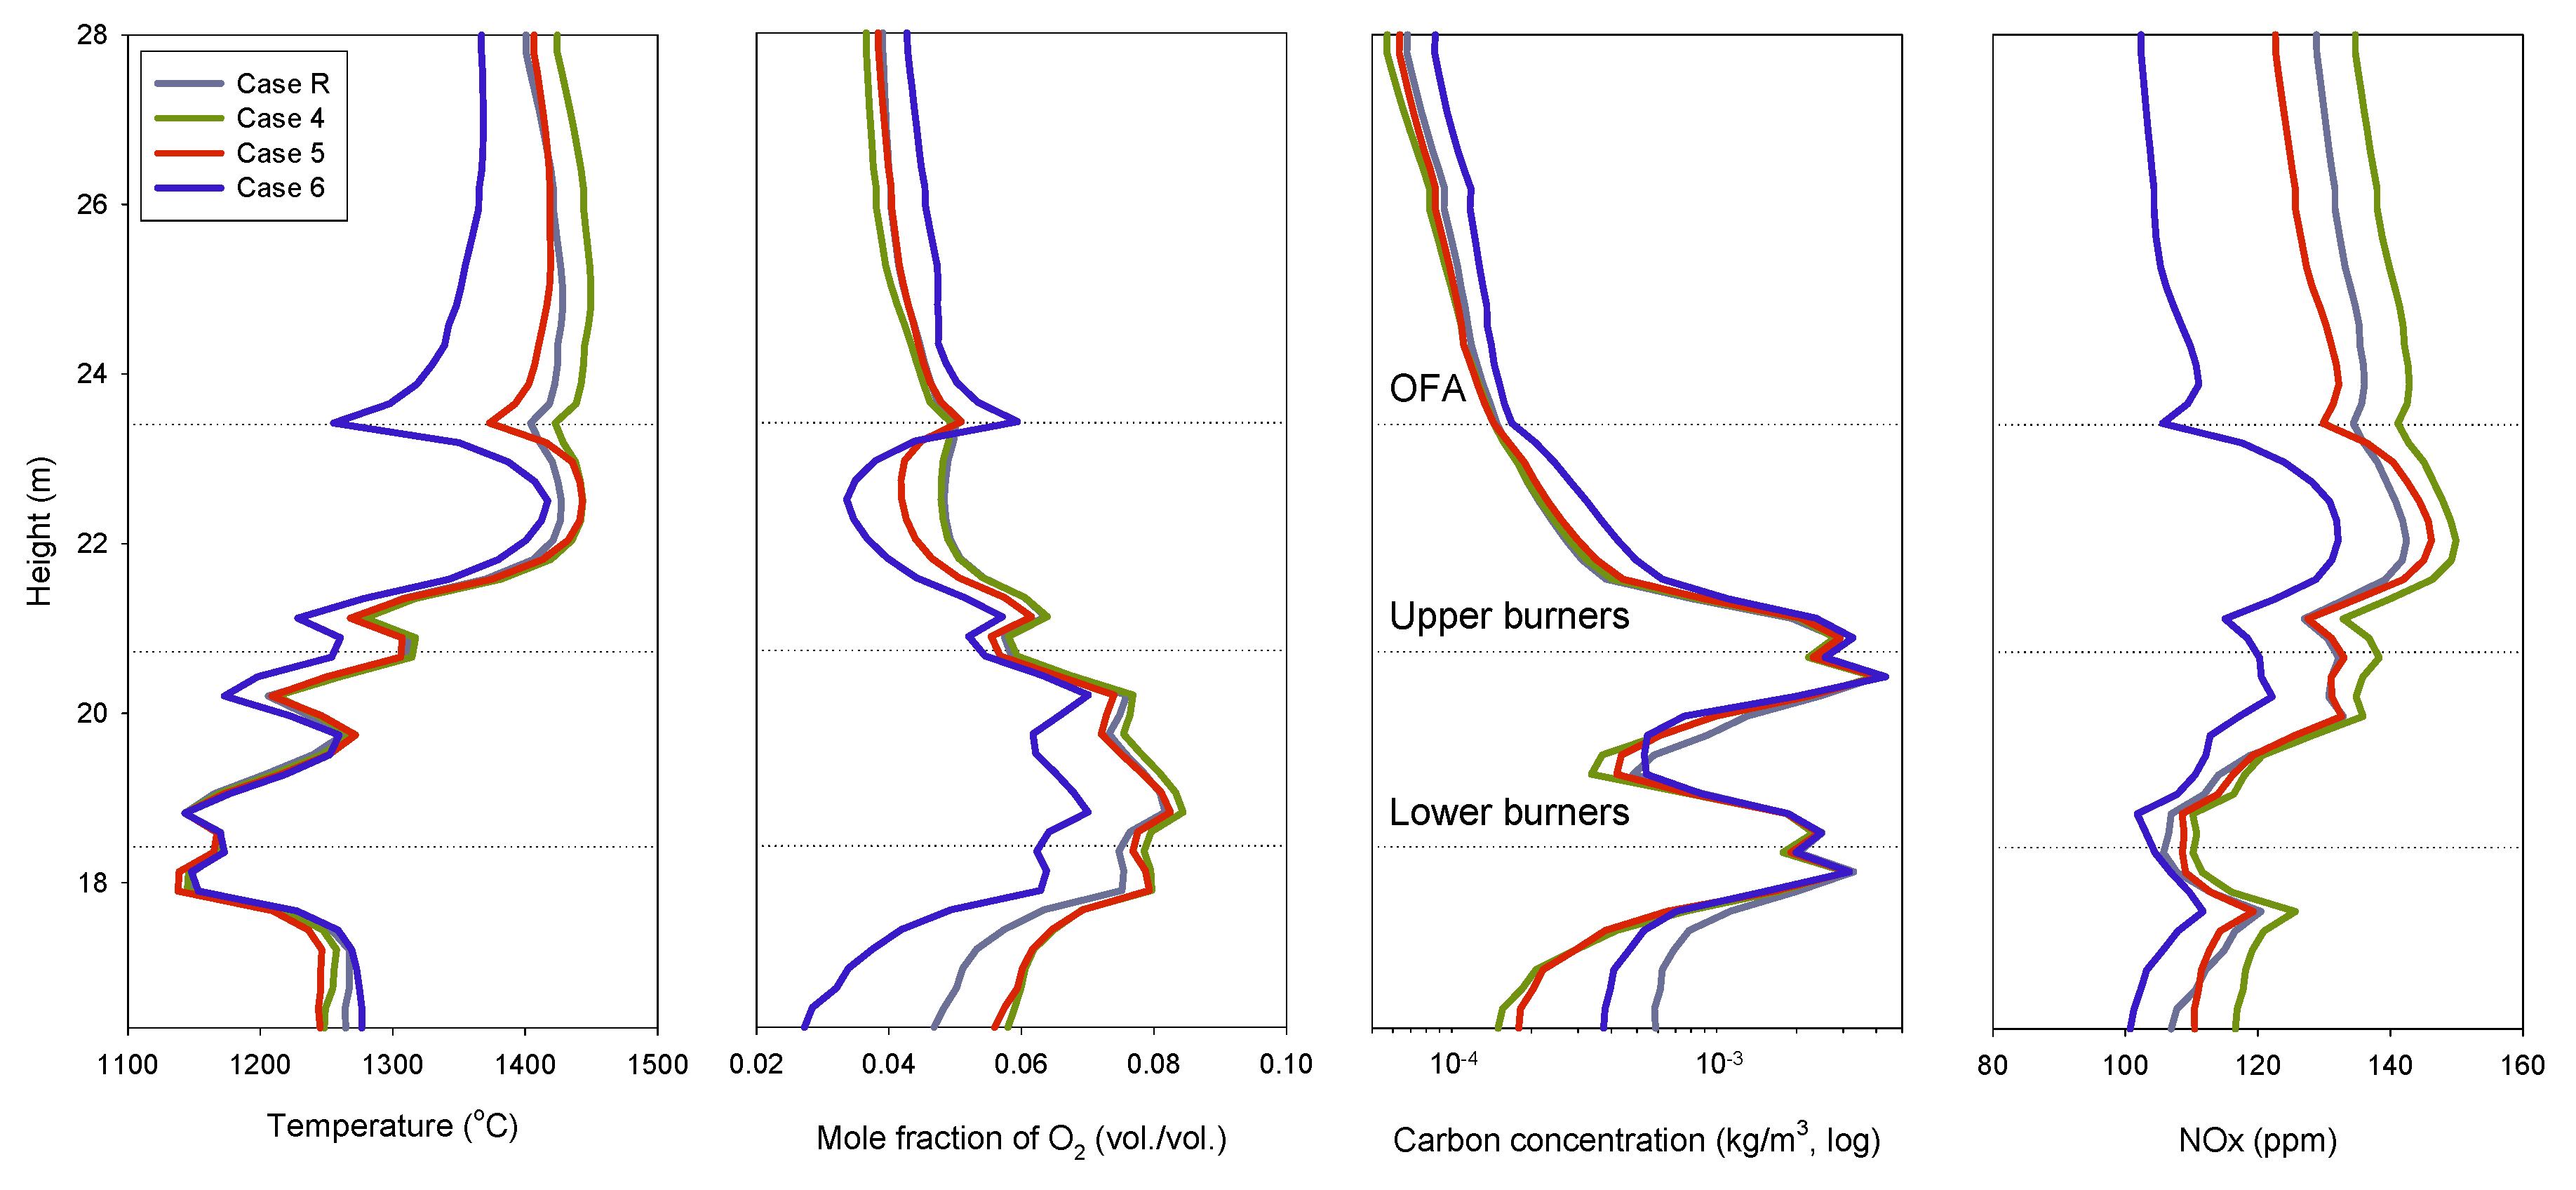
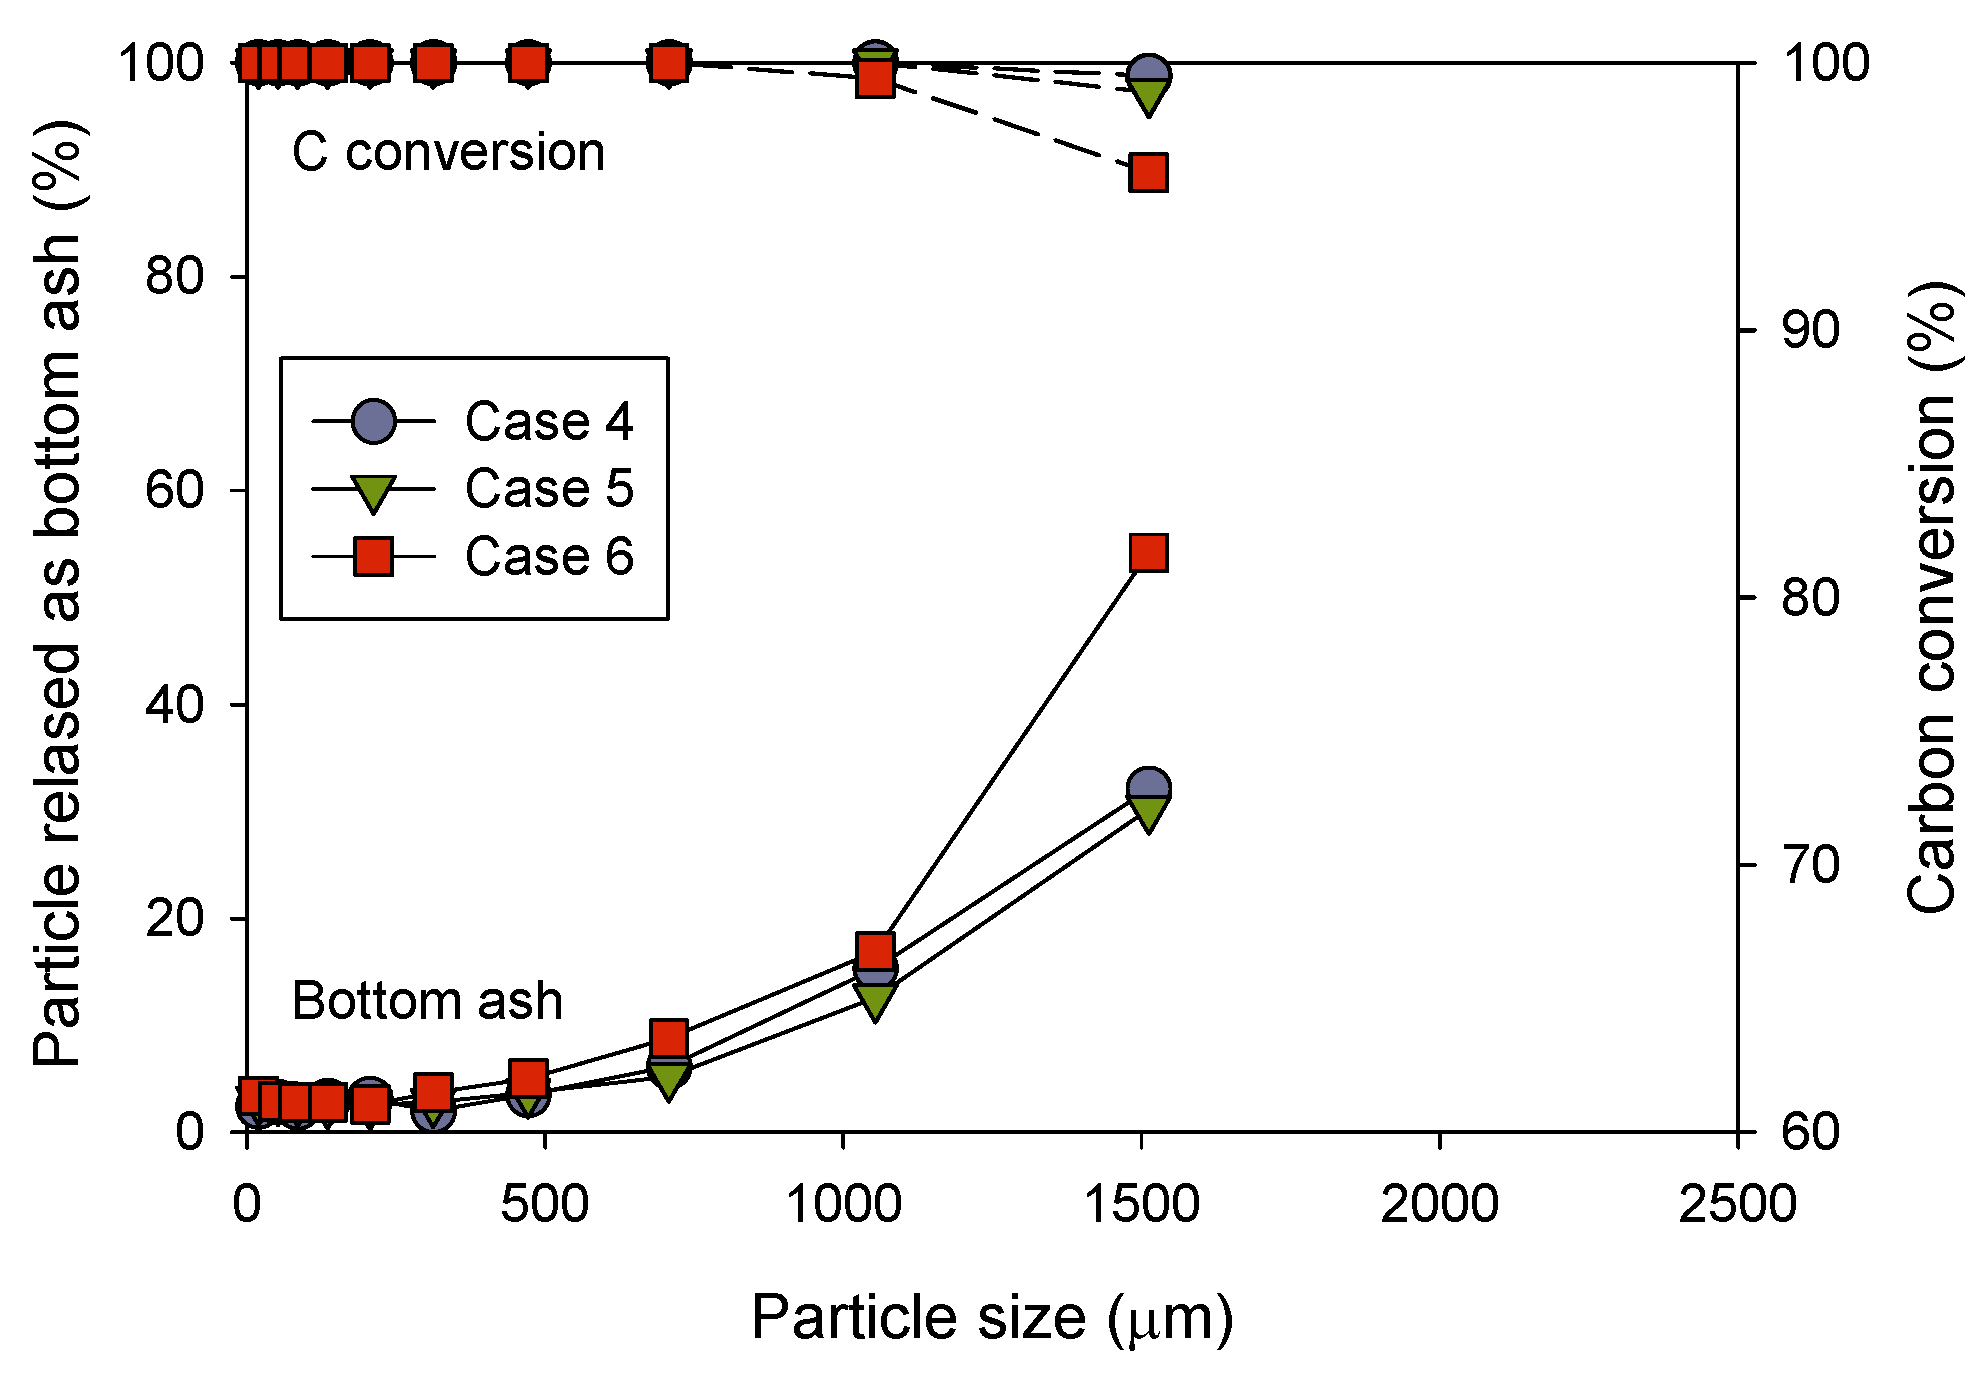
3.4. CFD Results for Decrease in Particle Sizes (Cases 4–6)

Since the contribution of large particles to the UBC increased rapidly for those larger than 1500 μm, the potential benefits of improving the pulverization efficiency were evaluated in Cases 4–6 by assuming smaller fuel particles having the size distribution plotted in Figure 2. Figure 9 shows the average profiles of the temperature and species concentrations for Cases 4–6. As compared to Case R, Case 4, with an identical air distribution, demonstrated slight increases in the average temperature and NO concentrations owing to a more intensive combustion of the smaller particles in the flames. The trends in Cases 5 and 6 were very similar to those for the respective cases of the same burner zone SR with the original particle sizes shown in Figure 8. However, the solid carbon concentrations at the top and bottom of the graph exhibited a major decrease, thus indicating much lower UBC contents in the ash.
Figure 10 presents the ash partitioning and carbon conversion for different particles used in Cases 4–6. As compared to Case R shown in Figure 6, the observed trends were similar while the size fractions larger than 1.5 mm were removed. Since the minimum carbon conversion was as high as 95.9% (for dp of 1.5 mm in Case 6), a major decrease in the UBC content was expected owing to the decrease in the particle sizes.
In the key performance parameters listed in Table 5, the UBC content in the bottom ash was 3.5% and 5.9% for Cases 4 and 5, respectively, which was a major achievement as compared to the UBC content of 69.6% in Case R. Further, the amount of bottom ash decreased to 143 kg/h or lower from 990 kg/h in Case R. Correspondingly, the boiler efficiency increased to 86%, which was very significant. However, the FEGT increased by 17.8–21.1 °C in Cases 4 and 5. In Case 6, with the deepest air staging, the UBC content became considerably higher (31.6% and 3.5% in the bottom and fly ash, respectively). The bottom ash release also increased to 289.4 kg/h by the lower velocity in the cross-section of the burner zone. The higher UBC content in the fly ash was because many char particles escaped the burner zone along the sidewalls without sufficient mixing with the OFA. These particles gathered in the large circulation region formed near the upper front wall and then entered the heat exchanger zones having temperatures not high enough to continue the char conversion. The high UBC content of the fly ash resulted in a lower FEGT but was not favorable owing to the lower boiler efficiency and ash disposal issues. Despite the more intensive combustion, the NO emissions in Cases 4–6 were similar to the respective case with the same burner zone SR for original particle sizes. Overall, the results suggest that the particle size reduction to ≤1.5 mm can facilitate a deeper air staging for lower NO emissions while achieving higher carbon conversion and boiler efficiency. The burner zone SR can be selected between 0.99 and 1.10. The particle size reduction can be achieved by modifying the dynamic air separator of the mills [5]; however, this increases the power consumption and decreases the biomass throughput. The use of a different type of mill [35] or pretreatment of the wood pellets via torrefaction [36] may be considered as more effective options for reducing the particle size, but these require a major capital investment.

3.5. CFD Results for Other Modifications in Boiler Operation (Cases 7 and 8)

CFD simulations were performed for two other options of lowering the swirl intensity of the burners (Case 7) and increasing the volume flow rate by FGR (Case 8). As summarized in Table 5, however, these cases were found to be ineffective in alleviating the problem of the high UBC content in the ash. When the tangential to axial velocity ratio of the burners in Case 7 was lowered to 0.7 from the value for Case R (0.8), the release of bottom ash (1079.9 kg/h) and its UBC content (71.4%) slightly increased from those of Case R. Having the air flow rate identical to that of Case R, the average velocity at the cross-sections of the burner zone in Case 7 did not change noticeably. However, the flames became narrower by the weaker swirl that led to locally higher particle concentrations stretched deeper into the middle of the furnace. The narrower flames also shrank the IRZ, resulting in a slight increase in the NO emission.
In Case 8, the volume flow rate at the burners was increased by 20% of the net flue gas recirculated to the secondary air and OFA. The FGR was helpful in decreasing the amount of bottom ash (906.8 kg/h) by increasing the average gas velocity. However, it also lowered the flame temperature which led to a poor carbon conversion and lower boiler efficiency. A more severe consequence was on the NO emission, increasing the exit NO concentration to 179.8 ppm. This was because the lower flame temperatures delayed the ignition and char conversion, spreading NO formation from the char to a wider area and deteriorating the NO reduction reactions within the flames. Furthermore, the NO contained in the FGR drawn before the selective catalytic reactor further increased the exit NO concentration by approximately 10 ppm.

4. Conclusions

The boiler in a power plant designed for anthracite combustion was modified to opposed wall firing for pulverized wood pellet combustion while maintaining the original arch firing outline. Despite the high reactivity of wood, the boiler suffers from a high UBC content in the bottom ash that causes a number of problems in the boiler performance including a low boiler efficiency and high NOx emission. Using CFD simulations, the reason for the high UBC content and methods for improving the boiler performance were investigated. The modeling approach was established to match the key performance parameters and UBC contents with those of the measured data for the reference case based on the plant operation survey. The CFD results for the reference case confirmed that the high UBC content in the bottom ash was associated with the poor grindability of the wood pellets and the low gas velocity in the wide cross-section of the burner zone in the arch firing outline. Lowering the stoichiometric ratio of the burner zone to fuel-rich conditions led to an increase in the release of bottom ash and its UBC content because it decreased the momentum of gas flow to entrain the char particles from the burner zone to the upper furnace. Therefore, the problem of the high UBC content prevented the introduction of proper air staging for a lower NOx emission. Adjusting the swirl intensity of the burner zone or introducing flue gas recirculation were not helpful in alleviating this problem. The only effective way was to reduce the particle sizes to smaller than 1.5 mm by improving the pulverization efficiency, which was also able to achieve a higher boiler efficiency with increased char conversion. This study shows the importance of fuel grindability at large utility boilers in fully exploiting the potential benefits of biomass, such as higher reactivity and lower fuel-N content compared to coal.

Author Contributions

Conceptualization, C.R. and Y.-g.-J.; methodology, J.L. and S.Y.; software, J.L. and S.Y.; validation, H.J. and J.P. (Jongkeun Park); formal analysis, J.P. (Jinje Park); investigation, H.J. and J.P. (Jongkeun Park); resources, S.Y. and J.P. (Jinje Park); data curation, J.P. (Jinje Park); writing—original draft preparation, J.L. and S.Y.; writing—review and editing, C.R.; visualization, J.P. (Jongkeun Park); supervision, C.R.; project administration, C.R.; funding acquisition, Y.-g.-J. All authors have read and agreed to the published version of the manuscript.

Funding

This work was funded by the Korea Institute of Energy Technology Evaluation and Planning (KETEP) affiliated with the Ministry of Trade, Industry and Energy of the Korean Government (Grant No. 20173010092550).

Acknowledgments

The authors would like to acknowledge Ho-Joon Ko and Ki-Jong Sung, from the Korea South-East Power Co. for their assistance for the plant data and fuel sample acquisition.

Conflicts of Interest

The authors declare no conflict of interest.

Nomenclature

Symbols
APre-exponential factor (s−1), surface area (m2)
cSpecific heat (J/kg·K)
CFDComputational fluid dynamics
dDiameter (cm)
EActivation energy (kJ/kmol)
ECOEconomizer
FEGTFurnace exit gas temperature (°C)
FGRFlue gas recirculation
hConvection coefficient (W/m2·K)
IRZInternal recirculation zone
KeqChemical equilibrium constant
kReaction rate (g·cm−2·atm−1·s−1)
NuNusselt number
OFAOverfire air
PPressure (atm)
PrPrandtl number
RUniversal gas constant, Reaction rate of char (g·cm−2·s−1)
ReReynolds number
SHSuperheater
SRStoichiometric ratio
TTemperature (K)
tTime (s)
UBCUnburned carbon
UCSMUnreacted core shrinking model
VVolatile matter (kg)
vVelocity (m/s)
YUnreacted char core to particle diameter ratio
Greek Symbols
θRRadiation temperature
εPorosity of the ash layer, Emissivity
σStefan–Boltzmann constant (5.67 × 10⁻⁸ (W/m2·K4))
Subscripts
axaxial direction
charUnreacted char core
diffDiffusion rate
dashDiffusion rate in the ash layer
iIndex of char conversion reaction
oInitial
pParticle
sSurface
tTotal pressure
tanTangential direction

References

  1. Fernando, R. Fuels for Biomass Cofiring; CCC/102; IEA Clean Coal Centre: London, UK, 2005. [Google Scholar]
  2. Sloss, L.L. Emissions from Cofiring Coal, Biomass and Sewage Sludge; CCC/175; IEA Clean Coal Centre: London, UK, 2010. [Google Scholar]
  3. Van Loo, S.; Koppejan, J. The Handbook of Biomass Combustion and Cofiring; Earthscan: London, UK, 2008. [Google Scholar]
  4. Hupa, M.; Karlström, O.; Vainio, E. Biomass combustion technology development–It is all about chemical details. Proc. Combust. Inst. 2017, 36, 113–134. [Google Scholar] [CrossRef]
  5. Esteban, L.S.; Carrasco, J.E. Evaluation of different strategies for pulverization of forest biomasses. Powder Technol. 2006, 166, 139−151. [Google Scholar] [CrossRef]
  6. Saastamoinen, J.; Aho, M.; Moilanen, A.; Sørensen, L.H.; Clausen, S.; Berg, M. Burnout of pulverized biomass particles in large scale boiler–single particle model approach. Biomass Bioenergy 2010, 34, 728−736. [Google Scholar] [CrossRef]
  7. Panahi, A.; Tarakcioglu, M.; Schiemann, M.; Delichatsios, M.; Levendis, Y.A. On the particle sizing of torrefied biomass for co-firing with pulverized coal. Combust. Flame 2018, 194, 72−84. [Google Scholar] [CrossRef]
  8. Magalhães, D.; Panahi, A.; Kazanç, F.; Levendis, Y.A. Comparison of single particle combustion behaviours of raw and torrefied biomass with Turkish lignites. Fuel 2019, 241, 1085−1094. [Google Scholar] [CrossRef]
  9. Li, J.; Paul, M.C.; Younger, P.L.; Watson, I.; Hossain, M.; Welch, S. Characterization of biomass combustion at high temperatures based on an upgraded single particle model. Appl. Energy 2015, 156, 749−755. [Google Scholar] [CrossRef] [Green Version]
  10. Li, J.; Paul, M.C.; Younger, P.L.; Watson, I.; Hossain, M.; Welch, S. Prediction of high-temperature rapid combustion behaviour of woody biomass particles. Fuel 2016, 165, 205−214. [Google Scholar] [CrossRef] [Green Version]
  11. Mason, P.E.; Darvell, L.I.; Jones, J.M.; Pourkashanian, M.; Williams, A. Single particle flame-combustion studies on solid biomass fuels. Fuel 2015, 151, 21−30. [Google Scholar] [CrossRef]
  12. Karlström, O.; Hupa, L. Energy conversion of biomass char: Oxidation rates in mixtures of O2/CO2/H2O. Energy 2019, 181, 615−624. [Google Scholar] [CrossRef]
  13. Cha, J.S.; Park, S.H.; Jung, S.-C.; Ryu, C.; Jeon, J.-K.; Shin, M.-C.; Park, Y.-K. Production and utilization of biochar: A review. J. Ind. Eng. Chem. 2016, 40, 1−15. [Google Scholar] [CrossRef]
  14. Williams, A.; Jones, J.M.; Pourkashanian, M. Pollutants from the combustion of solid biomass fuels. Prog. Energy Combust. Sci. 2012, 38, 113−137. [Google Scholar] [CrossRef]
  15. Nalbandian, H. NOx Control for Coal-Fired Plant; CCC/157; IEA Clean Coal Centre: London, UK, 2009. [Google Scholar]
  16. Glarborg, P.; Jensen, A.D.; Johnsson, J.E. Fuel nitrogen conversion in solid fuel fired systems. Prog. Energy Combust. Sci. 2003, 29, 89−113. [Google Scholar] [CrossRef]
  17. Riaza, J.; Mason, P.; Jones, J.M.; Gibbins, J.; Chalmers, H. High temperature volatile yield and nitrogen partitioning during pyrolysis of coal and biomass fuels. Fuel 2019, 248, 215–220. [Google Scholar] [CrossRef]
  18. Wang, X.; Hu, Z.; Deng, S.; Xiong, Y.; Tan, H. Effect of biomass/coal co-firing and air staging on NOx emission and combustion efficiency in a drop tube furnace. Energy Procedia 2014, 61, 2331−2334. [Google Scholar] [CrossRef] [Green Version]
  19. Jo, H.; Kang, K.; Park, J.; Ryu, C.; Ahn, H.; Go, Y. Optimization of air distribution to reduce NOx emission and unburned carbon for the retrofit of a 500 MWe tangential-firing coal boiler. Energies 2019, 12, 3281. [Google Scholar] [CrossRef] [Green Version]
  20. Jo, H.; Kang, K.; Park, J.; Ryu, C.; Ahn, H.; Go, Y. Detailed assessment of mesh sensitivity for CFD simulation of coal combustion in a tangential-firing boiler. J. Mech. Sci. Technol. 2020, 34, 917–930. [Google Scholar] [CrossRef]
  21. Haider, A.; Levenspiel, O. Drag coefficient and terminal velocity of spherical and nonspherical particles. Powder Technol. 1989, 58, 63–70. [Google Scholar] [CrossRef]
  22. Li, J.; Brzdekiewicz, A.; Yang, W.; Blasiak, W. Co-firing based on biomass torrefaction in a pulverized coal boiler with aim of 100% fuel switching. Appl. Energy 2012, 99, 344–354. [Google Scholar]
  23. Ranz, W.E.; Marshall, W.R. Evaporation from Drops. Part I. Chem. Eng. Prog. 1952, 48, 141–146. [Google Scholar]
  24. Niksa, S. PC Coal Lab Version 4.1: User Guide and Tutorial; Niksa Energy Associates LLC.: Belmont, MA, USA, 1997. [Google Scholar]
  25. Wen, C.Y.; Chaung, T.Z. Entrainment coal Gasification Modeling. Ind. Eng. Chem. Process. Des. Dev. 1979, 18, 684–695. [Google Scholar] [CrossRef]
  26. Smith, K.L.; Smoot, L.D.; Fletcher, T.H.; Pugmire, R.J. The Structure and Reaction Processes of Coal; Plenum Press: New York, NY, USA, 1994. [Google Scholar]
  27. Jones, W.P.; Lindstedt, R.P. Global reaction schemes for hydrocarbon combustion. Combust. Flame 1988, 73, 233–249. [Google Scholar] [CrossRef]
  28. Magnussen, B.F.; Hjertager, B.H. On mathematical models of turbulent combustion with special emphasis on soot formation and combustion. Proc. Combust. Inst. 1977, 16, 719–729. [Google Scholar]
  29. Shih, T.H.; Liou, W.W.; Shabbir, A.; Yang, Z.; Zhu, J. A new k-ε eddy-viscosity model for high Reynolds number turbulent flows - model development and validation. Comput. Fluids 1995, 24, 227–238. [Google Scholar]
  30. Smith, T.F.; Shen, Z.F.; Friedman, J.N. Evaluation of coefficients for the weighted sum of gray gases model. J. Heat Transf. 1982, 104, 602–608. [Google Scholar] [CrossRef]
  31. Park, J.K.; Park, S.; Kim, M.K.; Ryu, C.; Baek, S.H.; Kim, Y.J.; Kim, H.H.; Park, H.Y. CFD analysis of combustion characteristics for fuel switching to bioliquid in oil-fired power plant. Fuel 2015, 159, 324–333. [Google Scholar] [CrossRef]
  32. Jakob, M. Heat transfer and flow resistance in cross flow of gases over tube banks. Trans. ASME 1938, 60, 384–386. [Google Scholar]
  33. Zukauskas, A. Heat transfer from tubes in crossflow. Adv. Heat Transf. 1972, 8, 93–160. [Google Scholar] [CrossRef]
  34. De Soete, G.G. Overall reaction rates of NO and N2 formation from fuel nitrogen. Proc. Combust. Inst. 1975, 15, 1093–1102. [Google Scholar] [CrossRef]
  35. Williams, O.; Newbolt, G.; Eastwick, C.; Kingman, S.; Giddings, D.; Lormor, S.; Lester, E. Influence of mill type on densified biomass comminution. Appl. Energy 2016, 182, 219−231. [Google Scholar] [CrossRef]
  36. Yu, S.; Park, J.; Kim, M.; Kim, H.; Ryu, C.; Lee, Y.; Yang, W.; Jeong, Y. Improving energy density and grindability of wood pellets by dry torrefaction. Energy Fuels 2019, 33, 8632–8639. [Google Scholar] [CrossRef]
Figure 1. Schematic of the 125 MWe wood pellet-fired boiler.
Energies 13 05077 g001
Figure 2. Particle size distribution of the pulverized wood pellets.
Energies 13 05077 g002
Figure 3. CFD results for Case R: (a) pathlines encoded with velocity magnitude and (b) temperature contours.
Energies 13 05077 g003
Figure 4. Proportion of the area at two horizontal planes with z-velocity smaller than the terminal velocity of fresh char particles in Case R.
Energies 13 05077 g004
Figure 5. Particle trajectories coded with the normalized char mass for different particle sizes in Case R: (a) dp = 830 μm, (b) 1711 μm, and (c) 2700 μm.
Energies 13 05077 g005
Figure 6. Analysis of bottom ash for various particle sizes in Case R: (a) ratio of particles released as bottom ash and (b) carbon conversion and unburned carbon (UBC) content.
Energies 13 05077 g006aEnergies 13 05077 g006b
Figure 7. CFD results related to NO emission in Case R: (a) NO concentration, (b) net reaction rate of NO, and (c) O2 mole fraction.
Energies 13 05077 g007
Figure 8. Mass-weighted average profiles of temperature, O2 mole fraction, solid carbon, and NO concentrations for Cases 1–3 with different air flow distributions.
Energies 13 05077 g008
Figure 9. Mass-weighted average profiles of temperature, O2 mole fraction, solid carbon, and NO concentrations for Cases 4–6 with smaller particle sizes.
Energies 13 05077 g009
Figure 10. Ratio of particles released as bottom ash and carbon conversion in Cases 4–6 with smaller particle sizes (≤1.5 mm).
Energies 13 05077 g010
Table 1. Wood pellet properties and operating conditions of the 125 MWe boiler.
ParameterValues
Wood pelletProximate analysis (% wet): Total moisture 8.90, volatile matter 73.77, fixed carbon 14.85, ash 2.48
Ultimate analysis (% dry, ash-free): C 49.65, H 5.62, O 44.32, N 0.41
Higher heating value (MJ/kg): 17.11
Fuel throughput76,800 kg/h
Burner primary air122,920 kg/h, 159 °C at the mill inlet
Burner secondary air331,888 kg/h, 315 °C
OFA22,275 kg/h, 315 °C
Excess air ratio21.6%
Table 2. Simulation cases for adjustment of operating conditions and further retrofitting of the boiler.
CaseBurner Secondary Air Ratio (%)Burner Zone Stoichiometric RatioOFA Ratio (%)Note
F1F2R2
R23.023.023.01.164.7Reference case
124.624.624.61.220Different air staging
221.521.521.51.109.4
318.418.418.40.9918.7
423.023.023.01.164.7Smaller fuel particles (Figure 2) with different air staging
521.521.521.51.109.4
618.418.418.40.9918.7
723.023.023.01.164.7Lower swirl intensity (vtan/vax = 0.7)
823.023.023.01.164.7Flue gas recirculation (20%)
Table 3. Reaction submodels adopted in the CFD.
CategorySubmodels
Discrete phase—Lagrangian scheme with stochastic tracking for turbulence
—Number of particles: 74,800
—Particle size: 10–2700 μm
Biomass combustion—Devolatilization: bio-FLASHCHAIN [24]
Dry biomass→77.80 wt.% daf volatiles + 19.62 wt.% daf C(s) (Char)
Composition of volatiles: Tar 31.2, CO 34.1, CO2 5.7, H2O 11.6, H2 0.91, CH4 1.19, CxHy 8.31 wt.% daf
Devolatilization rate:
d V d t = A   exp ( E R T ) ( V 0 V ) ; E = 18.5 kcal/mol, A= 1.03 × 10⁷ s−1
—Char conversion: unreacted core shrinking model [25]
R c h a r , i = 5 1 k d i f f , i + 1 10 k s , i Y 2 + 1 k d a s h , i ( 1 Y 1 ) ( P i P i * ) ( g   cm 2   s 1 )
k d a s h = k d i f f ε 2.5 , Y = d c h a r / d p
(R1) C(s) + 0.5 O2 → CO
k s = 8710 exp ( 17967 / T s ) ,   k d i f f = 1.383 × 10 3 ( T / 1800 ) 0.75 / ( P t d p )
P i P i * = P O 2
(R2) C(s) + H2O → CO+H2
k s = 247 exp ( 21060 / T s ) ,   k d i f f = 1 × 10 3 ( T 2000 ) 0.75 / ( P t d p )
P i P i * = P H 2 O ( P H 2 P C O ) / K e q ,   K e q = exp ( 17.644 30260 / ( 1.8 T s ) )
(R3) C(s) + CO2 → 2 CO
k s = 247 exp ( 21060 / T s ) ,   k d i f f = 7.45 × 10 4 ( T / 2000 ) 0.75 / ( P t d p )          
P i P i * = P C O 2
Species, gas reaction—Species: Tar, CO, CO2, H2, CH4, CxHy, H2, SO2, O2, N2
—Reaction mechanism [26,27]
(R4) CxHyOz (tar) + a x2+y4-z2)O2 → x CO + 0.5y H2
(R5) CnHm + 0.5n x2+y4-z2)O2 → n CO + 0.5m H2
(R6) CnHm + 0.5n Hx2+y4-z2)2O → n CO + 0.5(m+n) H2
(R7) CH4 + 0.5 x2+y4-z2)O2 → CO + 2 H2
(R8) CH4 + 0.5 Hx2+y4-z2)2O → CO + 2.5 H2
(R9) CO + H2O → CO2 + H2
(R10) H2 + 0.5 O2 → H2O
—Reaction rate: kinetic rate/eddy dissipation rate model [28]
NOx—Thermal NOx: extended Zeldovich mechanism
—Fuel NOx: De Soete model [34]
—Fuel-N evenly distributed between volatile-N as NH3 and char-N as NO
—NO reduction on the particle surface with a N2-BET surface area of 200 m2/g
Table 4. Comparison of CFD results and measured data for the reference case (Case R).
ParameterMeasured DataCFD
Exit O2 (% dry)3.724.1
Exit gas temperature (°C)354.5367.6
Exit NO (ppm, 6% O2)81.2107.6
Heat absorption (MWth)Evaporator148.4148.8
Platen+ Primary SH65.165.4
Final SH31.631.9
RH46.046.5
Economizer15.715.0
UBC (wt%)Bottom ash61.769.6
Fly ash1.91.3
Table 5. Comparison of key performance parameters predicted by CFD simulations.
CaseBurner Zone Stoichiometric RatioUnburned Carbon Content (%)Bottom Ash Release (kg/h)Carbon Conversion (%)Boiler Efficiency (%)Furnace Exit Gas Temp. (°C)Exit NO (ppm, 6% O2)
Fly AshBottom Ash
R1.161.369.6990.097.8484.31117.8107.6
11.222.868.7984.997.8184.21140.9120.1
21.101.670.71066.697.6384.01115.498.5
30.992.476.61663.996.0282.81099.484.3
41.160.73.5143.499.9586.01138.9111.1
51.101.65.9139.399.8985.91135.6101.3
60.993.531.6287.499.5485.61125.985.4
71.160.771.41079.997.6384.01112.0108.4
81.166.269.3906.897.7682.81086.9179.8

