Article

Efficiency versus Equity in Spatial Siting of Electricity Generation: Citizen Preferences in a Serious Board Game in Switzerland

by
Franziska Steinberger
1,
Tobias Minder
1 and
Evelina Trutnevyte
1,2,*
1
Department of Environmental Systems Science, Institute for Environmental Decisions (IED), ETH Zurich, 8092 Zurich, Switzerland
2
Renewable Energy Systems, Institute for Environmental Sciences (ISE), Section of Earth and Environmental Sciences, University of Geneva, 1211 Geneva, Switzerland
*
Author to whom correspondence should be addressed.
Energies 2020, 13(18), 4961; https://doi.org/10.3390/en13184961
Submission received: 28 April 2020 / Revised: 14 September 2020 / Accepted: 15 September 2020 / Published: 22 September 2020
(This article belongs to the Section C: Energy Economics and Policy)

Abstract

:
Energy transitions around the world will change the spatial fingerprint of the electricity sector, but there is a lack of studies on citizen preferences for siting the future mix of electricity technologies. Using the case of Switzerland in 2035, we present a serious board game to form and elicit citizen preferences for spatial siting of a full mix of electricity technologies and we test this game with 44 participants in the city of Zurich. The game proves to help elicit valid preferences of the participants and lead to measurable learning effects about this complex, multi-dimensional topic. The results show that these 44 participants prefer a diverse mix of renewable technologies for Switzerland in 2035. In terms of siting, these participants consistently choose the efficiency strategy, where new plants are concentrated in the areas where they produce most electricity at least cost, in contrast to the strategy of regional equity, where all Swiss regions would equally build new generation and share the benefits and burdens of the energy transition.

1. Introduction

The Paris Agreement to mitigate climate change globally [1], the European Union’s long-term strategy of net-zero emissions [2], and many national plans for energy transition [3,4,5] include ambitious targets of low-carbon energy supply. Energy efficiency and high shares of renewable energy are increasingly considered to be feasible and desirable for meeting these targets [6,7,8]. For example, on the supply side, the Swiss Energy Strategy 2050 [9] and the Swiss Federal Energy Act [10] aim to increase new renewable electricity supply from solar cells (PV), wind, geothermal, or biomass from 2.7 TWh in 2018 to 11.4 TWh until 2035, in addition to already well-established hydropower. Hydropower already covers two-thirds of the electricity mix in Switzerland and, after the planned nuclear phase-out, techno-economic analyses indicate that the major share or even the full electricity mix would need to be based on renewable technologies [11,12,13]. Once disaggregated and regionalized, such scenarios with high shares of decentralized renewable technologies reveal all the more ambitious nature of the Swiss transition [13,14,15]. As compared to today, where five nuclear reactors in four locations supply over a third of the Swiss electricity, the future electricity mix will undoubtedly change the spatial fingerprint of the electricity sector.
Like all industrial activity, renewable technologies carry various costs, risks, and benefits to human health, safety, economy, and the environment [16,17,18,19]. There is no single technology that comes only with benefits. For example, wind power has generally low life-cycle environmental impacts, but adds to mineral scarcity, whereas small hydropower has comparatively high impacts on flora and fauna or water systems, despite low life-cycle impacts on climate change or air pollution [20]. Due to the irregular spatial distribution of renewable resource potential, some sub-national regions will be affected by the electricity sector transition more than others [13,18,21]. Two idealized strategies for siting new renewable generation can be distinguished [13,19,22,23]. First, new renewable generation could be located following the efficiency or least-cost principle and would be mainly concentrated in a few most productive locations, for instance, with the highest solar irradiation or wind speeds. In this case, a smaller number of regions would bear all the costs, risks, and benefits. Alternatively, renewable generation could be sited in a regionally even manner, sacrificing some productivity and cost performance, but ensuring a more equitable distribution of costs, risks, and benefits across sub-national regions and an easier integration into the grid [13,19]. The pros and cons of the two strategies were investigated in Switzerland [13], Germany [22], European Union [19], United States [24,25], African countries [26,27], and elsewhere. The preferred strategy is ultimately a question of values rather than factual analysis [13,23]. There are many spatial investigations of the technical, environmental, or socio-economic dimensions of renewable generation that mostly focus on the advantages and disadvantages of various siting scenarios [19,28,29,30,31,32,33]. However, spatial analyses that also incorporate the value judgments of citizens or stakeholders are rarer [34,35,36,37,38,39]. Existing participatory studies primarily revolve around the spatial planning of concrete energy projects in specific locations [37,40,41] rather than on more holistic value judgments on efficiency versus regional equity.
On a parallel track, social scientific literature to date mostly focuses on assessing citizen preferences for individual technologies or technology mixes without any spatial dimensions [42,43,44,45,46]. Since citizens show ever-increasing preferences for renewable technologies [46,47,48] and since most renewable technologies are needed anyway to reach ambitious transition targets, limited useful conclusions can be drawn from these generic technology preferences. Technology location is a factor that also contributes to citizen preferences, for example, when wind power is perceived positively elsewhere, but not in one’s own community [49,50]. On a regional level, citizen preferences have been elicited for tolerable distances from residential or protected areas to large solar facilities [34] or enhanced geothermal systems [51]. In the case of nuclear power, citizen preferences have been shown to change non-monotonously with increasing distance from the plant [52]. However, no study exists to date on citizen preferences for complete technology mixes at a national or sub-national level, including the spatial dimension of where these technologies should be located.
Eliciting robust citizen preferences for such a complex topic as the tradeoff between efficient versus regionally equitable siting of a full mix of technologies, including renewable technologies, is challenging. If elicited in conventional surveys, the preferences could be biased and would not represent the actual value judgments of the citizens for several reasons. The opinions of non-experts are often distorted by misconceptions and awareness gaps [53,54], for example, when nuclear power is believed to emit direct greenhouse gas emissions, natural gas is perceived as renewable, or enhanced geothermal systems are thought to have a potential to induce a vulcanic eruption [44,53]. Especially for new technologies [44,45,55], the citizens may not yet have fully formed and stable opinions and first need to go through the process of preference formation to be able to articulate these preferences [56,57]. The process of preference formation is cognitively demanding and requires motivation, effort, time, and skill [58,59,60]. Various methodologies have been proposed in order to engage citizens in the process of learning, for instance, by reading factsheets and participating in group discussions [42,43,44,45]. In other environmental fields, serious games have been used to simplify highly complex topics for individual learning as well as for facilitating the participant’s appreciation of the opinions of others [58,61]. Although multiple serious games on energy exist, for example, to motivate behavior to reduce energy consumption or to explain pathways to climate change mitigation [61,62], the potential of such games to investigate the spatial dimension of technology siting remains to be explored.
We present a new approach that can be used to form and elicit citizen preferences for spatial siting of the full electricity mix, especially distinguishing between efficient versus regionally equitable siting of new technologies. Using the case of the Swiss electricity sector in 2035, we created a serious board game that introduces its participants to the key tradeoffs of the spatial siting of new technologies and enables the formation and elicitation of the participants’ value judgments. We conducted five participatory workshops with 44 participants in total in the city of Zurich in Switzerland, where we tested the game and measured the evolution of the citizen preferences before, during, and after the game to document any changes. This study thus makes two types of new contributions due to its focus on technology siting: a methodological contribution by using a serious board game to investigate citizen preferences for spatial siting of the full electricity mix, and a practical contribution in the form of the value judgments of the Swiss citizens about technology siting.

2. Materials and Methods

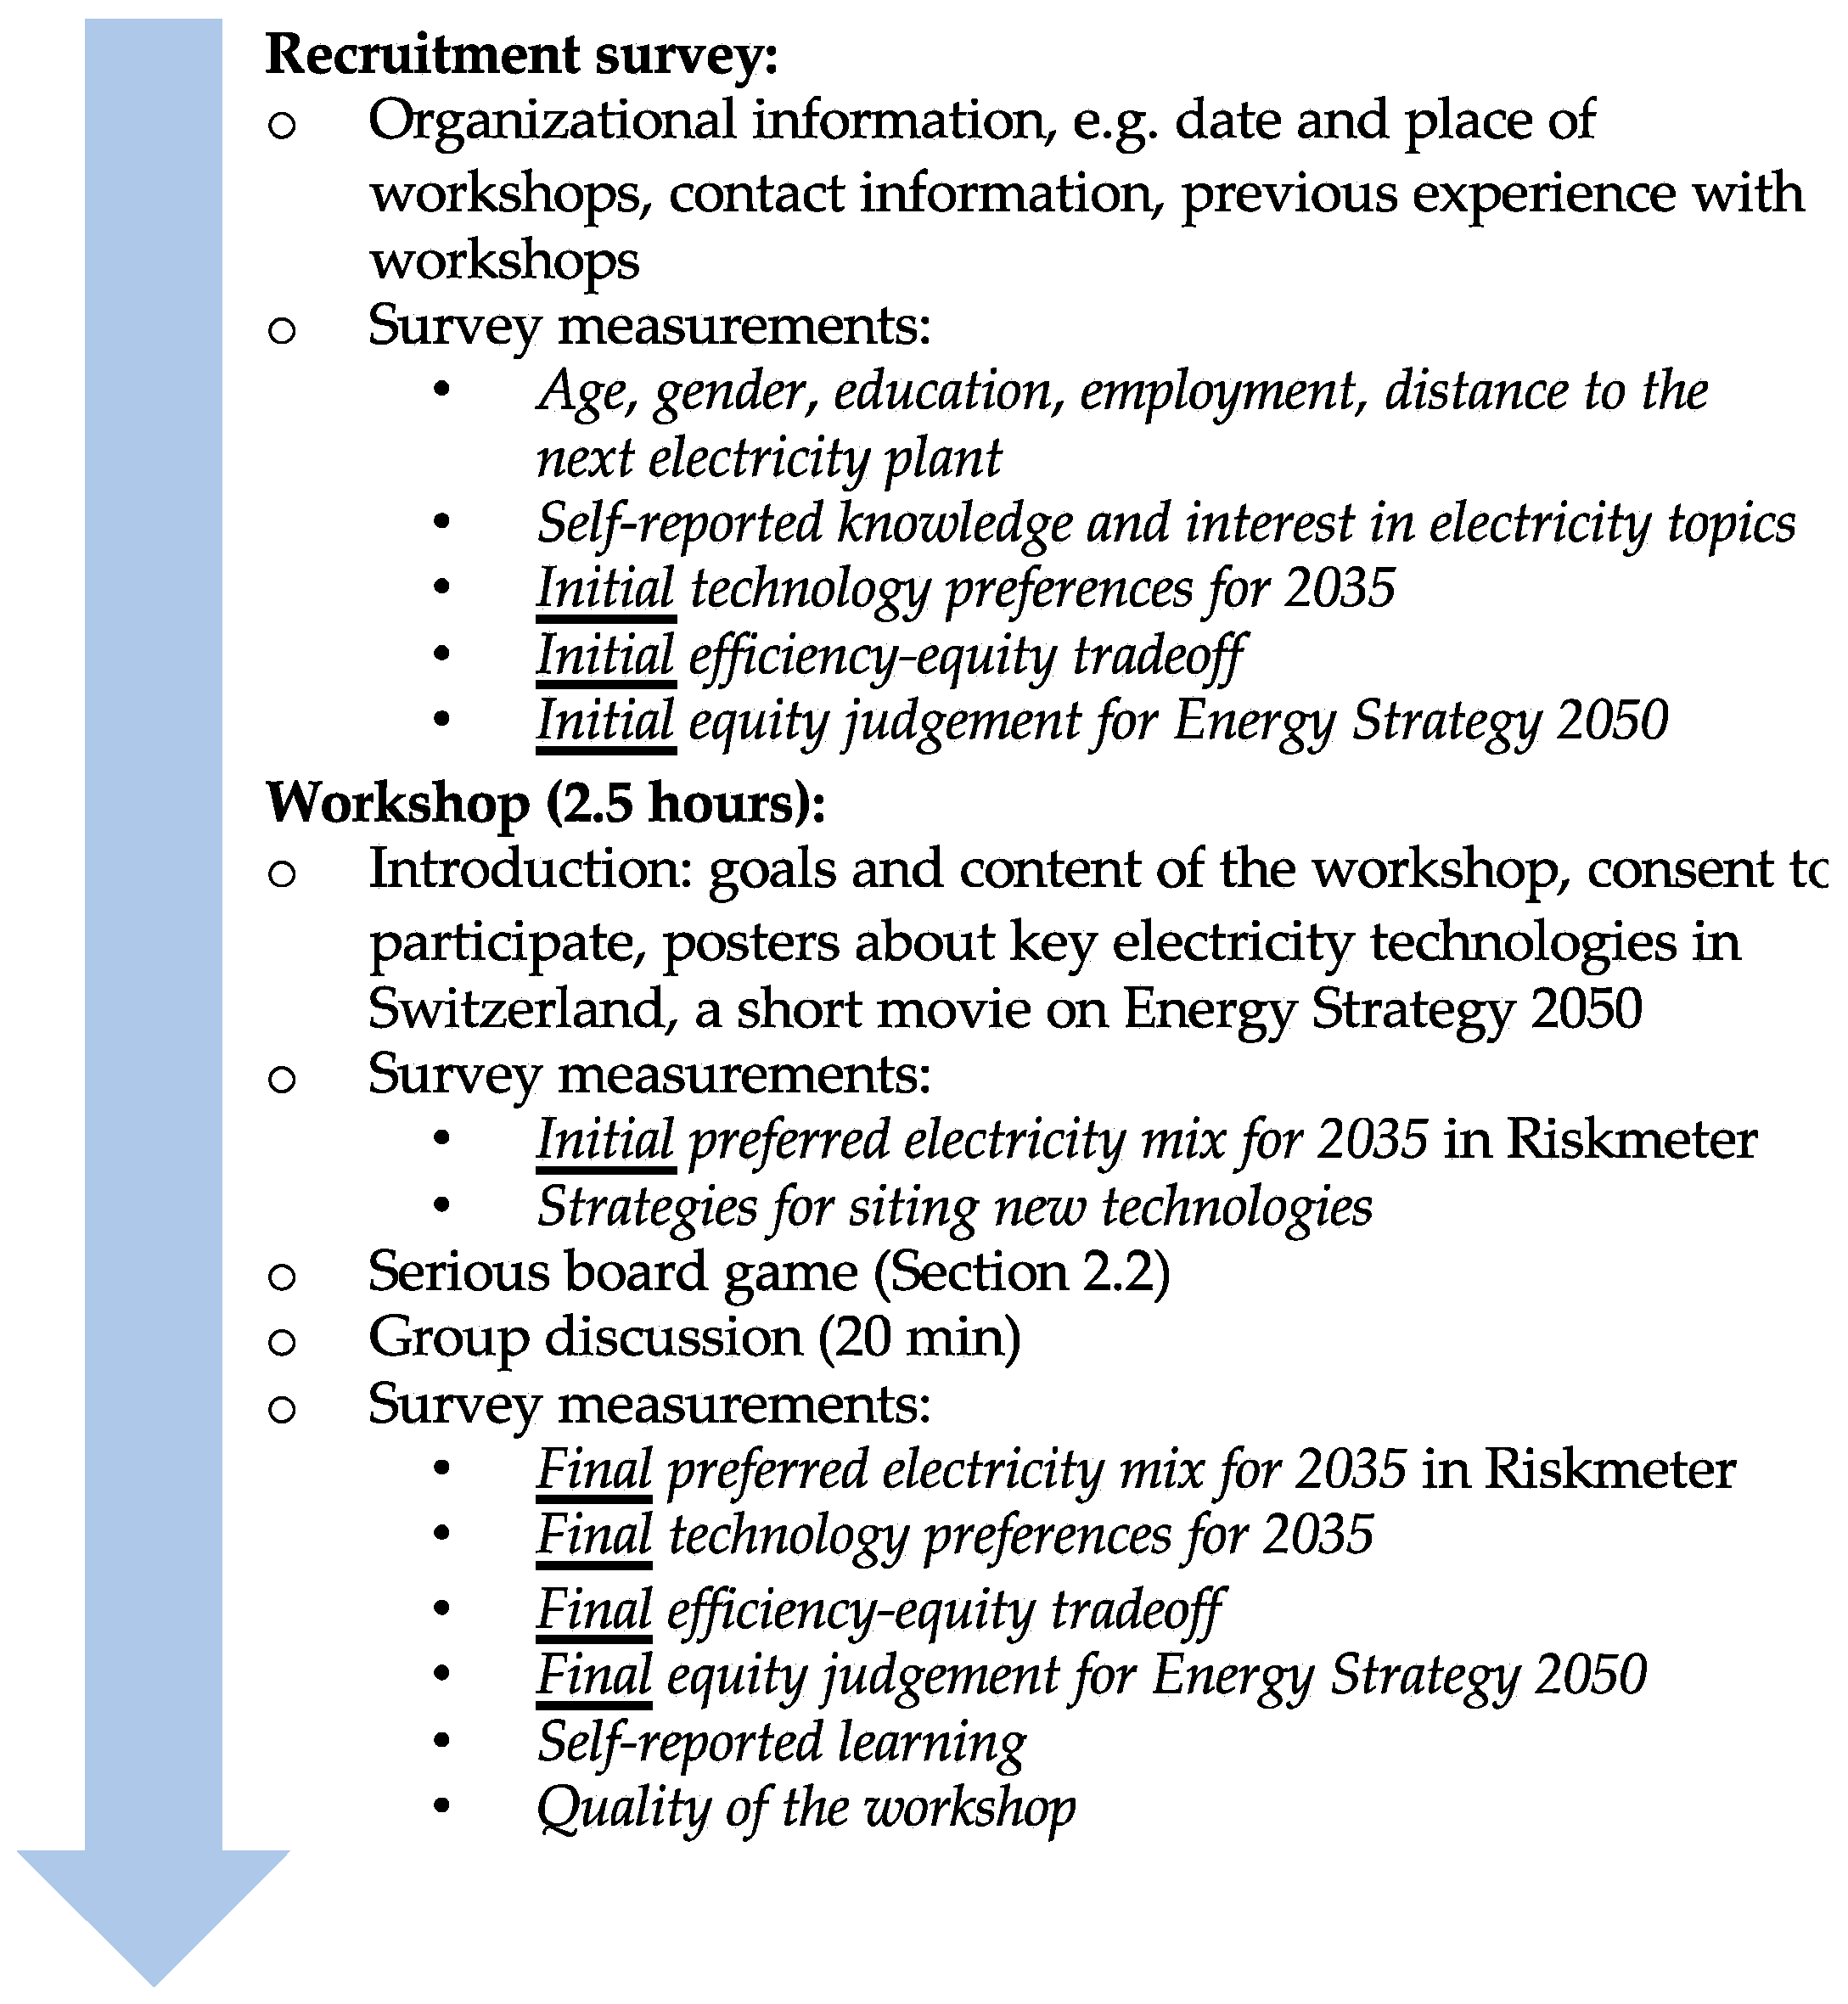
2.1. Overall Process and Measurements

In order to form and elicit citizen preferences for the spatial siting of the full electricity mix in Switzerland, we adapted and merged two existing methodologies: informed citizen panels for the formation and elicitation of informed citizen preferences [42,44,45] and a serious board game with related evaluations before, during, and after the game [58,61,63,64]. The rationale here is that, in order to allow the citizens to make informed judgments that are close to their actual values, we, first of all, involve them in an informational process to fill their knowledge gaps, reduce misconceptions, and expose them to the judgments and perspectives of other citizens. Then, we also allow sufficient time for the judgments to form by using a workshop and a game instead of a short survey.
The full process of the workshop and the survey measurements are summarized in Figure 1. The process started with the recruitment survey, where citizens who wanted to participate could sign up, get information about the workshop, and had to answer questions on age, gender, education, employment status, self-report knowledge on electricity topics (six items; seven-point Likert scale from 1 = completely disagree to 7 = completely agree), and self-reported interest in electricity topics (six items; seven-point Likert scale from 1 = completely disagree to 7 = completely agree). Then, they were asked to report their initial technology preferences for expanding electricity generation technologies, electricity savings, and efficiency, or import from abroad in Switzerland by 2035 (11 technologies; seven-point Likert scale from 1 = completely disagree to 7 = completely agree; with a “do not know” option). The choice of these alternatives was based on the existing techno-economic analyses in Switzerland [11,12,13]: hydropower, solar cells, wind, deep geothermal, biogas, waste incineration, woody biomass, natural gas, and nuclear power. In order to assess the familiarity with the spatial dimension, the participants had to report what they thought was the distance to the next electricity plant from their home (nine technologies; three distance options of less than 1 km, 10 km, 50 km, or more; with a “do not know” option).
Afterward, the participants received a short explanation of the two siting strategies for new technologies: efficiency (when technologies are sited where they produce most electricity at least cost) and regional equity (when technologies are sited in a way that all Swiss cantons and municipalities are equally affected by the costs and benefits). The participants then had to make their choice for the initial efficiency-equity tradeoff (10 technologies without electricity savings; a slider between efficiency and equity). The recruitment survey closed with a question on the initial equity judgment for the Energy Strategy 2050 (six items; seven-point Likert scale from 1 = much unfairer to 7 = much fairer; with a “do not know” option).
The participants of the recruitment survey were then invited to attend a workshop of 2.5 h with 8–10 participants each. As shown in Figure 1, the workshop started with an explanation of its goals, content, and the rules of participation for participants’ consent. Since previous research in Switzerland showed awareness gaps and misconceptions about electricity technologies [44,45,53], the participants were first introduced to short posters about each of the 11 technologies, including brief descriptions of how the technologies function, what their current situations are in Switzerland, as well as photos. The participants were also shown a short movie about the Swiss Energy Strategy 2050 [65].
Afterward, the participants were introduced to the interactive web-tool Riskmeter [44,59,66], where they had to create and submit their initial preferred electricity mix for 2035 for Switzerland. By means of interactive sliders, Riskmeter [66] allows participants to choose a realistic combination of electricity generation technologies, electricity savings, and efficiency, as well as net import from abroad in TWh/year until the foreseen Swiss electricity demand of 70 TWh/year in 2035 is met. The choice of each technology in Riskmeter is constrained by its maximum sustainable potential as well as its current deployment level that is set to be the minimum. In the case of nuclear power, the minimum is set to zero because Switzerland plans to phase out nuclear power in the long run [9], but the participants could choose to keep some of the existing plants in 2035 too. The participants also had to answer questions on preferred strategies for siting new technologies that again focused on the efficiency-equity tradeoff (six items; seven-point Likert scale from 1 = completely disagree to 7 = completely agree).
After using the Riskmeter, the participants were split into two groups of 4–5 people and they participated in a serious board game (Section 2.2) on the spatial siting of renewable generation in Switzerland and had a reflective group discussion of 20 min afterward. In the end, the participants were invited to adjust and resubmit their final preferred electricity mix for 2035 using the Riskmeter and again answered four questions from the recruitment survey on final technology preferences, final efficiency-equity tradeoff, and final equity judgment for the Energy Strategy 2050. The workshop closed with two evaluation questions: self-reported learning at the workshop, including the serious game (five items; seven-point Likert scale from 1 = completely disagree to 7 = completely agree), and overall satisfaction and quality of the workshop (seven items; seven-point Likert scale from 1 = completely disagree to 7 = completely agree). The participants received a fixed monetary reward at the end (50 CHF in cash per person).
For the analysis, the descriptives of the survey outputs and the game were investigated, considering the “do not know” option as a missing value unless otherwise noted in the Results section. The reliability of the composite measures was assessed using Cronbach’s α. The change before and after the game was evaluated using t-tests and McNemar tests. The differences among the various subsamples of the participants were assessed using ANOVA.

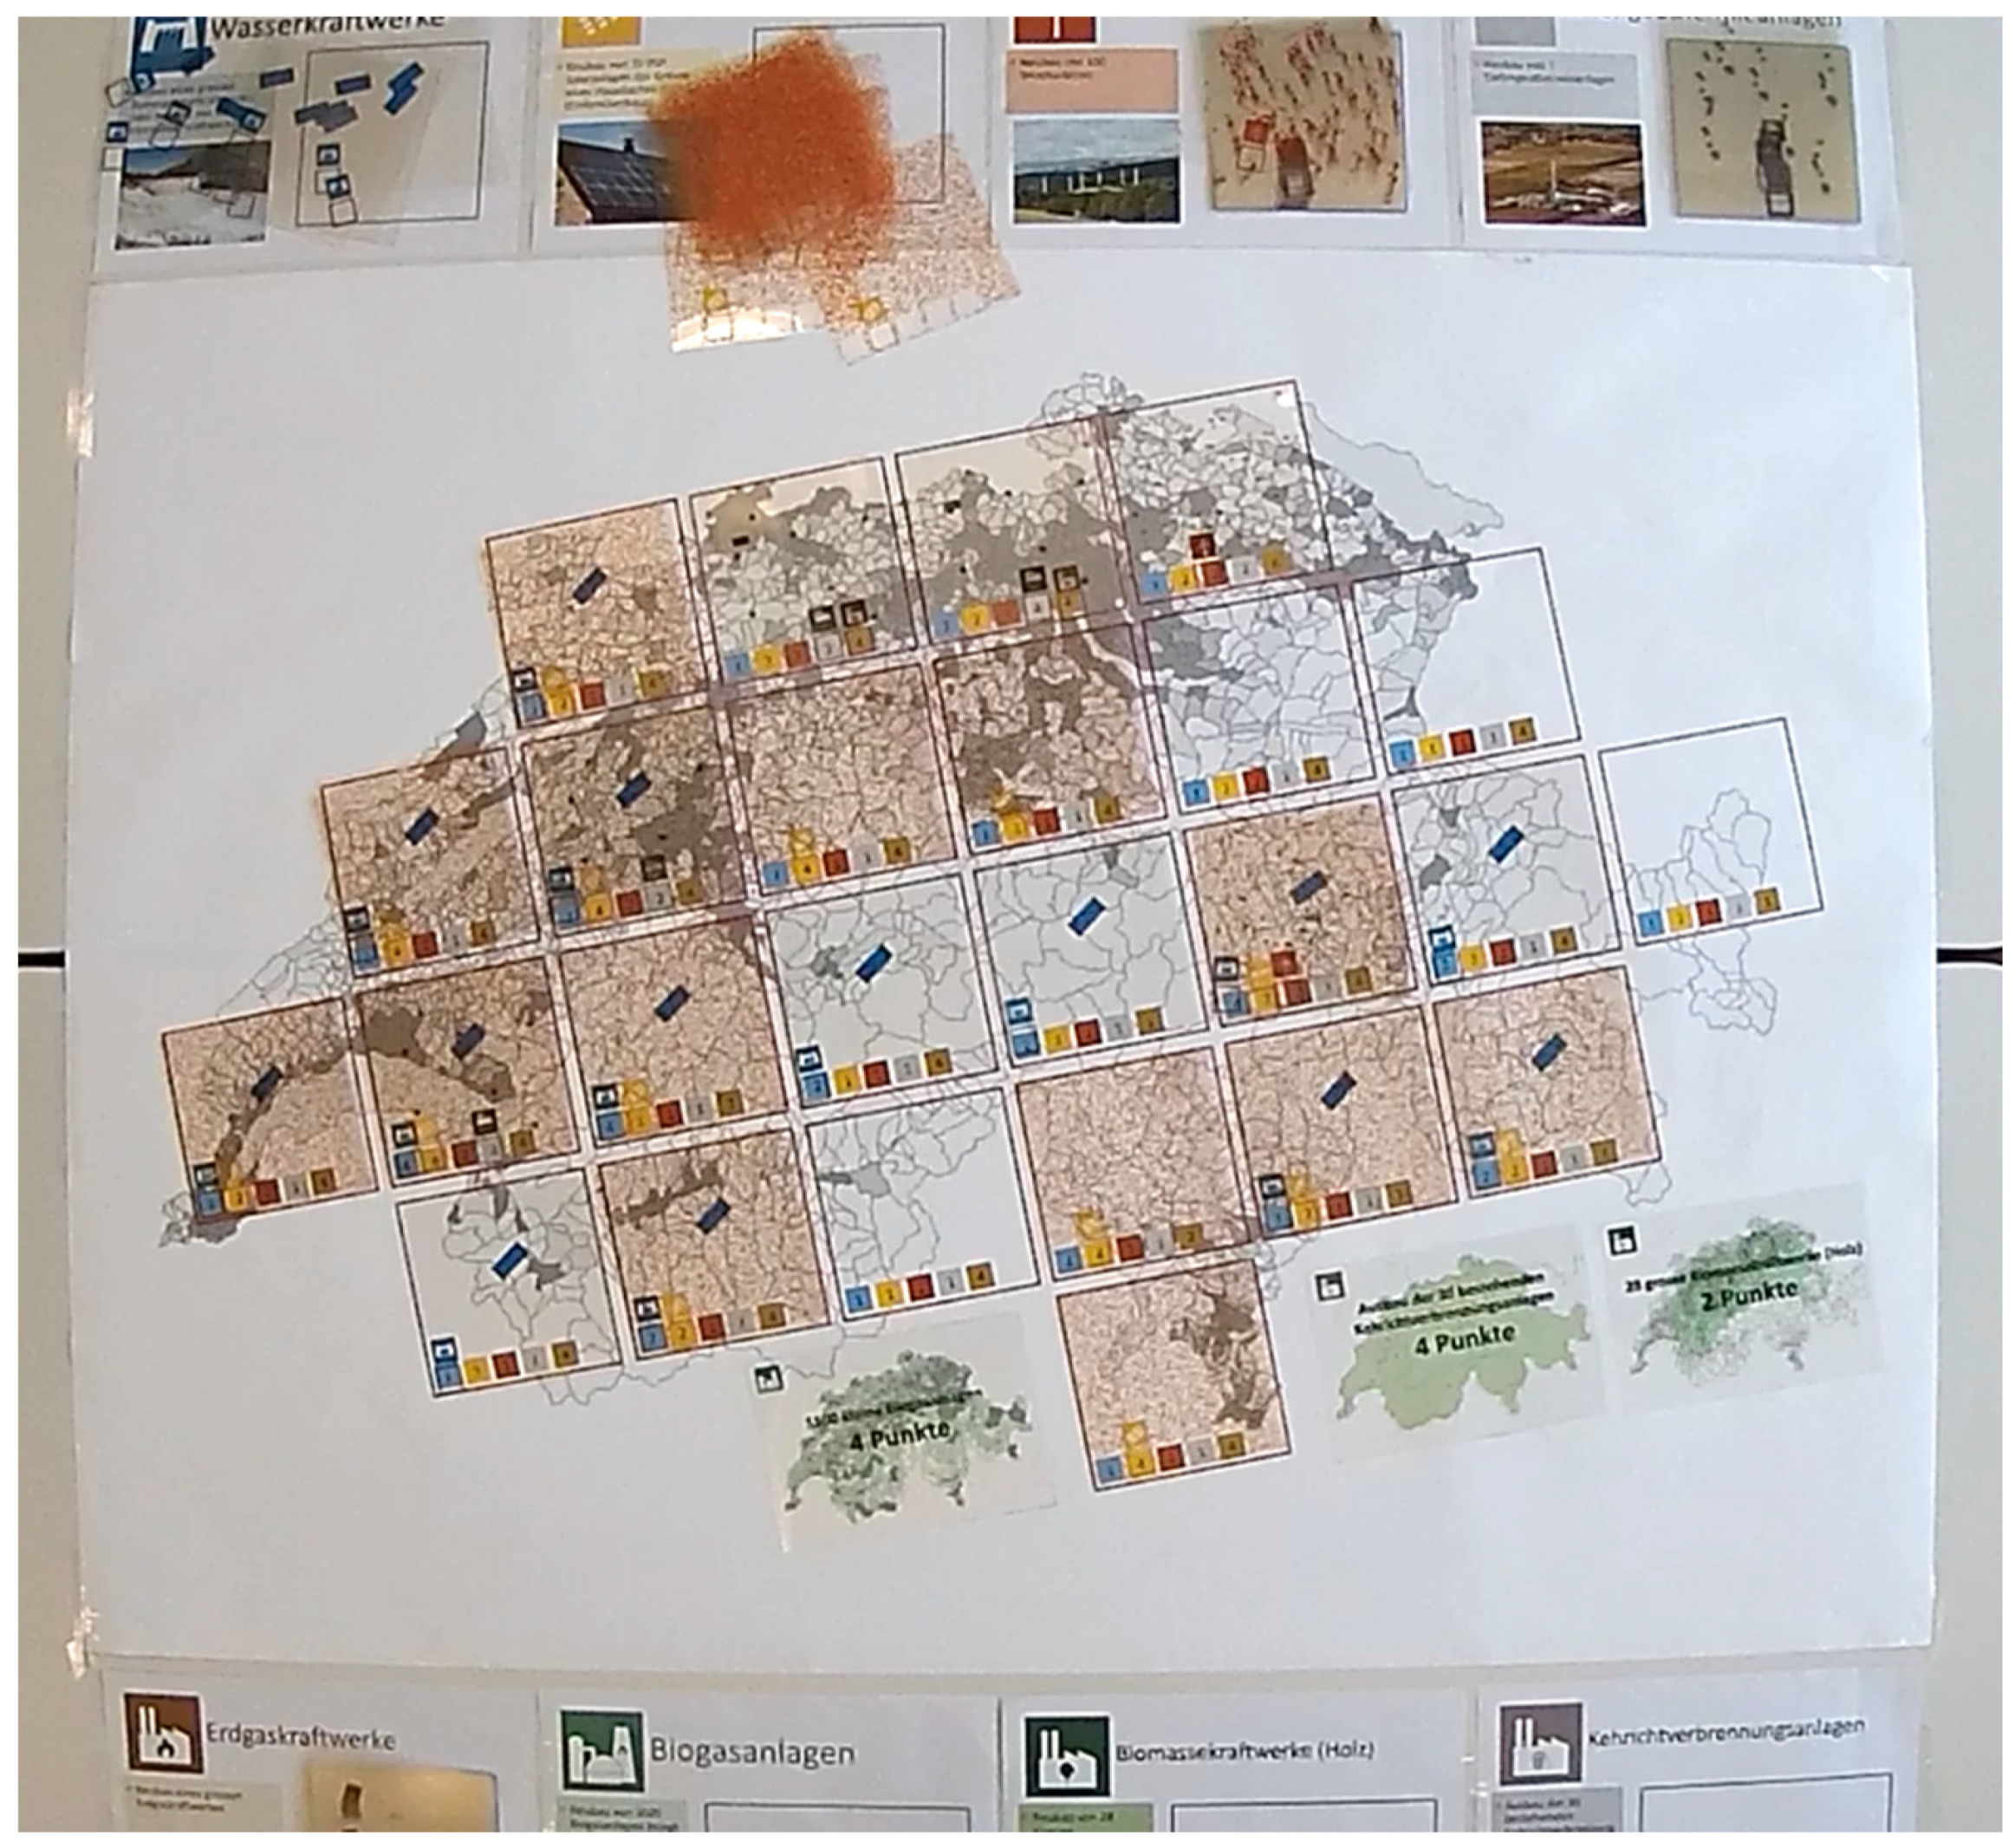
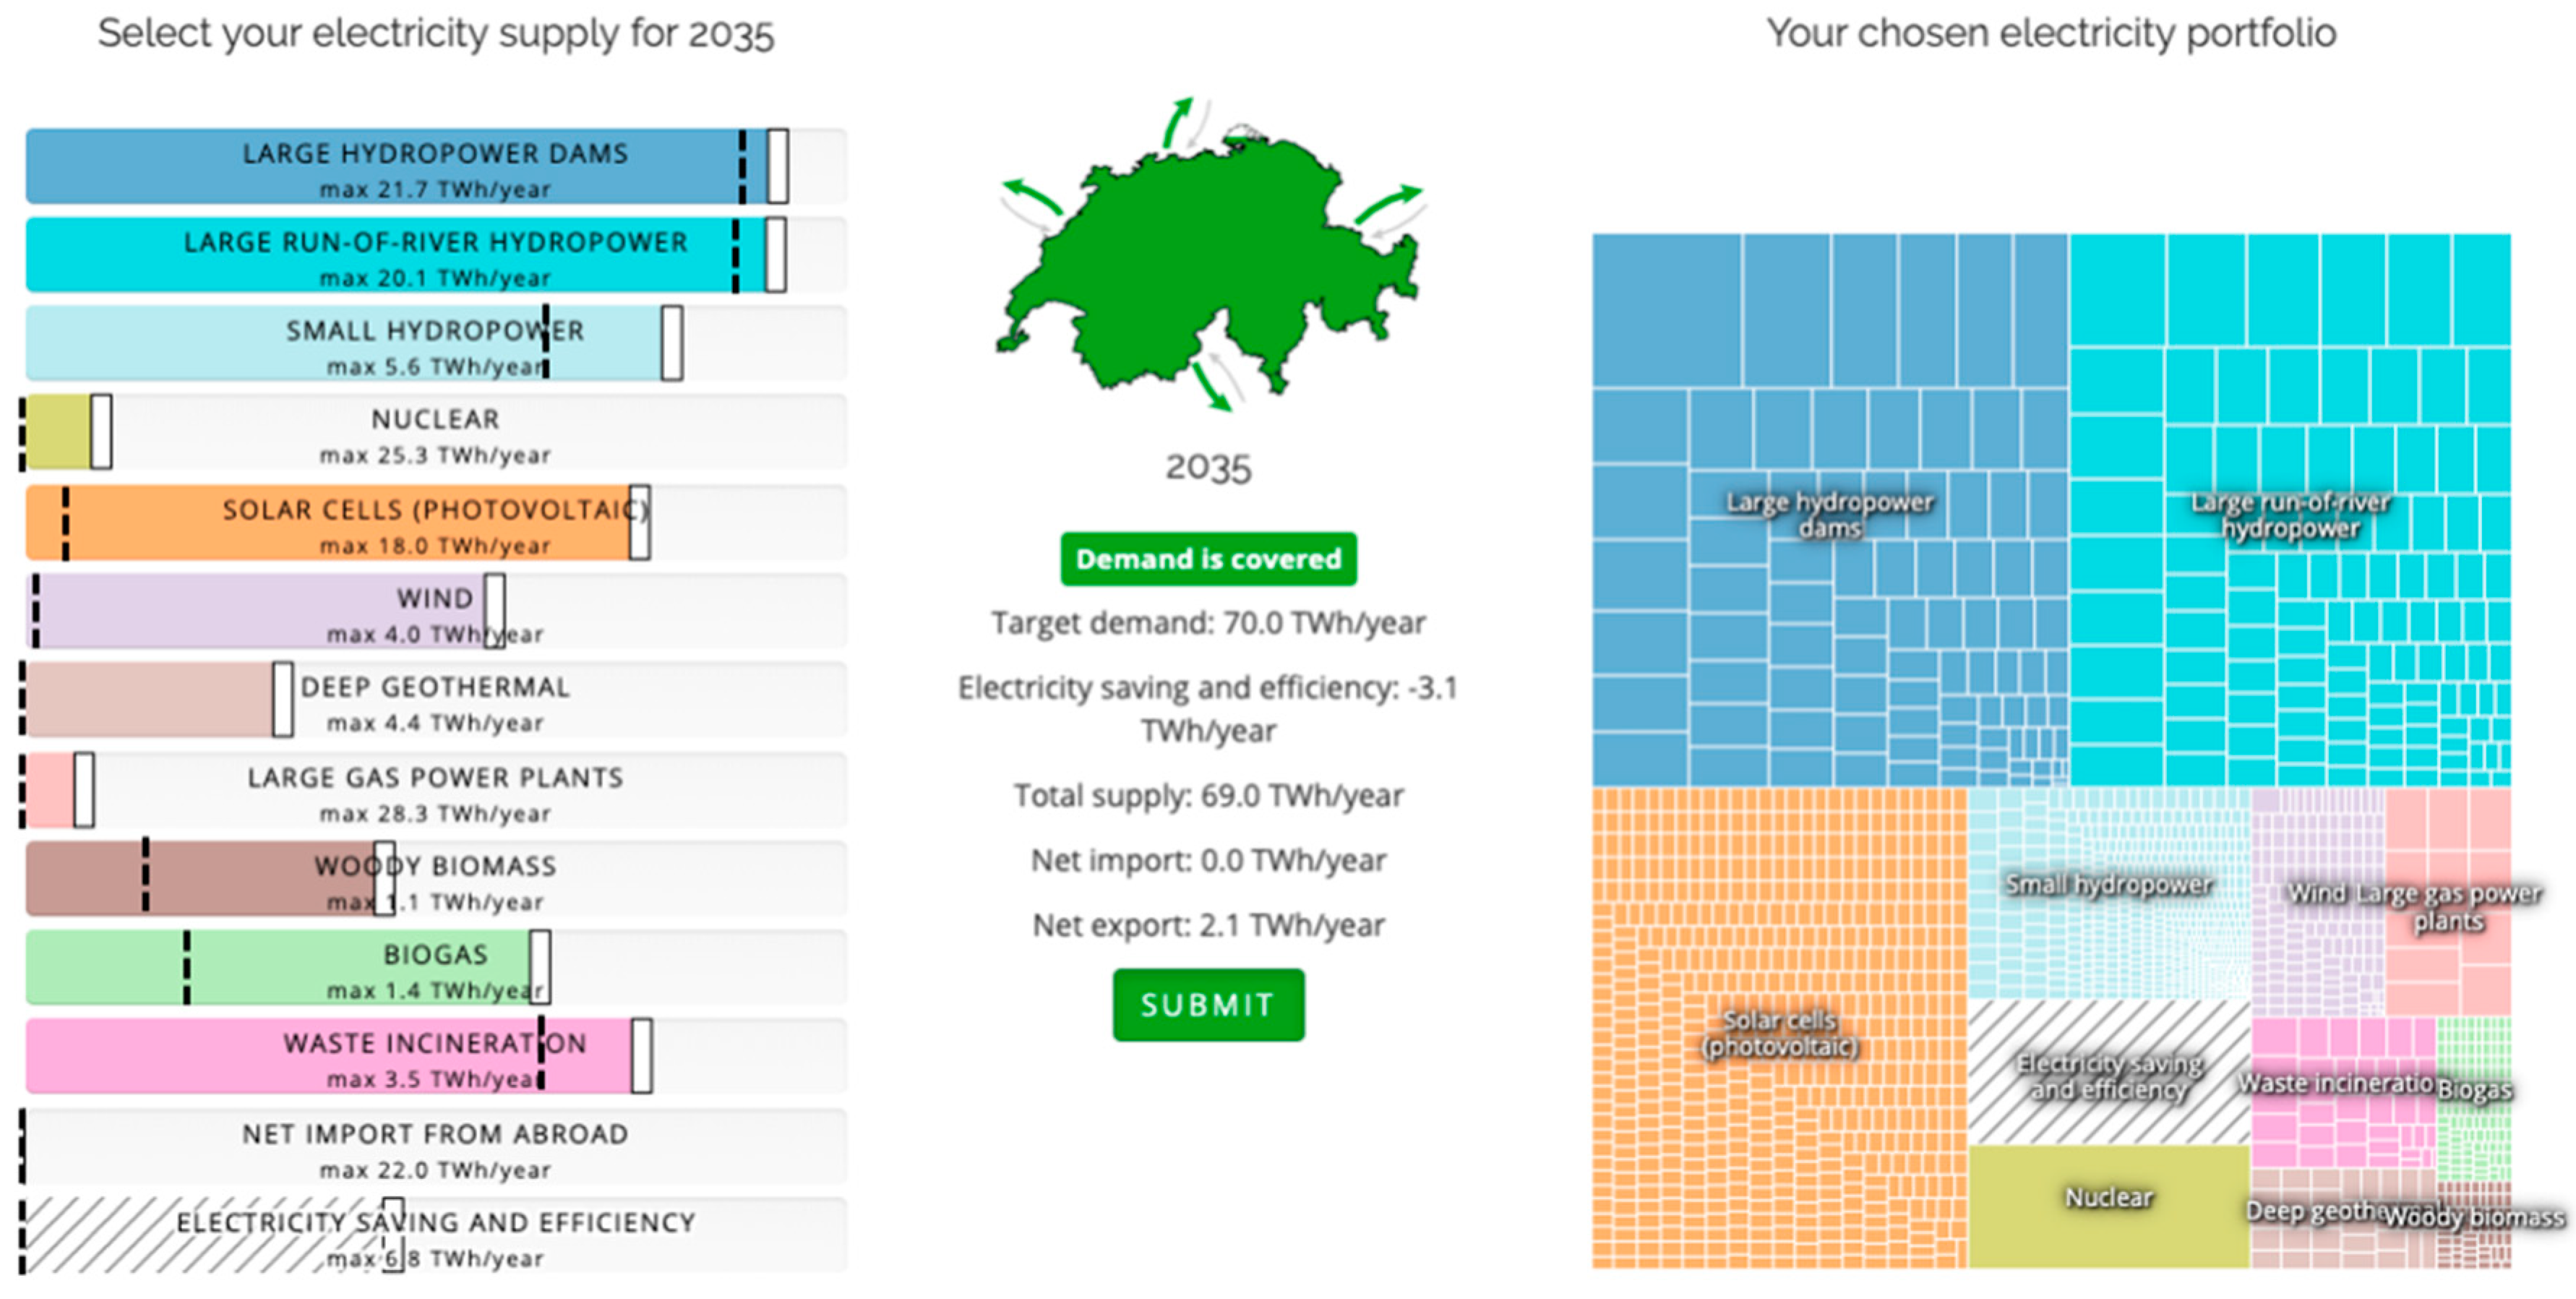
2.2. Serious Board Game

In order to form and elicit citizen preferences for spatial siting of a full mix of electricity technologies, a serious board game was developed using the case of Switzerland. The game aimed at inducing three types of learning [58,61]: (1) individual cognitive learning about the possibilities and spatial tradeoffs in siting new technologies, (2) normative learning where the participants gradually formed their preferences and articulated them, and (3) relational learning when the participants were exposed to the normative preferences of the other participants. In addition, the game was designed in a way that the participants had to make a tradeoff: either to site new technologies following the efficiency strategy and spatially concentrate them in the most productive locations or to follow the regional equity strategy and spread new technologies more evenly in space, sacrificing some of their productivity [13,22].
The game was designed using a Swiss map with a coarse grid of 25 boxes (Figure 2). The participants were given a joint task to site a mix of new generation technologies in these boxes in order to earn 100 game points. With 0.28 TWh/year for one game point, the task was equivalent to finding locations for 28 TWh/year of new electricity in Switzerland in 2035, which is approximately equal to the gap between the expected electricity demand of 70 TWh/year and existing domestic generation after the nuclear phase-out [11,12,13]. Around the map, piles of transparent foils were arranged to represent eight generation technologies: hydropower, solar cells, wind, deep geothermal, waste incineration, biogas, woody biomass, and natural gas plants. The hydropower option mostly referred to small plants, as the potential for large dams and large run-of-river plants is nearly exhausted in Switzerland [13,46]. The list of technologies was consistent with the survey measurements (Section 2.2) and the participants could choose any of these technologies, whereas only nuclear plants were excluded because no new plants are foreseen in Switzerland. Electricity import and efficiency were excluded from the spatial game for simplicity as the game was already demanding for participants, but these choices were covered via the Riskmeter. Each of the 25 transparent foils for hydropower, solar, wind, deep geothermal, and natural gas could be placed in any of the boxes on the map and, on this foil, the amount of land that the technology needs was visualized. When placed in a specific box, each foil would provide one, two, or four game points, broadly corresponding to the spatial technical potential of these technologies in Switzerland [13] and hence reflecting an exaggerated and simplified spatial patterns of productivity. In this way, the game participants needed to make the efficiency-equity tradeoff for each type of technology that they chose. Due to small technical potential in Switzerland, waste incineration (two points), biogas (four points), and woody biomass plants (four points) had only one foil each and, if chosen, would be placed next to the map, representing a distribution all over Switzerland.
The process of the game consisted of two steps. In the first step, 100 game points (28 TWh) needed to be reached by the participants altogether, when they took turns to place foils on the map with four points per participant per turn. The participants could place one foil in one box or several foils in multiple boxes as long as the foils added up to four points. Only one foil per technology was allowed in each box and afterward the technology’s potential was assumed to be exhausted, roughly corresponding to the actual spatial potential of technologies in Switzerland [13]. Several foils with different technologies were allowed in the same box. During the workshops, it took from 5 to 6.25 rounds for the participants to reach 100 points.
During the second step of the game, the concept of so-called silent negotiations was adapted in order to allow the participants to move the foils to come up with a joint map that everyone was satisfied with [67,68]. After 100 points were reached in the first step, the participants were asked to study the map and indicate if they agreed with it (thumbs up) or if they would like to change it (thumbs down). If all participants agreed, the game ended. If at least one participant disagreed, all participants were given a chance to replace and/or move the foils for up to four points per participant per turn. The total number of game points always stayed at 100. The participants could also pass their turn if they were satisfied with the map. After each round, the players again indicated whether they agreed with the new result or not. The maximum number of rounds in the second step was limited to five due to time constraints. Most groups finished the second step after 2–3 rounds. During the entire game, the participants were asked not to speak with each other [67,68] and they could later engage in a 20-min group discussion (Figure 1). The participants wore a colored bracelet and the game was filmed from above for data collection.

2.3. Sample of Participants and Evaluation of Workshops

Five workshops were conducted in April 2018 in the city of Zurich in the German-speaking part of Switzerland. Advertisements for the workshops were distributed in non-commercial online platforms, websites for recruiting study participants, and grocery stores. The advertisements specified that the workshops focused on Swiss electricity generation. All 71 respondents of the recruitment survey were invited to attend one of the workshops, allocating the participants in a way that ensures diversity in terms of demographics in each workshop. The final number of participants was N = 44 (62% of all invited participants), or 8 to 10 participants per workshop. As participants received a monetary reward (50 CHF in cash per person) for their participation, the maximum number of participants was limited. The sample was not planned to be representative of the Swiss general population. A non-representative sample was not problematic because the sample was still diverse in terms of demographics as well as energy interests and knowledge (see the next paragraph), and because we measured learning and preference formation for each individual before and after the workshops without the aim to generalize our findings to the whole population. The sample of 44 is sufficient from the methodological point of view as such a sample is typical for exploratory citizen workshops [42,43,44,45,69].
The participants were from 19 to 66 years old (M = 38.6 years, SD = 15.5 years) and thus the sample was a little younger than the Swiss general population (M = 42.2 years [70]). In particular, the age group of 20–25 years was overrepresented, and the group of 30–40 years was underrepresented. With 36% of female participants, the sample underrepresented the Swiss female ratio of 50.4% [70]. Since 30% of the Swiss population has a high school degree and 18% has a university degree [71], our sample was on average more educated with 60% of participants with high school degrees and 40% with university degrees. Of all the participants, 30% were still studying (in high school, professional school, university of applied sciences, university, or continuing education) and 11% were retired or seeking employment. Additionally, 68% of the participants lived in urban areas, hence explaining parts of the deviations from the Swiss general population, mostly in Zurich or the cantons of Aargau, Bern, Luzern, and Solothurn. The self-reported knowledge of electricity topics ranged from 13 to 40 out of the maximum score of 42 (M = 27.7, SD = 6.2, Cronbach’s α = 0.79). The self-reported interest in electricity topics ranged from 14 to 40 out of 42 (M = 29.3, SD = 6.1, Cronbach’s α = 0.84). These outcomes on interest and knowledge were similar to the other studies in Switzerland [44,45] and, overall, indicated the diverse starting point of the recruited participants as well as no evidence of self-selection beyond interest in the monetary reward for participation. In terms of familiarity with the spatial dimension, the share of “do not know” answers about the distance to the next electricity plant from home was high for less common technologies in Switzerland (61% for natural gas, 57% for deep geothermal and biogas, 55% for woody biomass, and 35% for wind) and low for more familiar technologies (5% for nuclear, 16% for waste incineration, 18% for hydropower, 20% for solar cells).
At the end of the workshops, the self-reported learning was evaluated at M = 22.3 and SD = 5.7 out of the maximum of 35. The overall satisfaction with the quality of the workshop was judged at M = 42.7 and SD = 4.0 out of the maximum of 49. Such relatively high evaluations mean that the participants were generally satisfied with the process, whereas some of them learned more than others at the workshop, especially because they started with different levels of knowledge and interest. Overall, these subjective evaluations already demonstrate that the serious board game and the workshops induced learning and the formation of preferences. Section 3.2 and Section 3.3 provide complementary evidence on learning and preference formation that was measured indirectly.

3. Results

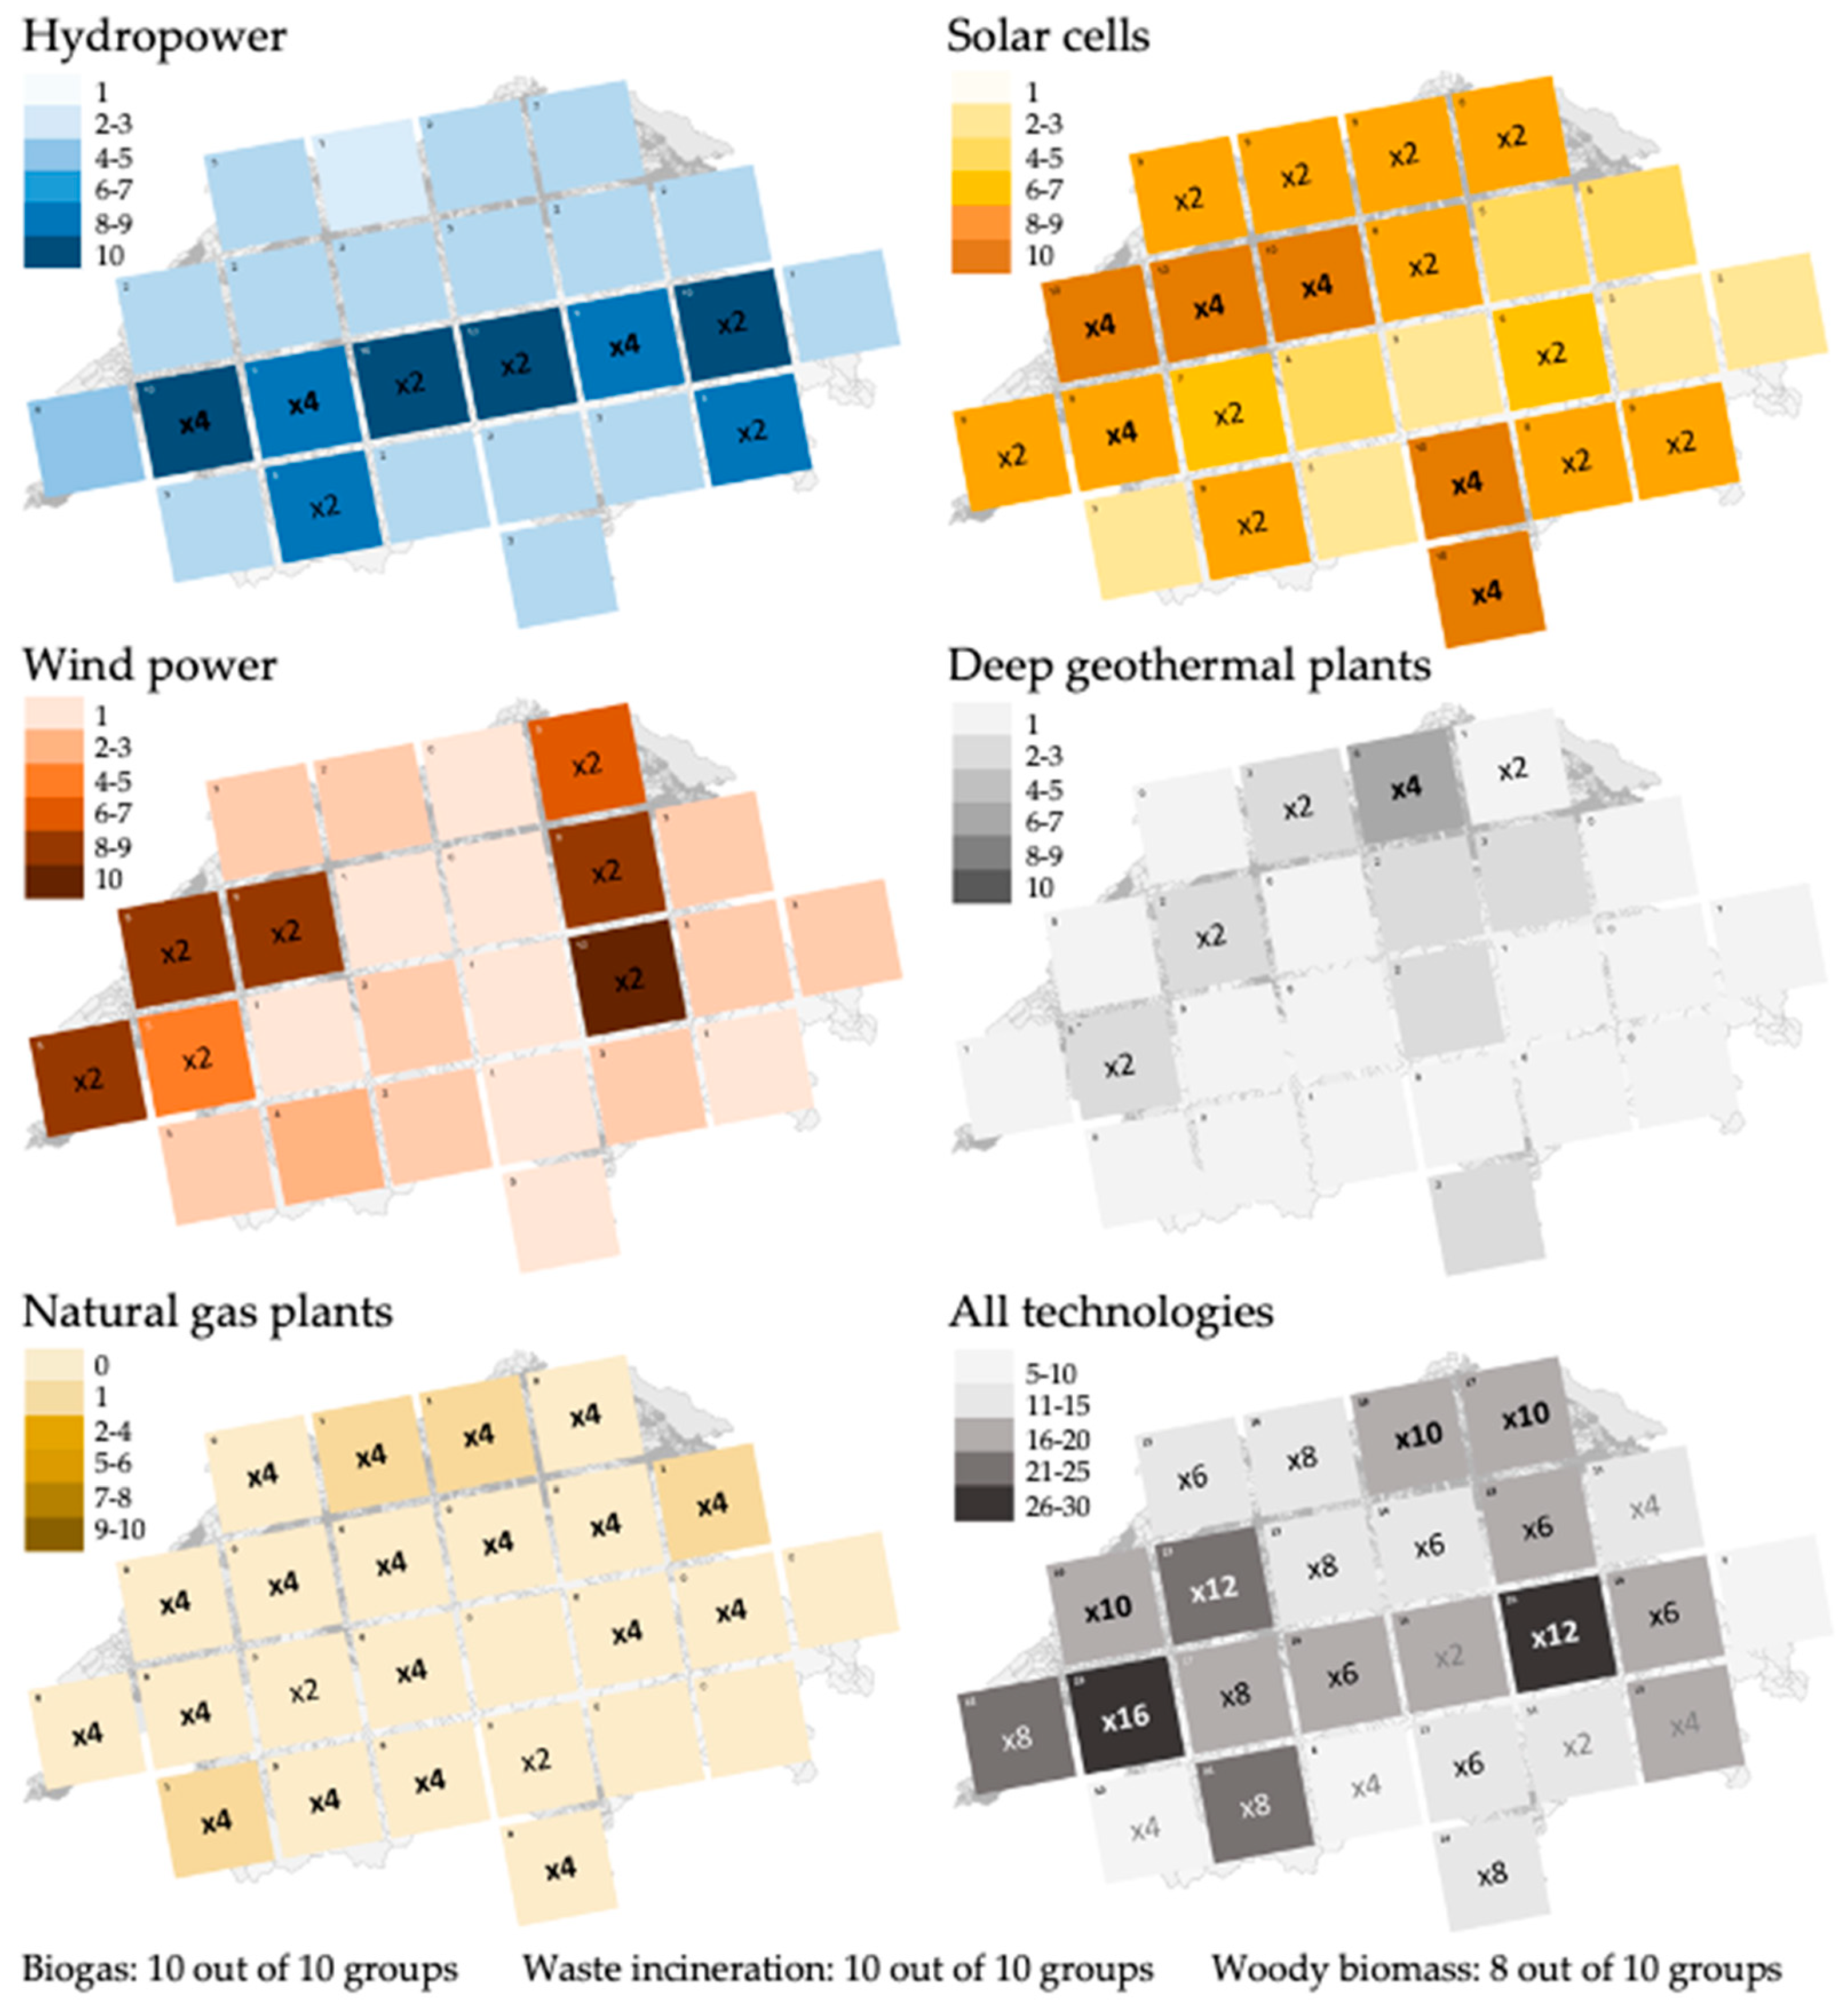
3.1. Choice and Siting of Electricity Generation Technologies in the Serious Board Game

Figure 3 depicts the final choice and location of electricity generation technologies after both steps of the serious board game with 44 participants in 10 game groups in five workshops. In order to earn 100 game points or, in other words, to select and locate technologies to generate an additional 28 TWh/year of electricity in Switzerland, the participants chose a diversified mix of technologies: solar cells (179 foils were chosen in 10 games out of the maximum of 250, giving a 72% selection rate), new hydropower (114 foils out of 250; 46% selection rate), wind (87 foils out of 250; 35% selection rate), deep geothermal (28 foils out of 250; 11% selection rate), biogas (10 foils out of 10; 100% selection rate), waste incineration (10 foils out of 10; 100% selection rate), woody biomass (8 foils out of 10; 80% selection rate), and natural gas plants (4 foils out of 250; 2% selection rate). This choice of technologies in the game, in fact, followed the same broad pattern as the initial as well as final technology preferences for 2035 from the survey (Section 3.2). Solar cells and hydropower were by far the two most preferred technologies and they were followed by wind power, biogas, waste incineration, woody biomass, and as the last preferred renewable technology, deep geothermal plants. In the game as well as in the survey, the participants expressed negative attitudes towards natural gas, for example, choosing only four out of 250 foils with natural gas in all 10 game groups.
During the second step of silent negotiations, the foils with all types of technologies were added, removed, or relocated without a clear pattern. Only for solar cells and hydropower, the distribution of the movements was skewed towards adding more foils to the map rather than removing. The interactive part of the game, therefore, could have additionally strengthened already strong initial preferences for solar cells and hydropower.
In terms of the locations of new technologies, Figure 3 demonstrates that participants followed the efficiency principle for the preferred technologies. Solar cells, hydropower, wind power, and to some extent deep geothermal plants were all located much more often in boxes with “×2” and “×4”, where these technologies were more productive. The most preferred technologies, solar cells and hydropower, were also repeatedly located in other boxes without the marks of “×2” and “×4”, illustrating a higher willingness to accept these technologies regardless of their location or efficiency. For wind power and deep geothermal plants, many boxes remained unused in all game sessions and the technologies were practically exclusively concentrated in the most productive locations. The outcome for natural gas showed that participants followed the efficiency strategy only for preferred renewable technologies, whereas natural gas foils were used very little despite the fact that most boxes on the map were marked with “×4”.

3.2. Changes in Preferences for Technologies and Electricity Mixes

Table 1 provides the initial and final technology preferences for Switzerland for 2035, using a seven-point Likert scale, as well as initial and final preferred electricity mixes from Riskmeter (Section 2.1). In terms of single technology preferences, solar cells and hydropower were by far the most preferred technologies, together with electricity savings and efficiency that were also part of the surveys. Wind power, biogas, and waste incineration were also ranked high, whereas electricity import from abroad, natural gas plants, and nuclear power were on average rated below the mid-point of four on the seven-point scale. In terms of preferred electricity mixes, the average preferred mix was diversified and had a high share of renewable technologies. Since preferences in Riskmeter were constrained by technical potentials of the technologies in Switzerland (Section 2.1), participants particularly included new solar cells, wind power, biogas, woody biomass, deep geothermal plants, as well as electricity savings and efficiency (Figure 4). Although participants expressed a high preference for hydropower in other measurements, hydropower was not extended much more in Riskmeter, potentially because participants wanted to diversify their mixes, and hydropower already covered a large portion of the mix. The participants chose to include more than a third of the remaining technical potential of deep geothermal plants, woody biomass, biogas, and wind power, but these technologies played a comparatively minor role in the final mix (right panel in Figure 4) and hence preferred electricity mixes were still consistent with technology preferences for these technologies. Nuclear power, natural gas plants, and especially electricity import from abroad were all consistently either excluded from the mix or included to a very limited extent. In the case of nuclear power, these results potentially indicate that, even if the serious game had allowed building or keeping nuclear plants, few participants would have used this option. The large standard deviations in the case of nuclear power and natural gas to some extent show the variability of opinions, but this variability is disproportionally amplified because these two technologies had the largest degree of freedom in Riskmeter as they could reach from zero to over 25 TWh/year, whereas other technologies were more constrained by their minimum and maximum potentials. All the findings on technology preferences and preferred electricity mixes are in line with other similar surveys in Switzerland [44,45] and with the serious board game (Section 3.1).
Table 1 also shows the changes in technology preferences as well as preferred electricity mixes from Riskmeter (Section 2.1) before and after the serious board game, indicating the effects of learning and preference formation. Both measurements show that after the serious board game the already low preferences for natural gas and electricity import from abroad dropped even further. In the case of technology preferences, this drop was statistically significant for both natural gas (M = 3.70 vs. M = 2.61, t = 3.78, p = 0.000) and import (M = 3.18 vs. M = 2.61, t = 0.57, p = 0.011). In the Riskmeter measurements, the means for all renewable technologies were also higher after the serious board game and there were two other statistically significant changes: a small increase in preference for small hydropower (M = 4.38 TWh/year vs. M = 4.7 TWh/year, t = −2.58, p = 0.014) and wind power (M = 13.49 TWh/year vs. M = 13.72 TWh/year, t = −2.18, p = 0.034). The serious game, therefore, seems to have strengthened preferences for renewable technologies, potentially because the participants could better grasp the spatial implications when forming their preferences and because they realized that the potential of renewable technologies is higher than initially expected.

3.3. Efficiency-Equity Tradeoff and Equity Judgment for Energy Strategy 2050

As shown in Table 2, the initial and final efficiency-equity tradeoffs from the surveys revealed a clear tendency of the participants to prioritize the efficiency strategy, where new technologies would be located in the most productive areas to generate the most electricity at the least cost rather than spreading these technologies in a regionally equitable manner. The preferences for efficiency were especially pronounced for hydropower and wind power. Women participants had a statistically higher preference for equity than men for hydropower (F (1,42) = 9.09, p = 0.004) and for wind (F (1,42) = 8.78, p = 0.005). For other renewable technologies, such as waste incineration, biogas, woody biomass, or solar cells, there was a slightly lower focus on efficiency, but they were still below the mid-point of four that would indicate a shift towards regional equity over efficiency. After the serious board game, the preference for efficiency became even more pronounced and statistically significantly stronger for hydropower (M = 2.30 vs. M = 1.50, t = 3.25, p = 0.002) and deep geothermal plants (M = 3.07 vs. M = 2.21, t = 2.64, p = 0.012). Likely, this was a learning effect from the serious game, where participants learned about the concentrated nature of these technologies in Switzerland (Figure 3) and hence eventually put more emphasis on efficiency. The preference for the efficiency strategy was already high for wind power to start with. All these findings from Table 2 are consistent with the final outcomes of the serious game (Section 3.1), where the participants prioritized the efficiency principle too.
The preferences for efficiency-equity tradeoff were also elicited using a complementary question on preferred strategies for siting new technologies (Table 3). The findings again revealed a preference for the efficiency strategy: the three statements that focused on regional equity were consistently rated below the mid-point of four (“neither agree, nor disagree”), whether they were framed in terms of constructing new plants, producing own electricity, or baring the impacts. The efficiency strategies that prioritize the most productive areas first or build the lowest possible amount of plants were rated above the mid-point of four. The most extreme version of the efficiency strategy that aims to concentrate most of the new plants in few areas, however, was judged below the mid-point, indicating skepticism about the radical focus on efficiency.
Table 4 presents the equity judgments for the Energy Strategy 2050, where the mean judgments were mostly situated around the mid-point of four (“neither fairer, nor unfairer”), both before and after the workshop. The Swiss Energy Strategy 2050 that focuses on renewable energy, energy efficiency, and nuclear phase-out was, on average, perceived to be rather fairer than the current situation in terms of impact on current vs. future generations, cities vs. rural areas, large Swiss regions, and small vs. large companies. It was, on average, perceived to be slightly unfairer for low vs. high-income households and for various economic sectors. The spatial siting of technologies, reflected in the questions on cities vs. rural areas and on large Swiss regions, was perceived rather neutral in terms of fairness and this has not changed after the serious board game.
When comparing equity judgments for the Energy Strategy 2050 before and after the workshop, the only statistically significant change was the increase in the perceived equity in terms of impact on current vs. future generations (M = 4.93 vs. M = 5.57, t = −2.06, p = 0.046). Although it is difficult to precisely attribute this change to specific learning during the workshop, it could have originated from the fact that the participants learned about the objectives of the Energy Strategy 2050 in the short movie [65] and about the potential of renewable technologies in the serious board game and the Riskmeter. For example, the participants that overall perceived the Energy Strategy 2050 to be rather fair (i.e., the participants with the sum of their judgments from Table 3 of 23 or higher, out of the maximum of 42) were also statistically significantly more in favor of solar cells (t = 4.19, p = 0.047), wind power (t = 4.43, p = 0.041), electricity savings and efficiency (t = 7.21, p = 0.010), and biogas (t = 6.31, p = 0.016) as compared to the rest of the sample. The effect of learning about renewable technologies from the game could have therefore further strengthened the fairness perception of the Energy Strategy 2050.

4. Discussion

In terms of the methodological contributions of this study, the serious board game proved to lead to measurable learning effects and preference formation by the 44 participants, and it enabled the elicitation of preferences. Choosing a full mix of electricity technologies alone is already a complex and cognitively demanding task [42,43,44,45] and here we added another dimension of siting all these technologies. Nonetheless, the elicited preferences for technologies and their siting were logically consistent with the measurements from more conventional surveys (Table 2 and Table 3) as well as with findings observed in other studies in Switzerland [44,45,69,72]. We, therefore, conclude that the game enabled the elicitation of valid preferences. Even more, the game also successfully led to learning effects, which were measured either directly as self-reported learning (Section 2.3) or indirectly as changes in the preferences after the game (Table 1, Table 2 and Table 4). The learning, however, was not as high as in other studies that applied similar measurements [44,45,59]. However, the other studies involved at least twice as much time as well as required reading technical factsheets, hence potentially explaining higher self-reported learning. As observed by others [37,44,73], this could also be a downside of gamified methods that include less new content and are not perceived to be as informative as, for example, factsheets.
In terms of the practical contributions based on the technology choice of the participants, the results showed that our 44 participants preferred a diverse mix of renewable technologies and electricity savings and efficiency in Switzerland in 2035 rather than nuclear power, natural gas, and electricity import from abroad. Especially solar cells and hydropower had high preferences. These findings were consistent with multiple other survey measurements with small or large samples in Switzerland, indicating the robustness of these findings [44,45,46,69,72]. After the serious game, strengthening preferences were observed for renewable technologies when the participants learned about the spatial dimension of these technologies in Switzerland, whereas the preference for natural gas dropped even further. These effects of learning and preference formation, however, were slightly lower than in other studies with informed citizen panels in Switzerland [44,45]. As said, the other studies engaged with more extensive information, where the participants spent hours reading factsheets or discussing energy topics. It is also worth noting that after more than five years of public discussion and a public referendum in Switzerland on the Energy Strategy 2050, Swiss citizens already have well-formed opinions about the energy transition. It is therefore not surprising that the preferences for technologies were relatively stable (Table 1).
In terms of the value judgments of our 44 participants on technology siting, we found strong evidence that the participants preferred the efficiency strategy over the strategy of regional equity. They wanted new plants to be located where they produce the most electricity at the least cost rather than to be evenly spread throughout the country. This preference observed in the game (Figure 3) was consistent with the other survey measurements (Table 2 and Table 3). The preference for efficiency strengthened even more after the game, in particular for hydropower and deep geothermal plants, whose spatially concentrated nature of the resource was visible in the game (Figure 3 and Table 2). However, this preference for efficiency only applied for individual technologies rather than across technologies because natural gas plants—even if they were depicted in the game as efficient (Figure 3)—were not chosen by the participants. These results on the preference for efficiency could have been to some extent induced by the game though, when the participants chose moves to earn most game points. Although this observation was also made by others that used serious games [37], the consistency of the preference for efficiency with the survey measures and the limited choice of efficient natural gas plants still indicate the validity of the elicited preferences for siting.
The current Swiss policy, the Energy Strategy 2050, that focuses on increasing renewable energy, energy efficiency, and phasing out nuclear power was perceived by our 44 participants to neither improve nor diminish inter-regional fairness in Switzerland (Table 4). This demonstrates the limited importance of the spatial dimension in the fairness question from the view of our participants [13]. Other dimensions of fairness, especially intra-generational fairness and impacts on low- vs. high-income households, were perceived to respectively increase or decrease the fairness more. As such, this finding additionally explains the focus of the participants on the efficiency strategy rather than regional equity because the spatial dimension was not viewed to influence fairness much.
This study and the serious board game carry several limitations that could be addressed in future research. First, the game and the posters in the workshop presented short and highly simplified information on the technology choice and siting. Future work could, therefore, use a more extensive informational process that also includes reading technical factsheets [44,45] or the game could use information from spatial electricity sector modeling to introduce the participants to realistic rather than simplified siting choices [13,14,19,29,33]. Here, in particular, interactive web-tools, like Riskmeter, could prove advantageous over a board game to make the information from the modeling available. Second, the scope of the game could be extended to cover the tradeoffs in the whole energy system rather than electricity generation alone by including grids [33,55] or heating technologies [74]. Third, our study so far included only 44 participants due to the limits on available monetary compensation, and since these workshops require extensive organizational efforts and are more demanding than large representative surveys. This sample size is typical in citizen workshops of such an exploratory nature and it was sufficient to test the game, to observe the effects of learning and preference formation, and to identify results that are robust and in line with previous research in Switzerland [44,45,46,69,72]. In the future, the sample could be extended to cover a more representative number of participants by means of gamified online surveys or involve other groups, such as school pupils. Such work could be also conducted in other countries and, especially in the case of developing regions with higher equity concerns [26,27], the final outcomes of the game could be very different. After all, the game only focused on the general citizen preferences for electricity technologies and their siting, whereas future work could explore interlinkages with local acceptance [49,50], the spatial dimensions of community or market acceptance [75], as well as acceptance of related policy instruments [76].

5. Conclusions

Using the case of the Swiss electricity sector in 2035, we presented a serious board game to form and elicit citizen preferences for spatial siting of the full mix of electricity technologies and we tested this game with 44 participants in the city of Zurich. In terms of the methodological contribution, the game proved to lead to learning effects for this complex and multi-dimensional topic, when the participants self-reported learning and when we also measured changes in preferences for technologies and siting strategies after the game. The elicited preferences were logically consistent with findings from more conventional methods, indicating the validity of such a serious game for preference formation and elicitation.
In terms of the practical contribution towards policymaking, the results showed that these 44 participants—similar to previous research findings in Switzerland—preferred a diverse mix of renewable technologies in Switzerland with minimum or no contribution of nuclear power, natural gas, and electricity import from abroad. Solar cells and hydropower stood out in particular for their high preference. For siting new technologies, our methodology enabled us to show that the participants consistently preferred the efficiency strategy, where plants would be located in the areas where they produce the most electricity at least cost, in contrast to the strategy of regional equity, where all Swiss regions would build for renewable generation and share the benefits and burdens of the energy transition equally. The serious board game further strengthened this preference for the efficiency strategy. After all, the current Energy Strategy 2050 was perceived to neither increase nor decrease inter-regional fairness in Switzerland, hence also explaining the participants’ preference for efficiency rather than regional equity. This new information could inform the implementation of the Energy Strategy 2050, in particular, by bringing in the spatial and equity dimensions.

Author Contributions

Conceptualization, methodology, formal analysis, F.S., T.M.; supervision, E.T.; writing and editing, E.T., F.S., T.M. All authors have read and agreed to the published version of the manuscript.

Funding

This work was supported by the Swiss National Science Foundation Ambizione Energy grant No. 160563.

Acknowledgments

The authors thank Rea Pärli, Danny Nef, Simon Baumgartner, and Antonia Ulmann for their help during the workshops and Georgios Xexakis for his support with Riskmeter.

Conflicts of Interest

The authors declare no conflict of interest.

References

  1. UNFCCC The Paris Agreement. Available online: http://unfccc.int/paris_agreement/items/9485.php (accessed on 30 July 2019).
  2. European Commission. A Clean Planet for All. A European Strategic Long-Term Vision for a Prosperous, Modern, Competitive and Climate Neutral Economy; European Commission: Brussels, Belgium, 2018. [Google Scholar]
  3. Ministero dello Sviluppo Economico (MISE). Italy’s National Energy Strategy: For a More Competitive and Sustainable Energy; Ministero dello Sviluppo Economico: Rome, Italy, 2013.
  4. Ministère de l’Ecologie, du Développement Durable et de l’Energie (MEDDE). France National Low-Carbon Strategy; Ministère de l’Ecologie, du Développement Durable et de l’Energie: Paris, France, 2015.
  5. Committee on Climate Change (CCC). The Fifth Carbon Budget. The Next Step Towards a Low-Carbon Economy; UK Committee on Climate Change: London, UK, 2015. [Google Scholar]
  6. Gielen, D.; Boshell, F.; Saygin, D.; Bazilian, M.D.; Wagner, N.; Gorini, R. The role of renewable energy in the global energy transformation. Energy Strat. Rev. 2019, 24, 38–50. [Google Scholar] [CrossRef]
  7. Jacobson, M.Z.; Delucchi, M.A. Providing all global energy with wind, water, and solar power, Part I: Technologies, energy resources, quantities and areas of infrastructure, and materials. Energy Policy 2011, 39, 1154–1169. [Google Scholar] [CrossRef]
  8. Kammen, D.M.; Sunter, D.A. City-integrated renewable energy for urban sustainability. Science 2016, 352, 922. [Google Scholar] [CrossRef] [Green Version]
  9. Der Schweizerische Bundesrat. Botschaft zum ersten Massnahmenpaket der Energiestrategie 2050 (Revision des Energierechts) und zur Volksinitiative “Für den geordneten Ausstieg aus der Atomenergie (Atomausstiegsinitiative)”; Der Schweizerische Bundesrat: Bern, Switzerland, 2013.
  10. Die Bundesversammlung der Schweizerischen Eidgenossenschaft. Energiegesetz vom 30 September 2016 (Stand. am 1. Januar 2018); Der Bundesrat: Bern, Switzerland, 2018.
  11. Densing, M.; Panos, E.; Hirschberg, S. Meta-analysis of energy scenario studies: Example of electricity scenarios for Switzerland. Energy 2016, 109, 998–1015. [Google Scholar] [CrossRef]
  12. Berntsen, P.B.; Trutnevyte, E. Ensuring diversity of national energy scenarios: Bottom-up energy system model with Modeling to Generate Alternatives. Energy 2017, 126, 886–898. [Google Scholar] [CrossRef] [Green Version]
  13. Sasse, J.-P.; Trutnevyte, E. Distributional trade-offs between regionally equitable and cost-efficient allocation of renewable electricity generation. Appl. Energy 2019, 254, 113724. [Google Scholar] [CrossRef]
  14. Yazdanie, M.; Densing, M.; Wokaun, A. The nationwide characterization and modeling of local energy systems: Quantifying the role of decentralized generation and energy resources in future communities. Energy Policy 2018, 118, 516–533. [Google Scholar] [CrossRef]
  15. Kienast, F.; Huber, N.; Hergert, R.; Bolliger, J.; Moran, L.S.; Hersperger, A.M. Conflicts between decentralized renewable electricity production and landscape services—A spatially-explicit quantitative assessment for Switzerland. Renew. Sustain. Energy Rev. 2017, 67, 397–407. [Google Scholar] [CrossRef]
  16. Masanet, E.; Chang, Y.; Gopal, A.R.; Larsen, P.; Morrow, W.R.; Sathre, R.; Shehabi, A.; Zhai, P. Life-Cycle Assessment of Electric Power Systems. Annu. Rev. Environ. Resour. 2013, 38, 107–136. [Google Scholar] [CrossRef]
  17. Roth, S.; Hirschberg, S.; Bauer, C.; Burgherr, P.; Dones, R.; Heck, T.; Schenler, W. Sustainability of electricity supply technology portfolio. Ann. Nucl. Energy 2009, 36, 409–416. [Google Scholar] [CrossRef]
  18. Gingerich, D.B.; Sun, X.; Behrer, A.P.; Azevedo, I.L.; Mauter, M.S. Spatially resolved air-water emissions tradeoffs improve regulatory impact analyses for electricity generation. Proc. Natl. Acad. Sci. USA 2017, 114, 1862–1867. [Google Scholar] [CrossRef] [Green Version]
  19. Sasse, J.-P.; Trutnevyte, E. Regional impacts of electricity system transition in Central Europe until 2035. Nat. Commun. 2020. [Google Scholar] [CrossRef]
  20. Trutnevyte, E.; Volken, S.; Xexakis, G. Factsheets of electricity generation technologies in Switzerland (EN). Zenodo 2019. [Google Scholar] [CrossRef]
  21. Howard, D.C.; Wadsworth, R.A.; Whitaker, J.W.; Hughes, N.; Bunce, R.G.H. The impact of sustainable energy production on land use in Britain through to 2050. Land Use Policy 2009, 26, S284–S292. [Google Scholar] [CrossRef]
  22. Drechsler, M.; Egerer, J.; Lange, M.; Masurowski, F.; Meyerhoff, J.; Oehlmann, M. Efficient and equitable spatial allocation of renewable power plants at the country scale. Nat. Energy 2017, 2, 17124. [Google Scholar] [CrossRef]
  23. Lehmann, P.; Ammermann, K.; Gawel, E.; Geiger, C.; Hauck, J.; Heilmann, J.; Meier, J.-N.; Schicketanz, S.; Stemmer, B.; Tafarte, P.; et al. Managing Spatial Sustainability TraDe-offs: The Case of Wind Power. UFZ Discussion Papers, 04/2020; Helmholtz-Zentrum für Umweltforschung: Leipzig, Germany, 2020. [Google Scholar]
  24. Siler-Evans, K.; Azevedo, I.L.; Morgan, M.G.; Apt, J. Regional variations in the health, environmental, and climate benefits of wind and solar generation. Proc. Natl. Acad. Sci. USA 2013, 110, 11768–11773. [Google Scholar] [CrossRef] [PubMed] [Green Version]
  25. Vaishnav, P.; Horner, N.; Azevedo, I.L. Was it worthwhile? Where have the benefits of rooftop solar photovoltaic generation exceeded the cost? Environ. Res. Lett. 2017, 12, 094015. [Google Scholar] [CrossRef]
  26. Trotter, P.A.; Cooper, N.J.; Wilson, P.R. A multi-criteria, long-term energy planning optimisation model with integrated on-grid and off-grid electrification—The case of Uganda. Appl. Energy 2019, 243, 288–312. [Google Scholar] [CrossRef]
  27. Nock, D.; Levin, T.; Baker, E. Changing the policy paradigm: A benefit maximization approach to electricity planning in developing countries. Appl. Energy 2020, 264, 114583. [Google Scholar] [CrossRef]
  28. Ryberg, S.D.; Robinius, M.; Stolten, D. Evaluating Land Eligibility Constraints of Renewable Energy Sources in Europe. Energies 2018, 11, 1246. [Google Scholar] [CrossRef] [Green Version]
  29. Mohr, L.; Burg, V.; Thees, O.; Trutnevyte, E. Spatial hot spots and clusters of bioenergy combined with socio-economic analysis in Switzerland. Renew. Energy 2019, 140, 840–851. [Google Scholar] [CrossRef]
  30. Mourmouris, J.C.; Potolias, C. A multi-criteria methodology for energy planning and developing renewable energy sources at a regional level: A case study Thassos, Greece. Energy Policy 2013, 52, 522–530. [Google Scholar] [CrossRef]
  31. Mentis, D.; Siyal, S.H.; Korkovelos, A.; Howells, M. A geospatial assessment of the techno-economic wind power potential in India using geographical restrictions. Renew. Energy 2016, 97, 77–88. [Google Scholar] [CrossRef]
  32. Müller, J.; Trutnevyte, E. Spatial projections of solar PV installations at subnational level: Accuracy testing of regression models. Appl. Energy 2020, 265, 114747. [Google Scholar] [CrossRef]
  33. Bartlett, S.; Dujardin, J.; Kahl, A.; Kruyt, B.; Manso, P.; Lehning, M. Charting the course: A possible route to a fully renewable Swiss power system. Energy 2018, 163, 942–955. [Google Scholar] [CrossRef]
  34. Brewer, J.; Ames, D.P.; Solan, D.; Lee, R.; Carlisle, J. Using GIS and social preference data to evaluate utility scale solar power site suitability. Renew. Energy 2015, 81, 825–836. [Google Scholar] [CrossRef]
  35. Oudes, D.; Stremke, S. Spatial transition analysis: Spatially explicit and evidence-based targets for sustainable energy transition at the local and regional scale. Landsc. Urban Plan. 2018, 169, 1–11. [Google Scholar] [CrossRef]
  36. Höltinger, S.; Salak, B.; Schauppenlehner, T.; Scherhaufer, P.; Schmidt, J. Austria’s wind energy potential—A participatory modeling approach to assess socio-political and market acceptance. Energy Policy 2016, 98, 49–61. [Google Scholar] [CrossRef]
  37. Flacke, J.; De Boer, C. An Interactive Planning Support Tool for Addressing Social Acceptance of Renewable Energy Projects in The Netherlands. ISPRS Int. J. Geo-Inf. 2017, 6, 313. [Google Scholar] [CrossRef] [Green Version]
  38. Suškevičs, M.; Eiter, S.; Martinat, S.; Stober, D.; Vollmer, E.; de Boer, C.L.; Buchecker, M. Regional variation in public acceptance of wind energy development in Europe: What are the roles of planning procedures and participation? Land Use Policy 2019, 81, 311–323. [Google Scholar] [CrossRef]
  39. Cousse, J.; Wüstenhagen, R.; Schneider, N. Mixed feelings on wind energy: Affective imagery and local concern driving social acceptance in Switzerland. Energy Res. Soc. Sci. 2020, 70, 101676. [Google Scholar] [CrossRef]
  40. Schito, J.; Jullier, J.; Raubal, M. A framework for integrating stakeholder preferences when deciding on power transmission line corridors. EURO J. Decis. Process. 2019, 7, 159–195. [Google Scholar] [CrossRef]
  41. Scherhaufer, P.; Höltinger, S.; Salak, B.; Schauppenlehner, T.; Schmidt, J. A participatory integrated assessment of the social acceptance of wind energy. Energy Res. Soc. Sci. 2018, 45, 164–172. [Google Scholar] [CrossRef]
  42. Mayer, L.A.; de Bruin, W.B.; Morgan, M.G. Informed Public Choices for Low-Carbon Electricity Portfolios Using a Computer Decision Tool. Environ. Sci. Technol. 2014, 48, 3640–3648. [Google Scholar] [CrossRef]
  43. Scheer, D.; Konrad, W.; Scheel, O. Public evaluation of electricity technologies and future low-carbon portfolios in Germany and the USA. Energy Sustain. Soc. 2013, 3, 8. [Google Scholar] [CrossRef]
  44. Volken, S.; Xexakis, G.; Trutnevyte, E. Perspectives of informed citizen panel on low-carbon electricity portfolios in Switzerland and the empirical evaluation of informational material. Environ. Sci. Technol. 2018, 52, 11478–11489. [Google Scholar]
  45. Dubois, A.; Holzer, S.; Xexakis, G.; Cousse, J.; Trutnevyte, E. Informed citizen panels on the Swiss electricity mix 2035: Longer-term evolution of citizen preferences and affect in two cities. Energies 2019, 12, 4231. [Google Scholar] [CrossRef] [Green Version]
  46. Xexakis, G.; Hansmann, R.; Volken, S.P.; Trutnevyte, E. Models on the wrong track: Model-based electricity supply scenarios in Switzerland are not aligned with the perspectives of energy experts and the public. Renew. Sustain. Energy Rev. 2020, 134, 110297. [Google Scholar] [CrossRef]
  47. Bertsch, V.; Hall, M.; Weinhardt, C.; Fichtner, W. Public acceptance and preferences related to renewable energy and grid expansion policy: Empirical insights for Germany. Energy 2016, 114, 465–477. [Google Scholar] [CrossRef]
  48. Roddis, P.; Carver, S.; Dallimer, M.; Ziv, G. Accounting for taste? Analysing diverging public support for energy sources in Great Britain. Energy Res. Soc. Sci. 2019, 56, 101226. [Google Scholar] [CrossRef]
  49. Devine-Wright, P. Beyond NIMBYism: Towards an integrated framework for understanding public perceptions of wind energy. Wind Energy 2005, 8, 125–139. [Google Scholar] [CrossRef]
  50. Guo, Y.; Ru, P.; Su, J.; Anadon, L.D. Not in my backyard, but not far away from me: Local acceptance of wind power in China. Energy 2015, 82, 722–733. [Google Scholar] [CrossRef] [Green Version]
  51. Carr-Cornish, S.; Romanach, L. Differences in Public Perceptions of Geothermal Energy Technology in Australia. Energies 2014, 7, 1555–1575. [Google Scholar] [CrossRef] [Green Version]
  52. Huang, L.; Zhou, Y.; Han, Y.; Hammitt, J.K.; Bi, J.; Liu, Y. Effect of the Fukushima nuclear accident on the risk perception of residents near a nuclear power plant in China. Proc. Natl. Acad. Sci. USA 2013, 110, 19742–19747. [Google Scholar] [CrossRef] [PubMed] [Green Version]
  53. Volken, S.; Wong-Parodi, G.; Trutnevyte, E. Laypeople’s beliefs and acceptance of risks of electricity generation technologies. J. Risk Res. 2019, 22, 432–447. [Google Scholar] [CrossRef]
  54. Morgan, G.M.; Fischhoff, B.; Bostrom, A.; Atman, C.J. Risk Communication: A Mental Models Approach; Cambridge University Press: Cambridge, UK, 2001. [Google Scholar]
  55. Stadelmann-Steffen, I. Bad news is bad news: Information effects and citizens’ socio-political acceptance of new technologies of electricity transmission. Land Use Policy 2019, 81, 531–545. [Google Scholar] [CrossRef]
  56. Fischhoff, B. Value elicitation: Is there anything in there? Am. Psychol. 1991, 46, 835–847. [Google Scholar] [CrossRef]
  57. Slovic, P. The construction of preferences. Am. Psychol. 1995, 50, 364–371. [Google Scholar] [CrossRef]
  58. Aubert, A.H.; Bauer, R.; Lienert, J. A review of water-related serious games to specify use in environmental Multi-Criteria Decision Analysis. Environ. Model. Softw. 2018, 105, 64–78. [Google Scholar] [CrossRef]
  59. Xexakis, G.; Trutnevyte, E. Are interactive web-tools for environmental scenario visualization worth the effort? An experimental study on the Swiss electricity supply scenarios 2035. Environ. Model. Softw. 2019, 119, 124–134. [Google Scholar] [CrossRef] [Green Version]
  60. Petty, R.E.; Cacioppo, J.T. The Elaboration Likelihood Model of Persuasion; Academic Press Inc.: Cambridge, MA, USA, 1986. [Google Scholar]
  61. Den Haan, R.-J.; Van der Voort, C.M. On Evaluating Social Learning Outcomes of Serious Games to Collaboratively Address Sustainability Problems: A Literature Review. Sustainability 2018, 10, 4529. [Google Scholar] [CrossRef] [Green Version]
  62. Boomsma, C.; Hafner, R.; Pahl, S.; Jones, V.R.; Fuertes, A. Should We Play Games Where Energy Is Concerned? Perceptions of Serious Gaming as a Technology to Motivate Energy Behaviour Change among Social Housing Residents. Sustainability 2018, 10, 1729. [Google Scholar] [CrossRef] [Green Version]
  63. Mayer, I.; Bekebrede, G.; Harteveld, C.; Warmelink, H.; Zhou, Q.; van Ruijven, T.; Lo, J.; Kortmann, R.; Wenzler, I. The research and evaluation of serious games: Toward a comprehensive methodology. Br. J. Educ. Technol. 2014, 45, 502–527. [Google Scholar] [CrossRef]
  64. Connolly, T.M.; Boyle, E.A.; MacArthur, E.; Hainey, T.; Boyle, J.M. A systematic literature review of empirical evidence on computer games and serious games. Comput. Educ. 2012, 59, 661–686. [Google Scholar] [CrossRef]
  65. Generalsekretariat Eidgenössisches Departement für Umwelt. Energie und Kommunikation UVEK, Energiestrategie 2050 auf Video. Available online: https://www.uvek.admin.ch/uvek/de/home/uvek/abstimmungen/abstimmung-zum-energiegesetz/energiestrategie-2050-auf-video.html (accessed on 30 July 2019).
  66. University of Geneva. Riskmeter. Available online: www.riskmeter.ch (accessed on 1 April 2020).
  67. Macmillan, A.; Davies, M.; Shrubsole, C.; Luxford, N.; May, N.; Chiu, L.F.; Trutnevyte, E.; Bobrova, Y.; Chalabi, Z. Integrated decision-making about housing, energy and wellbeing: A qualitative system dynamics model. Environ. Health 2016, 15, 23–34. [Google Scholar] [CrossRef] [PubMed] [Green Version]
  68. Pictet, J.; Bollinger, D. The silent negotiation or how to elicit collective information for group MCDA without excessive discussion. J. Multi-Criteria Decis. Anal. 2005, 13, 199–211. [Google Scholar] [CrossRef]
  69. Jobin, M.; Visschers, V.H.M.; van Vliet, O.P.R.; Árvai, J.; Siegrist, M. Affect or information? Examining drivers of public preferences of future energy portfolios in Switzerland. Energy Res. Soc. Sci. 2019, 52, 20–29. [Google Scholar] [CrossRef]
  70. SFSO Altersmasszahlen der Ständigen Wohnbevölkerung nach Staatsangehörigkeitskategorie und Geschlecht, 1999–2017. Available online: https://www.bfs.admin.ch/bfs/fr/home/statistiques/population/effectif-evolution/age-etat-civil-nationalite.assetdetail.6046304.html (accessed on 30 July 2019).
  71. SFSO Ständige Wohnbevölkerung ab 15 Jahren nach Höchster Abgeschlossener Ausbildung und Kanton. 2015. Available online: https://www.bfs.admin.ch/bfs/de/home/statistiken/kataloge-datenbanken/tabellen.assetdetail.1862705.html (accessed on 30 July 2019).
  72. Visschers, V.H.M.; Siegrist, M. Find the differences and the similarities: Relating perceived benefits, perceived costs and protected values to acceptance of five energy technologies. J. Environ. Psychol. 2014, 40, 117–130. [Google Scholar] [CrossRef]
  73. McMahon, R.; Stauffacher, M.; Knutti, R. The scientific veneer of IPCC visuals. Clim. Chang. 2016, 138, 369–381. [Google Scholar] [CrossRef]
  74. Chambers, J.; Narula, K.; Sulzer, M.; Patel, M.K. Mapping district heating potential under evolving thermal demand scenarios and technologies: A case study for Switzerland. Energy 2019, 176, 682–692. [Google Scholar] [CrossRef]
  75. Wüstenhagen, R.; Wolsink, M.; Bürer, M.J. Social acceptance of renewable energy innovation: An introduction to the concept. Energy Policy 2007, 35, 2683–2691. [Google Scholar] [CrossRef] [Green Version]
  76. Ingold, K.; Stadelmann-Steffen, I.; Kammermann, L. The acceptance of instruments in instrument mix situations: Citizens’ perspective on Swiss energy transition. Res. Policy 2019, 48, 103694. [Google Scholar] [CrossRef]
Figure 1. Overall process and the survey measurements (in italic). The underscored text indicates the measurements that were repeated before and after the game.
Energies 13 04961 g001
Figure 2. Serious board game on siting a full mix of electricity generation technologies in Switzerland.
Energies 13 04961 g002
Figure 3. Summary of the technology choice and location at the end of all 10 serious board games with 44 participants in total. The color of the boxes represents the number of foils placed by all participants in each box. The annotations “×2” and “×4” mark the boxes, where one foil would respectively earn two or four points and hence would indicate boxes with higher efficiency or productivity.
Energies 13 04961 g003
Figure 4. Average final preferred electricity mix for Switzerland for 2035 in Riskmeter [66] (Section 2.1). The white markers on the left panel show the means (N = 44) and Table 1 provides the standard deviations. The black dashed lines show the lower bound for each technology, corresponding to already installed generation in Switzerland that will last until 2035.
Energies 13 04961 g004
Table 1. Initial and final technology preferences and preferred electricity mixes (means ± standard deviations) for Switzerland for 2035.
TechnologiesTechnology Preference
(1 = Completely Disagree, 7 = Completely Agree)
Preferred Electricity Mix
(TWh/Year in Riskmeter 1)
InitialFinalInitialFinal
Hydropower (all)6.14 ± 1.196.41 ± 0.98--
Large hydropower dams--20.27 ± 0.9920.37 ± 1.01
Large run-of-river hydropower--18.55 ± 1.0018.65 ± 1.01
Small hydropower--4.38 ± 0.794.57 ± 0.80 *
Solar cells6.36 ± 1.166.39 ± 1.3013.49 ± 4.1113.72 ± 4.11
Wind5.82 ± 1.305.66 ± 1.482.16 ± 1.242.39 ± 1.15 *
Deep geothermal4.93 ± 1.884.20 ± 2.221.26 ± 1.471.49 ± 1.46
Biogas5.17 ± 1.435.50 ± 1.460.85 ± 0.440.90 ± 0.45
Waste incineration4.88 ± 1.785.27 ± 1.662.56 ± 0.512.65 ± 0.51
Woody biomass4.50 ± 1.674.70 ± 1.750.49 ± 0.320.54 ± 0.34
Natural gas3.70 ± 1.732.61 ± 1.69 ***3.09 ± 5.192.50 ± 4.55
Nuclear2.02 ± 1.611.82 ± 1.562.16 ± 5.711.63 ± 4.69
Electricity savings and efficiency5.95 ± 1.535.77 ± 1.672.98 ± 2.313.17 ± 2.47
Import from abroad3.18 ± 1.622.61 ± 1.53 *0.74 ± 2.310.42 ± 1.45
* p < 0.05 and *** p < 0.001 between two measurements of the same variable before and after the board game; 1 Riskmeter submissions (Section 2.1) in TWh/year are constrained by the minimum and maximum potentials of each technology in Switzerland in 2035 (Figure 4).
Table 2. Survey results on the initial and final efficiency-equity tradeoff (means ± standard deviations).
Efficiency-Equity Tradeoff
(1 = Only Efficiency, 7 = Only Equity)
InitialFinal
Hydropower2.30 ± 1.391.50 ± 1.07 **
Solar cells3.32 ± 2.192.77 ± 2.09
Wind2.27 ± 1.452.14 ± 1.55
Deep geothermal3.07 ± 1.822.21 ± 1.54 *
Biogas3.57 ± 1.743.23 ± 1.79
Waste incineration3.84 ± 1.843.52 ± 2.16
Woody biomass3.20 ± 1.733.39 ± 1.73
Natural gas3.18 ± 1.403.35 ± 2.21
* p < 0.05 and ** p < 0.01 between two measurements of the same variable before and after the board game.
Table 3. Strategies for siting new technologies in terms of efficiency-equity tradeoff (means ± standard deviations).
Strategies for Siting New Technologies
(7 = Completely Agree, 1 = Completely Disagree)
Every municipality should supply its demand with its own plantsEquity3.21 ± 1.61
Municipalities that already have many plants should not build new onesEquity3.74 ± 1.54
New plants should be built in a way that all municipalities are equally affectedEquity3.81 ± 1.53
New plants should be built where they produce the most electricityEfficiency6.30 ± 0.80
The lowest possible number of new plants should be builtEfficiency4.14 ± 1.77
Fewer municipalities should build many plants so that other municipalities stay unaffectedEfficiency3.00 ± 1.70
Note: ‘Equity’ and ‘Efficiency’ denote whether the strategy rather follows the equity or efficiency principles.
Table 4. Initial and final equity judgments for the Energy Strategy 2050 (means ± standard deviations).
Equity Judgment for the Energy Strategy 2050
(1 = Much Unfairer, 7 = Much Fairer)
InitialFinal
Impact on cities vs. rural areas4.15 ± 1.494.18 ± 1.08
Impact on large Swiss regions4.08 ± 1.334.26 ± 0.83
Impact on low- vs. high-income households3.21 ± 1.653.45 ± 1.18
Impact on service, industrial vs. agricultural sectors3.73 ± 1.553.88 ± 1.26
Impact on small vs. large companies3.52 ± 1.674.02 ± 1.29
Impact on current vs. future generations4.93 ± 1.955.57 ± 1.52 *
* p < 0.05 between two measurements of the same variable before and after the board game.

