Article

Optimal Selection and Location of Fixed-Step Capacitor Banks in Distribution Networks Using a Discrete Version of the Vortex Search Algorithm

by
Walter Gil-González
1,
Oscar Danilo Montoya
2,3,
Arul Rajagopalan
4,
Luis Fernando Grisales-Noreña
1 and
Jesus C. Hernández
5,*
1
Grupo GIIEN, Facultad de Ingeniería, Institución Universitaria Pascual Bravo, Campus Robledo, Medellín 050036, Colombia
2
Laboratorio Inteligente de Energía, Universidad Tecnológica de Bolívar, Cartagena 131001, Colombia
3
Facultad de Ingeniería, Universidad Distrital Francisco José de Caldas, Bogotá D.C 11021, Colombia
4
School of Electrical Engineering, Vellore Institute of Technology, Chennai 632014, India
5
Department of Electrical Engineering, University of Jaén, Campus Lagunillas s/n, Edificio A3, 23071 Jaén, Spain
*
Author to whom correspondence should be addressed.
Energies 2020, 13(18), 4914; https://doi.org/10.3390/en13184914
Submission received: 27 July 2020 / Revised: 16 September 2020 / Accepted: 17 September 2020 / Published: 19 September 2020
(This article belongs to the Special Issue Heuristic Optimization Techniques Applied to Power Systems)

Abstract

:
This paper deals with the problem of the optimal selection of capacitor banks in electrical AC distribution systems for minimizing the costs of energy losses during a year of operation through a discrete version of the vortex search algorithm (DVSA). This algorithm works with a hypersphere with a variable radius defined by an exponential function where a Gaussian distribution is used to generate a set of candidate solutions uniformly distributed around the center of this hypersphere. This center corresponds to the best solution obtained at the iteration t, which is initialized at the center of the solution space at the iterative search beginning. The main advantage of combining the exponential function with the Gaussian distribution is the correct balance between the exploration and exploitation of the solution space, which allows reaching the global optimal solution of the optimization problem with a low standard deviation, i.e., guaranteeing repeatability at each simulation. Two classical distribution networks composed of 33 and 69 nodes were used to validate the proposed DVSA algorithm. They demonstrated that the DVSA improves numerical reports found in specialized literature regarding the optimal selection and location of fixed-step capacitor banks with a low computational burden. All the simulations were carried out in MATLAB software.

Graphical Abstract

1. Introduction

Electrical distribution networks are responsible for transferring energy from the transmission system to industrial, commercial, and domestic users [1]. The convectional configuration of these networks is radial; this means their configuration is like a tree where each user has one main supply source [2,3]. This implies that the energy reaches the end-users through the primary feeder of the network. Therefore, this increases the power losses of the system [4]. Additionally, the voltages of the end-users may be below the established limits. In order to improve the operation of the system, various strategies have been proposed, such as phase balancing [5], shunt capacitor placement [6], distributed generator placement [7], reconfiguration [8], location of energy storage systems [9], series compensation [10], etc.
One of the above-mentioned strategies being the most economical and easiest to implement is the optimal installation of shunt capacitors [11]. This strategy allows reducing power losses, improving voltage drop, and increasing power factor. However, shunt capacitor installation has some challenges, such as its placement and sizing, which are very important since if they are carried out improperly, they can increase the power loss and decrease the voltage profile of the distribution networks. Therefore, the optimal capacitor installation in distribution networks helps to reduce the annual operating costs caused by power losses by about 30% with low investments and minimum grid interventions, as reported in [6]. Thus, the optimal location problem of capacitor banks in distribution networks has been widely studied in the scientific literature; some of these works are presented below.
The location and sizing of capacitors in distribution systems have been tackled with several methodologies and optimization algorithms. The authors of [12] proposed a mixed-integer linear programming by using a suitable linearization that maximized the net present value of cash flow. In [13], a mixed-integer nonlinear programming (MINLP) approach was presented for radial and mesh distribution systems. In reference [14], a fuzzy-based approach mixed with the simulated annealing technique was proposed. The authors of [15] presented a combination between a loss sensitivity factor (LSF) and a particle swarm optimization (PSO) with its discrete version, while the LSF determines the node placement and the discrete PSO provides the capacitor size. In [16], a mixed approach that contemplates the LSF and voltage stability index (VSI) for the optimal capacitor installation considering all possible load variations was developed. The authors of [17] implemented two methods, a sensitivity analysis and the gravitational search algorithm (GSA). The sensitivity analysis reduces search space to find an accurate solution, while the GSA allocates the capacitor values. In reference [18], new PSO approaches, including Gaussian and Cauchy probability distribution functions, were described; whereas in [19] an improved harmony algorithm (IHA) mixed with LSF and VSI was presented. The LSF and VSI were used for node location, while the IHA approach provided the capacitor size. Other optimization algorithms that have been implemented for the optimal location and sizing of capacitors in distribution systems are two-stage method (TSM) [20], fuzzy-real coded genetic algorithm (FRCGA) [21], flower pollination algorithm (FPA) [22], teaching learning-based optimization (TLBO) [23], memetic algorithm [24], Chu–Beasley-based genetic algorithm [25], plant growth simulation algorithm [26], direct search algorithm [27], hybrid algorithm [28], firefly algorithm [29], and artificial bee colony [30].
Recently, a promissory metaheuristic optimization technique known as the vortex search algorithm (VSA) has emerged to solve complex nonlinear non-convex optimization problems in the continuous domain. Some of these approaches are optimal power flow in AC and DC networks [31,32,33], respectively; optimal selection of analog active filter components [34]; application of the VSA for numerical optimization [35,36,37]; optimal design of offshore and onshore natural gas liquefaction processes [38]; and optimal solution of the inverse kinematics problem of serial robot manipulators with offset wrist [39]; among others. It is worth mentioning that the main advantages of using the VSA in nonlinear optimization problems are the following: (i) its low standard deviation since it works with Gaussian distribution functions for exploring the solution space; (ii) its correct balance between exploration and exploitation of the solution space during the iteration procedure since the optimization search is guided by a variable radius applied on the Gaussian hypersphere that contains all the potential solutions of the current iteration; and (iii) its easy implementation for any programming language via sequential programming. On the other hand, after a careful review of the state of the art, we do not find evidence regarding a discrete version of the VSA applied to mixed-integer nonlinear optimization problems. This is a gap that this research tries to fill in the electrical engineering area by applying this variant of the VSA applied to the issue of the optimal location and selection of fixed-step capacitor banks in distribution networks. Considering the specialized literature, the main contributions of this research can be summarized as follows:
The proposal of a discrete version of the VSA (DVSA) to solve the problem of the optimal selection and location of fixed-step capacitor banks in AC distribution networks with low computational effort.
The use of a discrete codification implements integer numbers as decision variables that simplify the dimension of the classical binary vectors used in the literature to represent this optimization problem. This codification compacts in a unique stage, the location and sizing problems of capacitor banks, which substantially reduces the processing times.
An improvement of the current results reported in the specialized literature for the problem of the optimal location of fixed-step capacitor banks.
This paper is organized as follows: Section 2 shows the mathematical formulation for the optimal location and sizing of capacitors in distribution systems. Section 3 explains the proposed methodology to solve the optimal capacitor installation problem. Section 4 describes the test system and capacitor bank information. The next section analyzes the main results. Lastly, the conclusions of the study and the outlines for future research are presented in Section 5.

2. Mathematical Formulation

The problem of the optimal location and selection of fixed-step capacitor banks in AC distribution networks can be represented with an MINLP model, where (i) the integer characteristic is defined by the possibility of locating (or not) capacitor bank k into an arbitrary node i, which is defined with the integer variable x i , k ; (ii) the mixed nature of the model is giving by the presence of continuous variables such as power injection in slack nodes, and voltage magnitudes v i and angle θ i in all the nodes; (iii) the nonlinear structure is defined by the presence of a trigonometric function in the power balance equations as well as by the products between voltage magnitudes in different nodes. The complete mathematical structure of this MINLP model is described as follows:

2.1. Objective Function

The objective function corresponds to the minimization of the total energy cost during a continuous year of operation added to the investment costs in fixed capacitor banks, as presented in (1).
min z = i N k C C k year Q k x i , k + C kWh loss Δ T i N j N Y i j v i v j cos δ i δ j θ i j ,
where z is the objective function value; C k year is the installation cost of capacitor bank k with total reactive power injection Q k at any node of the system; C kWh loss is the average costs of the energy losses in the whole distribution network, Δ T is the length of the time period under analysis, i.e., Δ T = 8760 h; Y i j is the magnitude of the admittance matrix that interconnects nodes i and j; v i and v j are the variables associated to the magnitude of the voltages at nodes i and j which have angles δ i and δ j , respectively; and θ i j is the angle of the admittance that relates nodes i and j. Note that C and N are the sets that contain all the capacitor options and the total nodes of the network, respectively.

2.2. Set of Constraints

The set of constraints corresponds to a compilation of different operative limitations of any power distribution; these are listed below:
p i g p i d = v i j N Y i j v j cos δ i δ j θ i j , i N
q i g + k C Q k x k , i q i d = v i j N Y i j v j sin δ i δ j θ i j , i N
k C x k , i 1 , i N
i N k C x k , i = N cap ava ,
v min v i v max , i N
where p i g and q i g correspond to the active and reactive power generation in the node i; p i d and q i d are the active and reactive power consumption in the node i; v min and v max are the minimum and maximum voltage bounds, and N cap ava represents the number of capacitors available for installation.
The interpretation of the optimization model (1)–(6) is as follows: Equation (1) defines the objective function related to the annual operation cost of the distribution network which is associated with the sum of the investments in fixed-step capacitor banks and the cost of the energy losses produced in all the resistive effects in the distribution lines. Expressions (2) and (3) correspond to the active and reactive power balance constraints per node, respectively. These are the more complex constraints in power system optimization since these are a nonlinear non-affine set of equality constraints with products between voltage magnitudes and trigonometric functions, which are typically solved with numerical methods such as Newton–Raphson or successive approximations [40]. Expression (4) determines the possibility of installing only one type of capacitor bank per node. Equation (5) specifies the fixed number of capacitor banks to be installed in the distribution network. In Equation (6), the voltage regulation constraint is presented, which is a typical operational restriction imposed by the regulatory entities on the distribution company to guarantee a quality service to all the end-users.
Remark 1.
The optimization model (1)–(6) is an MINLP representation of the problem of the optimal location of fixed-step capacitor banks in distribution networks, where the discrete nature of the decision is an integer. Nevertheless, we select a binary representation by introducing the decision variable x k , i since it facilitates the interpretation of the complete mathematical formulation. Notwithstanding, in the solution methodology (i.e., the next section), we codify it by using its integer structure to simplify the structure of the DVSA.

3. Solution Methodology

To solve the problem of the optimal location of fixed-step capacitor banks in distribution networks to minimize operating costs in a horizon of one year, this paper used the VSA in its discrete form (i.e., DVSA) as a master optimization stage that is connected with a power flow method in its slave stage. The function of the master stage is to define the set of nodes where the capacitor will be located with their corresponding sizes, while the slave state is entrusted with evaluating the power flow constraints, i.e., the power balance equations defined by (2) and (3).

3.1. Vortex Search Algorithm

The VSA is an optimization methodology that allows solving nonlinear non-convex optimization problems with a continuous structure based on the manner of stirred fluids that produce vortex behaviors in pipes [34]. The main characteristic of this approach is that it works with a Gaussian distribution and a variable radius that permits the exploration and exploitation of the solution space during the iterative process [33]. In the literature, the optimal power flow has been successfully solved with the VSA approach by guaranteeing the global optimal value with minimum standard deviations [41]. Even if the VSA works with continuous variables, in this research, we used this evolution strategy to explore and exploit the solution space by rounding these variables to the nearest integer to have a feasible solution for the slave stage.
In general terms, the VSA works with nonconcentric hyperspheres, where the exterior diameter represents the boundaries of the solution variables, and its center represents the current best solution. In the beginning, the center of the hypersphere (i.e., μ 0 ) is defined in (7):
μ 0 = x min + x max 2 ,
where x min and x max represent vectors with dimensions d × 1 that contain the minimum and maximum bounds of the decision variables.
A set of solutions is generated around the center of the hypersphere in its neighborhood, which is denoted as C t ( s ) , where t is the iterative counter. Initially t = 0 , which implies that C 0 ( s ) is generated by a random process using a Gaussian distribution in the d dimensional space. Note that C 0 ( s ) = { s 1 , s 2 , , s m } , being m the number of candidate solutions. To generate a Gaussian distribution in a multidimensional space, an equation is used as defined in Expression (8).
p ( x | μ , Σ ) = 2 π d Σ 1 2 e x p 1 2 x μ T Σ 1 x μ ,
where x R d × 1 corresponds to a random vector of variables, μ R d × 1 is a simple mean (center) vector, and Σ R d × d is the covariance matrix.
Note that if the diagonal elements of the covariance matrix are equal and the off-diagonal elements in this matrix are zero, then the Gaussian distribution will produce hyperspheres in a d-dimensional space. An easy way to determine Σ , considering zero covariances and equal variances, is defined in (9).
Σ = σ 2 I d × d ,
where σ is the variance of the Gaussian distribution and I d × d is an identity matrix. Observe that the standard deviation of the Gaussian distribution (i.e., σ 0 ) can be defined as in Equation (10):
σ 0 = max x max min x min 2 ,
where σ 0 is considered the radius of the hypersphere in a d-dimensional space, i.e., r 0 . To attain a correct exploration in the solution space, σ 0 initially corresponds to the biggest possible hypersphere. In addition, during the search process, its radius decreases closer to the optimal solution. At the selection stage, the best solution s 0 , * C 0 ( s ) is selected and memorized to modify the current center of the hypersphere μ 0 . Each solution s k l needs to lie within its limits before the selection step. The rule employed for this purpose is presented in (11):
s h l = x l max x l min r l + x l min , s h l , x l max x l min r l + x l min , s h l < x l min x l min s h l x l max s h l > x l min
where h = 1 , 2 , , m , l = 1 , 2 , , d , and r l represent uniformly distributed random numbers in the interval 0 , 1 . Observe that the best solution s t , C t ( s ) is updated if the current solution is better, which updates of the center μ t and its radius r t .
One of the essential aspects in the implementation of the VSA approach for nonlinear optimization is the adaptive adjusting of the hypersphere radius by using a variable-step approach [34]. In the original version of the VSA approach, gamma functions were proposed to guide the variation of the radius during the iterative procedure. However, the authors of [33] have simplified it by introducing a decreasing exponential function to make the radius variable as defined in (12):
r t = σ 0 1 t t max e α τ τ max ,
where the parameter α is defined heuristically as 6, and t max is the total number of iterations [33].
To exemplify the codification proposed to represent the problem of the optimal location of fixed-step capacitor banks in distribution networks, i.e., the potential solution s k takes the following form:
s h = 1 , , n , , i | k , , 1 , ; , c ,
where the first part of the vector represents integer numbers that define the node where a capacitor is located (i.e., from node 1 to node n). While the second part of the vector corresponds to the size of capacitor bank k, i.e., the integer number that determines the nominal reactive power injection of the capacitor, which varies from 1 to c, being c the capacitor bank with the highest reactive injection capability.
The first part of the codification vector is always revised so that repeated numbers do not appear in order to guarantee the feasibility of each solution to fulfill constraint (4), which is associated with the possibility of locating a unique capacitor bank per node.
In Algorithm 1, the implementation of the VSA to solve discrete optimization problems is summarized.
Algorithm 1: Proposed master optimization algorithm based on the VSA to define the location and sizing of capacitor banks in distribution networks.
1.  Inputs:
2.  Determine the initial center μ 0 from (7);
3.  Calculate the initial radius r 0 (or the standard deviation σ 0 ) with (12);
4.  Set the initial best fitness function as z ( s best ) = (minimization problem);
5.  Make t = 0 ;
6.  while ( t t max )
7.    Generate the candidate solutions using a Gaussian distribution around the center μ t with a
    standard deviation (radius) r t as defined in (9) to obtain C t ( s ) with d-dimension columns and m rows;
8.    If C t ( s ) crosses any upper or lower bound, place it within its bounds using (11);
9.    Evaluate the successive approximation power flow problem (see (16)) for each s h in C t ( s ) and calculate
     its corresponding fitness function as (13);
10.   Select the best solution s as the argument that produces the minimum z f contained in C t ( s ) ;
11.   if ( z f ( s ) < z f ( s best ) )
12.     s best = s ;
13.     z f ( s best ) = z f ( s ) ;
14.   else
15.    Retain the best solution attained so far s best ;
16.   end
17.   Make the center μ t + 1 equal to the best solution s best ;
18.   Update the current radius r t + 1 as given by (12);
19.    t = t + 1 ;
20.  end
21.  Output:
22.  The best solution is found for s best and its fitness function is z f ( s best ) ;
Note in Algorithm 1 that we speak about the fitness function z f , which allows guiding the exploration and exploitation of the solution space during the iterative procedure. Here, the proposed fitness function takes the following form:
z f = z + β i N max 0 , v i v max + max 0 , v min v i ,
where β is a penalization factor that amplifies the effect of a possible voltage violation.
Remark 2.
Note that the power balance equations (see Expressions (2) and (3)) due to their equal nature need to be solved with a numerical method, which will be presented. In addition, the constraints related to the number of capacitor banks available and their installation in nodes are directly guaranteed by the proposed codification, which implies that they are always fulfilled during the iteration procedure.
Remark 3.
Algorithm 1 is the general pseudo-code for solving discrete optimization problems via the DVSA in distribution system applications by using a master–slave optimization strategy. Observe that in the case of the optimal location and selection of fixed-step capacitor banks in line 9 of this algorithm, the slave stage (i.e., the successive approximation power flow approach) is implemented, which provides the required information regarding grid performance (voltage magnitudes and angles) to evaluate the fitness function that guides the whole optimization process through the solution space [42].

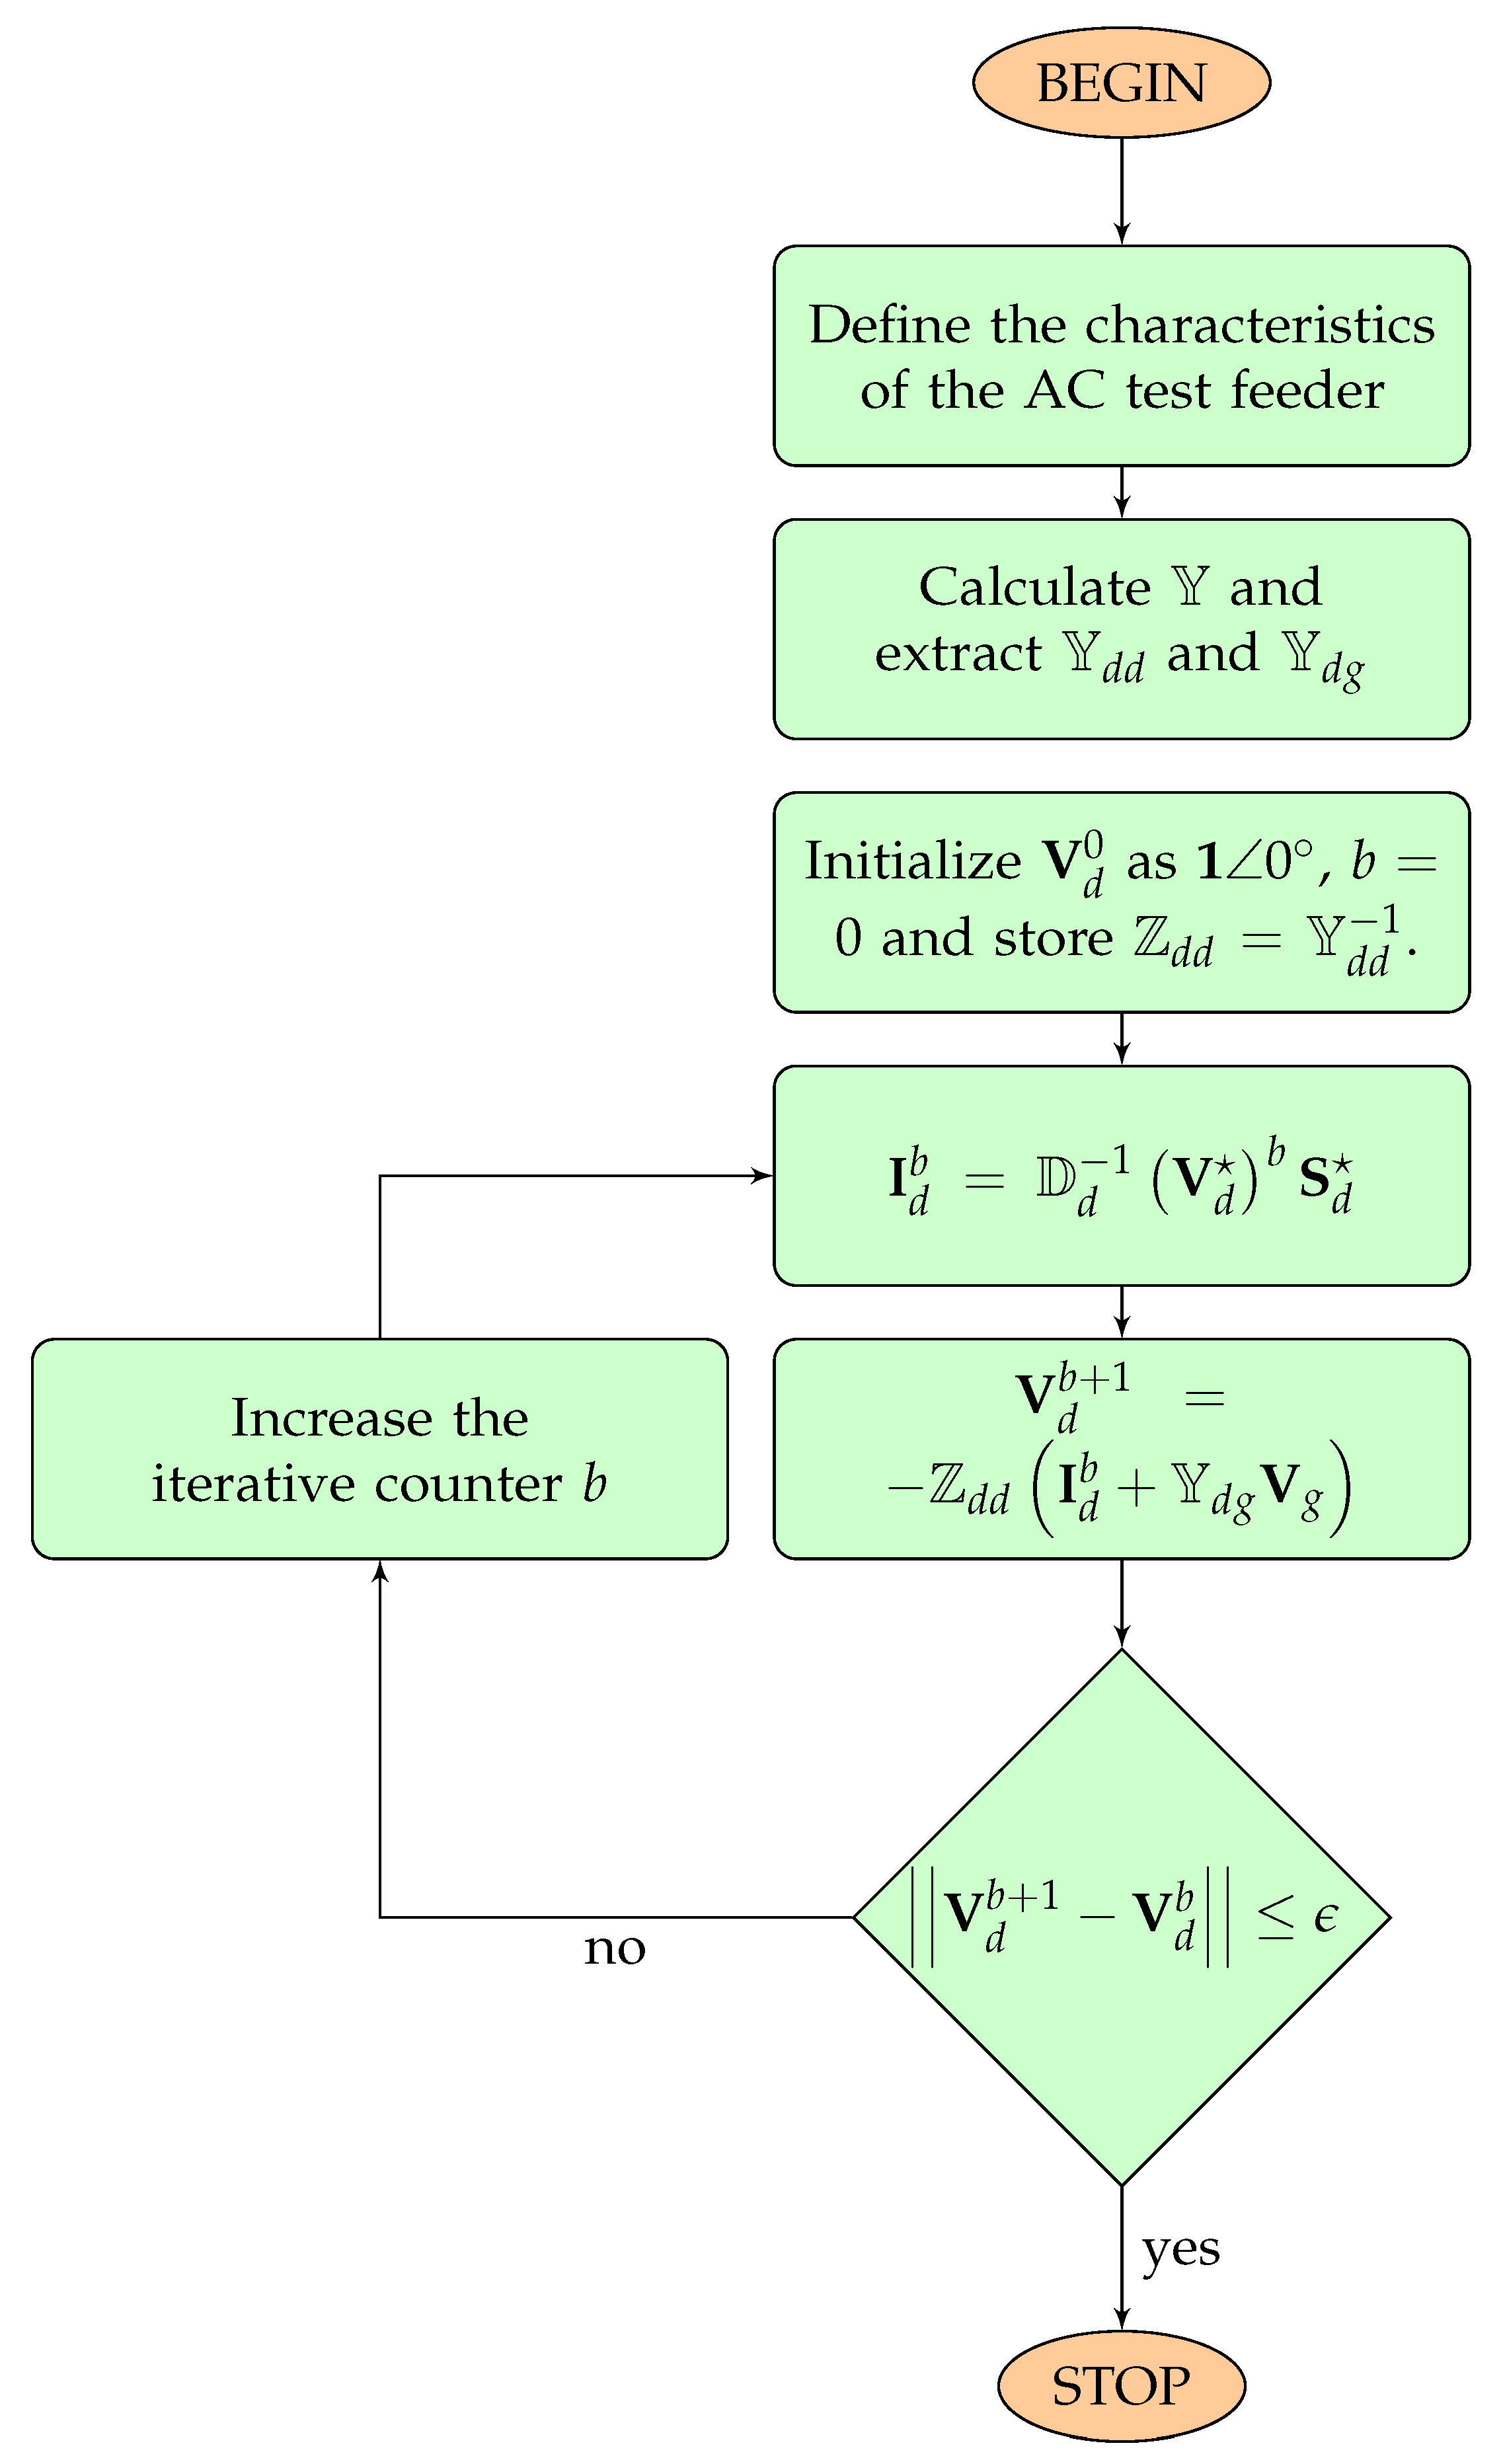
3.2. Successive Approximation Power Flow Approach

The successive approximation power flow method is a powerful tool to solve power flow problems in electrical distribution networks with a convergence guarantee, as recently demonstrated in [40]. This approach works with the complex representation of the power flow problem; i.e., Equations (2) and (3) are rewritten as follows:
S g * = d i a g V g * Y g g V g + Y g d V d ,
S d * = d i a g V d * Y d g V g + Y d d V d ,
where S g is a vector that has apparent power injection in all the slack nodes; S d is a vector that contains all the apparent power consumptions in the demand nodes, including the reactive power injections of the fixed capacitor banks installed; and V g and V d are the voltage variables in slack and demand nodes, respectively. Note that Y · , · is rectangular matrices with the components of the admittance matrix [43].
Remark 4.
The apparent power balance equation (14) is indeed a linear equality constraint where the variables are the amount of apparent power injection in the slack nodes and the voltage values in the demand nodes. Nevertheless, the main complication in the power flow analysis is the solution of (15) since it is a set of nonlinear equations that require numerical methods to be solved.
Note that the solution of (15) can be achieved by rewriting it as a fixed-point theorem form, i.e., V d = f V d , as follows:
V d b + 1 = Y d d 1 d i a g 1 V d b , * S d * + Y d g V g ,
where b is the iterative counter.
The convergence of the recursive expression for power flow analysis defined by (16) was proved in [40,44] by using the Banach fixed-point theorem. In addition, the recursive formula (16) is evaluated until the convergence error is reached; i.e., max V d b + 1 V d b ϵ , where epsilon is recommended in the literature as 1 × 10 10 .
One of the main advantages of the successive approximation method for power flow solutions in distribution networks is its speed of convergence. This is because the inverse of the matrix Y d d is calculated one time and stored in memory to accelerate the required computational times in its solution [40].
Finally, Figure 1 presents the flow diagram of the slave optimization stage (i.e., the power flow evaluator) that is responsible of providing all the electrical variables required in the fitness function evaluation.

4. Test Systems

This section presents the test system information of two radial distribution test feeders largely used in power system optimization. These test systems correspond to the 33- and 69-node test feeders.

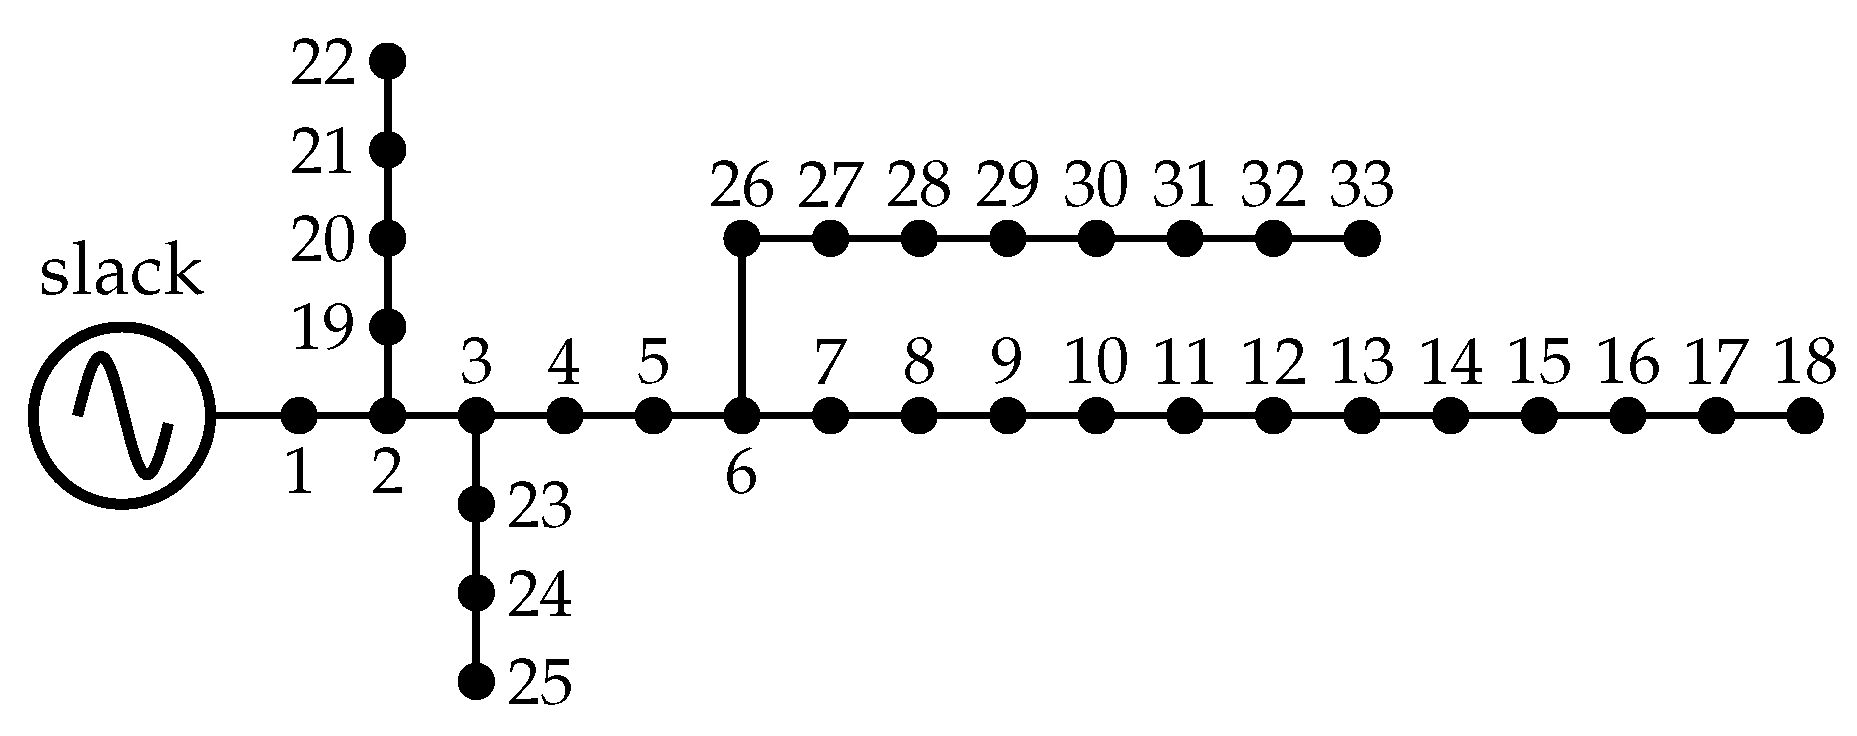
4.1. Thirty-Three-Node Test Feeder

The 33-node test feeder is a radial distribution network composed of 32 lines and 33 nodes, which is operated at 12.66 kV as the nominal voltage at the substation (i.e., node 1). The electrical configuration of this test feeder is depicted in Figure 2. The total active and reactive power consumptions are 3715 kW and 2300 kVAr, respectively. The initial power losses of the 33-node test feeder are 210.9876 kW.
The information for all the branches and the load consumption of the 33-node test feeder is listed in Table A1 located in Appendix A.

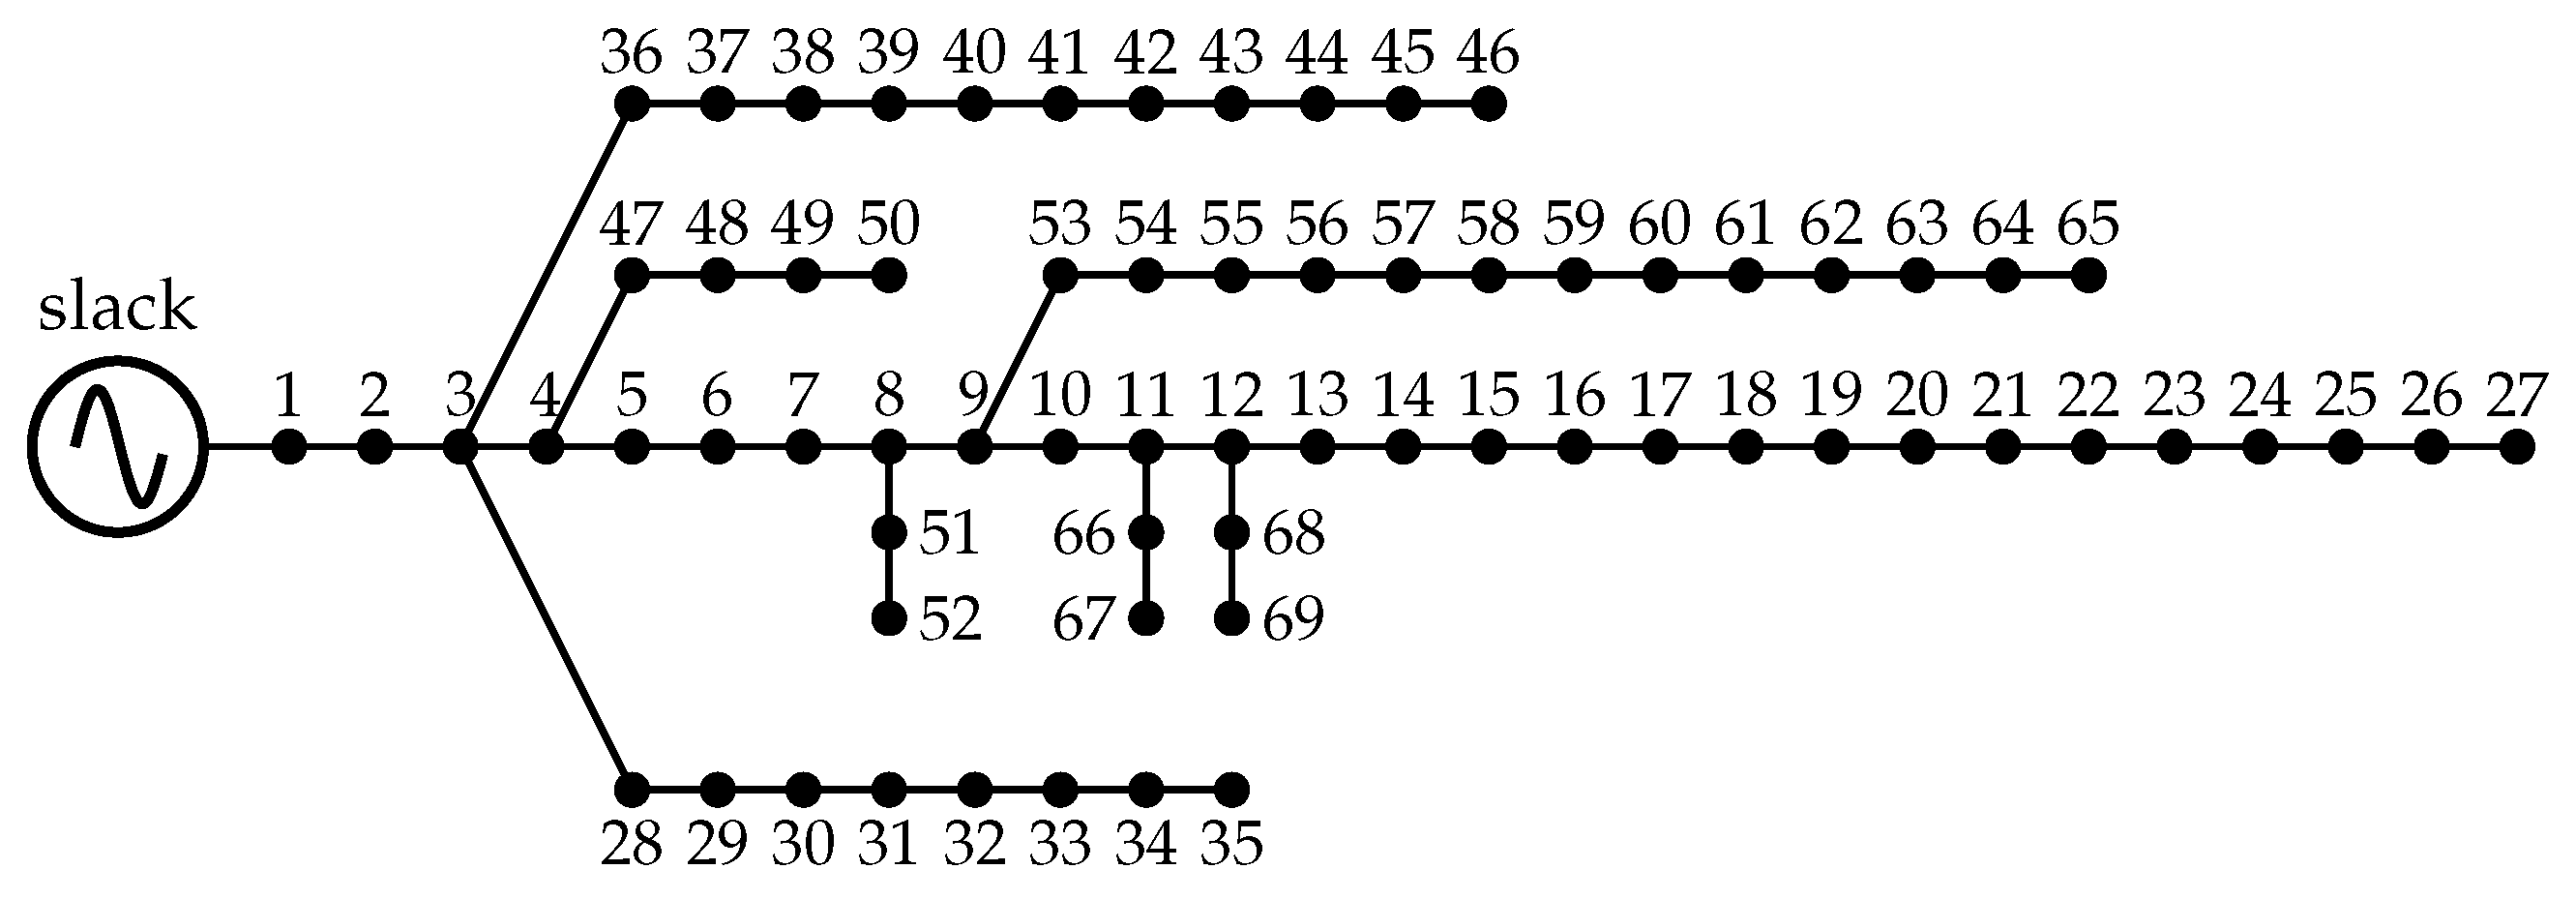
4.2. Sixty-Nine-Node Test Feeder

The 69-node test feeder is composed of 68 branches and 69 nodes, which are fed with 12.66 kV being the voltage-controlled source located at node 1. The electrical configuration of this test feeder is reported in Figure 3. This feeder has the total active and reactive power demands of 3890.7 kW and 2693.6 kVAr, respectively. The initial active power losses of this system are 224.9520 kW.
The information for all the branches and the 69-node test feeder load consumption is presented in Table A2 located in Appendix A.

4.3. Capacitor Banks Information

The set of fixed-step capacitor banks considered in this research are listed in Table 1, which was taken from [22]. Note that C kWh loss is assigned here as 0.0192 US$/kWh-year.

5. Computational Validation

To solve the general MINLP model (1)–(6) that represents the optimal location problem of fixed-step capacitor banks in AC distribution networks, we employed the MATLAB software version 2020a on a desktop computer with an INTEL(R) Core(TM) i 5 3550 3.5 -GHz processor and 8 GB of RAM running on a 64-bit version of Microsoft Windows 7 Professional.
The selection of the parameters reported in Table 2 was done using a sensitivity analysis between the number of individuals in the population and the number of iterations used by the DVSA. In this sense, we made and explored between 5 to 20 individuals and 500 to 2000 iterations in both test feeders, where we observed the following: (i) low individuals and low iteration numbers make the optimization process faster but the possibility of finding the global optimal solution decreases significantly; (ii) large numbers of individuals and iterations make the optimization process slow but the possibility of finding the global optimal solution increases significantly; and (iii) iteration numbers between 800 and 1500 and population sizes between 8 and 12 allow making the correct balance between total processing times and the possibility of finding the global optimum at each execution. For this reason, we selected a population size with 10 elements and 1000 iterations to parameterize the proposed DVSA.
It is worth mentioning that for comparative purposes with reference [22], we will consider the possibility of installing three fixed-step banks in the 33- and 69-node test feeders.

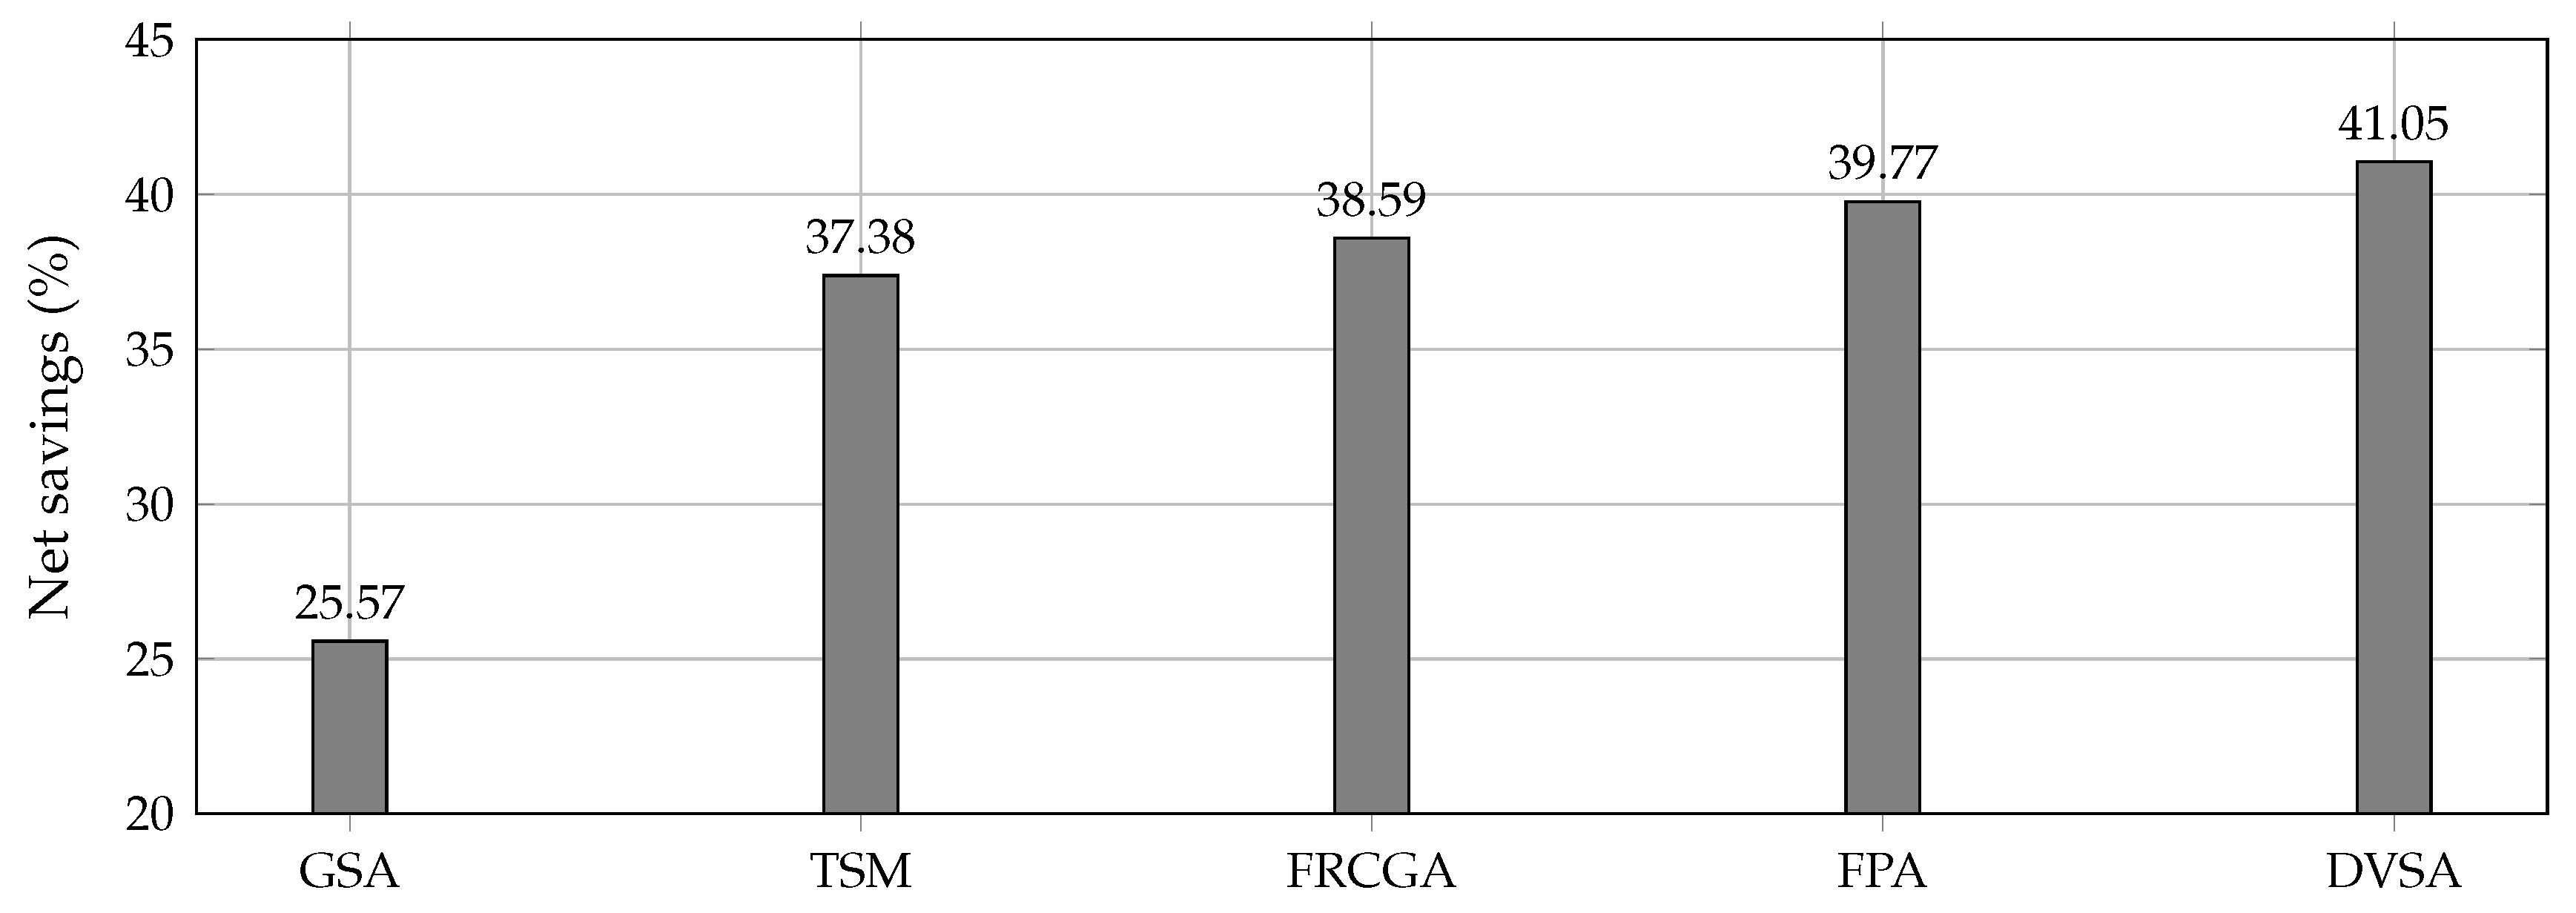
5.1. Results in the 33-Node Test Feeder

Table 3 reports the results reached by the proposed DVSA in the 33-node test feeder. These results are compared to reported by the following optimization methods: GSA [17], TSM [20], FRCGA [21], and FPA [22].
From Table 3, the following can be observed:
The proposed DVSA reaches a better solution regarding final power losses in the 33-node test feeder with 138.416 kW when compared to the results in the literature. This implies a total net savings of about US$ 12 , 191.17 , which is an additional savings of US$ 502.26 in comparison to the results reached by the FPA.
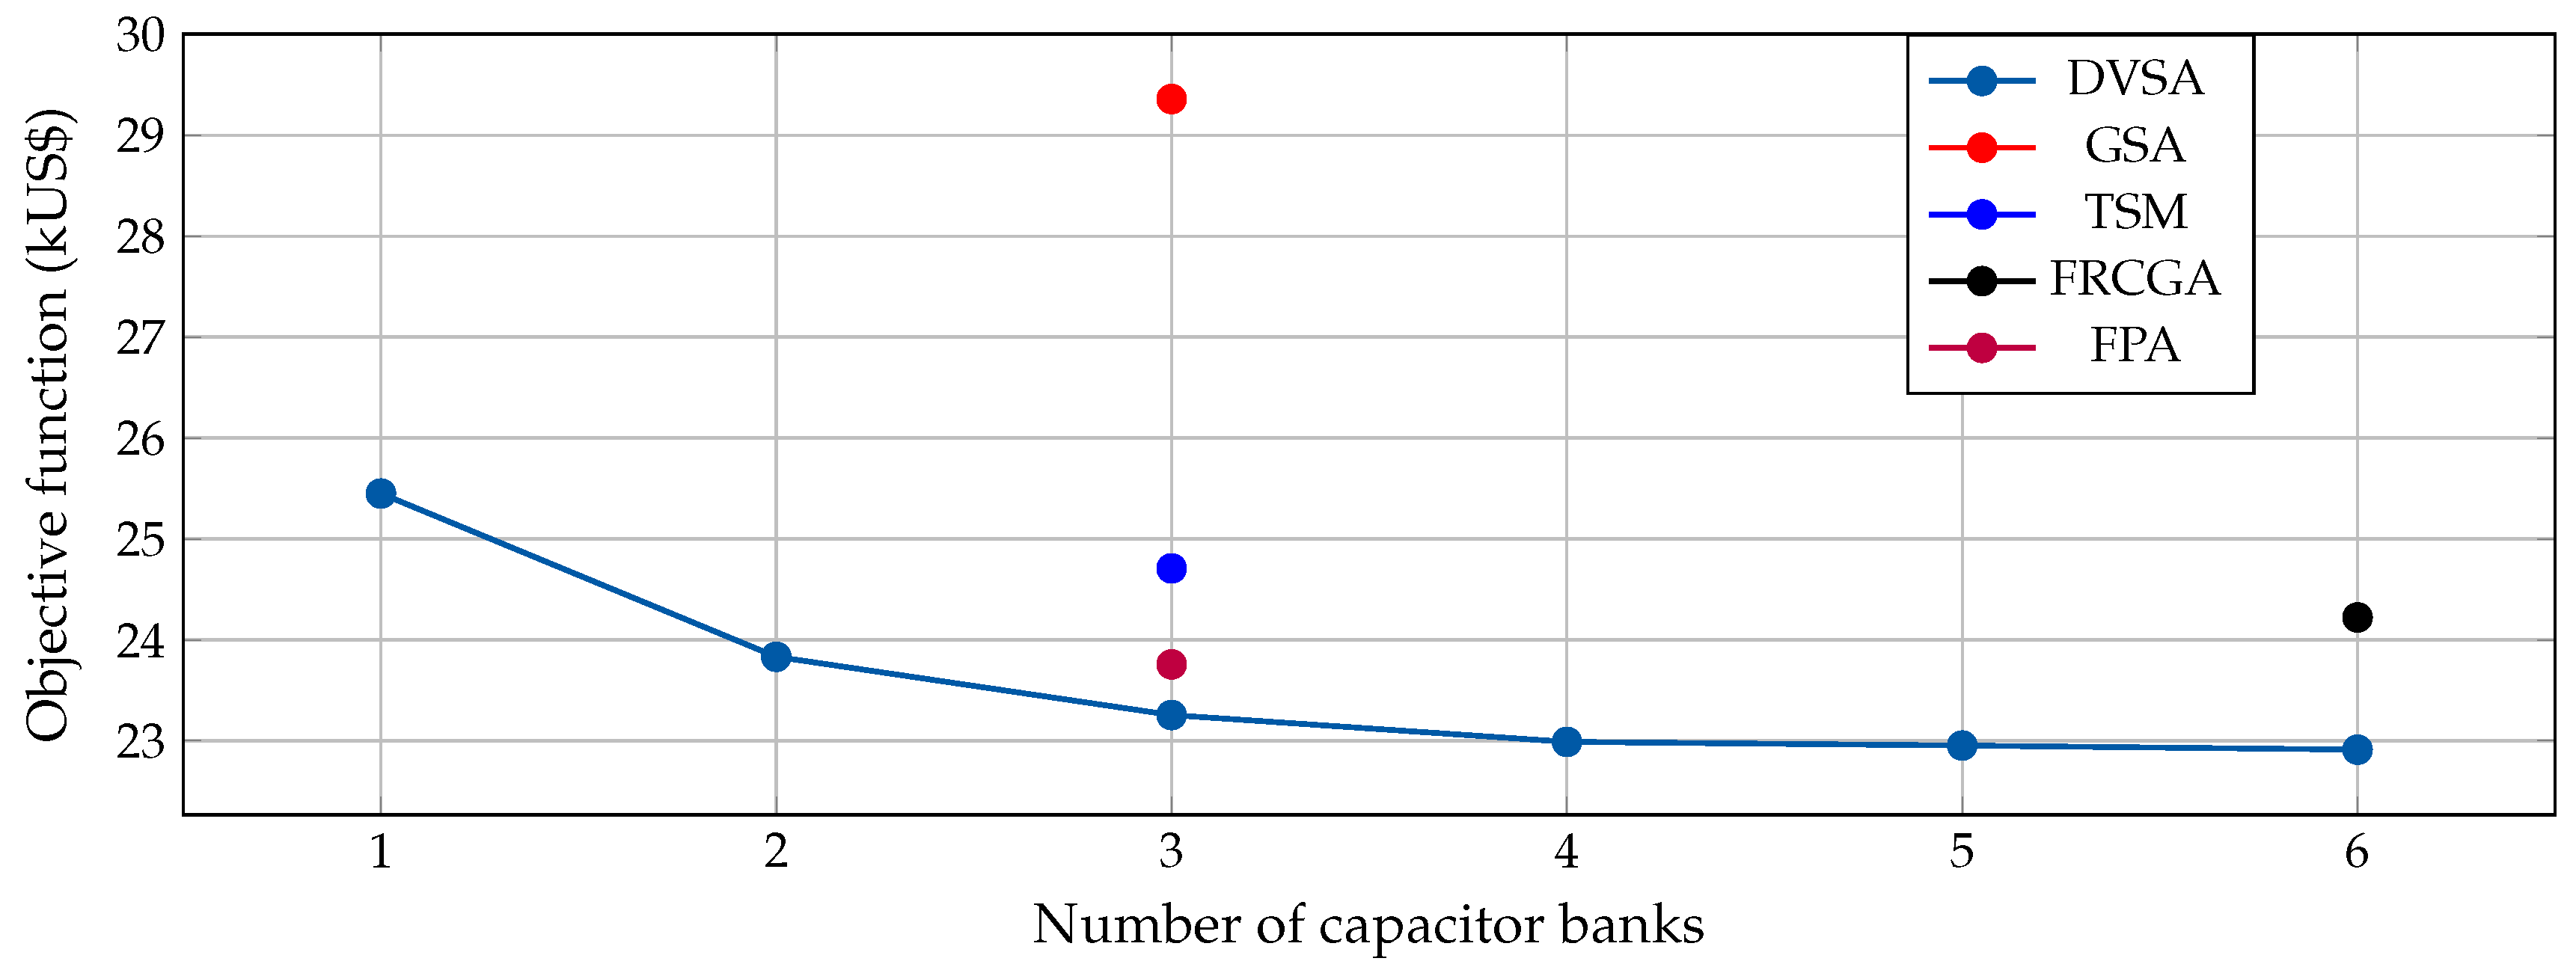
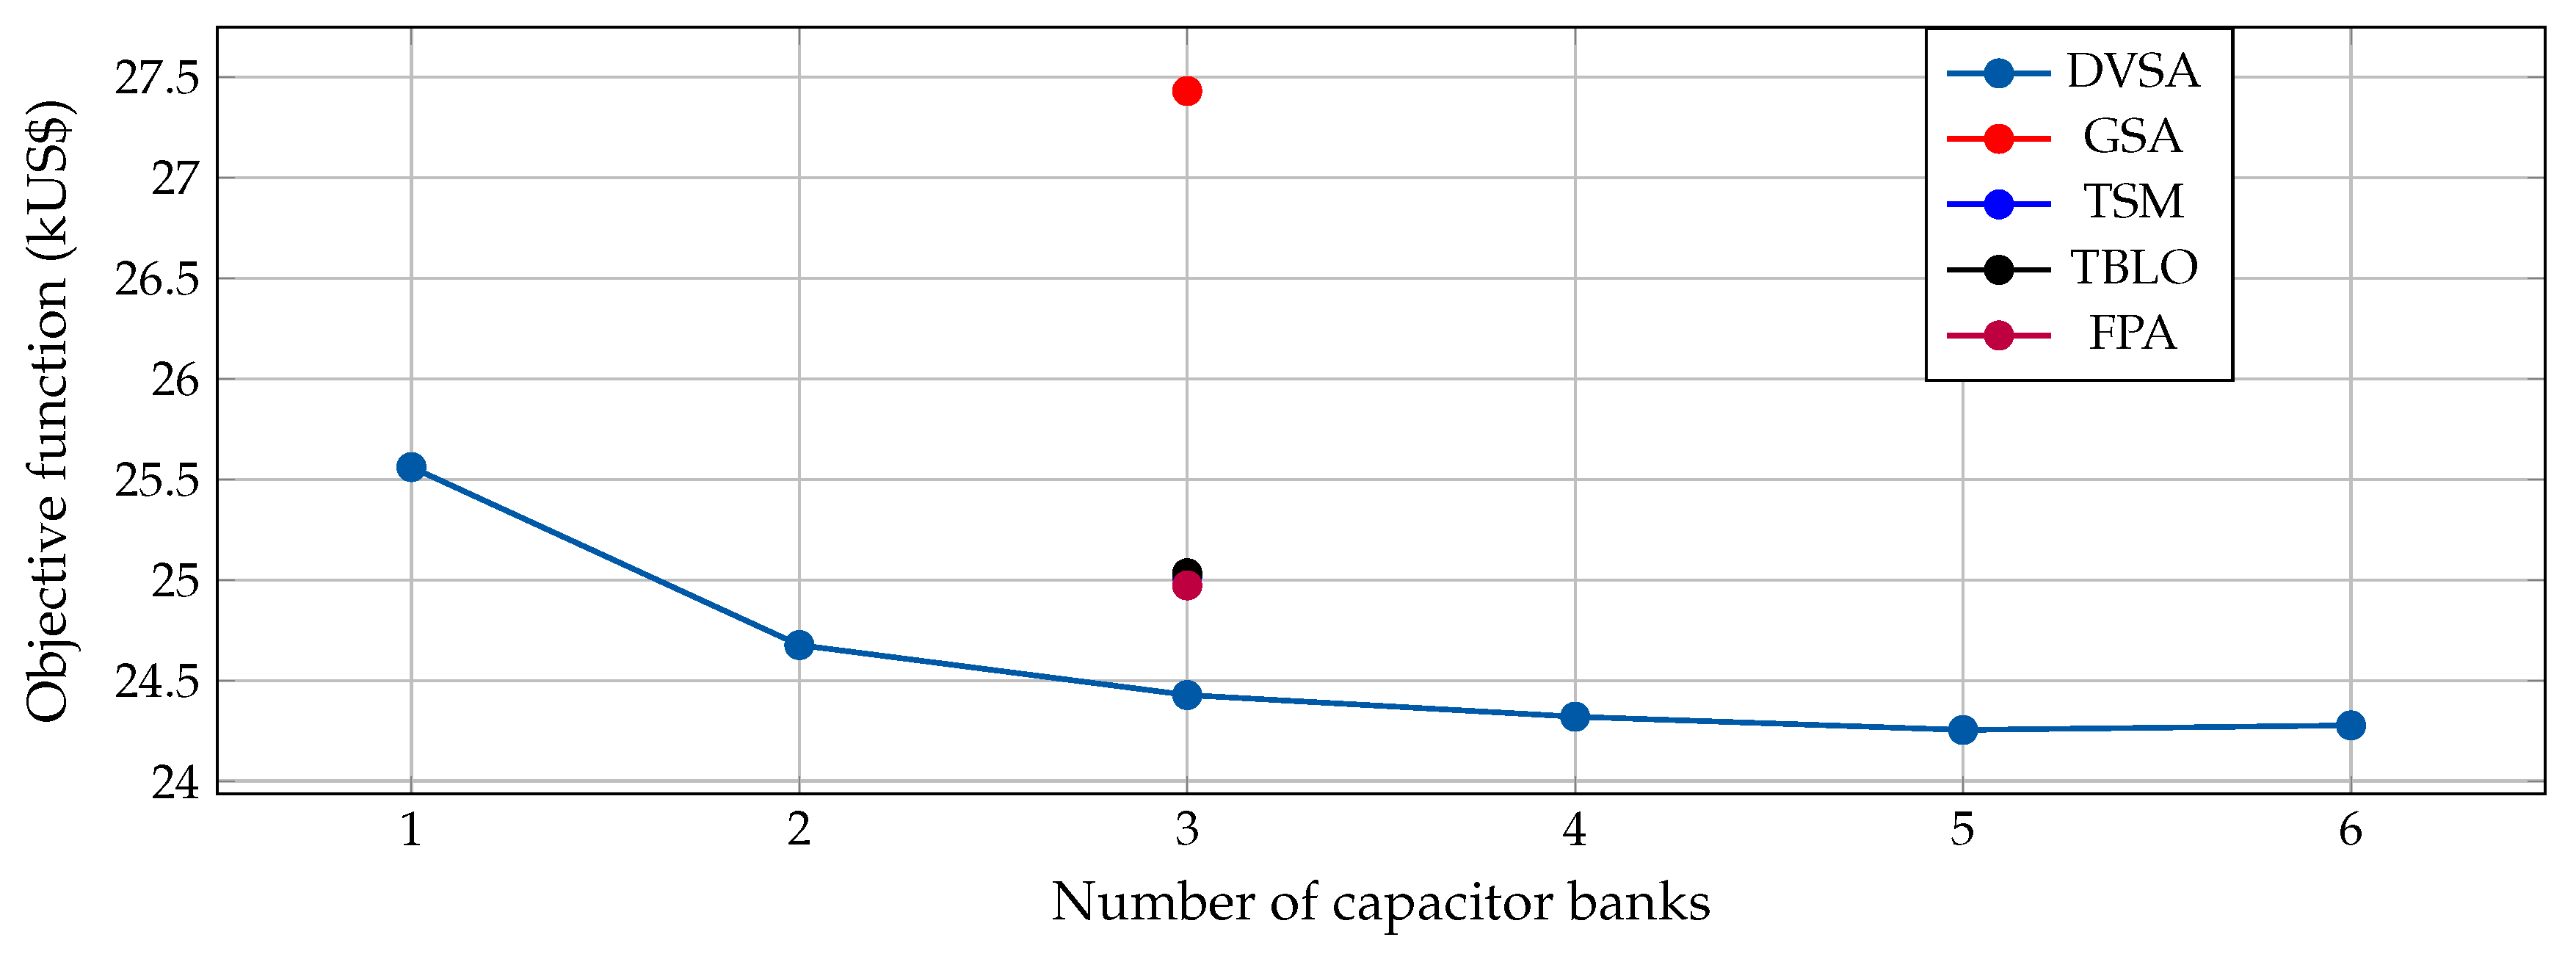
The FRCGA method requires at least six capacitor banks to reduces the total power losses about 33.05 % , while the proposed approach with only three capacitor banks reaches 34.40 % , regarding the base case; this implies an additional improvement of 1.35 % .
Figure 4 presents the percentage of energy-saving costs after the fixed-step capacitor banks in the 33-node test feeder are positioned. This figure confirms that the proposed DVSA reaches the best net savings indicator with a reduction of about 41.05 % , only followed by the FPA with 39.77 % .
Figure 5 illustrates the effect of installing the capacitor banks with the proposed method on the voltage profile for the 33-bus system. Note that the voltage profiles are improved when compared with the base case. In addition, note that the lowest voltage without compensation is 0.9038 pu and with compensation it is 0.9306 pu; this indicates that the lowest voltage improved by 2.93%.
It is important to mention that after 100 consecutive evaluations of the proposed approach, the maximum operating costs reached is about US$ 23 , 477.26 . This result is better than the result achieved by the FPA. This maximum result obtained by the DVSA corresponds to the location of capacitor banks in nodes 3, 12, and 30 with reactive power injection capabilities of 900 kVAr, 450 kVAr, and 900 kVAr, respectively. In addition, the standard deviation of the proposed DVSA is about US$ 94.36 . Regarding processing times, the proposed approach takes about 2.98 s to reach the global optimum. After 100 consecutive evaluations, we note that the probability of finding the global optimum by the proposed DVSA is about 70 % for the 33-node test feeder.
Figure 6 reports the final operation costs of the 33-node test feeder when the possibility of locating fixed step-capacitor banks varies from one to six.
From Figure 6, we can note the following:
The final operating costs in the 33-node test feeder present higher variations if the number of fixed-step capacitor banks oscillates from one to three. However, after four capacitor banks, the reduction of the operating costs presents saturations. This implies that three capacitor banks are enough to reach adequate optimal solutions with minimum physical interventions inside the grid.
The solution of the proposed DVSA for locating two or more capacitors shows better results than approaches in the literature, which means that our approach is efficient in reducing the total operating cost and suitable to be used for utilities in real applications.

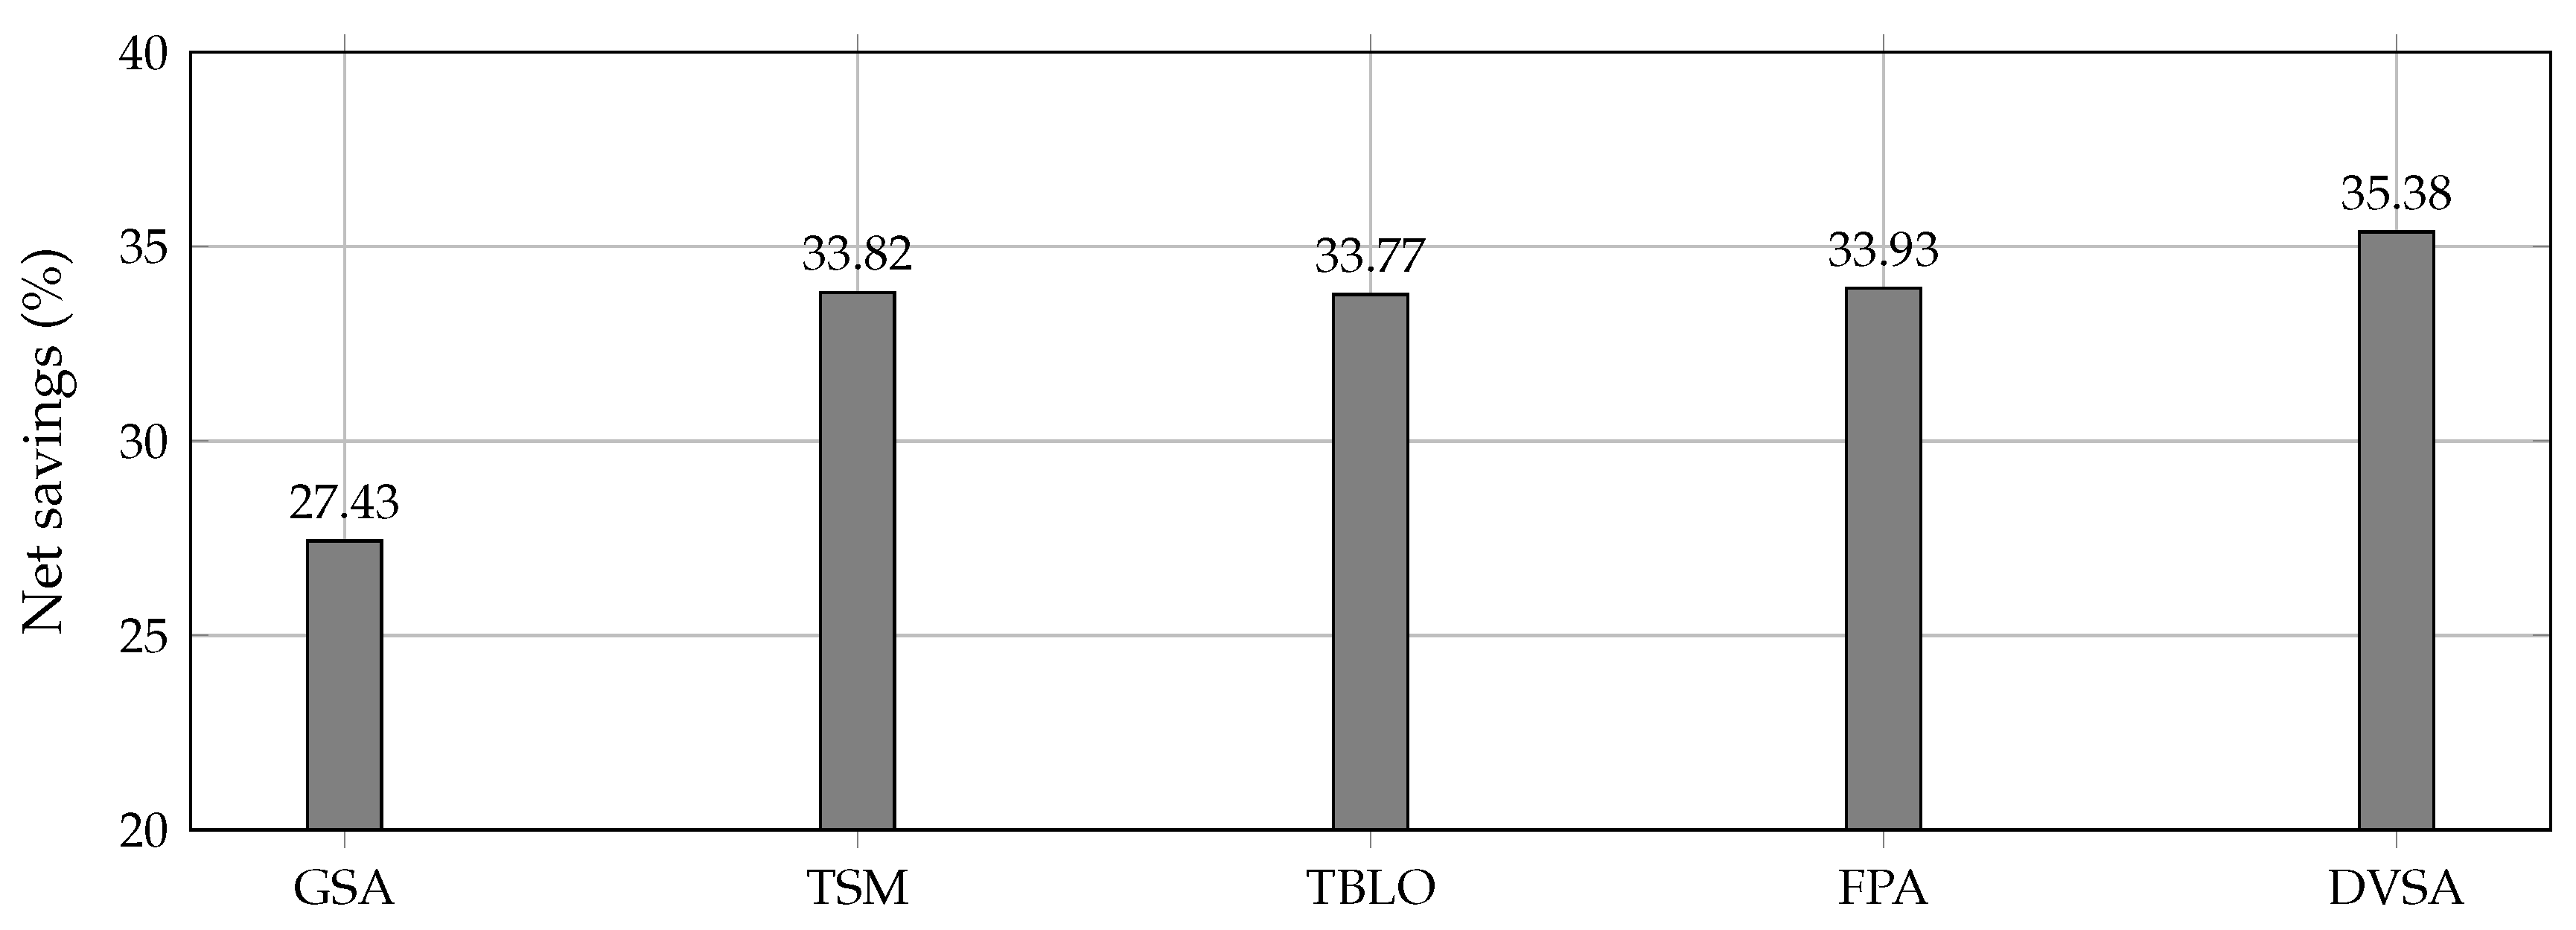
5.2. Results in the 69-Node Test Feeder

Table 4 shows the numerical comparisons between the proposed DVSA and approaches in the literature. In this case, it is also carried out by comparing the TLBO [23].
From Table 4, it is possible to confirm that the best approach to reduce total power losses and operating costs by using fixed-step capacitor banks in distribution systems is the DVSA. This is because it saves US$ 545.13 when compared to the solution reported by the FPA. In addition, comparing the total reactive power injections between the proposed approach (1800 kVAr) and the FPA approach (1950 kVAr) shows that the reactive power injection is lower when the proposed approach’s configuration is used. This implies that the total operating costs are reduced.
Figure 7 depicts the percentage of cost savings when fixed-step capacitor banks are installed in distribution networks.
From Figure 7, we can confirm that the best approach to reduce the annual operation costs in distribution networks is our proposal with total cost savings of about 35.38 % , which is at least a 1.45 % improvement when compared to the FPA, and 6.50 % concerning the worst method, i.e., GSA.
Regarding computational performance, the proposed DVSA takes about 14 s to reach the global optimal solution with an efficiency of 32% after 100 consecutive evaluations. The maximum value achieved by the proposed approach is about US$ 24 , 866.68 . This solution implies that even the worst solution of the DVSA is better than the results reported by all the comparative methods, as can be seen in Table 4. In addition, the standard deviation of our approach is about US$ 98.97 , which implies that all the solutions reached by the DVSA are similar.
Figure 8 reports the annual operating costs when a different number of capacitor banks are available for installation in the 69-node test feeder.
Figure 9 shows the effect of installing the capacitor banks with the DVSA method on the voltage profile for the 69-bus system. Note that the voltage profiles are improved when compared with the base case. Note that the lowest voltage without compensation is 0.9092 pu and with compensation it is 0.9308 pu; this indicates that the lowest voltage improved by 2.37%.
From Figure 8 we can observe the following: (i) The problem of the optimal location of fixed-step capacitor banks in distribution networks reaches the best solutions when the number of capacitor banks is between two and five since after six the objective function will increase again, as is the case of the 69-node test feeder. This behavior can be attributed to the discrete nature of the decision variables since the minimum size of the capacitors is about 150 kVAr; and (ii) the solutions reported by our proposal for two or more capacitors are better than all the comparison methods.

5.3. Additional Comments

Considering the numerical validations reported in this research, it is worth mentioning the following:
To verify that the proposed DVSA can find the optimal global solution for both test feeders, we implemented an exhaustive search algorithm to evaluate each possible combination of nodes for all possible capacitor sizes by using the successive approximation power flow method embedded in nested loops. After some hours of evaluation, this exhaustive search finds the same solutions reported in Table 3 and Table 4, implying that these solutions are indeed the global optima.
Regarding processing times of the proposed DVSA to select and locate fixed-step capacitor banks in AC distribution networks, it can be noted that after 100 consecutive evaluations in the case of the 33-node test feeder the average processing time is about 1.33 s, and in the case of the 69-node test feeder this time is about 4.01 s. These results demonstrate the low-computational effort required by the proposed approach to achieve the optimal solution.
Note that the proposed DVSA for optimal location and selection of fixed-step capacitor banks in distribution networks are easily extended to multiple periods of analysis (i.e., considering load curves) by adding the sub-index t in all the voltages, angles, and power in the mathematical model (1)–(6) (see optimization model (A1)–(A6) reported in Appendix B) since the optimal location and size of the capacitors is uncoupled in time. This implies that the complication in the implementation is only associated with the number of power flow evaluations required in the slave stage. These implementations will be presented in the next section.

5.4. Optimal Location of Capacitors Considering a Variable Load Curve
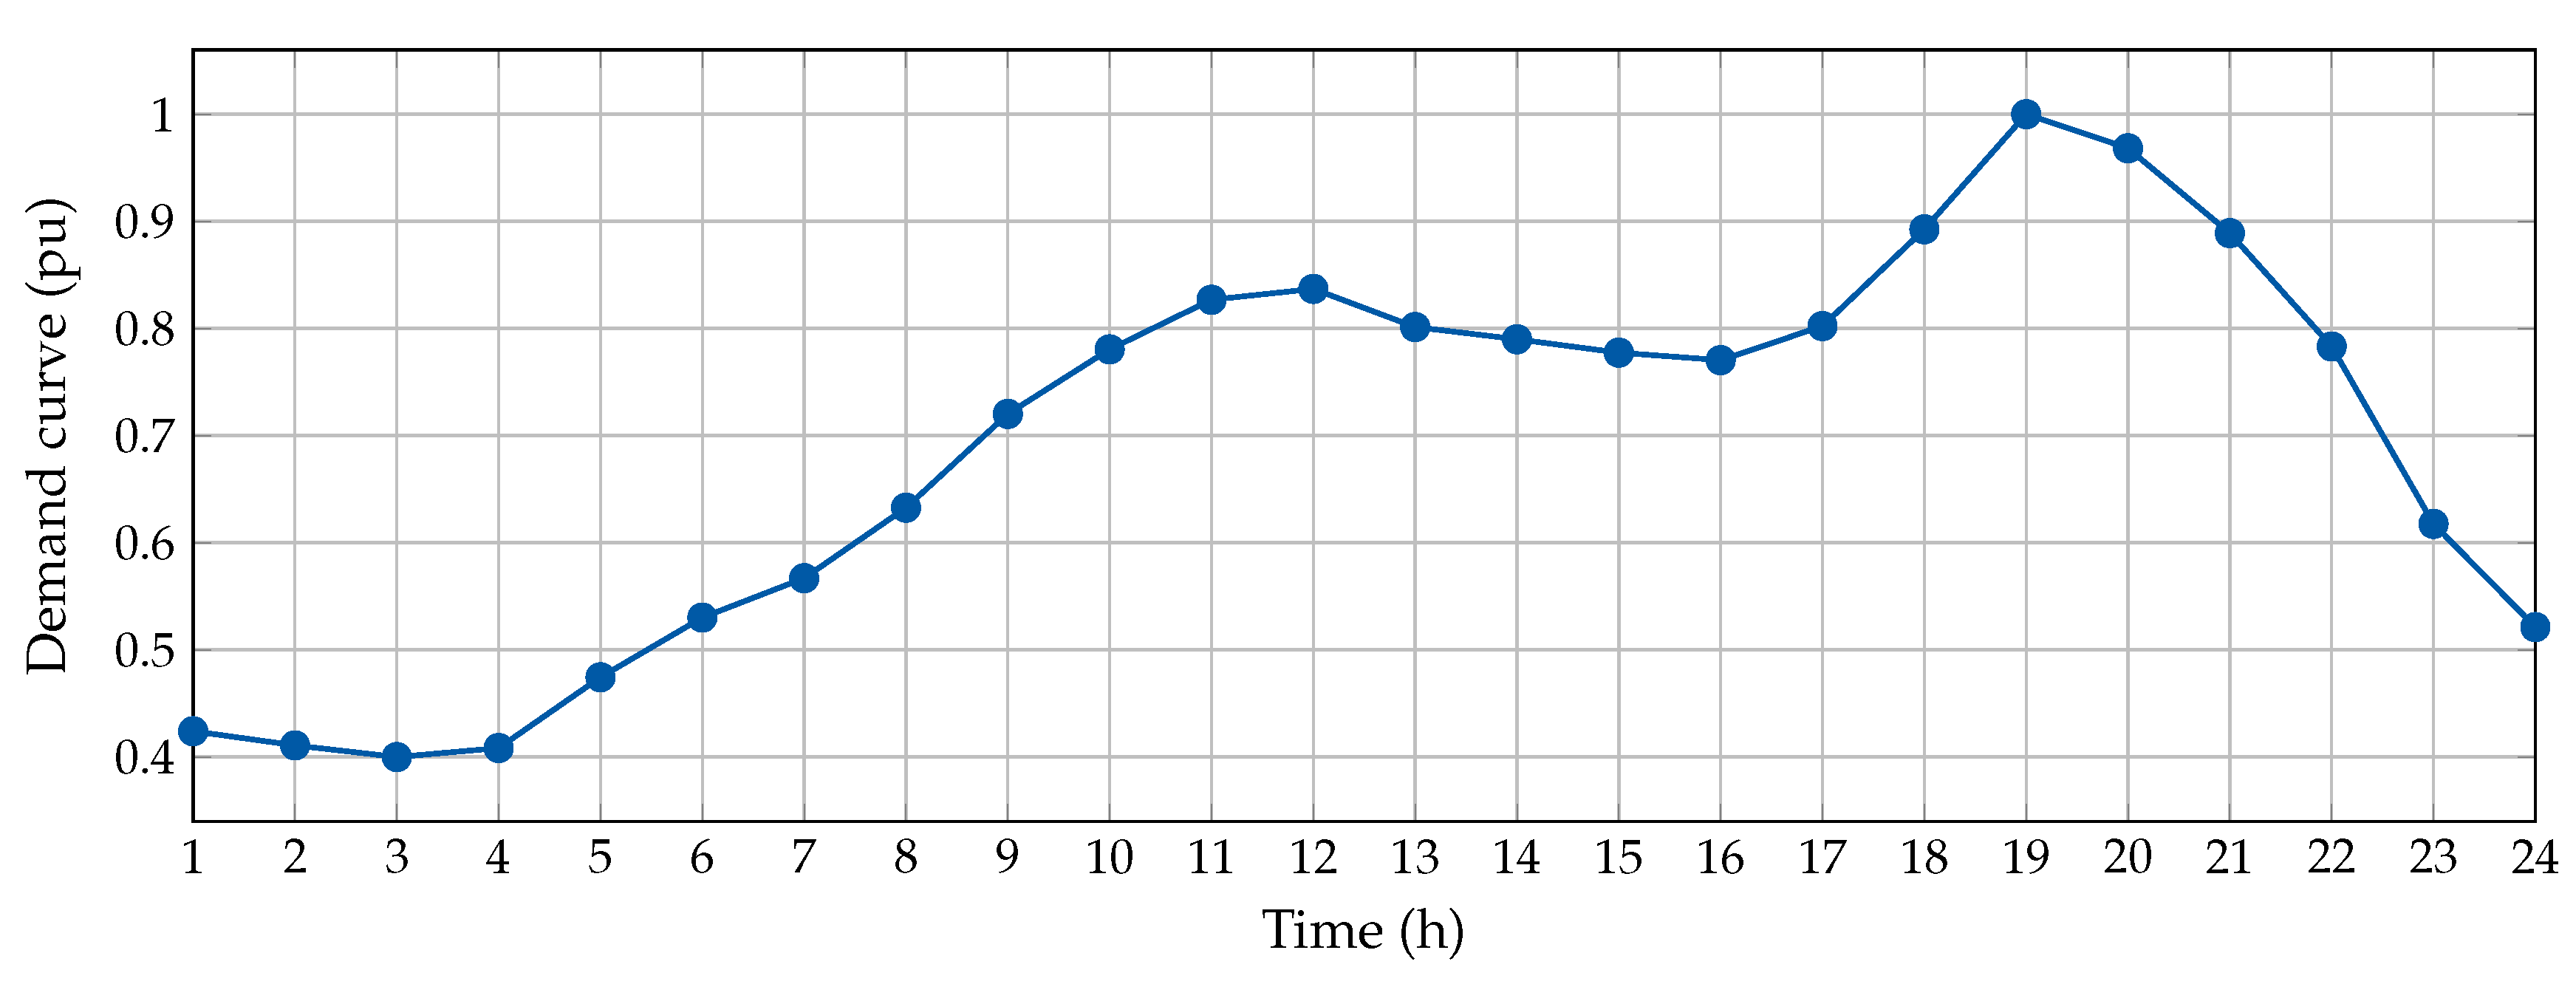
To evaluate the optimization model that defines the optimal selection and location of fixed-step capacitor banks in the AC distribution system more realistically. We reformulated the mathematical model (1)–(6) to include the time-varying dependence as defined in Appendix B (see the mathematical model (A1)–(A6)). To model the daily demand behavior, we consider the typical residential demand curve in the Colombian power system reported in [3]. This demand curve is plotted in Figure 10.
Table 5 presents the numerical results in both test feeders considering the daily load behavior presented in Figure 10.
From results in Table 5, we can observe that:
In the 33-node test feeder, the initial energy losses considering the daily load behavior (see Figure 10) are about 2508.634 kWh/day, which are reduced to 1720.669 kWh/day after the installation of three fixed-step capacitors in nodes 12, 24, and 30 with nominal rates of 300 kVAr, 300 kVAr, and 750 kVAr, respectively. Note that these capacitors reduce the costs of the energy losses by 31.04 % .
The selected nodes in the case of the 33-node test feeder coincide for the cases of peak hour and daily load behavior. However, in the second case, their sizes have been reduced from 450 kVAr to 300 kVAr and from 1050 kVAr to 750 kVAr. It is worth mentioning that the reduction of sizes is an expected result because considering variable load behaviors, the expected reductions regarding power losses minimization are moderated in comparison to the load peak case; i.e., these pass from US $ 12191.17 (peak load case) to US $ 5514.78 (load daily load variation case).
In the case of the 69-node test feeder the initial daily energy losses without capacitors is about 2666.286 kWh/day, which are reduced to 1800.283 kWh/day. This reduction is reached after locating the fixed-step capacitor banks in nodes 11, 21, and 61 with nominal rates of 300 kVAr, 150 kVAr, and 900 kVAr, respectively. Observe that the annual operational costs are reduced by 32.48 % regarding the base case reported in Table 5.
When comparing the location of the capacitor banks for the cases of load peak case and time-varying load behavior, it can be observed that the nodes 11 and 69 remain constant in both scenarios. While the node 18 is changed by the node 21 in the case of variable load behavior. This variation demonstrates that it is advisable for the optimal location of capacitor banks in distribution networks to consider a realistic load scenario instead of just the peak load case, since the solutions in the peak case could not be the same when taking charge variations into account.
Regarding the computational performance of the proposed DVSA to select and locate fixed-step capacitor banks in AC distribution networks, we can mention that; (i) after 100 consecutive evaluations of the proposed approach in the 33-node test feeder, about 78 % of the solutions are the same—reported in Table 5. In the case of the 69-node test feeder, the effectiveness of the proposed approach is about 25 % ; and (ii) the average processing times after the 100 consecutive evaluations are 28.87 s and 152.57 s for the 33- and 69-node test systems, respectively. These results demonstrate the robustness of the proposed optimization method regarding the possibility of finding optimal solutions as well as the low-computational effort required to compute them.

6. Conclusions and Future Works

In this paper, a new DVSA was proposed to address the problem of the optimal selection and location of fixed-step capacitor banks in AC distribution networks. The objective function analyzed focused on minimizing the annual operating costs associated with grid energy losses during the peak hour. Numerical results demonstrated that for both test feeders with three capacitor banks, the annual operating costs were reduced at least 35 % . In addition, the proposed approach had low computational effort since the average processing time for the 33-node test feeder was about 1.30 s, while in the 69-node test feeder, this was about 4.01 s. One of the main characteristics of the proposed DVSA lies in employing a unique codification that permits representing the problem of the optimal location and sizing of fixed-step capacitor banks. This prevents the usage of embedded metaheuristics to solve this problem. An extension to a daily operative behavior considering a Colombian typical load curve was analyzed for both test feeders in order to consider a more realistic case. Simulations in these operative conditions showed that the expected reductions in the annual operative costs are considered minor compared to the peak load case. However, these can be regarded as near to the real operation conditions expected for utilities in physical applications.
After 100 consecutive evaluations, the proposed DVSA achieved the best solutions for the 69-node and 33-node test feeders at 32% and 70% of the times in the case of load peak operation conditions, respectively. For the case of the time-varying load behavior, the best solutions were achieved at 78% and 25% of the times for the 33- and 69-node test feeders. The standard deviation index demonstrated that all the solutions achieved by this approach are similar. Additionally, they improved total power losses and decreased operating costs compared to the other methods. Regarding processing times in the case of the load curve, the proposed DVSA method takes less than 160 s to deal with the optimal solution in both test feeders, which can be considered a highly efficient methodology, since the location of capacitor banks in AC distribution networks are considered a planning problem where days or weeks are required to the physical implementation.
For future work, it will be possible to address the following problems: (i) propose a convex formulation of the optimal power flow problem in AC distribution networks that can be used in a master–slave strategy with a branch and bound method to guarantee the global optimal solution of the problem addressed in this research; (ii) employ the proposed DVSA method to solve the problem of the optimal location and sizing of distributed generators in AC by using a compact codification that takes into account discrete variables regarding nodes and continuous ones associated with the optimal sizing of these generators; and (iii) analyze the proposed methodology including voltage and current harmonics in the test systems.

Author Contributions

Conceptualization, O.D.M., W.G.-G., A.R., and J.C.H.; methodology, O.D.M., W.G.-G., A.R., and J.C.H.; investigation, O.D.M., W.G.-G., A.R., and J.C.H.; writing—review and editing, O.D.M., W.G.-G., A.R., L.F.G.-N. and J.C.H. All authors have read and agreed to the published version of the manuscript.

Funding

This work was partially supported by the National Scholarship Program Doctorates of the Administrative Department of Science, Technology, and Innovation of Colombia (COLCIENCIAS), by calling contest 727-2015.

Conflicts of Interest

The authors declare no conflict of interest.

Appendix A. Electrical Parameters

Table A1 and Table A2 present the electrical parameters of the 33- and 69-node test feeders, respectively.
Table A1. Electrical parameters of the 33-node test feeder.
Node iNode j R ij  [ Ω ] X ij  [ Ω ] P j  [kW] Q j  [kW]Node iNode j R ij  [ Ω ] X ij  [ Ω ] P j  [kW] Q j  [kW]
120.09220.04771006017180.73200.57409040
230.49300.251190402190.16400.15659040
340.36600.18641208019201.50421.35549040
450.38110.1941603020210.40950.47849040
560.81900.7070602021220.70890.93739040
670.18720.61882001003230.45120.30839050
781.71141.235120010023240.89800.7091420200
891.03000.7400602024250.89600.7011420200
9101.04000.740060206260.20300.10346025
10110.19660.0650453026270.28420.14476025
11120.37440.1238603527281.05900.93376020
12131.46801.1550603528290.80420.700612070
13140.54160.71291208029300.50750.2585200600
14150.59100.5260601030310.97440.963015070
15160.74630.5450602031320.31050.3619210100
16171.28901.7210602032330.34100.53026040
Table A2. Electrical parameters of the 69-node test feeder.
Node iNode j R ij  [ Ω ] X ij  [ Ω ] P j  [kW] Q j  [kW]Node iNode j R ij  [ Ω ] X ij  [ Ω ] P j  [kW] Q j  [kW]
120.00050.0012003360.00440.01082618.55
230.00050.00120036370.06400.15652618.55
340.00150.00360037380.10530.123000
450.02510.02940038390.03040.03552417
560.36600.18642.62.239400.00180.00212417
670.38100.194140.43040410.72830.85091.21
780.09220.0470755441420.31000.362300
890.04930.0251302242430.04100.047564.3
9100.81900.2707281943440.00920.011600
10110.18720.061914510444450.10890.137339.2226.3
11120.71140.235114510445460.00090.001239.2226.3
12131.03000.3400854470.00340.008400
13141.04400.345085.547480.08510.20837956.4
14151.05800.34960048490.28980.7091384.7274.5
15160.19660.065045.53049500.08220.2011384.7274.5
16170.37440.123860358510.09280.047340.528.3
17180.00470.0016603551520.33190.11143.62.7
18190.32760.1083009530.17400.08864.353.5
19200.21060.069010.653540.20300.103426.419
20210.34160.11291148154550.28420.14472417.2
21220.01400.004653.555560.28130.143300
22230.15910.05260056571.59000.533700
23240.34600.1145282057580.78370.263000
24250.74880.24750058590.30420.100610072
25260.30890.1021141059600.38610.117200
26270.17320.0572141060610.50750.25851244888
23280.00440.01082618.661620.09740.04963223
28290.06400.15652618.662630.14500.073800
29300.39780.13150063640.71050.3619227162
30310.07020.02320064651.04100.53025942
31320.35100.11600011660.20120.06111813
32330.83900.2816141066670.00470.00141813
33341.70800.564619.51412680.73940.24442820
34351.47400.48736468690.00470.00162820

Appendix B. Time-Varying Optimization Model

To extend the optimization model (1)–(6) in order to consider time-varying load effects, here, we reformulated it, by adding the sub-index t as follows:
min z 1 = i N k C C k year Q k x i , k + C kWh loss t T i N j N Y i j v i , t v j , t cos δ i , t δ j , t θ i j Δ T ,
p i , t g p i , t d = v i , t j N Y i j v j , t cos δ i , t δ j , t θ i j , i N , t T
q i , t g + k C Q k x k , i q i , t d = v i , t j N Y i j v j , t sin δ i , t δ j , t θ i j , i N , t T
k C x k , i 1 , i N
i N k C x k , i = N cap ava ,
v min v i , t v max , i N , t T
Note that in this model Δ t is defined as 365 days and the cardinality of the set T is 24 h. Note that in this model we assume that the hourly curve is practically the same during the whole year since it is based on the Colombian consumption where seasons do not have incidence (i.e., an equatorial country).

References

  1. Poudineh, R.; Peng, D.; Mirnezami, S. Electricity Networks: Technology, Future Role and Economic Incentives for Innovation; Technical Report; The Oxford Institute for Energy Studies: Oxford, UK, 2017. [Google Scholar] [CrossRef]
  2. Lavorato, M.; Franco, J.F.; Rider, M.J.; Romero, R. Imposing Radiality Constraints in Distribution System Optimization Problems. IEEE Trans. Power Syst. 2012, 27, 172–180. [Google Scholar] [CrossRef]
  3. Montoya, O.D.; Gil-González, W. Dynamic active and reactive power compensation in distribution networks with batteries: A day-ahead economic dispatch approach. Comput. Electr. Eng. 2020, 85, 106710. [Google Scholar] [CrossRef]
  4. Sultana, S.; Roy, P.K. Krill herd algorithm for optimal location of distributed generator in radial distribution system. Appl. Soft Comput. 2016, 40, 391–404. [Google Scholar] [CrossRef]
  5. Soltani, S.; Rashidinejad, M.; Abdollahi, A. Stochastic Multiobjective Distribution Systems Phase Balancing Considering Distributed Energy Resources. IEEE Syst. J. 2018, 12, 2866–2877. [Google Scholar] [CrossRef]
  6. Abdelaziz, A.; Ali, E.; Elazim, S.A. Optimal sizing and locations of capacitors in radial distribution systems via flower pollination optimization algorithm and power loss index. Eng. Sci. Technol. Int. J. 2016, 19, 610–618. [Google Scholar] [CrossRef] [Green Version]
  7. Grisales-Noreña, L.; Montoya, O.D.; Gil-González, W. Integration of energy storage systems in AC distribution networks: Optimal location, selecting, and operation approach based on genetic algorithms. J. Energy Storage 2019, 25, 100891. [Google Scholar] [CrossRef]
  8. Verma, H.K.; Singh, P. Optimal Reconfiguration of Distribution Network Using Modified Culture Algorithm. J. Inst. Eng. India Ser. B 2018, 99, 613–622. [Google Scholar] [CrossRef]
  9. Grisales-Noreña, L.; Montoya, O.D.; Ramos-Paja, C.A. An energy management system for optimal operation of BSS in DC distributed generation environments based on a parallel PSO algorithm. J. Energy Storage 2020, 29, 101488. [Google Scholar] [CrossRef]
  10. Ghosh, A.; Ledwich, G. Series Compensation of Power Distribution System. In Power Quality Enhancement Using Custom Power Devices; Springer: Boston, MA, USA, 2002; pp. 333–377. [Google Scholar] [CrossRef]
  11. Abdelaziz, A.; Mohamed, F.; Mekhamer, S.; Badr, M. Distribution system reconfiguration using a modified Tabu Search algorithm. Electr. Power Syst. Res. 2010, 80, 943–953. [Google Scholar] [CrossRef]
  12. Khodr, H.; Olsina, F.; De Oliveira-De Jesus, P.; Yusta, J. Maximum savings approach for location and sizing of capacitors in distribution systems. Electr. Power Syst. Res. 2008, 78, 1192–1203. [Google Scholar] [CrossRef] [Green Version]
  13. Nojavan, S.; Jalali, M.; Zare, K. Optimal allocation of capacitors in radial/mesh distribution systems using mixed integer nonlinear programming approach. Electr. Power Syst. Res. 2014, 107, 119–124. [Google Scholar] [CrossRef]
  14. Ramadan, H.A.; Wahab, M.A.; El-Sayed, A.H.M.; Hamada, M.M. A fuzzy-based approach for optimal allocation and sizing of capacitor banks. Electr. Power Syst. Res. 2014, 106, 232–240. [Google Scholar] [CrossRef]
  15. Elsheikh, A.; Helmy, Y.; Abouelseoud, Y.; Elsherif, A. Optimal capacitor placement and sizing in radial electric power systems. Alex. Eng. J. 2014, 53, 809–816. [Google Scholar] [CrossRef] [Green Version]
  16. Devabalaji, K.R.; Ravi, K.; Kothari, D. Optimal location and sizing of capacitor placement in radial distribution system using bacterial foraging optimization algorithm. Int. J. Electr. Power Energy Syst. 2015, 71, 383–390. [Google Scholar] [CrossRef]
  17. Shuaib, Y.M.; Kalavathi, M.S.; Rajan, C.C.A. Optimal capacitor placement in radial distribution system using Gravitational Search Algorithm. Int. J. Electr. Power Energy Syst. 2015, 64, 384–397. [Google Scholar] [CrossRef]
  18. Lee, C.S.; Ayala, H.V.H.; dos Santos Coelho, L. Capacitor placement of distribution systems using particle swarm optimization approaches. Int. J. Electr. Power Energy Syst. 2015, 64, 839–851. [Google Scholar] [CrossRef]
  19. Ali, E.; Abd Elazim, S.; Abdelaziz, A. Improved Harmony Algorithm for optimal locations and sizing of capacitors in radial distribution systems. Int. J. Electr. Power Energy Syst. 2016, 79, 275–284. [Google Scholar] [CrossRef]
  20. Abul’Wafa, A.R. Optimal capacitor allocation in radial distribution systems for loss reduction: A two stage method. Electr. Power Syst. Res. 2013, 95, 168–174. [Google Scholar] [CrossRef]
  21. Abul’Wafa, A.R. Optimal capacitor placement for enhancing voltage stability in distribution systems using analytical algorithm and Fuzzy-Real Coded GA. Int. J. Electr. Power Energy Syst. 2014, 55, 246–252. [Google Scholar] [CrossRef]
  22. Tamilselvan, V.; Jayabarathi, T.; Raghunathan, T.; Yang, X.S. Optimal capacitor placement in radial distribution systems using flower pollination algorithm. Alex. Eng. J. 2018, 57, 2775–2786. [Google Scholar] [CrossRef]
  23. Sultana, S.; Roy, P.K. Optimal capacitor placement in radial distribution systems using teaching learning based optimization. Int. J. Electr. Power Energy Syst. 2014, 54, 387–398. [Google Scholar] [CrossRef]
  24. Asl, T.S.; Jamali, S. Optimal capacitor placement size and location of shunt capacitor for reduction of losses on distribution feeders. In Proceedings of the 2009 International Conference on Clean Electrical Power, Capri, Italy, 9–11 June 2009; pp. 223–226. [Google Scholar]
  25. Guimarães, M.A.; Castro, C.A. An efficient method for distribution systems reconfiguration and capacitor placement using a Chu-Beasley based genetic algorithm. In Proceedings of the 2011 IEEE Trondheim PowerTech, Trondheim, Norway, 19–23 June 2011; pp. 1–7. [Google Scholar]
  26. Rao, R.S.; Narasimham, S.; Ramalingaraju, M. Optimal capacitor placement in a radial distribution system using plant growth simulation algorithm. Int. J. Electr. Power Energy Syst. 2011, 33, 1133–1139. [Google Scholar] [CrossRef] [Green Version]
  27. Raju, M.R.; Murthy, K.R.; Ravindra, K. Direct search algorithm for capacitive compensation in radial distribution systems. Int. J. Electr. Power Energy Syst. 2012, 42, 24–30. [Google Scholar] [CrossRef]
  28. Das, P.; Banerjee, S. Placement of capacitor in a radial distribution system using loss sensitivity factor and cuckoo search algorithm. Int. J. Sci. Res. Manag. 2013, 2, 751–757. [Google Scholar]
  29. Das, P.; Banerjee, S. Optimal Sizing And Placement Of Capacitor In A Radial Distribution System Using Loss Sensitivity Factor And Firefly Algorithm. Int. J. Eng. Comput. Sci. 2014, 3, 5346–5352. [Google Scholar]
  30. El-Fergany, A.A.; Abdelaziz, A.Y. Capacitor placement for net saving maximization and system stability enhancement in distribution networks using artificial bee colony-based approach. Int. Jo. Electr. Power Energy Syst. 2014, 54, 235–243. [Google Scholar] [CrossRef]
  31. Aydin, O.; Tezcan, S.; Eke, I.; Taplamacioglu, M. Solving the Optimal Power Flow Quadratic Cost Functions using Vortex Search Algorithm. IFAC-PapersOnLine 2017, 50, 239–244. [Google Scholar] [CrossRef]
  32. Montoya, O.D.; Grisales-Noreña, L.F.; Amin, W.T.; Rojas, L.A.; Campillo, J. Vortex Search Algorithm for Optimal Sizing of Distributed Generators in AC Distribution Networks with Radial Topology. Commun. Comput. Inf. Sci. 2019, 1052, 235–249. [Google Scholar]
  33. Montoya, O.D.; Gil-González, W.; Grisales-Noreña, L.F. Vortex Search Algorithm for Optimal Power Flow Analysis in DC Resistive Networks with CPLs. IEEE Trans. Circuits Syst. II 2019, 67, 1439–1443. [Google Scholar] [CrossRef]
  34. Dogan, B.; Olmez, T. Vortex search algorithm for the analog active filter component selection problem. AEU Int. J. Electr. Commun. 2015, 69, 1243–1253. [Google Scholar] [CrossRef]
  35. Dogan, B. A Modified Vortex Search Algorithm for Numerical Function Optimization. Int. J. Artif. Intell. Appl. 2016, 7, 37–54. [Google Scholar] [CrossRef]
  36. Razavi, S.F.; Sajedi, H. SVSA: A Semi-Vortex Search Algorithm for solving optimization problems. Int. J. Data Sci. Anal. 2018, 8, 15–32. [Google Scholar] [CrossRef]
  37. Li, P.; Zhao, Y. A quantum-inspired vortex search algorithm with application to function optimization. Nat. Comput. 2018, 18, 647–674. [Google Scholar] [CrossRef]
  38. Qyyum, M.A.; Yasin, M.; Nawaz, A.; He, T.; Ali, W.; Haider, J.; Qadeer, K.; Nizami, A.S.; Moustakas, K.; Lee, M. Single-Solution-Based Vortex Search Strategy for Optimal Design of Offshore and Onshore Natural Gas Liquefaction Processes. Energies 2020, 13, 1732. [Google Scholar] [CrossRef] [Green Version]
  39. Toz, M. Chaos-based Vortex Search algorithm for solving inverse kinematics problem of serial robot manipulators with offset wrist. Appl. Soft Comput. 2020, 89, 106074. [Google Scholar] [CrossRef]
  40. Montoya, O.D.; Gil-González, W. On the numerical analysis based on successive approximations for power flow problems in AC distribution systems. Electr. Power Syst. Res. 2020, 187, 106454. [Google Scholar] [CrossRef]
  41. Ozkıs, A.; Babalık, A. A novel metaheuristic for multi-objective optimization problems: The multi-objective vortex search algorithm. Inf. Sci. 2017, 402, 124–148. [Google Scholar] [CrossRef]
  42. Grisales-Noreña, L.F.; Gonzalez-Montoya, D.; Ramos-Paja, C.A. Optimal Sizing and Location of Distributed Generators Based on PBIL and PSO Techniques. Energies 2018, 11, 1018. [Google Scholar] [CrossRef] [Green Version]
  43. Garces, A. A Linear Three-Phase Load Flow for Power Distribution Systems. IEEE Trans. Power Syst. 2016, 31, 827–828. [Google Scholar] [CrossRef]
  44. Shen, T.; Li, Y.; Xiang, J. A Graph-Based Power Flow Method for Balanced Distribution Systems. Energies 2018, 11, 511. [Google Scholar] [CrossRef] [Green Version]
Figure 1. Flowchart of the successive approximation power flow method used in the slave stage of the proposed discrete version of the vortex search algorithm (DVSA).
Energies 13 04914 g001
Figure 2. Electrical configuration of the 33-node test system.
Energies 13 04914 g002
Figure 3. Electrical configuration of the 69-node test system.
Energies 13 04914 g003
Figure 4. Percentage of energy-saving costs after locating capacitor banks in the 33-node test feeder.
Energies 13 04914 g004
Figure 5. The impact of compensated devices on the voltage profile for the 33-node test feeder.
Energies 13 04914 g005
Figure 6. Impact of the number of capacitor banks in the final operation costs.
Energies 13 04914 g006
Figure 7. Percentage of energy saving costs after locating capacitor banks in the 69-node test feeder.
Energies 13 04914 g007
Figure 8. Impact of the number of capacitor banks in the final operation costs.
Energies 13 04914 g008
Figure 9. The impact of compensated devices on the voltage profile for the 69-node test feeder.
Energies 13 04914 g009
Figure 10. Typical demand load curve in residential networks in Colombia [3].
Energies 13 04914 g010
Table 1. Capacitor banks’ information.
k123
Q k [kVAr]150300450
C k year [$/kVAr-year]0.5000.3500.253
k456
Q k [kVAr]600750900
C k year [$/kVAr-year]0.2200.2760.183
k789
Q k [kVAr]105012001350
C k year [$/kVAr-year]0.2280.1700.207
k101112
Q k [kVAr]150016501800
C k year [$/kVAr-year]0.2010.1930.870
k1314
Q k [kVAr]19502100
C k year [$/kVAr-year]0.2110.176
Table 2. Parameters for implementing the proposed DVSA algorithm.
Discrete Vortex search algorithm
Population size10
Number of iterations1000
Population generationGaussian Distribution
Successive approximation power flow
Number of iterations1000
Tolerance 1 × 10 10
Experimental tests per system
Number of evaluations100
Table 3. Optimal location of capacitor banks in the 33-node test feeder.
MethodNodesSize [kVAr]Total Losses [kW]Costs [US$]
Base case210.98735445.91
GSA [17] 9 , 29 , 30 450 , 800 , 900 171.78029,358.39
TSM [20] 7 , 29 , 30 850 , 25 , 900 144.04024,705.87
FRCGA [21] 28 , 6 , 29 , 8 , 30 , 9 25 , 475 , 300 , 175 , 400 , 350 141.24024,221.18
FPA [22] 30 , 13 , 24 900 , 450 , 450 139.07523,757.00
DVSA 24 , 12 , 30 450 , 450 , 1050 138.41623,254.74
Table 4. Optimal location of capacitor banks in the 69-node test feeder.
MethodNodesSize [kVAr]Losses [kW]Costs [US$]
Base case225.07237800.00
GSA [17] 11 , 29 , 60 900 , 1050 , 450 163.28027,431.04
TSM [20] 19 , 62 , 63 225 , 900 , 225 148.91025,016.88
TBLO [23] 12 , 61 , 64 600 1050 , 150 146.35025,033.20
FPA [22] 11 , 61 , 22 450 , 1350 , 150 , 145.86024,972.78
DVSA 11 , 18 , 61 300 , 300 , 1200 145.39724,427.65
Table 5. Optimal location of capacitor banks in the 33- and 69-node test feeders considering daily load variations.
MethodNodesSize [kVAr]Energy Losses [kWh/day]Costs [US$]
33-node test feeder
Base case2508.63417,560.44
DVSA 12 , 24 , 30 300 , 300 , 750 1720.66912,045.66
69-node test feeder
Base case2666.28618,664.00
DVSA 11 , 21 , 61 300 , 150 , 900 1800.28312,652.24

