Article

Water-Induced Corrosion Damage of Carbon Steel in Sulfolane

1
Institute of Materials Engineering, University of Silesia in Katowice, 75 Pułku Piechoty 1A, 41-500 Chorzów, Poland
2
Institute of Chemistry, University of Silesia in Katowice, Szkolna 9, 40-007 Katowice, Poland
*
Authors to whom correspondence should be addressed.
Energies 2020, 13(17), 4580; https://doi.org/10.3390/en13174580
Submission received: 4 August 2020 / Revised: 27 August 2020 / Accepted: 2 September 2020 / Published: 3 September 2020

Abstract

:
Sulfolane in contact with water and oxygen forms acidic (by-) products that are major factors in accelerating the corrosion of carbon/stainless steel. In consequence, water-induced corrosion damage can be a serious problem in industrial systems. Hence, the determination of the corrosion resistance of AISI 1010 steel immersed in sulfolane containing 0 to 6 vol.% water was the principal objective of the study. Evaluation of the corrosion resistance of steel electrodes was performed using a potentiodynamic technique and scanning Kelvin probe microscopy. It was observed that the corrosion products layer that formed on the surface of AISI 1010 steel partially protects it against corrosion in sulfolane with a water concentration in the range from 1 vol.% to 4 vol.%. Interestingly, amounts of water above 4 vol.% cause a break-down of the corrosion products layer and deteriorate the corrosion resistance of AISI 1010 steel as well. Moreover, the relationship between the fractal dimension, corrosion degree of the steel surface and water concentration in sulfolane was investigated. The fractal dimension was determined using 2D grayscale images of AISI 1010 steel registered through a scanning electron microscope. It was noticed that both the fractal dimension and the corrosion degree rose with the increased water concentration in sulfolane.

1. Introduction

A wide range of anthropogenic as well as biogenic-based chemicals, including volatile organic and/or inorganic compounds (VOCs/VICs), compose a diverse suite of potential environmental pollutants [1]. In particular, the surface and/or groundwater defilements caused by industrially engineered sulfur-containing micropollutants, sometimes termed as emerging contaminants (ECs), are regarded as some of the most pressing ecological fears worldwide [2,3]. In order to mitigate the burden on Nature, the development and/or optimization of cost-effective, large-scale manufacturing procedures for the reduction of sulfur-based compounds (RSCs) are highly desirable and challenging issues since their recalcitrance correlates to persistence [4]. On the whole, liquid/liquid or liquid extraction processes can be employed to purify the unprocessed natural or industrial off-gases, respectively [5].
An interesting substitute to widely employed extractive liquids in the petroleum refining or softening (sweetening) of sour gases is 2,3,4,5-tetrahydrothiophene-1,1-dioxide, customarily named sulfolane (C4H8O2S) [6]. Due to its high selectivity for aromatic hydrocarbons, sulfolane (SFL) is extensively applied in the dearomatization of hydrocarbon-based mixtures, for instance, jet or diesel fuel [7]. Regrettably, the extensive manufacturing and multitude of industrial SFL applications have caused problems with liquid storage security, resulting in some unintentional spills of pure solvents from extraction units in refineries/gas plants or accidental releases of sulfolane-containing wastes [8]. Due to its high aqueous solubility, SFL is prone to long-distance off-site migration in aquifers from the spot of leakage/release to drinking water wells, affecting the ecosystem as well as exacerbating water sensory characteristics [9]. In consequence, the environmental/biological fate of sulfolane-based liquids is being extensively monitored due to the confined ADMETox (absorption, distribution, metabolism, excretion, toxicity) data related to the long-term exposure of living organisms to SFL-contaminated aqueous mixtures [10]. Obviously, the key question about the eco-friendly and operationally efficient physicochemical and/or biological procedures for in situ or ex situ treatment of SFL-rich groundwater confronts engineers/chemists worldwide. In order to physically remove sulfolane from polluted groundwater, granular and/or biologically activated carbon (G/BAC) can be implemented as popular ex situ adsorbents [11]. Moreover, the advanced ex/in situ chemical oxidation-type processes (AOPs) were effectively employed in the purification of SFL-contaminated sites using the highly reactive potential of species such as SO4•− and OH radicals generated from hydrogen peroxide (H2O2) and persulfate (S2O8) or peroxymonosulfate (HS2O5) precursors, respectively [12]. In fact, the background solutes/co-pollutants (e.g., bicarbonate, carbonate, chloride, benzene) competitively diminish the ability of non-selective radical-based AOPs to decompose sulfolane-contaminated mixtures; potent oxidants can oxidize a range of recalcitrant organic compounds at one time [13]. Compared to hydroxyl radicals (OH), sulfate (SO4•−)-based radicals are getting more popular due to their higher redox potential (2.5–3.1V) [14]. The impact of experimental parameters (e.g., water/soil ratio, number of extraction cycles, shaking time) on sulfolane treatability in aqueous media, including synthetic (model) water and real SFL-polluted groundwater samples, was investigated using several oxidative techniques separately or in tandem (e.g., photocatalysis and photolysis) with UV/H2O2, UV/O3, alkaline ozonation and neutral Fenton reagents combined with pH, chemical concentration of H2O2 and ethylenediaminetetraacetic acid chelated iron (FeEDTA), O3 flow rate and ultraviolet-C light controlling, respectively [15]. Interestingly, a synergic effect was recorded when the combination of two UV-related oxidants (UVC/H2O2/O3) proved to be much more efficient in the treatment of an SFL-rich aqueous medium [16,17].
Following the popular principle of green chemistry and eco-toxicology, much attention is being currently paid to the degradation of sulfolane by biological processes. In particular, the employment of active hunters from the indigenous microbial communities shed new light on the functional capabilities of the biodegraders in SFL removal from groundwater [12]. Unfortunately, the exact pathway of sulfolane biotransformation has not been fully elucidated yet. It seems that SFL biodegradation undergoes according to various biochemical tracks depending on the biogeographic and/or biogeochemical variances within the microbial communities employed [18]. Specifically, the 4S-desulfurization mechanism of SFL was proposed due to its structural relatedness to dibenziothiophene, resulting in the ring opening stage, subsequent sulfate (HSO3) generation and final substrate mineralization with CO2, H2O and SO4 production, respectively [19]. Moreover, the stimulatory potential of mineral nutrients (C/N/P ratio), temperature, dissolved oxygen (DO) level and composition of microbial consortia were scrutinized profoundly as factors limiting sulfolane biodegradation. Since hydrocarbon pollutants (mainly jet and diesel fuel) co-exist with sulfolane, the influence of hydrocarbons (primarily aliphatic) of intermediate length (C10–C25) on the bacterial bioremediation capabilities (as the source of carbon) was investigated, revealing that hydrocarbon co-contamination retards the SFL biodegradation–toxic impact of petroleum on SFL-degrading microorganisms [18,20].
In order to limit/optimize the operating time and to increase the removal efficiency of SFL from an aqueous medium, integrated scenarios combining biological transformation with advanced oxidation processes (Bio-AOPs) have been proposed recently [14]. The integration of AOPs at the pre-and/or post-processing stage of wastewater treatment using a conventional biological approach enabled to reduce the operational costs of chemicals as well as to eliminate the toxic (by-)products of incomplete SFL mineralization in the biological units or remaining recalcitrant micropollutants (e.g., pharmaceuticals, pesticides). A dual Bio-AOPs performance revealed that the oxidation of pollutants and disinfection of microbes occur concurrently. It seems that a sequential combination of chemical oxidation with biotransformation is an appealing alternative for sulfolane-rich wastewater treatment since two heads are better than one.
Regarding the operational costs and limitations of SFL-containing soil/water chemical and/or biological remediation, a key question should be raised about the reasons for unintentional sulfolane leakages into the ecosystem as the extractive liquid is industrially used and regenerated in the closed loop [21]. Moreover, under standard operating conditions, pure SFL is regarded to be non-aggressive to steel, however, small quantities of oxidizing agents (e.g., chlorates, nitrates, peroxides), oxygen or water can induce corrosion processes with the formation of aggressive (by)-products, for instance, SO2 that is subsequently oxidized to H2SO3 [22].
C 4 H 8 O 2 S + O 2 + H 2 O H 2 S O 3 + C 3 H 7 C O 2 H
In industrial applications, approximately 1–3 vol.% of water is routinely added to pure SFL in order to support liquid storage operations as well as transfer between plants. In consequence, both localized and general corrosion can be accelerated due to higher SFL-based liquid conductance and easier ion transfer between electrochemical cells. Moreover, the SFL corrosive potential may be escalated in the presence of water and halide impurities (mostly chlorides). On the whole, some basic correlations between oxygen/chloride and water concentrations have been observed during SFL decomposition and subsequent generation of acidic corrodents [23,24]. In fact, our previous findings suggest that the AISI 1010 steel electrode immersed in sulfolane at 95 °C is characterized by the most uniform surface among all the investigated electrodes [25,26].
In this context, the quantitative evaluation of factors (individual impurities or operational variables) ruling the SFL-induced corrosion of carbon and alloyed steels seems valid. Due to its availability, constructability and manufacturing costs, AISI 1010 steel is widely used in the petroleum and gas industry; however, the aggressive nature of the produced fluids and gases confines the practical durability of industrial installations.
The principal objective of the presented study was to analyze the impact of water concentration in sulfolane on the electrochemical corrosion of AISI 1010 steel. In an attempt to estimate the maximum corrosion degree of the investigated steel samples in SFL-contaminated aqueous mixtures, and at the same time not to allow water to evaporate from the solution, the working temperature of 95 °C was chosen. The corrosion mechanism and corrosion rate were studied using a potentiodynamic technique and scanning Kelvin probe microscopy (SKP). In order to quantify the corrosion damage of the material surface, fractal analysis was performed using images registered by a scanning electron microscope (SEM).

2. Materials and Methods

2.1. Electrochemical Analysis

The test material was a rectangular plate (89 × 20 × 2 mm3) made of AISI 1010 low-carbon steel containing 0.08–0.13 wt.% C, 0.3–0.6 wt.% Mn, ≤0.05 wt.% S, ≤0.04 wt.% P and Fe as the remainder. Steel electrodes were degreased in acetone before placing them in a home-made reactor vessel with a volume of 500 cm3. The detailed description of the test vessel used can be found elsewhere [24,25,26]. The vessel was filled with sulfolane (chemically pure ≥99%, ≤0.2 vol.% of H2O) and subsequently water was added (from 1 to 6 vol.%). In order to simulate the flowing conditions, the sulfolane solution was stirred with the velocity of ca. 1000 rpm using a PTFE magnetic stirrer 1-cm long. The corrosion test of steel electrodes in sulfolane solution lasted 96 h at a temperature of 95 °C. For protection against air, the corrosion test was conducted under inert atmosphere (99.995%, Ar). After 96 h of immersion, electrochemical properties of steel electrodes were tested using the PARSTAT 2273 system (Princeton Applied Research, Oak Ridge, TN, USA). Electrochemical tests were carried out on two steel electrodes for each water concentration. Working, counter and reference electrodes were AISI 1010 steel (8 cm2), platinum plate (100 cm2) and a saturated calomel electrode (SCE), respectively. Ohmic drop ΔE = jRS (V) was estimated using the measured current density (j) and sulfolane resistance (RS = 0.57 MΩ·cm2) [25,26]. The open-circuit potential (OCP) was registered for 60 min. Potentiodynamic polarization curves j = f(E) (E is the electrode potential) were recorded using the linear sweep voltammetry technique with the potential sweep rate of v = 10 mV·min−1, and the potential range was ±150 mVSCE versus OCP. Electrochemical parameters determining the corrosion resistance of the steel were specified by j = f(E) curve fitting with the Butler–Volmer Equation [27]:
j = j corr ( e ( ln 10 ( E E corr ) β a ) e ( ln 10 ( E E corr ) β c ) ) ,
where jcorr is the corrosion current density, Ecorr is the corrosion potential and βa and βc are the anodic and cathodic Tafel slopes. Once the values of βa, βc and jcorr are known, the Stern–Geary coefficient (B = βaβc/(ln10(βa + βc))) and polarization resistance (Rp = B/jcorr) can be determined as well. Moreover, the corrosion rate (CR) can be calculated as follows [27]:
C R = k E W ρ j corr ,
where ρ is the material density (ρAISI 1010 = 7.86 g·cm−3), EW is the material equivalent weight (EWAISI 1010 = 27.923) and k is a coefficient, which determines the unit of corrosion rate (for jcorr expressed in μA·cm−2 and k = 3.27 × 10⁻³ mm·g·µA1·cm−1·year−1, CR is in mm·year−1). Noise associated with dependencies j = f(E) caused by a low value of sulfolane conductivity (ca. 0.35 μS·cm−1 at 25 °C [25]) was removed using the Savitzky–Golay smoothing algorithm [28] and OriginPro 2018 software (OriginLab, Northampton, MA, USA), respectively.

2.2. Surface Analysis

In order to determine the surface damage of AISI 1010 steel electrodes caused by a corrosion process in sulfolane containing up to 6 vol.% of water, the scanning electron microscope JEOL JSM-6480 (JEOL Ltd., Tokyo, Japan) was applied. The obtained grayscale images were stored as 960 × 960 matrices with the integer values ranging from 0 to 255 (8-bit images). The specific distribution of the matrix values represents the surface damage of the investigated steel. The quantitative analysis of the corroded surface using 2D images is usually based on the determination of the so-called corrosion degree, i.e., quotient of the corroded area to the total area of the image. Unfortunately, in some cases it is difficult to define the boundary of corrosion pits; this is regarded as a drawback of the method. On the other hand, the surface fractal dimension (DB) can be used to evaluate the damage of the material, as reported previously [29,30,31,32,33,34]. To specify the fractal dimension of objects in registered SEM images, the differential box-counting method was applied. Generally, in this method, the image is divided into pseudo-3D volumes (Vε) having a square base with the side length 1/ε (ε is the scale) and the height determined as the variance between the maximum and minimum pixel intensity for all pixels within the space (1/ε)2. Then, one can calculate DB using the slope of log(Vε) vs. log(ε) dependence and equation DB = 3 – (slope/2) [35,36]. In this work, DB calculation was carried out using the ImageJ 1.52p/FracLac 2.0f software (National Institutes of Health, Bethesda, MD, USA).
Using the scanning electrochemical workstation PAR M370 (Princeton Applied Research, Oak Ridge, USA) equipped with a tungsten Kelvin probe (KP, ø500 μm, Princeton Applied Research, Oak Ridge, USA), contact potential difference (CPD) maps were registered. More details on the principles of SKP measurement can be found elsewhere [37]. The scanning area was 16 mm2 (a square with a side length of 4 mm) and the distance between the sample and the probe was c.a. 100 μm. Resulting CPD maps were converted to matrices of the form CPDm,n = CPD(xm, yn), where xm = mΔx, yn = nΔy, m = 1, 2…, M, n = 1, 2…, N and Δx and Δy are the map resolutions in the x and the y direction, respectively. The quantitative analysis of CPD distribution involves the analysis of local CPD magnitude in relation to an arbitrary level that is the arithmetic average over all the CPD values on the map (CPDav). Moreover, the root mean square deviation (CPDrms), skewness (CPDsk) and kurtosis (CPDku) were determined using the following formulas [38,39,40,41]:
μ k = 1 M N n = 1 N m = 1 M ( C P D m , n C P D av ) k ,
C P D rms = ( μ 2 ) 1 2 ,
C P D sk = μ 3   ( C P D rms ) 3 ,
C P D ku = μ 4 ( C P D rms ) 4 3 ,
where μk is called the k-th central moment and k = 2, 3 and 4. Skewness and kurtosis describe the shape of the contact potential difference distribution being useful for indicating the presence of surface heterogeneities. Skewness describes the degree of symmetry of the CPD distribution about the average value. The sign of CPDsk indicates the predominance of CPD peaks (CPDsk > 0) or valleys (CPDsk < 0), while kurtosis specifies the presence of extremely high peaks/deep valleys (CPDku > 0), respectively. Surfaces with a texture, i.e., those for which one can distinguish the privileged direction, will tend to have CPDku < 0.

3. Results and Discussion

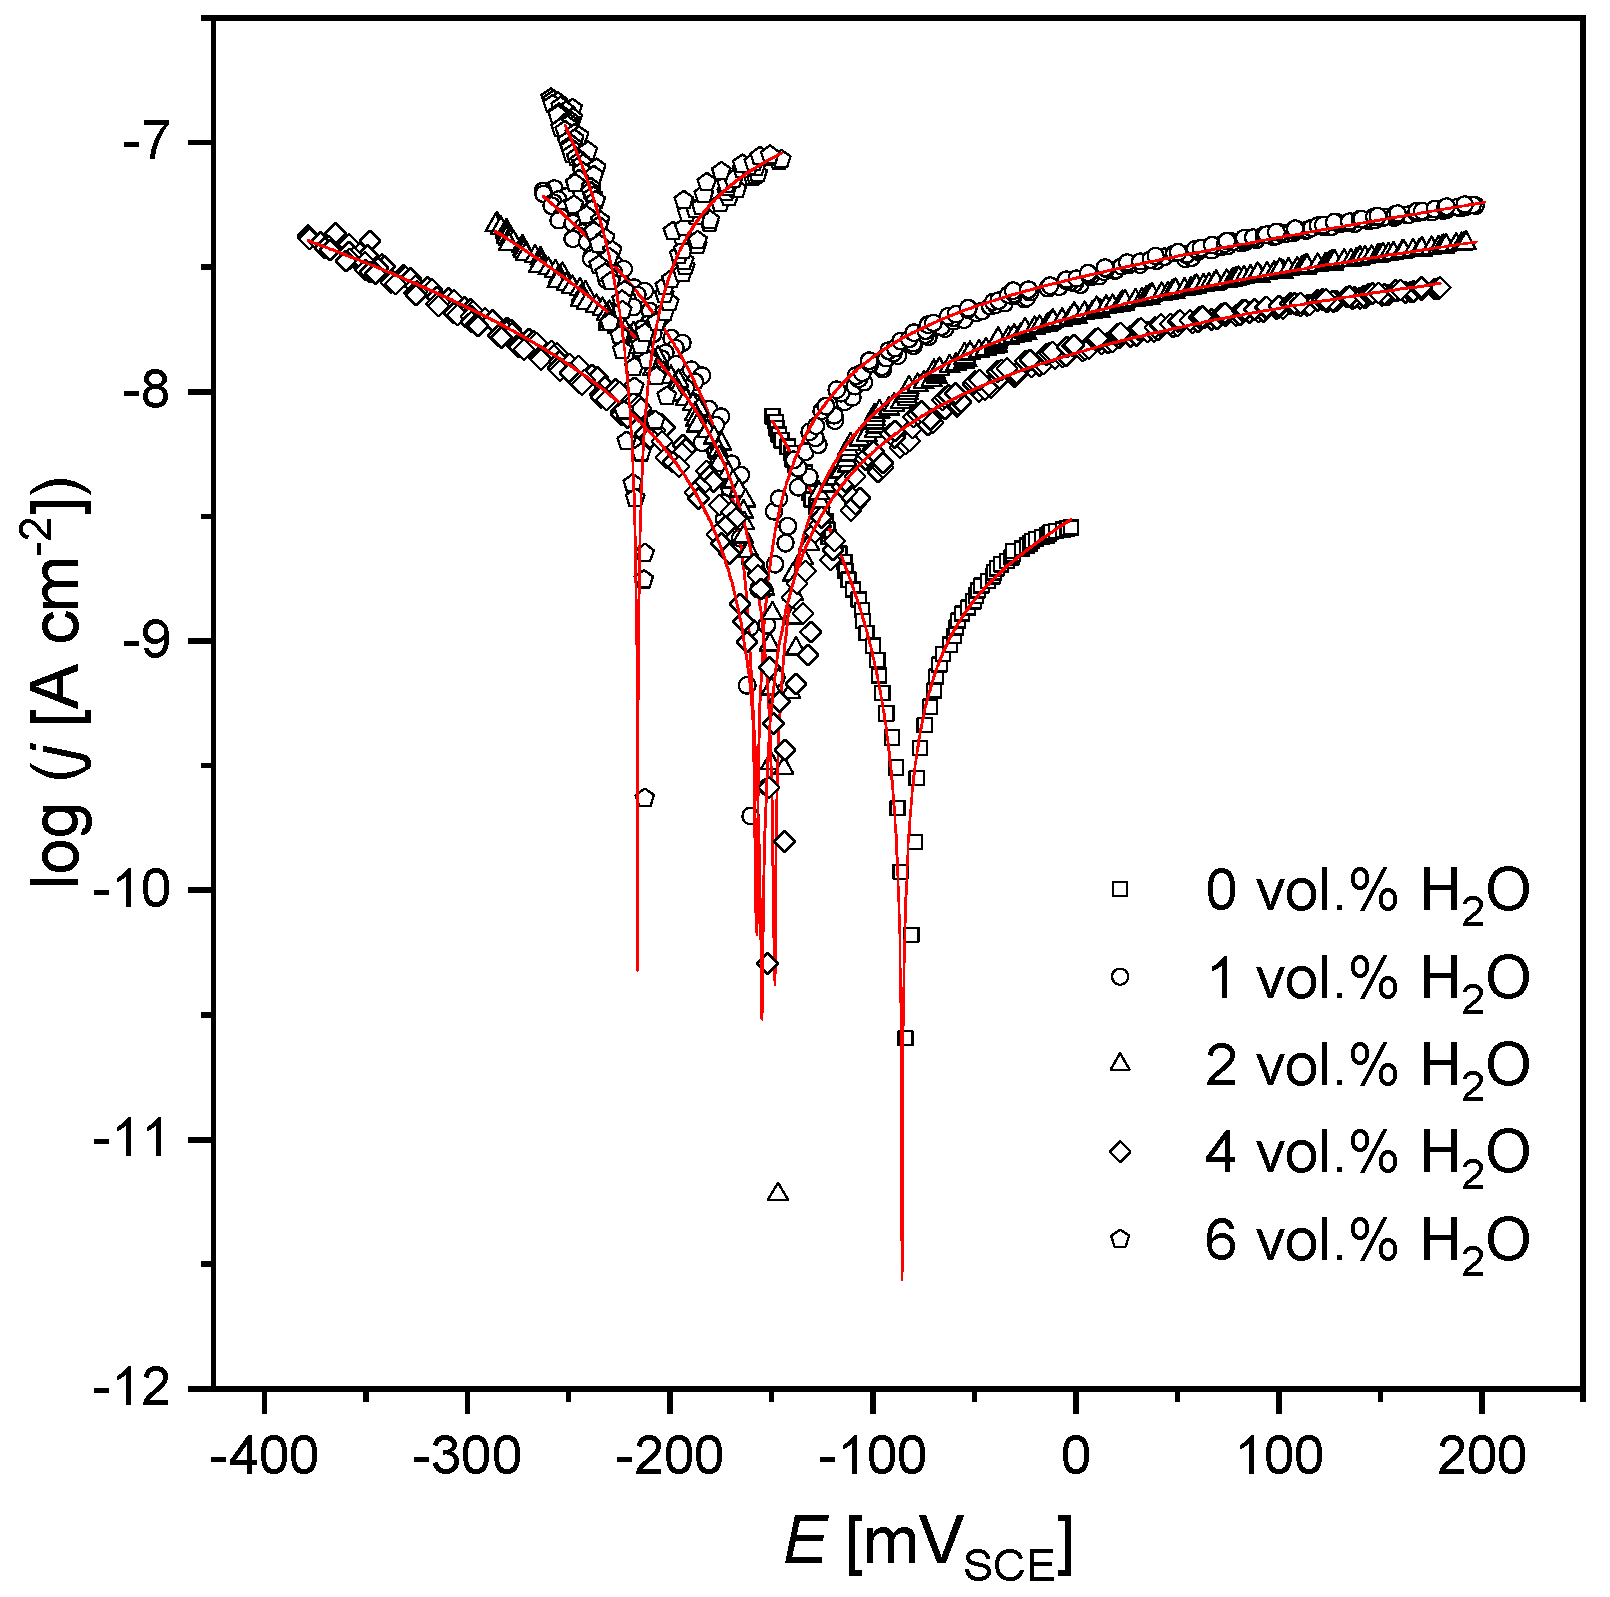
3.1. Corrosion Resistance
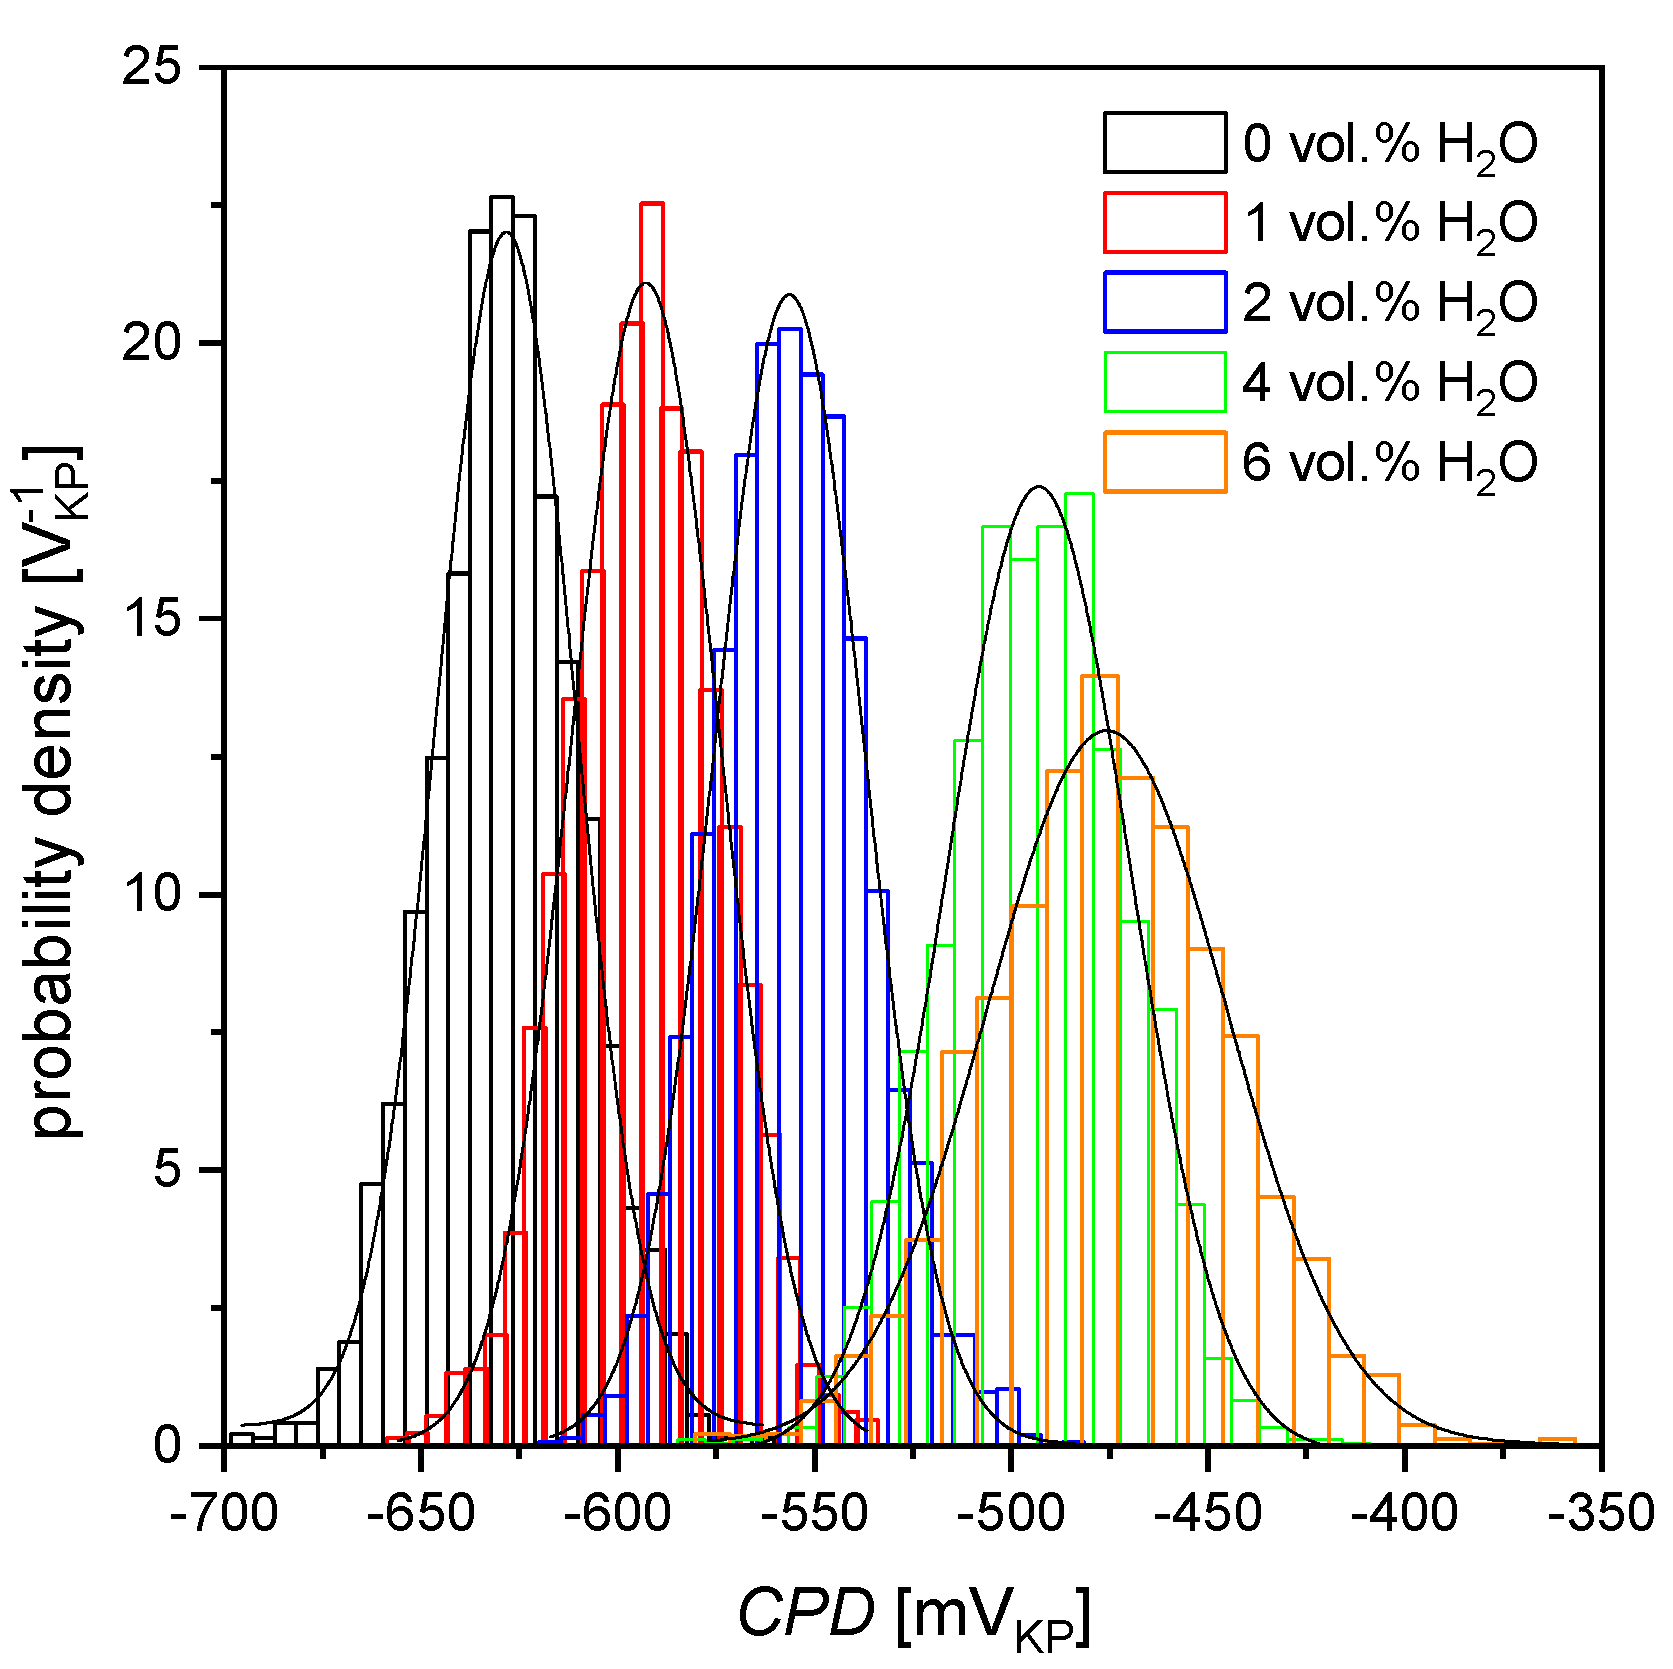
The dependence of the open-circuit potential in the function of time (t) measured for AISI 1010 steel immersed in sulfolane containing up to 6 vol.% of water is illustrated in Figure 1. It is noticeable that the average value of the OCP decreases with the increasing water concentration in sulfolane. In particular, when the water concentration increases from 0 to 6 vol.%, the average value of the OCP decreases from –104(1) to –257(2) mVSCE. The decrement of the OCP indicates an increment in the thermodynamic tendency to the corrosion of AISI 1010 steel. It should be noted that for water content ranging from 1 to 4 vol.%, the OCP values are comparable, although at the same time, the OCP values are lower by ca. 60 mVSCE compared to the water-free sulfolane. As a relative measure of OCP dispersion, a coefficient of variation (specified as the ratio of the standard deviation to the OCP average) was determined. It was recorded that for the last 20 min of the OCP measurement, the coefficient of variation did not exceed 3% for all the investigated electrodes (see Figure 1). Thus, one can state that AISI 1010 steel electrodes achieved a stable value of open-circuit potential in sulfolane solution that is necessary to record potentiodynamic curves properly.
Potentiodynamic polarization curves that represent anodic and cathodic reactions in the corrosion process of the AISI 1010 steel electrodes in sulfolane are presented in Figure 2. The electrochemical parameters that quantitatively describe changes in the corrosion resistance of the material tested were determined using potentiodynamic curves and Equation (1) and are shown in Table 1.
Corrosion potential (Ecorr), just like open-circuit potential, is a thermodynamic value that determines the corrosion tendency of a material in a given environment. It was noticed that the Ecorr of the AISI 1010 steel electrodes shows a similar trend to the open-circuit potential. Thus, the corrosion tendency of the investigated material increases with increased water concentration in sulfolane. As indicated in Equation (2), corrosion current density (jcorr) is directly proportional to the corrosion rate (CR). It was found that jcorr and CR values recorded for AISI 1010 steel increased ca. 4.5 times after adding 1 vol.% of water to sulfolane. Surprisingly, for variations in the water concentration in the range between 1 and 4 vol.%, jcorr and CR do not increase, but remain constant. Further increases in jcorr (ca. 3.5 times) and CR values were stated after increasing the water concentration in sulfolane up to 6 vol.%. On the whole, values of Ecorr, jcorr and CR indicate that the growing water concentration in sulfolane accelerates the corrosion of AISI 1010 steel. However, it should be noted that the maximum value of corrosion current density for the tested steel is ca. 67 nA·cm−2 and corresponds to a corrosion rate of 0.78 μm·year−1. Corrosivity categories of atmospheres based on corrosion rates are defined in the ISO 9223 standard [42]. Regarding carbon steel, corrosivity categories start with CR ≤ 1.3 μm·year−1 (category C1) and end with 200 ≤ CR ≤ 700 μm·year−1 (category CX). Based on the same classification for the corrosivity estimation, one can conclude that sulfolane belongs to the C1 category.
Corrosion of carbon steel used in the petroleum industry for pipelines or tanks is mainly caused by the presence of water, corrosive gases (H2S, CO2 and O2), chlorides and microorganisms. The most common form of corrosion occurs when carbon steel comes in contact with an aqueous solution, for instance, when CO2 is dissolved in water, corrosive carbonic acid is formed [43,44,45,46,47,48,49]. Sulfolane in the presence of water and air also forms an aqueous solution of sulphurous acid [24,25,26]. When carbon steel is exposed to an acidic solution, electrochemical corrosion processes are likely to occur. Thus, the anodic reaction for the investigated corrosion process should be iron dissolution, whereas the cathodic process coupled with the anodic should be the reduction of H+ ions. It was noticed that the increment in the water concentration in sulfolane ranging from 1 to 4 vol.% was accompanied by the enhancement of the βa and βc values as well (see Table 1). Thus, in that range of water concentration, the rate of anodic and cathodic reactions in the corrosion process decreases. Note that βa as well as βc decline rapidly with the enlargement of the water concentration in sulfolane above 4 vol.%. Moreover, for all investigated electrodes βa > βc, i.e., the rate determining step of the corrosion process is the anodic reaction. The high value of the Stern–Geary coefficient (62–144 mV) for AISI 1010 steel electrodes immersed in water-containing sulfolane (from 1 to 4 vol.% H2O) indicates the passive corrosion state of those materials. This means that iron oxidizes with the formation of the corrosion products layer on the material surface. Corrosion products like oxides, hydroxides, sulfates and carbonates, inter alia, may have no effect on, accelerate or inhibit the corrosion rate. For example, an iron carbonate protective layer can be formed on the surface of carbon steel and low-alloy steels (to 9 wt.% Cr) used in the petroleum industry. However, note that fluid movement or the temperature often break down the FeCO3 layer accelerating corrosion process [46,47,48,49]. It was found that for the water concentration in the range from 1 to 4 vol.%, a protective layer stabilizes the corrosion rate of AISI 1010 steel in sulfolane at a certain level. Additionally, the value of the Stern–Geary coefficient for the AISI 1010 steel electrode immersed in sulfolane containing 6 vol.% of water suggests that the steel in that environment is in an active corrosion state. The valid factors that affect the corrosion rate of steel in acidic solution are the corrosion products layer solubility, the solution temperature and the relative movement between the steel electrode and the solution [50]. In the conducted electrochemical tests, both the temperature and the stirring rate for all steel samples tested were the same, in consequence, only the concentration of water in sulfolane seems to be a dominant factor that can affect the observed variations in the corrosion rate of AISI 1010 steel. The obtained values of the βa, βc and B parameters indicate that the extension of the water concentration above 4 vol.% resulted in the dissolving of the corrosion products layer. Similar conclusions can be drawn from the polarization resistance analysis. Increased water concentration in sulfolane corresponds to the increment of the Rp values. However, the increase in the water concentration above 4 vol. % implies a decline of the Rp value (over 15 times), suggesting that the protective layer formed by the corrosion products on the surface of the AISI 1010 steel is destroyed.

3.2. Surface Damage

In addition to the electrochemical parameters, images of the corroded material surface are one of the most significant sources of corrosion data. Briefly speaking, the images qualitatively/quantitatively describe the shape, area and distribution of corrosion damage. Figure 3 presents the SEM images of the AISI 1010 steel surface after a corrosion test without etching of the corrosion products layer. It can be illustrated qualitatively that the nature of corrosion damage of AISI 1010 steel depends on the water concentration in sulfolane. Larger pits are visible for the steel electrode immersed in water-containing sulfolane compared to steel electrode immersed in water-free (pure) sulfolane. The observed changes on the material surface can be explained by the increased corrosivity of the environment towards AISI 1010 steel which is caused by the presence of sulphurous acid formed in the reaction of sulfolane with water and air [24,25,26].
In order to quantify local changes on the corroded steel surface, the fractal dimension (DB) was determined using 2D grayscale images. Generally, the values of fractal dimension can vary in the range of 2 to 3—for a smooth surface, DB is equal to 2, while for a more rough and irregular one, it is closer to 3. Concerning the corrosion resistance of materials, one can state that the more serious the corrosion damage, the larger the fractal dimension is. The lowest fractal dimension corresponds to the AISI 1010 steel electrode in the initial state as depicted in Figure 4. In fact, the fractal dimension does not change significantly for the water concentration in sulfolane in the range of 1 to 4 vol.%. It means that the protective layer formed on the steel surface is stable in the above range of water concentration. On the other hand, the extension of the water concentration up 4 vol.% caused the increment of DB again (see Figure 4). One can state that when the corrosion products layer is dissolved, the surface of the steel electrode becomes rougher. Moreover, the fractal dimension corresponds to the corrosion rate for the tested steel.
Contact potential difference maps for the AISI 1010 steel electrodes are presented in Figure 5. The registered maps and Equations (3)–(6) have been used for the determination of parameters that describe quantitatively the electronic properties of the AISI 1010 steel surface. Resulting parameters are reported in Table 2.
It was noticed that the increment of the water concentration in sulfolane from 0 to 6 vol.% implicated that the CPDav increases by ca. 25%. The shift of CPDav towards higher values can be explained by the presence of the corrosion products layer on the AISI 1010 steel surface. Moreover, the initial increase in the water concentration in the range of 1 to 4 vol.% and, subsequently, from 4 to 6 vol.%, causes the enlargement of the CPDrms by approximately 19% and 37%, respectively. The CPDrms parameter indicates that the dispersion of the contact potential difference on the steel surface increases by leaps and bounds. It means that the rate of the local dissolution of the corrosion products layer grows rapidly in the function of the water concentration above 4 vol.%. The increasing heterogeneity of the protective layer has a strong corrosion effect on AISI 1010 steel, i.e., it facilitates the formation of corrosive cells and, in consequence, causes a decrease in the corrosion resistance of AISI 1010 steel. It should be emphasized that the analysis of the CPD distribution and electrochemical parameters leads to similar conclusions.
Histograms of the CPD values are shown in Figure 6. The detailed description of the histograms’ preparation can be found elsewhere [38,39,40,41].
Briefly, the deviation from a normal distribution is quantitatively represented by the skewness (CPDsk) and kurtosis (CPDku). In this case, both parameters are in the range ±0.1 (see Table 2). In consequence, the CPD distribution on the AISI 1010 steel surface follows a Gaussian (normal) distribution for all the investigated sulfolane solutions. Approximation of the CPD histograms using the Gaussian function is given by the equation
g ( C P D ) = 1 σ 2 π e 1 2 ( C P D C P D av σ ) 2
where σ in Equation (7) is the standard deviation and is equal to the CPDrms. Histograms, as well as the skewness and kurtosis, indicate that the CPD values on the AISI 1010 steel surface are symmetrically distributed about the average value. Moreover, the CPD distribution does not show inordinately high peaks/deep valleys, irrespective of the sulfolane water concentration. It should be also noted that parallel scratches present on the material surface do not affect the CPD distribution. One can state that there are no privileged areas on the material surface, thus corrosion pits should appear randomly.

4. Conclusions

  • It was found that the corrosion rate of AISI 1010 steel increases with the increasing water concentration in sulfolane. In particular, the increment of the water concentration in the range from 0 to 1 vol.% and subsequently to 6 vol.% resulted in an increase in the corrosion rate (4.4 and 15.6 times, respectively). It should be emphasized that in real systems, the corrosion rate is influenced not only by the presence of water, but also by the presence of other impurities (e.g., O2), the processing temperature, flow velocity and pH of the corrosive solution. The combination of these factors can cause the real corrosion rate to be higher than presented above.
  • It was concluded that the corrosion products layer formed on the surface of AISI 1010 steel partially protects the material against corrosion in water-containing sulfolane (for water concentration from 1 to 4 vol.%). Corrosion rates of AISI 1010 steel are comparable for such water concentrations.
  • It was noticed that the rate-determining step of the corrosion process of AISI 1010 steel in water-contaminated sulfolane is the anodic reaction.
  • Finally, the greater the water concentration, the greater the corrosion degree and fractal dimension of the AISI 1010 steel surface.

Author Contributions

J.K., B.Ł., V.K., A.B.—conceptualization, methodology, investigation, formal analysis, article writing and editing, P.D.—data curation. All authors have read and agreed to the published version of the manuscript.

Funding

This research received no external funding.

Acknowledgments

We would like to profoundly acknowledge Honeywell Process Solutions for any help.

Conflicts of Interest

The authors declare no conflict of interest.

References

  1. Barro, R.; Regueiro, J.; Llompart, M.; Garcia-Jares, C. Analysis of industrial contaminants in indoor air: Part 1. Volatile organic compounds, carbonyl compounds, polycyclic aromatic hydrocarbons and polychlorinated biphenyls. J. Chromatogr. A 2009, 1216, 540–566. [Google Scholar] [CrossRef] [PubMed]
  2. Atkinson, R.; Arey, J. Atmospheric degradation of volatile organic compounds. Chem. Rev. 2003, 103, 4605–4638. [Google Scholar] [CrossRef] [PubMed]
  3. Bak, A.; Kozik, V.; Dybal, P.; Sulowicz, S.; Kasperczyk, D.; Kus, S.; Barbusinski, K. Abatement robustness of volatile organic compounds using compact trickle-bed bioreactor: Biotreatment of styrene, ethanol and dimethyl sulfide mixture in contaminated airstream. Int. Biodeterior. Biodegrad. 2017, 119, 316–328. [Google Scholar] [CrossRef]
  4. Wagh, R.B.; Gund, S.H.; Nagarkar, J.M. An eco-friendly oxidation of sulfide compounds. J. Chem. Sci. 2016, 128, 1321–1325. [Google Scholar] [CrossRef] [Green Version]
  5. Angaji, M.T.; Ghanbarabadi, H.; Gohari, F.K.Z. Optimizations of sulfolane concentration in propose Sulfinol-M solvent instead of MDEA solvent in the refineries of Sarakhs. J. Nat. Gas Sci. Eng. 2013, 15, 22–26. [Google Scholar] [CrossRef]
  6. Tilstam, U. Sulfolane: A versatile dipolar aprotic solvent. Org. Process Res. Dev. 2012, 16, 1273–1278. [Google Scholar] [CrossRef]
  7. Zaretskii, M.I.; Rusak, V.V.; Chartov, E.M. Sulfolane and dimethyl sulfoxide as extractants. Coke Chem. 2013, 56, 266–268. [Google Scholar] [CrossRef]
  8. Yang, C.F.; Liu, S.H.; Su, Y.M.; Chen, Y.R.; Lin, C.W.; Lin, K.L. Bioremediation capability evaluation of benzene and sulfolane contaminated groundwater: Determination of bioremediation parameters. Sci. Total Environ. 2019, 648, 811–818. [Google Scholar] [CrossRef]
  9. Saint-Fort, R. Sulfolane attenuation by surface and subsurface soil matrices. J. Environ. Sci. Health Part A Tox. Hazard. Subst. Environ. Eng. 2006, 41, 1211–1231. [Google Scholar] [CrossRef]
  10. Silinski, M.A.R.; Uenoyama, T.; Cooper, S.D.; Fernando, R.A.; Robinson, V.G.; Waidyanatha, S. Development and validation of an analytical method for quantitation of sulfolane in rat and mouse plasma by GC–MS. J. Anal. Toxicol. 2019, 43, 477–481. [Google Scholar] [CrossRef]
  11. Khan, M.F.; Yu, L.; Tay, J.H.; Achari, G. Coaggregation of bacterial communities in aerobic granulation and its application on the biodegradation of sulfolane. J. Hazard. Mater. 2019, 377, 206–214. [Google Scholar] [CrossRef] [PubMed]
  12. Dinh, M.; Hakimabadi, S.G.; Pham, A.L.-T. Treatment of sulfolane in groundwater: A critical review. J. Environ. Manag. 2020, 263, 110385. [Google Scholar] [CrossRef] [PubMed]
  13. Brandão, M.; Yu, L.; García, C.; Achari, G. Advanced oxidation based treatment of soil wash water contaminated with sulfolane. Water 2019, 11, 2152. [Google Scholar] [CrossRef] [Green Version]
  14. Khan, M.F.; Yu, L.; Achari, G.; Tay, J.H. Degradation of sulfolane in aqueous media by integrating activated sludge and advanced oxidation process. Chemosphere 2010, 222, 1–8. [Google Scholar] [CrossRef] [PubMed]
  15. Yu, L.; Mehrabani-Zeinabad, M.; Achari, G.; Langford, C.H. Application of UV based advanced oxidation to treat sulfolane in an aqueous medium. Chemosphere 2016, 160, 155–161. [Google Scholar] [CrossRef]
  16. Izadifard, M.; Achari, G.; Langford, C.H. Mineralization of sulfolane in aqueous solutions by Ozone/CaO2 and Ozone/CaO with potential for field application. Chemosphere 2018, 197, 525–540. [Google Scholar] [CrossRef]
  17. Izadifard, M.; Achari, G.; Langford, C.H. Degradation of sulfolane using activated persulfate with UV and UV-Ozone. Water Res. 2017, 125, 325–331. [Google Scholar] [CrossRef]
  18. Kasanke, C.P.; Leight, M.B. Factors limiting sulfolane biodegradation in contaminated subarctic aquifer substrate. PLoS ONE 2017, 12, 1–10. [Google Scholar] [CrossRef] [Green Version]
  19. Kasanke, C.P.; Collins, R.E.; Leight, M.B. Identification and characterization of a dominant sulfolane-degrading Rhodoferax sp. via stable isotope probing combined with metagenomics. Sci. Rep. 2019, 9, 3121. [Google Scholar] [CrossRef]
  20. Jiang, Y.; Brassington, K.J.; Pripich, G.; Paton, G.I.; Semple, K.T.; Pollard, S.J.T.; Coulon, F. Insight into the biodegradation of weathered hydrocarbons in contaminated soils by bioaugmentation and nutrient stimulation. Chemosphere 2016, 161, 300–307. [Google Scholar] [CrossRef] [Green Version]
  21. Schneider, D.F. Avoid sulfolane regeneration problems. Chem. Eng. Prog. 2004, 100, 34–39. [Google Scholar]
  22. Zaretskii, M.I.; Rusak, V.V.; Chartov, E.M. Extractive rectification by means of sulfolane in chemical technology: A review. Coke Chem. 2011, 54, 299–301. [Google Scholar] [CrossRef]
  23. Mingy, L.; Zhong, J.; Xujiang, S. Cause of equipment corrosion and counter measures in the sulfolane recycling system of aromatics extraction unit. Pet. Process Petrochem. 2005, 36, 30–33. [Google Scholar]
  24. Bak, A.; Kozik, V.; Dybal, P.; Kus, S.; Swietlicka, A.; Jampilek, J. Sulfolane: Magic extractor or bad actor? Pilot-scale study on solvent corrosion potential. Sustainability 2018, 10, 3677. [Google Scholar] [CrossRef] [Green Version]
  25. Bak, A.; Losiewicz, B.; Kozik, V.; Kubisztal, J.; Dybal, P.; Swietlicka, A.; Barbusinski, K.; Kus, S.; Howaniec, N.; Jampilek, J. Real-time corrosion monitoring of AISI 1010 carbon steel with metal surface mapping in sulfolane. Materials 2019, 12, 3276. [Google Scholar] [CrossRef] [Green Version]
  26. Kubisztal, J.; Losiewicz, B.; Dybal, P.; Kozik, V.; Bak, A. Temperature-related corrosion resistance of AISI 1010 carbon steel in sulfolane. Materials 2020, 13, 2563. [Google Scholar] [CrossRef]
  27. Fernández-Solis, C.D.; Vimalanandan, A.; Altin, A.; Mondragón-Ochoa, J.S.; Kreth, K.; Keil, P.; Erbe, A. Fundamentals of electrochemistry, corrosion and corrosion protection. In Soft Matter at Aqueous Interfaces, Lecture Notes in Physics; Lang, P.R., Liu, Y., Eds.; Springer: Cham, Switzerland, 2016; Volume 97, pp. 29–70. ISBN 9783319245003. [Google Scholar]
  28. Savitzky, A.; Golay, M.J.E. Smoothing and differentiation of data by simplified least squares procedures. Anal. Chem. 1964, 36, 1627–1639. [Google Scholar] [CrossRef]
  29. Xu, S.; Weng, Y. A new approach to estimate fractal dimensions of corrosion images. Pattern Recogn. Lett. 2006, 27, 1942–1947. [Google Scholar] [CrossRef]
  30. Pidaparti, R.M.; Aghazadeh, B.S.; Whitfield, A.; Rao, A.S.; Mercier, G.P. Classification of corrosion defects in NiAl bronze through image analysis. Corros. Sci. 2010, 52, 3661–3666. [Google Scholar] [CrossRef]
  31. Issa, A.K.; Aji, A.M. Application of fractal dimension on atmospheric corrosion of galvanized iron roofing material. IJSTR 2015, 4, 91–98. [Google Scholar]
  32. Qian, A.; Jin, P.; Tan, X.; Wang, D. Corrosion damage assessment of AerMet100 steel based on image analysis. IOP Conf. Ser. Mater. Sci. Eng. 2018, 394, 052066. [Google Scholar] [CrossRef]
  33. Yao, J.; Chen, J.; Lu, C. Fractal cracking patterns in concretes exposed to sulfate attack. Materials 2019, 12, 2338. [Google Scholar] [CrossRef] [PubMed] [Green Version]
  34. Menchaca-Campos, E.C.; Villalba-Enciso, E.R.; Juarez-Nuñez, V.; Flores-Dominguez, M.; Mayorga-Cruz, D.; Guardian-Tapia, R.; Uruchurtu-Chavarín, J. Fractal dimension analysis of aluminum corrosion roughness by electrochemical and optical methods. EJERS 2020, 5, 282–291. [Google Scholar] [CrossRef] [Green Version]
  35. Di Ieva, A. The Fractal Geometry of the Brain; Springer: New York, NY, USA, 2016; ISBN 9781493939930. [Google Scholar]
  36. Sarkar, N.; Chaudhuri, B.B. An efficient approach to estimate fractal dimension of textural images. Pattern Recogn. 1992, 25, 1035–1041. [Google Scholar] [CrossRef]
  37. Losiewicz, B.; Popczyk, M.; Szklarska, M.; Smołka, A.; Osak, P.; Budniok, A. Application of the scanning Kelivin probe technique for characterization of corrosion interfaces. Solid State Phenom. 2015, 228, 369–382. [Google Scholar] [CrossRef]
  38. Kubisztal, J.; Kubisztal, M.; Haneczok, G. Quantitative characterization of material surface–application to Ni + Mo electrolytic composite coatings. Mater. Charact. 2016, 122, 45–53. [Google Scholar] [CrossRef]
  39. Kubisztal, J.; Kubisztal, M.; Stach, S.; Haneczok, G. Corrosion resistance of anodic coatings studied by scanning microscopy and electrochemical methods. Surf. Coat. Technol. 2018, 350, 419–427. [Google Scholar] [CrossRef]
  40. Kubisztal, J.; Kubisztal, M.; Haneczok, G. New scaling procedure for quantitative determination of surface anisotropy–application to plastic deformation of AISI 316L stainless steel. Surf. Topogr. Metrol. Prop. 2020, 8, 015003. [Google Scholar] [CrossRef]
  41. Kubisztal, J.; Kubisztal, M.; Haneczok, G. Corrosion damage of 316L steel surface examined using statistical methods and artificial neural network. Mater. Corros. 2020, 1–14. [Google Scholar] [CrossRef]
  42. ISO 9223:2012. Corrosion of Metals and Alloys–Corrosivity of Atmospheres–Classification, Determination and Estimation; International Organization for Standardization: Geneva, Switzerland, 2012. [Google Scholar]
  43. Santos, B.G.; King, F. Corrosion of carbon steel in petrochemical environments. NACE 2008, 1, 08388. [Google Scholar]
  44. Jafari, H.; Idris, M.H.; Ourdjini, A.; Rahimi, H.; Ghobadian, B. EIS study of corrosion behavior of metallic materials in ethanol blended gasoline containing water as a contaminant. Fuel 2011, 90, 1181–1187. [Google Scholar] [CrossRef]
  45. Tamalmani, K.; Husin, H. Review on corrosion inhibitors for oil and gas corrosion issues. Appl. Sci. 2020, 10, 3389. [Google Scholar] [CrossRef]
  46. Olivares, G.Z.; Gayosso, M.J. Corrosion of steel pipelines transporting hydrocarbon condensed products, obtained from a high pressure separator system: A failure analysis study. Mater. Sci. Appl. 2015, 6, 760–772. [Google Scholar] [CrossRef] [Green Version]
  47. Groysman, A. Corrosion problems and solutions in oil, gas, refining and petrochemical industry. Koroz. Ochr. Mater. 2017, 61, 100–117. [Google Scholar] [CrossRef] [Green Version]
  48. Popoola, L.T.; Grema, A.S.; Latinwo, G.K.; Gutti, B.; Balogun, A.S. Corrosion problems during oil and gas production and its mitigation. Int. J. Ind. Chem. 2013, 4, 35. [Google Scholar] [CrossRef] [Green Version]
  49. Ziólkowska, M.; Wardzińska, D. Corrosiveness of fuels during storage processes. In Storage Stability of Fuels; Biernat, K., Ed.; IntechOpen: Rijeka, Croatia, 2015; ISBN 9789535117346. [Google Scholar]
  50. Panossian, Z.; Lira de Almeida, N.; Ferreira de Sousa, R.M.; de Souza Pimenta, G.; Bordalo Schmidt Marques, L. Corrosion of carbon steel pipes and tanks by concentrated sulfuric acid: A review. Corros. Sci. 2012, 58, 1–11. [Google Scholar] [CrossRef]
Figure 1. Open-circuit potential for the AISI 1010 steel electrodes immersed in sulfolane containing up to 6 vol.% of water; VSCE is the electrode potential measured versus saturated calomel electrode.
Energies 13 04580 g001
Figure 2. Potentiodynamic polarization curves for the AISI 1010 steel electrodes immersed in sulfolane containing up to 6 vol.% of water; symbols and solid lines represent experimental data and fit of Equation (1), respectively; VSCE is the electrode potential measured vs. saturated calomel electrode.
Energies 13 04580 g002
Figure 3. SEM images for the AISI 1010 steel surface in the initial state (a) and after 96 h of immersion in sulfolane that contains 0 (b), 1 (c), 2 (d), 4 (e) and 6 (f) vol.% of water.
Energies 13 04580 g003
Figure 4. Fractal dimension (DB) in the function of the water concentration in sulfolane.
Energies 13 04580 g004
Figure 5. Contact potential difference (CPD) maps for the AISI 1010 steel electrodes after 96 h of immersion in sulfolane containing 0 (a), 1 (b), 2 (c), 4 (d) and 6 (e) vol.% of water; VKP is the voltage measured versus Kelvin probe.
Energies 13 04580 g005aEnergies 13 04580 g005b
Figure 6. Histograms of contact potential difference (CPD) determined using maps shown in Figure 5; solid lines—fit of the Gaussian distribution (see Equation (7)); VKP is the voltage measured versus Kelvin probe.
Energies 13 04580 g006
Table 1. Corrosion parameters for the AISI 1010 steel electrodes immersed in sulfolane containing up to 6 vol.% of water; VSCE is the electrode potential measured vs. saturated calomel electrode.
Vol.% H2OEcorr (mVSCE)jcorr (nA·cm−2)βa (mVSCE)βc (mVSCE)B (mVSCE)Rp (MΩ·cm2)CR (μm·Year−1)
0−104.1(4)4.2(2)776(46)485(22)13030.80.05
1−157.6(8)19.1(2)748(15)177(3)623.30.22
2−148.6(2)17.1(2)915(14)266(6)905.20.21
4−154.8(9)18.4(1)1262(109)451(17)1447.80.22
6−216.1(7)67(18)402(148)87(14)310.50.78
Table 2. Statistical parameters calculated using maps shown in Figure 5; CPDav is the average value, CPDrms is the root mean square deviation, CPDsk is the skewness and CPDku is the kurtosis; VKP is the voltage measured versus Kelvin probe.
Vol.% H2OCPDav (mVKP)CPDrms (mVKP)CPDskCPDku
0−628.317.5−0.040.10
1−590.518.90.04−0.01
2−553.019.20.100.06
4−490.022.5−0.100.02
6−471.230.90.010.09

