Article

Classification of Coal Structure Combinations and Their Influence on Hydraulic Fracturing: A Case Study from the Qinshui Basin, China

1
College of Geoscience and Surveying Engineering, China University of Mining and Technology, Beijing 100083, China
2
School of Energy Science and Engineering, Henan Polytechnic University, Jiaozuo 454003, China
3
School of Mining Engineering, Liaoning Shihua University, Fushun 113001, China
4
Research Institute of Petroleum Exploration and Development, Beijing 100083, China
5
China United Coalbed Methane Co., Ltd., Beijing 100011, China
*
Author to whom correspondence should be addressed.
Energies 2020, 13(17), 4559; https://doi.org/10.3390/en13174559
Submission received: 26 July 2020 / Revised: 31 August 2020 / Accepted: 31 August 2020 / Published: 2 September 2020

Abstract

:
Coal structure directly correlates to permeability and hydraulic fracturing effects. Underground coal mining indicates that a single coal section generally contains multiple coal structures in superposition, making how to recognise the coal structure combination and predict its influence on coal permeability a challenging problem. Based on well-drilling sampled cores, the geological strength index (GSI), and well-logging data, the DEN, GR, CALX, and CALY were selected to establish a model to predict GSI by multiple regression to identify coal structure from 100 coalbed methane wells. Based on fitting GSI and corresponding permeability test values, injection fall-off (IFO) testing, and hydraulic fracturing results, permeability prediction models for pre- and post-fracturing behaviour were established, respectively. The fracturing effect was evaluated by the difference in permeability. The results show that a reservoir can be classified into one of nine types by different coal structure thickness proportion (and combinations thereof) and the fracturing curves can be classified into four categories (and eight sub-categories) by the pressure curve. Up-down type I and type II reservoirs (proportion of hard coal >60%) and intervening interval type I reservoir (proportion of hard coal >70%) are prone to form stable and descending fracturing curves and the fracturing effects are optimal. Intervening interval type II (hard coal:soft coal:hard coal or soft coal:hard coal:soft coal ≈1:1:1) and up-down type III (hard coal:soft coal =1:1) form descending type II, rising type I and fluctuating type I fracturing curves and fracturing effect ranks second; up-down type IV and V (proportion of hard coal <40%), interval type III (proportion of hard coal <30%), and multi-layer superposition-type reservoirs readily form fluctuating and rising fracturing curves and fracturing effects therein are poor. The research results provide guidance for the targeted stimulation measured under different coal structure combinations.

1. Introduction

Coalbed methane (CBM) is a low-carbon, environmentally-friendly, unconventional energy resource and should be developed effectively. The coal reservoir in Qinshui Basin has experienced multistage tectonics, which form different coal structures of strong heterogeneity [1,2,3,4,5]. The complex coal structure leads to the difference in porosity and permeability, which is an important factor in determining CBM production [6,7,8,9,10]. Besides, coal structure determines the choice, and efficacy of drilling and completion operations and has an important influence on hydraulic fracturing [11,12,13,14,15]. In addition, with a certain thickness of deformed soft coal, coal and gas outbursts become more likely, adversely affecting coal mine safety; the more deformed the coal, the more likely it is to give rise to coal and gas outbursts [16,17,18]. Therefore, the accurate identification and distribution of coal structure is of great importance for CBM exploration, development, and gas leakage prevention [19,20,21].
The methods of identification of coal structure mainly include observation of manually collected specimens and geophysical information identification. Among them, geophysical information identification methods mainly include logging [22,23,24,25,26,27,28,29,30] and seismic methods [31,32,33]. Compared with the seismic method, the well-logging method offers higher resolution and accuracy and can provide continuous data allowing better identification of coal structures. There are qualitative and quantitative methods for logging identification. In previous research, qualitative identification was mainly based on the differences between logging curves in different coal structures [34]. At present, the coal structure cannot meet the actual demand only from the perspective of qualitative analysis and the logging identification method is gradually moving towards quantitative development. Researchers use multiple regression analysis [23], correspondence analysis [28], BP neural networks [35,36], pore structure index methods [37], the intersection method [27,38], principal component analysis [39,40], clustering analysis [41], and the kernel Fisher discriminant analysis method [42] based on data from drilling coring, caliper logging, resistivity logging, density logging, natural gamma ray logging, and acoustic logging to identify coal structure, and any trends therein. At present, although there are many identification methods for coal structure and some logging parameters are affected by geological evolution and other factors, the logging response characteristics are not obvious. The identification results vary to some extent. For the high rank coal, caliper logging, density logging, and natural gamma logging were mainly selected to identify coal structure.
The geological strength index (GSI) was established by Hoek and is used to classify a rock mass [43,44,45]. The rock mass strength is estimated from the mechanical properties and observations of the rock. The value is determined by the degree and the state of discontinuity of a rock mass. Similarly, coal is a special combustible organic rock: the essence thereof is the same, therefore, GSI can be used to evaluate the coal structure. The coal structure can reflect the coal integrity. Extraneous cracks and cleats belong to discrete surfaces, and cut matrix blocks are similar to the rock lumpiness. When the coal surface is better, the coal connectivity is stronger, the coal structure is better, and its GSI value is larger (and vice versa).
Hydraulic fracturing is one of the most important methods used to reform low-permeability coal reservoirs and the effect of fracturing has a direct influence on the productivity of CBM wells. Fracturing evaluation methods mainly include the fracture/closure pressure, crack monitoring, gamma tracing, and fracturing curve analysis [46,47]. Among them, the fracturing curves are easily obtained and can reflect the characteristics of coal reservoirs, crack propagation, fracturing fluid flow, and proppant migration. The fracturing curves should be analysed in detail as it is of great significance to the integration of information relating to geology and engineering [48]. Some researchers have classified the fracturing curves into four types: stable type, fluctuating type, descending type, and stable-fluctuating type to evaluate the fracturing effect [48,49,50,51], believing that the coal structure has an important influence on hydraulic fracturing: however, the above research only focuses on the influence of single coal structure on fracturing. According to the fracturing process, the relationship between coal structure and fracturing curve was analysed. Most coal seams are composed of many different coal structures, so it is generally unreasonable to conduct fracturing of the whole coal seam. For a complex coal seam containing different coal structures, the vertical distribution of coal structure needs to be analysed precisely to determine the reasonable fracturing parameters.
Based on the above issues, this paper mainly introduces the GSI to conduct continuous and quantitative characterisation of the deformation of coal. A multiple regression model is established between GSI and logging parameters and the coal structure is identified from 100 CBM wells using this model. Based on the identification of coal structure, coal reservoir types are classified with the proportion of thickness and spatial combination of different coal structures. The types of fracturing curves are divided according to the characteristics of their pressure curves, and the pre- and post-fracturing permeability of coal reservoir and their differences are used to analyse the fracturing effects of different fracturing curve types. Finally, the paper statistically summarises the relationship between the types of the fracture curves and coal reservoir types with different coal structure combinations to assess the fracturing effects in different types of coal reservoir. The research results can provide ideas and guidance for advancing hydraulic fracturing technology and parameter optimisation under multi-coal structure combinations and lay a foundation for efficient exploration and development of CBM in the No. 3 coal seam in Shizhuangnan Block in the Qinshui Basin in China.

2. Geological Setting
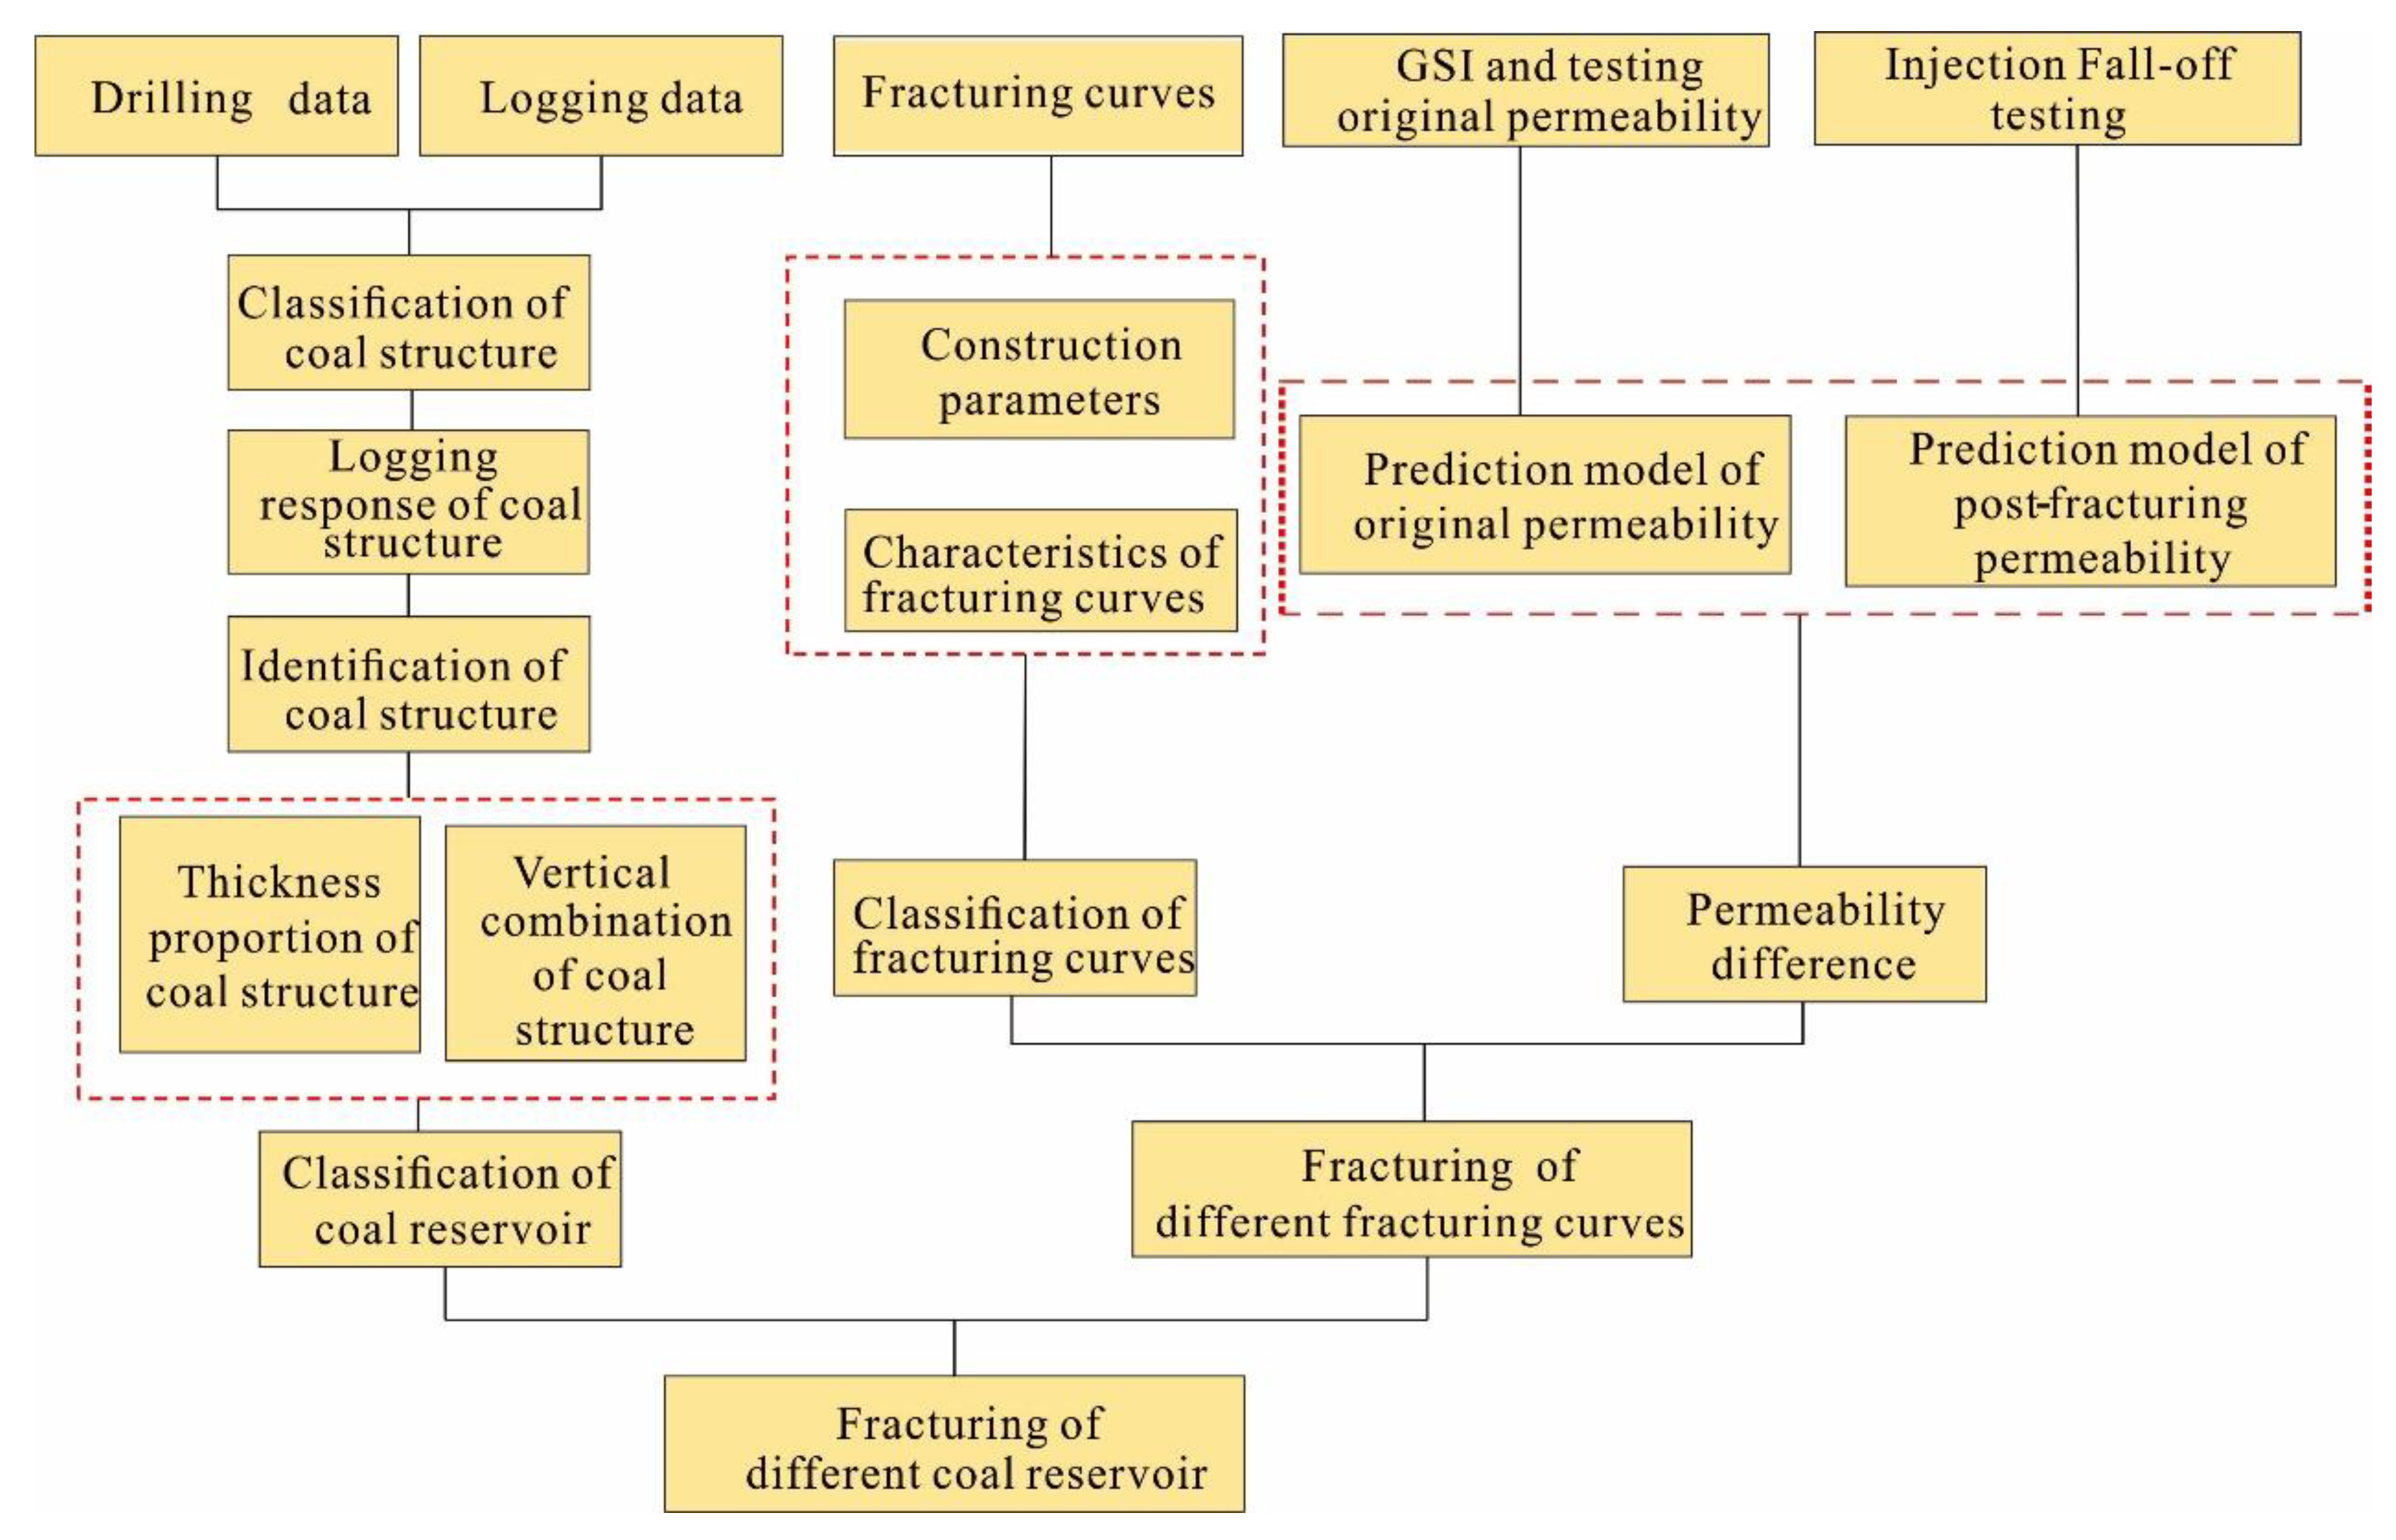
The Shizhuangnan Block lies in the south of Qinshui Basin and is classified as a secondary tectonic unit of the Qinshui block depression in the Taihang uplift belt of the North China plate. The block is generally a monocline structure plunging towards the north-west, and is with a series of axial near-east-west folds in the south-east as arranged in arcuate form therein. The strata include Ordovician, upper Carboniferous Benxi Formation, Carboniferous-Permian Taiyuan Formation, Lower Permian Shanxi Formation, Middle Permian Shihezi Formation, Upper Permian Shiqianfeng Formation, and Quaternary from bottom to top [52,53]. The No. 3 and No. 15 coal seams are distributed therein, among which the No. 3 coal seam is the target seam in the study area. The No.3 coal seam has a stable distribution: the thickness ranges from 3.5 m to 11 m, with an average of 6.35 m; there are one of two layers of dirt and the thickness thereof is about 0.2 to 0.3 m. The gas content is 4.5 to 23.5 m3/t and is relatively low in the fault development area. The coal structure is mainly cataclastic and granulated coal. The coal is relatively broken and has strong heterogeneity on the horizontal and vertical direction in the cores of multi-structural movement and near-fault zones. The permeability is between 0.015 × 10⁻³ to 1.35 × 10⁻³ μm2 and is generally low [54]. In this study, data from 100 wells were collected for analysis. The specific well locations and elevation isoline of the bottom of No. 3 coal seam are shown in Figure 1.

3. Research Methods

Coal samples were observed after collection from core samples taken when drilling CBM wells in the study area and were calibrated for different coal structure by GSI, including undeformed coal, cataclastic coal, granulated coal, and mylonite coal. The GSI and multiple parameters of logging response were fitted and the fitting formula thus obtained; this was used to calculate the GSI at intervals of 0.2 m in the coal seam segment of 100 CBM wells. The distribution of coal structure was obtained from the GSI interval value in the coal seam segment. The reservoirs were classified into nine types by the proportion of coal thickness and spatial combination with different coal structures.
According to the characteristics of coal reservoir types and hydraulic fracturing curves, four categories and eight sub-categories fracturing curves were established. The permeability was measured on different coal structures and the relationship between GSI and original permeability of coal reservoirs obtained. The original permeability of coal reservoirs is calculated by using “GSI chart + multi-parameter fitting of well logging data + permeability testing” methods. The filter loss of fracturing fluid, measurement of pressure-drop, and injection rate of total fracturing fluid volume were analysed in the fracturing process. Combined with the injection/pressure-drop test theory, the prediction model of post-fracturing permeability was established. Based on the predictive model of pre-fracturing and post-fracturing permeability, their permeability and difference were calculated. The fracturing effects with different fracturing curve types were evaluated by their difference and gas production. Finally, the fracturing curves of different coal reservoir types were analysed and the fracturing effects were deduced for a coal reservoir with different coal structure combinations. The workflow is shown in Figure 2.

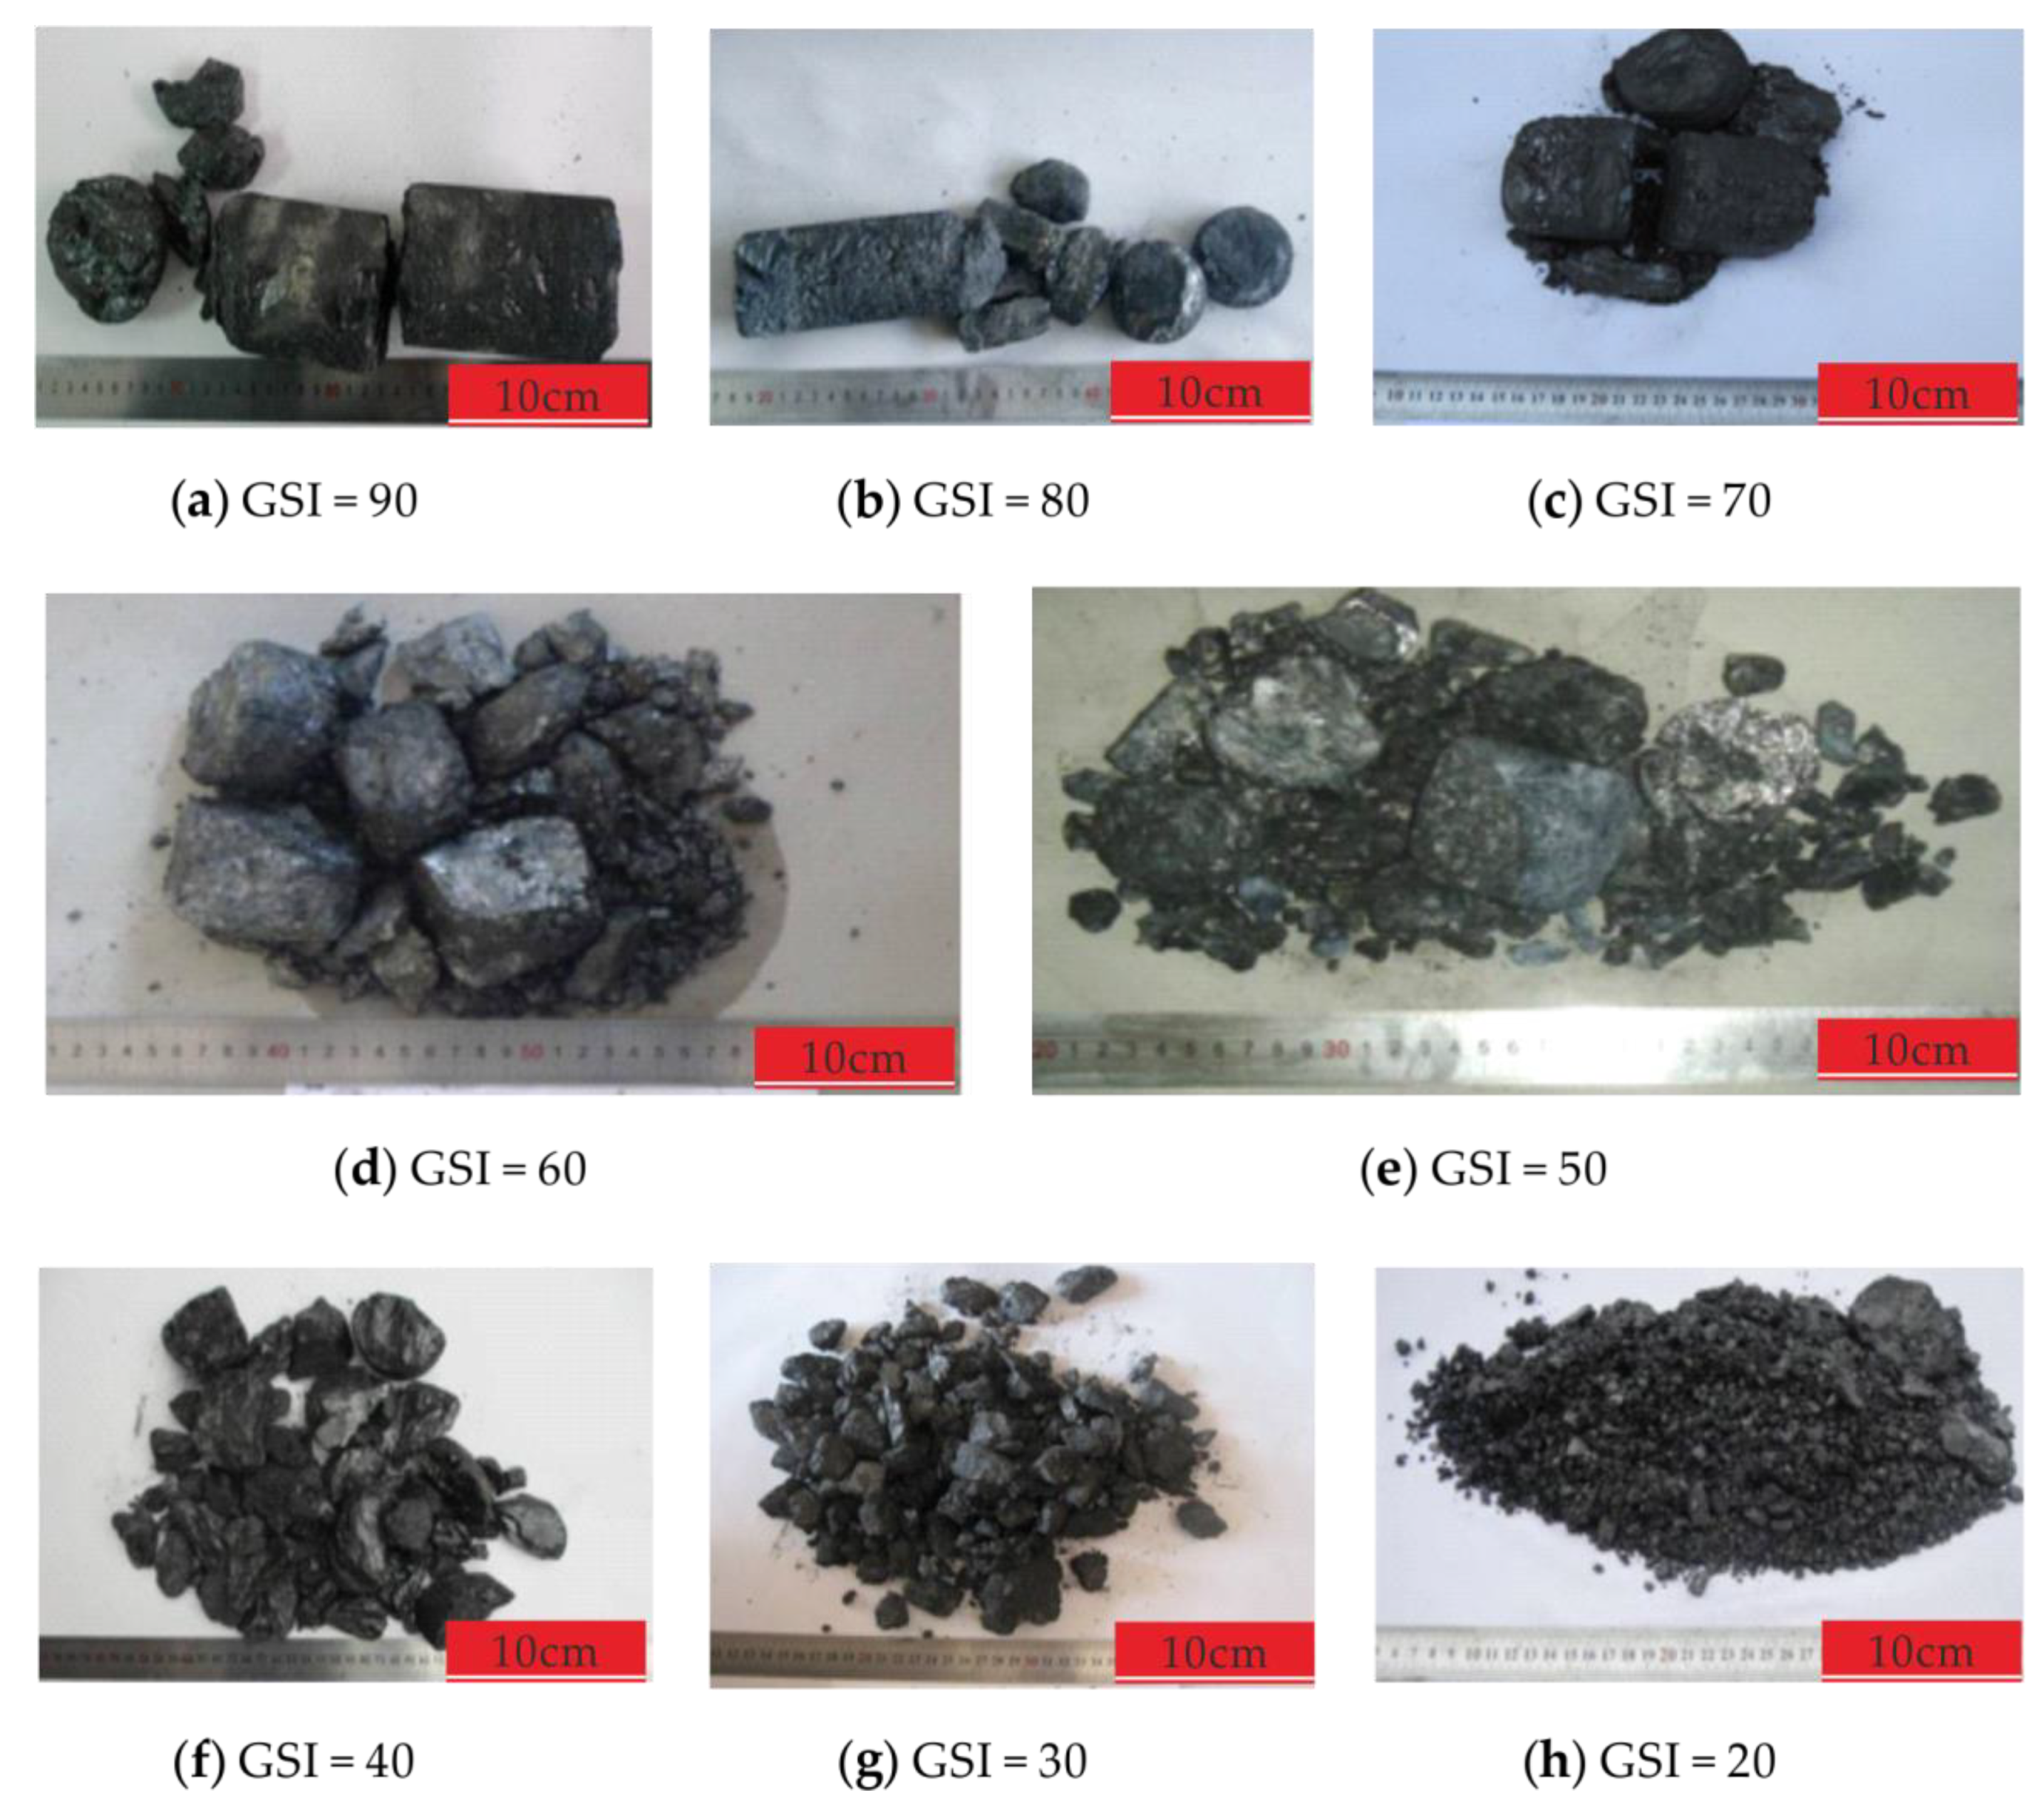
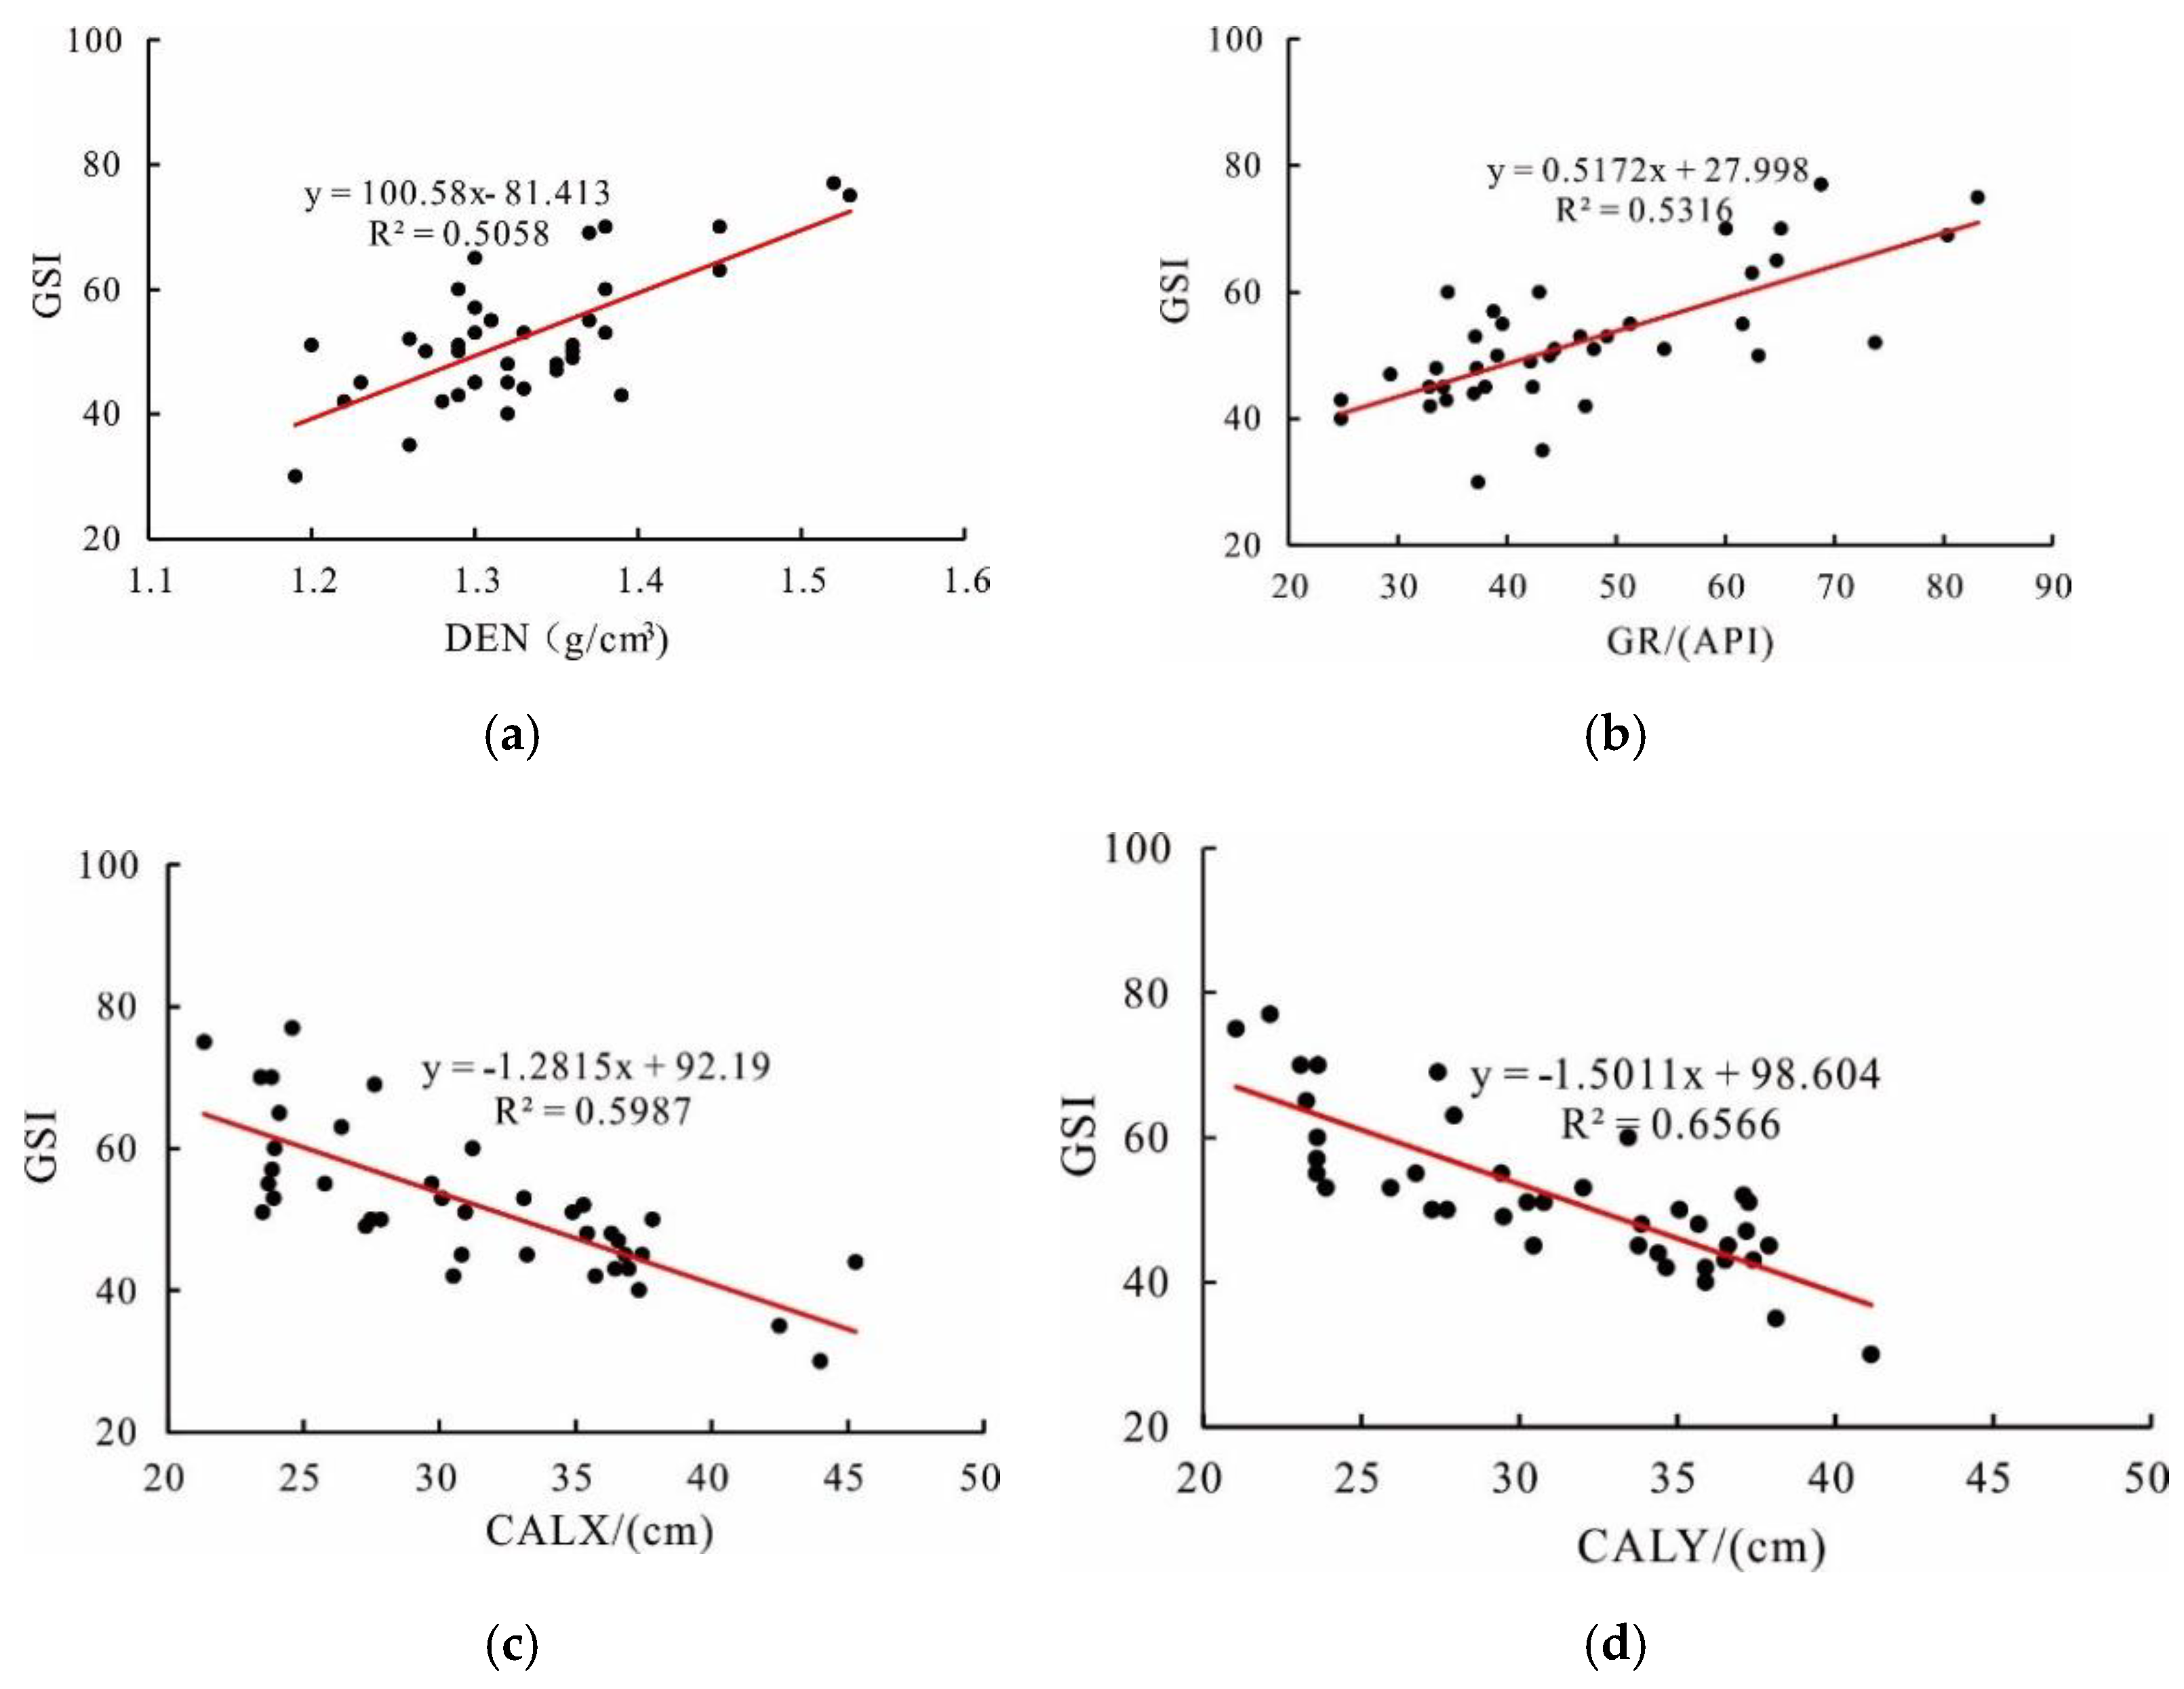
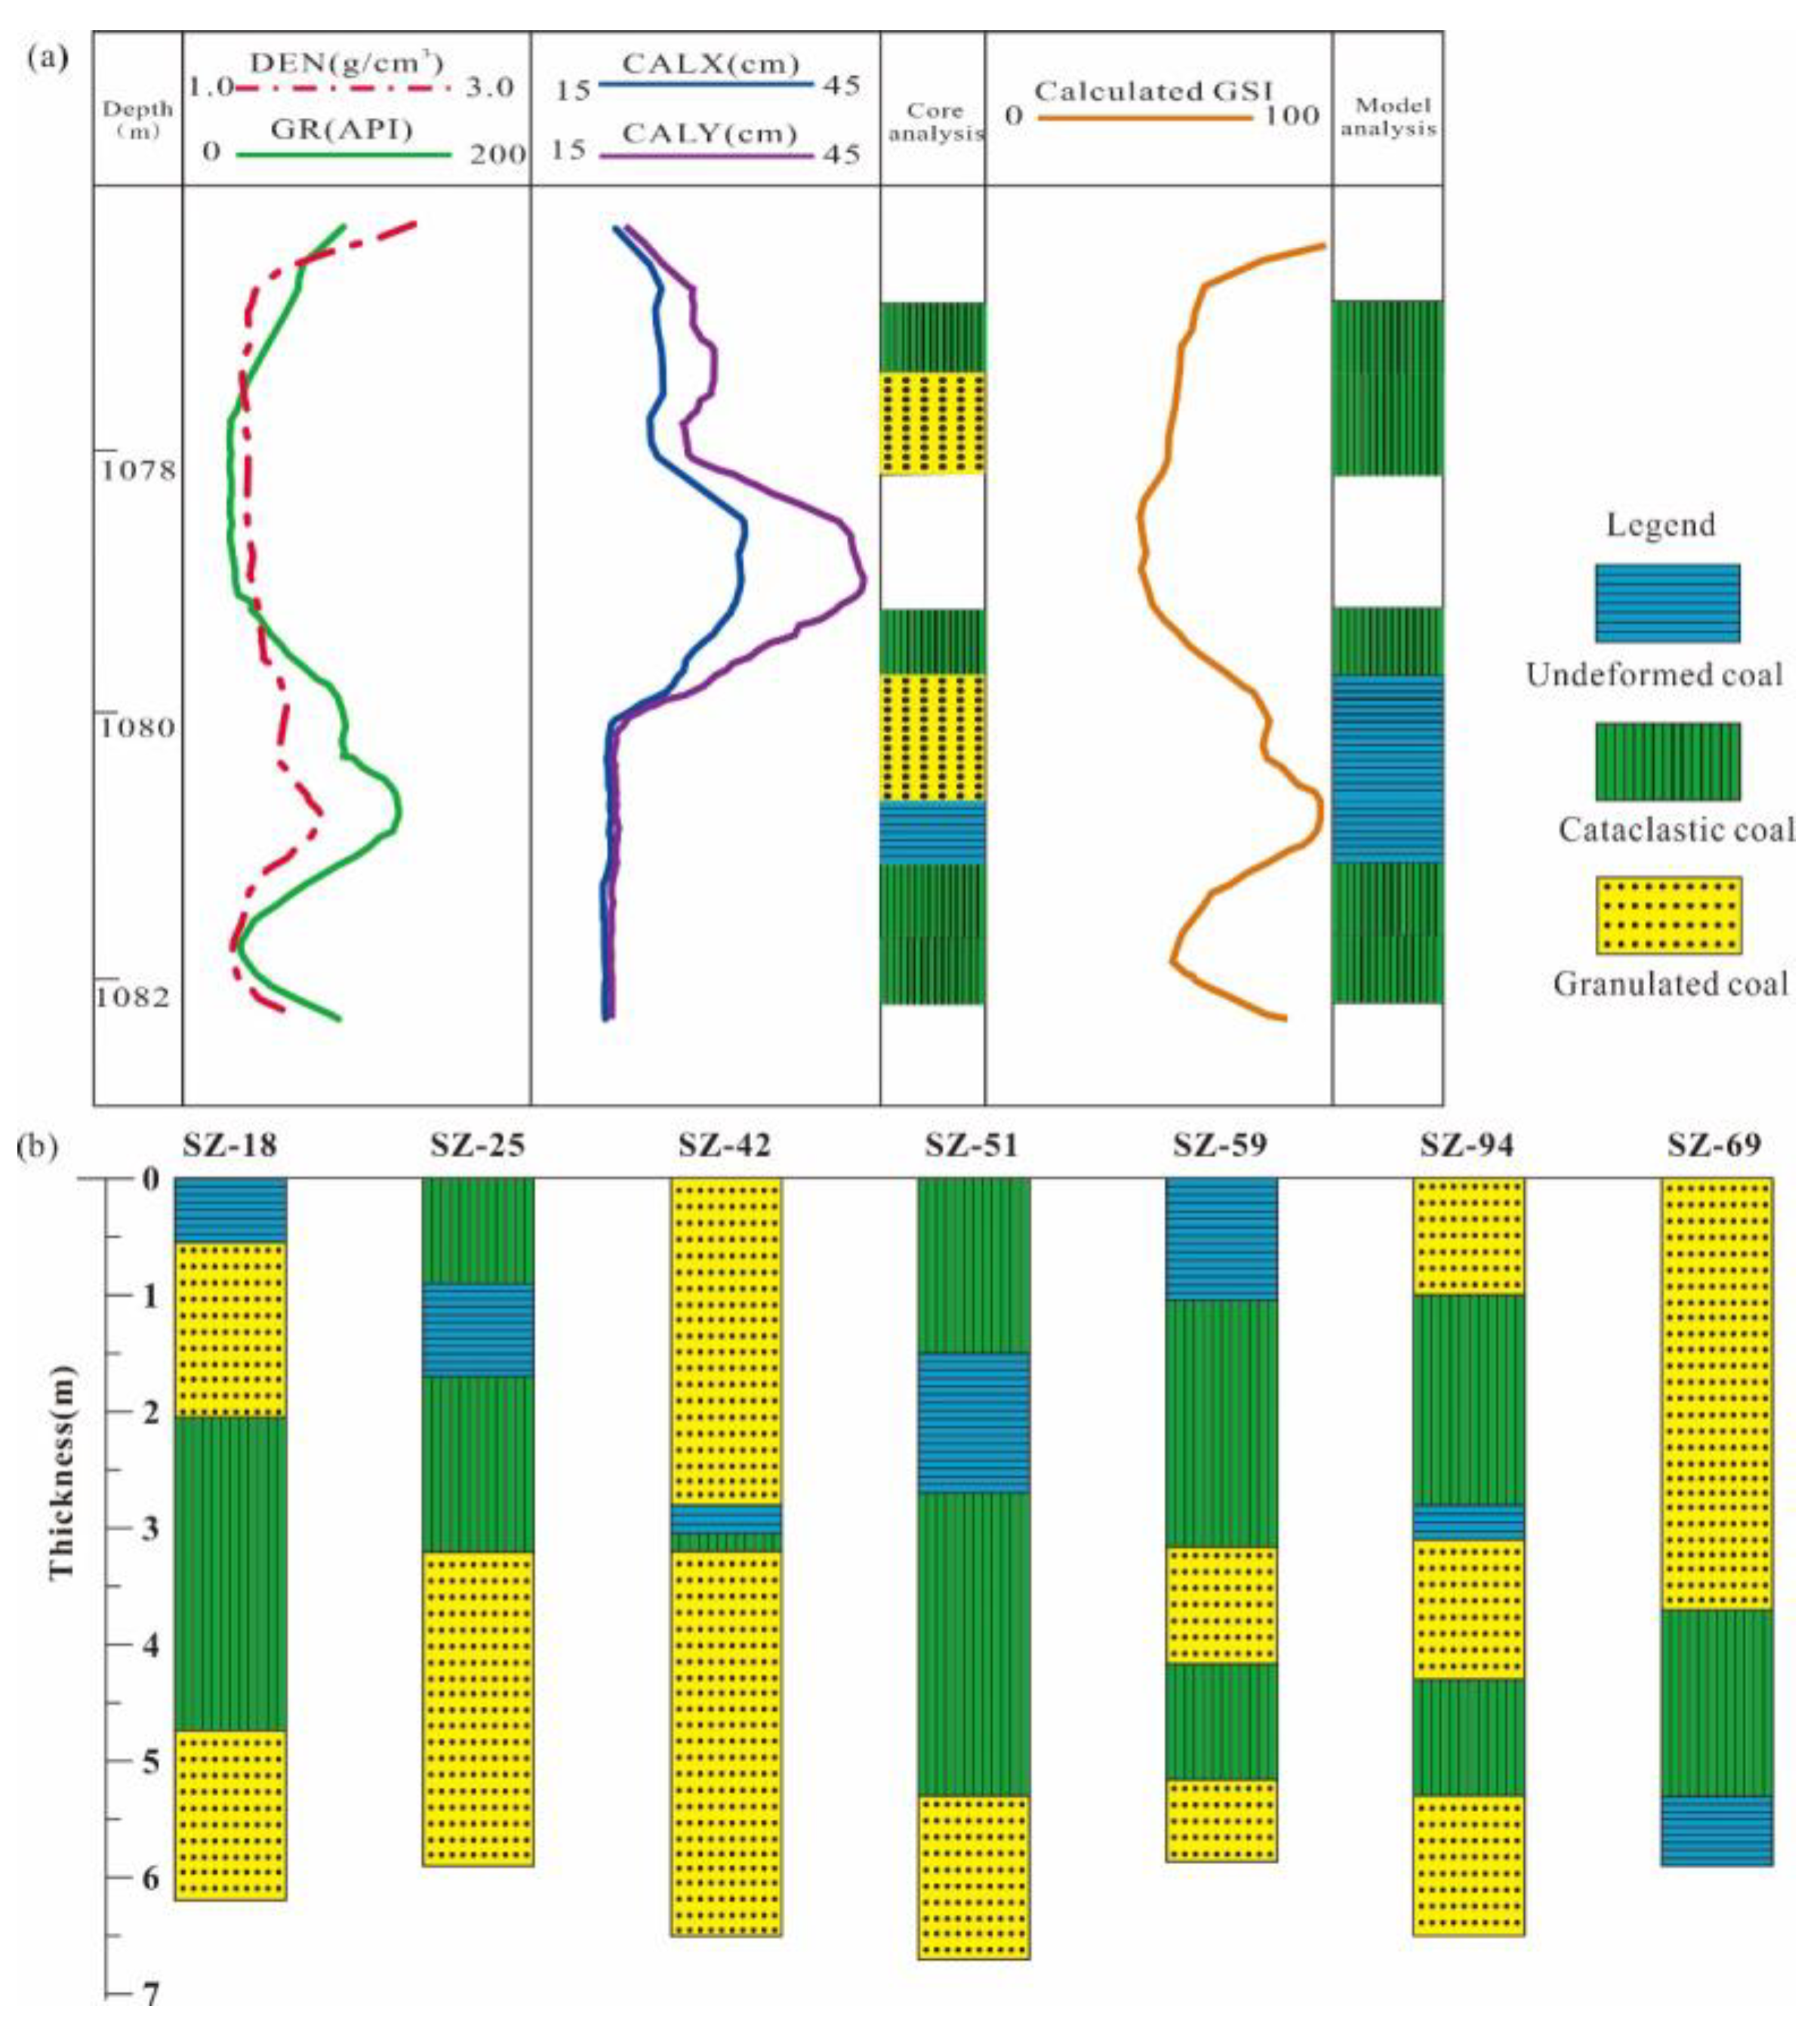
3.1. Quantitative Characterisation of Coal Structure

Traditionally, according to the degree of deformation of coal, coal structures are classified into four types: undeformed coal, cataclastic coal, granulated coal, and mylonite coal [55]. It is difficult to combine this classification methodology with logging curves [56]. To establish the relationship between the logging response value and the four types of coal structures, some researchers have replaced the structural weathering of the traditional GSI diagram with the width and filling of fractures in the coal and use GSI to quantify the four types of coal structures in combination with drilling coring data [43,44]. The same goes for the present work: the GSI of typical coal structures is shown in Shizhuangnan Block in Figure 3.
Representative coring samples were selected for observation in Shizhuangnan Block. According to the GSI classification standard, the coal structure of the sample is quantitatively characterised. Correlation analysis is conducted between GSI and typical parameters of the logging curve (Figure 4).
Due to the logging curve’s susceptibility to drilling, well completion, and geological conditions, there is a certain correlation between GSI value and DEN, GR, CALX, and CALY, but the correlation is weak. To improve prediction accuracy and practical production application, a multiple regression model is established by using multiple logging parameters from 39 core samples from 10 stratigraphic wells. The multi-parameter formula is as follows for the GSI:
G S I = a D E N + b G R + c C A L X + d C A L Y + e
The coefficients are calculated by fitting: a = 50.40, b = 0.222, c = −0.42, d = −0.407, e = 0.539, R2 = 0.856, and sig = 0.000 < 0.005. The prediction accuracy is thus improved.
According to (1), the GSI value of coal seam segment is judged and the accuracy of the model is further verified in terms of CBM well coring. GSI values are calculated in the coal seam segments of a typical well (Figure 5). The comparison of coal identification by calculating GSI values and coring shows slight differences.

3.2. Hydraulic Fracturing Effects

3.2.1. Prediction of the Original Permeability of a Coal Reservoir

Representative coal samples of different coal structures were selected and compared with a GSI chart to obtain GSI values of the samples. The initial permeability of coal samples was measured; furthermore, previous research results were collected [57]. Based on these data, the GSI value and initial permeability of coal structure were fitted, and the relationship between them established. The permeability reaches its maximum when the GSI is 53.70 (Figure 6). The permeability decreases when the coal reservoir remains either quite intact or severely broken. The smaller the GSI value is, the more broken, or even powdered, the coal. The resulting fractures transected each other in the early stage, which led to the decrease of permeability. With increasing GSI value, the coal structure transitioned to that of a cataclastic coal. When the stress increased, the coal would yield and be destroyed. The internal cracks in the coal would further expand and connect, and macroscopic cracks formed, thus increasing the permeability. When the GSI increased continuously, the coal structure would transition to an undeformed structure (this was intact). With increasing stress, the pores and fractures were closed and the permeability decreased. According to the relationship between GSI and permeability, the original permeability of selected well was calculated in the Shizhuangnan Block.

3.2.2. Permeability Prediction Model for Coal Reservoirs Post Hydraulic Fracturing

(1) The concept
The fracturing of reservoir should, as a process, follow three assumptions: first, artificial fractures can be represented by the Khristianovic-Geertsma de Klerk (KGD) model [58,59]; second, the flow of fracturing fluid obeys Darcy’s law in the coal reservoir; third, the fracturing fluid does not break through the top or bottom of the coal seam during fracturing [60]. Based on the above assumptions, the steps of establishing the post-fracturing permeability prediction model are as follows: firstly, according to the KGD model, fracturing curve and percolation theory, the filter loss of fracturing fluid is calculated during fracturing. Secondly, the relationship between the pressure drop and the time of instantaneous shut-in is analysed as per Horner’s method and pressure drop curves when pumping is stopped. Finally, through coupling analysis of filter loss, pressure-drop curves, and total fracturing fluid volumes, a predictive model of post-fracturing permeability is established [61].
(2) Filter loss of fracturing fluid during fracturing
Generally, the following assumptions should be followed: the fracturing fluid is filtered from top to bottom during fracturing and the fracturing fluid follows the rule of parallel flow in the plane of the flat-plate model during filtration. The permeability is equal within the range of fracturing. When following these assumptions, the seepage velocity υ can be obtained from Darcy’s law:
υ = Q 1 A t 1 = k d p μ d x
In Equation (2): υ is the seepage velocity of fracturing fluid, m/s; Q1 is the filtration loss of fracturing fluid during fracturing, m3; A is the area of fracturing cracks, m2; k is the post-fracturing permeability, μm2; t1 is fracturing time, s; μ is the liquid viscosity, MPa · s; p is the flow pressure at filter flow distance x in the fracturing fluid, MPa.
According to the KGD model, the width can be expressed during fracturing by Equation (3):
w ( x ) = 4 σ E ( 1 ν 2 ) L 2 x 2
In Equation (3): σ is the net pressure, MPa; E is the Young’s modulus, MPa; ν is Poisson’s ratio; L is the half-length of the crack, m; w(x) is the crack width at x, m.
According to the law of volume conservation during fracturing, it can be concluded that:
Q t = 2 0 L h w ( x ) d x + Q 1
In Equation (4): Qt is the amount of fracturing fluid during fracturing, m3; h is the thickness of the coal seam, m.
By combining Equations (3) and (4), the half-length of the crack can be obtained as follows:
L = E ( Q t Q 1 ) 2 h σ π ( 1 ν 2 )
Combined with Equations (2) and (5), the filter loss of fracturing fluid can be obtained during fracturing as follows:
Q 1 = 2 k ( σ p e ) t 1 [ 2 k ( σ p e ) t 1 + μ h 2 ] Q t
In Equation (6): pe is the reservoir pressure, MPa.
(3) Pressure and time upon pressure-drop
According to the fracturing curves, the instantaneous shut-in pressure was obtained. In the case of no connection with existing geological faults, the reservoir pressure generally starts to drop after pumping is stopped to extend the crack post-fracturing. Therefore, based on the Horner curve and the principle of injection/pressure-drop testing of permeability, the relationship between reservoir pressure and time after cessation of pumping is as follows:
p ( t ) = 2.12 × 10 3 Q 2 μ B Δ t k h lg t + [ p i 2.12 × 10 3 Q 2 μ B Δ t k h × ( lg k φ μ C t r w 2 + 0.9077 + 0.8686 S ) ]
To:
a = 2.12 × 10 3 Q 2 μ B Δ t k h , b = p i 2.12 × 10 3 Q 2 μ B Δ t k h × ( lg k φ μ C t r w 2 + 0.9077 + 0.8686 S ) p ( t ) = a lg t + b
In Equation (7), Q2 is the amount of fracturing fluid at the beginning of filtration after the pump is stopped, m3. φ is the porosity, %; Δt refers to the time taken to reduce the reservoir pressure after cessation of pumping on the ground, s; rw is the wellbore radius, m; Ct is the volume comprehensive compression coefficient; S is the epidermal coefficient; B is the formation volume coefficient of water.
The pressure and time of the cessation of pumping are pt and t2. When the pressure drops to the reservoir pressure, substituting pt and t2 into Equation (8), we obtain the time of filtration stopping t3, Δt = t3t2, namely:
Δ t = ( 10 p t p e a 1 ) t 2
(4) Prediction of post-fracturing permeability
According to the Horner curve:
h k = 2.12 × 10 3 Q 2 μ B a Δ t
According to the conservation of volume:
Q 1 + Q 2 = Q t
Combining Equations (6) and (11):
Q 2 = Q t Q 1 = μ h 2 [ 2 k ( σ p e ) t 1 + μ h 2 ] Q t
Combining Equations (10)–(12), the prediction model of post-fracturing permeability can be obtained as follows:
k = μ { a Δ t h 2 + [ h 4 a 2 Δ t 2 16.96 × 10 3 a B h t 1 × Δ t Q t ( σ p e ) ] 1 / 2 } 4 a t 1 Δ t ( σ p e )

4. Results and Discussion

4.1. Classification of Reservoir Types with Different Coal Structures

4.1.1. Identification of Different Coal Structures

The complete set of logging data were collected from 100 CBM wells, but most of them have no drilling coring record. According to the method of GSI quantitative characterisation of coal structure, the coal structure is identified and stratified on the No. 3 coal seam. Each coal structure represents one layer coal. For SZ-68 well: it has one layer undeformed coal, two layers cataclastic coal and two layers soft coal, for a total of five layers of coal. The total thickness proportion of coal structure is 100%. The stratification, thickness and proportion of different coal structures of the selected wells are listed in Table 1.

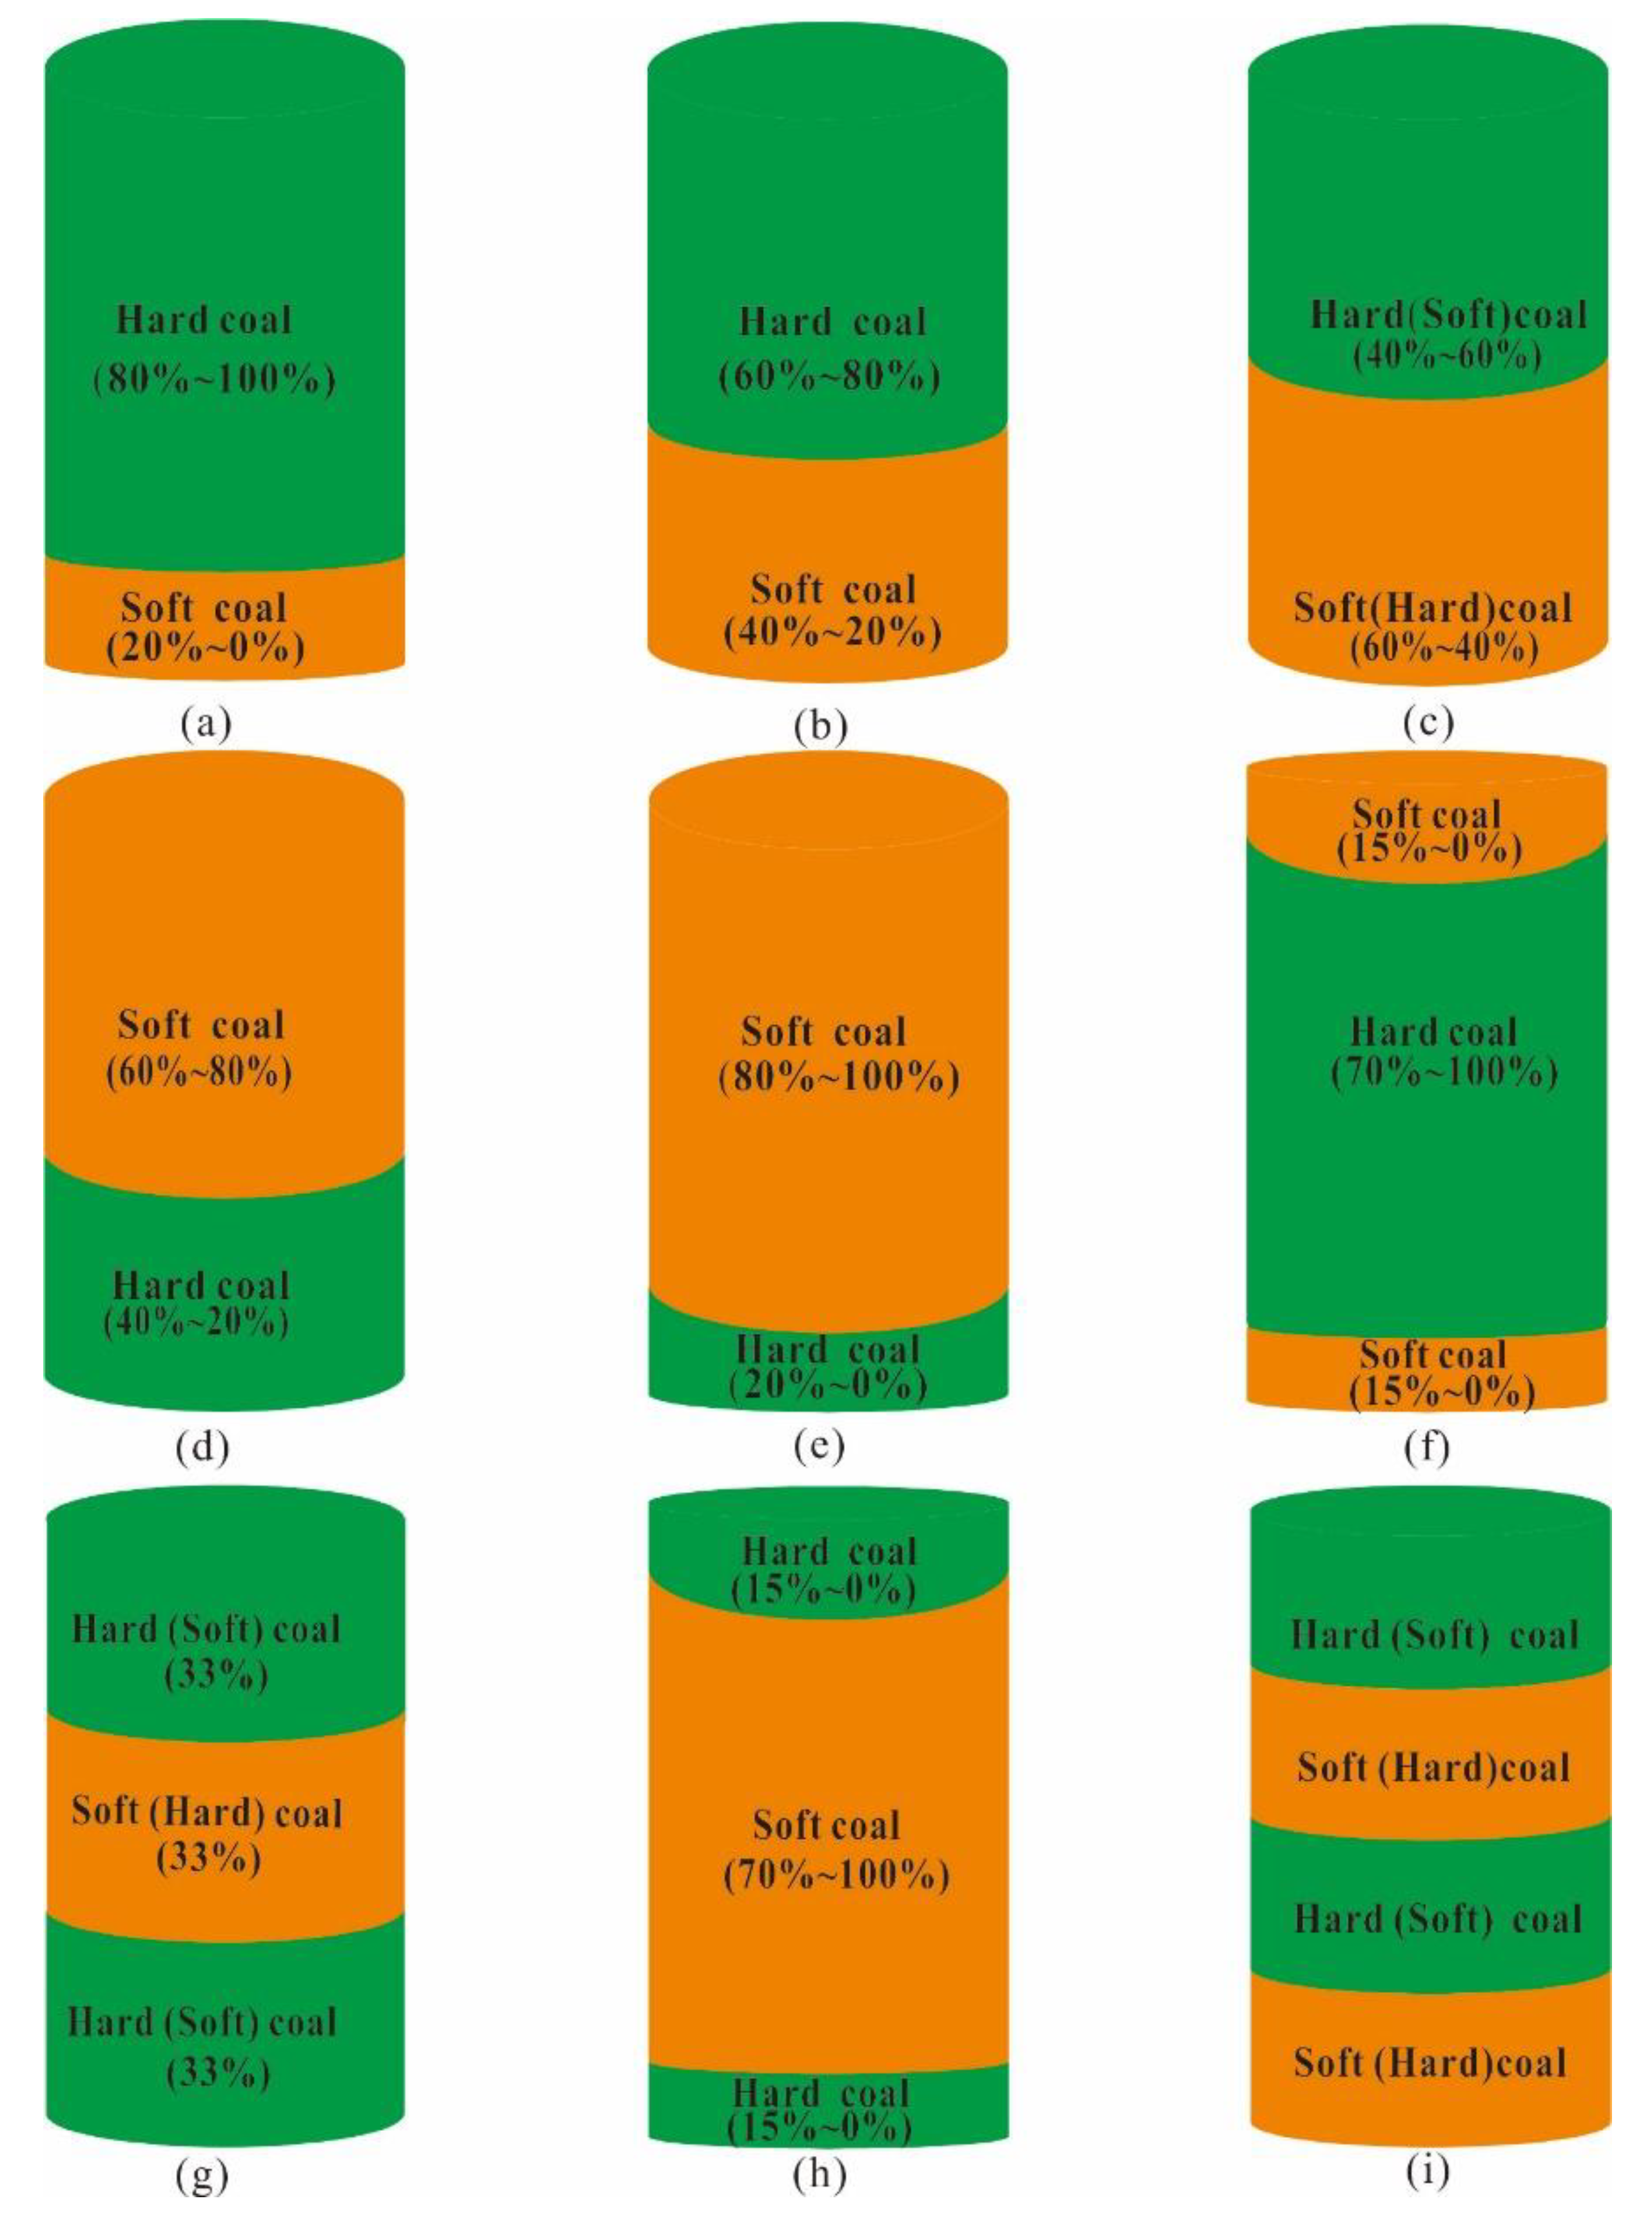
4.1.2. Classification of Reservoir Type by Proportion and Combination of Different Coal Structures

Coal reservoir types are classified based on the longitudinal thickness (from the vertical direction of coal seam), proportion, and spatial combination of different coal structures. The coal reservoirs can generate new fractures and are beneficial to reservoir reconstruction during fracturing because of the high strength and hardness of both the undeformed, and cataclastic, coal, while the reservoir is bad for reservoir reconstruction because of the crushing of granulated, and mylonite, coal [62]. For the analysis, the undeformed, and cataclastic coal are classified as hard coal and granulated, and mylonite coal are classified as soft coal [63].
It can be seen from Table 1 that the No. 3 coal seam is generally composed of up to six coal seams with different coal structures in the study area, and the range of the proportion of different coal structures varies significantly within the coal seam. In the whole No.3 coal seam, the proportion of undeformed coal ranges from 0 to 63% and the average proportion thereof is 15%. The proportion of cataclastic coal ranges from 0 to 98% and the average proportion thereof is 40%. The total thickness proportion of undeformed coal and cataclastic coal (hard coal) ranges from 0 to 100%, and the average proportion thereof is 56%; the thickness proportion of granulated coal and mylonite coal (soft coal) ranges from 0 to 100%, and the average proportion thereof is 44%.
The coal reservoir is not only subject to a large range of fluctuation in the proportion of different coal structures, but also exhibits significant differences in the longitudinal distribution of different coal structure combinations, indicating the strong heterogeneity of the coal seam. Based on the identification results of coal structure, the coal reservoir spatial combination types are classified into up-down type, intervening interval type and multi-layer superposition type by using the identification method of hard coal and soft coal.
In consideration of the combined types and proportions of different coal structure coal, the coal reservoir is classified into one of nine types (except 12 no-gas wells) (Figure 7). According to the thickness proportion of hard coal, up-down type reservoirs are classified into five types, including up-down type I, up-down type II, up-down type III, up-down type IV, and up-down type V reservoirs. Up-down type I: the up is hard coal and its thickness proportion is 80–100%; the down is soft coal and its thickness proportion is 20–0%. Up-down type II: the up is hard coal and its thickness proportion is 60–80%; the down is soft coal and its thickness proportion is 40–20%. Up-down type III: the up is hard coal and its thickness proportion is 40–60%; the down is soft coal and its thickness proportion is 60–40%. Up-down type IV: the up is soft coal and its thickness proportion is 60–80%; the down is hard coal and its thickness proportion is 40–20%. Up-down type V: the up is soft coal and its thickness proportion is 80–100%; the down is hard coal and its thickness proportion is 20–0%. Similarly, intervening interval type reservoirs are classified into three types, including intervening interval type I, intervening interval type II, and intervening interval type III reservoirs. Intervening interval type I: the up is soft coal and its thickness proportion is 15–0%; the middle is hard coal and its thickness proportion is 70–100%; the down is soft coal and its thickness proportion is 15–0%. Intervening interval type II: the up and the down are hard coal or soft coal and their thickness proportions are respectively 33%; the middle is soft coal or hard coal and its thickness proportion is 33%. Intervening interval type III: the up is hard coal and its thickness proportion is 15–0%; the middle is soft coal and its thickness proportion is 70–100%; the down is hard coal and its thickness proportion is 15–0%. The coal reservoir is of multi-layer superposition type when hard coal and soft coal appear alternately (representing a complex coal reservoir).

4.2. Effects of Hydraulic Fracturing with Different Fracturing Curves

4.2.1. Classification of Hydraulic Fracturing Curves

The hydraulic fracture curves were from the Shizhuangnan Block. Each fracturing curve shows the relationship between oil pressure, displacement, sand ratio, and construction time. It is mainly composed of pressure-time, displacement-time, and sand ratio-time data. The pressure can directly reflect the underground dynamic pressure changes arising in the construction process. The displacement and sand ratio reflect the construction situation, and the information pertaining to fracture propagation and fluid migration in the reservoir can be obtained by combining the pressure curves with the displacement and sand ratio curves. According to the characteristic change of oil pressure curves, combined with morphological characteristics of the displacement curves, sand curves and their inter-relationship [43], fracturing curves from 100 wells were analysed and classified into four categories (with eight sub-categories). Typical fracturing curves are shown in Figure 8.
(1) Stable type
Stable type is classified into stable type I (stable all the time) and stable type II (down to stable). Stable type I is described as follows: the variations of pressure are less than 0.5 MPa. then it increases for a while and remains almost unchanged for a long time when the coal seam is fractured and the displacement is basically unchanged. The overall pressure is very stable. The difference between stable type II and stable type I is mainly that the pressure gradually decreases at the beginning of construction. The pressure remains quasi-constant when it decreases to a certain value.
The reason for stable type I formation may be that the coal structure is dominated by cataclastic coal and granulated coal, thus leading to development of many endogenous cracks and a low fracture-initiation pressure in the coal. Such reservoirs are more conducive to fracture formation. Additionally, with the continuous expansion of fractures, the loss of fracturing fluid also increases, and the pressure of fracturing fluid decreases in the direction of fracture extension as well as the width of the fracture decreasing. When filtration and crevices are in fluid flow balance, the crevice will not expand at all and the fracturing curve is relatively ideal.
The reason for stable type II formation may be that the coal structure is dominated by cataclastic coal and undeformed coal, which causes slight reservoir pollution near the wellbore. When the reservoir begins to fracture, the pressure is required to break through the polluted zone. The reservoir is mainly based on the initiation of new fractures and the artificial fractures are relatively stable with few branch fractures thereon: the fracturing curve is then optimal.
(2) Descending type
The descending type is classified into descending type I (descending all the way) and descending type II (fluctuating and descending). Descending type I is mainly described as follows: with a dropping-pressure of more than 3 MPa from the beginning to cessation of pumping, the pressure keeps dropping during fracturing. Descending type II entails a pressure rising then falling many times with an overall decline if more than 3 MPa.
The reason for descending type I occurring may be that the coal structure is mainly of an undeformed type. There is only a small polluted zone near the wellbore, and it is generally removed by the fracturing fluid. When the fracturing fluid filtration volume remains the same, the crack quickly extends outward or forms many cracks, thus causing the drop in fluid pressure. The fracturing fractures conduct natural fractures in the coal and the fracturing curve is conducive to CBM production.
The reason for the occurrence of descending type II behaviour may be that the CBM wells have a high enlargement rate and produce gas in inclined wells. Moreover, with a high enlargement rate, the perforation effect is usually non-ideal and the fracturing fluid does not readily conduct natural fractures in the coal, therefore, the fracturing effect may be moderate.
(3) Rising type
The rising type is classified into rising type I (rising all the way) and rising type II (fluctuating and rising). Rising Type I is mainly described as follows: the pressure keeps rising during fracturing and it rises by more than 3 MPa from the beginning to cessation of pumping. Rising type II mainly entails many pressure cycles with an overall rising of greater than 3 MPa.
The reason for the occurrence of rising type I behaviour may be that the coal structure is mainly of the granulated type. The reservoirs were polluted during the process of drilling, well completion, and fracturing. To break through the damage zone, the pressure tended to increase. The fracturing fracture was difficult to expand, hindering proppant migration and the fracturing effect may be poor.
The reason for the occurrence of rising type I may be that the coal reservoir was polluted near the wellbore, resulting in a high fracture pressure. The coal structure was broken, which led to sand plugging and significant fracturing fluid filtration.
(4) Fluctuating type
Fluctuating type behaviour is classified into fluctuating type I (small fluctuations) and fluctuating type II (large fluctuations). Fluctuating type I is described mainly by a pressure falling then rising many times during fracturing. The construction pressure does not exceed 3 MPa and the oscillation amplitude is less than 3 MPa throughout. The difference between fluctuating type I and fluctuating type II is that the oscillation amplitude of the construction pressure is greater than 3 MPa.
The reason for fluctuating type I behaviour occurring may be that the coal structure is relatively broken, and there are many cracks and pores therein. On the one hand, the pores are small and sand plugging readily occurs; on the other, the fracturing fluid undergoes too much filtration in the reservoir, which may eventually lead to a poor fracturing effect.
The reason for fluctuating type II behaviour arising may be that the reservoir was polluted near the wellbore. The fracturing fluid is mainly used to make joints and extend cracks in hard coal, the proppant effect is diminished in the fracture, and the fracturing effect may be poorer.

4.2.2. Fracturing Effect of Hydraulic Fracturing Curves

The original permeability and the post-fracturing permeability are calculated from the 88 selected CBM wells (Figure 9). Compared with the original permeability, post-fracturing permeability generally increased. The growth multiple of pre-fracture and post-fracture permeability can represent fracturing effects of fracturing curves of different types, however, the post-fracturing permeability is low when the original permeability is very low and the reservoir has a higher growth multiple of pre-fracture and post-fracture permeability; besides, post-fracturing permeability is high when the original permeability is very high and the reservoir has a lower growth multiple of pre-fracture and post-fracture permeability. To some extent, the growth multiple of pre-fracture and post-fracture permeability cannot really reflect the fracturing effect, therefore, the difference between the original permeability and post-fracturing permeability is used to reflect fracturing effect.
From Figure 9, the permeability difference of stable type II fracturing curves is generally higher and its average permeability difference is 8.91 × 10⁻³ μm2; the permeability difference of stable type I fracturing curves is also higher and its average permeability difference is 6.40 × 10⁻³ μm2. The permeability difference of descending type II fracturing curves is followed by stable fracturing curves and its average permeability difference is 5.00 × 10⁻³ μm2. The permeability difference of descending type I fracturing curves is slightly smaller than that of descending type II curves and its average permeability difference is 4.66 × 10⁻³ μm2. Beginning with the fluctuating type I fracturing curves, the permeability difference is generally small, and its average permeability difference is 1.91 × 10⁻³ μm2. The average permeability difference of rising type I fracturing curves is 0.96 × 10⁻³ μm2. The permeability difference of fluctuating type II fracturing curves is also generally small, and its average permeability difference is 0.61 × 10⁻³ μm2. Compared with fracturing curves of other types, the permeability difference of rising type II fracturing curves is the smallest and its average permeability difference is only 0.29 × 10⁻³ μm2. Combined with production data relating to drainage, the average gas production rate is about 1000 m3/d when the difference of original permeability and post-fracturing permeability exceeds 8 × 10⁻³ μm2; the average rate of gas production is about 800 m3/d when their difference is between 5 × 10⁻³ and 8 × 10⁻³ μm2; the average rate of gas production is about 500 m3/d when their difference is between 3 × 10⁻³ and 5 × 10⁻³ μm2; the average rate of gas production is less than 500 m3/d when their difference is less than 3 × 10⁻³ μm2. In summary, the fracturing curve of fracturing effects of different reservoir types is ranked (in descending order) as: stable type II, stable type I, descending type II, descending type I, fluctuating type I, rising type I, fluctuating type II, then rising type II.

4.3. Fracturing Effect of Reservoir Types with Different Coal Structure Combinations

The fracturing curves can directly reflect the fracturing effect in CBM wells [39,40,43]. Therefore, the types of fracturing curves were analysed for different coal reservoir types. Then the fracturing effects of fracturing curves of different types were used to analyse and qualitatively evaluate the fracturing effects of different coal reservoir types.
According to Section 4.1.2, the coal reservoir is classified into nine different types, including up-down type I, up-down type II, up-down type III, up-down type IV, up-down type V, intervening interval type I, intervening interval type II, intervening interval type III, and multi-layer superposition type. Combined with morphological characteristics of the fracturing curves, the fracture curve types with different coal reservoir types were classified (Figure 10).
According to Figure 10, the fracturing curves of an up-down type I reservoir are mainly stable and of descending type; the fracturing curves of an up-down type II reservoir are dominated by descending fracturing curves, with one stable type I well and one stable type II well; the fracturing curves of an up-down type III reservoir are mainly of the fluctuating type and ascending type and one well is of descending type II; the fracturing curves of an up-down type IV reservoir are mainly of the descending and fluctuating type; the fracturing curves of an up-down type V reservoir are all of the rising and fluctuating type. The fracturing curves of an intervening interval type I reservoir are all stable and of the descending type; the fracturing curves of an intervening interval type II reservoir include stable, descending, rising, and fluctuating types; the fracturing curves of an intervening interval type III reservoir are mainly of rising type II, with fluctuating and rising type I curves. The fracturing curves of multi-layer superposition type are distributed from the stable type to the fluctuating type, but mainly embody the fluctuating type and the rising type.
According to the fracturing curves of reservoir type with different coal structure combinations, and the fracturing effects of different reservoir types, the fracturing effects of the reservoir are analysed in terms of their different coal structure combinations. From Figure 10, the up-down type I and intervening interval type I reservoir mainly have stable fracturing curves, but the former has a relatively higher stable type II fracturing curve. This is because the two types of reservoir contain similar proportions of hard coal. Compared with hard coal, soft coal has a lower hardness, a lower fracture pressure, and large differences in physical properties. The interlayer effect is significant when a hard coal and a soft coal appear in the same coal reservoir. For example, when a coal reservoir is composed of hard coal and soft coal with the hard coal on the top and the soft coal on the bottom, the soft coal is first to be broken, which inhibits the extension of fractures in the hard coal during hydraulic fracturing. This affects the fracturing effect in the hard coal and the overall fracturing effect is poor. An intervening interval type I reservoir is made up of three layers coal, soft coal, hard coal, and soft coal respectively. Two layers of soft coal can inhibit extension fracture, to a greater extent than in an up-down type I reservoir, therefore, the fracturing effect is slightly poorer than that in an up-down type I reservoir.
The fracturing curves of an up-down type II reservoir are mainly of the descending type and the fracturing effect is inferior to that of up-down type I and intervening interval type I reservoirs. The fracturing curves of an intervening interval type II reservoir are mainly of the fluctuating and rising types. The fracturing effects are inferior to those in up-down type I, intervening interval type I, and up-down type II reservoirs; because such a reservoir contains either two hard coals between one soft coal, or two soft coals between one hard coal, the coal thickness proportion of different coal structures is approximately 1:1:1.
Although the descending curve of an up-down type IV reservoir is above than that of an up-down type III reservoir, the thickness of hard coal in an up-down type III reservoir accounts for a higher proportion of the total thickness and the ratio of the thickness of hard coal and soft coal is approximately 1:1. The interlayer influence is relatively small, so the fracturing effect is better than that in an up-down type IV reservoir.
The fracturing curves of intervening interval type III and up-down type V reservoirs are all of the rising type and fluctuating type, but the rising type II curve of the former occurs more often than the latter, so the fracturing effect is inferior to the latter. The thickness proportion of soft coal is over 70% in both reservoirs, but the former reservoir contains soft coal between two layers of hard coal, so is significantly affected by interlayer effect, so the fracturing effect is relatively poor. Multi-layer superposition reservoir is dominated by fluctuating and rising curves, but other types of curves are also distributed therein, indicating that the reservoir type is complex, and the operators should select an appropriate fracturing technique. Therefore, the overall fracturing effect in this type of reservoir is better than that of intervening interval type III reservoirs.
In conclusion, up-down type I and type II reservoirs (proportion of hard coal >60%) and interval type I reservoirs (proportion of hard coal >70%) are prone to form stable and descending fracturing curves, resulting in good fracturing effects. Interval type II (hard coal:soft coal:hard coal or soft coal:hard coal:soft coal approximate 1:1:1) and up-down type III (hard coal:soft coal =1:1) form descending type II, rising type I, and fluctuating type I fracturing curves, followed by good fracturing effect; up-down type IV and V reservoirs (proportion of hard coal <40%), interval type III reservoirs (proportion of hard coal <30%), and multi-layer type reservoirs are prone to form fluctuating and rising fracturing curves, with poor fracturing effects. The fracturing effect is ranked (in descending order) as: up-down type I, intervening interval type I, up-down type II, intervening interval type II, up-down type III, up-down type IV, up-down type V, multi-layer superposition type, and intervening interval type III reservoirs.

5. Conclusions

The main conclusions are as follows:
(1)
The fracturing curves are mainly of the descending or stable types when the hard coal ratio is above 70%, and the fracturing effect is good. The fracturing curves are mainly of fluctuation, or rising types when the soft coal ratio is above 50%, which has a negative effect on the exploitation of coalbed methane.
(2)
For coal with different coal structure combinations, hard coal often cannot be easily transformed because of their different mechanical properties when conventional hydraulic fracturing technology is used to fracture the whole coal segment.
(3)
The hard coal is only fractured for the up-down coal reservoir. The intervening interval coal reservoir is used to perforate the middle hard coal by staged fracturing. The multi-layer superposition coal reservoir is reformed by top coal fracturing.

Author Contributions

Y.W. and X.N. conceived the ideas; D.L. analysed the data and wrote the paper; J.F. provided language support; C.T., X.W., and S.Z. provided technical support. All authors have read and agreed on the published version of the manuscript.

Funding

This work was supported by the National Science and Technology Major Project of China (Grant Nos 2017ZX05064003 and 2016ZX05066001-002).

Acknowledgments

We thank China United Coalbed Methane Corporation for providing the production well date.

Conflicts of Interest

The authors declare no conflict of interest.

Nomenclature

Roman Symbols
AArea of fracturing cracks, m2
Q1Filtration loss of fracturing fluid during fracturing, m3
Q2Amount of fracturing fluid at the beginning of filtration after cessation of pumping, m3
QtAmount of fracturing fluid during fracturing, m3
kPost-fracturing permeability, μm2
t1Fracturing time, s
pFlow pressure, MPa
E Young’s modulus, MPa
L Half-length of the crack, m
w(x)Crack width at x, m
ΔtTime to reduce the reservoir pressure upon cessation of pumping on the ground, s
rwWellbore radius, m
CtVolume comprehensive compression coefficient, dimensionless
SEpidermal coefficient, dimensionless
BFormation volume coefficient of water, dimensionless
peReservoir pressure, MPa
Greek Symbols
υ Seepage velocity of fracturing fluid, m/s
μ Liquid viscosity, MPa · s
σ Net pressure, MPa
ν Poisson’s ratio, dimensionless
φ Porosity, %

Abbreviations

CBMCoalbed methane
GSIGeological strength index
DENDensity
GRNatural gamma
CALXCalliper in the X-direction
CALYCalliper in the Y-direction
IFOInjection fall-off
KGDKhristianovic-Geertsma de Klerk
UCUndeformed coal
CCCataclastic coal
GCGranulated coal
MCMylonite coal

References

  1. Durucan, S.; Edwards, J.S. The effects of stress and fracturing on permeability of coal. Min. Sci. Technol. 1986, 3, 205–216. [Google Scholar] [CrossRef]
  2. Jiang, B.; Qu, Z.H.; Wang, G.X. Effects of structural deformation on formation of coalbed methane reservoirs in Huaibei coalfield, China. Int. J. Coal Geol. 2010, 82, 175–183. [Google Scholar] [CrossRef]
  3. Cao, Y.X.; Davis, A.; Liu, R. The influence of tectonic deformation on some geochemical properties of coals–a possible indicator of outburst potential. Int. J. Coal Geol. 2003, 53, 69–79. [Google Scholar] [CrossRef]
  4. Li, Y.; Yang, J.; Pan, Z. Nanoscale pore structure and mechanical property analysis of coal: An insight combining AFM and SEM images. Fuel 2020, 260, 116352. [Google Scholar] [CrossRef]
  5. Su, X.B.; Lin, X.Y.; Liu, S.B. Geology of coalbed methane reservoirs in the Southeast Qinshui Basin of China. Int. J. Coal Geol. 2005, 62, 197–210. [Google Scholar] [CrossRef]
  6. Connell, L.D.; Lu, M.; Pan, Z.J. An analytical coal permeability model for tri-axial strain and stress conditions. Int. J. Coal Geol. 2010, 84, 103–114. [Google Scholar] [CrossRef]
  7. Frodsham, K.; Gayer, R.A. The impact of tectonic deformation upon coal seams in the South Wales coalfield, UK. Int. J. Coal Geol. 1999, 38, 297–332. [Google Scholar] [CrossRef]
  8. Scott, S.; Anderson, B.; Crosdale, P. Coal petrology and coal seam gas contents of the Walloon Subgroup-Surat Basin, Queensland. Australia. Int. J. Coal Geol. 2007, 70, 209–222. [Google Scholar] [CrossRef]
  9. Pan, J.N.; Hou, Q.L.; Ju, Y.W. Coalbed methane sorption related to coal deformation structures at different temperatures and pressures. Fuel 2013, 102, 760–765. [Google Scholar] [CrossRef]
  10. Li, Y.; Yang, J.; Pan, Z. Unconventional natural gas accumulations in stacked deposits: A discussion of Upper Paleozoic coal-bearing strata in the east margin of the Ordos Basin, China. Acta. Geol. Sin-Engl. 2019, 93, 111–129. [Google Scholar] [CrossRef] [Green Version]
  11. Huang, B.X.; Liu, C.Y.; Fu, J.H. Hydraulic fracturing after water pressure control blasting for increased fracturing. Int. J. Rock Mech. Min. Sci. 2011, 48, 976–983. [Google Scholar] [CrossRef]
  12. Li, J.Q.; Liu, D.M.; Yao, Y.B. Evaluation of the reservoir permeability of anthracite coals by geophysical logging data. Int. J. Coal Geol. 2011, 87, 121–127. [Google Scholar] [CrossRef]
  13. Meng, Z.P.; Zhang, J.C.; Wang, R. In-Situ stress, pore pressure and stress-dependent permeability in the Southern Qinshui Basin. Int. J. Rock Mech. Min. Sci. 2011, 48, 122–131. [Google Scholar] [CrossRef]
  14. Xu, H.; Tang, D.Z.; Zhao, J.L. A new laboratory method for accurate measurement of the methane diffusion coefficient and its influencing factors in the coal matrix. Fuel 2015, 158, 239–247. [Google Scholar] [CrossRef]
  15. Zhao, J.L.; Tang, D.Z.; Xu, H. High production indexes and the key factors in coalbed methane production: A case in the Hancheng block, southeastern Ordos Basin, China. J. Pet. Sci. Eng. 2015, 130, 55–67. [Google Scholar] [CrossRef]
  16. Li, H. Major and minor structural features of a bedding shear zone along a coal seam and related gas outburst, Pingdingshan coalfield, northern China. Int. J. Coal Geol. 2001, 47, 101–113. [Google Scholar] [CrossRef]
  17. Li, H.Y.; Ogawa, Y. Pore structure of sheared coals and related coalbed methane. Environ. Geol. 2001, 40, 1455–1461. [Google Scholar] [CrossRef]
  18. Li, H.Y.; Ogawa, Y.; Shimada, S. Mechanism of methane flow through sheared coals and its role on methane recovery. Fuel 2003, 82, 1271–1279. [Google Scholar] [CrossRef]
  19. Li, Y.; Zhang, C.; Tang, D. Coal pore size distributions controlled by the coalification process: An experimental study of coals from the Junggar, Ordos, and Qinshui basins in China. Fuel 2017, 206, 352–363. [Google Scholar] [CrossRef]
  20. Belyadi, H.; Fathi, E.; Belyadi, F. Hydraulic Fracturing in Unconventional Reservoirs: Theories, Operations, and Economic Analysis; Gulf Professional Publishing: Cambidge, UK, 2017. [Google Scholar]
  21. Liu, J.; Yao, Y.; Liu, D.; Xu, L.; Elsworth, D.; Huang, S.; Luo, W. Experimental simulation of the hydraulic fracture propagation in an anthracite coal reservoir in the southern Qinshui basin, China. J. Petrol. Sci. Eng. 2018, 168, 400–408. [Google Scholar] [CrossRef]
  22. Yegireddi, S.; Uday Bhaskar, G. Identification of coal seam strata from geophysical logs of borehole using Adaptive Neuro-Fuzzy Inference System. J. Appl. Geophys. 2009, 67, 9–13. [Google Scholar] [CrossRef]
  23. Fu, X.H.; Qin, Y.; Wang, G.X.; Rudolph, V. Evaluation of coal structure and permeability with the aid of geophysical logging technology. Fuel 2009, 88, 2278–2285. [Google Scholar] [CrossRef]
  24. Fu, X.H.; Qin, Y.; Wang, G.X.; Rudolph, V. Evaluation of gas content of coalbed methane reservoirs with the aid of geophysical logging technology. Fuel 2009, 88, 2269–2277. [Google Scholar] [CrossRef]
  25. Chen, Y.; Tang, D.Z.; Xu, H. The distribution of coal structure in Hancheng based on well logging data. J. China Coal Soc. 2013, 38, 1435–1442. [Google Scholar]
  26. Hu, X.; Yang, S.; Zhou, X. A quantification prediction model of coalbed methane content and its application in Pannan coalfield, Southwest China. J. Nat. Gas Sci. Eng. 2014, 21, 900–906. [Google Scholar] [CrossRef]
  27. Teng, J.; Yao, Y.B.; Liu, D.M. Evaluation of coal texture distributions in the southern Qinshui basin, North China: Investigation by a multiple geophysical logging method. Int. J. Coal Geol. 2015, 140, 9–22. [Google Scholar] [CrossRef]
  28. Hou, Y.H.; Yao, Y.B.; Yang, Y.H. Discriminate method of coal structure based on correspondence analysis technology: A case study in the Anze area, Qinshui Basin. J. China Coal Soc. 2016, 41, 2041–2049. [Google Scholar]
  29. Chen, J.; Huang, W.H.; Lu, X.X. Quantitative analysis on tectonically deformed coal and its physical properties in Shizhuang area of Qinshui Basin. J. China Coal Soc. 2017, 42, 732–737. [Google Scholar]
  30. Tang, S.; Tang, D.; Li, S.; Xu, H.; Tao, S.; Geng, Y.; Ma, L.; Zhu, X. Fracture system identification of coal reservoir and the productivity differences of CBM wells with different coal structures: A case in the Yanchuannan Block, Ordos Basin. J. Petrol. Sci. Eng. 2018, 161, 175–189. [Google Scholar] [CrossRef]
  31. Peng, L.Y.; Cui, R.F.; Ren, C. Classification of coal body structure using seismic lithology inversion information. J. China Coal Soc. 2013, 38, 410–415. [Google Scholar]
  32. Feng, X.Y.; Yang, Y.H.; Zuo, Q.Q. Coal structure quantitative prediction with sensitive-attribute and parameter-inversion fusion. Oil Geophys. Prospect. 2019, 54, 1115–1122. [Google Scholar]
  33. Cao, L.; Yao, Y.; Liu, D.; Yang, Y.; Wang, Y.; Cai, Y. Application of seismic curvature attributes in the delineation of coal texture and deformation in Zhengzhuang field, southern Qinshui Basin. AAPG Bull. 2020, 104, 1143–1166. [Google Scholar] [CrossRef]
  34. Hou, H.H.; Shao, L.Y.; Guo, S.Q. Evaluation and genetic analysis of coal structures in deep Jiaozuo Coalfield, northern China: Investigation by geophysical logging data. Fuel 2017, 209, 552–566. [Google Scholar] [CrossRef]
  35. Ma, F.Y.; Fu, C.C. Advanced pattern recognition based on neural network applied in coal structure. Chin. Control Decis. Conf. 2017. [Google Scholar] [CrossRef]
  36. Hou, J. Evaluation of coalbed methane reservoirs from geophysical log data using an improved fuzzy comprehensive decision method and a homologous neural network. Geophys. Prospect. 2002, 50, 453–462. [Google Scholar] [CrossRef]
  37. Yao, J.P.; Sima, L.Q.; Zhang, Y.G. Quantitative identification of deformed coals by geophysical logging. J. China Coal Soc. 2011, 36, 94–98. [Google Scholar]
  38. Huang, B.; Qin, Y.; Zhang, W.H. Identification of the coal structure and prediction of the fracturability in the No. 8 coal reservoir, Gujiao block, China. Energy Explor. Exploit. 2018, 36, 204–229. [Google Scholar] [CrossRef] [Green Version]
  39. Ren, P.F.; Xu, H.; Tang, D.Z. The identification of coal texture in different rank coal reservoirs by using geophysical logging data in northwest Guizhou, China: Investigation by principal component analysis. Fuel 2018, 230, 258–265. [Google Scholar] [CrossRef]
  40. Wang, Y.J.; Liu, D.M.; Cai, Y.D. Evaluation of structured coal evolution and distribution by geophysical logging methods in the Gujiao Block, northwest Qinshui basin, China. J. Nat. Gas Sci. Eng. 2018, 51, 210–222. [Google Scholar] [CrossRef]
  41. Li, C.L.; Yang, Z.B.; Sun, H.S. Construction of a logging interpretation model for coal structure from multi-coal seams area. J. China Coal Soc. 2020, 45, 721–730. [Google Scholar]
  42. Shi, J.X.; Zeng, L.B.; Dong, S.Q. Identification of coal structures using geophysical logging data in Qinshui Basin, China: Investigation by kernel Fisher discriminant analysis. Int. J. Coal Geol. 2020, 217, 103314. [Google Scholar] [CrossRef]
  43. Hoek, E.; Brown, E.T. Practical estimates or rock mass strength. Int. J. Rock Mech. Min. Sci. 1997, 34, 1165–1186. [Google Scholar] [CrossRef]
  44. Hoek, E.; Marinos, P.; Benissi, M. Applicability of the geological strength index (GSI) classification for very weak and sheared rock masses. The case of the Athens Schist Formation. Bull. Eng. Geol. Environ. 1998, 57, 151–160. [Google Scholar] [CrossRef]
  45. Sonmez, H.; Ulusay, R. Modifications to the geological strength index (GSI) and their applicability to stability of slopes. Int. J. Rock Mech. Min. Sci. 1999, 36, 743–760. [Google Scholar] [CrossRef]
  46. Palmer, I.D.; Kutas, G.M. Hydraulic fracture height growth in San Juan Basin Coalbeds. Soc. Pet. Eng. 1991, 71–88. [Google Scholar] [CrossRef]
  47. Rodvelt, G. Vertical well construction and hydraulic fracturing for CBM completions. Coal Bed Methane Prospect Pipeline 2014, 101–135. [Google Scholar] [CrossRef]
  48. Zhang, X.N.; Kang, Y.S.; Jiang, S.Y. Fracturing curve types and their formation mechanism of NO.3 coal seam in Shizhuang block in Qinshui basin. J. China Coal Soc. 2017, 42, 441–451. [Google Scholar]
  49. Cai, L.; Yao, Y.B.; Zhang, Y.P. Hydraulic Fracturing Curve Types of Coal Reservoirs in Zhengzhuang Block, Qinshui Basin and their geological influence factors. Acta Petrol. Sin. 2015, 36, 83–90. [Google Scholar]
  50. Hu, Q.J.; Li, M.X.; Qiao, M.P. Analysis of key geologic factors of fracturing effect of CBM wells for high-rank coal in Southern Qinshui Basin. J. China Coal Soc. 2017, 42, 1506–1516. [Google Scholar]
  51. Bian, X.B.; Jiang, T.X.; Jia, C.G. A new post-frac evaluation method for shale gas wells based on fracturing curves. Nat. Gas Ind. B 2016, 3, 146–151. [Google Scholar] [CrossRef] [Green Version]
  52. Peng, C.; Zou, C.C.; Zhou, T.N. Factors affecting coalbed methane (CBM) well productivity in the Shizhuangnan block of southern Qinshui basin, North China: Investigation by geophysical log, experiment and production data. Fuel 2017, 191, 427–441. [Google Scholar] [CrossRef]
  53. Li, Y.; Tang, S.H.; Zhang, S.H. In situ analysis of methanogenic pathways and biogeochemical features of CBM co-produced water from the Shizhuangnan Block in the Southern Qinshui Basin, China. Energy Fuels 2020, 34, 5466–5475. [Google Scholar] [CrossRef]
  54. Zhang, J.; Liu, D.M.; Cai, Y.D. Geological and hydrological controls on the accumulation of coalbed methane within the No. 3 coal seam of the southern Qinshui Basin. Int. J. Coal Geol. 2017, 182, 94–111. [Google Scholar] [CrossRef]
  55. Xue, G.W.; Liu, H.F.; Li, W. Deformed coal types and pore characteristics in Hancheng coalmines in Eastern Weibei coalfields. Int. J. Min. Sci. Tec. 2012, 22, 681–686. [Google Scholar] [CrossRef]
  56. Su, X.B.; Lin, X.Y. Coalbed Methane Geology; Coal Industry Press: Beijing, China, 2009. [Google Scholar]
  57. Guo, H.Y.; Su, X.B.; Xia, D.P. Relationship of the permeability and geological strength index (GSI) of coal reservoir and its significance. J. China Coal Soc. 2010, 35, 1319–1322. [Google Scholar]
  58. Khristianovic, S.A.; Zheltov, Y.P. Formation of vertical fractures by means of highly viscous liquid. In Proceedings of the Fourth World Petroleum Congress, Rome, Italy, 6–15 June 1955; pp. 579–586. [Google Scholar]
  59. Geertsma, J.; de Klerk, J. A rapid method of predicting width and extent of hydraulic induced fractures. J. Pet. Technol. 1969, 21, 1571–1581. [Google Scholar] [CrossRef]
  60. Detournay, E. Propagation regimes of fluid-driven fractures in impermeable rocks. Int. J. Geomech. 2015, 4, 35–45. [Google Scholar] [CrossRef]
  61. Ni, X.M.; Li, Z.Y.; Wang, Y.B. Establish and Application on prediction model about permeability of coal reservoir after hydraulic fracture. Coal Sci. Technol. 2014, 42, 92–95. [Google Scholar]
  62. Hu, Q.T.; Liu, L.; Li, Q.G. Experimental investigation on crack competitive extension during hydraulic fracturing in coal measures strata. Fuel 2020, 265, 117003. [Google Scholar] [CrossRef]
  63. Xu, Y.B.; Guo, S.Q. Technology and application of staged fracturing in coalbed methane horizontal well of soft and hard coal composite coal seam. J. China Coal Soc. 2019, 44, 1169–1177. [Google Scholar]
Figure 1. Location of the study area and wells. (a) Location of the study area in China. (b) Location of the Shizhuangnan Block in southern Qinshui Basin. (c) Topography of the study area and location of the wells. (d) Stratigraphic column of the coal-bearing strata.
Energies 13 04559 g001
Figure 2. The workflow of the research.
Energies 13 04559 g002
Figure 3. GSI quantisation of coal showing typical deformation in the study area. 70–100 is undeformed coal; 50–70 is cataclastic coal; 25–50 is granulated coal; 0–25 is mylonite coal.
Energies 13 04559 g003
Figure 4. (a) The relationship between bulk density and GSI. (b) The relationship between natural gamma ray and GSI. (c) The relationship between borehole diameter of the X direction and GSI. (d) The relationship between borehole diameter of the Y direction and GSI.
Energies 13 04559 g004
Figure 5. (a) Well SZ-001 Coring and GSI values for the coal seam section of typical CBM wells. (b) Vertical distribution of coal textures in a cross-sections in the Shizhuangnan Block. The results were inferred from the GSI model.
Energies 13 04559 g005
Figure 6. The relationship between GSI value and original permeability.
Energies 13 04559 g006
Figure 7. Classification of coal reservoirs with different coal structure combination. (a) Up-down type I reservoir; (b) Up-down type II reservoir; (c) Up-down type III reservoir; (d) Up-down type IV reservoir; (e) Up-down type V reservoir; (f) Intervening interval type I reservoir; (g) Intervening interval type II reservoir; (h) Intervening interval type III reservoir; (i) Multi-layer superposition type reservoir.
Energies 13 04559 g007
Figure 8. Typical fracturing curves. (a) Stable type I. (b) Stable type II. (c) Descending type I. (d) Descending type II. (e) Rising type I. (f) Rising type II. (g) Fluctuating type I. (h) Fluctuating type II.
Energies 13 04559 g008
Figure 9. Original permeability and post-fracturing permeability and their difference with fracturing curves of different types. (a) Stable type I. (b) Stable type II. (c)Descending type I. (d) Descending type II. (e) Rising type I. (f) Rising type II. (g) Fluctuating type I. (h) Fluctuating type II.
Energies 13 04559 g009
Figure 10. Fracturing curve types of reservoir types with different coal structure combinations.
Energies 13 04559 g010
Table 1. Thickness and proportion of different coal structure in coal seam.
WellsUCCCUC + CCGC + MC
StratificationGross Thickness (m)Proportion (%)StratificationGross Thickness (m)Proportion (%)Proportion (%)StratificationGross Thickness (m)Proportion (%)
SZ-6810.35 523.15 495422.95 46
SZ-6322.70 4322.10 337621.50 24
SZ-3911.00 1620.90 153124.20 69
SZ-4810.33 522.80 444923.20 51
SZ-3710.10 226.25 9810000.00 0
SZ-7810.84 1210.75 112325.21 77
SZ-7912.06 3211.26 195123.21 49
SZ-7110.30 523.60 636821.80 32
SZ-3811.02 1610.98 153134.50 69
SZ-9410.30 522.80 434833.40 52
SZ-3321.14 1822.90 456322.40 37
SZ-6410.05 122.60 343534.95 65
SZ-9810.70 1223.50 587011.80 30
SZ-2921.81 3023.10 518121.20 19
SZ-1210.60 1024.20 677711.50 23
SZ-2100.00 024.40 676722.15 33
SZ-2610.20 323.50 535632.90 44
SZ-7510.20 412.30 434732.90 53
SZ-1622.25 3313.21 478021.34 20
SZ-2510.80 1412.40 405422.70 46
SZ-3110.36 613.40 586422.10 36
SZ-6910.60 1011.60 273723.70 63
SZ-9010.74 1110.40 61725.30 83
SZ-4510.03 100.00 0135.85 99
SZ-3220.48 823.63 596722.00 33
SZ-2810.37 611.55 243024.60 70
SZ-5510.25 424.95 808410.96 16
SZ-0410.10 123.10 454623.70 54
SZ-8900.00 020.00 0026.55 100
SZ-6622.41 3922.70 438211.10 18
SZ-0521.56 2823.80 679510.30 5
SZ-4410.97 1711.90 345112.80 49
SZ-1110.20 423.57 677121.57 29
SZ-2210.18 325.30 939610.20 4
SZ-6000.00 013.60 616122.30 39
SZ-8810.60 1014.70 778710.80 13
SZ-0611.10 1522.15 304523.85 55
SZ-3410.15 214.70 636522.65 35
SZ-8310.25 423.55 606422.10 36
SZ-0711.50 2324.80 739610.30 4
SZ-8011.50 2334.80 739610.30 4
SZ-7310.15 210.10 1326.55 97
SZ-9111.21 2021.54 264623.25 54
SZ-5410.94 1610.56 92534.50 75
SZ-9200.00 000.00 0016.90 100
SZ-6510.80 1222.10 314333.80 57
SZ-1910.53 811.21 192724.66 73
SZ-0821.89 2724.25 618810.85 12
SZ-8410.60 911.40 213024.70 70
SZ-1400.00 012.70 444423.50 56
SZ-9510.50 812.10 354323.40 57
SZ-7410.25 421.60 242824.75 72
SZ-9310.43 725.63 899610.25 4
SZ-2012.25 3423.52 538710.93 13
SZ-8711.70 2623.50 537911.40 21
SZ-6710.35 514.80 737821.45 22
SZ-1012.55 4220.59 105232.96 48
SZ-2412.60 3813.70 549210.50 8
SZ-4210.25 410.15 2616.10 94
SZ-8510.25 423.00 454923.45 51
SZ-1522.78 4311.63 256822.00 32
SZ-9711.30 1923.83 567521.67 25
SZ-0211.76 2311.30 174024.50 60
SZ-0110.43 710.90 152224.60 78
SZ-8110.80 1111.90 273814.30 62
SZ-9622.54 4011.31 206022.55 40
SZ-1711.25 1834.20 607821.50 22
SZ-8610.79 1222.17 344623.36 54
SZ-4010.78 1222.65 415323.10 47
SZ-1810.55 912.67 435222.98 48
SZ-4710.10 223.65 737511.25 25
SZ-0311.09 1724.04 648121.20 19
SZ-10010.78 1214.38 688021.25 20
SZ-3511.30 2321.90 345712.40 43
SZ-8211.30 2111.54 254623.25 54
SZ-2700.00 011.20 191925.25 81
SZ-7610.61 1023.15 506012.50 40
SZ-6111.26 1923.22 476622.31 34
SZ-3610.15 213.80 545623.05 44
SZ-7711.11 1724.22 648111.22 19
SZ-0910.28 523.21 566132.21 39
SZ-7010.93 1623.88 678321.00 17
SZ-6211.47 2310.32 52824.51 72
SZ-2321.35 2010.21 32335.33 77
SZ-7223.10 4521.25 186322.55 37
SZ-1300.00 011.75 272734.75 73
SZ-9912.58 3710.21 34024.26 60
SZ-3010.15 210.65 91126.20 89
SZ-5600.00 000.00 0016.00 100
SZ-4311.70 3023.40 609010.60 10
SZ-4112.00 3013.40 528211.20 18
SZ-4611.55 2423.85 608411.00 16
SZ-4923.79 6010.25 46422.31 36
SZ-5214.60 6322.41 339610.33 4
SZ-5311.80 2722.80 426912.10 31
SZ-5711.44 2124.54 658611.03 14
SZ-5011.45 2223.38 507221.88 28
SZ-5811.39 2410.90 164023.50 60
SZ-5111.201824.10 617911.40 21
SZ-5911.04 1823.14 547221.68 28
(Note: UC = undeformd coal; CC = cataclastic coal; GC = granulated coal; MC = mylonite coal.)

