Article

Predictive Reliability Assessment of Generation System

1
School of Electrical Engineering, Shenyang University of Technology, Shenyang 110870, China
2
Science and Technology Communication Department, State Grid Liaoning Electric Power Co. Ltd., Shenyang 110006, China
*
Author to whom correspondence should be addressed.
Energies 2020, 13(17), 4350; https://doi.org/10.3390/en13174350
Submission received: 18 July 2020 / Revised: 4 August 2020 / Accepted: 18 August 2020 / Published: 22 August 2020

Abstract

:
Due to increasing load and characteristic stagnation and fluctuations of existing generation systems capacity, the reliability assessment of generation systems is crucial to system adequacy. Furthermore, a rapid load increase could amount to a consequent sudden deficit in the generation supply before the next scheduled assessment. Hence, a reliability assessment is conducted at regular and close intervals to ensure adequacy. This study simulates and establishes the relationship between the load growth and generation capacity using the generation and load data of the IEEE reliability test system (IEEE RTS ‘96 standard). The generation capacity states and the risk model were obtained using the sequential Monte Carlo simulation (MCS) method. The load was gradually increased stepwise and is simulated against the constant generation capacity. In each case, the reliability index was recorded in terms of loss-of-load evaluation (LOLE). The recorded reliability index was thereafter fitted with the load-growth trend by the linear regression approach. A predictive assessment approach is thereafter proffered through the obtained fitting equation. In addition, a reliability threshold is effectively determined at a yield point for a reliability benchmark.

Graphical Abstract

1. Introduction

The economic growth of nations is positively impacted by their electrical power supply adequacy. The menace of inadequacy could be disastrous and catastrophic both to the consumers’ side and the utility company. This ranges from a huge loss of revenue to death in critical cases such as in the health and aviation sector, yet the insufficiency of generated power is still a natural factor during load growth. In addition, the tendency of generation plants to become derated during operation intervals is a natural factor. For instance, a hybrid generation system comprising of solar, wind, and hydro plants would have its solar capacity derated at night due to photon absence. In addition, the hydro and wind source would be most likely derated in the summer. Because the generation capacity is ideally either constant or derated while the load uniquely rises, electrical loads would experience deficit supply in the future. The reliability assessment of the generation system ensures that the available generation capacity adequately covers the consumers’ load at all times [1]. It checks the susceptibility of the load growth to the generation capacity supply shortage. Thus, it is performed at frequent time intervals to assist power providers and planners to prevent loss of load [2,3]. This offers a timely generation deficiency notification, seeks a reinforcement response, and promotes an optimal balance between system reliability and cost of power supply.
A general approach to estimate the generation system reliability is presented in [4]. However, it is limited to the procedure for determining the reliability assessment of the generation system based on the demand response instead. It did not consider the natural load characteristics of the electricity users. The adequacy assessment of microgrid generation is presented in [5], but it limited its assessment to the use of two reliability indices, namely; loss-of-load probability and expected demand not supplied. It did not consider the information regarding the duration of load loss during energy dispatch. The literature [6] presents the power system reliability assessment, but specifically considered the impact of four cyberattack scenarios on the network components of the SCADA system. The reliability evaluation of the power system in the demand-side considering flexible reserve provider is proposed in [7]. Here, two approaches were used, namely: time-sequential simulation (TSS) techniques and reliability network equivalent (RNE). However, it did not quantify the actual reliability impact of an ailing generation system on the demand side in terms of the duration of load loss. The load and generation innovative modeling approach for reliability assessment is described in [8]. Here, a new approach to the generation–load modeling using the smart meter load data was presented, however, the reliability metric examined was the “expected energy not served” (EENS) index. Information regarding the loss-of-load duration was not considered. Literature [9] presents a generation system comprehensive reliability assessment. It calculated the contributions of renewable energy on the supply adequacy of the comprehensive generation system. Here, two indices were used, namely: fluctuation system minute (FSM) and flow distribution fluctuation (FDF) ratio. The loss-of-load evaluation index was not considered. A reliability assessment of a microgrid in islanded mode is described in [10]. It, however, considered a cyber-physical model of the microgrid where circuit breakers and distributed energy resources were treated as the coupling elements between the cyber and physical systems. The operational performance of the generation units was quantified and compared using the Taiwan power company operational data. The reliability indices compared were limited to the lower heating value and the power generation unit availability.
The objectives of this write-up are to access and demonstrate the impact of continued load growth on the reliability of the existing generation system. This was achieved using the LOLE reliability index. Finally, a smart and predictive method of reliability assessment was proffered to accommodate the effect of load growth. Section 2 explains the reliability index and describes the power system literature reviews and the terminologies in the generation–load system. The adopted methodology and the reliability assessment steps are described in Section 3. Section 4 includes the performed simulations, analysis and graphic results, while Section 5 has the conclusion.

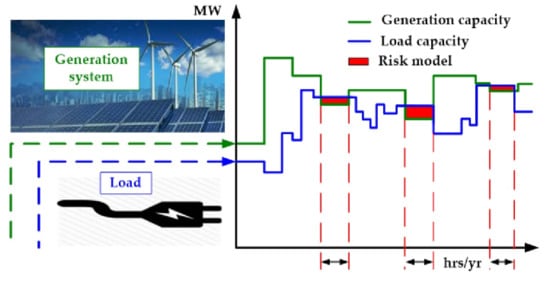
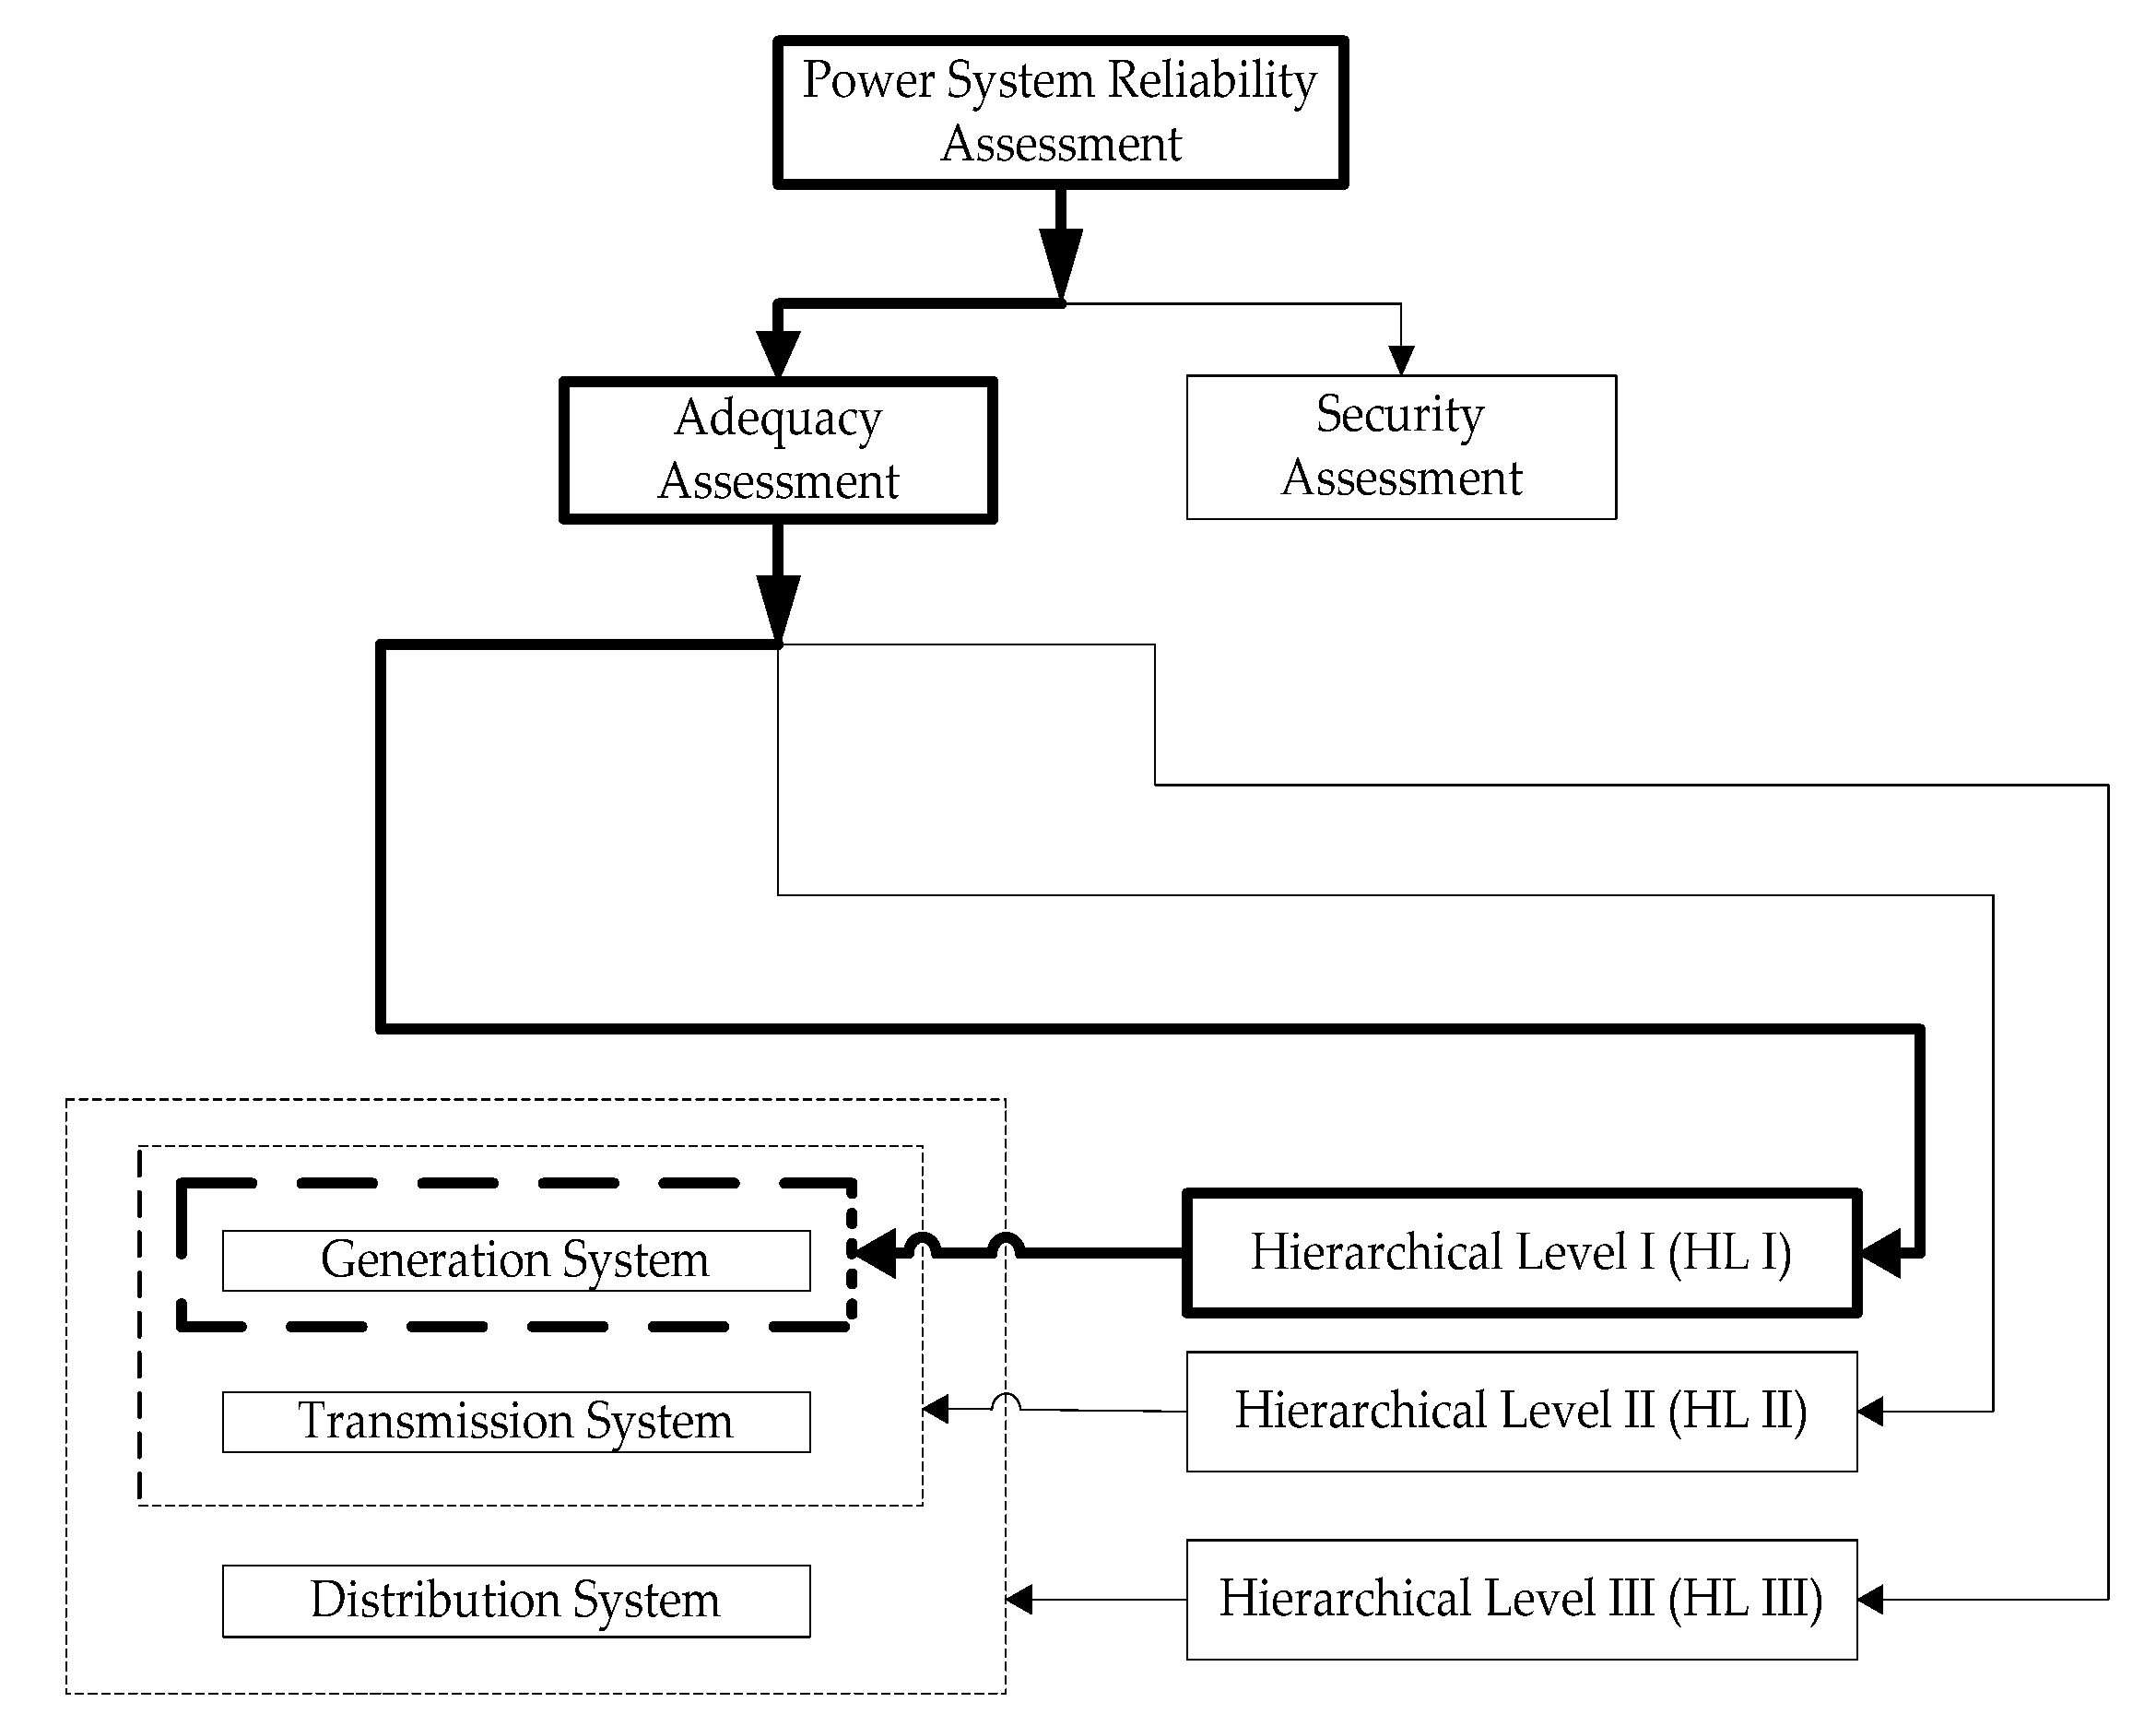
2. Power System Reliability Assessment

Power system reliability assessment is comprised of adequacy assessment (AA) and security assessment [11,12]. AA is concerned with the power system capacity to convey adequate electrical power to the consumer loads [13]. The security assessment is the power system capacity to withstand and adapt to the harsh conditions of its surrounding environment [14,15]. The reliability assessment presented herein represents AA. The power system AA is categorized into three. These include; Hierarchical level I (HL I), Hierarchical level II (HL II), and Hierarchical level III (HL III) [16]. The HL I is concerned with the AA in the generation sector alone, the HL II deals with both the generation and transmission sector, while the HL III is concerned with the generation, transmission and distribution sector. The scope of the reliability assessment considered herein is limited to the generation sector (HLI). This is as shown in Figure 1 via the thick (bold) flow lines that ended in the thick dotted line.
The generation system consists of one or more generation source(s) known as the generation unit(s). Generation units could be “in service (up)” or “out of service (down)” states when needed due to planned or unplanned outages [17]. The generation system reliability is usually calculated and quantified using the reliability index which reveals the system reliability strength [18].

2.1. The Generation System Reliability Index

The impact of the continued load growth on the reliability of the generation system was examined using the loss-of-load evaluation (LOLE) reliability assessment metric. This is a widely accepted and most widely utilized probabilistic method in power generation reliability evaluation [19]. The LOLE presents the total time duration during which the load suffers power supply insufficiency within a period usually a year [11]. From Figure 2, the LOLE was elementarily calculated as shown in (1) and conventionally measured in hour-per-year (h/yr).
LOLE   =   t 1 +   t 2
where t 1 means generation failure duration 1 and t 2 means generation failure duration 2.

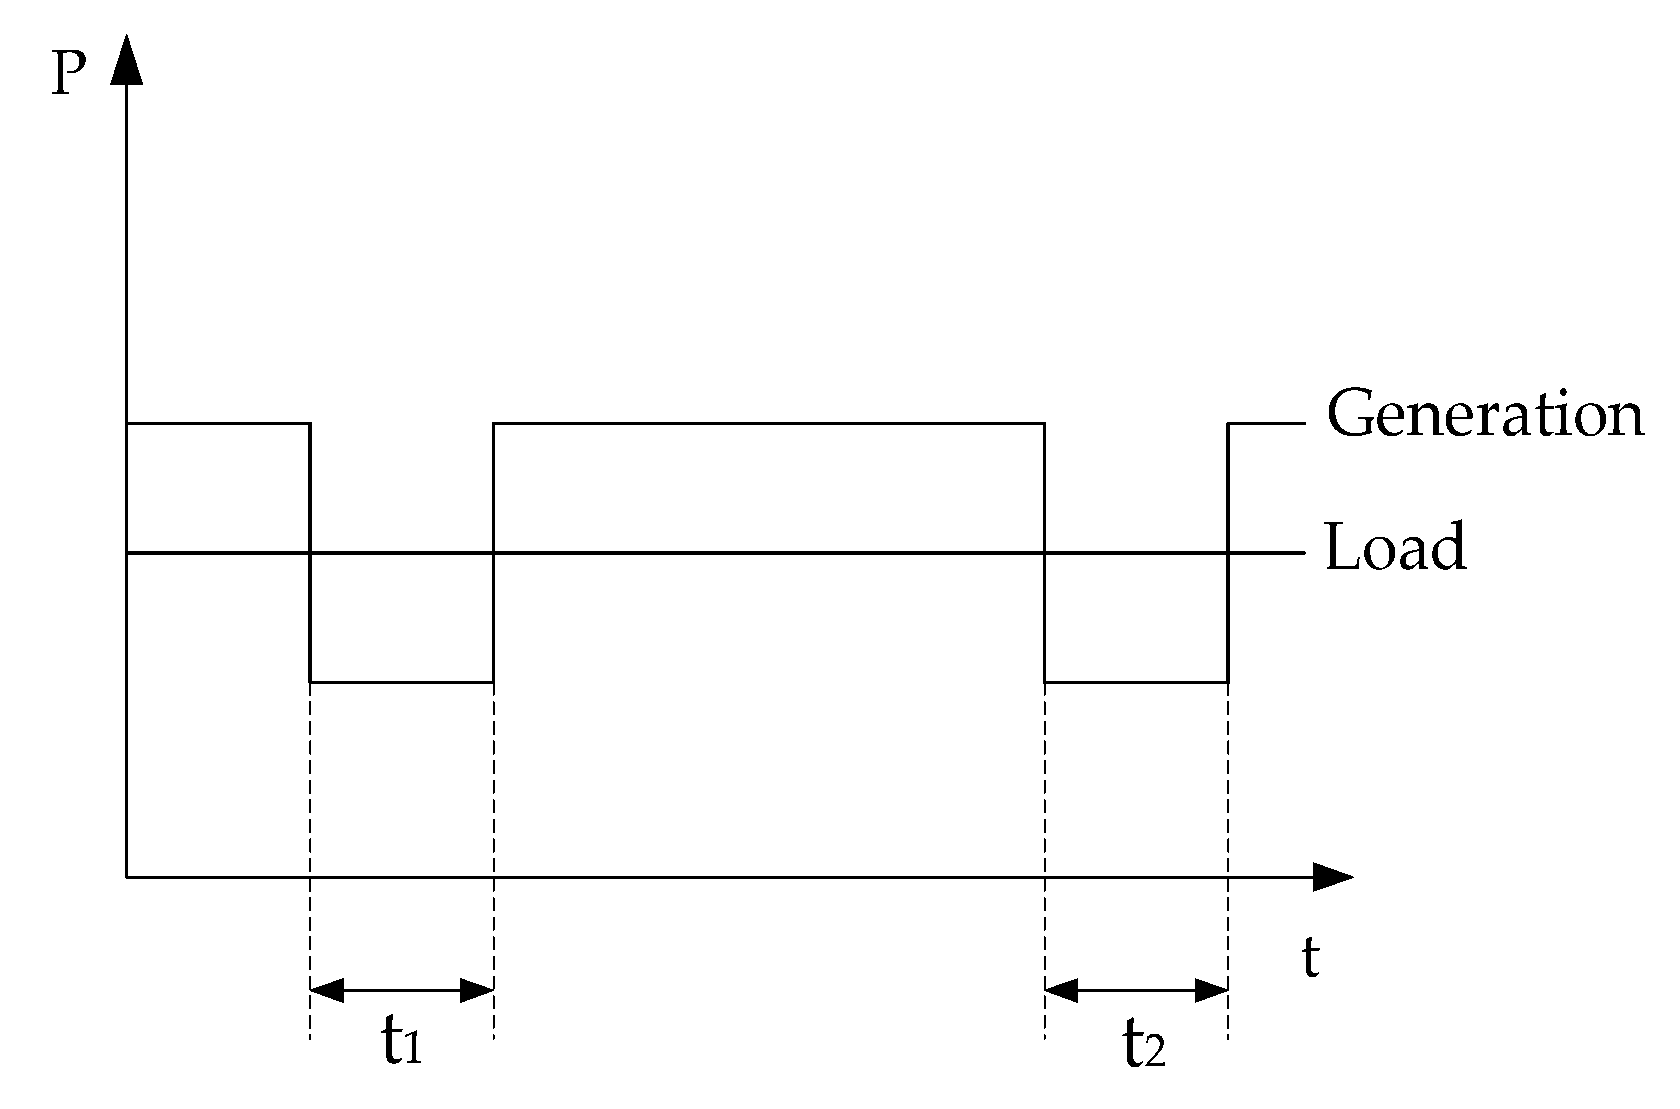
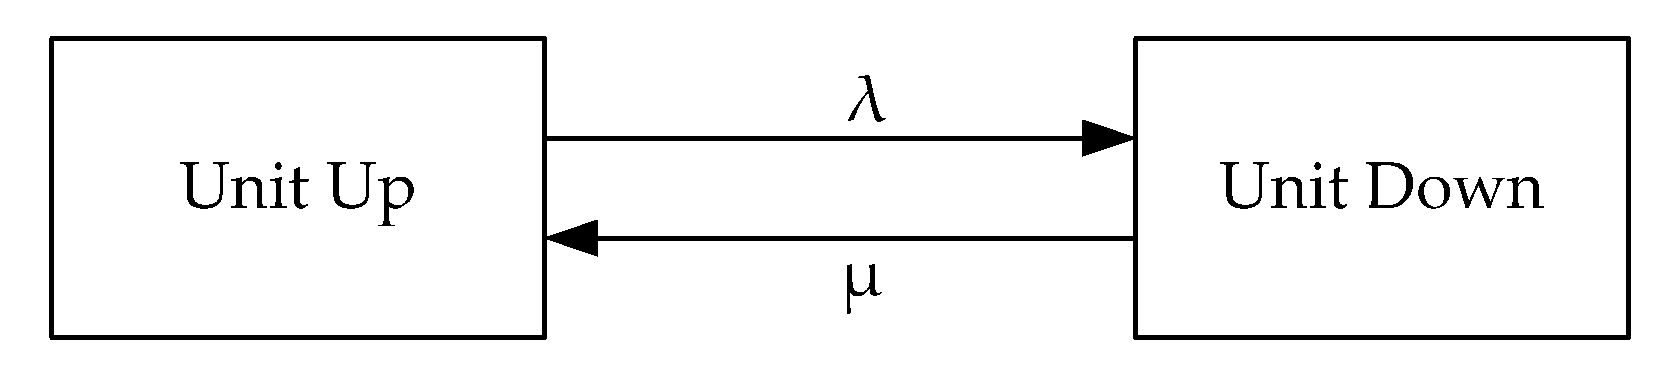
2.2. The Generation Model, Load Model and the Risk Model

To evaluate the reliability of generation systems, each generator is usually represented with a model. This reflects the performance of the generating unit sequentially in the mutually exclusive states, namely, up (operating) or down states [11]. This is as shown in Figure 3. A single generator’s model is referred to as a ‘unit model’. Individual unit models are combined by a superimposition method to obtain a resultant single generation model (resultant system capacity) as seen in Figure 4.
To model the generation capacity, the operation performance of the generating unit is characteristically expressed using the time-to-fail (TTF) and time-to-repair (TTR) parameters. TTF is the duration that a generating unit in the up-state lasts before entering the failed state. TTR is the duration that the generating unit remained in the down-state (failed state) before getting back to the up-state (operating state). TTF and TTR are illustrated in Figure 5 and are obtained as described in (2) and (3), respectively via the sequential Monte Carlo simulation (MCS) method [11].
TTF   =   ( 1 λ )   ln   U 1
TTR   =   ( 1 μ )   ln   U 2
where λ and µ are the failure rate and repair rate, respectively and U1 and U2 are sets of generated random numbers, ‘x’ ranging from zero (0) to one (1), where x = x1, x2, x3, ….., xn and 0 < x < 1. The random numbers (U1 and U2) are generated using a random number generator. The value of the failure rate λ is given by:
λ   =   1 / MTTF
where MTTF is the mean time to fail. The value of the repair rate μ is described by:
μ   =   1 / MTTR
where MTTR is the mean time to repair. The Equations (2) and (3) are suitable for describing state intervals of stochastic systems with any number of discrete states [11]. In our paper, they were calculated using the generation system data from the IEEE RTS ‘96 standard as shown in Appendix A in Table A1. It consists of nine (9) generation sources, each consisting of several generating units. The values of λ and µ are also obtainable from the IEEE RTS standard for each of the generating units via (4) and (5). The states’ durations of each generating unit, i.e., TTF and TTR, are sequentially calculated as follows:
(1)
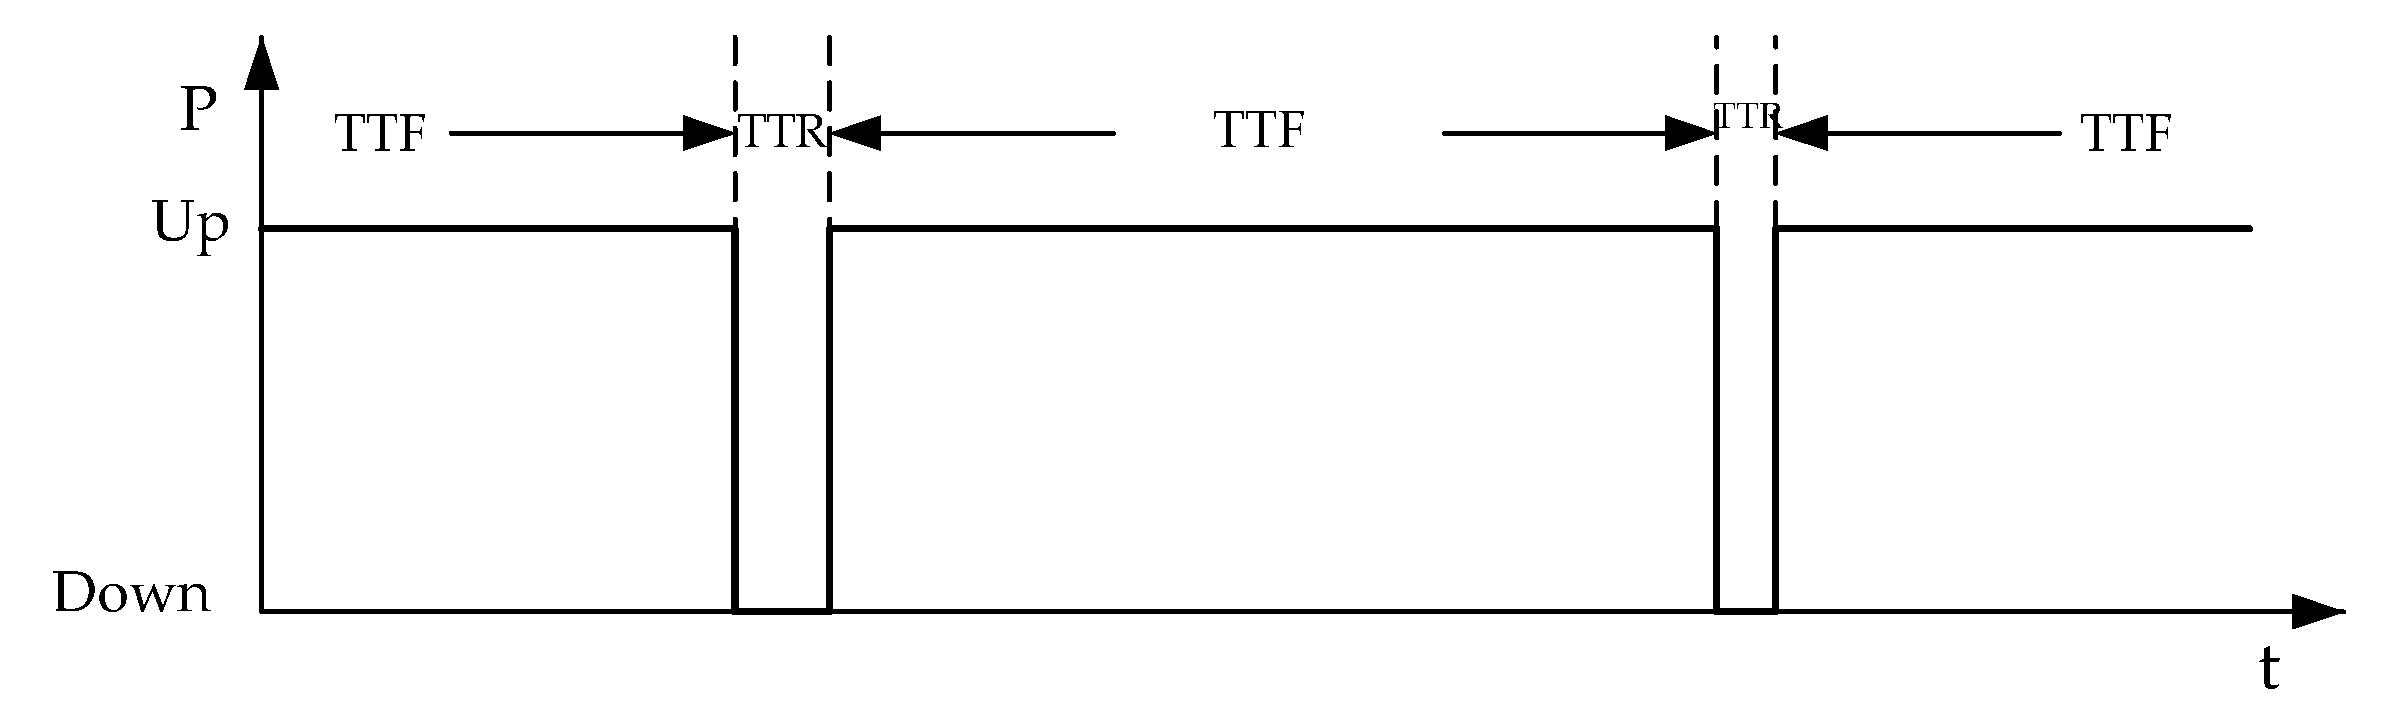
For each of the random numbers generated in U1, the TTF is calculated using (2);
(2)
For each of the random numbers generated in U2, the TTR is calculated using (3);
(3)
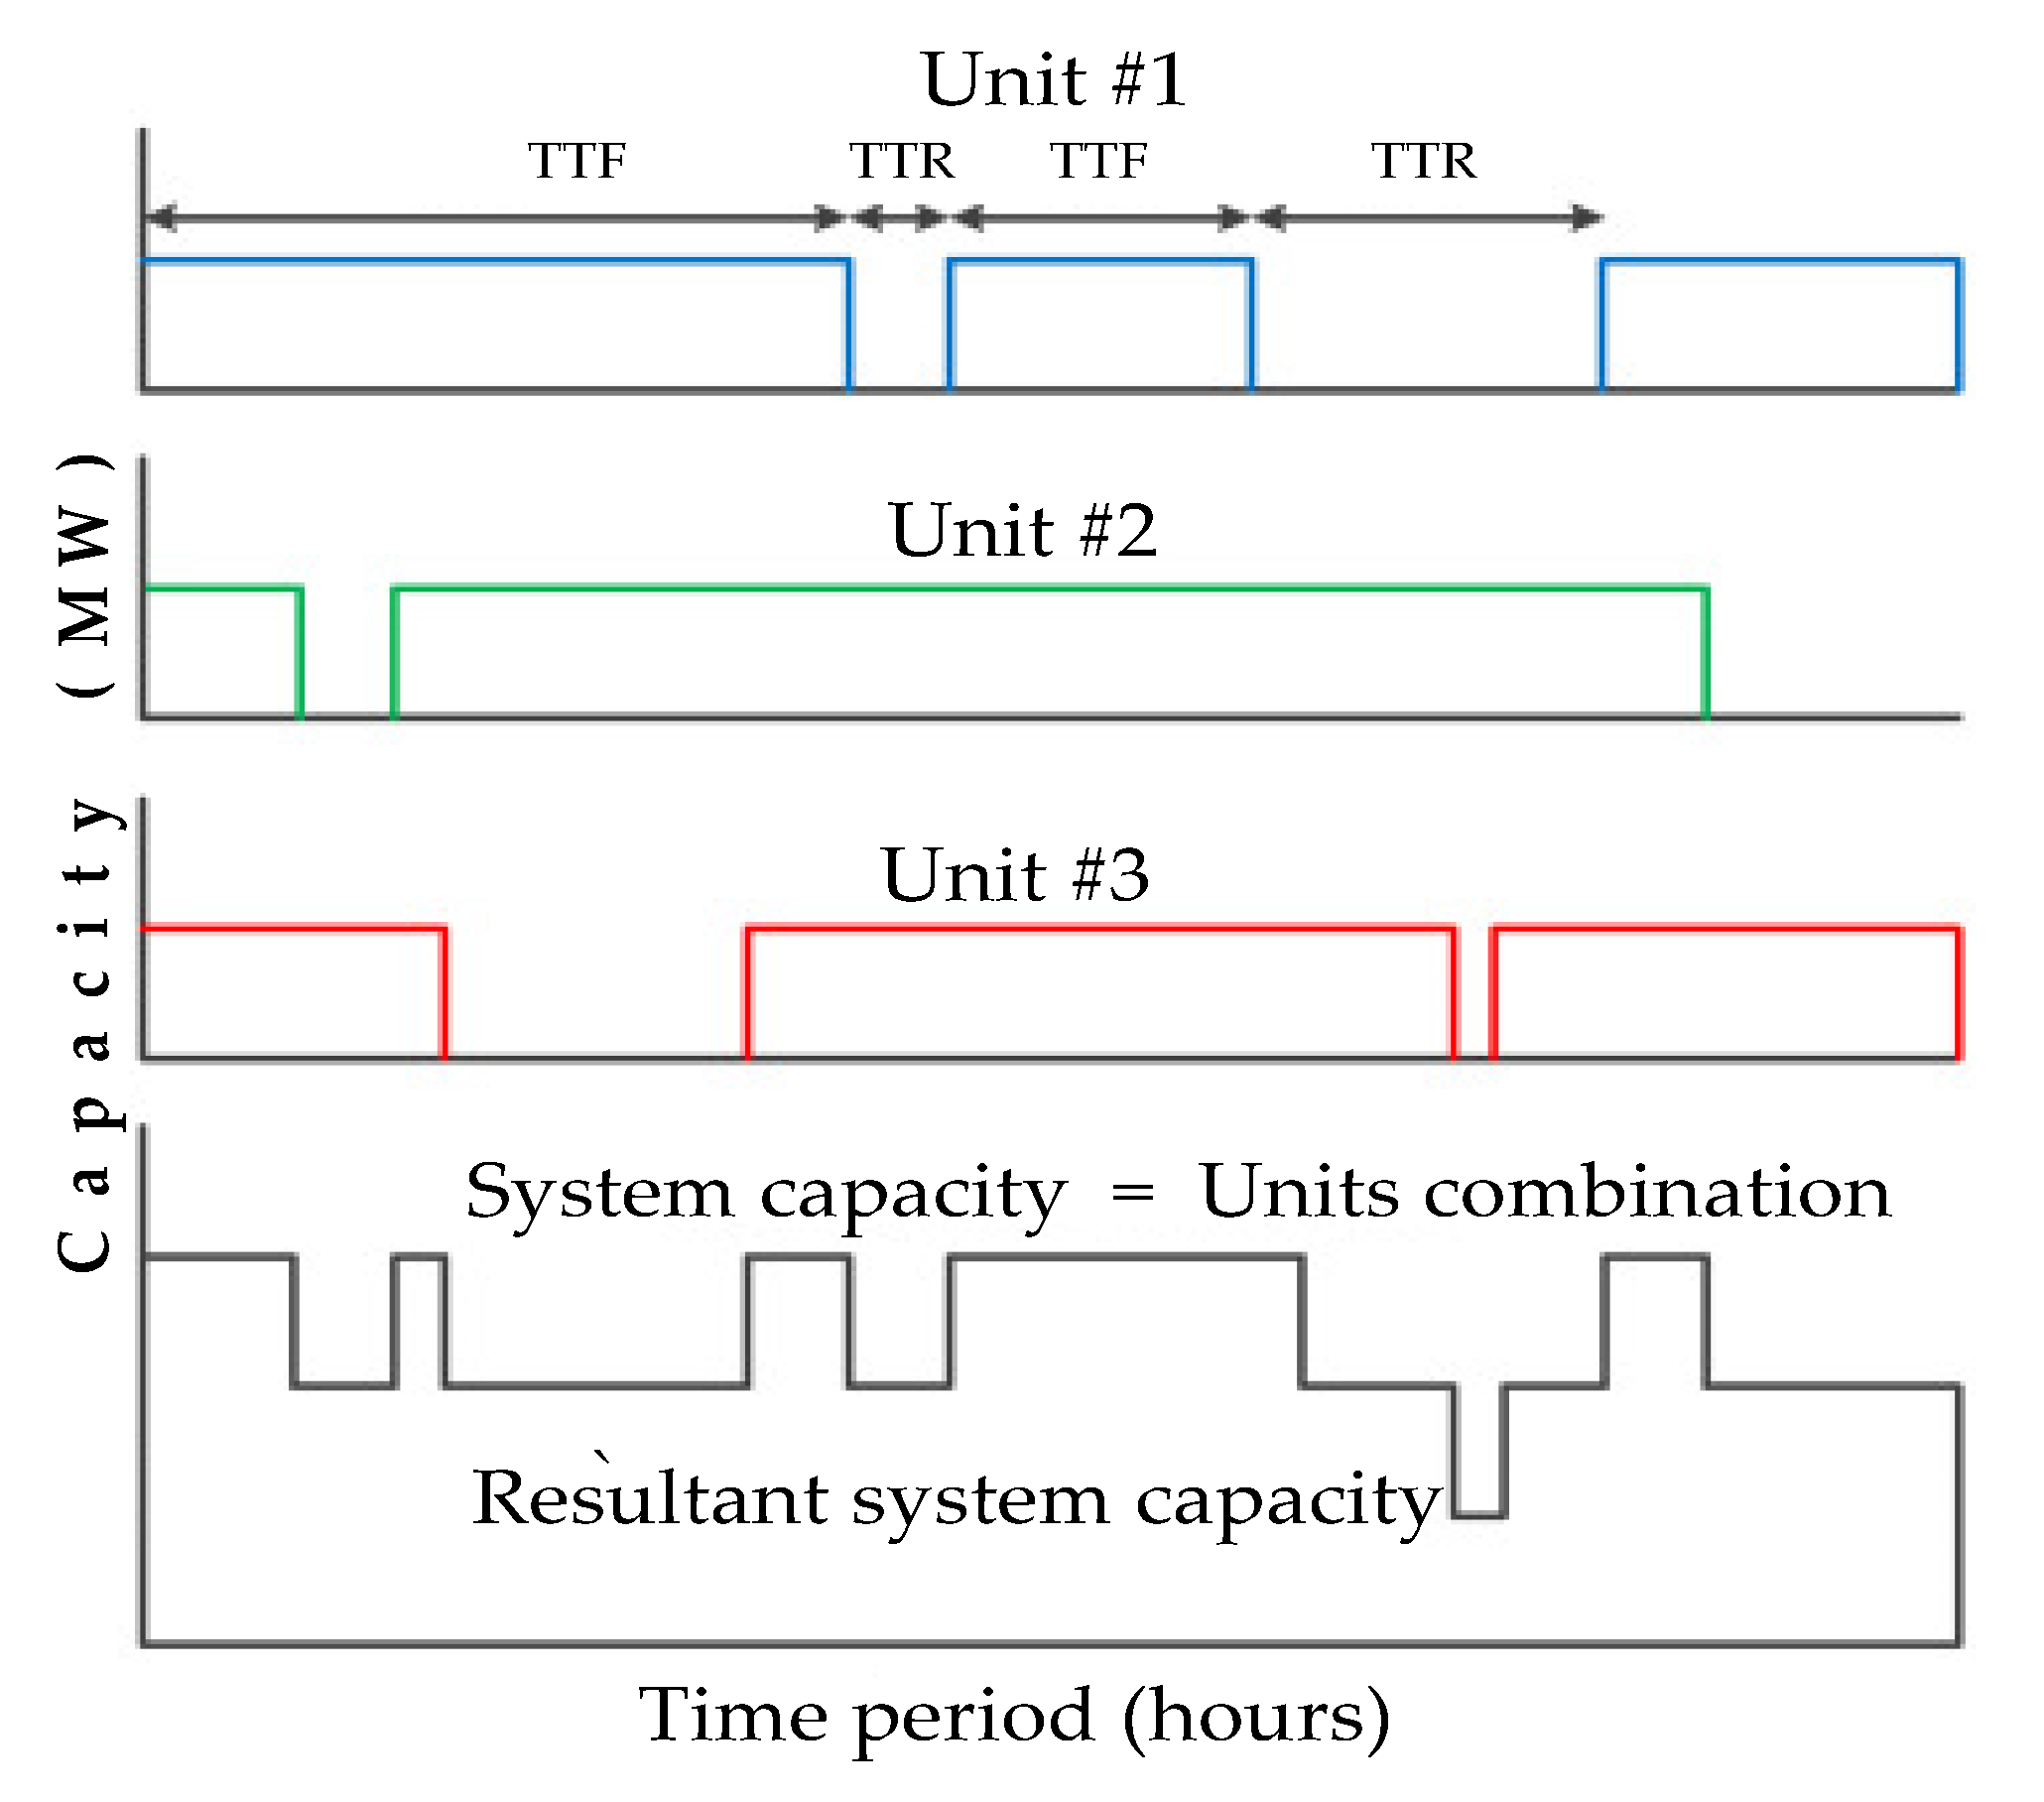
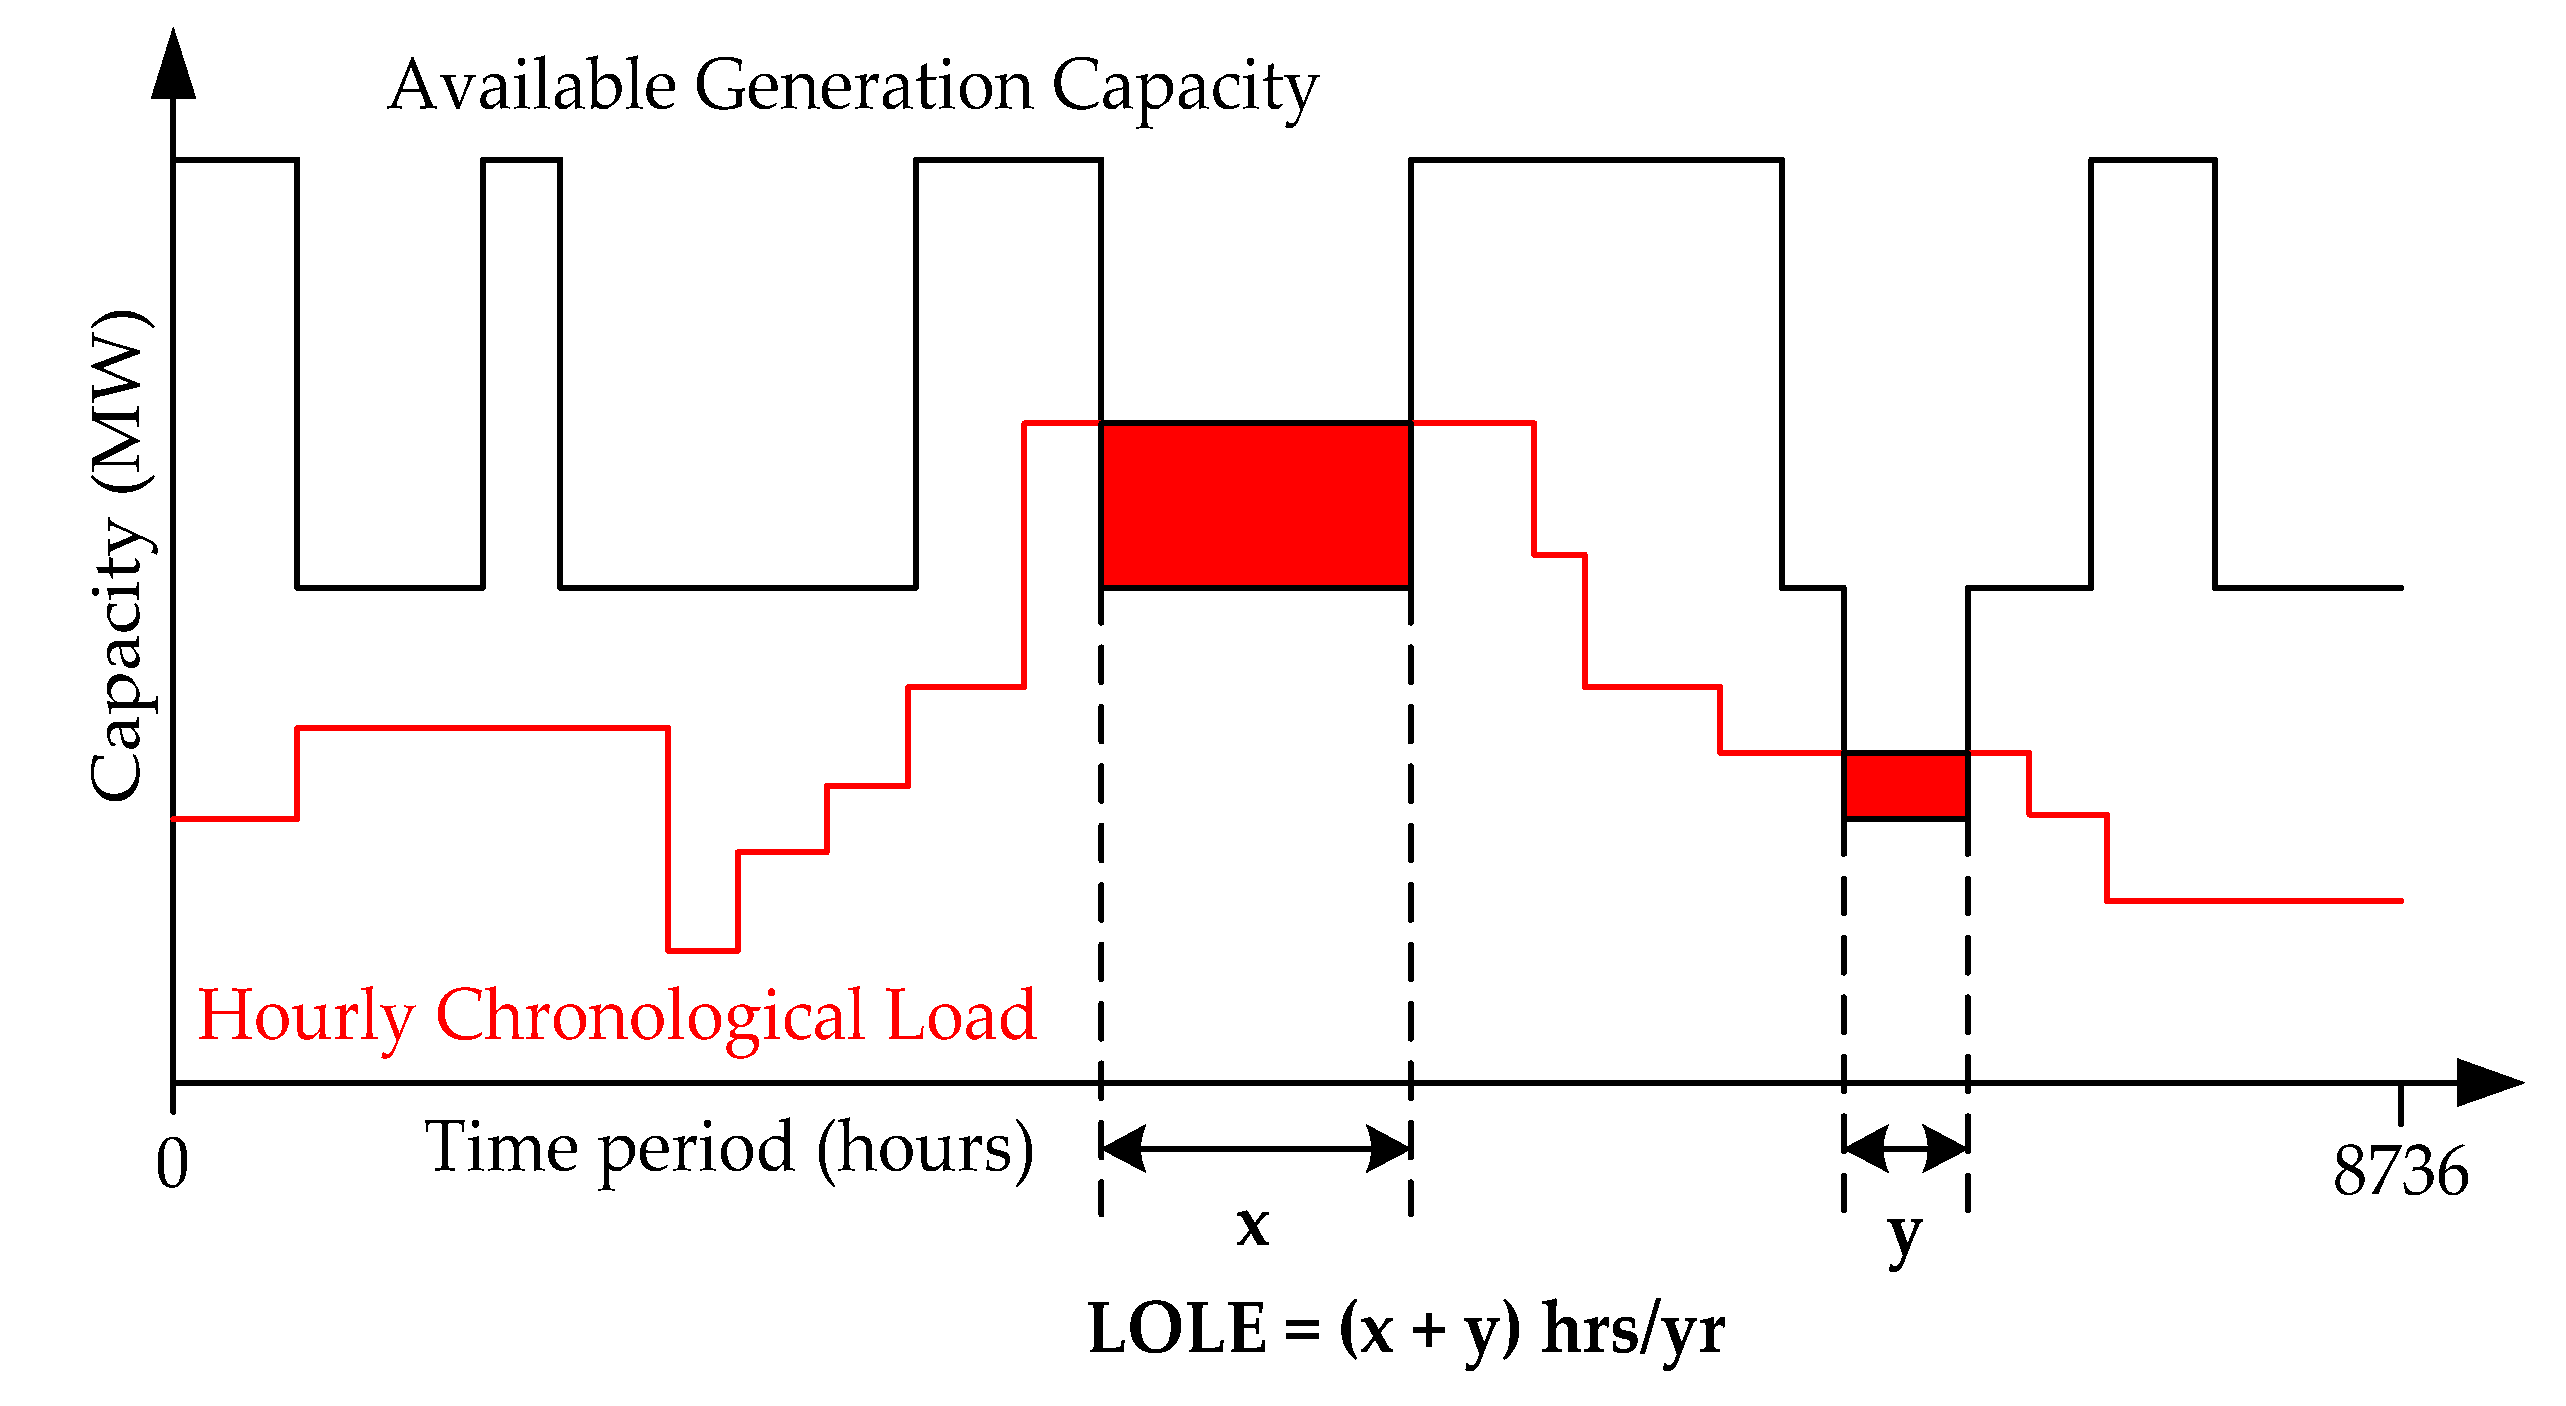
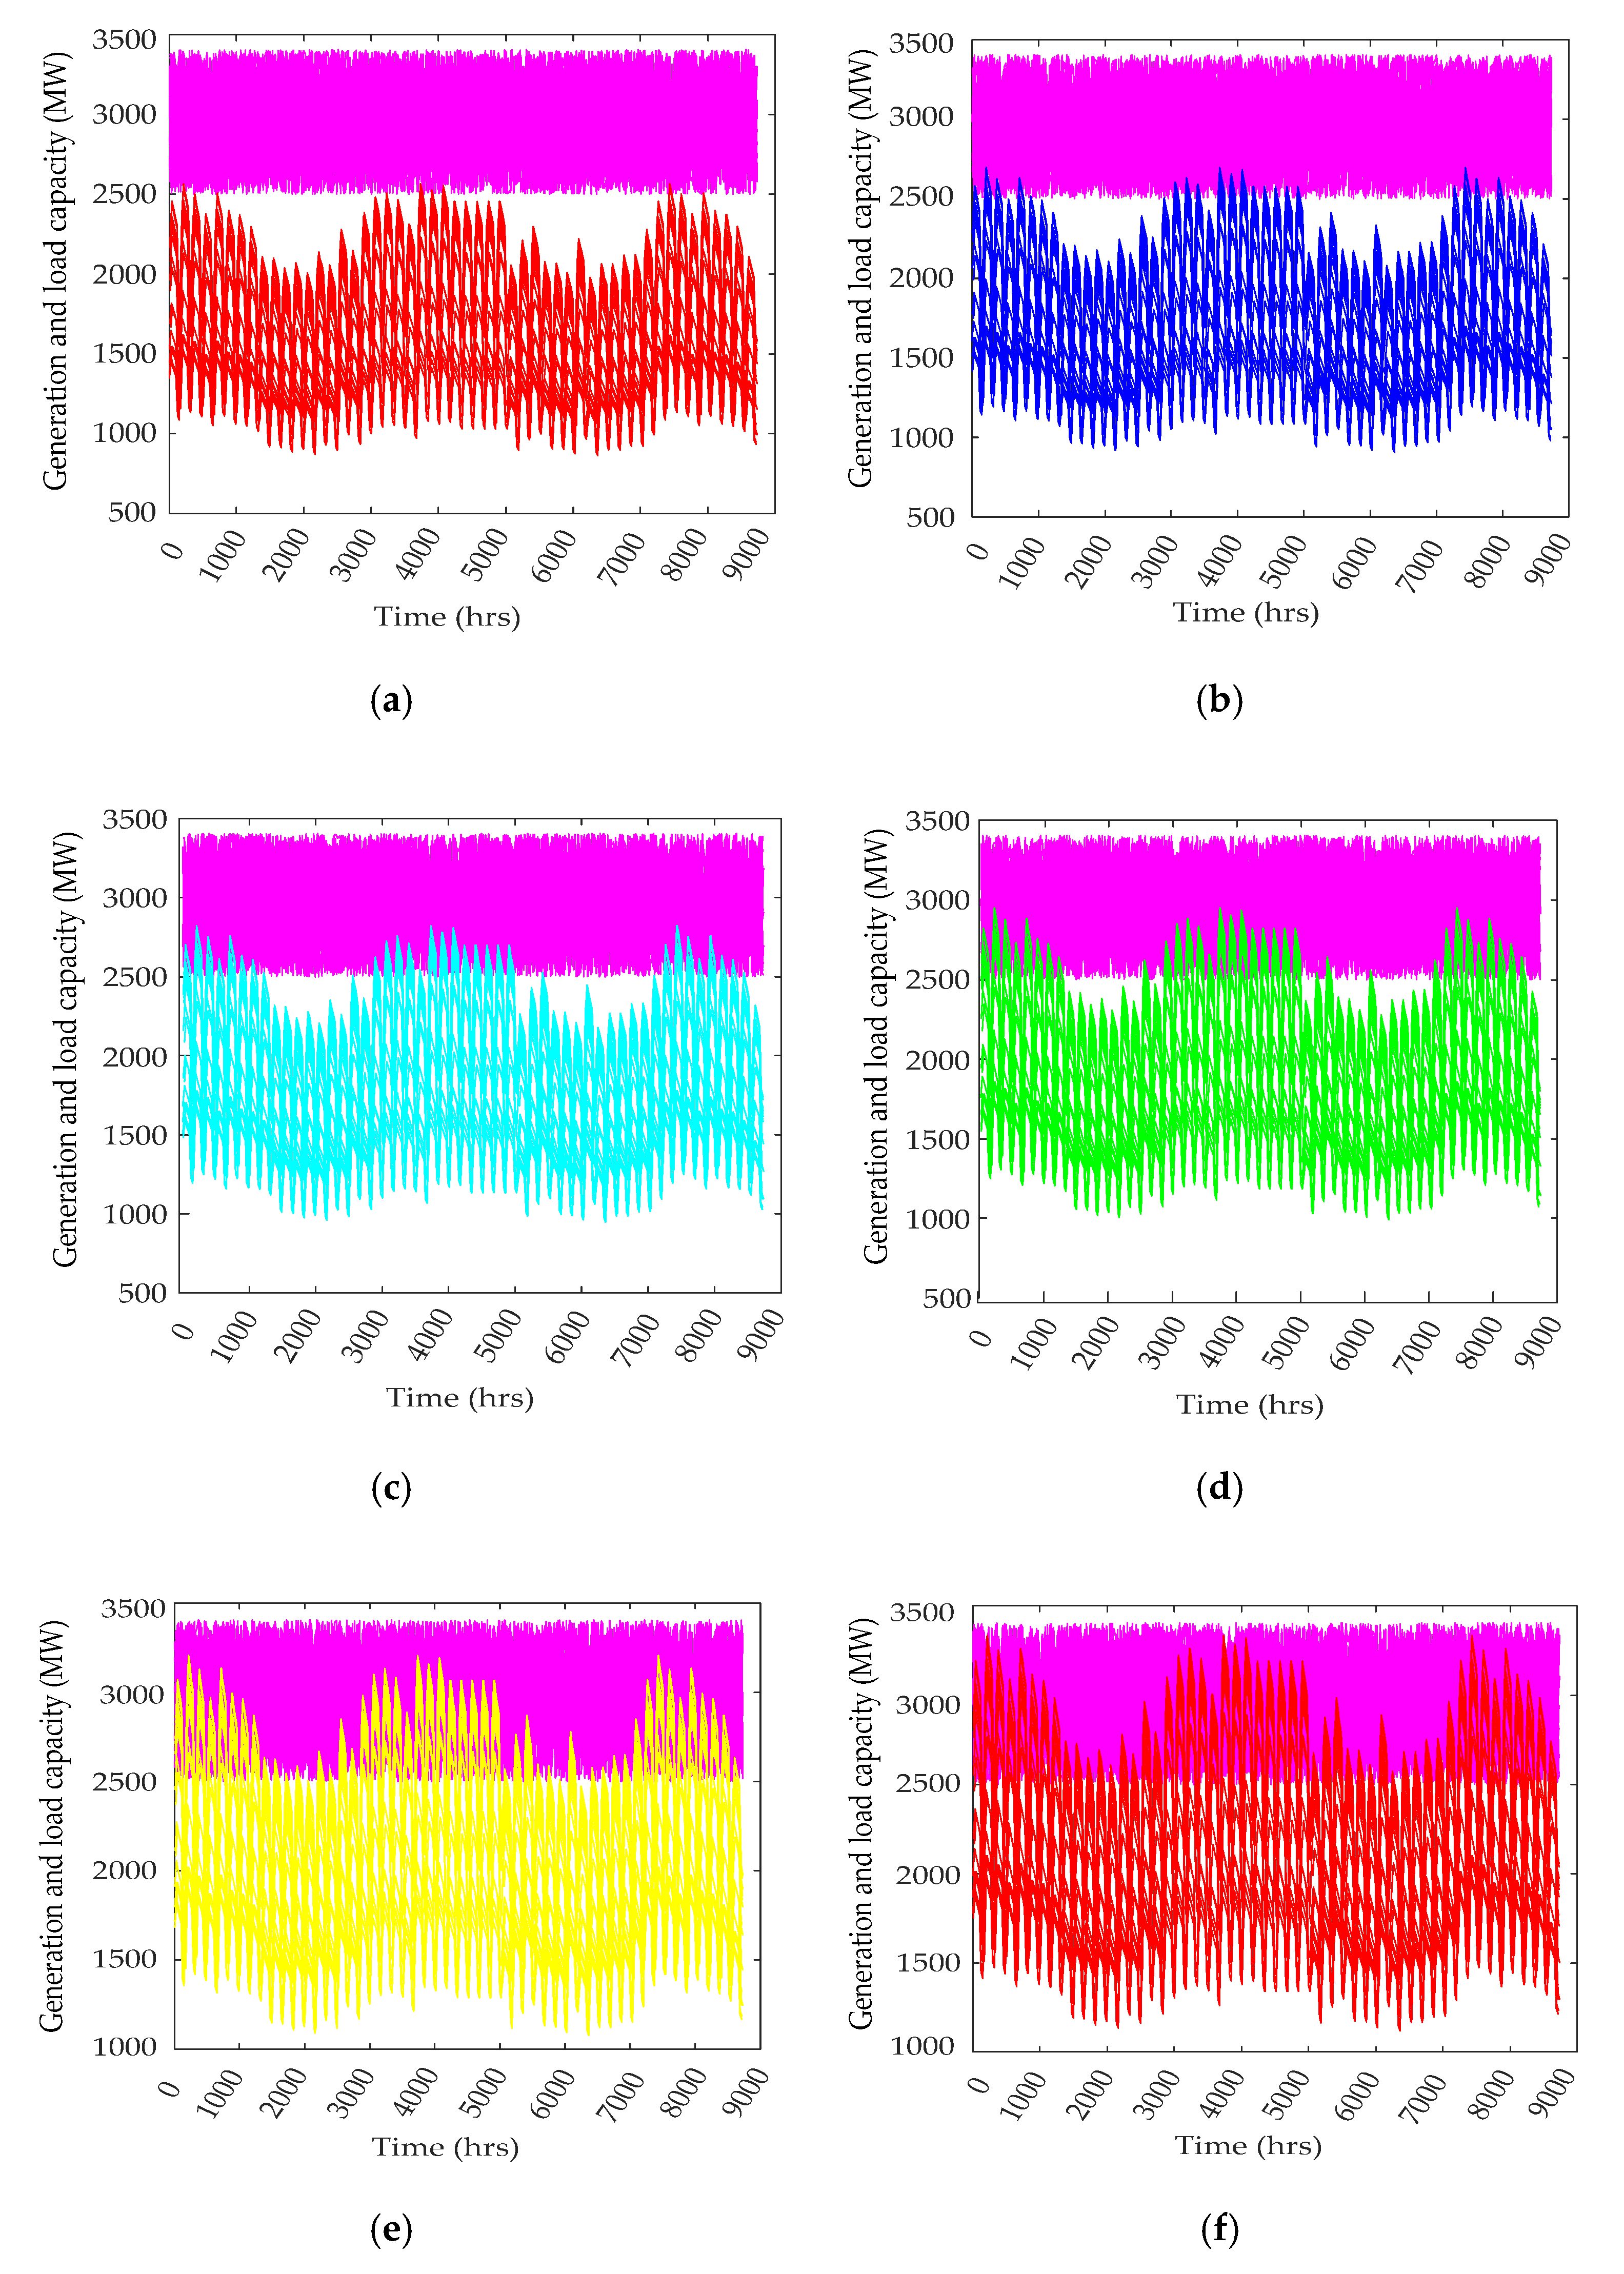
The resultant series of TTF and TTR are thereafter graphically and sequentially joined (one after the other) (i.e., TTF, then TTR, then TTF, and so on) as shown in Figure 5. This is continued until the total value reaches 8736 representing the total number of hours of a year. This is performed for each of the entire generating units. In the end, they are combined by a superimposition method to obtain a single resultant system capacity as shown in Figure 4. This is the annual duration of the generation capacity states, otherwise known as the generation model.
The load model is a graphic representation of the consumers’ hourly chronological peak load for a period of one year. It, thus, consists of 8736 values which represent 8736 h of a year [11]. This is shown in Figure 6 through the red line in the graph of the superimposed generation and load model.
The risk model represents the superimposition of the generation and the load model from which the LOLE reliability index is calculated [20]. The LOLE is the sum of the individual algebraic differences between the load level and the generation capacity at the points where the load level exceeds the generation capacity. This is as shown by the two red shaded regions in Figure 6. This is usually calculated in a yearly period. The generation system has a record of the total capacity for each hour, hence 8736 values corresponding to 8736 h of the year. In addition, the load system has a record of the consumers’ hourly load usage level, hence, also 8736 values. Since both the generation capacity and the load level have the same graphic units (MW versus hours), it becomes easy to superimpose the load level on the generation capacity to calculate the resultant difference in their capacities (MW). The points (hours) where the generation capacity exceeds the load is regarded as the safe region, while, the points (hours) where the load level exceeds the generation capacity is recorded as the LOLE. The summation of these points (hours) of LOLE for a year gives the LOLE.

3. The Reliability Assessment and the Monte Carlo System

The LOLE reliability index was obtained from the reliability assessment via the MCS. The MCS method accommodates the natural stochastic factors in the generation system operating states considering the inherent fluctuations in the generating capacity [20,21,22]. The Monte Carlo model was developed to be dynamic in solving several kinds of problems instead of the problem having to match the model or the method [23,24]. This predicts the system’s real-time behavioral characteristics in the simulated time and generates the probability distribution of each of the parameters [25,26]. The reliability assessment data were obtained from the IEEE reliability test system (IEEE RTS ‘96 standard). The generation and load data of the IEEE RTS are given in Appendix A and Appendix B, respectively. This was established in the IEEE power engineering society by the IEEE subcommittee on the application of probability methods [27,28]. The aim was to present a common test platform for the comparison of results obtained through various methods of power system reliability analysis. It is comprised of the following [11]:
A.
Total generation capacity [Appendix ATable A1] of 3405 MW ranging from 12 MW to 400 MW. This consists of 32 generating units and their individual forced outage rates, mean time to fail (MTTF) and mean time to repair (MTTR). The entire individual units are superimposed with one another to obtain a single unit known as the generation model. The generation model is further superimposed with the load model to calculate the assessment index (LOLE) [29].
B.
The load is made up of the following [Appendix B]:
(1)
The annual peak load of 2850 MW;
(2)
Weekly peak load presented in percent of the annual peak load. This comprises of 52 percentage values that represent the 52 weeks of a year (Table A2);
(3)
Daily peak load presented in percent of the weekly peak load. This comprises of 7 percentage values that represent the 7 days of a week (Table A3);
(4)
Hourly peak load presented in percent of the daily peak load. This comprises of 24 percentage values that represent the 24 h of a day (Table A4).
The load composition of the IEEE-RTS is such that the load characteristics of every season of the year are considered. Thus, the inherent stochasticity in the load system is well accommodated in the standard.

Modeling the Generation Capacity and the Load

From the IEEE RTS standard data used in the simulation process, the derived generation model was superimposed with the load model and the risk model was consequently accessed. From the risk model, the LOLE reliability index was thereafter calculated. The simulation was performed in the MATLAB environment.
To further investigate the impact of the load growth on the available generation capacity adequacy, the load data were further increased stepwise and sequentially. They were increased from the original level (0%) to 30% fold by a tiny step size of 0.06%. Thus, the load multiplication factor ranges from 1.0 to 1.30 through a step size of 0.0006. In each step, the generation capacity model was simulated against the incrementing load and the LOLE was calculated as described in Figure 6. Hence, 501 LOLE values were recorded, i.e., (30%/0.06%) + 1 (the original load level).
In addition, in each step, the calculated LOLE value was translated into the “percentage of annum” metric, regarded as A%, described in (6), i.e., what percentage of annum is the calculated LOLE? The A% metric is introduced to quantify the realistic impact of each of the calculated LOLE values on the generation capacity adequacy. A yield point, defined by Ay%, is thereafter established at a particular value of A% such that the values of A% that are above Ay% are unacceptable. This is known as the reliability threshold of the generation capacity. It is the maximum accommodable limit of A% above which the generation system is pronounced unreliable. At this point, the simulation process is stopped, and the generation improvement is demanded. Hence, the values at Ay% and below signify that the generation capacity is adequate and thus, reliable. The “percentage of annum” A% is described by:
A %   =   ( LOLE / 8736 ) · 100 %
where LOLE means loss-of-load evaluation.
Thus, if:
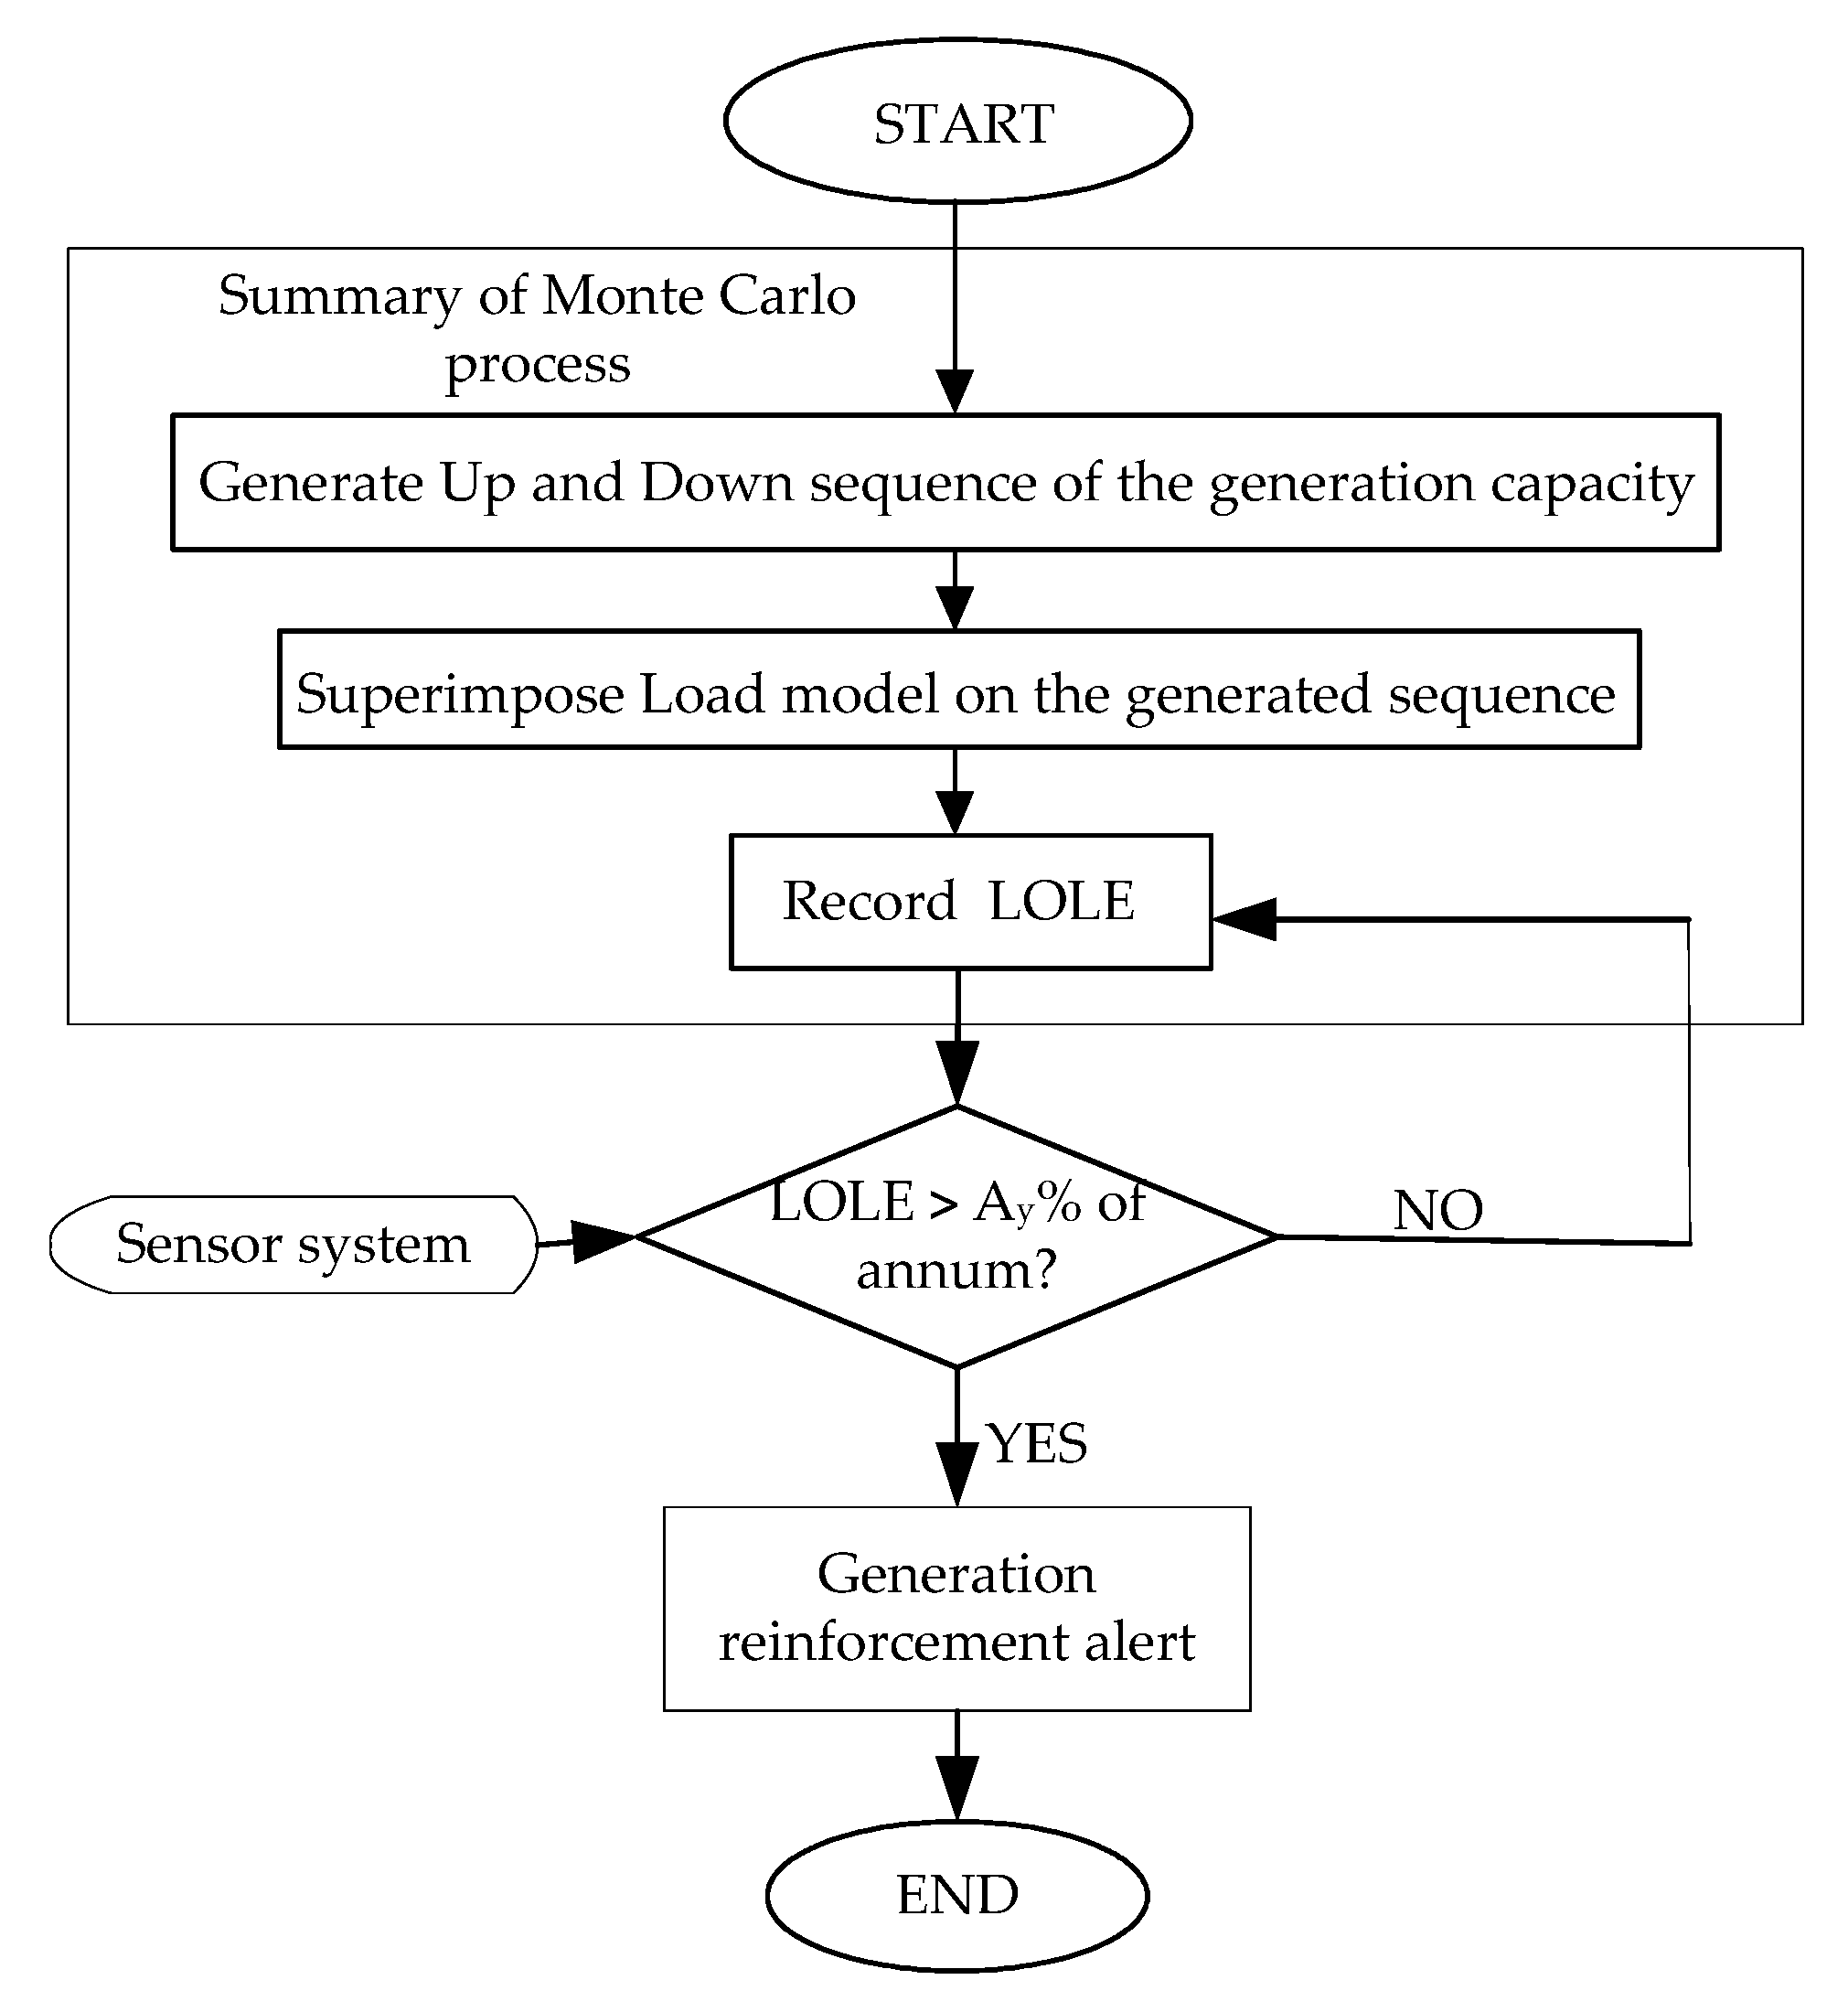
  • A% < Ay%, generation system is reliable,
  • A% = Ay%, generation system is reliable, and
  • A% > Ay%, generation system is unreliable.
Ay% signifies the reliability threshold. The value of the Ay% is determined by the power utility and it serves as a benchmark that defines her quality of service (QoS). A lower value of Ay% implies higher QoS, thus, greater system reliability and vice versa. A flowchart for generation system reliability assessment and notification is shown in Figure 7. This depicts a smart approach to accommodate the load rise effect and timely generation system reinforcement through a notification alert system.

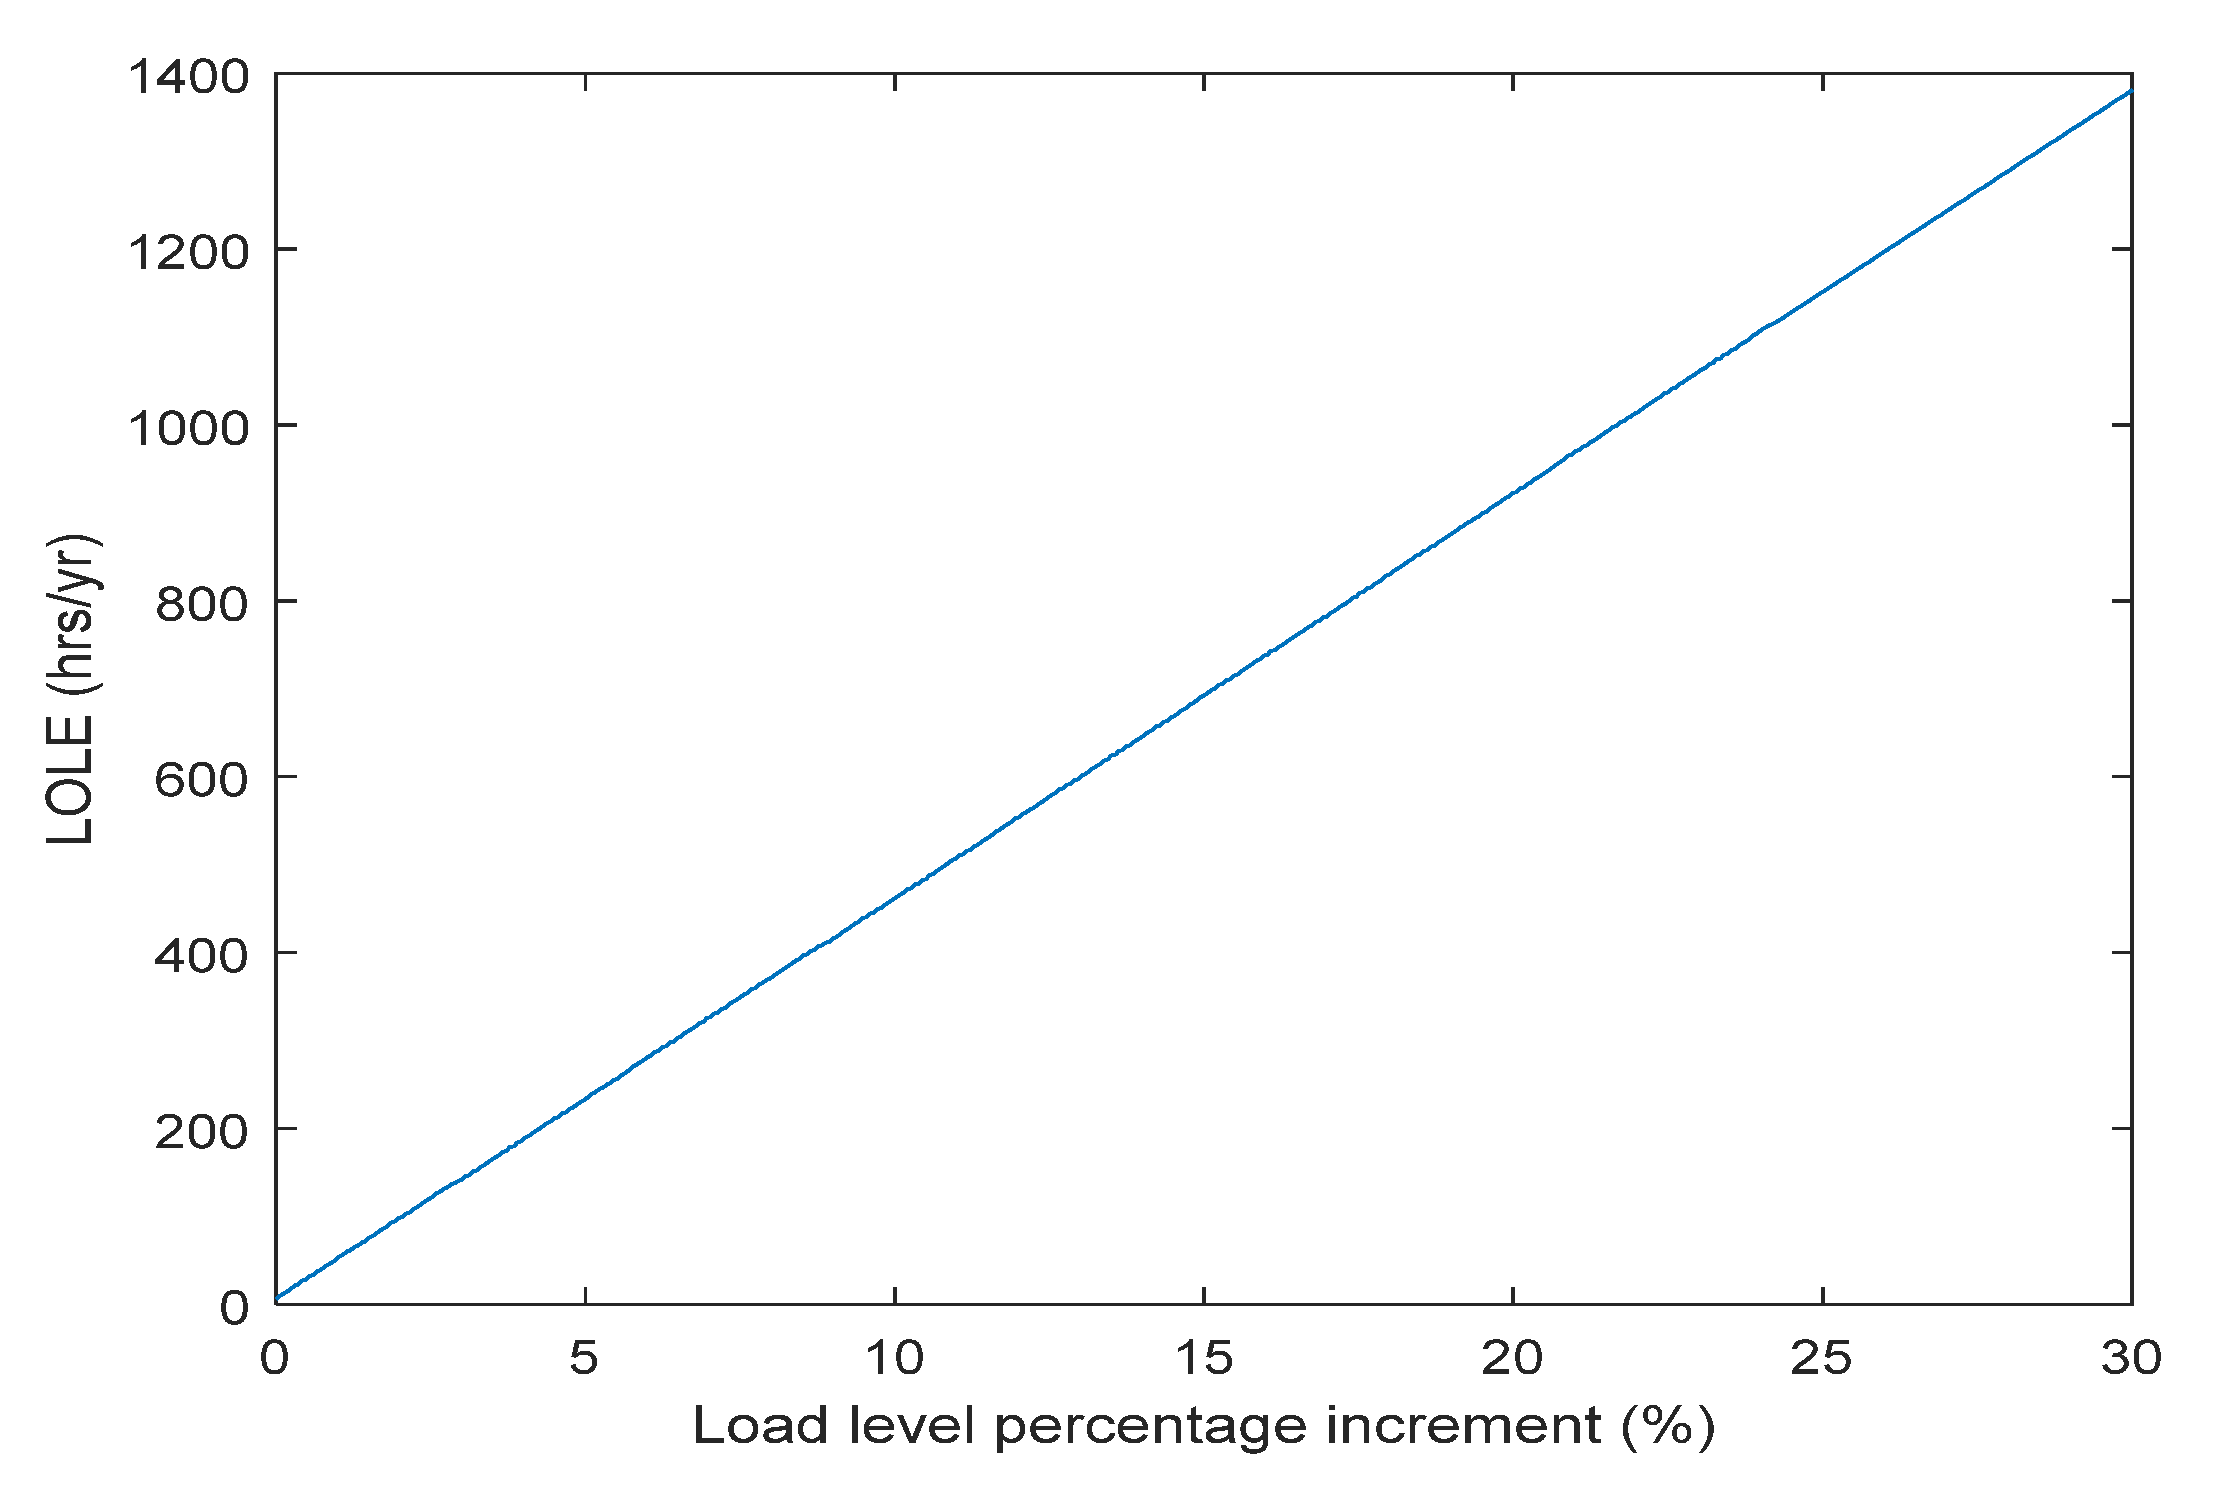
4. Simulation Results and Discussion

The generation–load simulation process comprises of 501 LOLE values. An overview of the load increment at six major intervals (namely: 0%, 5%, 10%, 15%, 25% and 30%) against the available generation capacity is shown in Figure 8 in a generation–load graph. The graph of the load increment against the generation capacity could be seen ranging from (a) to (f) for 0% to 30% load increment, respectively. This is designated with distinct colors for clarity. The generation capacity is represented by the magenta color, while the various load increment is represented by other colors. The “load spikes” into the generation capacity region in (b) for a 5% increment is seen greater than the “load spikes” in (a) for a 0% load increment. Likewise, the “load spikes” in (c) for a 10% load increment is greater than that in (b) for a 5% increment. In addition, the spikes in (d) for a 15% increment is greater than that in (c) for 10% increment, and so on, until (f). These various “load spikes” into the generation capacity are known as the LOLE for each load increment considered. They are the points where the consumer load surpasses the generation capacity. The yield point was established at Ay% ≈ 15% (floor), thus, the simulation was stopped at this point. This was reached at approximately 30% load increment and the LOLE of 1380 h/yr, as seen in Figure 9. From the data sequence in the graphs of Figure 8, it is evident that the LOLE increases linearly with the load increment. Hence, a further simulation was performed to obtain the respective LOLEs from up to 500 steps of load increment. Figure 9 shows the graph of the respective LOLEs obtained from the generation–load model as a result of 500 points of load increment ranging from 0% to 30%.
Since the relationship between LOLE and the load rise maintained a linear trend, a regression analysis is further introduced in the simulation process. Thus, the obtained LOLE values are simulated with the load rise through the least-squares method. The 501 simulation data points were split into 80% training and 20% testing datasets. The simulation was performed in the Python-Jupyter integrated development environment (IDE). The linear regression algorithm of Scikit-learn was used, and the random state of the train_test_split was seeded to 90 (random_state = 90). Through simulation, a relationship between the LOLE and the load rise was established. The fitting formula is given by:
LOLE   =   45.843 L i   +   5.296
where Li is load.
Equation (7) depends on the uniqueness of the relationship, and values would vary based on the recorded generation and load data. The equation is wholly dependent on the load-growth history, Li of the particular consumers in the area under consideration. Also, the capacity and state of the available generation system is a contributing factor. Thus, different areas would record different simulation values. However, the relative variation of the independent parameter, Li, with the LOLE remains proportionally unique. In our simulation, the accuracy of the formula is tested with 101 data points of the test data, and the coefficient of determination (R-square) recorded is 0.99. Given the average deviation of the prediction in (8), the average deviation of the 101 data points is 0.63. The average deviation Dav is given by:
D av =   [ 1 n i = 1 n ( ( 45.843 L i + 5.296 )     LOLE i ) 2 ] 1 / 2
where LOLEi is the actual LOLE.
From the simulation result, the future generation system reliability assessments can be effectively performed using (7). From the generation system operation data and the recent load-growth history (data), a simulation is performed using the linear regression algorithm. Using the resulting fitting equation, the value of LOLE could be predicted at any instance given the current load information. The LOLE is then monitored as the load rises, by translating it to the A% equivalent as seen in (6). If A% exceeds the preset yield point (Ay%), known as the percentage of annum, the generation reinforcement is necessitated. At this point, the generation system reinforcement demand is declared critical. From our simulation, the tiny load increment step size of 0.06% adopted ensures high precision in the reliability assessment scheme. Thus, this guarantees high accuracy in the prediction through (7). This, therefore, would accommodate the smallest possible load growth through the robust feature.

5. Conclusions

Generation system reliability assessment is demanding and necessitates that it is performed at regular intervals. The system must be monitored to ascertain the reliability status of the existing generation system at any point in time to ensure continued adequacy in supply. A reliability predictive analysis is made using the generation system data and consumer load-growth history. The generation system reliability assessment propelled by such a predictive approach would facilitate timely response to the reliability demand of deficient generation capacity. Through the entire simulation approach, the LOLE is carefully bounded below the yield point. This is regarded as the safe region within which the generation system operation capacity is endorsed reliable. By this approach, the adequacy of the available generation system is predictively guaranteed. The yield point metric (Ay) would also serve as a basis to guide the consumers in the decision making process. The patronage-related decisions arising from the course of market competitions would rightly be made given the various available utility companies. The power utilities operating at lower Ay% have a higher quality of service (QoS). They would certainly earn greater consumers’ patronage in the electricity market. The entire system also promotes an optimal balance between system reliability and the cost of power supply.

Author Contributions

Conceptualization, M.O.O.; formal analysis, H.J. and H.W.; project administration, Z.L. and J.Y. (Jingwei Yuan); resources, J.F., W.L. and T.A.O.; supervision, J.Y. (Junyou Yang); validation, J.Y. (Junyou Yang); writing—original draft preparation, M.O.O. All authors have read and agreed to the published version of the manuscript.

Funding

This work was funded in part by the Technology Project of State Grid Corporation of China under Grant SGTYHT/18–XX–213 and in part by the Liaoning Province ‘Xingliao Talents Plan’ (XLYC1902090).

Conflicts of Interest

The authors declare no conflicts of interest.

Appendix A

IEEE RTS ’96 generating unit data.
Total installed generation capacity = 3405 MW.
Table A1. Generating unit data.
Unit Size (MW)Number of UnitsForced Outage RateMean Time To Fail (MTTF) (Hours)Mean Time To Repair (MTTR) (Hours)
1250.02294060
2040.1045050
5060.01198020
7640.02196040
10030.04120050
15540.0496040
19730.0595050
35010.081150100
40020.121100150

Appendix B

IEEE RTS ’96 load data.
Annual peak load = 2850 MW.
Table A2. Weekly peak load (52 weeks) as a percentage of annual peak.
WeekPeak Load (%)WeekPeak Load (%)WeekPeak Load (%)WeekPeak Load (%)WeekPeak Load (%)
186.21272.72390.03472.94588.5
290.01370.42488.73572.64690.9
387.81475.02589.63670.54794.0
483.41572.12686.13778.04889.0
588.01680.02775.53869.54994.2
684.11775.42881.63972.45097.0
783.21883.72980.14072.451100.0
880.61987.03088.04174.35295.2
974.02088.03172.24274.4
1073.72186.53277.64380.0
1171.52281.13380.64488.1
Table A3. Daily peak load (7 days) as a percentage of weekly peak.
DayPeak Load (%)
Monday93
Tuesday100
Wednesday98
Thursday96
Friday94
Saturday77
Sunday75
Table A4. Hourly peak load (24 h) as a percentage of daily peak.
Winter Weeks
1–8 and 44–52
Summer Weeks
18–30
Spring/Fall Weeks
9–17 and 31–43
HourWeekdayWeekendWeekdayWeekendWeekdayWeekend
12–1 a.m.677864746375
1–2637260706279
2–3606858666069
3–4596656655866
4–5596456645965
5–6606558626565
6–7746664627268
7–8867076668574
8–9958087819583
9–10968895869989
10–119690999110092
11–Noon9591100939994
Noon–1 p.m.959099939391
1–29588100929290
2–39387100919090
3–4948797918886
4–5999196929085
5–610010096949288
6–71009993959692
7–89697929598100
8–99194921009697
9–10839293939095
10–11738787888090
11–12638172807085

References

  1. Alferidi, A.; Karki, R. Development of probabilistic reliability models of photovoltaic system topologies for system adequacy evaluation. Appl. Sci. 2017, 7, 176. [Google Scholar] [CrossRef] [Green Version]
  2. Singh, C.; Jirutitijaroen, P.; Mitra, J. Generation adequacy evaluation using discrete convolution. In Electric Power Grid Reliability Evaluation: Models and Methods, 1st ed.; Wiley-IEEE Press: Hoboken, NJ, USA, 2019; pp. 193–213. [Google Scholar] [CrossRef]
  3. Zhu, J.; Zhang, Y. A frequency and duration method for adequacy assessment of generation systems with wind farms. IEEE Trans. Power Syst. 2019, 34, 1151–1160. [Google Scholar] [CrossRef]
  4. Qi, X.; Ji, Z.; Wu, H.; Zhang, J.; Wang, L. Short-term reliability assessment of generating systems considering demand response reliability. IEEE Access 2020, 8, 74371–74384. [Google Scholar] [CrossRef]
  5. Micky, R.R.; Lakshmi, R.; Sunitha, R.; Ashok, S. Generation adequacy assessment for microgrid with ESS. In Proceedings of the IEEE 7th Power India International Conference (PIICON), Bikaner, India, 25–27 November 2016. [Google Scholar] [CrossRef]
  6. Zhang, Y.; Wang, L.; Xiang, Y.; Ten, C.W. Power system reliability evaluation with scada cybersecurity considerations. IEEE Trans. Smart Grid 2015, 6, 1707–1721. [Google Scholar] [CrossRef]
  7. Jia, H.; Ding, Y.; Song, Y.; Singh, C.; Li, M. Operating reliability evaluation of power systems considering flexible reserve provider in demand side. IEEE Trans. Smart Grid 2019, 10, 3452–3464. [Google Scholar] [CrossRef] [Green Version]
  8. Gunduz, H.; Khan, Z.A.; Altamimi, A.; Jayaweera, D. An innovative methodology for load and generation modelling in a reliability assessment with PV and smart meter readings. In Proceedings of the IEEE Power and Energy Society General Meeting (PESGM), Portland, OR, USA, 5–10 August 2018. [Google Scholar] [CrossRef]
  9. Yan, C.; Bie, Z.; Ling, Y.; Li, G.; Xiong, F.; Wen, J. A comprehensive reliability assessment index system for regional grid with a large renewable energy penetration. In Proceedings of the Asia-Pacific Power and Energy Engineering Conference (APPEEC), Xi’an, China, 25–28 October 2016. [Google Scholar] [CrossRef]
  10. Guo, J.; Liu, W.; Syed, F.R.; Zhang, J. Reliability assessment of a cyber physical microgrid system in island mode. CSEE J. Power Energy Syst. 2019, 5, 46–55. [Google Scholar] [CrossRef]
  11. Allan, R.N.; Billinton, R. Reliability Evaluation of Power Systems, 2nd ed.; Springer Science & Business Media: New York, NY, USA, 2013. [Google Scholar]
  12. Singh, C.; Jirutitijaroen, P.; Mitra, J. Introduction to power system reliability. In Electric Power Grid Reliability Evaluation, 1st ed.; Wiley-IEEE Press: Hoboken, NJ, USA, 2019; pp. 185–191. [Google Scholar] [CrossRef]
  13. Bagchi, A.; Goel, L.; Wang, P. Generation adequacy evaluation incorporating an aggregated probabilistic model of active distribution network components and features. IEEE Trans. Smart Grid 2018, 9, 2667–2680. [Google Scholar] [CrossRef]
  14. He, J.; Yuan, Z.; Yang, X.; Huang, W.; Tu, Y.; Li, Y. Reliability modeling and evaluation of urban multi-energy systems: A review of the state of the art and future challenges. IEEE Access 2020, 8, 98887–98909. [Google Scholar] [CrossRef]
  15. Bagchi, A.; Goel, L.; Wang, P. Adequacy assessment of generating systems incorporating storage integrated virtual power plants. IEEE Trans. Smart Grid 2019, 10, 3440–3451. [Google Scholar] [CrossRef]
  16. Su, S.; Hu, Y.; He, L.; Yamashita, K.; Wang, S. An assessment procedure of distribution network reliability considering photovoltaic power integration. IEEE Access 2019, 7, 60171–60185. [Google Scholar] [CrossRef]
  17. Qi, X.; Cheng, Q. Imprecise reliability assessment of generating systems involving interval probability. IET Gener. Transm. Distrib. 2017, 11, 4332–4337. [Google Scholar] [CrossRef]
  18. Kadhem, A.A.; Wahab, N.I.A.; Aris, I.; Jasni, J.; Abdalla, A.N. Reliability assessment of power generation systems using intelligent search based on disparity theory. Energies 2017, 10, 343. [Google Scholar] [CrossRef] [Green Version]
  19. Liu, J.; Yu, Y.; Qin, C. Unified two-stage reconfiguration method for resilience enhancement of distribution systems. IET Gener. Transm. Distrib. 2019, 13, 1734–1745. [Google Scholar] [CrossRef]
  20. Zamani-Gargari, M.; Kalavani, F.; Abapour, M.; Mohammadi-Ivatloo, B. Reliability assessment of generating systems containing wind power and air separation unit with cryogenic energy storage. J. Energy Storage 2018, 16, 116–124. [Google Scholar] [CrossRef]
  21. Peng, L.; Hu, B.; Xie, K.; Tai, H.M.; Ashenayi, K. Analytical model for fast reliability evaluation of composite generation and transmission system based on sequential Monte Carlo simulation. Int. J. Electr. Power Energy Syst. 2019, 109, 548–557. [Google Scholar] [CrossRef]
  22. Dunkelberg, H.; Sondermann, M.; Meschede, H.; Hesselbach, J. Assessment of flexibilisation potential by changing energy sources using Monte Carlo simulation. Energies 2019, 12, 711. [Google Scholar] [CrossRef] [Green Version]
  23. Ansari, O.A.; Chung, C.Y. A hybrid framework for short-term risk assessment of wind-integrated composite power systems. IEEE Trans. Power Syst. 2019, 34, 2334–2344. [Google Scholar] [CrossRef]
  24. Wang, Y. An enhanced Markov chain Monte Carlo-integrated cross-entropy method with a partially collapsed Gibbs sampler for probabilistic spinning reserve adequacy evaluation of generating systems. Electr. Power Compon. Syst. 2017, 45, 1617–1628. [Google Scholar] [CrossRef]
  25. Zhao, Y.; Tang, Y.; Li, W.; Yu, J. Composite power system reliability evaluation based on enhanced sequential cross-entropy Monte Carlo simulation. IEEE Trans. Power Syst. 2019, 34, 3891–3901. [Google Scholar] [CrossRef]
  26. Singh, S.S.; Fernandez, E. Reliability assessment of a remote hybrid renewable energy system using Monte Carlo simulation. Int. J. Renew. Energy Technol. 2018, 9, 368. [Google Scholar] [CrossRef]
  27. Dagoumas, A. Assessing the impact of cybersecurity attacks on power systems. Energies 2019, 12, 725. [Google Scholar] [CrossRef] [Green Version]
  28. Tchórzewski, J.; Pytel, M. Neural modeling of the electrical power system development based on IEEE RTS test data. In Proceedings of the Modern Electric Power Systems (MEPS), Wroclaw, Poland, 6–9 July 2015. [Google Scholar] [CrossRef]
  29. Rathore, A.; Patidar, N.P. Reliability assessment using probabilistic modelling of pumped storage hydro plant with PV-Wind based standalone microgrid. Int. J. Electr. Power Energy Syst. 2019, 106, 17–32. [Google Scholar] [CrossRef]
Figure 1. Power system reliability assessment path.
Energies 13 04350 g001
Figure 2. Generation–load model.
Energies 13 04350 g002
Figure 3. Generating unit operating states.
Energies 13 04350 g003
Figure 4. Generation model.
Energies 13 04350 g004
Figure 5. Illustration of time-to-fail (TTF) and time-to-repair (TTR).
Energies 13 04350 g005
Figure 6. Risk model.
Energies 13 04350 g006
Figure 7. Flowchart of the generation system reliability assessment smart notification approach.
Energies 13 04350 g007
Figure 8. Superimposed generation–load model for (a) 0%, (b) 5%, (c) 10%, (d) 15, (e) 25% and (f) 30% load increases.
Energies 13 04350 g008
Figure 9. Loss-of-load evaluation (LOLE) values versus load increment from 0% to 30%.
Energies 13 04350 g009

