IoT-Based Smart Plug for Residential Energy Conservation: An Empirical Study Based on 15 Months’ Monitoring


Department of Architecture, Korea University, Seoul 02841, Korea
Energies 2020, 13(15), 4035; https://doi.org/10.3390/en13154035
Submission received: 6 July 2020
/
Revised: 28 July 2020
/
Accepted: 29 July 2020
/
Published: 4 August 2020
(This article belongs to the Special Issue IoT and Sensor Networks in Industry and Society)
Abstract
:The study examines the implications of educating prosumers regarding Internet of Things (IoT) use and monitoring to reduce power consumption in the home and encourage energy conservation, sustainable living, and behavior change. Over 15 months, 125 households and household owners received training regarding IoT plug equipment, usage monitoring, and energy reduction. A face to face survey was then conducted regarding power consumption reductions, frequency of monitoring, and user satisfaction compared to the previous year. The study found that participating households used around 5% less energy compared to average households. The reduction rate was found to have increased when more appliances were connected to smart plugs and their power usage was monitored more frequently. Power usage also fell in a greater level when participants were more satisfied with being given smart plugs and related education. Moreover, energy reduction rates increase when smart plugs were used for cooling and heating appliances as well as video, audio, and related devices. The results suggest that this program can be used to reduce energy use, which can be beneficial for smart homes and smart cities. The study demonstrates the importance of education from the perspective of energy conservation and related policies.
1. Introduction
Over the past few decades, the electric power system has faced unprecedented demand growth [1,2]. Buildings are one of the main consumers of total electricity; many scholars have discussed the energy management problem and have presented a number of power management schemes in both the domestic and residential sectors [3]. In countries outside the United States, various programs for demand response (DR) in the commercial and industrial field have been implemented [2]. Fully automated DR is the most well-known automation type realized by the home energy management (HEM) system, and research in related fields has produced tangible results.
Since the 1990s, several studies have been conducted on the residential sector, from both the perspective of power production and management, and from residents who are the primary power consumers. Among consumers, the real-time electricity pricing model has a high economic-environmental value than the conventional common flat rates [4]. Real-time monitoring of power consumption is an environmentally sustainable strategy for power usage reduction, helping the user reduce unnecessary power consumption and expenditure.
The advent of the smart city era in the 2000s highlighted the importance of energy management through various methods in smart homes, which were considered the end point. “Smart home” refers to a building equipped with devices that benefit the end users [5,6,7] with the development of application models and services for home networks recognized as a business model for the private sector [8]. These technologies and services increase the user’s satisfaction with the adaptive home service [9]. The emergence of the Internet of Things (IoT) appliances, devices, and applications, especially in the energy sector, is believed to increase the convenience of citizens’ daily lives, bringing about sustainable development in homes and cities [10]. Accordingly, IoT equipment and applications are being considered from various perspectives [11].
The IoT-based smart plug is a fundamental alternative to energy reduction from the user’s point of view. It provides selective access, has an appropriate level of technology and price competitiveness, which is why many companies offer solutions that connect to a single product or other equipment. The market has expanded from $0.71 billion in 2016 to an expected $2.59 billion in 2021 [12].
Points of improvement for the smart plug have been suggested because it is voluntarily chosen, purchased, and utilized in homes where smart home equipment is not installed [13], but it plays a unique role at the midpoint of the energy prosumer era that we currently predict. It has been pointed out, however, that the smart plug by itself is insignificant for energy saving as “you use energy to save energy” [14]. Ultimately, a change in user and household behavior is also required to reduce energy usage [15,16]. Thus, educating consumers on the efficient use and reduction of energy is needed for effective utilization of sustainable energy [17]. This is also a means to enhance the economy, society, and quality of life [18]. From this point of view, the usage of equipment or devices, which are easily accessible and usable by households for energy conservation, and related education on those items are expected to serve as a stepping stone to the production and the management of sustainable energy. In order to ensure the sustainability of related technologies and policy measures, it is necessary to monitor equipment and devices that have been developed and utilized, subsequent changes of users’ behaviors and related education programs.
As such, this study examined apartment residents over 15 months, wherein they used both IoT smart plugs and received education about energy saving. Based on the results, the study analyzed methods the participants used to reduce electricity consumption, factors that affected the reduction, users’ satisfaction level, and the possibility for their sustainable utilization in the future.
1.1. Literature Review
1.1.1. Transition from Consumer to Manager and Prosumer
So far, studies of the energy sector and residential space have been conducted primarily from the perspective of public energy supply and management stability based on power demand. For example, Ref. [19] conducted a study based on game-theory which predicted the balance of power loads and daily schedules for residents and the pricing tariffs of the power supply. Ref. [20] emphasized the importance of scheduling for cost-benefit while presenting and verifying algorithms for the balance and optimization of households’ minimum price and maximum comport. In particular, various technologies, hypotheses, and research models were established and verified to realize the aforementioned smart home and energy management system. However, the reality is that most countries and cities rely on the top-down method of public or large companies for the stable supply and demand of energy. The creation of the energy market’s equilibrium condition is important in the long run to overcome this [21].
From this perspective, the growth and spread of smart city and smart grid concepts since the 2000s have redefined both the role of users, who were previously regarded as consumers of power, and new methods of power supply. The word “prosumer” was coined to exemplify the combination of producer and consumer. Many scholars predict that in the future, communities or individuals will act as major agents of energy production, management, and sales; in some ways, this is already being accomplished [22]. Thus, related research areas will be needed to predict and redefine users’ roles and behaviors, which will expand in the future [23]. The public sector is required to serve its role of changing smart energy management, while simultaneously supplying and monitoring various related goods and services [24].
Except for a few standardized and commercialized technologies, however, there is still a lack of fundamental, foundational, and realistic research from a user’s behavioral point of view, i.e., the most accessible device or service that can change the user’s fundamental energy-saving behavior, and the education needed regarding energy conservation.
At a time when energy consumers have increasingly become “prosumers,” multiple researches have focused on users themselves as well as effects of their voluntary energy reduction from the perspectives of smart home or smart city.
The first point of such discussions is users’ voluntary improvement regarding their energy demand through the revision of energy supply or charging schemes [25,26]. They also emphasize that advanced information and knowledge could lead to structural changes in users’ behaviors [27,28]. Secondly, they highlight control and monitoring led by users with a focus on the development and monitoring of smart home-related technologies such as smart plugs and IoT-based home appliances. Given that IoT, which can actually be controlled by users, is one of the efficient means for saving energy [28,29], the introduction of smart plug/socket and other similar items could reduce the energy consumption in cities and households [30,31]. As related technologies and equipment are still in their development stage, researches on their impacts and utilities have just begun.
Case in point is Ref. [32], who analyzed the survey on the use of smart plugs, which found that the quality of information and the usefulness of control applications, among other things, could enhance users’ satisfaction with the device. However, there still have not been enough researches that review real effects that IoT equipment, such as real smart plugs, has on energy saving as well as their impacts on users in socio-scientific terms.
1.1.2. Importance of Evaluating User Experiences
From the perspective discussed in the previous section, recent studies have focused on measuring citizens’ perceptions in the energy saving and renewable energy field, and suggested the direction of relevant policies based on the results.
In particular, as the field has come to include renewable energies [33] and new energy technologies [26], as well as willingness to pay (WTP) [34] and quality of life (Qol) [35], related research is going beyond the development of existing energy mechanisms and technologies that respond to user demand; it is recognizing citizens as agents of energy consumption and conservation by listening to and analyzing their opinions. In particular, public opinion must be considered when formulating and implementing policies, with an even greater emphasis in democratic societies [36].
Thus, the socio-demographic characteristics, ideology, and implementation of surveys based on individual value judgments in civil society is the basis for energy-related policymaking, which is the basis for public and private investment in related fields [37]. In addition, given that each individual’s energy saving behavior is an important factor for reducing energy consumption [38], and that education is an important tool to achieve this goal [39], monitoring these items is an important factor in diagnosing the present and predicting and preparing for the future.
From this point of view, a number of studies are being carried out to create a framework for the user’s experience of relevant policies, technologies, and equipment, or to monitor the results. In particular, the importance of IoT in transportation, energy, and housing for user experience in smart cities is being emphasized [40], but there is a lack of discussion on practical research about the relationship between users’ perceptions, acceptance, and consumption and the importance of IoT [41]. Moreover, given that only relevant discussions are considered in detail, such as education, monitoring of its effectiveness [42], or reviews of related products and services [43,44], studies that combine user experience and the evaluation of related products or services with various factors that influence power consumption may be necessary in future research.
2. Materials and Methods
2.1. Research Process and Method
The smart plug, which has become more popular recently, is one of the most active and accessible user-led energy saving means but requires education. Study participants were selected in the following manner. They were then provided with smart plugs and energy conservation education, and the results were observed for 15 months.
The selected participants included those 20 years old or older who lived in apartment complexes. Complexes were chosen due to Seoul’s residential characteristics, as apartments are one of the most common housing types in Korea. Selected households (144) had lived in one of four apartment complexes for two years or more. Data on monthly electricity usage for the past year was obtained from either the participants or the complex management office so that usage could be compared with the previous year.
Second, three IoT-based smart multi-tabs, two plugs, and two smart switches were given to participants. The products provided were IoT-based smart plugs and switches, and their functions were power control, scheduling, and timer from far and near distances using 5G, LTE, Wi-Fi, and Bluetooth (offline-based), all of which are currently available on the market. The participants installed the smart plugs and switches as they saw fit and notified the researchers of the type, number, and location of the connecting device.
The apartment complex was between 20 years and 30 years old and used hot water heating supplied by CHP (combined heat and power) plant. Because of this, electricity use in winter was low, except when using electric heaters. However, since air conditioning is used separately in each household, a lot of electricity tends to be used in the summer.
Third, participants received an hour-long education session when they received the smart plug and at one month, two months, four months, six months, eight months, and 12 months after they received the plug. The content of the training included: (1) How to use the IoT-based smart plug and how to use the control application; (2) real-time power monitoring, other methods of use, and comparison workshops on current power consumption compared to the previous year; (3) understanding and reducing the power consumption of home appliances; (4) how to use air-conditioning and heating devices to increase cooling and heating efficiency; (5) two workshops comparing current power consumption compared to the previous year; and (6) purchasing high-efficiency home appliances and government subsidies and reviews.
Fourth, participants’ monthly power usage was collected for the 15 months of the experiment, starting in, March 2019, when the devices were supplied, to May 2020, when the experiment ended. Prior to the experiment, a preliminary survey was conducted on users’ gender, age, number of household members, and area of residence; during and at the end of the experiment, a survey was conducted on the number of times the device control application was monitored, satisfaction level, and willingness to participate in the program.
2.2. Research Models and Variables
A total of 125 survey results who attended more than 80% of the education programs were collected and then analyzed. First, a pre- and post-use comparative evaluation was conducted. Participant expectations about the product before use were measured and compared with the satisfaction level after use. In terms of actual power usage, the results and effects were analyzed by comparing and analyzing the average monthly power usage for 15 months before using the product with the power usage for 15 months during the experiment. For the two before and after comparisons, the paired-samples t-test was performed.
Second, the factors affecting the increase and decrease in power usage were analyzed. The reduction in power consumption based on pre- and post-use power usage was set up as the dependent variable, while the number of installations of the supplied device, the number of times power and status were controlled and monitored using the application, and the socio-economic characteristics were set up as independent variables. Given that users’ energy conservation can be derived from the results of relevant devices supplied and training, the study comprehensively examined which factors affected the increase or decrease of electricity consumption by adding the satisfaction level measured in the survey as an independent variable. The reason socio-economic variables such as gender, age, and income were included in the regression model is to provide a basis for future public policymaking or support [45,46]. Additionally, since residential area variables tend to increase the demand for electricity as the size of the dwelling increases, education regarding the use of, and then using, smart plugs was expected to reduce power usage.
Third, with the dependent variable as the amount of power reduced, the study examined which appliances affected participants’ reduced power usage through an additional regression analysis that used the supplied plug and the connected home appliances as independent variables. The reduced power usage depended on the user’s lifestyle or the amount of power consumed by the home appliance, but it was expected that this analysis would provide insight into the user’s tendency to install smart plugs and the impact of home appliances on power reduction, and that the results would provide a basis for the improvement of the related curriculum.
The dependent variables and the types and contents of each of the independent variables, which combine the contents of these two regression models, are shown in Table 1 and Table 2.
This study used a multiple regression model with several independent variables, but since the measurement scale is different, all the variables included were converted to Z-score and used for the regression model. The equation for the regression model is as follows:
where Yi is the ith observation of the D.V., β0 is the intercept, β1⋯βk is the slope coefficient. For each of the I.V. εi is the error term for the ith observation. F for measuring the overall significance of the regression model was calculated as follows:
where R2 is for RSS is residual sum of squares and SSE is for the sum of squared estimate of errors. Additionally, MSR is for regression mean square and MSE is for mean square error. Since the value increases the more I.V. there are in the multiple regression, R2 was used as the criterion for selecting I.V., whose value is the following. Variance inflation factor (VIF) was used to measure multicollinearity between I.V. and the equation is shown below to the right.
where R2 is for sample R-square, is for total sample size, and is for number of predictors.
3. Results
3.1. Overview
In this study, 144 people participated in the training and smart plug and switch usage monitoring programs. The results were monitored over 15 months. However, for quantitative analysis, 19 households were excluded because they either replaced or installed new living and kitchen appliances or electric heaters during the period, moved to other areas, or whose attendance was less than 60%. Results from the final 125 households were analyzed. The socio-economic characteristics for the 125 people are shown in Table 3 below. The respondents had a mean age of 40.56, a mean residential area of 87.89 m2, and an average of 2.60 people per household. This was slightly higher than the average, according to government statistics, of 2.4 people per household [47], and higher than the mean residential area of 84.2 m2 for complex residential areas.
In this study, 144 people participated in the training and smart plug and switch usage monitoring programs. The results were monitored over 15 months. However, for quantitative analysis, 19 households were excluded because they either replaced or installed new living and kitchen appliances or electric heaters during the period, moved to other areas, or whose attendance was less than 60%. Results from the final 125 households were analyzed. The socio-economic characteristics for the 125 people are shown in Table 3 above. The respondents had a mean age of 40.56, a mean residential area of 87.89 m2, and an average of 2.60 people per household. This was slightly higher than the average, according to government statistics, of 2.4 people per household [47], and higher than the mean residential area of 84.2 m2 for complex residential areas.
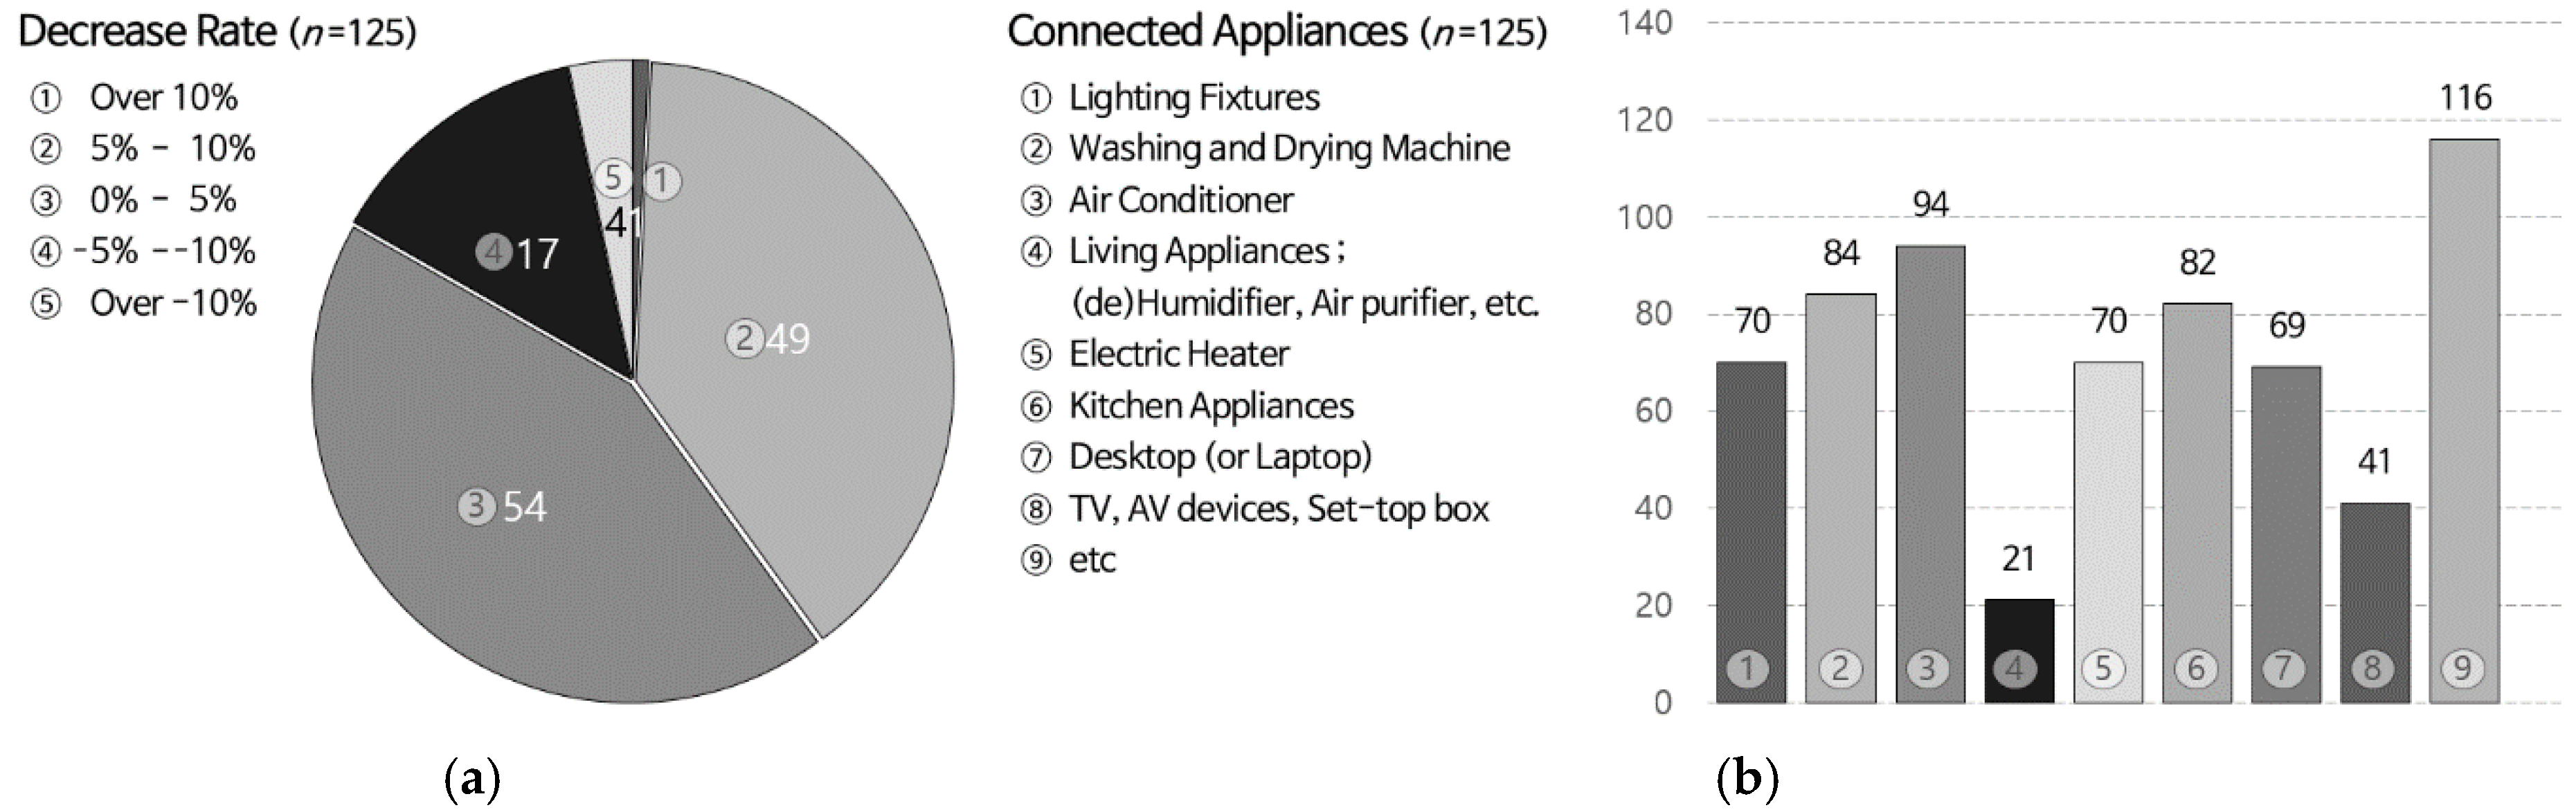
Prior to the regression model analysis, the effects of the corresponding training program and the use of smart plugs and switches were reviewed. The results showed that for the 15 months, participants had used an average of 204.19 kWh per month during the previous year, but toward the end of the experiment they were using an average of 196.57 kWh per month, showing a reduction of power consumption by about 3.53%. Figure 1 shows the decrease rates for the 125 participating households.
Participants were found to have connected at least two and up to 11 appliances to the smart plugs and switches, averaging 5.18. As shown in Figure 2, the satisfaction level for the six training sessions and smart plug supply programs conducted over a year averaged 5.72 points out of 10. On average, participants’ willingness to participate in further smart plug usage and related education programs was 6.18, which is higher than the satisfaction level.
3.2. Effects of Home Energy Savings by The Program
A paired-samples t-test was conducted to verify the quantitative difference between the amount of power reduction and the year-on-year reduction in power usage, measured over the 15 months experiment (see Table 4); the t-value came to 10.666, meaning that the reduced amount of power usage before and after this program shows a statistically significant difference. Moreover, given that the average power consumption of apartment complexes where program participants reside increased by about 1.69% year-on-year, participants in this program reduced power usage through relevant devices and training.
A paired-samples t-test was conducted to verify the quantitative difference between the amount of power reduction and the year-on-year reduction in power usage, measured over the 15 months experiment; the t-value came to 10.666, meaning that the reduced amount of power usage before and after this program shows a statistically significant difference. Moreover, given that the average power consumption of apartment complexes where program participants reside increased by about 1.69% year-on-year, participants in this program reduced power usage through relevant devices and training.
In order to measure the actual impact on the power reduction, this study selected a control group involving a total of 375 households and compared their average power consumption with that of program participants over the same period. The control group was chosen from the same four apartment complexes as those at which the participants reside. Samples from each complex were selected first in consideration of the distribution of the participants, and the final members were randomly chosen among the residents whose living space is the same as that of the participants. The number of households in the control group was three times larger than that of the program participants. In order to compare the average power consumption between the two groups, this study conducted independent two-sample t-test. The result showed that there found statistical differences between them, just as shown in Table 5.
In details, the average power consumption for the 15 months before the launch of the program came to 204.18 kWh and 203.20 kWh, respectively, which showed no statistical differences.
However, the Table 5 for 15 months after the program stood at 196.56 kWh and 206.84 kWh, respectively, which shows a 10-kWh gap, or about 4.97%. The t value is −2.528, which means that the reduction of power consumption between the participants and the control group shows differences in the statistically significant level. This can be translated into that the distribution of related equipment and providing education have a significant impact on the reduction of power consumption.
The analysis results of the two regression models that identify factors affecting participants’ power usage are as follows. First, the socio-economic variables, smart plug and switch usage characteristics, and the program’s satisfaction level, including training, were input as independent variables (see Table 6 and Table 7) to measure factors affecting power usage reduction.
The adjusted R2 showed a high explanatory power of 77.2%. The Durbin–Watson value was 1.709, which is close to 2 and not close to 0 or 4. In short, there was no correlation between the residuals, indicating that the regression model was appropriate. The F value was p = 0.000 to 60.833, indicating that the regression line is suitable for the model. Based on the t value, the independent variable with the highest explanatory power was found to be the program that included the provision and education of the smart plug and switch (t = 6.715, p = 0.000). Providing appropriate equipment to participants and educating them regarding energy-saving had the most significant impact on power usage. Results also showed that the number of smart plug and switch installations had a high impact on energy use reduction (t = 3.072, p = 0.003). These results suggest that merely using smart plugs and switches, which can cut off used power or standby power from the inside and outside of the dwelling, can provide an adequate level of power-saving. However, given that the control and real-time usage monitoring through related applications of the smart plug and switch, i.e., user-driven monitoring, contribute to power savings in use (t = 2.355, p = 0.020), the combined-comprehensive consideration and action of the physical–human factors to reduce power usage may increase the reduction of power consumption. However, the socio-economic characteristics mentioned in many studies were not significant in this regression model. Gender, age, income, and residential area were not relevant to the use of smart plugs and switches and reduced electricity use through related education.
The results of regression model II are shown in Table 8 and Table 9. The model’s dependent variable is the mean reduction rate of participants’ power consumption over 15 months, and the independent variable is each type of household appliance connected to a smart plug and switch. Based on the adjusted R2 value, the research model showed 59.9% and a Durbin–Watson value of 1.765, suggesting with a relatively high explanation power that it contributed quantitatively to reduced power consumption by appliances connected to smart plugs and switches. When considering independent variables that affect the dependent variables based on the t-values, TV sets, set-top boxes, and AV equipment that were mostly located in the living room had the highest effect, even though only 41 households had installed them (t = 4.729, p = 0.000). Smart plugs of seasonal home appliances installed in general electric heaters (t = 3.668, p = 0.001) and air conditioners (t = 3.578, p = 0.001) were found to have affected power usage reduction. Given that during the experiment, living room appliances such as set-top boxes consume the most standby power in Korean households [48], the actual power cut-off through smart plugs has a positive effect on energy reduction. In addition, cut-off of idle power and the power control of household appliances such as air purifiers, humidifiers, and dehumidifiers, which have been increasing recently, were shown to affect reduction of power use. Washing machines and dryers were also found to have affected the dependent variables; participants received education regarding efficient use and power reduction with these appliances. However, desktop computers and lighting devices using smart switches, known to use relatively high standby power, had no significant impact on the dependent variables, though they were installed in 70 and 69 households respectively, which are relatively high rates.
4. Conclusions and Discussion
This study examined the possibility of reducing electricity use in homes through users’ voluntary education and use of IoT-based smart plugs and switches to leap into smart cities and energy prosumers. Unlike previous studies that present the results of an energy data analysis at the urban level, or analyze the results of collective education for students or practitioners, actual members of households voluntarily installed smart plugs and switches, and monitored and quantitatively verified the trends in energy-reduction effects through training. Satisfaction with this program, which includes supplied devices and education, had the most significant impact on the power savings of each household; the number of applications designed for real-time power usage monitoring using applications, for which training was provided, had a positive effect on power savings at a relatively high rate. It is therefore expected that these strategies can impact energy savings in efficient homes if the program is implemented in collective residential areas such as apartment complexes with relatively clear management entities.
These results can be used as a basis for future education regarding how equipment such as smart switches and plugs can be used. Differences in the environmental, political, and economic size and characteristics of countries and cities will need to be considered. However, this study showed through a quantitative analysis that power management for TVs, set-top boxes, AV devices and air-conditioning and heating appliances, which are frequently used and have a relatively high standby power in the home, affects energy reduction over a long period of time. These generalized outcomes could lead to in-depth training and voluntary participation for individuals in related training, which could ultimately lead to user-led energy reduction.
However, there are practical limitations to the methods proposed in this study. The average energy reduction for the 125 samples used in this study was around 7.62 kWh. Based on the average household usage of about 200 kWh, the average monthly cost savings was about 1.2 USD based on the calculation method for the target’s electricity costs. This means that consumers need years of use to recover their initial cost of investment. Thus, although it can have a relatively positive effect in new housing and housing complexes where various home IoT facilities are installed and provided during the construction phase, willingness to purchase related equipment may be reduced in existing housing and residential complexes; this will reduce effectiveness. Thus, in addition to tax reductions on the purchase of low-power home appliances when making similar plans, the relevant agencies, local governments, or the central government need to secure budget funds to introduce related equipment and education when implementing various residential projects. It is also necessary to provide a foundation for enhancing and implementing energy saving awareness without discrimination. Although many studies examined whether socio-economic characteristics of households affected energy savings, the results of this study model showed that such characteristics were not significant for the dependent variables. Given that there are differences in related programs for each country, city, and region, and that the study was limited to reducing power usage for those who participated in the program instead of samples based on population, further research will need to distinguish between the implications preceding studies and the similarities and differences of this study’s topics.
Nevertheless, this study is meaningful in that it produced relevant results through long-term monitoring from a practical point of view of energy saving. It is also meaningful in that it provided a direction for energy saving from the perspective of future policy, education, citizens during the monitoring, and housing, a residential space for citizens.
Funding
This research received no external funding.
Acknowledgments
I thank the participant of this program who willingly participated whole process and provided their valuable research materials. I am also thankful to the anonymous reviewers for their useful suggestions.
Conflicts of Interest
The authors declare no conflict of interest.
References
- U.S. Energy Information Administration. Annual Energy Outlook 2011: With Projections to 2035; EIA: Washington, DC, USA, 2011. [Google Scholar]
- Pipattanasomporn, M.; Kuzlu, M.; Rahman, S. An algorithm for intelligent home energy management and demand response analysis. IEEE Trans. Smart Grid 2012, 3, 2166–2173. [Google Scholar] [CrossRef]
- Anvari-Moghaddam, A.; Monsef, H.; Rahimi-Kian, A. Optimal smart home energy management considering energy saving and a comfortable lifestyle. IEEE Trans. Smart Grid 2014, 6, 324–332. [Google Scholar] [CrossRef]
- Mohsenian-Rad, A.H.; Leon-Garcia, A. Optimal residential load control with price prediction in real-time electricity pricing environments. IEEE Trans. Smart Grid 2010, 1, 120–133. [Google Scholar] [CrossRef]
- Pedrasa, M.A.A.; Spooner, T.D.; MacGill, I.F. Coordinated scheduling of residential distributed energy resources to optimize smart home energy services. IEEE Trans. Smart Grid 2010, 1, 134–143. [Google Scholar] [CrossRef]
- Jiang, L.; Liu, D.Y.; Yang, B. Smart Home Research, Proceedings of the 2004 International Conference on Machine Learning and Cybernetics, Shanghai, China, 26–29 August 2004; IEEE Cat. No. 04EX826; IEEE: Piscataway, NY, USA, 2004; pp. 659–663. [Google Scholar]
- Ricquebourg, V.; Menga, D.; Durand, D.; Marhic, B.; Delahoche, L.; Loge, C. The Smart Home Concept: Our Immediate Future. In Proceedings of the 2006 1st IEEE International Conference on E-learning in Industrial Electronics, Hammamet, Tunisia, 18–20 December 2006; pp. 23–28. [Google Scholar]
- Shon, T.; Koo, B.; Choi, H.; Park, Y. Security architecture for IEEE 802.15. 4-based wireless sensor network. In Proceedings of the 2009 4th International Symposium on Wireless Pervasive Computing (IEEE), Melbourne, VIC, Australia, 11–13 February 2009; pp. 1–5. [Google Scholar]
- Wang, C.; Liu, X.; Wang, H. A framework of intelligent agent based middleware for context aware computing. In Proceedings of the 2009 Fifth International Conference on Natural Computation (IEEE), Tianjin, China, 14–16 August 2009; pp. 107–110. [Google Scholar]
- Mavroudi, A.; Divitini, M.; Gianni, F.; Mora, S.; Kvittem, D.R. Designing IoT applications in lower secondary schools. In Proceedings of the 2018 IEEE Global Engineering Education Conference (EDUCON), Tenerife, Spain, 17–20 April 2018; pp. 1120–1126. [Google Scholar]
- Lee, G.M.; Crespi, N.; Choi, J.K.; Boussard, M. Internet of things. In Evolution of Telecommunication Services; Springer: Berlin/Heidelberg, Germany, 2013; pp. 257–282. [Google Scholar]
- Global Smart Plug Market—Drivers and Forecast from Technavio. Available online: https://www.businesswire.com/news/home/20170228005699/en/Global-Smart-Plug-Market---Drivers-Forecast (accessed on 15 June 2020).
- Musleh, A.S.; Debouza, M.; Farook, M. Design and implementation of smart plug: An Internet of Things (IoT) approach. In Proceedings of the 2017 International Conference on Electrical and Computing Technologies and Applications (ICECTA), (IEEE), Ras Al Khaimah, UAE, 21–23 November 2017; pp. 1–4. [Google Scholar]
- Will a Smart Plug Pay For Itself? Available online: https://www.howtogeek.com/424558/will-a-smart-plug-pay-for-itself/ (accessed on 15 June 2020).
- Hori, S.; Kondo, K.; Nogata, D.; Ben, H. The determinants of household energy-saving behavior: Survey and comparison in five major Asian cities. Energy Policy 2013, 52, 354–362. [Google Scholar] [CrossRef]
- Ouyang, J.; Hokao, K. Energy-saving potential by improving occupants’ behavior in urban residential sector in Hangzhou City, China. Energy Build. 2009, 41, 711–720. [Google Scholar] [CrossRef]
- Alexandru, A.; Jitaru, E. Education for Energy Saving in the House, Proceedings of the WSEAS International Conference on Energy Planning, Energy Saving, Environmental Education (EPESE’07), Arcachon, France, 14–16 October 2007; WSEAS Press: Athens, Greece, 2007; pp. 84–89. [Google Scholar]
- Ntona, E.; Arabatzis, G.; Kyriakopoulos, G.L. Energy saving: Views and attitudes of students in secondary education. Renew. Sustain. Energy Rev. 2015, 46, 1–15. [Google Scholar] [CrossRef]
- Mohsenian-Rad, A.H.; Wong, V.W.; Jatskevich, J.; Schober, R.; Leon-Garcia, A. Autonomous demand-side management based on game-theoretic energy consumption scheduling for the future smart grid. IEEE Trans. Smart Grid 2010, 1, 320–331. [Google Scholar] [CrossRef] [Green Version]
- Du, P.; Lu, N. Appliance commitment for household load scheduling. IEEE Trans. Smart Grid 2011, 2, 411–419. [Google Scholar] [CrossRef]
- Böhringer, C.; Rutherford, T.F. Combining bottom-up and top-down. Energy Econ. 2008, 30, 574–596. [Google Scholar] [CrossRef] [Green Version]
- Parag, Y.; Sovacool, B.K. Electricity market design for the prosumer era. Nat. Energy 2016, 1, 1–6. [Google Scholar] [CrossRef]
- Yue, T.; Long, R.; Chen, H. Factors influencing energy-saving behavior of urban households in Jiangsu Province. Energy Policy 2013, 62, 665–675. [Google Scholar] [CrossRef]
- Han, D.M.; Lim, J.H. Design and implementation of smart home energy management systems based on zigbee. IEEE Trans. Consum. Electron. 2010, 56, 1417–1425. [Google Scholar] [CrossRef]
- Carroll, J.; Lyons, S.; Denny, E. Reducing household electricity demand through smart metering: The role of improved information about energy saving. Energy Econ. 2014, 45, 234–243. [Google Scholar] [CrossRef]
- Gram-Hanssen, K. Standby consumption in households analyzed with a practice theory approach. J. Ind. Ecol. 2010, 14, 150–165. [Google Scholar] [CrossRef]
- Faruqui, A.; Sergici, S.; Sharif, A. The impact of informational feedback on energy consumption—A survey of the experimental evidence. Energy 2010, 35, 1598–1608. [Google Scholar] [CrossRef]
- Arasteh, H.; Hosseinnezhad, V.; Loia, V.; Tommasetti, A.; Troisi, O.; Shafie-khah, M.; Siano, P. IoT-based smart cities: A survey. In Proceedings of the 2016 IEEE 16th International Conference on Environment and Electrical Engineering (EEEIC), Florence, Italy, 7–10 June 2016; pp. 1–6. [Google Scholar]
- Arshad, R.; Zahoor, S.; Shah, M.A.; Wahid, A.; Yu, H. Green IoT: An investigation on energy saving practices for 2020 and beyond. IEEE Access 2017, 5, 15667–15681. [Google Scholar] [CrossRef]
- Tsai, K.L.; Leu, F.Y.; You, I. Residence energy control system based on wireless smart socket and Iot. IEEE Access 2016, 4, 2885–2894. [Google Scholar] [CrossRef]
- Lutui, P.R.; Cusack, B.; Maeakafa, G. Energy efficiency for IoT devices in home environments. In Proceedings of the 2018 IEEE International Conference on Environmental Engineering (EE), Milan, Italy, 12–14 March 2018; pp. 1–6. [Google Scholar]
- Ghazal, M.; Akmal, M.; Iyanna, S.; Ghoudi, K. Smart plugs: Perceived usefulness and satisfaction: Evidence from United Arab Emirates. Renew. Sustain. Energy Rev. 2016, 55, 1248–1259. [Google Scholar] [CrossRef] [Green Version]
- Tanujaya, R.R.; Lee, C.Y.; Woo, J.; Huh, S.Y.; Lee, M.K. Quantifying Public Preferences for Community-Based Renewable Energy Projects in South Korea. Energies 2020, 13, 2384. [Google Scholar] [CrossRef]
- Buylova, A.; Steel, B.S.; Simon, C.A. Public perceptions of energy scarcity and support for new energy technologies: A western US case study. Energies 2020, 13, 238. [Google Scholar] [CrossRef] [Green Version]
- Streimikiene, D.; Balezentis, T. Willingness to Pay for Renovation of Multi-Flat Buildings and to Share the Costs of Renovation. Energies 2020, 13, 2721. [Google Scholar] [CrossRef]
- Druică, E.; Goschin, Z.; Ianole-Călin, R. Energy Poverty and Life Satisfaction: Structural Mechanisms and Their Implications. Energies 2019, 12, 3988. [Google Scholar] [CrossRef] [Green Version]
- Besley, J.C. The state of public opinion research on attitudes and understanding of science and technology. Bull. Sci. Technol. Soc. 2013, 33, 12–20. [Google Scholar] [CrossRef]
- Gao, L.; Wang, S.; Li, J.; Li, H. Application of the extended theory of planned behavior to understand individual’s energy saving behavior in workplaces. Resour. Conserv. Recycl. 2017, 127, 107–113. [Google Scholar] [CrossRef]
- Aktamis, H. Determining energy saving behavior and energy awareness of secondary school students according to socio-demographic characteristics. Educ. Res. Rev. 2011, 6, 243–250. [Google Scholar]
- Latre, S.; Leroux, P.; Coenen, T.; Braem, B.; Ballon, P.; Demeester, P. City of Things: An Integrated and Multi-Technology Testbed for IoT Smart City Experiments. In Proceedings of the 2016 IEEE International Smart Cities Conference (ISC2), Trento, Italy, 12–15 September 2016; pp. 1–8. [Google Scholar]
- Yan, Z.; Zhang, P.; Vasilakos, A.V. A survey on trust management for Internet of Things. J. Netw. Comput. Appl. 2014, 42, 120–134. [Google Scholar] [CrossRef]
- Cheng, H.C.; Liao, W.W. Establishing a lifelong learning environment using IOT and learning analytics. In Proceedings of the 2012 14th International Conference on Advanced Communication Technology (ICACT) (IEEE), Pyeongchang, Korea, 19–22 February 2012; pp. 1178–1183. [Google Scholar]
- Lee, W.J. Satisfiers and dissatisfiers of smart IoT service and customer attitude. Adv. Sci. Technol. Lett. 2016, 126, 124–127. [Google Scholar]
- Chatterjee, S.; Kar, A.K.; Gupta, M. Success of IoT in smart cities of India: An empirical analysis. Gov. Inf. Q. 2018, 35, 349–361. [Google Scholar] [CrossRef]
- Martinsson, J.; Lundqvist, L.J.; Sundström, A. Energy saving in Swedish households. The (relative) importance of environmental attitudes. Energy Policy 2011, 39, 5182–5191. [Google Scholar] [CrossRef]
- Wyatt, P. A dwelling-level investigation into the physical and socio-economic drivers of domestic energy consumption in England. Energy Policy 2013, 60, 540–549. [Google Scholar] [CrossRef]
- Seoul Statistics Service. Available online: http://data.seoul.go.kr/dataService/boardList.do#submenu1 (accessed on 25 March 2020).
- Blog of Ministry of Trade, Industry and Energy. Available online: https://blog.naver.com/mocienews/221436213752 (accessed on 1 July 2020).
Figure 1.
Result of electric power decrease rate of the program participants for 15 months compared to: (a) the same month last year; (b) connected appliances with smart plugs and switches.
Figure 1.
Result of electric power decrease rate of the program participants for 15 months compared to: (a) the same month last year; (b) connected appliances with smart plugs and switches.

Figure 2.
Results: (a) Number of installed smart plugs and switches; (b) satisfaction with the program; and (c) willingness to continue to participate.
Figure 2.
Results: (a) Number of installed smart plugs and switches; (b) satisfaction with the program; and (c) willingness to continue to participate.


Table 1.
Dependent (D.V.) and Independent (I.V.) Variables of Research Model I.
| Class | Variable | Scales |
|---|---|---|
| D.V. | Average Reduction Rate of Electricity Consumption 1 | Percentage |
| I.V. (Socio-economic Characteristics) | Gender (Male/Female) | Selective |
| Age of Respondent | Number | |
| Area of Housing | m2 | |
| Monthly Income per Household | USD | |
| I.V. (Observed Variables) | Frequency of Monitoring Using an Application | Number |
| Number of home Appliances Connected with Smart Plugs | Number | |
| Overall Satisfaction of Smart Plugs and Education | Likert (11pts) |
1 Mean of reduction rate for 15 months compared to the same month last year.
Table 2.
Dependent (D.V.) and Independent (I.V.) Variables of Research Model II.
| Class | Variable | Scales |
|---|---|---|
| D.V. | Average reduction Rate of Electricity Consumption 1 | Percentage |
| I.V. (Home Appliances Connected with Smart Plugs) | Lighting Fixtures | Selective (Y = 1, N = 0) |
| Washing and Drying Machine | ||
| Kitchen Appliances | ||
| Air Conditioner | ||
| Living Appliances: (de)Humidifier, Air purifier, etc. | ||
| Electric Heater | ||
| Desktop (or Laptop) | ||
| TV, AV devices, Set-top box | ||
| Etc. |
1 Average value for 15 months compared to the same month last year.
Table 3.
Result of General Characteristics of Respondents (n = 125).
| Variable | Class | Number (n) | Percentage |
|---|---|---|---|
| Gender (Over 20) | Male | 81 | 64.80% |
| Female | 44 | 35.20% | |
| Age Group | 20–30 | 30 | 24.00% |
| 31–40 | 39 | 31.00% | |
| 41–50 | 29 | 23.00% | |
| 51–60 | 13 | 10.00% | |
| Over 60 | 14 | 11.00% | |
| Education | Under Secondary Education | 0 | 0.00% |
| Under Higher Education | 51 | 40.80% | |
| Associates Degree or Higher | 74 | 59.20% | |
| Average Income 1 | 1250–2083 USD | 11 | 8.80% |
| 2083–2500 USD | 23 | 18.40% | |
| 2500–3333 USD | 52 | 41.60% | |
| 3333–4167 USD | 28 | 22.40% | |
| Over 4166 USD | 11 | 8.80% | |
| Number of People in a Households | 1–2 | 14 | 11.20% |
| 3 | 44 | 35.20% | |
| 4 | 45 | 36.00% | |
| 5 | 22 | 17.60% | |
| Over 5 | 0 | 0.00% | |
| Area of Residential Area | 52–59 m2 | 34 | 27.20% |
| 59–80 m2 | 25 | 20.00% | |
| 81–110 m2 | 31 | 24.80% | |
| 111–130 m2 | 9 | 7.20% | |
| Over 130 m2 | 26 | 20.80% |
1 Average value for 15 months compared to the same month last year.
Table 4.
Comparison of Home Energy Saving Rate Before and After Program Participation.
| Variables | Mean | Std. | t-Value | p |
|---|---|---|---|---|
| Before program participation | 204.19 kWh | 28.411 | 10.666 | 0.000 1 |
| After program participation | 196.57 kWh | 25.474 |
1p < 0.000.
Table 5.
Comparison of Energy Saving Rate Before and After Program with control group.
| Variables | Mean | S.D. 2 | t-Value | p | ||
|---|---|---|---|---|---|---|
| Participants | C.G.1 | Participants | C.G.1 | |||
| Average power usage before program | 204.19 kWh | 203.20 kWh | 28.411 | 33.505 | 0.250 | 0.614 |
| Average power usage after program | 196.58 kWh | 206.84 kWh | 31.474 | 36.591 | –2.528 | 0.012 * |
1 control group, 2 standard deviation, * p < 0.05.
Table 6.
Result of Regression Model I.
| Variables (Std. Values) | Std. Error | β | t-Value | p-Value 1 | Tolerance |
|---|---|---|---|---|---|
| (constant) | 0.165 | − | 21.456 | 0.000 | − |
| Gender | 0.207 | 0.079 | 1.476 | 0.143 | 0.637 |
| Age of Respondent | 0.222 | −0.062 | −1.082 | 0.282 | 0.556 |
| Area of Housing | 0.205 | 0.088 | 1.658 | 0.100 | 0.647 |
| Monthly Income per Household | 0.169 | −0.028 | −0.635 | 0.527 | 0.954 |
| Frequency of Monitoring | 0.275 | 0.168 | 2.355 | 0.020 * | 0.361 |
| No. of Appliances with Smart Plugs | 0.264 | 0.211 | 3.072 | 0.003 ** | 0.391 |
| Overall satisfaction of Program | 0.258 | 0.451 | 6.715 | 0.000 *** | 0.409 |
1 * p < 0.05, ** p < 0.01, *** p < 0.001.
Table 7.
Summary of Regression Model I.
| R | R2 | Adjusted R2 | F-Statistics | p-Value 1 | Durbin–Watson |
|---|---|---|---|---|---|
| 0.886 | 0.784 | 0.772 | 60.833 | 0.000 *** | 1.709 |
1 *** p < 0.001.
Table 8.
Result of Regression Model II.
| Variables (Std. Values) | Std. Error | β | t-Value | p-Value 1 | Tolerance |
|---|---|---|---|---|---|
| (constant) | 0.218 | − | 16.194 | 0.000 *** | − |
| Lighting Fixtures | 0.238 | 0.115 | 1.858 | 0.066 | 0.848 |
| Washing and Drying Machine | 0.249 | 0.194 | 2.994 | 0.003 ** | 0.774 |
| Air Conditioner | 0.246 | 0.234 | 3.668 | 0.000 *** | 0.793 |
| Living Appliances | 0.230 | 0.192 | 3.213 | 0.002 ** | 0.908 |
| Electric Heater | 0.237 | 0.220 | 3.578 | 0.001 ** | 0.852 |
| Kitchen Appliances | 0.248 | 0.183 | 2.846 | 0.005 ** | 0.778 |
| Desktop (or Laptop) | 0.256 | 0.096 | 1.440 | 0.153 | 0.731 |
| TV, AV devices, Set-top box, | 0.239 | 0.293 | 4.729 | 0.000 *** | 0.841 |
| Etc. | 0.263 | 0.242 | 3.543 | 0.001 ** | 0.693 |
1 ** p < 0.01, *** p < 0.001.
Table 9.
Summary of Regression Model II.
| R | R2 | Adjusted R2 | F-Statistics | p-Value | Durbin-Watson |
|---|---|---|---|---|---|
| 0.793 | 0.628 | 0.599 | 21.582 | 0.000 *** | 1.765 |
*** p < 0.01.
© 2020 by the author. Licensee MDPI, Basel, Switzerland. This article is an open access article distributed under the terms and conditions of the Creative Commons Attribution (CC BY) license (http://creativecommons.org/licenses/by/4.0/).
Share and Cite
MDPI and ACS Style
Oh, J. IoT-Based Smart Plug for Residential Energy Conservation: An Empirical Study Based on 15 Months’ Monitoring. Energies 2020, 13, 4035. https://doi.org/10.3390/en13154035
AMA Style
Oh J. IoT-Based Smart Plug for Residential Energy Conservation: An Empirical Study Based on 15 Months’ Monitoring. Energies. 2020; 13(15):4035. https://doi.org/10.3390/en13154035
Chicago/Turabian StyleOh, Jooseok. 2020. "IoT-Based Smart Plug for Residential Energy Conservation: An Empirical Study Based on 15 Months’ Monitoring" Energies 13, no. 15: 4035. https://doi.org/10.3390/en13154035
Note that from the first issue of 2016, this journal uses article numbers instead of page numbers. See further details here.