1. Introduction
The strict link between climate change and energy conversion is today a matter of fact. After the medium- and long-term goals revision at the 24th Conference of the Parties (COP) in 2018, key European targets for 2030 goals were redefined as following:
at least 40% cuts in greenhouse gas emissions (w.r.t. 1990 levels);
at least 32% share for renewable energy;
at least 32.5% improvement in energy efficiency.
More stringent commitments toward the reduction of harmful emissions in the atmosphere by human activities were decided during the COP 25 in Madrid by some countries, such as Denmark, that committed to reach 70% below their 1990 emissions in the next eleven years.
Currently, 62.76% of electric power generation is derived from fossil fuel power plants [
1], thus making renewable energy sources necessarily and increasingly considered as more sustainable alternatives. Biomass deserves particular interest due to its CO
2 neutrality over a lifecycle perspective and its availability that is seasonal, but actually less dependent upon weather conditions with respect to solar and wind power [
2]. Local energy valorization of residuals is a viable opportunity for decarbonization implemented in decentralized zones, ensuring benefits on air quality, rational use of resources, and autonomy of operation with respect to the centralized energy infrastructure [
3].
In green protected areas, active forest management practices and wildfire prevention cutting can guarantee a continuous accessibility to pruning residues without damaging local ecosystems [
4] while, in a more general vision, appropriate care of vegetation along rivers, gardens, and urban parks can also be a source of valuable material by simultaneously assuring biodiversity. Local production of food goods can also be exploited as a source of materials otherwise needing proper disposal, with the consequent effort and costs. In Europe, there is a potential of biomass availability ranging between 615 and 728 million tons [
5,
6]. In Italy, there may be agricultural residues for about 12.8 million tons per year. Of these, 9.3 million tons can be derived from herbaceous crops (straw, sunflower sticks, and corn stalks) produced primarily in the North and 3.5 million tons from arboreal ones (olive and fruit trees and vines), with a large fraction produced in the South [
7].
Lignocellulosic biomasses have the potential to compete with fossil fuels thanks to the same thermochemical conversion process (i.e., pyrolysis, gasification, and combustion). However, the deployment of biomass-based energy systems has been delayed by the difficulty of working with feedstocks of different origin and composition. Fossil fuels are high-energy standard products, easily used in a variety of mature energy conversion systems. Conversely, biomass has a lower energy content, mainly as a consequence of its higher oxygen content [
8]. Moreover, biomass is also a relatively light and bulky material, i.e. the volume of biomass feedstock to be handled can be large, with all the consequent problems for storage and transportation. It is, in fact, a fibrous material with a moisture content higher than fossil fuels, typically ranging between 30 and 80% wt., depending on the season, weather, and type [
9]. The use of fuels with high moisture content decreases the overall energy efficiency of a power plant due to the need of energy for latent heat of vaporization. In addition to reducing the net heating value, the high moisture also determines an increase in the costs for transportation and storage, thus affecting profit margins and the convenience of biomass-powered plants, especially on the higher scales of power. On the other hand, biomass drying has little benefit for the improvement on properties such as the oxygen content, the poor grindability, and the hygroscopic behavior. Moreover, biomass typically cannot be stored outdoor because it is prone to natural decomposition over time and breakdown with exposure to moisture, pests, aerobic bacteria, and other environmental conditions, with consequent loss of quality and off-gas emissions. As a consequence, pre-treatments options must often be considered to enhance the biomass characteristics as a fuel, thus making for large-scale utilization of these materials for bioenergy production being often inefficient and uneconomic.
The direct use of biomass in firing technology has some technological problems, like the combustor fouling and the corrosion caused by the alkaline nature of biomass ashes. Slagging and fouling reduce the heat transfer at the combustor surfaces and cause corrosion end erosion problems, that practically reduce the lifetime of the equipment [
10]. Among the energy conversion processes, biomass gasification is a promising technology for energy generation. Waste material including agricultural and food processing residuals, as well as the humid fraction of municipal solid waste, are suitable for the potential use as biomass feedstock [
11], for direct use of biofuels generation by thermochemical conversion [
12]. Syngas, which can derive from the combined use of different biomasses, such as grapevine pruning mixed with coal [
13] or woody biomass and sewage sludge [
14], can be employed in micro-turbines under some conditions [
15,
16], but different issues have to be faced due to its low heating value and the variability on its composition. Combined heat and power (CHP) technologies based on biomass gasification have been intensively developed over the past years [
17,
18] and their technical, economic, and environmental performances have been extensively analyzed in different papers [
19,
20] by evaluating the use of this technology for residential and commercial applications [
21], also coupled with organic Rankine cycles [
22]. The scale of the plant significantly affects the technology to be preferred and its application. The downdraft gasifier is a very attractive solution for less than 1 MW
th thermal power input, if compared with the updraft configuration, for the advantage of higher conversion efficiency with lower rates of tar [
23] and particulate matter release. Several cases of real plants combining a downdraft gasifier with an internal combustion engine (ICE) of the microscale of power (less than 50 kW) exists in the literature, such as the Viking plant in Denmark [
24], Spanner Re in Germany [
25], and GM Corsa in Brazil [
26]. A common conclusion is that gasification can provide less environmental pollution than conventional combustion. Biomass conversion into syngas in microscale and small-scale downdraft reactors is considered an assessed technology, but, due to the number of variables affecting the conversion rate of the treated material (biomass size, shape, equivalence ratio, etc.), and despite the availability of different reactor configurations, just a few highly efficient designs have been developed so far.
ICEs, on the other hand, are particularly suitable to syngas use over the micro-scale or small-scale of power due to their low cost, easy control, durability and suitability to frequent start-and-stop procedures [
27,
28]. Nevertheless, their use has been up to present derived mostly from natural gas engine design, with low or null modification to the combustion chamber or to the control strategy.
The Italian project “INNOVARE-Innovative plants for distributed poly-generation by residual biomass” was funded by the Italian Ministry of Economic Development (MISE) as a concrete action to improve knowledge about biomass-to-energy chains and to enhance their diffusion, as based on cogeneration powered by residuals and local use of the produced electrical and thermal energy. Answers were investigated to current technological and logistic challenges and to break down barriers still hindering biomass-powered cogeneration from spreading widely.
The project INNOVARE was focused on a detailed analysis and an energy and environmental optimization of the individual components and individual subprocesses of a specific biomass micro-cogeneration technology already under development for the use of woodchips: the CMD ECO20X system, a micro-combined heat and power (mCHP) system manufactured by the Italian company Costruzioni Motori Diesel S.p.A. An extended experimental and numerical characterization of each component of the mCHP unit was made by jointly considering the availability of local biomasses in the Campania region in Southern Italy. Optimization of the engine and of the gasifier constituting the mCHP system was performed, with technological improvements going hand in hand with a harmonious and coordinated development of the biomass supply. Finally, through an operational demonstration, the project aimed at concretely verifying the sustainability of whole biomass-to-energy chains, so as to also highlight organizational and logistic problems in a mountain territory. A zone of particular naturalistic interest was considered as a case study that is, the National Park of Cilento, Vallo di Diano, and Alburni in Southern Italy.
2. The Case Study: The Biomass-Powered mCHP Unit and Its Characterization
2.1. Description of the mCHP Unit CMD ECO20X
The CMD ECO20X is a micro-scale combined heat and power (CHP) system powered with biomass. It is an integrated plant, combining a downdraft gasifier, syngas cleaning devices, a spark ignition ICE, and an electric generator.
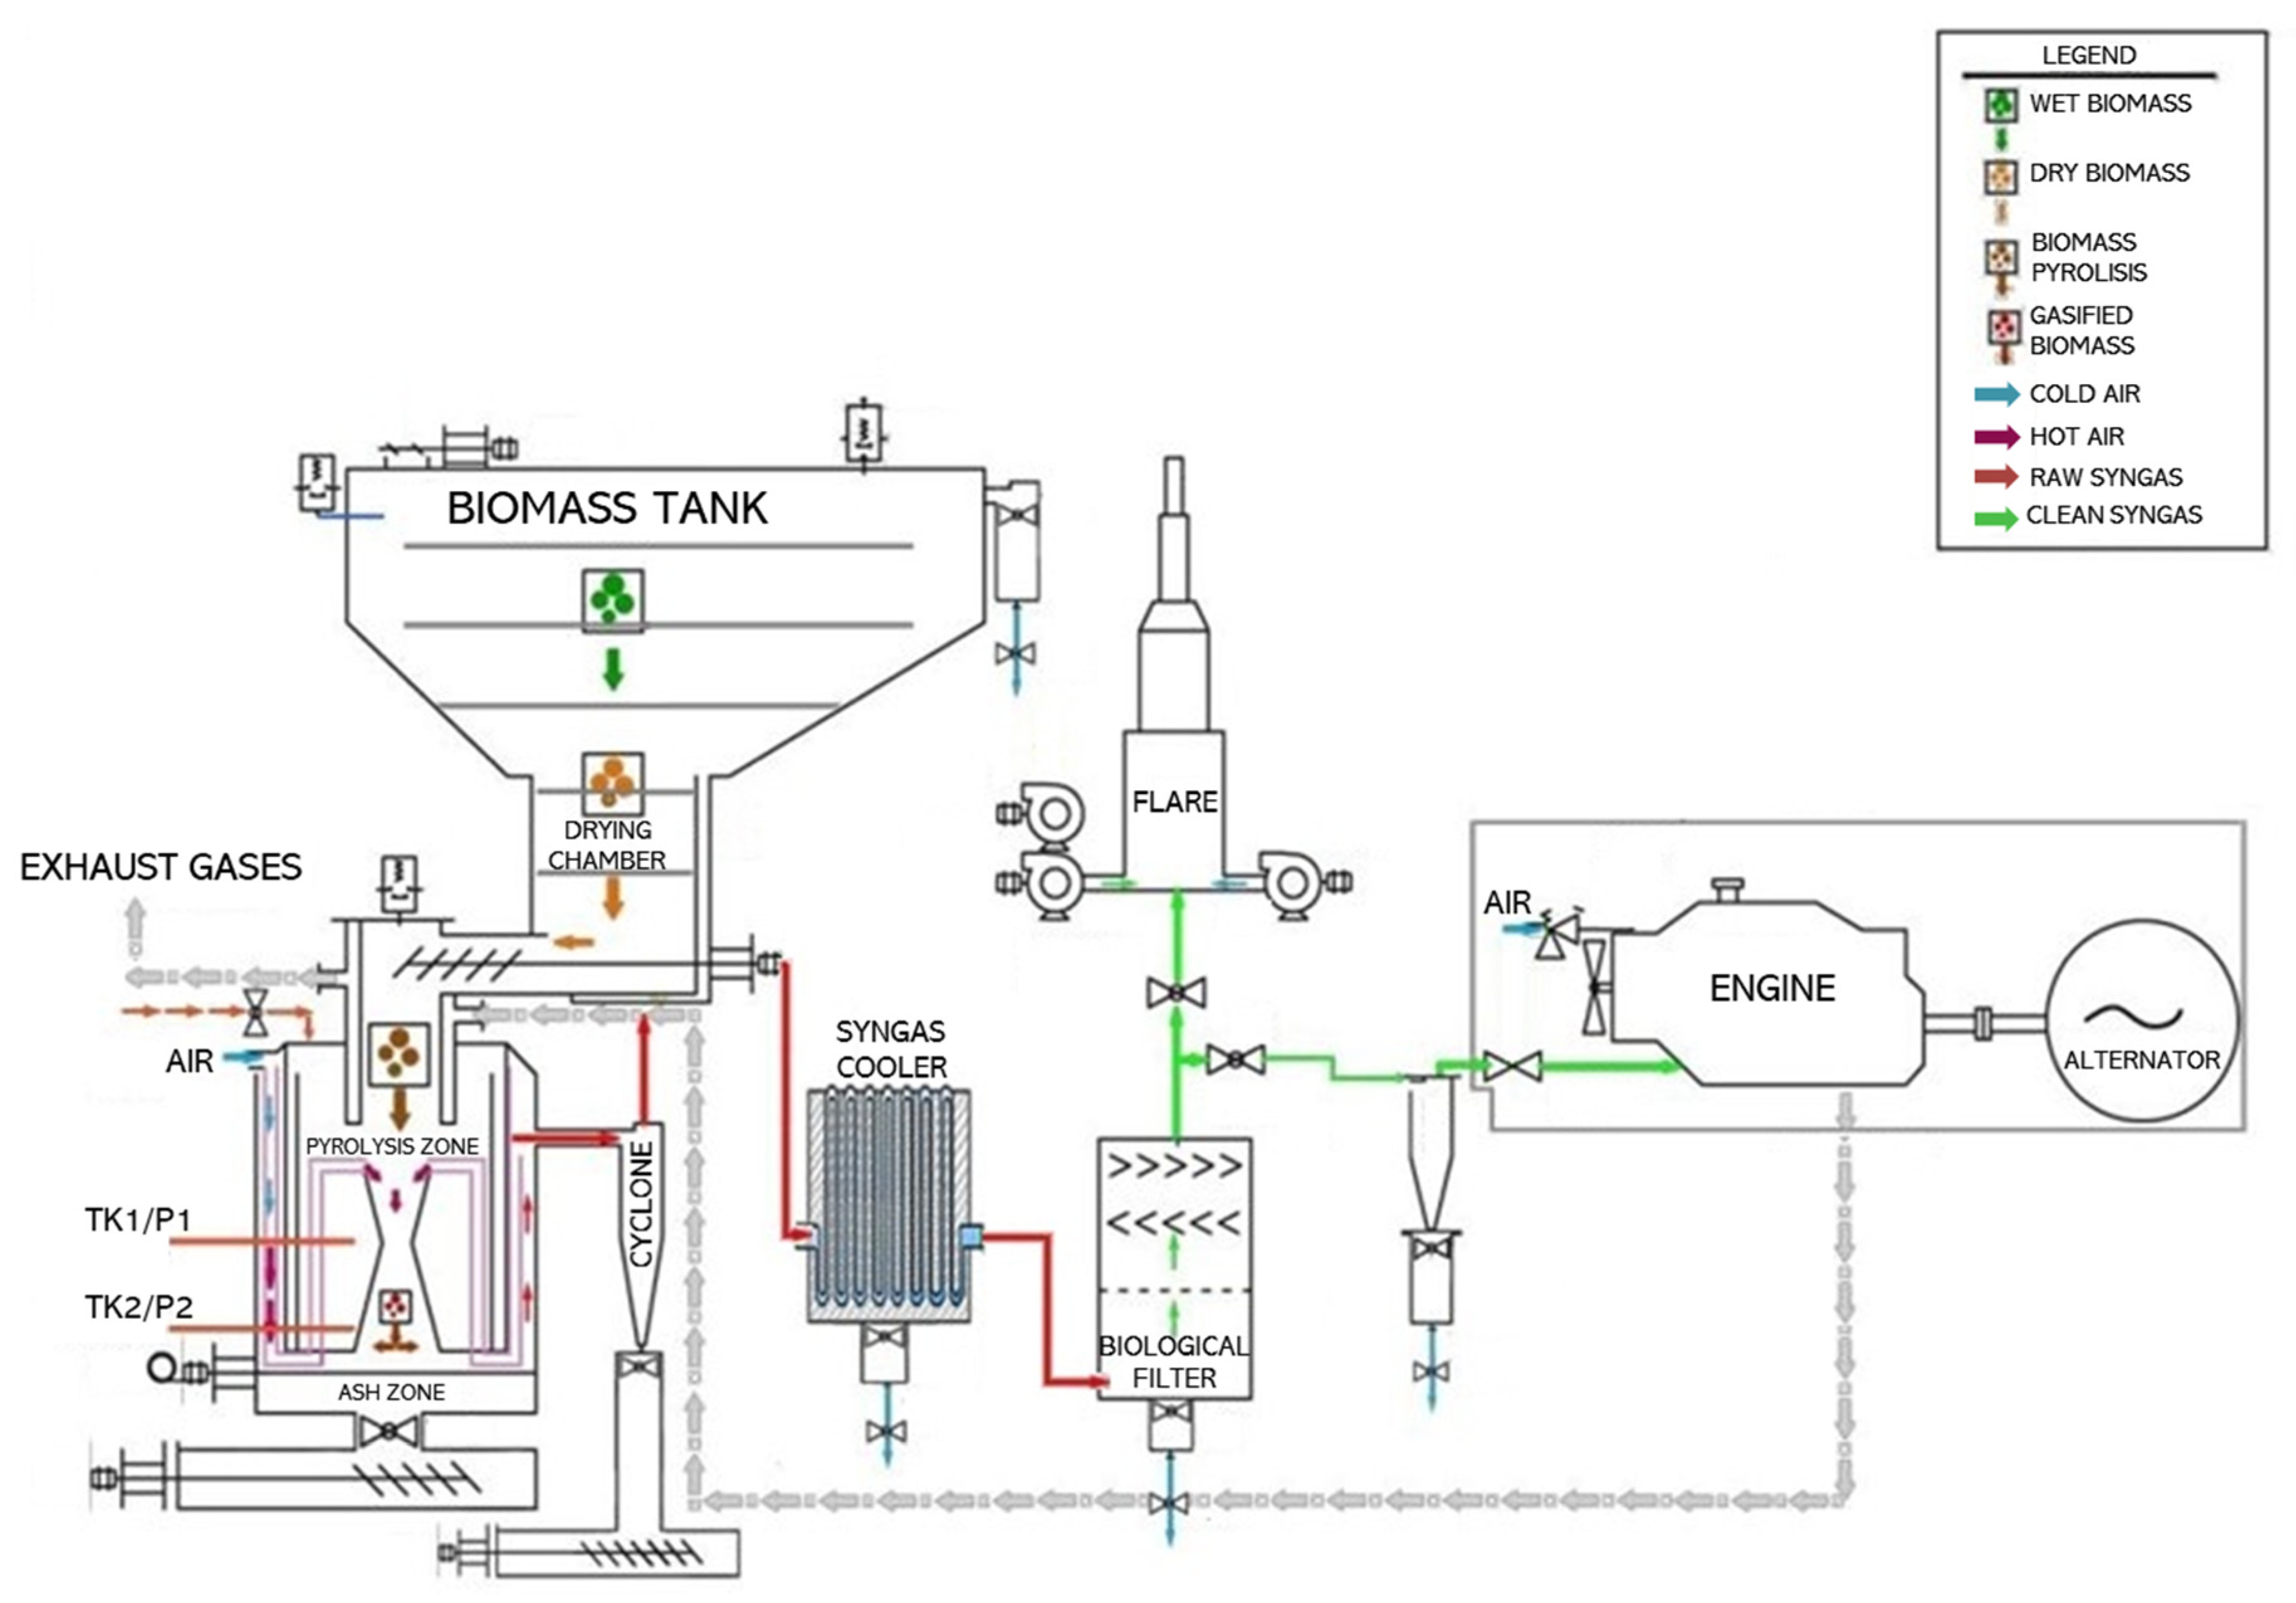
Figure 1 shows a complete flowchart of the system. The red arrow follows the syngas route as the gaseous fuel comes out of the gasifier at about 600–700 °C toward the cleaning section. This stage, as shown in
Figure 1, consists of:
a cyclone, where dust and particulates are removed from the syngas;
a heat exchanger named syngas cooler, where the water content of the producer gas is removed (the gas temperature is also reduced up to 50–70 °C);
a biological filter filled up with the same biomass used as feedstock where small particulate of carbon and water steam are removed;
another cyclone, where the last part of ash and particulate is disharged.
After the cleaning and cooling section, the syngas, blended with air in a stoichiometric ratio, reaches the ICE. Grey arrows indicate the exhaust gases.
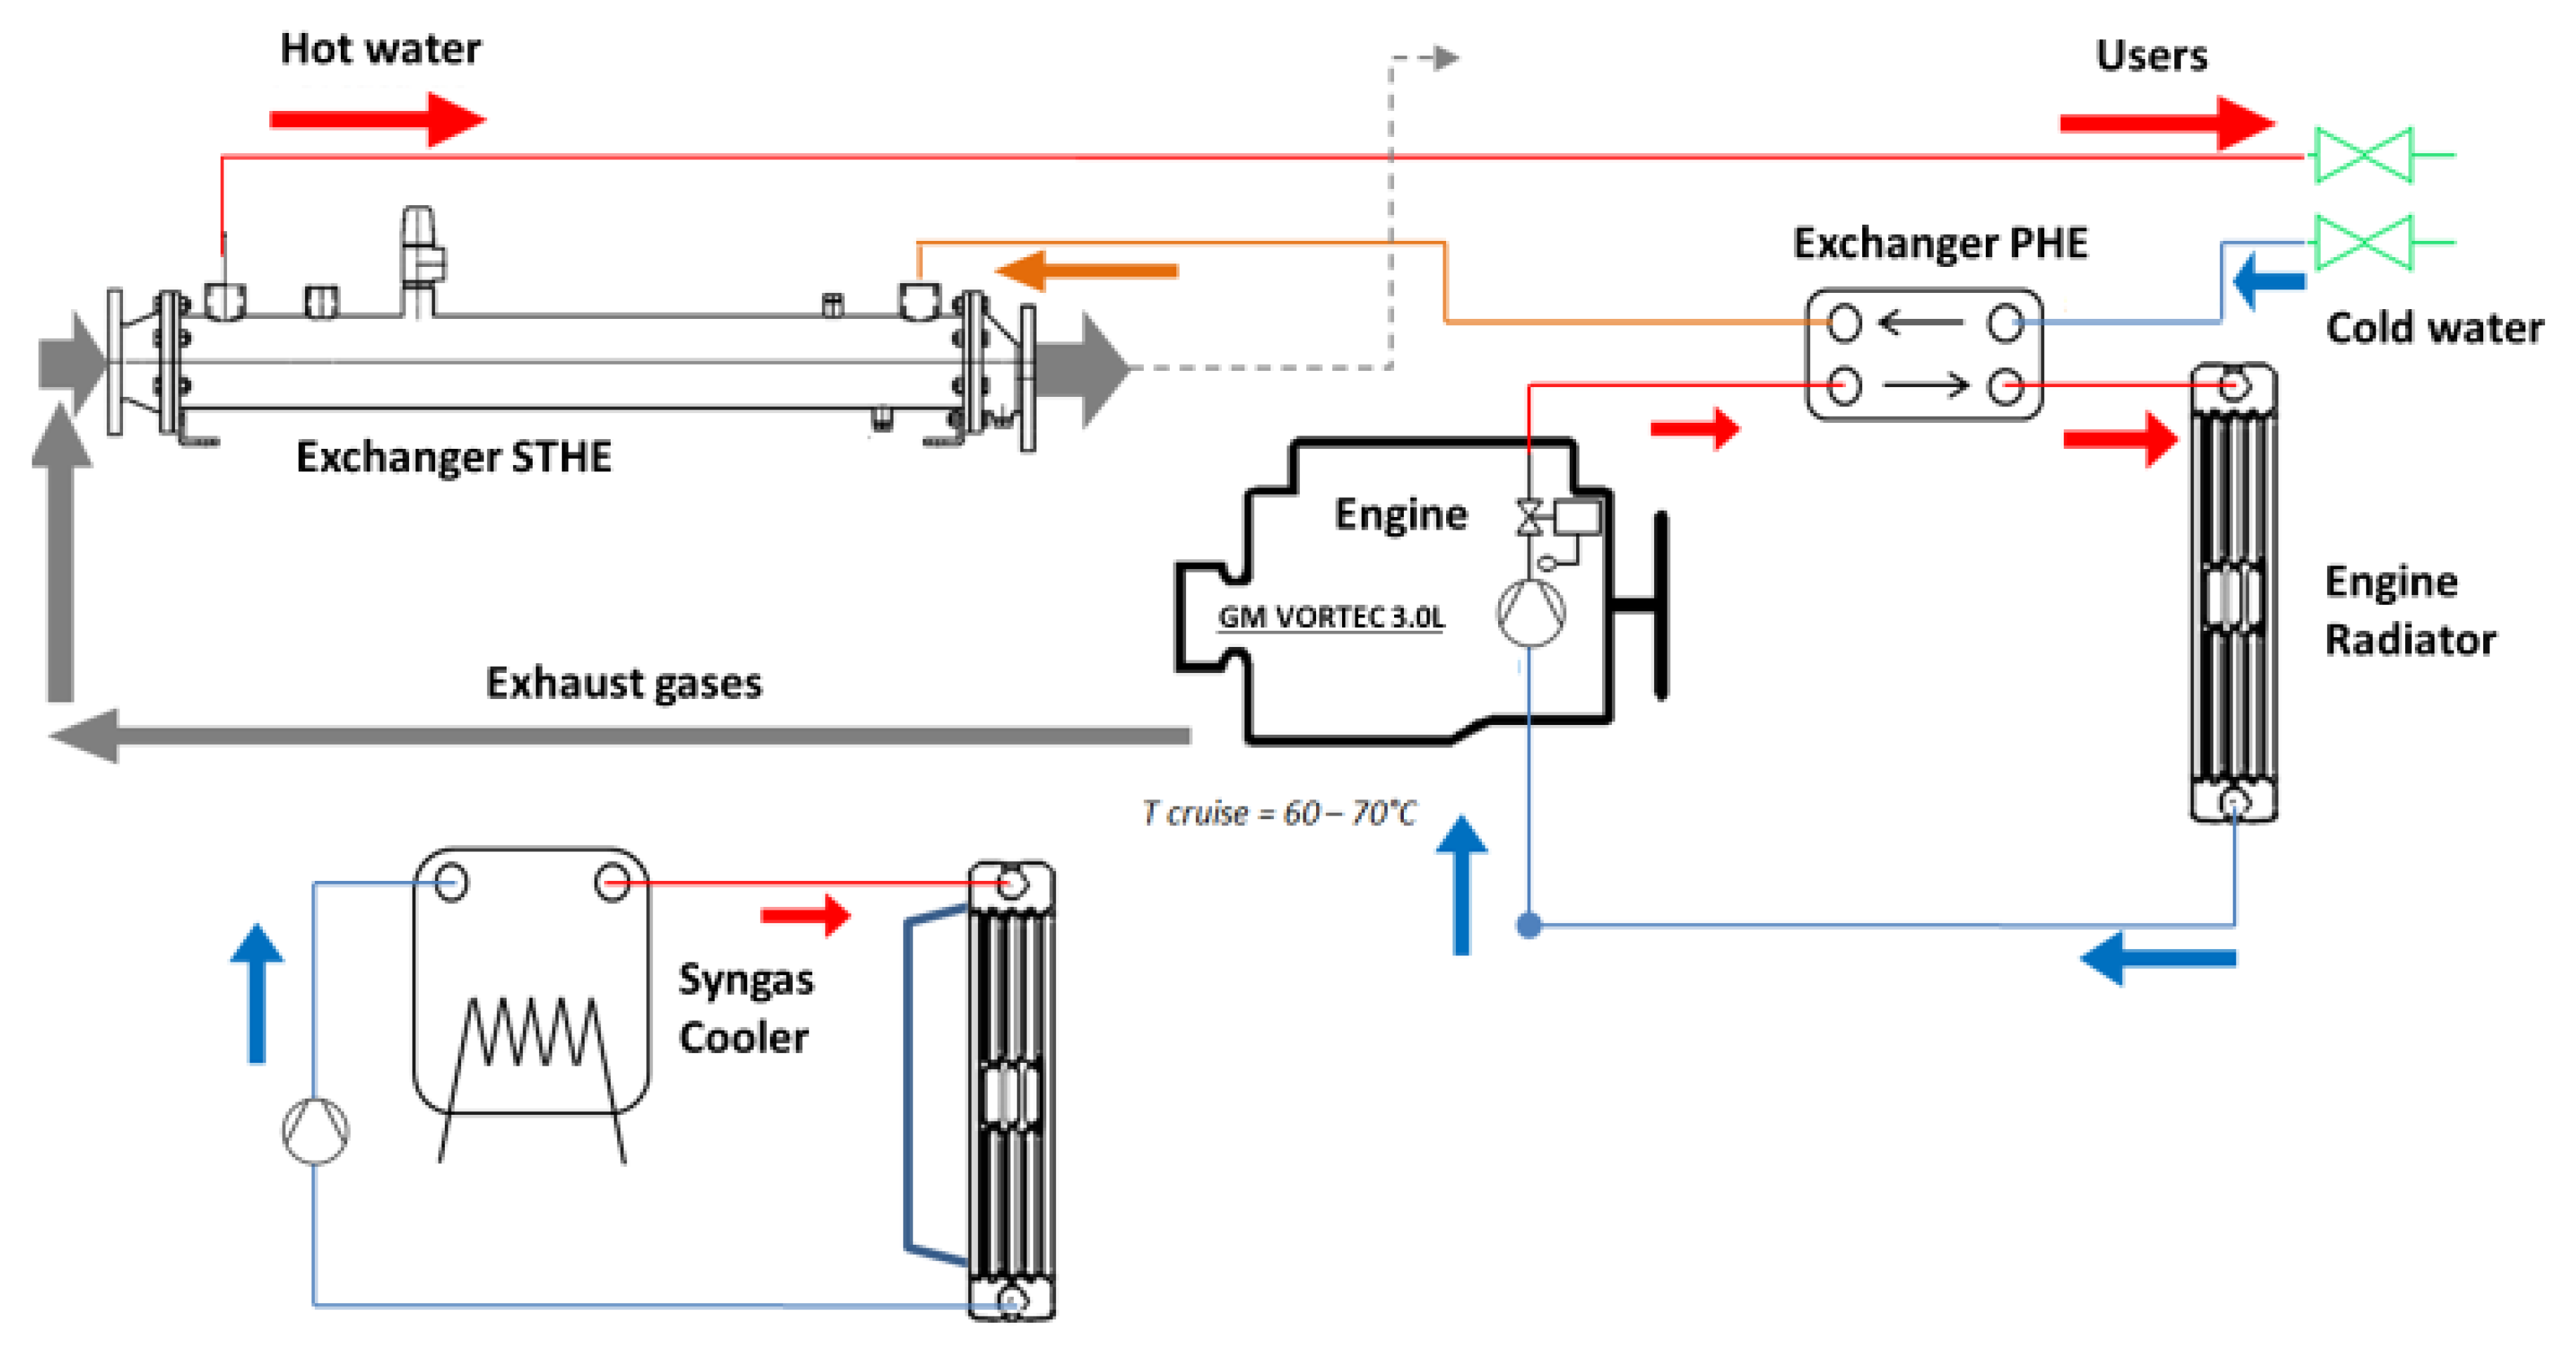
Waste heat recovery is realized through proper heat exchangers along the engine cooling circuit and the exhaust gases line, as shown in
Figure 2.
CMD ECO20X generates electrical and thermal energy by combustion of the syngas obtained through biomass gasification in a 3.0 L GM Vortec I-4 engine. The crankshaft of this last is connected to an alternator MeccAlte, mod. ECP 028, able to produce electrical power up to 20 kW. Thermal power up to 40 kW is also delivered. The CMD ECO20X unit is designed to process wooden biomass of G30 size (1.50 to 3.00 cm). The moisture content of the biomass suitable of being treated is between 15% and 30% in mass. Greater values of humidity imply loss of performance due to its negative effect on syngas calorific value.
The system is a fully automated machine, electronically managed at every stage of its operation: from the automatic loading of the biomass into the hopper, the start-up and operation of the gasification reactor, to the starting of the generator and the realization of the parallel connection with the electric national grid. The control system manages the discharge of ash, condensed matter and biochar, and can act with suitable strategies (until shutdown) in the case of possible failures thanks to the presence of proper sensors and automatic safety alarms. The system has a web service interface allowing to analyze stored data, monitor main parameters and manage the whole conversion via a simple Internet connection without an operator present in the operative environment. The most important technical characteristics of the CMD ECO20X unit are shown in
Table 1.
2.2. Engine Combustion Monitoring and Experimental Setup for ICE Exhaust Emissions Monitoring
The experimental activities of the INNOVARE project were conducted on the real engine equipping the considered mCHP unit. The engine is made by General Motors. Its intake ducts and the carburetion system were modified for syngas use, to ensure the correct air-to-fuel ratio, even with a variable composition of the fuel, that is under typical conditions of plants working with syngas. Pressure traces were measured by an AVL piezo quartz transducer directly inserted in the combustion chamber. The apparent heat release (HR) and heat release rate (HRR) were calculated in real-time by the AVL IndiMicro indicating system, as based on the pressure signal. The pressure signal was averaged over 516 consecutive cycles. The filter smoke number was measured by an AVL 315s smoke meter and converted in PM emission by means of a consolidated correlation implemented in the device processor [
29]. The emissions analysis was made by using an online analyzer Horiba-OBS2200. The analyzer gained the THC (total unburned hydrocarbon) content through flame ionization detector (FID) analysis, NO and NO
2 with chemiluminescence detectors (CLD), and CO and CO
2 with nondispersive infrared technique. Due to the extreme variability of the biomass composition, the syngas was analyzed by filling laboratory bags by spillage upstream of the engine, before the air mixing, and using an offline capillary column gas chromatograph.
Figure 3 shows the experimental layout adopted to analyze the combustion process and the engine emissions into detail, while
Table 2 describes the main engine characteristics.
The test procedure was designed for every experimental campaign in order to characterize and evaluate the performance and emissions of the whole plant by using different biomasses, such as woodchips or olive mill waste, under different operating conditions. Each test was characterized by a parametric analysis by varying the air to-fuel-ratio, the start of spark timing and the exhaust gas recirculation ratio, in order to evaluate the best performances for the plant.
2.3. Experimental Setup for Heat Recovery Measurement
The thermal recovery in the considered biomass-powered cogeneration system is carried out through a secondary circuit, where technical water is heated in two steps (
Figure 4):
- -
in the first step, the technical water receives thermal power through a plate heat exchanger (PHE) from the hot water coming from the ICE cooling jacket; the inlet and outlet temperature of both the cold side (Tp,in and Ta,in, respectively) and the hot side (TMOT,out and Trad,in, respectively) can be measured by means of K-type thermocouples;
- -
in the second step, the technical water receives thermal power through a shell and tube heat exchanger (STHE) from the exhaust gases coming from the ICE; the inlet and outlet temperature of both the cold side (Ta,in and Ta,out, respectively) and the hot side (Tf,in and Tf,out, respectively) can be measured by means of K-type thermocouples.
The flow rate of technical water can be measured by means of a volumetric flow meter. After being heated, the technical water is sent to the primary circuit of a stratified thermal storage tank. During the experimental campaign, the secondary circuit of the thermal storage tank was linked to a dry cooler, in order to simulate a thermal load of a final user in its real operation.
2.4. Numerical Analysis
In order to enhance the energy efficiency of the considered biomass-to-energy conversion system by simultaneously reducing pollutant emissions, a synergic numerical and experimental approach was followed. From the numerical point of view, a proper “digital twin” of the CMD ECO20X system was built and a multi-objective and multi-disciplinary optimization problem was solved through a software platform allowing the integration of different simulation tools. As a first step, a proper simulation model of the CMD ECO20X system was developed through both the Thermoflex
TM and the GT-Suite
® one-dimensional simulation tools: the section of production, cooling, and cleaning of the syngas was schematized within a proper Thermoflex
TM model [
30], while the ICE was modeled in the GT-Suite
® environment [
31]. The choice of using two different sub-models was mandatory, as explained in reference [
30], to obtain a predictive model of the system performance as the gasifier and engine operating conditions were varied (i.e., the equivalence ratio of the gasifier, the biomass composition, the ICE spark advance, and other governing parameters) [
32]. The developed platform guaranteed the management of all logical steps and enabled the complete automation of the whole simulation process. Thanks to an appropriate campaign, performed to characterize the behavior of the whole mCHP plant, a robust validation of the CMD ECO20X digital twin was possible.
The results of the simulations provided the operation range of the plant, syngas flow rate, and the best calibration of the ICE for different biomasses in term of spark timing, air-to-fuel ratio, and exhaust gas recirculation (EGR) rate. With the definition of the optimal operating conditions for different biomasses, a global analysis of performance was possible through a dynamic numerical simulation model of the plant, properly developed within the Trnsys© environment, a complete simulation software designed for the analysis of the dynamic performance of the energy system.
The post-processing of the simulation results allowed assessing the economic and environmental performances of the considered biomass powered cogeneration plant. In this case, some simplifications were adopted: the gasifier—ICE was considered as a single component working under steady-state conditions, while the thermal recovery operations was assumed to vary depending on the considered thermal load (space heating and cooling in different sectors of the plant). The analysis indeed mainly focused on the engine (developed as a black box calibrated on the basis of the main operating parameters from numerical analyses and experimental campaigns) and heat exchangers to derive overall information to be handled for economic and environmental evaluations.
3. Main Project Findings and Discussion
The whole INNOVARE project pursues the valorization of available resources through sustainable self-production of electricity, heat, and cooling. The current level of development of systems based on biomass gasification is indeed still inadequate for their efficient use and large-scale commercial distribution. Indeed, numerous problems still exist concerning both the transformation of the solid biomass into a valuable gaseous fuel and the process of syngas conversion in the thermal engine for an efficient and reliable operation of the whole plant. The obtained results of the Innovare project essentially concern improvements aimed at the creation of a biomass energy supply chain and at reducing the existing inefficiencies thanks to the optimization of various components of the considered micro-cogeneration system, such as the gasifier, the waste heat recovery system and the ICE. Modifications to the analyzed system are defined by thinking to targeted and not radical interventions, as on the air-to-fuel ratio, the exhaust gas recirculation and spark timing of the ICE or the arrangement of the heat exchangers. In the following, main findings are explained into detail, after a discussion concerning innovative methods to acquire quantitative information about biomass availability over some territories of interest.
3.1. Biomass to Energy: Sustainable Supply Chain Assessment
3.1.1. Wooden Biomass
An inventory of potential sites for biomass collection in protected green areas is carried out through an innovative approach that exploits microwave satellite remote sensing. This technology provides non-invasive, non-cooperative and cost-effective synoptic observations of the Earth’s surface that can support the management of both marine and terrestrial ecosystems [
33,
34]. Indeed, it was shown that spaceborne microwave remote sensing is a tool with considerable potential for observing wooden areas, forest reserves, and protected zones preserving the biodiversity and biomass heritage at relatively low costs, without direct interventions in unsafe/inaccessible locations and harsh environments [
35].
In the Innovare project, monitoring of green protected sites is performed with polarimetric synthetic aperture radar (SAR), an active coherent sensor that allows the observation of large areas of the Earth’s surface (in the order of hundreds of kilometers), during both day and night, almost regardless of the weather conditions and with high spatial resolution (in the order of few meters) [
36]. The milestone role played by polarimetric SAR satellites in the framework of biomass monitoring is witnessed by the forthcoming launch of the European Space Agency (ESA) BIOMASS space mission, which is planned to provide, routinely, information on the above-ground forest biomass stating from 2022 [
37].
A meaningful showcase of the results obtained within the framework of the INNOVARE project that aims at demonstrating the potential of the approach adopted for wooden biomass observation is shown in
Figure 5. The latter shows:
- (a)
the normalized radar cross-section (NRCS) reflectivity map obtained from ALOS PalSAR-1 in the HH channel (horizontally polarized signal at both transmitted and received sides) of the study area, i.e., the intensity of the signal scattered off the observed the scene at microwaves obtained after the calibration and geolocation. This map is displayed as a gray-tones image (in decibel scale) and overlaid on the Google Earth© geographic map for reference purposes.
- (b)
an excerpt of the eight-class classification output obtained, in an unsupervised way, from the Cloude-Pottier polarimetric decomposition scheme [
36], that aims at identifying the different land cover according to their scattering properties in order to highlight the presence of biomass. The legend for color-coding that associates each color in the classified image to the corresponding main scattering mechanism is also annotated together with the number of pixels, in percentage, belonging to that class in the whole image.
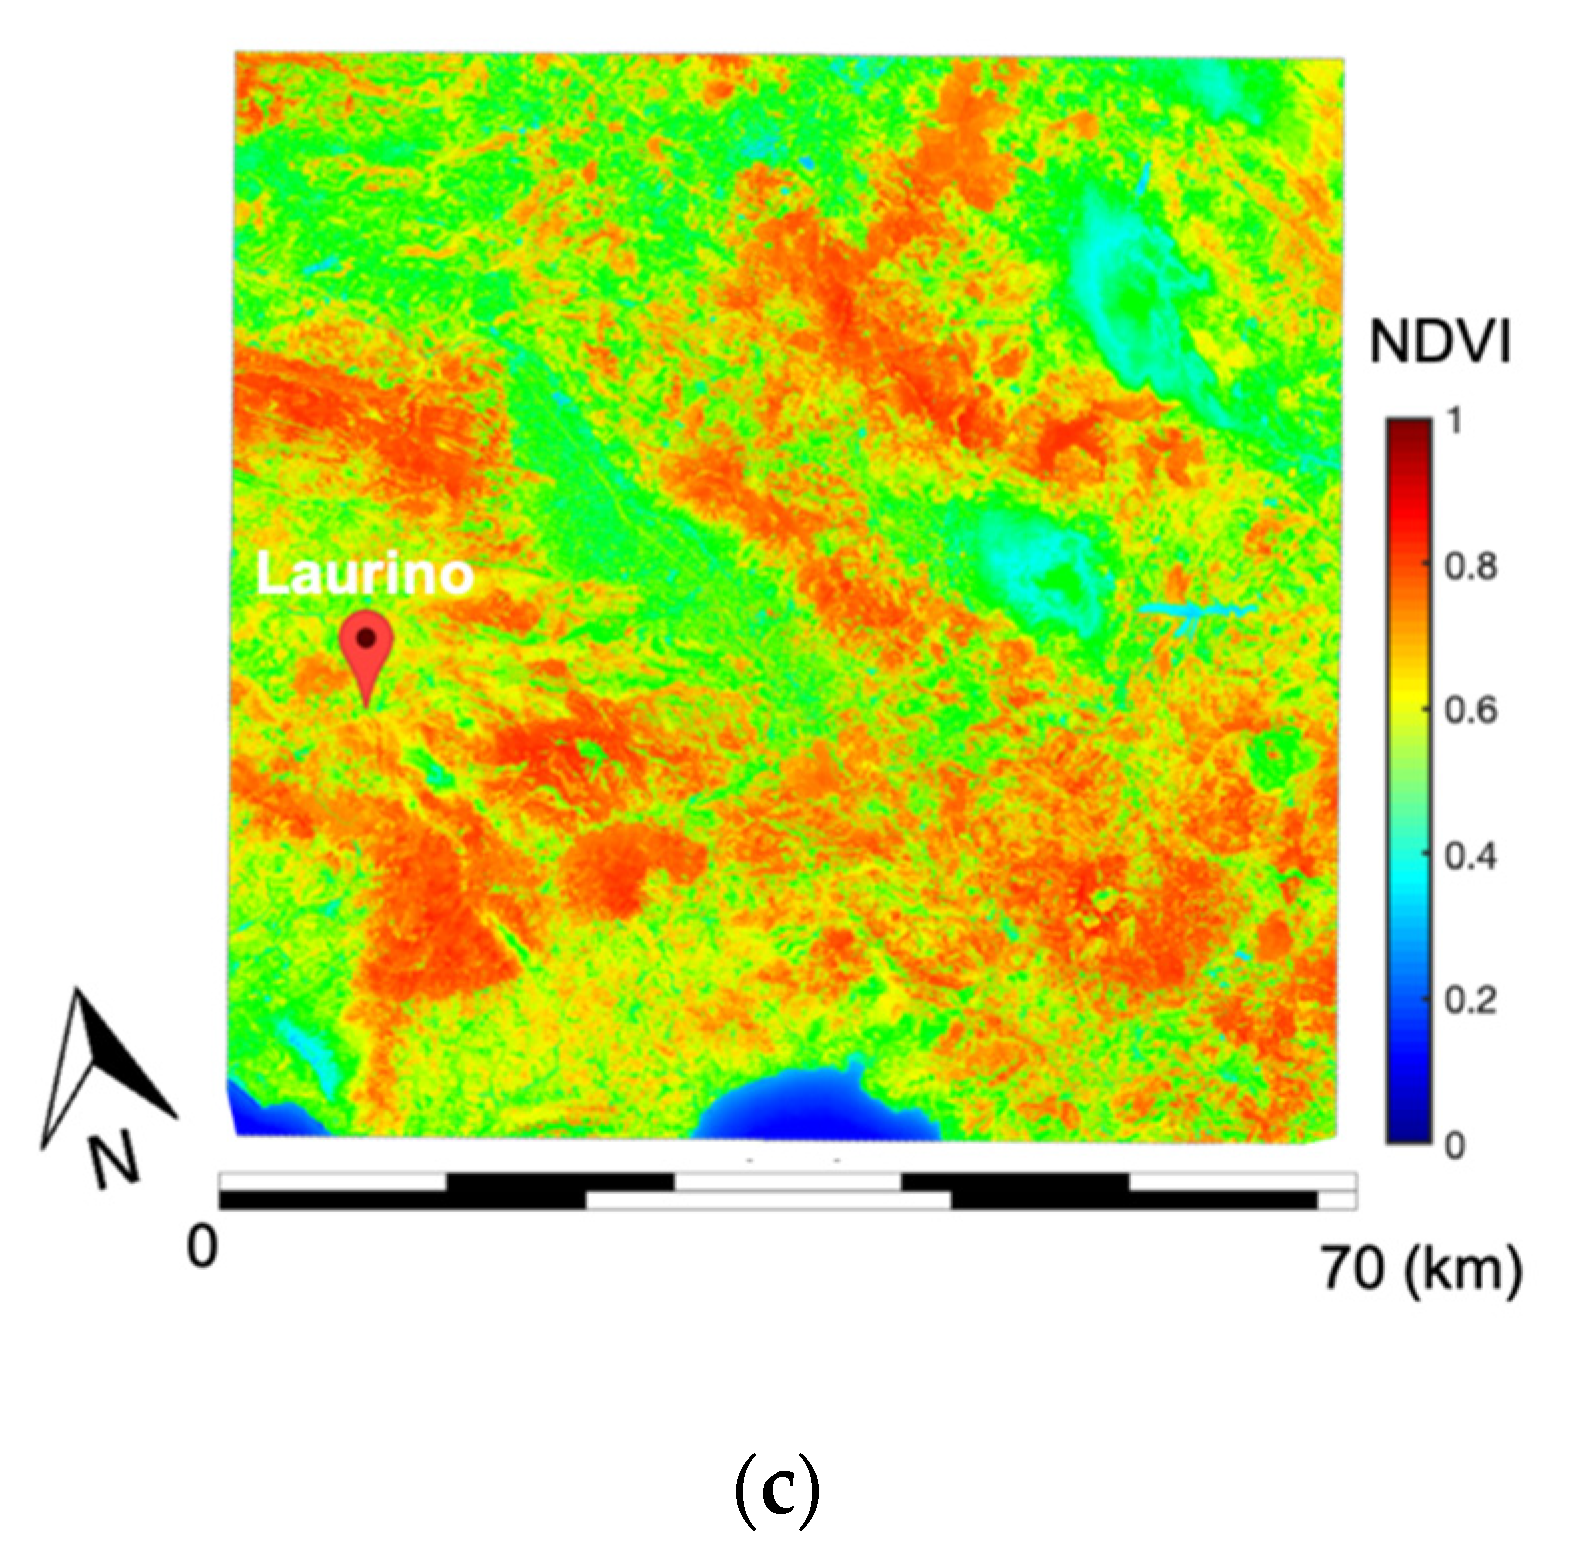
- (c)
the false-color normalized difference vegetation index (NDVI) map, obtained from the red and near-infrared bands measured by AVNIR-2, that aims at characterizing the presence of biomass (or, more generally, vegetation) according to its property of emitting the maximum electromagnetic radiation in the green visible band [
38].
Experimental results shown in
Figure 5 demonstrate the soundness and the potential of the proposed approach. The polarimetric SAR-based classification output reveals, in the study area, the significant presence (more than 50%) of areas characterized by scattering processes which are typical of vegetated areas, i.e., “double reflection” related to ground-trunks electromagnetic interactions and multiple scattering from “random anisotropic scatterers” and “complex structures” as the mixture of canopy/branches. The visual inspection of the NDVI map also supports the outcomes provided from polarimetric SAR satellite imagery, since the NDVI calls for a good matching with the classification output considering that the larger the NDVI values are (i.e., close to 1), the more remarkable is the presence of biomass. Hence, it can be concluded that, in this case, the critical area to be monitored for fire prevention can be reasonably limited to those pixels which are jointly classified as NDVI > 0.8 (red color) and Class 5 + Class 7 + Class 8 (green, dark purple, and light yellow colors, respectively).
3.1.2. Biomass from the Agrifood Sector
The project focuses, as said before, on wooden biomass and also on the possibility of using residual materials from olive milling. Virgin pomace is the solid residue obtained after extracting the olive paste and represents between 30% and 50% of the total weight of olives. It consists essentially of parts of the pulp, of the pits and of the skin films. The olive oil extraction system (traditional continuous system, two or three stages) affects the quality and quantity of virgin pomace.
Table 3 shows the average compositions of virgin pomace, as coming from various extraction systems.
In order to make the aforementioned product compatible with the CMD ECO20X system, both the exhausted pomace and the olive pits powder must undergo a briquetting process, as the one here performed using the DINAMIC 30 machine designed by CO.MA.FER.
Indeed, before the briquetting process, exhausted olive pomace was tested to establish its structural integrity, confirming the necessity to mix it with a variable quantity of wood sawdust. An appropriate experimental campaign was conducted to evaluate compactness of the briquetting between 10% and 50% of sawdust weight in mixture with olive pomace. Structural compactness is indeed indispensable to preserve the material from the mechanical stresses of the CMD ECO20X handling and loading systems. Indeed, with reference to the left of
Figure 6, even though the briquette made of 100% exhausted pomace appeared externally compact, even minimal tangential stresses resulted into an easy crumbling of its cross-sections and in the consequent release of dust particles hindering a gasification process of good quality. Conversely, it was found that by adding a quantity between the 10% and 50% in weight of wood sawdust, an adequate mixture can be obtained that guarantees a good compactness of the briquette. This is shown on the right of
Figure 6.
3.2. Gasifier and ICE Optimization
The project INNOVARE assumes the operation of the mCHP unit with both woodchips from fire prevention operations and exhausted olive pomace. The first biomass is considered as coming from plants that normally populate the area of the Cilento National Park, such as chestnut, pine, and poplar. Proximate and ultimate analyses of this “mixed” woodchips are shown in
Table 4.
During the performed experimental campaigns, no operating problems emerged in the tests with this biomass. Conversely, as explained before, exhausted olive pomace needed a briquetting pre-processing after its mixing with sawdust.
Table 5 show the proximate and ultimate analyses of the two components forming the briquettes.
Firstly, briquettes alone were used. The obtained syngas was found to have a higher content of methane and other aromatic hydrocarbons if compared to syngas produced from woodchips, as shown in
Table 6, but the excessive tar production deriving as a byproduct of gasification represented a critical operating condition.
The trend of the pressure at the gasifier bottom, named P2 in
Figure 1, in fact, marked negative peaks, as shown in
Figure 7, due to formation of caps of tar in the reduction zone that did not allow the gasifying agent flow. This led to a reduction of temperature in the combustion zone not assuring right conditions for the occurrence of the endothermic reactions of Boudouard and tar cracking, needed for the conversion of solid compounds into gas.
The low temperature and the excessive tar production under the olive pomace and sawdust briquette powering mode also ended in an excessive fouling of the whole plant, which actually stopped after about one hour of operation.
Figure 8 shows the detail of the dirtiness accumulated on the spark plug, compromising the nominal and optimal gap between the electrodes and also the intake ducts of the engine. This negative output of the experiments suggested the opportunity to resort to a dilution of the briquettes with wooden biomass, as said before, in order to reduce the tar production and the related mentioned problems. Thanks to the previously described numerical model of the CMD ECO20X unit, a thorough analysis was carried out by varying the mass percentage of sawdust and olive pomace briquettes diluted with wooden biomass in order to obtain the optimal mixing value. The trend between the gasification temperature and calorific value of the syngas produced as a function of olive pomace mass percentage is shown in
Figure 9. The best compromise solution was found at around 30% of briquettes that allowed adequate temperature to reduce tar production also corresponding to a reasonable calorific value of the obtained syngas.
After various tests, the identified way to use the olive pomace and sawdust mixing with woodchips with a maximum of 30% by weight of pomace and sawdust enabled the continuous working of the plant for at least five hours—that is, the normal duration of the loading hopper.
Figure 10 shows the recorded pressure P2 at the gasifier bottom in this case. The more regular trend is visible, that is an index of absence of consistent agglomerate formation.
Table 7 shows the comparison between the syngas produced by woodchip gasification and the one produced by mixing of olive pomace, sawdust, and woodchips (24% of olive pomace, 6% of sawdust, and 70% of woodchips).
The presence of the olive pomace, even though mixed with woodchips, is emphasized by the higher content of hydrocarbon components in the obtained syngas. Although the performed approach led to benefits on gasification, the electrical output was instead found to be lower than in the woodchips case, as shown in
Table 8. This was due principally to a fouling of the plant that in part clogged the filter and led the pressure to drop during the intake phase, with consequent lower filling of the ICE combustion chamber. Pressure cycle traces, lower in comparison with the woodchips case, are indeed shown in
Figure 11.
The collected experimental data also allowed the validation of the developed numerical model of the whole system. The effects of the ICE and gasifier operating conditions on performance and pollutant emissions, as said before, were in fact explored by authors by first assessing a numerical simulation of the plant operation validated with experimental data within the Thermoflow environment and by modeling into detail the ICE within the GT-Suite software [
30], then by performing a numerical multi-objective optimization [
32]. Different operating conditions obtained by varying simultaneously the equivalence ratio at the gasifier, the spark ignition timing, and the air-to-fuel ratio at the ICE were explored with the objectives to maximize the power output and, at the same time, minimize the CO and NOx emissions at the exhaust, whose reduction indeed appeared as a real challenge of the project. The numerical model and optimization allowed exploring the calibration plane of the engine by varying different operating parameters, including the EGR ratio [
39] for different biomass types. As a final result, both the electrical output and the environmental impact were decisively improved and the found set of variables in the Design of Experiment (DoE) space were then used during the experimental campaign to verify the correctness of the numerical findings.
Main results of the overall optimization are shown in
Figure 11 and
Figure 12.
Figure 12 represents the numerically evaluated optimal in-cylinder pressure cycle compared with the experimental one that was actually collected on the real plant under the optimized set of engine control variables. The found agreement is very good, especially if it is considered that a non-conventional fuel is used, whose composition derives form a gasification process, on its own strongly affected by the operating conditions and the biomass features.
The numerical results [
39] also suggested that moving toward a globally leaner mixture reduces the CO production as related to a better combustion efficiency. Its reduction is even more evident as the percentage of this species is higher. At the same time, more delayed spark events (toward values of 20° before the top dead center, BTDC), negatively affect the CO emissions, due to the lower in-cylinder temperatures, the consequently lower combustion efficiency, and the reduced CO-CO
2 conversion ratio directly linked to the maximum in-cylinder temperature.
On the other hand, as well known, in spark ignition engines, the NOx production strongly depends upon the time of combustion start, more than the mixture title. This is visible in
Figure 13 that quantifies the single effects of influence of the lambda, start of spark and gasifier equivalence ratio (ER on the Figure) on the system brake power and emissions. Even though there is not a great improvement of brake power, the strategy of varying the start of spark permits reducing the peak pressure and, consequently, the maximum temperature in the combustion chamber, main responsible for thermal NOx formation.
The optimal configuration of the whole plant is found as the one with the gasifier working with the lowest possible ER, according with technological limits, and the ICE working under lean mixtures and delayed spark.
Referring to the baseline case, a significant improvement of pollutant emissions can be achieved by using the optimized set of engine control parameters: the air index ratio lambda = 1.1, and spark advance = 24° BTDC.
Table 9 and
Table 10 show the improvement with respect to the baseline case of the new working point of the plant as fed with different biomasses, even if the intake manifold exhibits a lower pressure level that is index of a worst filling of the cylinders. A great improvement of pollutant emissions is achieved, particularly with regard to the CO percentage, that results from working under lean mixtures in both of the cases, with a simultaneous reduction of the in-cylinder pressure peak, thus assuring lower stresses and a more durable engine.
Working with a lean mixture also give the possibility of using a catalytic converter. This element, during the project, was indeed installed on the exhaust line immediately downstream the engine, shown in
Figure 14, converted the CO in CO
2, thanks to the presence of O
2 in the flow.
Thanks to the control of the air flow with a specific throttle linked to the lambda linear sensor, whose characteristic curve was specifically optimized for syngas use, a lean mixture was guaranteed, and the O
2 content present in the flow allowed the CO oxidation to CO
2. By adopting the right spark advance, according to numerical results, the final engine impact on environment was very low, as shown in
Table 11. Data of
Table 11 were in fact collected during the plant working in its real operation within the Cilento National Park, the location chosen for a practical demonstration of the ecological sustainability of the plant. They are also compared with expected limits described by Italian Legislative Decree 152/2006 n. 152. The decree also points out the way to correct the acquired data with the O
2 content in exhaust flow gas.
3.3. Waste Heat Recovery Analysis
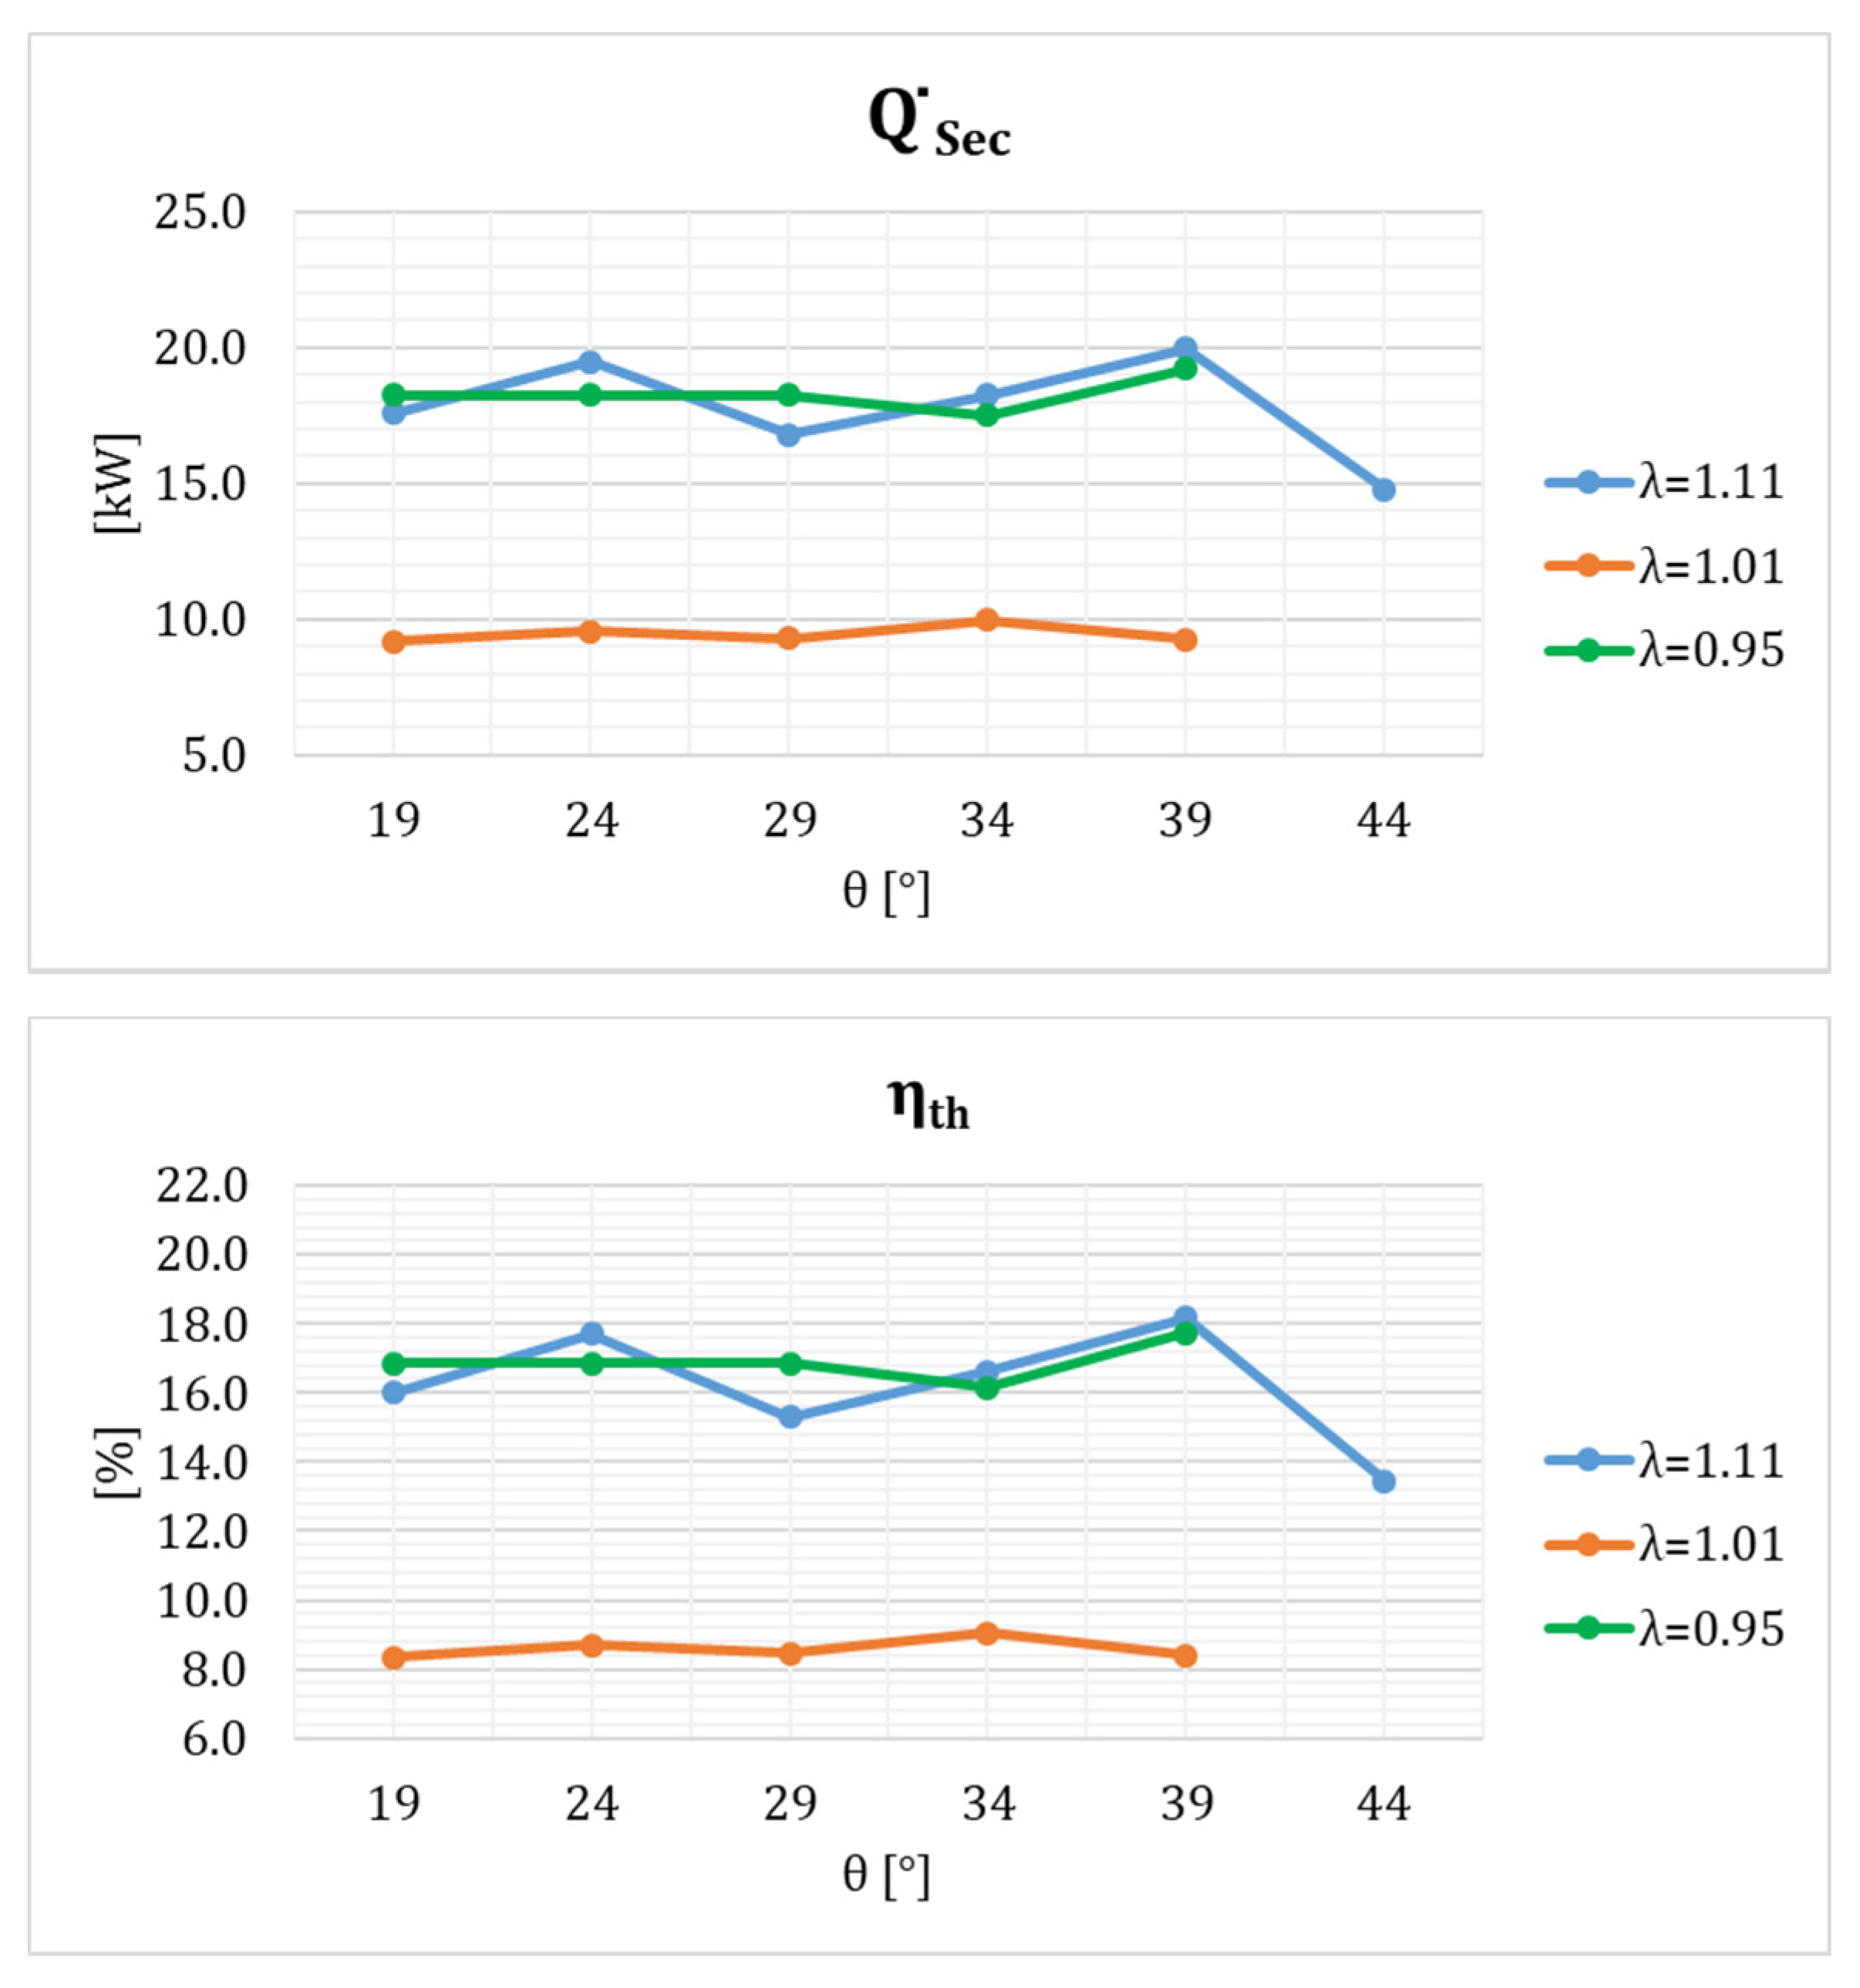
The quantities of interest for the waste heat recovery study were measured in all the relevant sections of the CMD ECO20X plant, thanks to a proper measurement and acquisition system developed specifically for the project. Experimental data allowed performing the mass and energy balances and the validation of a properly developed numerical model specifically reproducing the operation of the heat exchangers. Based on the coupled numerical-experimental activity, the authors also implemented a dynamic model, able to calculate the energetic, economic, and environmental performance of the system. A complete thermodynamic analysis was carried out by considering both the global system, reported in
Figure 15, and five control volumes corresponding to its main components, namely the reactor + cleaning section, the ICE, the plate heat exchanger (PHE) and the shell and tube heat exchanger (STHE), as shown in
Figure 15,
Figure 16 and
Figure 17. In
Table 12, a summary of the data acquired during the experimental campaign is reported, with the corresponding uncertainty calculated using a coverage factor equal to two, corresponding to a confidence level of 95%. Aim of the thermodynamic analysis was the characterization of the system in terms of net power output, thermal power production and global efficiency. These data are reported in the images from
Figure 18,
Figure 19 and
Figure 20.
Figure 18 shows the thermodynamic characterization made on the plant on the basis of the net power output and the global electric efficiency as a function of the air index and the ignition timing on the engine, to evaluate the baseline case of the whole plant.
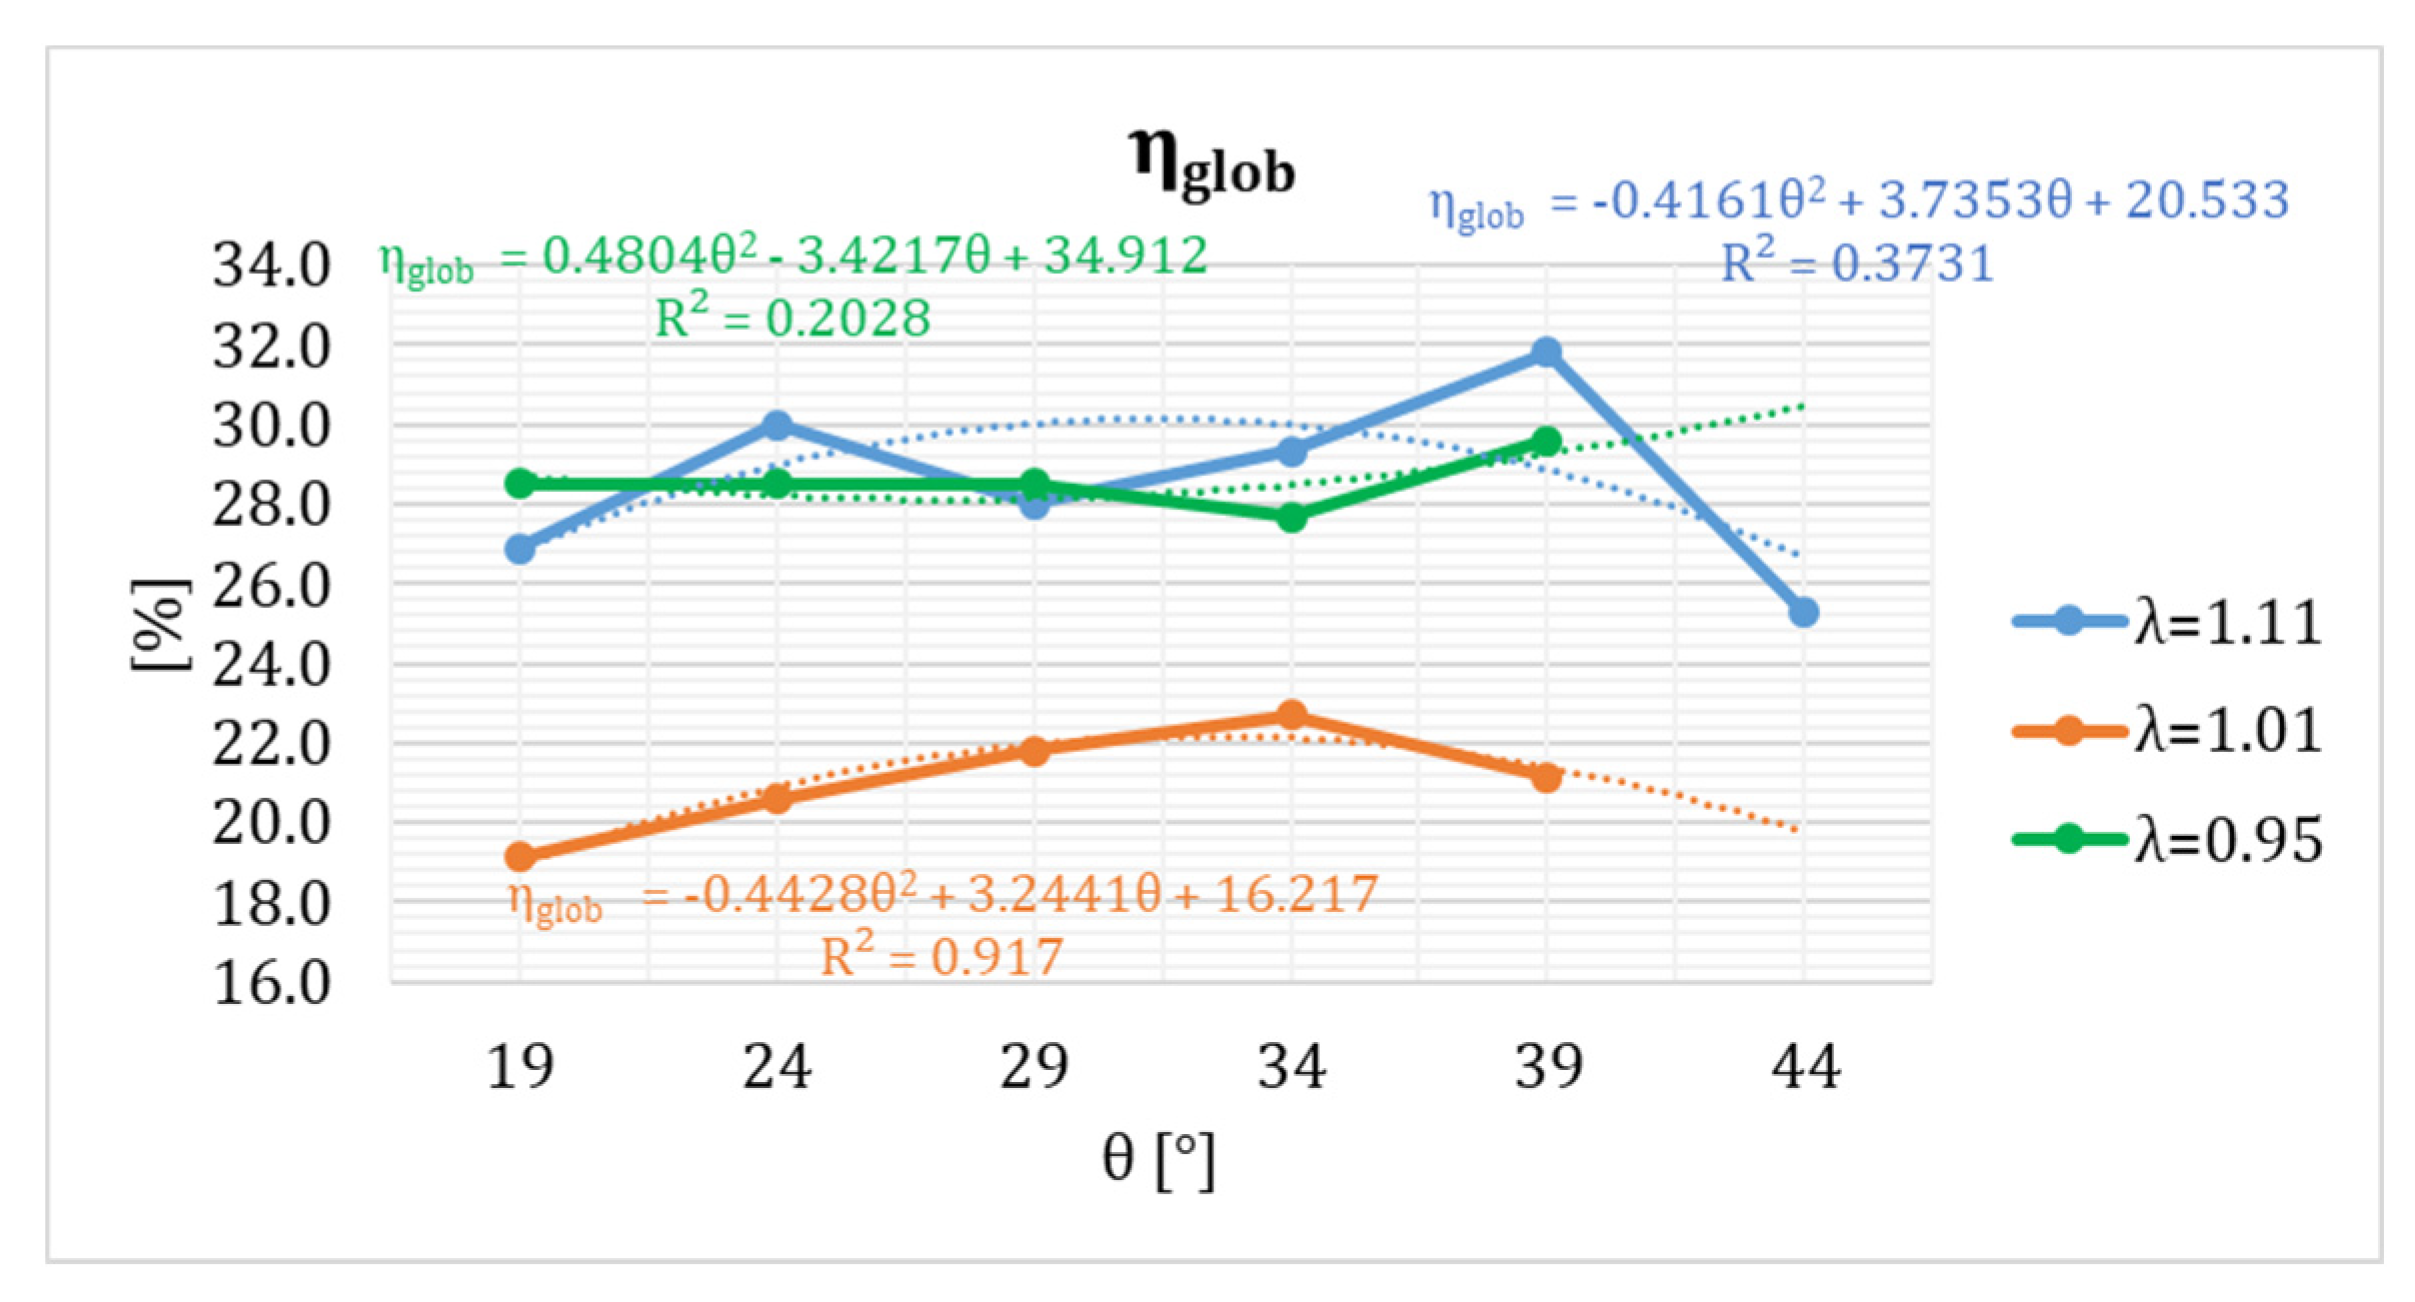
Figure 19 shows the characterization of recovered thermal power. Finally,
Figure 20 reports the global efficiency of the plant. The performances of the heat exchangers were assessed by means of the ε-NTU model. Results for different operating conditions are reported in
Table 13 together with experimental data. The found agreement is good.
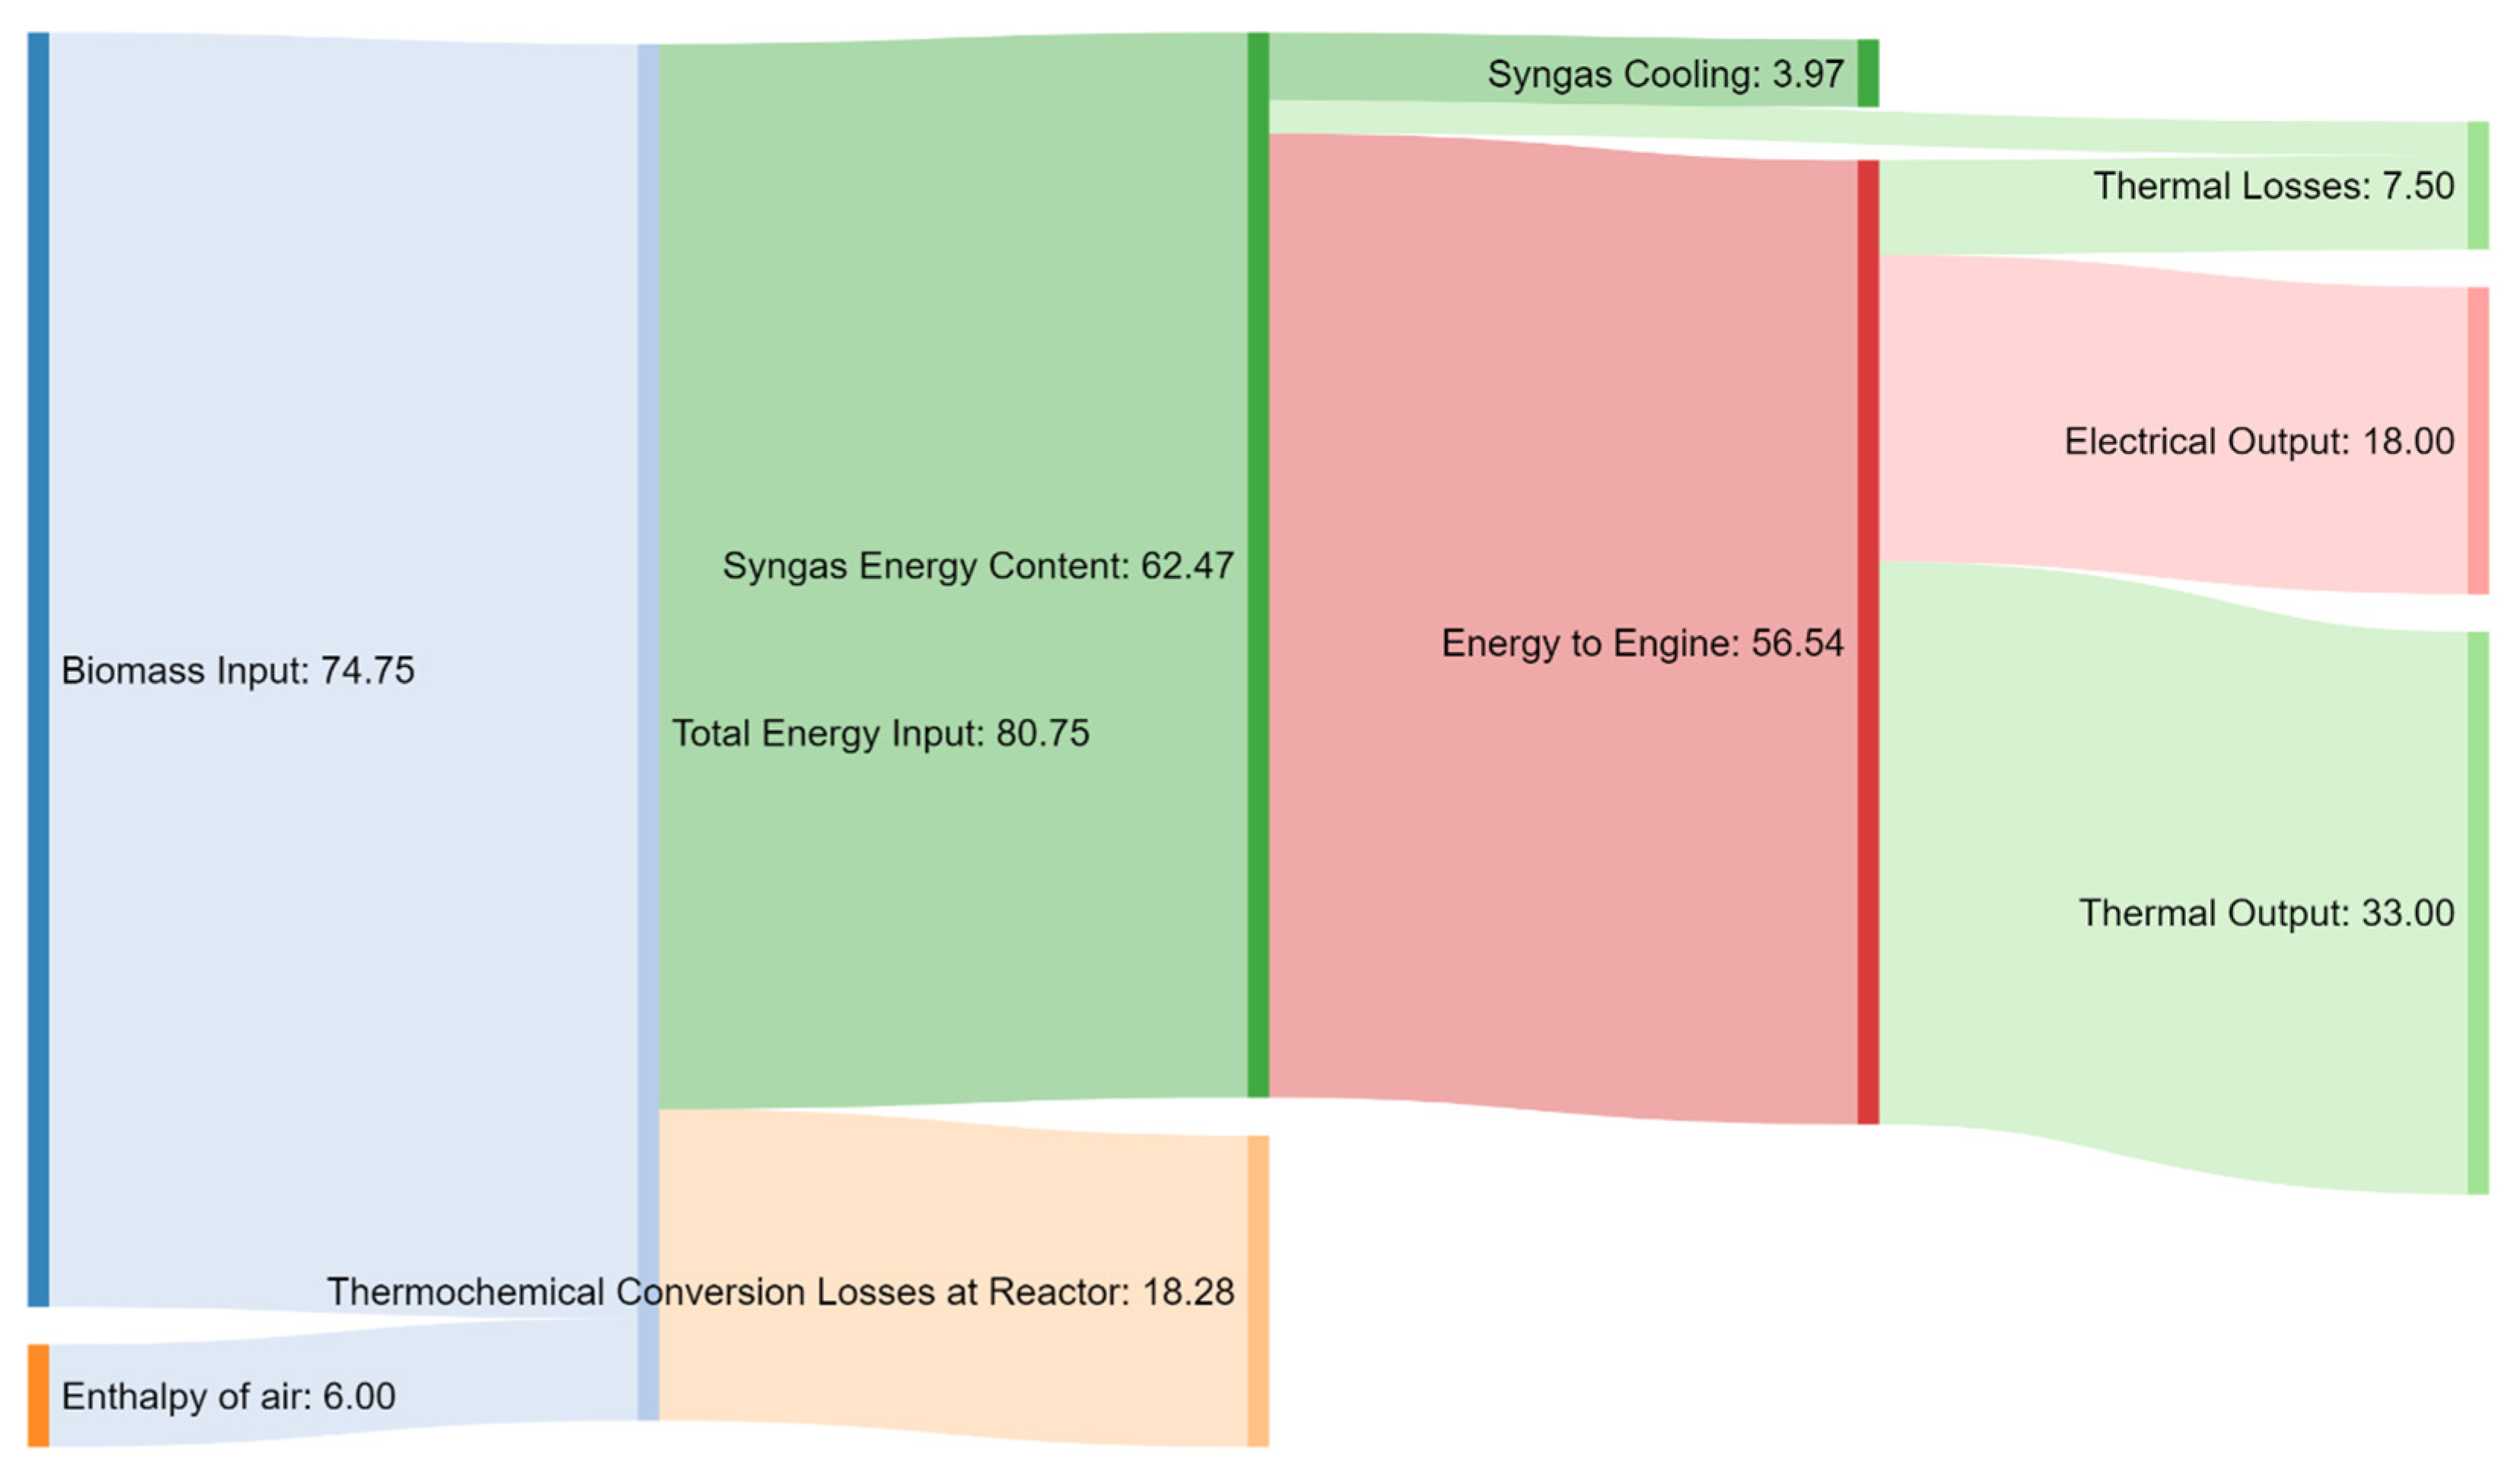
Figure 21 represents the Sankey diagram summarizing the analysis of the optimized operating conditions made by using a certified woodchip from class A1+ as feedstock. The right value of the spark advance, the revised air index value and the fewer stops of the system thanks to the greater reliability led to an improvement of the global efficiency from a maximum value of 32% up to 63.2%, with electrical efficiency increased from 13.8% to 24.08%.
On the basis of the literature data from references [
24,
25,
26,
40] a comparison on efficiency of the plant CMDECO20X was realized in
Figure 22. The improvement of the plant efficiency is evident by considering the starting value [
41] (named CMD ECO20 in
Figure 22), relevant to an initial version of the cogeneration unit called CMD ECO20, and the final value (named ECO20X opt in
Figure 22) of power output and the global electric efficiency.
3.4. The Environmental Impact of the Plant in a Real Demonstration
The studied and improved biomass-powered mCHP plant was installed in a real environment in the Municipality of Laurino in the National Park of Cilento, Vallo di Diano, and Alburni for a duration of six months. The system substituted a diesel genset used to reduce the volume of municipal solid waste in the collection site of the Municipality. The optimization activities allowed operation with ordinary maintenance for the period of the demonstration, despite the presence of olive pomace in the mixture.
The air quality in the proximity of the plant was measured during the real operation for both the energy generation systems, the traditional diesel genset, shown in
Figure 23a, and the CMD ECO20x plant of
Figure 23b. A specific environmental monitoring unit AQM65 QEROQUAL by pollution was used to evaluate the air quality by measuring CO, CO
2, NO
2, NOx, organic volatile compounds (expressed as equivalent CH
4), and particulate matter (PM10, PM2.5, PM1, and suspended thoracic particulate TPS). Acquisitions during operation of traditional diesel genset and CMD ECO20x plant are compared in
Table 14 by also showing the measured values before starting the systems, named Basis in
Table 14.
Data of
Table 13 show, as expected, the greatest environmental impact of the traditional diesel genset generally used by the Municipality, with respect to the CMD ECO20X plant, especially for CO production and particulate emissions. These measurements of air quality allowed the evaluation of the quality air index (IQA), a parameter that represents the state of the air and its harmfulness to humans and the surrounding environment. The reference method to calculate the IQA is regulated from local standards [
42] identified by the Regional Agency for Environment Protection (ARPAC), as based on the European Air Quality Directive 2008/50/CE. The standard set a subindex
Si for each pollutant concentration calculated as:
where:
The
IQA is defined, in a cautionary way, as the maximum value of the calculated subindices
Si for each pollutant concentration, as given by the following formula:
For each
IQA value, a specific color is assigned to derive a judgment on air quality, as shown in
Table 15, according the standard—the higher the
IQA, the worse the air quality.
By calculation of the subindices corresponding to the maximum measured values, it was possible to classify the quality of the air measured during the experimental campaign as:
Great, with an IQA of 15 during the CMD ECO20x operation;
Poor, with an IQA of 120 during the diesel genset operation.
It can therefore be stated that the IQA for the biomass-powered unit is about four times better than for the diesel genset.
The genset technologies can also be compared by evaluating the equivalent CO2 emissions over the whole energy conversion process within a Enviromental Impact Assessment. This aspect is fundamental in order to evaluate the impact of unconventional fuel on climate changes due to greenhouse gases effects, taking account the CO2 emissions from fuel preparation to its end use. The use of biomass as a fuel in a reciprocating engine for energy purpose is considered CO2 neutral, due to the sustainability of the material, but the same cannot be assumed for the quantity of energy necessary to produce and transport the material, especially if fossil fuels are used for these scopes. This required energy for fuel preparation and transportation is called “grey energy”. For wooden biomass, the following CO2 contribution must be considered:
cutting energy, due to the cut of the tree with chainsaw or similar equipment;
chipping energy, for wooden material transportation and utilization;
transport energy, from the cutting to chipping area, until the utilization site.
These can be calculated respectively with the following formulas:
The sum of the contributions related to cutting, chipping, and transportation represents the non-renewable quote of energy and can be compared to CO
2 emissions of a diesel genset [
43], as shown in
Table 16. The reduction of CO
2 emissions is evident—that is, perfectly in line with the project goal of reducing the impact of human actions on climate.
4. Conclusions
The biomass conversion taking place in a mCHP plant that combines a downdraft gasifier and a spark-ignition internal combustion engine were analyzed into detail during the INNOVARE project. A combined numerical and experimental approach was followed.
The real system was fully instrumented to gain both low frequency data of mass flow rate, temperature and pressure along the whole biomass-to-energy chain, as well as highly temporally resolved measures of the ICE in-cylinder pressure cycle. A numerical model of the ICE was developed that was also included within a global model of the whole plant. After the model validation and preliminary parametric analyses, a well-conceived numerical optimization was performed to determine the effect on emissions and IMEP of the gasifier equivalence ratio, the engine start of spark, air-to-fuel ratio by varying the air index lambda and the percentage of exhaust gas recirculation. Experimental measurements for different operating conditions were first carried out to fully characterize the plant and to collect data to be used for the numerical model validation, then to verify the improvement found by numerical optimization. Key results were discovered to reduce pollutant emissions up to 70% for CO and 72% for NOx.
A detailed analysis of the waste heat recovery circuit was also executed by evaluating the performance of each heat exchanger and the global efficiencies under each operating condition. This allowed for a deep understanding of the occurrence of losses in the analyzed mCHP unit, thus permitting avoiding inefficiencies and an overall improvement of waste heat recovery, leading to a global efficiency of the whole system of 63.2%, with a global electric efficiency of 24.08%.
The developed numerical model also allowed the optimal configuration of the mCHP plant to better work with locally available biomasses in a rural area of the South of Italy, in particular with a mix of woodchips and olive pomace. Real supply biomass-to-energy chain were defined in a demonstration site, as depending on the availability of raw material according to the morphology of the territory and the local agro-industrial production of olive oil.
The main scientific results of the INNOVARE project, indeed, are currently being exploited in a real integration of the cogeneration system into a biomass supply chain within a green protected area, the National Park of Cilento, Vallo di Diano, and Alburni. The objective is to process the material deriving from forest management operations and fire prevention strategies, as well as from local agro-industrial residues.
Within the project, the produced electrical energy was indeed used to activate mechanical systems for waste volume reduction in an ecological site of collection in the municipality of Laurino in the Province of Salerno, in the National Park of Cilento, Vallo di Diano, and Alburni. By comparing the air quality and CO2 emissions due to the traditional diesel genset operation and the here-developed upgraded plant CMD ECO20x, a decisive improvement of air quality is found to be pursued, from a Poor up to Great quality. This also regards the whole supply chain of the energy source.
The research will continue in the future within other ongoing projects as aimed at increasing the number of biomasses that can be processed by the plant for energy purposes, so as to further reduce the human impact on the environment in a concrete circular economy perspective. As a forthcoming change, the ICE of the cogeneration unit is also being modified to implement a 6-cylinder configuration and the syngas cleaning circuit.

 ,
, 


