Article

Electro-Fenton Based Technique to Enhance Cell Harvest and Lipid Extraction from Microalgae

1
Tianjin Key Laboratory of Industrial Biosystems and Bioprocess Engineering, Tianjin Institute of Industrial Biotechnology, Chinese Academy of Sciences, Tianjin 300308, China
2
Department of Biological Systems Engineering, Washington State University, Pullman, WA 99164-6120, USA
3
School of Life Science and Technology, Inner Mongolia University of Science and Technology, Baotou 014010, China
4
College of Life Science, North China University of Science and Technology, Tangshan 063210, China
5
College of Life Science and Techenology, Beijing University of Chemical Technology, Beijing 100029, China
*
Authors to whom correspondence should be addressed.
These authors contributed equally to this work.
Energies 2020, 13(15), 3813; https://doi.org/10.3390/en13153813
Submission received: 15 June 2020 / Revised: 21 July 2020 / Accepted: 23 July 2020 / Published: 24 July 2020
(This article belongs to the Special Issue Microalgae Cultures: Environmental Tool and Bioenergy Source)

Abstract

:
Currently, lipid extraction remains a major bottleneck in microalgae technology for biofuel production. In this study, an effective and easily controlled cell wall disruption method based on electro-Fenton reaction was used to enhance lipid extraction from the wet biomass of Nannochloropsis oceanica IMET1. The results showed that 1.27 mM of hydroxide radical (HO•) was generated under the optimal conditions with 9.1 mM FeSO4 in a 16.4 mA·cm−2 current density for 37.0 min. After the electro-Fenton treatment, the neutral lipid extraction yield of microalgae (~155 mg) increased from 40% to 87.5%, equal to from 12.2% to 26.7% dry cell weight (DCW). In particular, the fatty acid composition remained stable. The cell wall disruption and lipid extraction processes were displayed by the transmission electron microscope (TEM) and fluorescence microscopy (FM) observations, respectively. Meanwhile, the removal efficiency of algal cells reached 85.2% within 2 h after the reaction was terminated. Furthermore, the biomass of the microalgae cultured in the electrolysis wastewater treated with fresh nutrients reached 3 g/L, which is 12-fold higher than that of the initial after 24 days. These finds provided an economic and efficient method for lipid extraction from wet microalgae, which could be easily controlled by current magnitude regulation.

Graphical Abstract

1. Introduction

Microalgae is considered as a sustainable biomass source for producing biofuel, contributing to meet energy demands as well as addressing environmental concerns [1]. Driven by solar energy, microalgae can bio-fix CO2 (4–14%, v/v) [2] into biomass, such as lipids, starch, proteins and pigments, thus abate greenhouse gas (GHG) emissions [3]. However, several economic and technical constraints limit the industrial applications of microalgae-based biofuel, including high costs of production and low lipid extraction yield [4,5]. As the most useful sources for biodiesel production, triacylglycerols are the major components of microalgae lipid, which make up 20–50% of the total lipid [6,7,8,9,10,11], and disperse in the cytoplasm, bounded by a rigid cell wall. However, the rigid cell wall makes extraction of the lipid a challenging process. Hence, effective extraction techniques are required to extract lipid from microalgae cells.
Currently, several methods have been investigated at the laboratory-scale for lipid extraction, such as organic solvents, supercritical CO2, subcritical water extraction and milking [12,13,14,15,16]. Among these techniques, organic solvent extraction is a practical method of lipid extraction in industrial applications. Halim et al. and Lee et al. proposed that organic solvents extract lipid from the microalgae cell by diffusing into cytoplasm and dissolved most lipids [16,17]. Lipids undergo counter-diffusion through microalgae cell to the bulk solvent for the downstream process [18]. Organic solvent extraction techniques include both dry and wet routes, depending on the water content of the microalgae. The dry route requires over 90% of the water removal in the microalgae, water evaporation takes up nearly 90.5% of the total energy consumption in the whole process [19,20]. Furthermore, the potential fossil energy ratio (FER) of the wet and dry routes, which shows the ratio of renewable energy input to fossil energy output [20], reaches 1.82 and 2.38, respectively. This indicates that the wet route has higher energy efficiency and more feasibility for piloting [21]. However, cell wall disruption becomes the bottleneck for lipid liberation and extraction of the wet route [22].
The algal cell wall is constructed of complex carbohydrates and glycoproteins and has high mechanical strength and chemical resistance. Pretreatments with mechanical and non-mechanical techniques are usually required for the cell wall disruption. The former typically includes high-pressure homogenization (HPH), high-speed homogenization (HSH), hydrodynamic cavitation, microwaving, and ultrasonication (USN) [23,24,25,26,27,28,29,30,31]. These processes destroy the rigid cell wall with strong external forces, which causes high energy concerns [32,33]. Grimi et al. reported energy consumption ranging from 12 kJ·kg−1 dry weight (DW) for USN treatment of 1.5 MJ·kg−1 DW for HPH process in Nannochloropsis sp. cell disruption [32]. On the other hand, non-mechanical methods are known for lower energy consumption, with direct physical energy transfer and additional chemical reactions for cell disruption [23]. Non-mechanical methods include acid hydrolysis [34], ionic liquid extraction [35,36,37], steam explosion [38], and more. However, further challenges include continuous chemical supplementation, lipid degradation and waste liquor treatment, limiting their commercial applications [23,24].
To address these issues, recent research has focused on making the process more cost-effective and controllable, reducing energy consumption below the algae’s potential energy storage of 21 kJ·g−1, as well as improving the mildness and adaptability of the process and recoverability of products [23,24]. Fenton cell disruption techniques represent a new approach that effectively disrupts the microalgae cell wall. Additionally, the Fenton treatment is a promising technique in effluent disposal. In fact, it can remove over 90% of the chemical oxygen demand (COD) in combined industrial and domestic wastewater for water recycling [39]. These reduce the costs of equipment, maintenance and wastewater treatment, as well as energy consumption. In the Fenton reaction, high oxidative species, HO•, forms through iron catalysis of H2O2 decomposition. They have the ability to efficiently degrade microalgae cell walls (3~5 min) in mild temperatures and atmospheric pressures [40,41]. Moreover, iron catalysts needed in Fenton reactions can also be used for microalgae harvest [35]. However, continuous H2O2 supplement remains a bottleneck of the Fenton treatment due to safety concerns in the handling and shipping process and higher operation costs [42,43]. Meanwhile, difficult controllability of the Fenton reaction is also a major challenge for industrial applications. The excessive reaction usually leads to lipid degradation and markedly decreases the lipid extraction yield. The common ways to solve this problem are to add organic solvents and inhibitors in order to terminate the reaction [40,41], further raising costs [41,44].
It is highly desirable to develop an effective cell wall breaking method under mild conditions which could be regulated quickly and accurately. Moreover, the intracellular fatty acid profile remains stable. As an electrically driven reaction, the electro-Fenton reaction seems to be able to gradually destroy the cell wall by current controlling till the desired breaking effect is obtained. Thus, this study aimed to explore the use of the electro-Fenton reaction as an alternative technique for microalgae cell wall disruption. In this process, H2O2 is continuously generated on the surface of the cathode through cathodic oxygen reduction, which addresses the continuous supplementation of H2O2 as well as safety concerns [45]. Furthermore, the electro-Fenton process can be terminated through regulating current and electrolysis time with convenient operation. For this study, we examined the effects of different parameters (e.g., FeSO4 concentration, current density and time) on disruption of microalgae cell wall with response surface methodology (RSM). We used this models in the optimization process to identify the optimal conditions for lipid extraction. Then, the amount of hydroxyl radical, distribution of iron, monitored changes in the cell wall and lipid droplets were measured by High Performance Liquid Chromatography (HPLC), spectrophotometry, a transmission electron microscope (TEM) and a fluorescence microscope (FM), respectively. Subsequently, to further identify the quality of the extracted lipid, gas chromatography analysis was applied. Finally, the effect of the wastewater directly from electrolysis on cell growth was demonstrated.

2. Materials and Methods

2.1. Strain and Culture Conditions

N. oceanica IMET1, the strain with high triacylglycerol (TAG) and eicosapentaenoic acid (EPA) content, was considered as promising feedstock for microalgal biodiesel production and kindly provided by Dr. Yubin Ma from the Qingdao Institute of Bioenergy and Bioprocess Technology, Chinese Academy of Sciences. Seed cultures were maintained in 250 mL Erlenmeyer flasks with 150 mL of seawater BG-11 medium under continuous artificial illumination. In the experiments, 50 mL logarithmic phase seed cells and 350 mL fresh medium were transferred to glass columns (4.1 cm in diameter, 37 cm in height) with 2% (v/v) CO2. Aeration flow for each column was 10 mL·min−1. Light intensity and temperature were maintained at 50 μM·m−2·s−1 and 25 °C with an initial pH of 7.2, respectively. For the dry cell weight (DCW) measurement, the microalgal culture samples (10 mL) were filtered by pre-weighed 0.8 µm microporous filter papers, and then dried overnight at 105 °C. DCW was calculated using the difference between the final and beginning weights of the filter papers [46].

2.2. Neutral Lipid Extraction and Fatty Acid Analysis

The microalgal total neutral lipid and lipid extraction yield from electrolysis were obtained based on Steriti et al.’s and Fajardo et al.’s methods [41,47], respectively. The yield of extracted neutral lipids was calculated using the ratio between the weight of extracted lipids and the weight of total lipids in the microalgae. For the fatty acid methyl ester (FAME) reaction, 1 mL of the KOH-methanol solution (0.5 M) with nonadecanoic acid (0.1 mg·mL−1) was added to the lipid extract at 65 °C for 15 min, and shaken every 5 min. Next, 2 mL of 14% BF3-methanol solution was added at 65 °C for 2 min with continuous shaking. Subsequently, 2 mL of hexane and 1 mL of saturated NaCl solution was employed, and the FAMEs were dissolved in the hexane layer. For reproducibility, triplicates were carried out in each experimental condition.
FAME analysis was carried out using GC (GC2010, Shimadzu, Kyoto, Japan) equipped with a FID detector and a SP-2560 column (100 m × 0.25 mm × 0.2 µm, Supelco, Bellefonte, PA, USA), based on Zhang et al. [48]. An amount of 1 µL methylated sample was injected at 250 °C. The column temperature was initially set at 165 °C and held for 5 min. Subsequently, it was programmed to 180 °C at the rate of 5 min−1 and held for 5 min. Next, the temperature was increased from 180 °C to 240 °C at the rate of 5 min−1 and held for another 5 min. The temperature of FID detector remained at 260 °C. The flow rate of hydrogen and air were supplied at 40 and 400 mL·min−1, respectively.

2.3. Cell Disruption

Microalgae cells with 26 days cultivation were chosen as the material for electro-Fenton reaction treatment. Amounts of 50 mL cell samples were added into 100 mL glass beakers along with different amounts of FeSO4. Then, two graphite electrodes were dipped into the medium (3 cm2 effective area) and the distance between them was situated at 2 cm. A magnetic stirrer (350–400 rpm) was employed to enhance mass transfer in the electro-Fenton reaction. Compressed oxygen (2 L·min−1) was fed to the cathode for H2O2 production. Finally, electro-Fenton reaction was terminated by turning off the electricity. After electrolysis, microalgae precipitate was collected for lipid extraction according to the Section 2.2.

2.4. Optimization of Electro-Fenton Conditions

Several parameters affecting disruption of microalgae cell wall were evaluated through single-factor experiments by calculating the lipid extraction yield, including electrolysis time, FeSO4 concentration and current density. Triplicate runs were conducted for each combination: FeSO4 (5–15 mM), current density (5–30 mA·cm−2) and electrolysis time (0–60 min). Design expert (version 8.0.6) was used to design the experiments and analyze the data. Experimental designs of the electro-Fenton conditions are shown in Table 1.

2.5. Hydroxyl Radical Detection

The amount of HO• formation in the electro-Fenton reaction was monitored by the modified salicylic acid method [49]. The experimental apparatus was the same as that in Section 2.3. Based on the results of optimization, the electro-Fenton reaction was carried out at 9.1 mM FeSO4, 16.4 mA·cm−2 current density, 2 L·min−1 oxygen feeding at 350–400 rpm in room temperature. In addition, 5 mL salicylic acid-ethanol solution (90 mM) was added into the electro-Fenton reactor, which also contains a 40 mL BG11 culture medium, and the pH of the solution was adjusted to 6.0, which was the same as the final pH value of microalgae medium in electrolysis. For HO• detection, samples were collected at 0, 5, 15, 37 and 60 min, respectively. They were filled through a 0.22 µm luer syringe filter before analysis with HPLC (Shimadzu, LC-20AD). HPLC analysis was performed on an ODS-BD C-18 column (Sinochrom, 4.6 × 260 mm, 5.0 µm) at 35 °C. In the mobile phase, an acetic acid–water–methanol solution (1:79:20) was passed through the column with a flow rate of 1 mL·min−1. The concentrations of salicylic acid and its derivatives were measured with a UV detector at 296 nm. The injection volume was 10 µL each time [49].

2.6. Iron Detection

The iron concentrations in the supernatant and microalgae precipitation were detected with the modified 1,10-phenanthroline method [50]. An amount of 1 mL of microalgae samples collected at day 26 were subjected to electrolysis treatment at the optimized conditions of 0, 5, 15, 37 and 60 min, respectively. The cells without the addition of FeSO4 were used as a control. All experiments were performed in triplicate. Then the experimental cells underwent flocculation for 30 min after electrolysis. Next, the supernatant and precipitate were collected. Before iron detection, each precipitate was added in 50 µL concentrated HCl (37%, v/v), and 1 mL of water mixed by ultrasonic treatment for 5 min to dissolve the precipitated iron. In the detection, 2.5 mL ammonium acetate buffer (mixing 40 g ammonium acetate, 50 mL glacial acetic acid and water to 100 mL) was added into each supernatant and mixture. Then, 1.25 mL hydroxylamine hydrochloride solution (10%) and 2.5 mL 1, 10-phenanthroline (0.5%, m/v) were used to chelate the iron. Sequentially, the volume of solution was supplied to 25 mL with e-pure water. After 10 min, the color development reaction was complete. Finally, samples were measured with a spectrophotometer at 510 nm. The iron detection standard curve was required in each batch.

2.7. Electron Microscopy and Fluorescence Microscope Analysis

To observe the cell wall disruption process, electro-Fenton treatment ranging from 0 to 60 min were performed, respectively. Transmission electron microscopic (TEM) studies were carried out with TEM (JEM-1400; JEOL, Tokyo, Japan) according to Hou et al. [46]. To elucidate the lipid extraction process under electro-Fenton system, the microalgae cells stained by Nile red [51,52] were examined with a fluorescence spectrometer (Leica DM5000B microscope) with BP 516–560 nm excitation filter, 580 nm dichoic mirror and LP 590 nm emission filter (Leica filter cube N2.1) at 25 °C [53].

2.8. Reuse of Electro-Fenton Treated Microalgal Culture Medium for Subsequent Cultivation of Algae

After the reaction was terminated, the cells were settled in tubes for 2 h, the flocculation efficiency was measured by OD680 at different time (t) during the settling process [54]. Flocculation efficiency = (1 − ODt/OD0) × 100%, where ODt is the optical density of the cells at 2 h and OD0 is the initial optical density of the culture for the settling process. For comprehensive utilization of wastewater from the electro-Fenton reaction, culture medium recycling was carried out. The resulting supernatant was centrifuged for further cultivation with replenished fresh BG-11 nutrients, except for FeSO4. Cultivation conditions were consistent with methods described in Section 2.1. DCW was used to evaluate the effects of wastewater on cell growth.

3. Results and Discussion

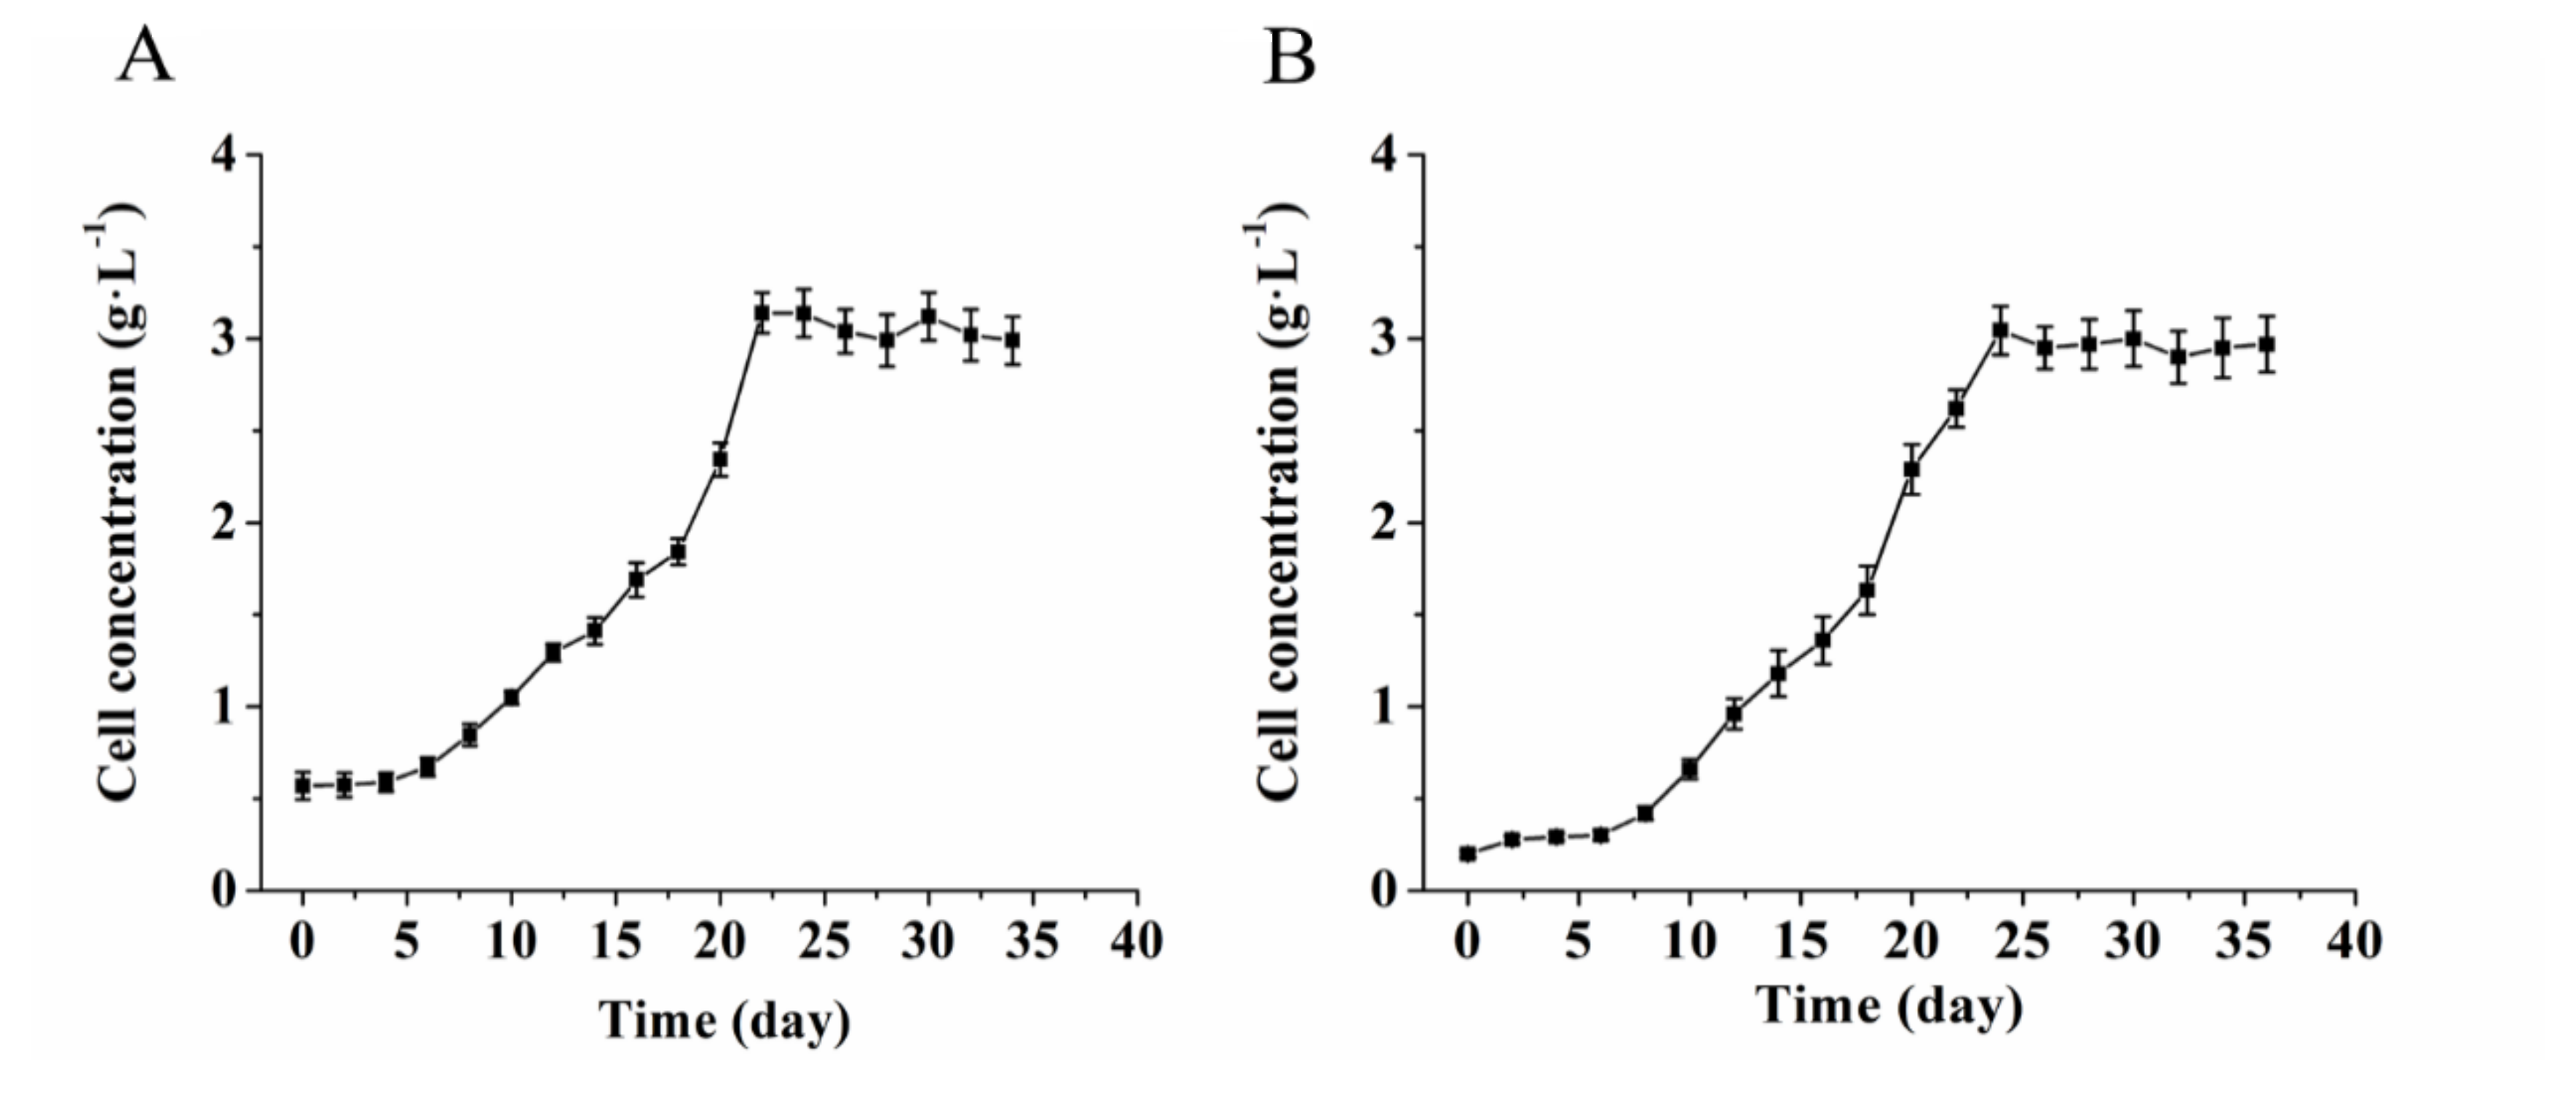
3.1. Growth Properties

To get the high biomass and lipid accumulation, we measured the cell growth curve using dry weight analysis, as shown in the Figure 1A. Results showed that this strain reached the stationary stage, with a biomass concentration of 3.10 g·L−1 after 26 days, and a neutral lipid content of 30.47% (wt/wt, DCW). Before reaching at stationary stage, microalgae began to turn yellow on day 22 (data not shown). This indicated that lipid accumulated gradually in the cells, which was in accordance with with Ma’s results [6]. To evaluate the effects of the electro-Fenton treatment on cell disruption, we need to keep microalgae alive and all the organelles intact, considering that the lack of nutrients and accumulation of toxic catabolites induced cell apoptosis. Thus, the cells cultured to the 26th day were collected for further analysis.

3.2. The Effects of Different Factors on Electro-Fenton Treatment for Lipid Extraction

In this study, we employed the electro-Fenton process for the simultaneous cell disruption and harvest of microalgae as wet biomass. Theoretically, oxygen was directly reduced on the surface of cathodes driven by electricity for H2O2 production. Next, the resulting H2O2 was catalyzed by Fe2+ to produce HO• for microalgae cell wall degradation through the Fenton reaction. Furthermore, Fe3+ kept obtaining electrons on the cathode, which inhibited the side reaction of oxygen generation. The related mechanism is shown as follows [42]:
O2 + e + 2H + → H2O2
Fe2+ + H2O2 → Fe3+ + OH + HO•
Fe3+ + e → Fe2+
Side reaction in the Fenton process:
Fe3+ + H2O2 → Fe2+ + 2H+ + O2
As the main factors, FeSO4 concentration, current density and electrolysis time thus largely affected lipid extraction yield. The optimum experimental conditions were 10 mM FeSO4, 17.5 mA·cm−2 current density and 30 min (Std. order 15 in Table 1). Lipid extraction yield reached the maximum 88.6% (wt%, total neutral lipid). In other electro-Fenton runs, parameters with either lower or higher value decreased the lipid extraction yield. In this process, three factors played important roles in lipid extraction by varying the amount of HO• as well as its contact time with microalgae. Pimentel et al. (2008) found that Fe2+ concentration and current density were directly related to the HO• production rate [55]. In addition, Le et al. and Steriti et al. found that the contact time between HO• and microalgae largely affected cell wall degradation and lipid extraction yield [41,56]. In the Fenton reaction treatment, insufficient HO• could not efficiently achieve cell wall disruption. However, excessive HO• caused lipid consumption. Thus, the method of HO• production must be strictly controlled. In this study, we precisely controlled the electro-Fenton reaction through electricity regulation. The lipid extraction yield of untreated N. oceanica IMET1 was about 40% (%, total neutral lipid), which was much lower than the electro-treated ones. Therefore, the electro-Fenton treatment played an important role in enhancing lipid extraction.

3.3. Confirmation of Predicted Optimum Condition

The predictive quadratic model for lipid extraction yield were based on actual parameters as follows:
Y = −37.83889 + 12.64796 × X1 + 3.79849 × X2 + 1.91768 × X3 − 0.040689 × X1 × X2 − 0.027345 × X1 × X3 − 0.00590643 × X2 × X3 − 0.60049 × X12 − 0.097653 × X22 − 0.021420 × X32;
where Y, X1, X2 and X3 were lipid extraction yield (wt%, total neutral lipid), FeSO4 concentration (mM), current density (mA·cm−2) and time (min), respectively. The predicted maximum lipid extraction yield calculated by the predictive model was 86.33% with the optimum conditions, including 9.1 mM FeSO4, 16.4 mA·cm−2 current density and 37.0 min electrolysis (Figure 2). This model described the experimental data well. The lipid extraction yield verified under the predicted optimum conditions was 87.53%, which was close to the predicted lipid extraction yield. In the optimal conditions, electro-Fenton enhanced the yield from 40% to 87.53%, equal to from 12.2% (wt%, DCW) to 26.7% (wt%, DCW), which is 16.1% and 53.4% higher than that in Ti4O7-based membrane anodic oxidation (23.0 wt%, DCW) and H2O2 with the FeSO4-based (17.4% wt%, DCW) method, respectively [41,57]. Meanwhile, compared to the traditional Fenton reaction, the amount of FeSO4 decreased from 24 mM to 9.1 mM and required no additional H2O2 [40,41]. This makes the pretreatment free from safety concerns of H2O2 in handling and transportation. As a result, electro-Fenton based way seems to be more economically for lipid extraction from wet microalgae.

3.4. Fatty Acid (FA) Composition Analysis during Electro-Fenton Reaction

The quality of the extracted lipid was examined by FAMEs analysis. Previous studies showed that the FAs composition significantly changed under both the Fe2(SO4)3-based method and H2O2 treatment with or without FeSO4 [35,40,41]. In this study, the identified 15 individual FAMEs were shown in Figure 3. In the control group, the major fatty acids (FAs) of IMET1 were palmitic acid (C16:0) and hexadecenoic acid (C16:1), which accounted for 32.5% and 26.2% of the total FAs, respectively. The third most abundant was oleic acid (C18:1), accounting for 22.9%. Notably, compared with FAs composition in the control, there were no obvious changes in the electro-Fenton treatment group after 1h. This was consistent with a previous report that monounsaturated (MUFA) and saturated fatty acids (SFA) were more resistant to HO• than polyunsaturated fatty acids (PUFA), due to their fewer double bonds [58]. The SFA and MUFA, the major contents in the IMET1, reached 40.5% and 49.4%, respectively. This made it difficult for HO• to change the FA composition through peroxidation and degradation [59,60]. High content of these FAs made IMET1 was suitable to this technology for algae cell wall disruption.

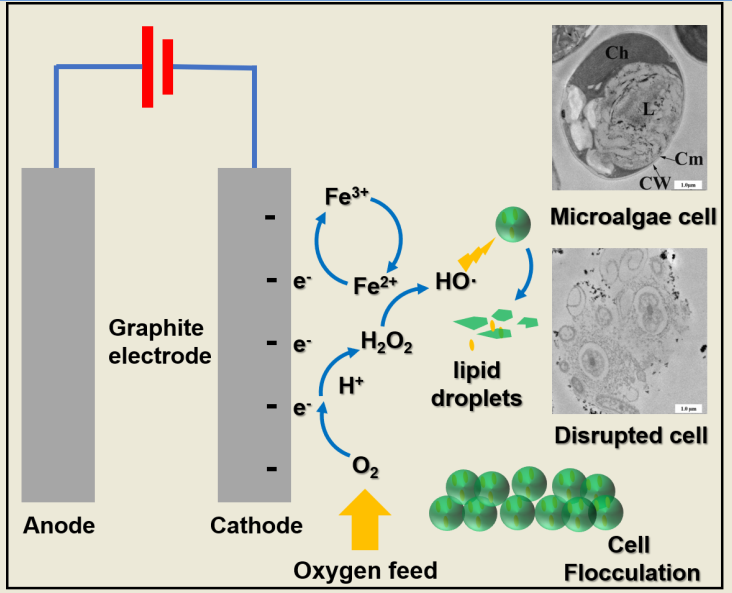
3.5. Microalgae Cell Disruption Mechanism in the Electro-Fenton Reaction

3.5.1. Hydroxyl Radical Generation in the Electro-Fenton Reaction

HO• was continuously produced during the electro-Fenton process. The concentration of HO• was calculated according to this theory that one equivalent of HO• drove one equivalent of hydroxyl group addition on the salicylic acid [49]. Figure 4 presents the line plots for salicylic acid-captured HO• products vs. electrolysis time. The production rates of 2,5-dHBA and 2,3-dHBA were initially kept at 15.76 µM·min−1 and 7.65 µM·min−1, respectively. After 15min, they started to decrease. At the optimal time (37 min), 1.27 mM HO• was formed in the electro-Fenton process. Interestingly, the results showed no obvious accumulation of these products when electricity was turned off (Figure 4). This indicated that the production of HO• could be effectively terminated through electricity regulation. Taking these into account, the electro-Fenton reaction overcomes several problems remaining in the Fenton reactions: first, H2O2 was sustainably produced on-site by oxygen feeding, eliminating the need for acquisition, shipment and storage of H2O2 [43], and might further decrease treatment costs. Second, the reaction termination and HO• production could be artificially regulated by using electricity without additional inhibitors consumption [40]. This could effectively balance microalgae cell wall degradation and lipid oxidation in the Fenton-based wet cell disruption route. Third, the electro-Fenton reaction decreased co-reactions causing by Ferric ions and increased the efficiency of HO• production. This indicated that the production of HO• could be effectively terminated through electricity regulation.

3.5.2. TEM for Microalgae Cell Wall and Cytomembrane Degradation in Electro-Fenton Reaction

The microalgae cell structure was gradually degraded in the electrolysis (Figure 5). Compared with untreated microalgae cells (Figure 5a,b), iron ions were clearly absorbed on the surface of the cell wall, and further diffused to the cytomembrane, even including the lipid body in the FeSO4 group (Figure 5c). However, these microalgae cell structures were kept intact without degradation by the absorbed iron in the 1h treatment (Figure 5d). In addition, we used electrolysis to treat microalgae cells for 15 min. It was discovered that most of microalgae were dead, and some organelles, such as chloroplast, were destroyed (Figure 5e). At the same time, a pore formed by HO• degradation on the cytomembrane (Figure 5f). We presumed that the thickness of cell wall was thicker than that of the cytomembrane, which firstly caused cytomembrane degradation. However, cell wall disruption was the true bottleneck in microalgae lipid wet extraction [12,14]. We found that a 15 min electro-Fenton reaction did not destroy the cell wall (Figure 5d), which was consistent with our previous results showing that 15 min was not the optimized electrolysis time for lipid extraction. In addition, when the electrolysis time reached 37 min, most of the organelles, including the lipid body, were destroyed (Figure 5g). Figure 5h depicted a pore that appeared on the cell wall. This suggested that cell wall disruption occurred in 37 min. Cell wall degradation changed the shape of microalgae cell and resulted in a higher lipid extraction yield. Finally, most of the microalgae cell structure was completely destroyed after 1h of electro-Fenton treatment (Figure 5i). The cell wall and cytomembrane were completely disrupted, and the intracellular contents leaked out (Figure 5j). In the meantime, the lipid was directly exposed to electro-Fenton agents as it diffused into the electrolyte, which caused lipid degradation by HO•. These results were consistent with Steriti et al.’s report [41]. This meant that the disruption degree of the cell wall could be regulated by electrolysis time, which aided the sequential extraction of various products from the microalgal cell.

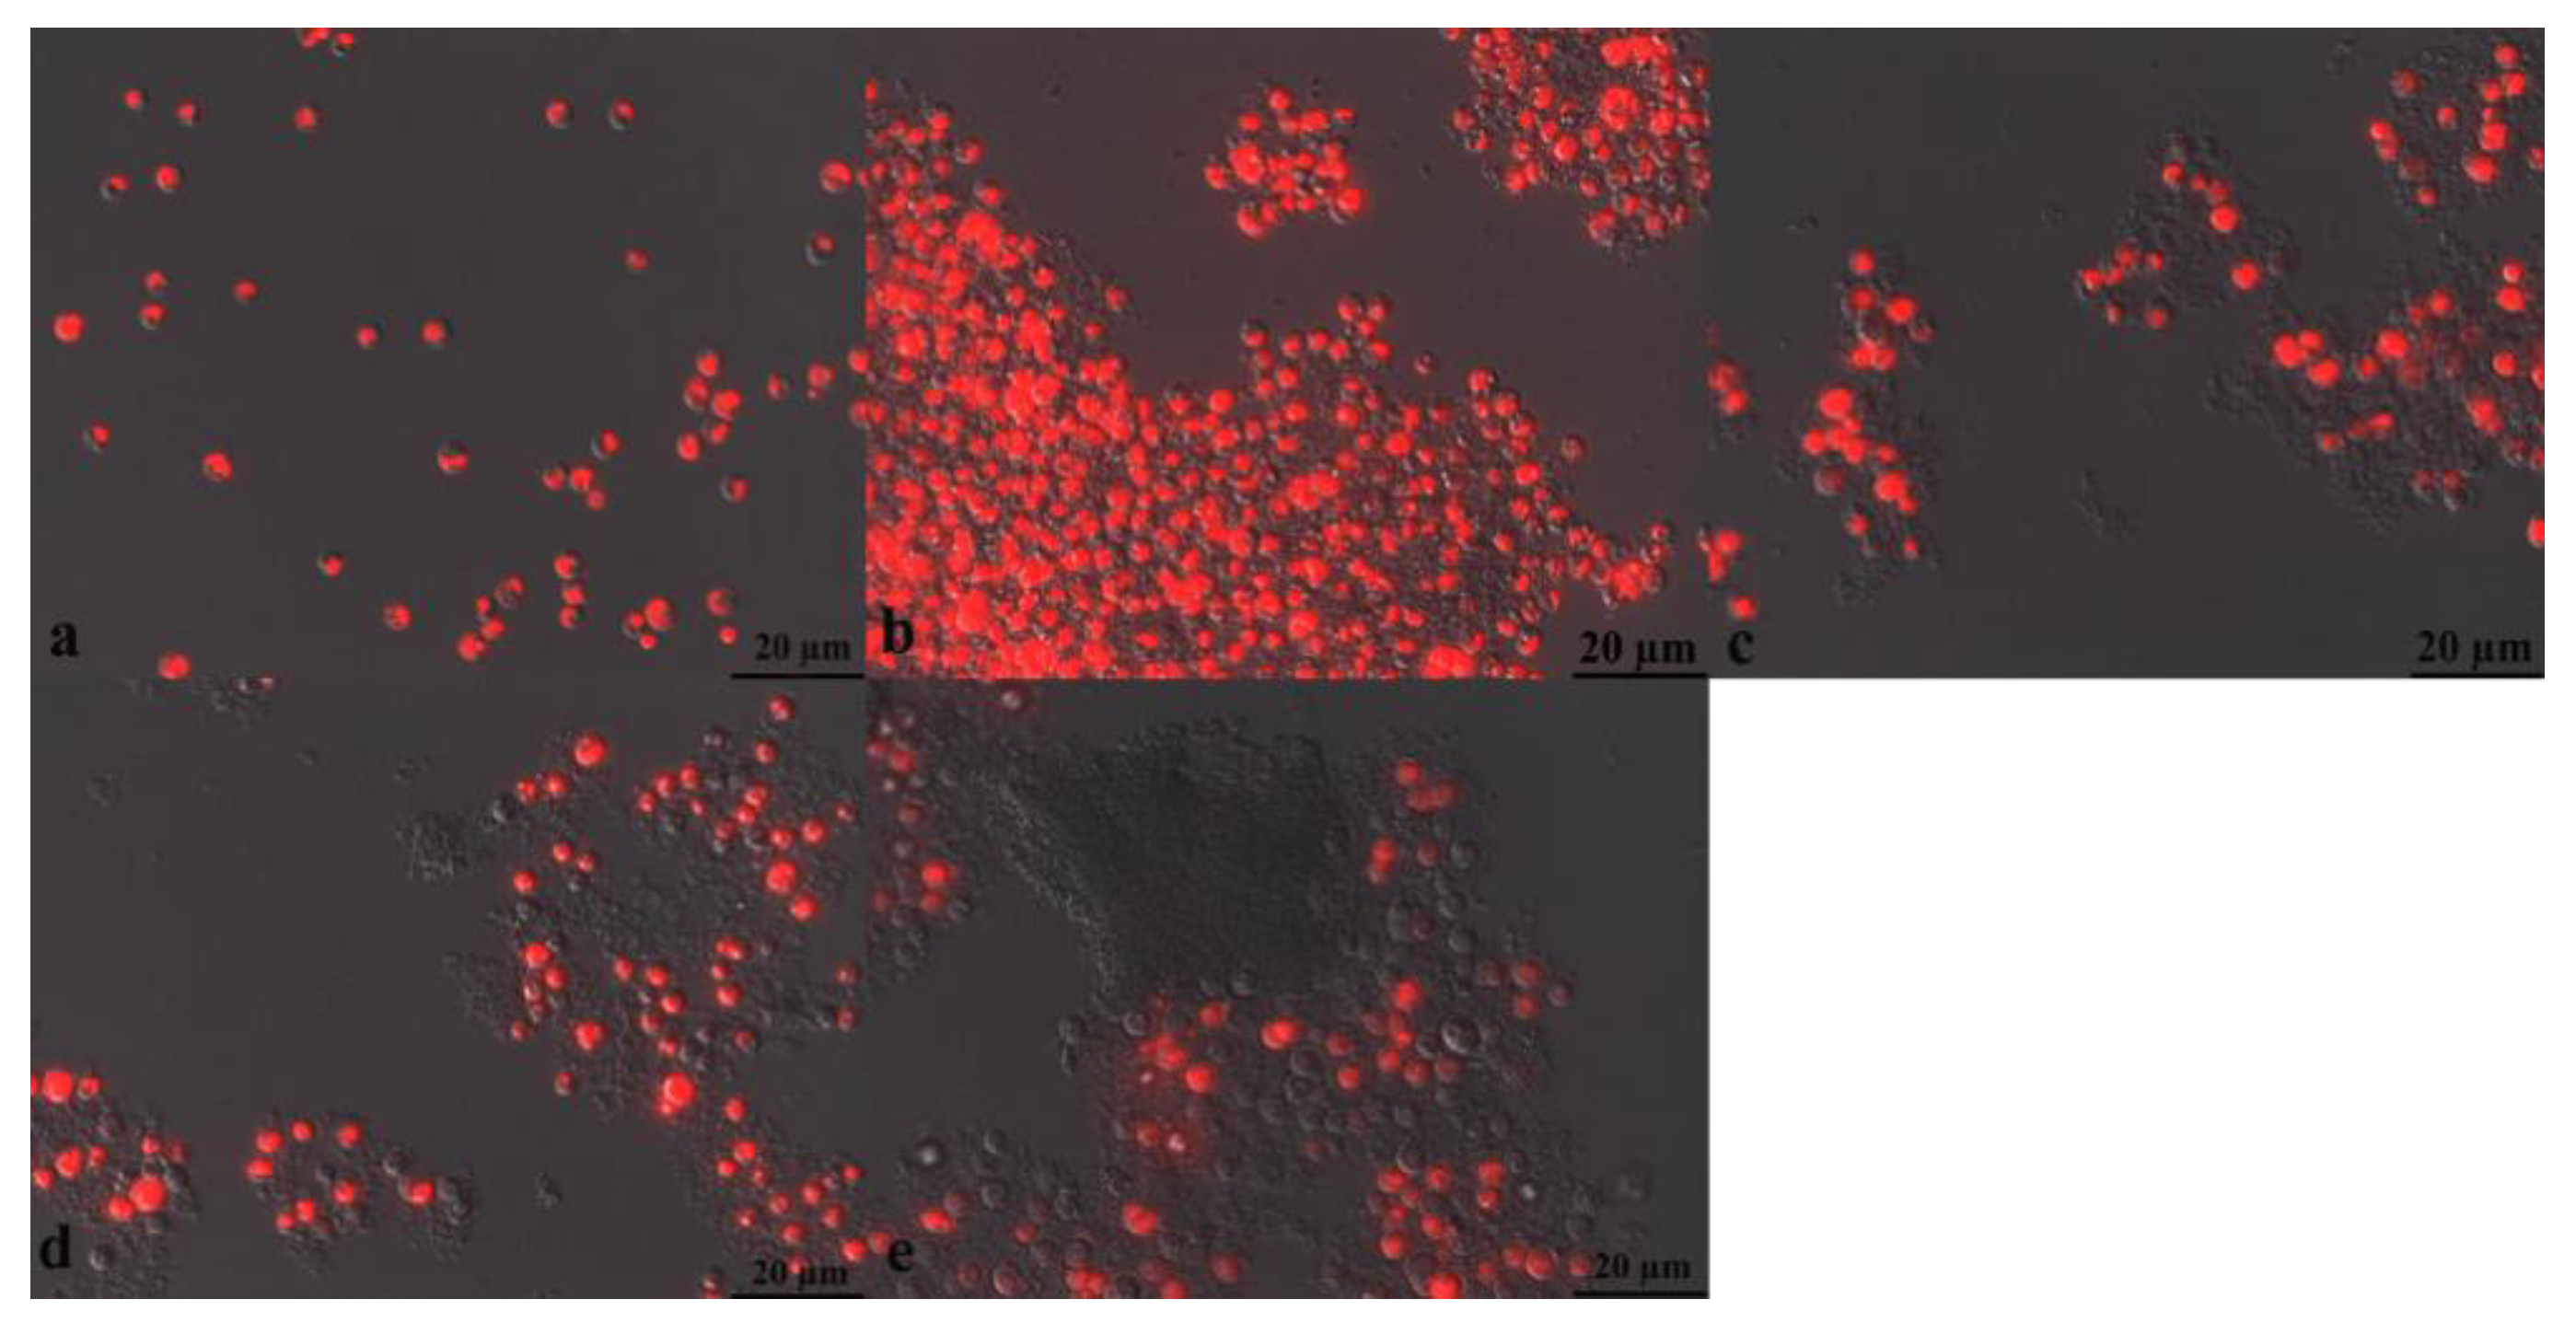
3.5.3. Fluorescence Microscope (FM) for Microalgae Observation during Electro-Fenton Reaction

Interestingly, microalgae cells showed obvious coagulation with iron addition, resulting in an efficient sedimentation. In contrast, the untreated microalgae cells dispersed in the culture medium and were separated from each other (Figure 6a). The addition of FeSO4 caused cell aggregation, and the cells were still complete (Figure 6b). The red fluorescence used to track lipid position did not show obvious changes during 1h of FeSO4 treatment. This indicated that cell and lipid degradation did not occur during FeSO4 treatment. Considering that the cost of harvesting is estimated as 20–30% of the total production costs, the treatment might make it more economical for biofuel production. In the next experiment, we used the electro-Fenton reaction to disrupt microalgae cells. The red fluorescence appeared on the whole microalgae cells, which meant that the lipid body was disrupted during the 15 min electro-Fenton reaction (Figure 6c). It was probable that the lipid body membranes absorbed the iron ions (Figure 5e), which catalyzed the resulting H2O2 from electrolysis to produce HO• on site and destroyed the membranes. When the reaction time was lengthened to 37 min, red fluorescence began to appear outside of the cells, as shown in the FM image (Figure 6d). This was consistent with our previous results that the cell wall was disrupted (Figure 5h). However, a one-hour electro-Fenton reaction disrupted most cells, and their fragments aggregated together (Figure 6e). A large amount of red fluorescence appeared among the resulting fragments with low intensity. This confirmed that HO• was able to completely destroy the microalgae cell structure. The leaked lipids were constantly exposed to HO• and consumed through oxidation reaction. Luckily, the reaction was accurately controlled, the high flocculation rate, high lipid extraction and low cost was thus obtained easily by the manual controls.

3.6. Iron Distribution

In the electrolysis process, iron functioned as the catalyst that induced HO• production [55], and also as the coagulant that enhanced the microalgae harvest through microalgae surficial charge neutralization [35,61]. Owning to these functions, iron distribution was further investigated to explain the trend of HO• production and provide the data for iron recovery in the downstream process. As shown in Figure 7a, iron concentration in the supernatant decreased from 322 mg·L−1 to 22 mg·L−1, while it increased from 179 mg·L−1 to 320 mg·L−1 in the precipitate during 60 min electrolysis. In addition, part of the iron was absorbed on the surface of the cathode through iron reduction. Figure 7b indicates that the iron abundance of supernatant during 60 min electrolysis decreased from 64% to 4%. However, the iron abundance of precipitate and electrodes increased from 33% to 63% and 2% to 33%, respectively. These results indicate that there were three main stages of iron distribution. In the first stage, about 33% of the iron was rapidly adhered on the microalgae through absorption, and 64% of that remained as free ions in the electrolyte. Metal ions could neutralize the negative charges distributed on the surface of the microalgae cell wall [61]. This was also confirmed by the fact that iron dispersed on the cell wall, cytomembrane and lipid droplets of microalgae (Figure 5c). In the second stage, 18% of additional iron attached to the microalgae during 5 min of electrolysis. It appears that the chemicals, such as Fe(OH)2 and Fe(OH)3, which formed during electrolysis, enhanced cell coagulation. In the third stage, iron began to accumulate on the surface of the cathode by iron reduction and continuously absorbed on the microalgae. As a result, the decreased contact area between cathode and oxygen would inhibit the electrolysis efficiency and cell disruption. Furthermore, more than 60% of iron was removed from the supernatant, prompting us to recover iron from precipitate residues after lipid extraction. On the other hand, FeSO4 also functioned as a precipitant for microalgae co-flocculation during electrolysis, the self-flocculation efficiency reached 85.2% after the reaction was terminated (data not shown).

3.7. Microalgae Cultivation in the Electro-Fenton Wastewater

The electro-Fenton process is well-known as a kind of advanced oxidation process (AOP) in wastewater treatment. We discovered that microalgae could grow well in the resulting wastewater. Figure 1B displays the growth curve of IMET1 in the wastewater. The results show that microalgae could grow in the wastewater at up to 3.0 g·L−1 in 24 days cultivation. After that, microalgae reached a stationary stage without obvious biomass accumulation. The growth curve of microalgae cultured with wastewater was similar to fresh medium. This indicated that the quality of wastewater met the requirements for IMET1 growth and did not negatively affect the growth of microalgae.

4. Conclusions

This study investigated a novel microalgae cell disruption technique for N. oceanica IMET1 lipid extraction based on the electro-Fenton reaction. The findings showed that the yield of lipid extraction depended on current density, Fe2+ concentration and electrolysis time. With the optimal conditions of 16.4 mA·cm−2 current density, 9.1 mM Fe2+ and 37.0 min electrolysis time, 87.53% of the lipid was extracted (%, total neutral lipids), and there were no obvious changes in intracellular components. After electrolysis, over 60% of the total iron distributed in the microalgae precipitation and on the surface of the electrode, which could be used for iron recovery and contribute towards cell harvest (85.2%). Furthermore, the resulting wastewater containing 88 mg·L−1 iron ions met the quality requirements for microalgae cultivation, and no inhibitors clearly affected microalgae growth. This electrochemistry technology holds promise as an efficient approach for microalgae biofuel extraction.

Author Contributions

Concenptualization, S.Z. and Y.H.; Data curation, D.Z.; Formal analysis, S.Z., Z.L. and W.W. (Weijie Wang); Fungding acquisition, F.C.; Investigation, S.Z., Y.H., D.W. and F.C.; Methodology, S.Z. and Y.H.; Project administration, S.C. and F.C.; Software, W.W. (Weijie Wang) and W.W. (Wenya Wang); Supervision, X.J. and W.W. (Wenya Wang); Validation, Z.L. and X.J.; Visualizaiton, D.W. and D.Z.; Writing-original draft, S.Z. and Y.H.; Writing-review & editing, Y.H., S.C. and F.C. All authors have read and agreed to the published version of the manuscript.

Funding

This work was supported partly by the National Key R&D Program of China (2019YFA090460203, 2018YFE0107200, 2016YFD0501405), the Tianjin Synthetic Biotechnology Innovation Capacity Improvement Project (TSBICIP-KJGG-004-05), the National Science Foundation of the United States (Grant No. 1231085), the Key Program for International Cooperation Projects of Sino-Canada (Grant No. 155112KYSB20160030), and the National Natural Science Foundation of China (Grant No. 31570047).

Acknowledgments

The authors thank Dr. Huanhuan Zhai (Tianjin Institute of Industrial Biotechnology, Chinese Academy of Sciences) for analysis of transmission electron microscope (TEM) observations and Dr. Lixian Wang (Tianjin Institute of Industrial Biotechnology, Chinese Academy of Sciences) for analysis of fluorescence microscopy (FM) observations.

Conflicts of Interest

The authors declare no conflict of interest.

References

  1. Demirbas, M.F. Biorefineries for biofuel upgrading: A critical review. Appl. Energy 2009, 86, S151–S161. [Google Scholar] [CrossRef]
  2. Moreira, D.; Pires, J.C. Atmospheric CO2 capture by algae: Negative carbon dioxide emission path. Bioresour. Technol. 2016, 215, 371–379. [Google Scholar] [CrossRef] [PubMed]
  3. Mata, T.M.; Martins, A.A.; Caetano, N.S. Microalgae for biodiesel production and other applications: A review. Renew. Sustain. Energy Rev. 2010, 14, 217–232. [Google Scholar] [CrossRef] [Green Version]
  4. Concas, A.; Lutzu, G.A.; Pisu, M.; Cao, G. Experimental analysis and novel modeling of semi-batch photobioreactors operated with Chlorella vulgaris and fed with 100% (v/v) CO2. Chem. Eng. J. 2012, 213, 203–213. [Google Scholar] [CrossRef]
  5. Concas, A.; Steriti, A.; Pisu, M.; Cao, G. Comprehensive modeling and investigation of the effect of iron on the growth rate and lipid accumulation of Chlorella vulgaris cultured in batch photobioreactors. Bioresour. Technol. 2014, 153, 340–350. [Google Scholar] [CrossRef]
  6. Ma, Y.; Wang, Z.; Yu, C.; Yin, Y.; Zhou, G. Evaluation of the potential of 9 Nannochloropsis strains for biodiesel production. Bioresour. Technol. 2014, 167, 503–509. [Google Scholar] [CrossRef]
  7. Gonçalves, A.L.; Rodrigues, C.M.; Pires, J.C.M.; Simões, M. The effect of increasing CO2 concentrations on its capture, biomass production and wastewater bioremediation by microalgae and cyanobacteria. Algal Res. 2016, 14, 127–136. [Google Scholar] [CrossRef]
  8. Wahlen, B.D.; Willis, R.M.; Seefeldt, L.C. Biodiesel production by simultaneous extraction and conversion of total lipids from microalgae, cyanobacteria, and wild mixed-cultures. Bioresour. Technol. 2011, 102, 2724–2730. [Google Scholar] [CrossRef]
  9. Hu, Q.; Sommerfeld, M.; Jarvis, E.; Ghirardi, M.; Posewitz, M.; Seibert, M.; Darzins, A. Microalgal triacylglycerols as feedstocks for biofuel production: Perspectives and advances. Plant J. 2008, 54, 621–639. [Google Scholar] [CrossRef]
  10. Ranjan, A.; Patil, C.; Moholkar, V.S. Mechanistic assessment of microalgal lipid extraction. Ind. Eng. Chem. Res. 2014, 49, 2979–2985. [Google Scholar] [CrossRef]
  11. Sharma, K.K.; Schuhmann, H.; Schenk, P.M. High Lipid Induction in Microalgae for Biodiesel Production. Energies 2012, 5, 1532–1553. [Google Scholar] [CrossRef] [Green Version]
  12. Wijffels, R.H.; Barbosa, M.J. An Outlook on Microalgal Biofuels. Science 2010, 329, 796–799. [Google Scholar] [CrossRef] [PubMed] [Green Version]
  13. Schäfer, K. Accelerated solvent extraction of lipids for determining the fatty acid composition of biological material. Anal. Chim. Acta 1998, 358, 69–77. [Google Scholar] [CrossRef]
  14. Cheng, C.H.; Du, T.B.; Pi, H.C.; Jang, S.M.; Lin, Y.H.; Lee, H.T. Comparative study of lipid extraction from microalgae by organic solvent and supercritical CO2. Bioresour. Technol. 2011, 102, 10151–10153. [Google Scholar] [CrossRef] [PubMed]
  15. Herrero, M.; Cifuentes, A.; Ibañez, E. Sub- and supercritical fluid extraction of functional ingredients from different natural sources: Plants, food-by-products, algae and microalgae: A review. Food Chem. 2006, 98, 136–148. [Google Scholar] [CrossRef] [Green Version]
  16. Lee, A.K.; Lewis, D.M.; Ashman, P.J. Disruption of microalgal cells for the extraction of lipids for biofuels: Processes and specific energy requirements. Biomass Bioenergy 2012, 46, 89–101. [Google Scholar] [CrossRef]
  17. Halim, R.; Danquah, M.K.; Webley, P.A. Extraction of oil from microalgae for biodiesel production: A review. Biotechnol. Adv. 2012, 30, 709–732. [Google Scholar] [CrossRef]
  18. Halim, R.; Gladman, B.; Danquah, M.K.; Webley, P.A. Oil extraction from microalgae for biodiesel production. Bioresour. Technol. 2011, 102, 178–185. [Google Scholar] [CrossRef]
  19. Lardon, L.; Hélias, A.; Sialve, B.; Steyer, J.P.; Bernard, O. Life-cycle assessment of biodiesel production from microalgae. Environ. Sci. Technol. 2009, 43, 6475. [Google Scholar] [CrossRef] [Green Version]
  20. Pradhan, A.; Shrestha, D.; McAloon, A.; Yee, W.; Haas, M.; Duffield, J.; Shapouri, H. Energy Life-Cycle assessment of soybean biodiesel revisited. Trans. ASABE 2009, 54, 1031–1039. [Google Scholar] [CrossRef]
  21. Xu, L.; Brilman, D.W.F.; Withag, J.A.M.; Brem, G.; Kersten, S. Assessment of a dry and a wet route for the production of biofuels from microalgae: Energy balance analysis. Bioresour. Technol. 2011, 102, 5113. [Google Scholar] [CrossRef]
  22. Taher, H.; Al-Zuhair, S.; Al-Marzouqi, A.H.; Haik, Y.; Farid, M. Effective extraction of microalgae lipids from wet biomass for biodiesel production. Biomass Bioenergy 2014, 66, 159–167. [Google Scholar] [CrossRef]
  23. Günerken, E.; D’Hondt, E.; Eppink, M.H.; Garcia-Gonzalez, L.; Elst, K.; Wijffels, R.H. Cell disruption for microalgae biorefineries. Biotechnol. Adv. 2015, 33, 243. [Google Scholar] [CrossRef]
  24. Shirgaonkar, I.Z.; Lothe, R.R.; Pandit, A.B. Comments on the mechanism of microbial cell disruption in high-pressure and high-speed devices. Biotechnol. Prog. 1998, 14, 657–660. [Google Scholar] [CrossRef]
  25. Balasundaram, B.; Pandit, A.B. Selective release of invertase by hydrodynamic cavitation. Biochem. Eng. J. 2001, 8, 251–256. [Google Scholar] [CrossRef]
  26. Cheng, J.; Sun, J.; Huang, Y.; Feng, J.; Zhou, J.; Cen, K. Dynamic microstructures and fractal characterization of cell wall disruption for microwave irradiation-assisted lipid extraction from wet microalgae. Bioresour. Technol. 2013, 150, 67. [Google Scholar] [CrossRef]
  27. Cheng, J.; Yu, T.; Li, T.; Zhou, J.; Cen, K. Using wet microalgae for direct biodiesel production via microwave irradiation. Bioresour. Technol. 2013, 131, 531–535. [Google Scholar] [CrossRef]
  28. Naghdi, F.G.; González, L.M.G.; Chan, W.; Schenk, P.M. Progress on lipid extraction from wet algal biomass for biodiesel production. Microb. Biotechnol. 2016, 9, 718–726. [Google Scholar] [CrossRef]
  29. Gogate, P.R.; Pandit, A.B. Application of cavitational reactors for cell disruption for recovery of intracellular enzymes. J. Chem. Technol. Biotechnol. 2008, 83, 1083–1093. [Google Scholar] [CrossRef]
  30. Keris-Sen, U.D.; Sen, U.; Soydemir, G.; Gurol, M.D. An investigation of ultrasound effect on microalgal cell integrity and lipid extraction efficiency. Bioresour. Technol. 2014, 152, 407–413. [Google Scholar] [CrossRef]
  31. Valizadeh Derakhshan, M.; Nasernejad, B.; Dadvar, M.; Hamidi, M. Pretreatment and kinetics of oil extraction from algae for biodiesel production. Asia Pac. J. Chem. Eng. 2014, 9, 629–637. [Google Scholar] [CrossRef]
  32. Grimi, N.; Dubois, A.; Marchal, L.; Jubeau, S.; Lebovka, N.I.; Vorobiev, E. Selective extraction from microalgae Nannochloropsis sp. using different methods of cell disruption. Bioresour. Technol. 2014, 153, 254–259. [Google Scholar] [CrossRef] [PubMed]
  33. Kim, D.-Y.; Vijayan, D.; Praveenkumar, R.; Han, J.-I.; Lee, K.; Park, J.-Y.; Chang, W.-S.; Lee, J.-S.; Oh, Y.-K. Cell-wall disruption and lipid/astaxanthin extraction from microalgae: Chlorella and Haematococcus. Bioresour. Technol. 2016, 199, 300–310. [Google Scholar] [CrossRef]
  34. Park, J.Y.; Oh, Y.K.; Lee, J.S.; Lee, K.; Jeong, M.J.; Choi, S.A. Acid-catalyzed hot-water extraction of lipids from Chlorella vulgaris. Bioresour. Technol. 2014, 153, 408. [Google Scholar] [CrossRef]
  35. Kim, D.Y.; Oh, Y.K.; Park, J.Y.; Kim, B.; Choi, S.A.; Han, J.I. An integrated process for microalgae harvesting and cell disruption by the use of ferric ions. Bioresour. Technol. 2015, 191, 469–474. [Google Scholar] [CrossRef]
  36. Teixeira, R.E. Energy-efficient extraction of fuel and chemical feedstocks from algae. Green Chem. 2012, 14, 419–427. [Google Scholar] [CrossRef]
  37. Vanthoorkoopmans, M.; Wijffels, R.H.; Barbosa, M.J.; Eppink, M.H.M. Biorefinery of microalgae for food and fuel. Bioresour. Technol. 2013, 135, 142–149. [Google Scholar] [CrossRef]
  38. Nurra, C.; Torras, C.; Clavero, E.; Ríos, S.; Rey, M.; Lorente, E.; Farriol, X.; Salvadó, J. Biorefinery concept in a microalgae pilot plant. Culturing, dynamic filtration and steam explosion fractionation. Bioresour. Technol. 2014, 163, 136. [Google Scholar] [CrossRef]
  39. Badawy, M.I.; Ali, M.E. Fenton’s peroxidation and coagulation processes for the treatment of combined industrial and domestic wastewater. J. Hazard. Mater. 2006, 136, 961. [Google Scholar] [CrossRef]
  40. Concas, A.; Pisu, M.; Cao, G. Disruption of microalgal cells for lipid extraction through Fenton reaction: Modeling of experiments and remarks on its effect on lipids composition. Chem. Eng. J. 2015, 263, 392–401. [Google Scholar] [CrossRef]
  41. Steriti, A.; Rossi, R.; Concas, A.; Cao, G. A novel cell disruption technique to enhance lipid extraction from microalgae. Bioresour. Technol. 2014, 164, 70–77. [Google Scholar] [CrossRef]
  42. Brillas, E.; Sirés, I.; Oturan, M.A. Electro-Fenton process and related electrochemical technologies based on Fenton’s reaction chemistry. Chem. Rev. 2009, 109, 6570–6631. [Google Scholar] [CrossRef]
  43. Qiang, Z.; Chang, J.-H.; Huang, C.-P. Electrochemical generation of hydrogen peroxide from dissolved oxygen in acidic solutions. Water Res. 2002, 36, 85–94. [Google Scholar] [CrossRef]
  44. Lopes, G.K.; Schulman, H.M.; Hermeslima, M. Polyphenol tannic acid inhibits hydroxyl radical formation from Fenton reaction by complexing ferrous ions. BBA Biomembr. 1999, 1472, 142–152. [Google Scholar]
  45. Oturan, M.A. An ecologically effective water treatment technique using electrochemically generated hydroxyl radicals for in situ destruction of organic pollutants: Application to herbicide 2, 4-D. J. Appl. Electrochem. 2000, 30, 475–482. [Google Scholar] [CrossRef]
  46. Hou, Y.; Liu, Z.; Yue, Z.; Chen, S.; Zheng, Y.; Chen, F. CAH1 and CAH2 as key enzymes required for high bicarbonate tolerance of a novel microalga Dunaliella salina HTBS. Enzym. Microb. Technol. 2016, 87, 17–23. [Google Scholar] [CrossRef]
  47. Fajardo, A.R.; Cerdán, L.E.; Medina, A.R.; Moreno, P.A.G.; Grima, E.M. Lipid extraction from the microalga Phaeodactylum tricornutum. Eur. J. Lipid Sci. Technol. 2007, 109, 120–126. [Google Scholar] [CrossRef]
  48. Zhang, K.; Li, H.; Chen, W.; Zhao, M.; Cui, H.; Min, Q.; Wang, H.; Chen, S.; Li, D. Regulation of the Docosapentaenoic Acid/Docosahexaenoic Acid Ratio (DPA/DHA Ratio) in Schizochytrium limacinum B4D1. Appl. Biochem. Biotechnol. 2016, 182, 1–15. [Google Scholar] [CrossRef]
  49. Jen, J.F.; Leu, M.F.; Yang, T.C. Determination of hydroxyl radicals in an advanced oxidation process with salicylic acid trapping and liquid chromatography. J. Chromatogr. A 1998, 796, 283–288. [Google Scholar] [CrossRef]
  50. Gu, X.; Chen, C.; Zhou, T. Spectrophotometric method for the determination of ascorbic acid with iron (III)-1,10-phenanthroline after preconcentration on an organic solvent-soluble membrane filter. Anal. Bioanal. Chem. 1996, 355, 94–95. [Google Scholar] [CrossRef]
  51. Alemán-Nava, G.S.; Cuellar-Bermudez, S.P.; Cuaresma, M.; Bosma, R.; Muylaert, K.; Ritmann, B.E.; Parra, R. How to use Nile Red, a selective fluorescent stain for microalgal neutral lipids. J. Microbiol. Methods 2016, 128, 74–79. [Google Scholar] [CrossRef]
  52. Lieselot, B.; Cedrick, V.; Koen, G.; Charlotte, B.; Koenraad, M.; Imogen, F. Optimization of a Nile Red method for rapid lipid determination in autotrophic, marine microalgae is species dependent. J. Microbiol. Methods 2015, 118, 152. [Google Scholar]
  53. Greenspan, P.; Mayer, E.P.; Fowler, S.D. Nile red: A selective fluorescent stain for intracellular lipid droplets. J. Cell. Biol. 1985, 100, 965–973. [Google Scholar] [CrossRef] [Green Version]
  54. Liu, Z.Y.; Liu, C.F.; Hou, Y.Y.; Chen, S.L.; Xiao, D.G.; Zhang, J.K.; Chen, F.J. Isolation and Characterization of a Marine Microalga for Biofuel Production with Astaxanthin as a Co-Product. Energies 2013, 6, 2759–2772. [Google Scholar] [CrossRef] [Green Version]
  55. Pimentel, M.; Oturan, N.; Dezotti, M.; Oturan, M.A. Phenol degradation by advanced electrochemical oxidation process electro-Fenton using a carbon felt cathode. Appl. Catal. B Environ. 2008, 83, 140–149. [Google Scholar] [CrossRef]
  56. Le, G.; Li, D.; Feng, G.; Liu, Z.; Hou, Y.; Chen, S.; Zhang, D. Hydroxyl radical-aided thermal pretreatment of algal biomass for enhanced biodegradability. Biotechnol. Biofuels 2015, 8, 194. [Google Scholar]
  57. Hua, L.; Guo, L.; Thakkar, M.; Wei, D.; Agbakpe, M.; Kuang, L.; Magpile, M.; Chaplin, B.P.; Tao, Y.; Shuai, D. Effects of anodic oxidation of a substoichiometric titanium dioxide reactive electrochemical membrane on algal cell destabilization and lipid extraction. Bioresour. Technol. 2016, 203, 112–117. [Google Scholar] [CrossRef] [Green Version]
  58. Carocho, M.; Ferreira, I.C. A review on antioxidants, prooxidants and related controversy: Natural and synthetic compounds, screening and analysis methodologies and future perspectives. Food Chem. Toxicol. 2013, 51, 15–25. [Google Scholar] [CrossRef]
  59. Gutteridge, J.M. Lipid peroxidation and antioxidants as biomarkers of tissue damage. Clin. Chem. 1995, 41, 1819. [Google Scholar] [CrossRef]
  60. Machlin, L.J.; Bendich, A. Free radical tissue damage: Protective role of antioxidant nutrients. FASEB J. 1987, 1, 441. [Google Scholar] [CrossRef]
  61. Chen, C.Y.; Yeh, K.L.; Aisyah, R.; Lee, D.J.; Chang, J.S. Cultivation, photobioreactor design and harvesting of microalgae for biodiesel production: A critical review. Bioresour. Technol. 2011, 102, 71–81. [Google Scholar] [CrossRef] [PubMed]
Figure 1. The growth curve of N. oceanica IMET1 (A. fresh seawater BG-11; B. electro-Fenton resulting wastewater).
Energies 13 03813 g001
Figure 2. Respond surface curve standing for the interactive effects of FeSO4 concentration, current density and time on the lipid extraction yield: (A) effect of FeSO4 concentration and current density; (B) effect of FeSO4 and time; (C) effect of current density and time.
Energies 13 03813 g002
Figure 3. Effect of electrolysis time on the composition of extracted fatty acids from N. oceanica IMET1.
Energies 13 03813 g003
Figure 4. 2, 3-dHBA and 2, 5-dHBA production versus time in electro-Fenton process.
Energies 13 03813 g004
Figure 5. Transmission electron microscope (TEM) image of microalgae. (a) fresh microalgae cell without any treatment, (b) parts of fresh microalgae cell without any treatment, (c) microalgae cell with FeSO4 addition, (d) parts of microalgae cell with FeSO4 addition, (e) microalgae cell with 15 min electro-Fenton treatment, (f) microalgae cell with 15 min electro-Fenton treatment, (g) microalgae cell with 37 min electro-Fenton treatment, (h) parts of microalgae cell with 30 min electro-Fenton treatment, (i) microalgae cell with 1 h electro-Fenton treatment, (j) parts of microalgae cell with 1 h electro-Fenton treatment.
Energies 13 03813 g005
Figure 6. Fluorescence microscopy (FM) image of microalgae. (a) Fresh microalgae cell without any treatment, (b) microalgae cell with FeSO4 addition, (c) microalgae cell with 15 min electro-Fenton treatment, (d) microalgae cell with 37 min electro-Fenton treatment, (e) microalgae cell with 1 h electro-Fenton treatment.
Energies 13 03813 g006
Figure 7. Iron distribution in the supernatant and precipitate (a). Averaged relative abundance of iron in each phase (b). IOE stands for iron abundance on the surface of electrode. IIP stands for iron abundance in the precipitate. IIS stands for iron abundance in the supernatant.
Energies 13 03813 g007
Table 1. Experimental design matrix for the optimization of electro-Fenton conditions.
Std. OrderRun OrderFe2+ Conc. (mM)Current Density (mA·cm−2)Time (min)Extraction Yield (wt%)
17110.0017.5030.0084.00
11210.005.0060.0064.97
6315.0017.500.0043.31
345.0030.0030.0058.41
10510.0030.000.0040.36
12610.0030.0060.0054.80
13710.0017.5030.0081.71
16810.0017.5030.0084.99
4915.0030.0030.0046.60
151010.0017.5030.0088.60
141110.0017.5030.0085.64
5125.0017.500.0046.27
7135.0017.5060.0066.28
1145.005.0030.0057.75
21515.005.0030.0056.11
91610.005.000.0041.67
81715.0017.5060.0046.92

