Article

Comparison of the Use of Energy Storages and Energy Curtailment as an Addition to the Allocation of Renewable Energy in the Distribution System in Order to Minimize Development Costs

by
Mateusz Andrychowicz
Institute of Mechatronics and Information Systems, Lodz University of Technology, 90-924 Lodz, Poland
Energies 2020, 13(14), 3746; https://doi.org/10.3390/en13143746
Submission received: 12 June 2020 / Revised: 9 July 2020 / Accepted: 15 July 2020 / Published: 21 July 2020

Abstract

:
This paper presents a comparison of the efficiency of energy storage and energy curtailment as an addition to the allocation of renewable energy in the distribution system in order to minimize development costs using a Mixed Integer-Linear Programming (MILP). Energy sources and energy storages are selected, sized and allocated under operational circumstances such as grid congestions and weather conditions. Loads and power units are modeled by daily consumption and generation profiles respectively, to reflect the intermittent character of renewable generation and consumption of energy. The optimization is carried out for a one-year time horizon using twenty-four representative days. The method is verified on three main simulation scenarios and three sub-scenarios for each of them, allowing for the comparison of the efficiency of each used tool. The main scenarios differ in their share of energy from renewable energy sources (RES) in total consumption. In the sub-scenarios, different tools (RES sizing and allocation, energy storages (ES) sizing and allocation and energy curtailment) are used. The results of this research confirm that energy curtailment is a more efficient additional tool for RES sizing and allocation than energy storages. This method can find practical application for Distribution System Operators in elaborating grid development strategies.

1. Introduction

Under the increasing installed power of renewable energy sources (RES), the purpose of distribution grids is shifting from passive energy delivery only, to energy delivery and energy production, increasing the role and imposing new duties for Distribution System Operators (DSOs) [1]. One of these duties imposes an obligation on DSOs for the elaboration of development plans, which is a key measure for increasing distribution systems’ capacity host for increasing RES penetration. Presently, the location of the renewable connection with the distribution network relates to local weather conditions or mounting capabilities. Therefore, wind turbines are usually located in distant places from household areas, while photovoltaics (PVs) are commonly installed on the top of roofs. As a result, energy generation and consumption are not correlated and power flows are increased in both directions. This is especially visible in the case of residential prosumers equipped with PV systems. In the summer, PV peak generation occurs from 12 p.m. to 2 p.m., and it falls to zero when the sun is setting. This is in opposition to the energy consumption pattern in households where demand peaks in the evening and from 12 p.m. to 2 p.m. are low, because usually, most of the consumers are away from their houses. Consequently, the PV energy is not consumed locally, and instead it is injected to the grid, to be transmitted and consumed, i.e., by commercial and industrial loads, which are often distant from residential areas. This power flow inflicts additional losses, because energy is lost twice: In the evening, due to increased demand, and midday, because of PV generation. This leads to grid infrastructure overdevelopment and stranded cost problems for DSOs and power balancing issues for Transmission System Operators (TSO) and utilities which, even now, face the problem of dynamic load changes (residual load curve variation) resulting in increased re-dispatching costs and reduced power system reliability [1]. These aspects are usually omitted in the research of DG allocation, which usually focuses on power loss minimization or the improvement of voltage stability.
The above-presented problems can be inexpensively solved by the proper allocation of the RES and energy storages (ES) in the distribution system and its operation. If the generation profile of the energy source is adjusted to the demand profile, the majority of the DG generation is self-consumed locally and allows for the avoidance of power losses. An example of such a principle can be seen in an office equipped with a rooftop PV system. Peak demand for commercial type load is correlated with PV generation, due to the working hours and intensity of devices, such as air conditioners.
This paper presents a method for the minimization of distribution system development costs through the optimal allocation of renewable power units, energy storages and the operation of them, including operational features of various types of generation units and consumption of versatile load types. Strong points lie in the complex approach for solving the local problem by:
  • the modelling of loads and power-generating units by energy consumption/generation profiles reflecting operational conditions;
  • the modelling of optimization variables allowing for the selection of the type of RES, energy storages (ES), its size and connection point in the grid and its operation.
The paper consists of seven sections, starting with the introduction, followed by the state of the art on methods of RES allocation in power systems. The third chapter presents the method proposed by the author, while the fourth section includes assumptions and fifth section includes simulation scenarios. Simulation results and discussions are presented in the sixth section. The paper ends with conclusions and recommendations for further research and Appendix A which displayed capacity structure for each scenario.

2. State of the Art on the Distribution System Development

This section provides an overview of methods for DG allocation under the following criteria: objective function formulation, variables selection, time horizon, resolution, approach (technical, economic, environmental, etc.), problem formulation and used solving methods.
Power loss minimization is one of the most common objective function formulations implemented for DG allocation problems [2,3,4,5,6,7]. Equally frequently applicable methods take into account aspects of the quality of supply also, including voltage improvement in an objective function [8,9,10,11,12,13,14,15,16] or setting constraints on voltage distortion [17,18] while others include the reduction of harmonics distortions as well [19,20]. Power loss reduction and the improvement of voltage are also presented in [21], however these measures are represented by sensitivity factors. Another approach is more energy consumer-oriented maximizing welfare [22] (including minimisation of energy costs and carbon emissions) or minimizing costs of power losses, load not supplied and DG installation O&M costs [23,24]. A similar method—minimizing power losses and energy generation costs—is presented in [25], while in [24,26], air pollutants are minimized as well. Some of the papers present methods using DG allocation for the improvement of supply reliability [27,28,29]. In [30], the authors propose a restoration matrix that presents the priority of supply from DG. Reference [31] also includes a reduction of the grid upgrade costs. Some papers present a multistep approach, hence, in the first step of the method presented in [12], optimization maximizes the benefits from the node point of view, while in the second step, the optimization maximizes the benefits from the entire considered network. In [32], the first step determines localization only, while the second provides an optimal capacity of each DG. The original approach is presented in [33], where authors maximize system loadability (usage of the network infrastructure). The objective of the optimization in [34] is nodal voltage stabilization. Nevertheless, the most common approach focusses on power loss minimization and voltage improvement, which are optimized in many approaches. This is presented in [35], where a much wider review on the optimization of DG allocation methods is provided.

Novelty of the Paper

The novelty of this research lies in the complex long-term optimization of a distribution system using RES sizing and allocation simultaneously, ES sizing and allocation and energy curtailment. Furthermore, the technical aspects of distribution system operation such as generation and consumption profiles, power flows, power losses or voltage levels are included.
The above-listed objectives can be obtained by the allocation of DG which can be carried out in several ways, including versatile types of variables. The significant majority of optimisation methods focus on the DG sizing and placing only [9,17,18,19,22,25,36,37]. Some methods also consider the selection of the DG type [3,7,20,22,23,31,38] but none of the mentioned methods combine the allocation of RES and ES or the allocation of RES and energy curtailment.
Optimization can be carried out for different time horizons and with different time resolutions. Most of the papers present methods optimising the DG structure for a single moment, omitting the dimension of time [2,5,8,9,10,11,17,18,19,22,23,25,36,39,40,41]. This static approach does not allow us to include crucial aspects of daily demand changes or intermittent RES generation, which are included in the presented paper. In papers where intermittent RES generation is included—[4] and [7]—there is a lack of long-time planning.
In papers [3,7,20,42,43], which present methods for long-time planning, no distribution system costs were minimized.
Most of the research already performed focuses on technical aspects, such as power line constraints [16] or nodal voltage limits, and only a few of them include economic aspects such as investment and O&M costs [17,23] or total cost of energy [19,22]. Only one of the papers reviewed includes different types of loads connected to considered systems [9]. This is another novel aspect of the paper that combines technical and economic aspects of distribution system operating, including different types of loads and generation units also.
Research also exists which combines the allocation of renewable energy sources and energy storages in the distribution system [44,45,46]. Other papers describe different approaches to energy curtailment: Turning off generation sources [47], limiting generation to a constant level [48], generation constraints adapted to technical constraints [49] or proportional generation reduction for the whole analyzed period [50]. None of the mentioned papers, however, combine the allocation of RES and ES or the allocation of RES and energy curtailment. Furthermore, none of the papers compare which distribution development strategy is more efficient.

3. Problem Formulation

The objective of the method presented is to provide the structure of the RES and ES allocation in the distribution system along with its operation, ensuring minimal costs of the distribution system development without violating the technical standard of the grid operation. Three types of RES (wind turbine (WT), photovoltaic (PV) and biogas (BG)) can be connected in each node with rated power depending on the value of typical units. RES units are represented by representative generation profiles, reflecting typical operating conditions. Due to the grid, overloads can be identified and eliminated by proper RES allocation and curtailment and energy storing. The optimization is performed, preserving technical constraints. Technical constraints refer to the network transmission capacity, nodal voltage standards and power exchange with the transmission system. Power flow in each line is calculated for each time step. The generation for RES is calculated as a product of the installed capacity and generation profile and load consumption is calculated similarly. Power exchange with the transmission system depends on the power of each transformer which connects these two systems.
The optimization model, which is described in the next section, consists of general mathematical formulations for mixed-integer linear problems which can be used by other optimization software.

3.1. Optimization Model

The minimization of the total costs of the distribution system development in relation to one year (installation and operating RES and energy storages) is the objective function. Total costs consist of three elements:
  • Fixed costs (CAPEX and OPEXfix) of new RES,
  • Fixed costs (CAPEX and OPEXfix) of new energy storages,
  • Operating costs (OPEXvar).
CAPEX there are investment costs connected with equipment and construction works costs. OPEXfix there are costs intended for taxes, maintenances and salaries. OPEXvar are the costs of fuels.
min { n N ( d D ( r R ( p n , d , r * P d , r * F C d , r R E S ) ) + p n E S * C E S * F C E S + d D ( E n , d * V C d , r R E S ) ) }
subject to
n N d D r R p n , d , r N
The DG generation in each node for each type of RES (En,d) is calculated as a sum of energy generation of each DG type in one node for the entire year.
n N       d D                 E n , d = t T E n , d , t G E N _ R E S
The DG generation in each time period (En,d,tGEN-RES) is a function of the optimization variable pn,d,r and is calculated a product of the RES rated power (Pd,r), current power utilization level (according to the generation profile Pd,ravail), optimization variable pn,d,r and minus energy curtailment (en,d,tcurt). The pn,d,r is a three-dimension variable, where dimension n refers to the number of the node, dimension d refers to the RES technology type (i.e., PV) and dimension r refers to the rated power (2). Energy curtailment (en,d,tcurt) is a variable which curtails the generation from the reference generation profiles for each node (n), RES type (d) and each time period (t).
n N d D t T E n , d , t G E N _ R E S = r R ( ( P d , r · p n , d , r ) · P d , t a v a i l ) e n , d , t c u r t
Another important parameter is the generation in the entire node (En,tGEN_node) which depends on the sum of DG generation for each RES type in single node and energy exchange with energy storages that are installed in the node.
n N t T E n , t G E N _ n o d e = ( d D ( E n , d , t G E N _ R E S ) e n , t t o E S + e n , t f r o m E S )
The typical RES sizes of each renewable technology are predefined and are included in the two-dimension matrix Pd,r (4). As a result of multiplication of variable matrix pn,d,r and parameters matrix Pd,r the installed power of all RES in every node is calculated.
d D r R P d , r = d i m m e n s i o n   D   [ P 1 , d 1 P 1 , d 2 P 1 , d 3 P 2 , d 1 P 2 , d 2 P 2 , d 3 P r , d 1 P r , d 2 P r , d 3 ] } d i m m e n s i o n   R
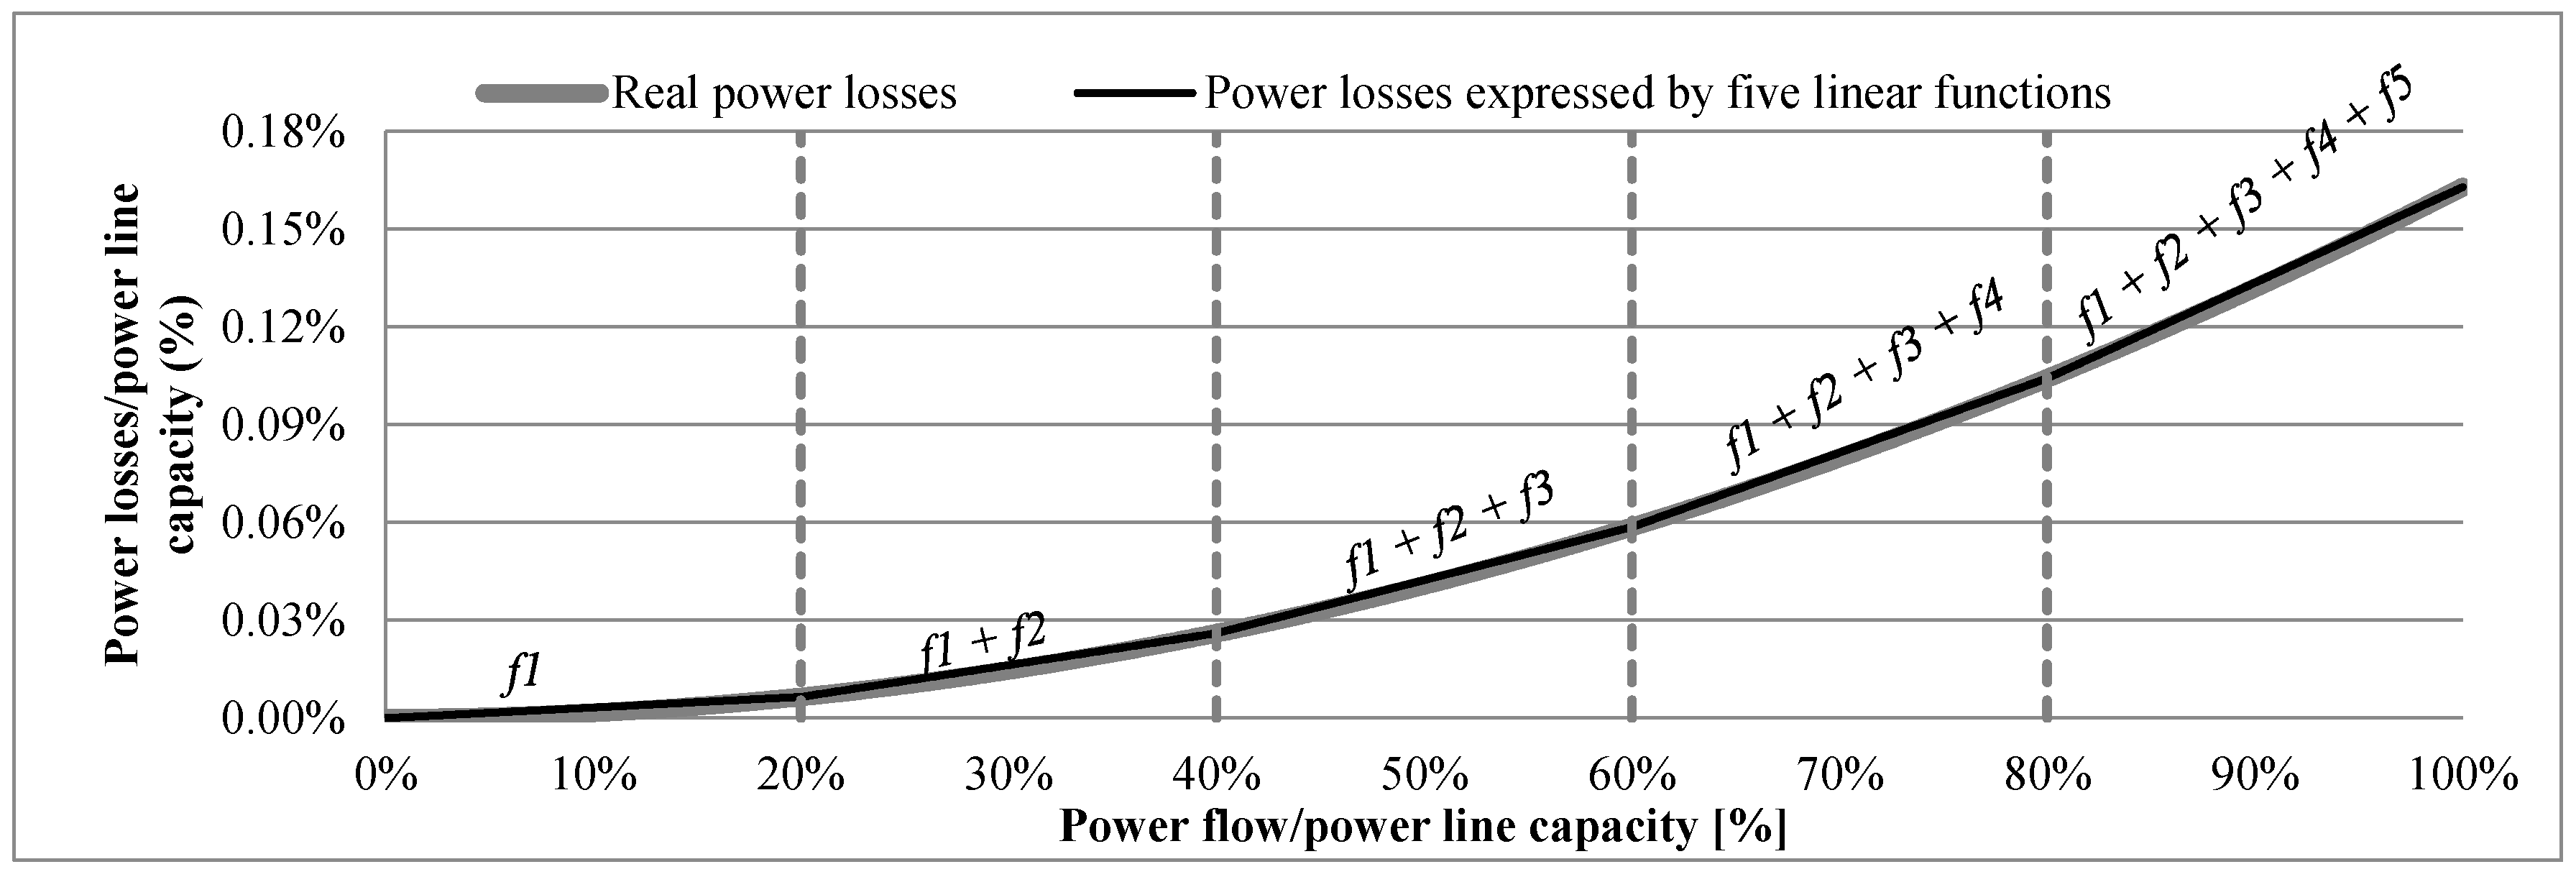
The optimization model in general is formulated as for an integer programming, however, it includes some non-linear elements such as power losses or voltage drops. In order to improve computation time and reformulate the original problem to the Mixed Integer-Linear Programming (MILP), non-linear components are linearized. The quadratic power losses are linearized by the spline of five linear functions—Figure 1. Each linear function was created for different values of power flow in relation to power line capacity. The first function was created for power flow in rage 0–100% of line capacity. The rest of the functions were designed for power flow in range: f2: 20%–100%, f3: 40%–100%, f4: 60%–100% and f5: 80%–100% of line capacity. The final power losses were created as a sum of all mentioned linear functions.
Each linearising function refers to power line capacity, this is applicable for every power line of the grid model (7)–(11).
t T   n , w N   f 1 n , w , t = 0.2 * L i n e . c o n s t n , w * R n , w U n , t 2 * P F n , w , t
t T   n , w N   f 2 n , w , t = 0.4 * L i n e . c o n s t n , w * R n , w U n , t 2 * P F n , w , t 0.08 * L i n e . c o n s t n , w 2 * R n , w U n , t 2
t T   n , w N   f 3 n , w , t = 0.4 * L i n e . c o n s t n , w * R n , w U n , t 2 * P F w , k , t 0.16 * L i n e . c o n s t n , w 2 * R n , w U n , t 2
t T   n , w N   f 4 n , w , t = 0.4 * L i n e . c o n s t n , w * R n , w U n , t 2 * P F w , k , t 0.24 * L i n e . c o n s t n , w 2 * R n , w U n , t 2
t T   n , w N   f 5 n , w , t = 0.4 * L i n e . c o n s t n , w * R n , w U n , t 2 * P F w , k , t 0.32 * L i n e . c o n s t n , w 2 * R n , w U n , t 2
Consequently, the energy lost on the power lines in each time step is as in (12),
t T   n , w N   P n , w , t l o s s e s = f 1 n , w , t + f 2 n , w , t + f 3 n , w , t + f 4 n , w , t + f 5 n , w , t
while the total power losses in the entire time horizon are as (13).
t T   P t l o s s e s = n , w N ( P n , w , t l o s s e s )
The same assumption of constant nodal voltages and omission of reactive power and reactance allows for the linearization of voltage drops (14).
t T   n , w N     U n , w , t = P F n , w , t * R n , w U n , t
Power flow in a power line, as well as nodal voltage, depends on power balance in each node depending on the grid structure and temporary power generation and demand. While the generation depends on weather conditions and generation structure, the demand for power in each time period depends on the load size and its type (referring to user behaviors).
  n N     t T n N ( P F n , w , t ) = E n , t G E N _ n o d e l L ( L o a d n , l * P l , t D E M )

3.2. Constraints

Two types of constraints are included: technical and economic. Technical constraints include power balances in grid nodes (16), power lines capacity (17) and nodal voltage limitations (18).
t T n N { l L ( L o a d n , l * P l , t D E M ) } P t r e s + T S t e x c h a n g e + P F n , w , t = 0
t T   n , w N   L i n e . c o n s t n , w P F n , w , t L i n e . c o n s t n , w
t T   n N     0.9 * U n o m i n a l U _ n , t 1.1 * U n o m i n a l
In the model, there are also assumed constraints related to the operation of energy storages like: level of charge, which depends on energy exchange between energy storage and node and efficiency of this exchange.
n N ,   t T C L n , t = C L n , t 1 + η E S * p n , t d o E S ( 1 η E S ) * p n , t z E S
The model assumes that annual energy production minus total losses in lines must be equal or greater than the assumed share (k) in the annual demand in the distribution system (20).
n N { d D E n , d t T P t l o s s e s } k * n N { l L ( t T L o a d n , l * P l , t D E M ) }

4. Assumptions

Since the model includes natural (non-negative integer) and real variables and all functions are linear, the optimization problem is modeled as a Mixed Integer-Linear Programming (MILP). The natural variable pn,d,r indicates the type of RES selected from the set of three technologies D: PV systems, wind turbines and biogas thermal units (21).
D = { d 1 , d 2 , d 3 } = { p v , w t , b g }
The rated power of each type of the RES is retrieved from the impact assessment to polish regulation on renewable energy sources from 2015 [51], displayed in Table 1. In the case of PV, the author realized that due to modular structure, PV systems are fully configurable, although they are assumed as three predefined values, to reduce the calculation effort. Nevertheless, the method allows for the application of any set of parameters.
There was one assumed type of energy storage with a capacity of 10 kWh, power of 5 kW and efficiency of energy exchange with the grid on the level of 90%.
Generation profiles are divided into three parts of the year: summer, winter and spring/autumn together. For each part of the year, there were created two profiles for WT and PV (high and low generation) based real data retrieved from the website of German and PolishTSOs. Generation profile for BG is assumed as constant for the whole year.
Three types of loads are included: residential, commercial and industrial. Each type of load is also characterized by a different energy consumption profile. Consumption profiles are also divided into three parts of the year and for each part, two profiles were created for working and non-working days. Load location is predefined (Figure 2).
Simulations were carried out for twenty-four representative days which were created as a total combination of generation profiles and consumption profiles, and according to real data, there was an analysis of how many times each combination occurred in the year, and based off of this, the whole year is modeled.
The modified MV benchmark network model consisting of eleven nodes is used for the simulation—Figure 3. Lines are characterized as connections between nodes, and for each of them, capacity and resistance are assumed. There is one exception, which is between nodes one and two and it is a transformer which connects the transmission (node 1) and the distribution system (node 2). The resistance for the transformer is assumed as 0 ohms, because this part of the system is not the aim of this research.
Power lines capacity and resistance are taken from the real data—Table 2.
One of the factors affecting the power balance of the distribution system is power exchange with the transmission system. In this research, it is assumed that power flow is allowed only in one direction—from the transmission to the distribution system. This means that in the period when energy consumption is higher than generation, the difference between them is covered by power supplied by external generation units from the transmission system. However, power cannot flow from the distribution to transmission system. This causes the sum of generation to be lower than the sum of demand in the whole system. This assumption is made arbitrarily and can be removed without affecting the method principle. This will result only with the higher local capacity host for DG.
CAPEX and OPEX (Table 3) depend on the type and the size of a power unit and are assumed on impact assessment to polish the regulation of RES [51].

5. Simulation

5.1. Scenarios

The method is examined in three main simulation scenarios which differ in the share of energy from RES in total demand in the analyzed distribution system. In the first scenario, the share of energy from RES is 30%, in the second 40%, and in the last scenario 50%. Furthermore, each major scenario has three sub-scenarios that were created to display the differences between approaches to the development of distribution systems. In Sub-scenario A, only the sizing and allocation of RES were used, in Sub-scenario B, the sizing and allocation of RES and ES were used, and in the last sub-scenario, C, the sizing and allocation of RES and energy curtailment were used.
Main scenarios:
  • 30% share of energy from RES in total demand,
  • 40% share of energy from RES in total demand,
  • 50% share of energy from RES in total demand.
Sub-scenarios:
  • sizing and allocation of RES,
  • sizing and allocation of RES and ES,
  • sizing and allocation of RES and EC.

5.2. Revision of the Strucure

The minimization of total costs of the distribution system development in relation to one year (installation and operating RES and energy storages) is the objective function. Simulations are performed using a network consisting of eleven nodes, where the node number one represents the transmission system and the rest of the nodes represent the distribution system. In nodes 2–11, generation units and ES can be connected. The connection between nodes is represented by resistance and line capacities. The generation from RES is calculated as a product of the RES rated power, current power utilization level (according to the generation profile), number of units and minus energy curtailment. It is also possible that energy can be stored in an energy storage, which is connected to the nodes.

6. Results

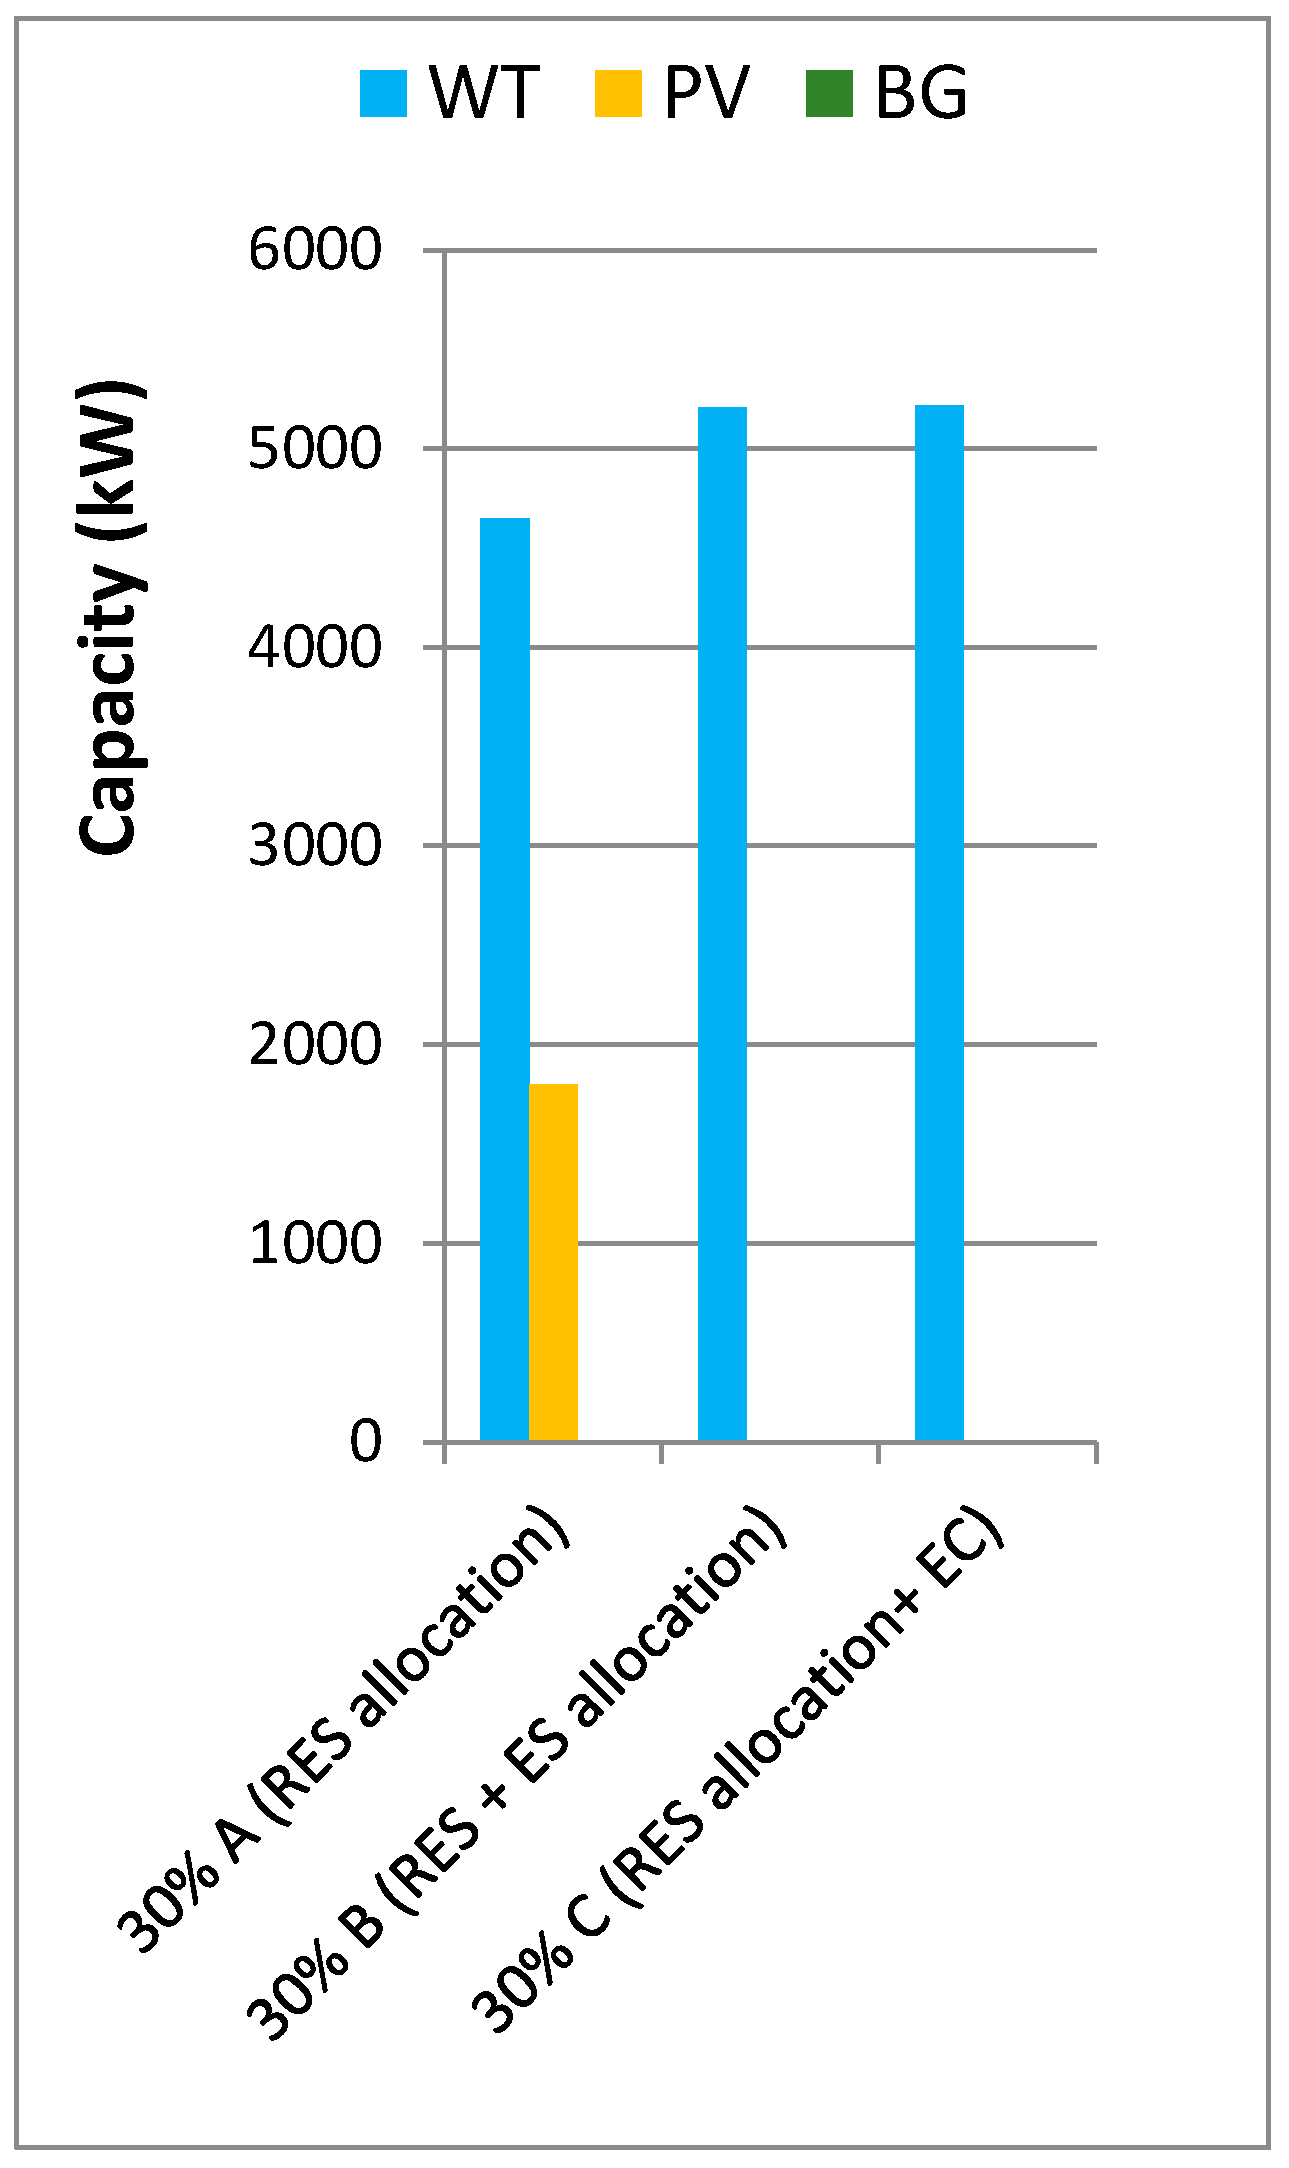
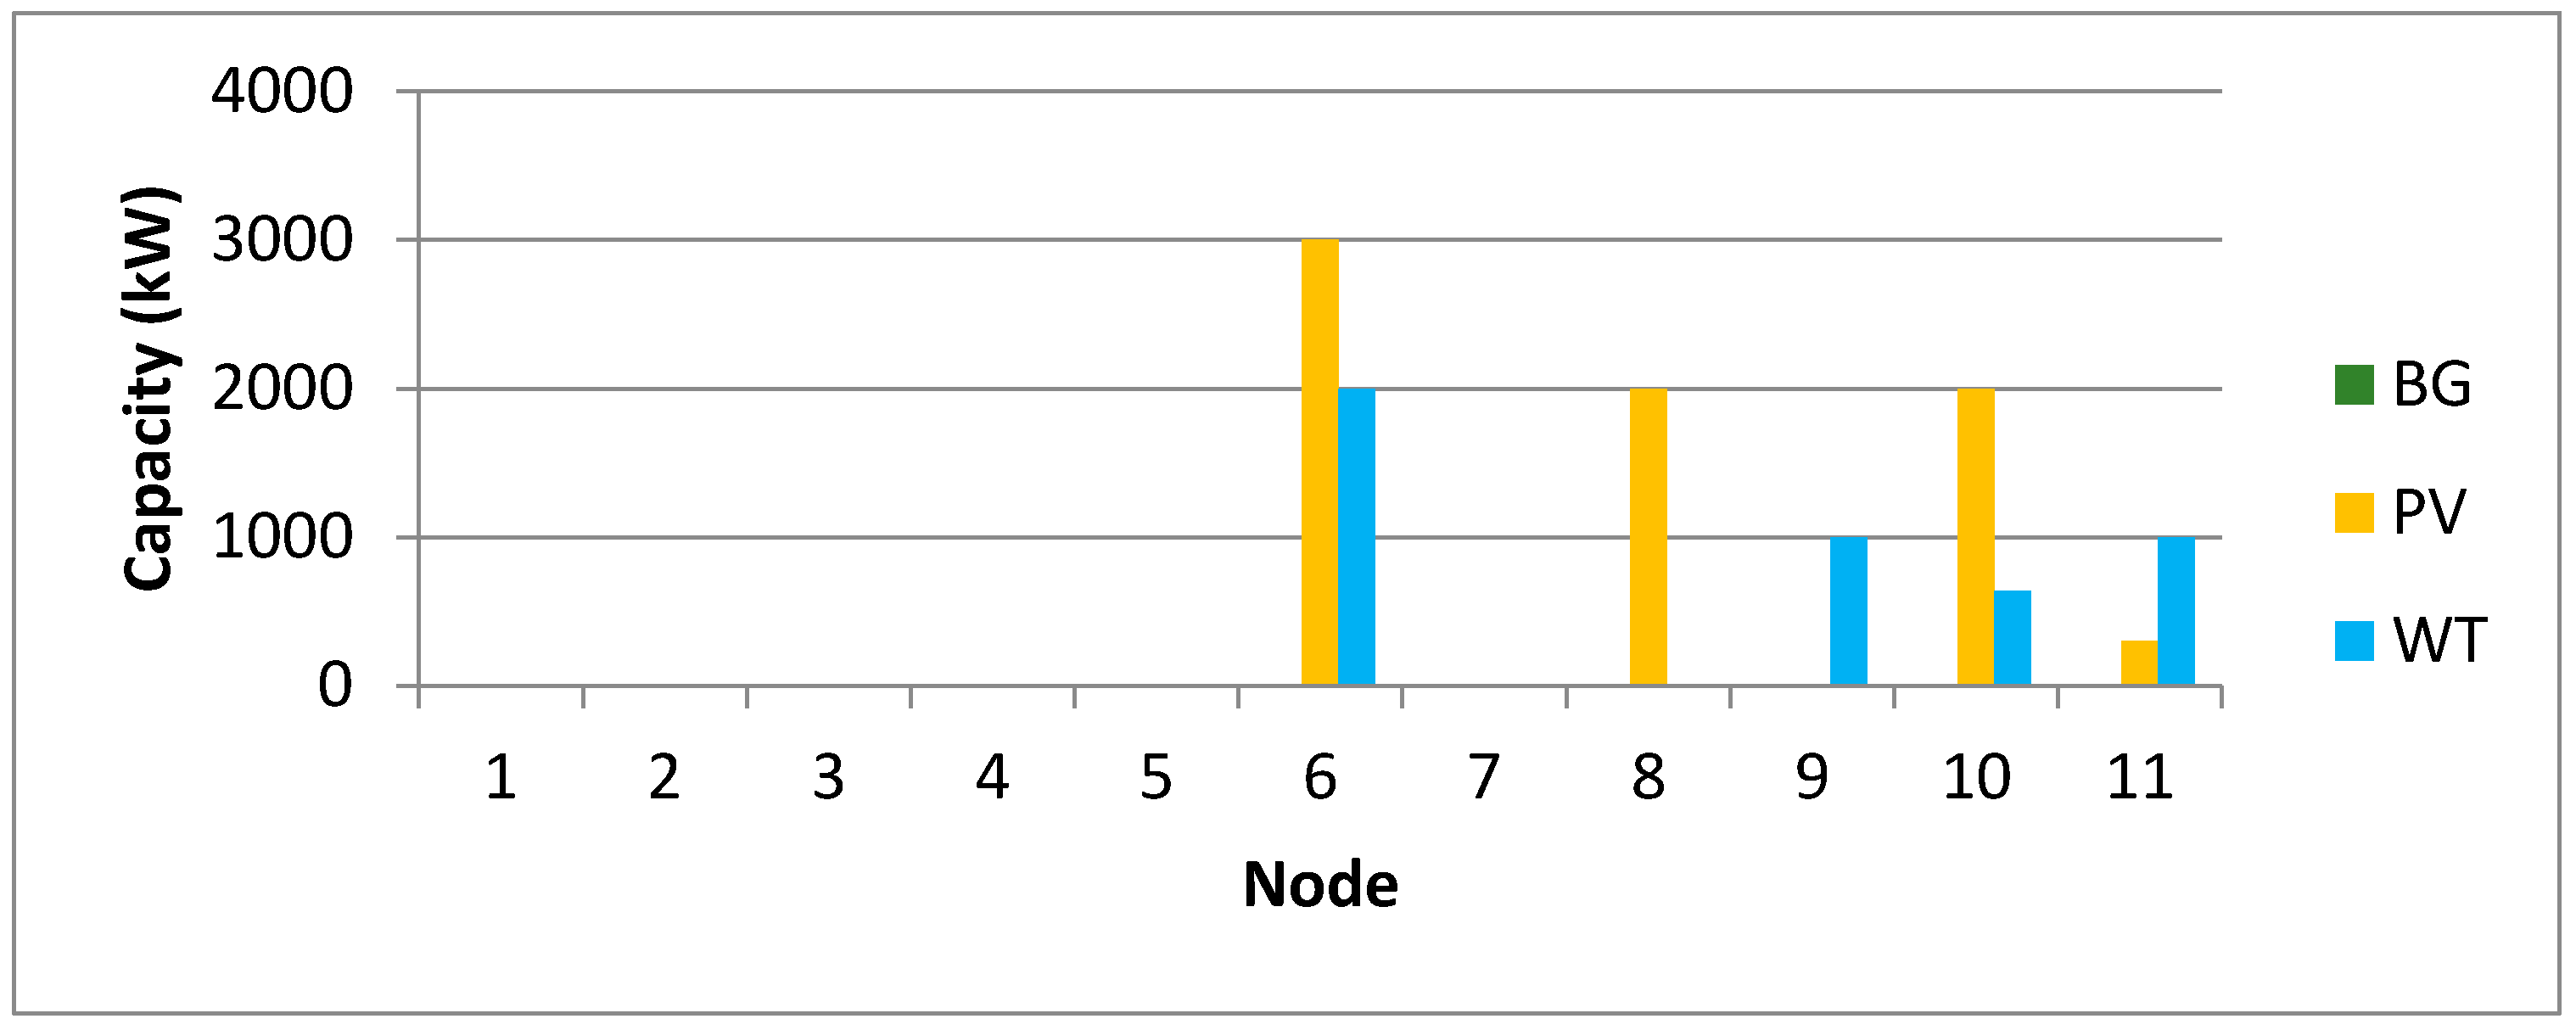
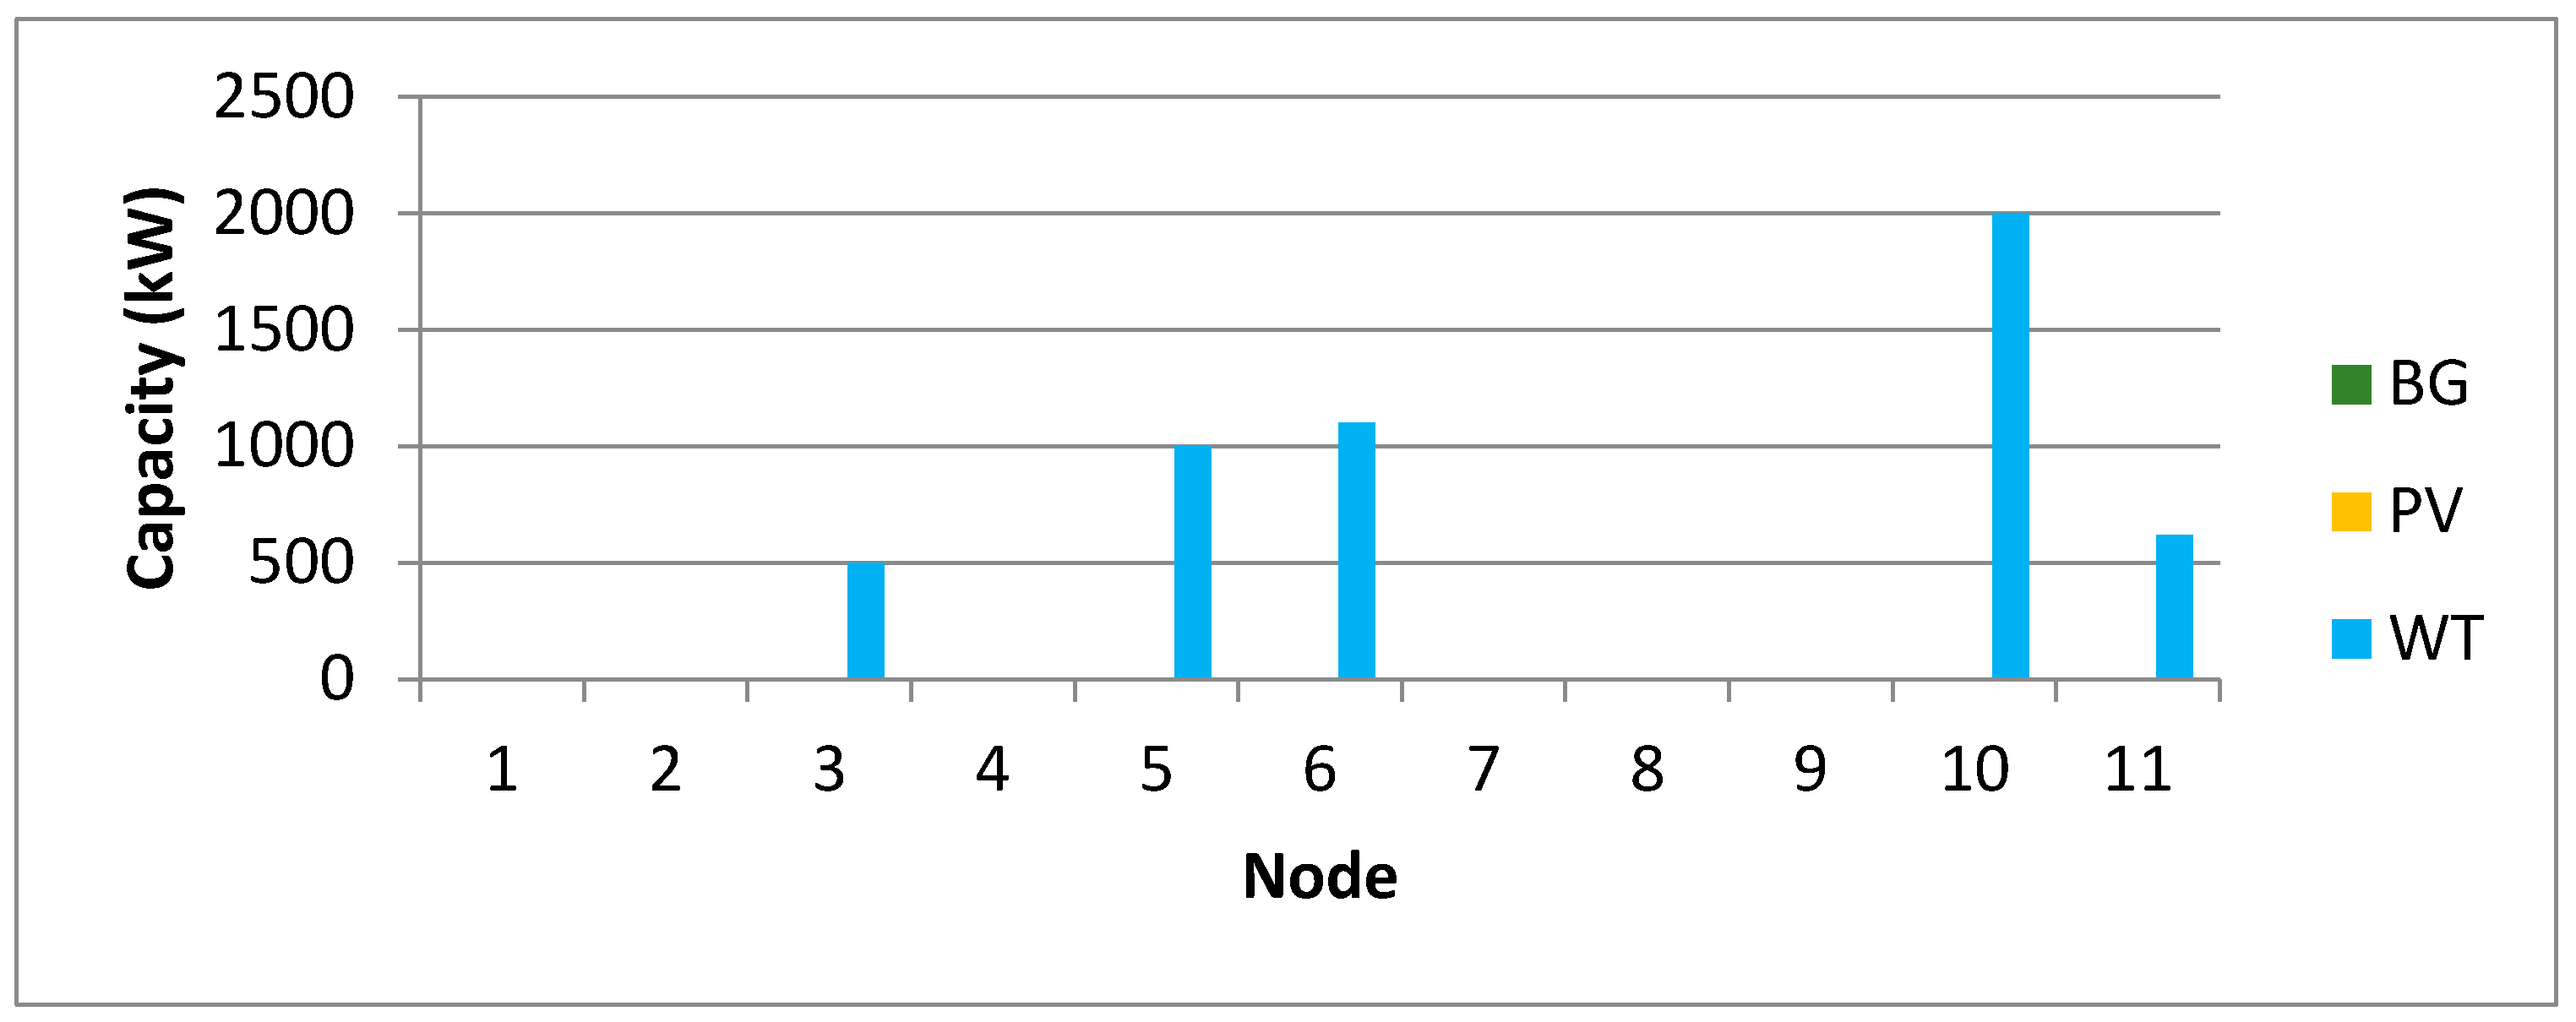
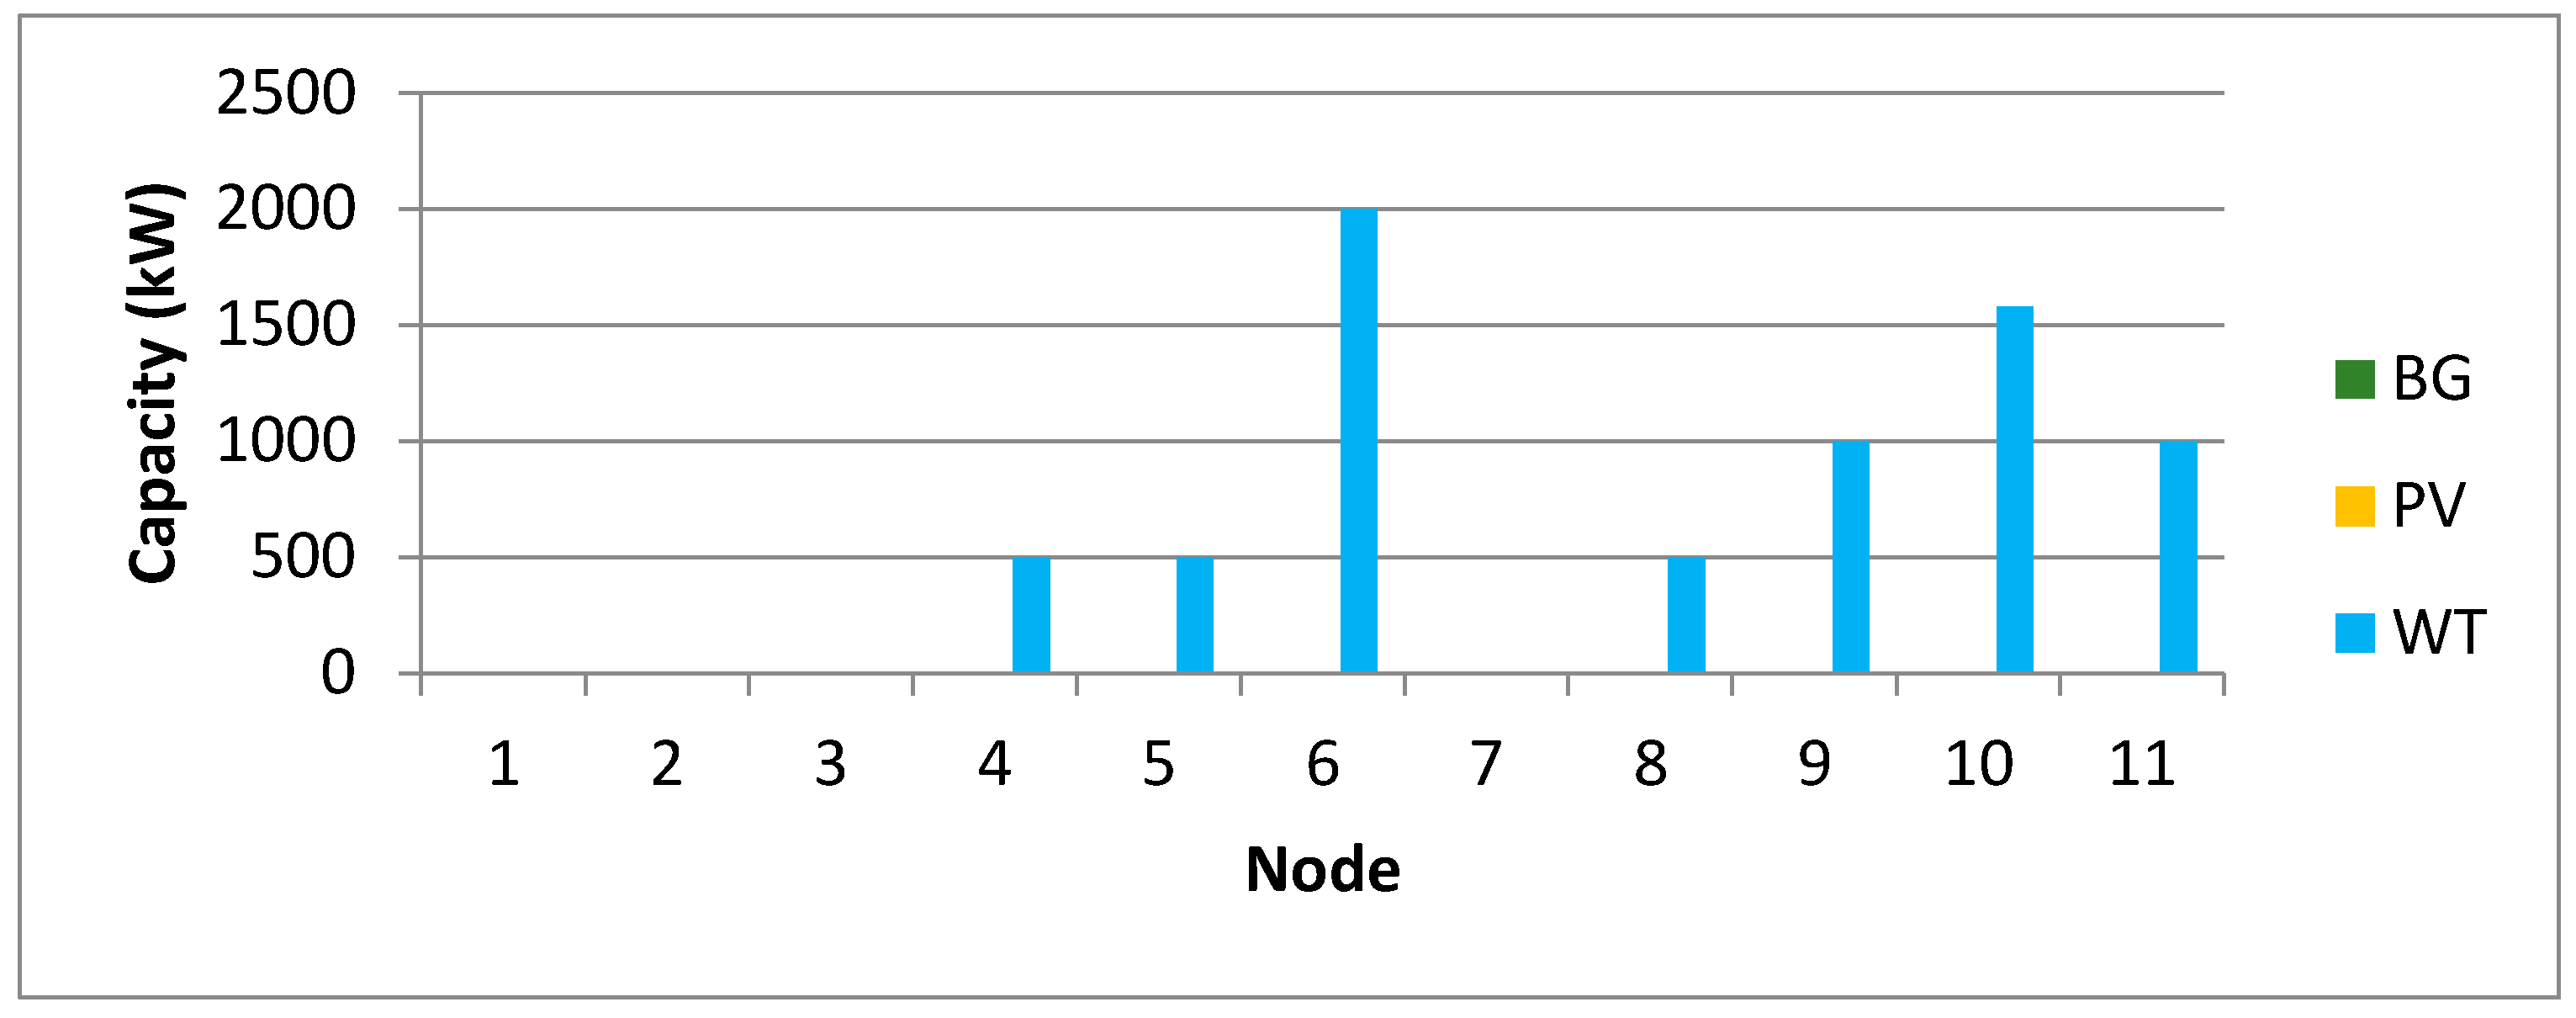
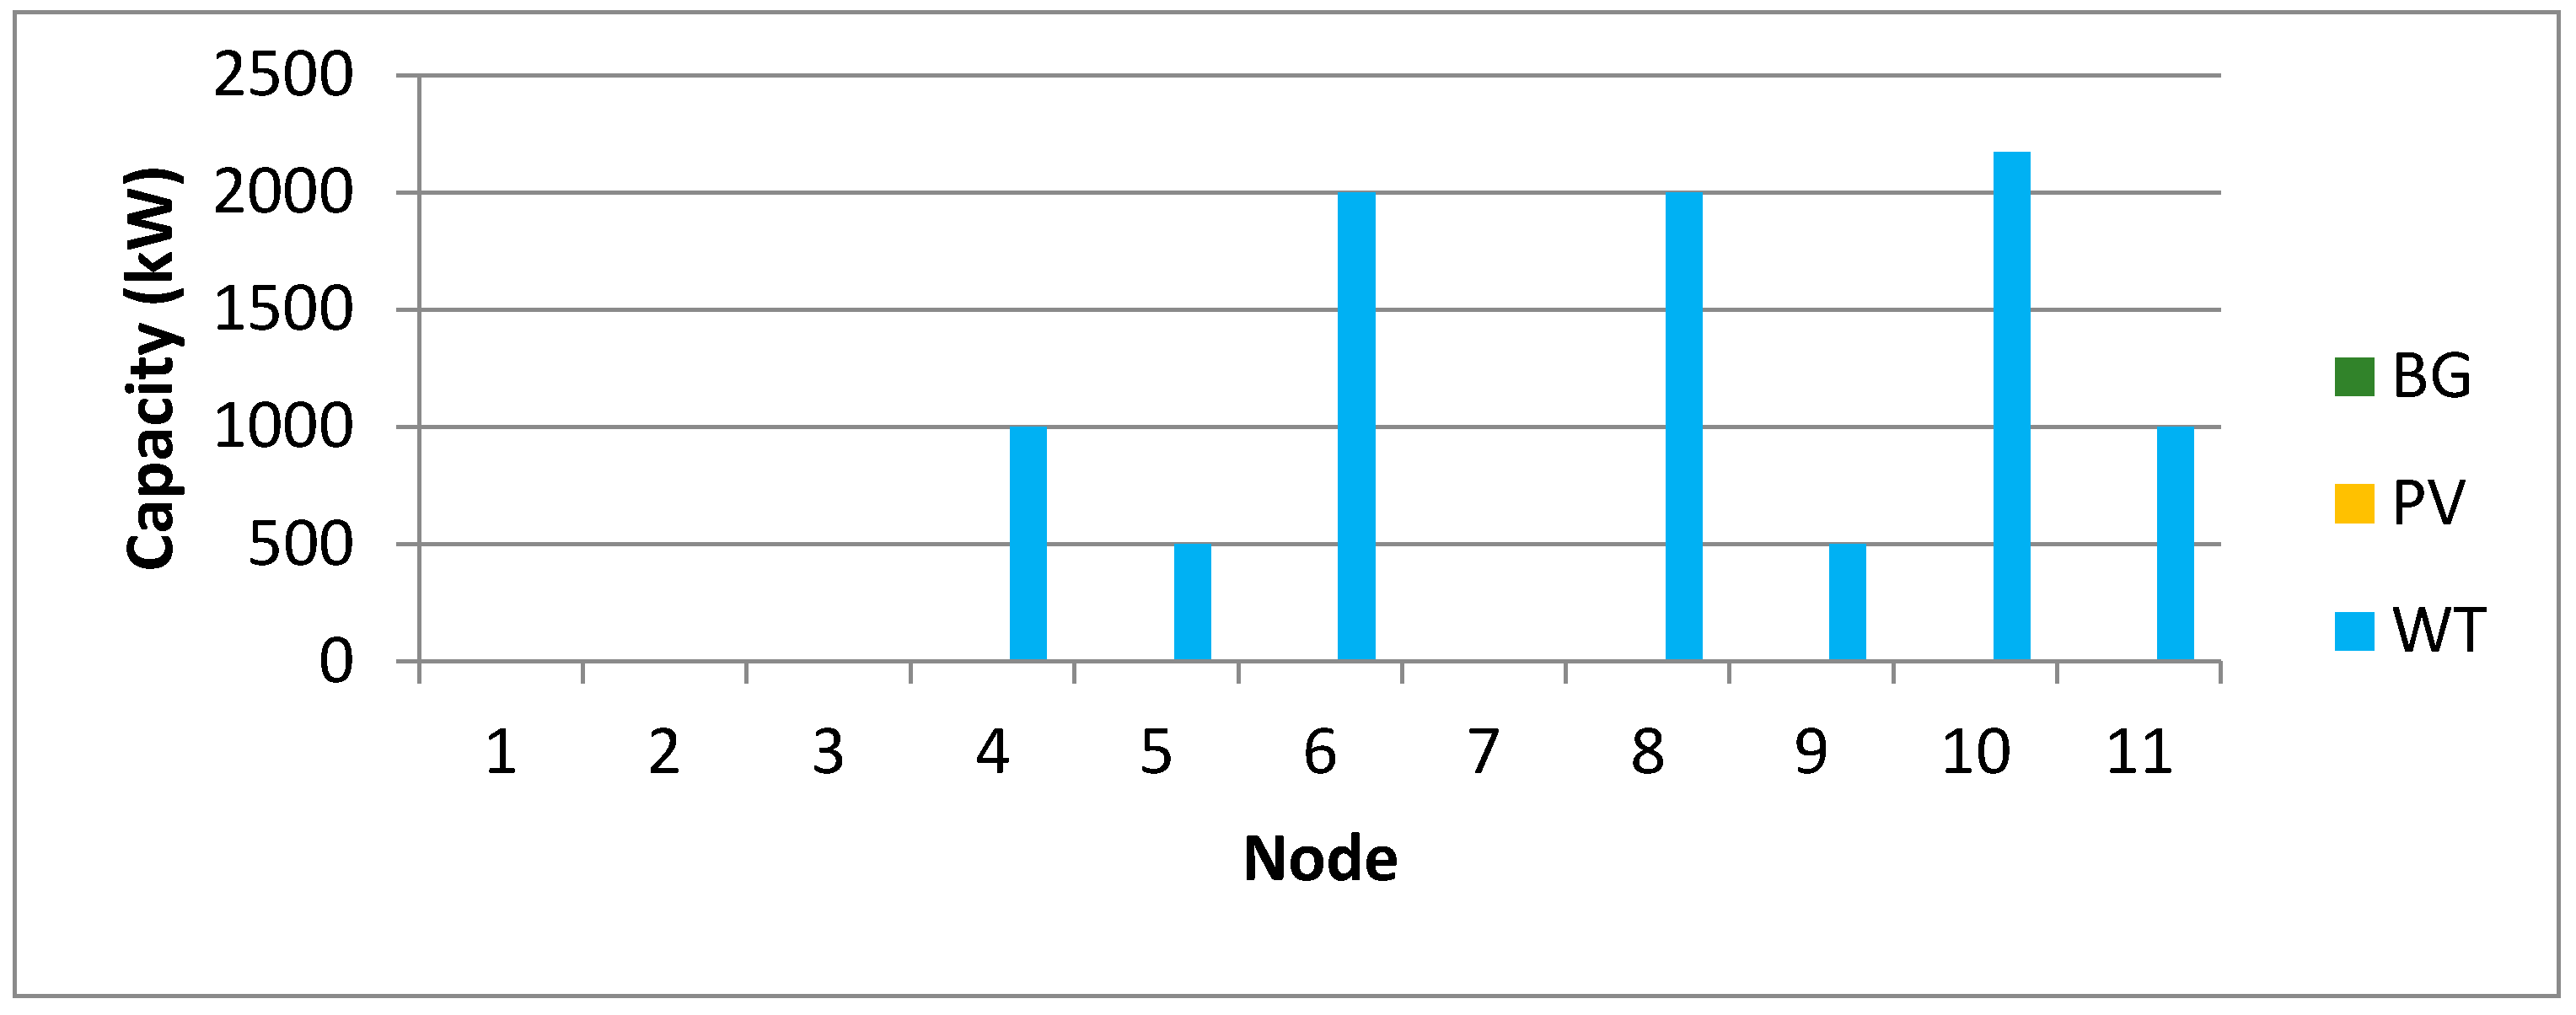
This section provides the simulation results presented in two parts that compare approaches to the development of distribution systems. The first part displays capacity structure for each scenario and the second one displays the overall cost of system development. In each part, the results consist of three charts that present the results for a different share of energy from RES in total demand. All of the results are obtained using FICO®Xpress v. 8.6. optimization software and all graphs are created using Microsoft Excel 365.
Based on Figure 4, Figure 5 and Figure 6, it can be seen that additional tools to RES sizing and allocation, like energy curtailment (EC) allocation or energy curtailment, allows a user to install more wind turbines, which are the cheapest renewable energy sources, without violating grid technical standards. Energy storages shift energy from one moment to another, which prevents the over-generation from RES. Energy curtailment, on the other hand, fits the generation profile to demand.
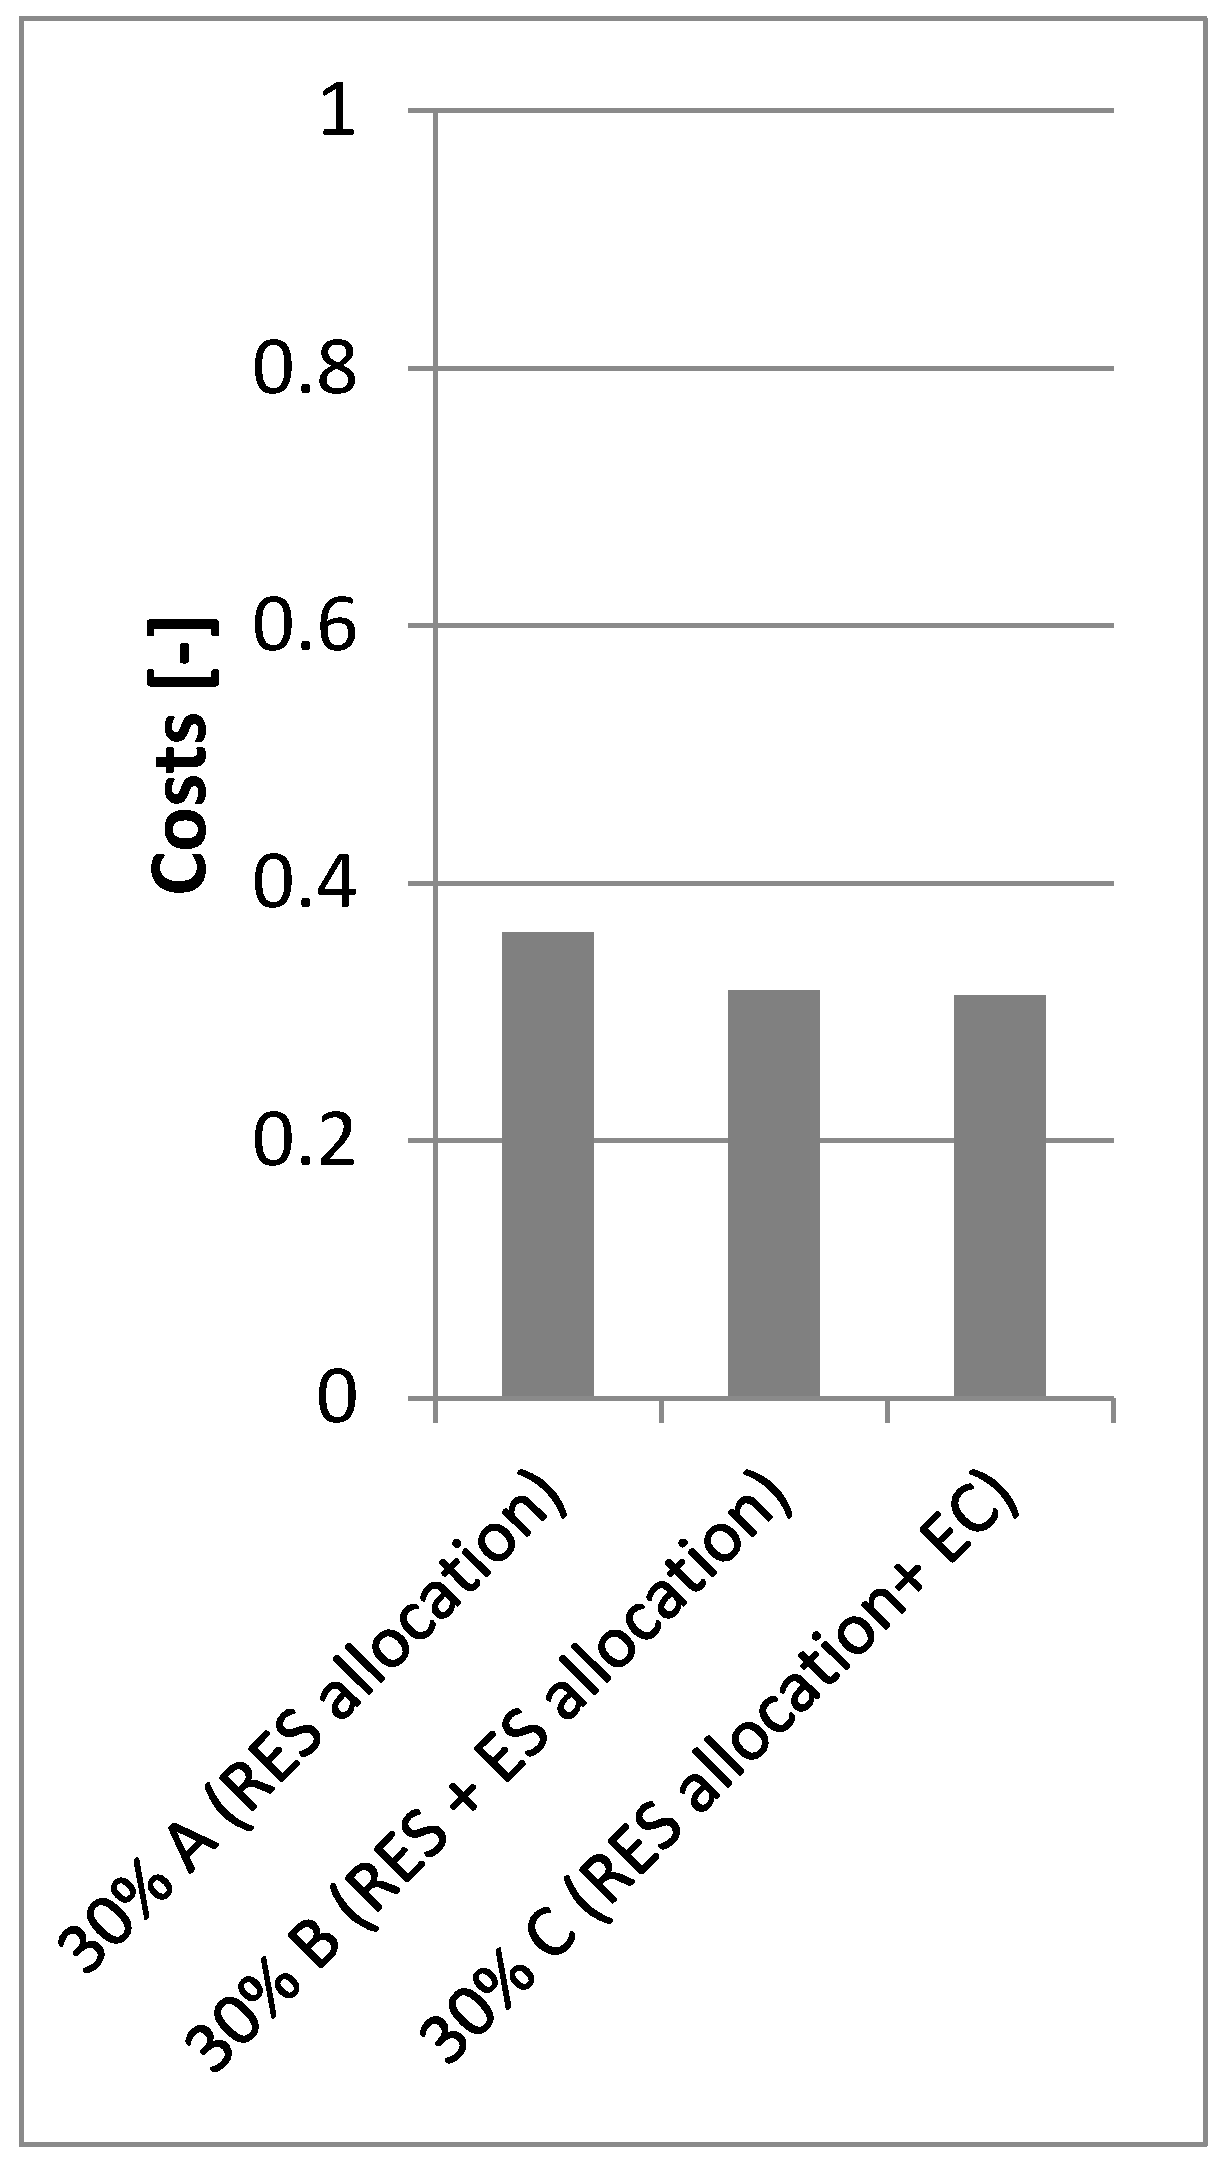
Based on Figure 7, Figure 8 and Figure 9 (all costs are compared to the highest one which is for 50% share for RES with RES sizing and allocation only), it can be observed that the combination of RES sizing and allocation and another additional tool reduces the overall cost of the distribution system development (at least 12% for 30% share). It can also be seen that, together with an increasing share of energy from RES in total demand, the energy curtailment became more efficient than energy storages.
In Table 4, computation time and the number of variables are displayed for each of the analyzed scenarios.

Results Discussion

The allocation and sizing of RES allows for the better use of existing infrastructure. This operation consists of choosing the type of renewable energy sources, the number of sources from a given power series and the node in which the units are to be built. Taking into account the generation profiles of individual RES, loads profiles and capacity of existing lines, it is possible to locate such generating units that do not violate the technical parameters of the network, and allow the achievement of the set level of their annual generation at the lowest possible cost total.
The allocation and sizing of energy storage allows for their distribution in the network and the selection of capacity, which will allow them to support RES at times when their generation exceeds the total demand in the system. Energy storage allows for energy storage at times when the generation from generating units exceeds the demand (usually, these are the night demand valleys) and putting this energy into the network at the peak of demand.
Energy curtailment allows a user to reduce energy production at times when their generation exceeds the total demand, which makes it possible to adjust the generation to the demand in these periods.

7. Conclusions

The optimization method for RES, ES allocation and energy curtailment under the criterion of minimization costs of distribution system development is presented. The novelty lies in comparing energy storages (ES) and energy curtailment (EC) as additional tools to RES sizing and allocation.
This combination of mentioned tools allows for the achievement of a desirable target (reducing costs of distribution system development). Due to the modelling of power units with energy generation or consumption profiles, it is possible to consider specific operational cases and select the best structure and location of renewables.
The results also show that energy curtailment is more efficient than energy storages with the growth of the share of energy from RES in total demand. This is due to the high prices of the ES and its limitation connected to the efficiency and level of charge. It shows that energy curtailment can be an efficient tool to control the operation of RES.

Funding

This research received no external funding.

Acknowledgments

Author would like to express the gratitude to the FICO® corporation and Microsoft corporation for programming support and provision of academic licenses for Xpress Optimization Suite and Office 365 to Lodz University of Technology.

Conflicts of Interest

Author declare no conflict of interest.

Abbreviations

Sets
n, wNsets of indices n, w representing number of nodes in distribution network
dDset of indices d representing type of renewable energy sources (RES) technology—D = [d1,…d3], where d1 is the first possible technology and d3 is the last one
lLset of indices l representing number of possible load type. L = [l1,…l3], where l1 is the first possible type and l3 is the last one
rRset of indices r representing type of rated power for each type of possible RES technology
Coefficients
E n , d annual energy production from each type of RES r in each node n
E n , d , t G E N _ R E S total production from RES type d in node n in time t
E n , t G E N _ n o d e total production from RES in node n in time t
P t l o s s e s total power losses in distribution system in time t
P n , w , t l o s s e s power losses in a power line between nodes w and k in time t
P d , r rated power of RES technology d for the power unit series type r
P d , t a v a i l generation profile for RES technology d in time t
P n , w , t a c t i v e active power flow between nodes n and w in time t
L o a d n , l nominal power of load type l in node n
P l , t D E M ergy consumption profile (discretized with hourly resolution) of load type l in time t
P F n , w , t linearized power flow between nodes n and w in time t
T S t e x c h a n g e energy exchange between distribution and transmission system in time t
L i n e . c o n s t n , w capacity of power line between nodes n and w
U n o m i n a l nominal voltage for distribution system (in this paper assumed as a 30 kV)
R n , w resistance of power line between nodes n and w
U n , t active voltage in node n in time t
U n , w , t linearized value of voltage drop between nodes n and w in time t
F C d , r R E S fixed cost of each type and rated power of renewable energy sources
F C E S fixed cost of energy storages
V C d , r R E S variable cost of each type d and rated power r of renewable energy sources
C E S nominal capacity of single energy storage
C L n , t level of charge of energy storages in node n in time t
η E S efficiency of energy exchange between nodes and energy storages
Decision variable
p n , d , r number of units in node n for RES type d and rated power r
p n E S number of units in node n for energy storages
e n , d , t c u r t energy curtailment of RES type d in node n in time t
e n , t t o E S energy which flow from grid to energy storage in node n in time t
e n , t f r o m E S energy which flow from energy storage to grid in node n in time t
Acronyms
WTwind turbine
PVphotovoltaic installation
BGbiogas power plant
RESrenewable energy sources
ESenergy storages
ECenergy curtailment

Appendix A

Figure A1. Capacity structure for 30% share of energy from RES in total demand with sizing and allocation of RES only.
Energies 13 03746 g0a1
Figure A2. Capacity structure for 40% share of energy from RES in total demand with sizing and allocation of RES only.
Energies 13 03746 g0a2
Figure A3. Capacity structure for 50% share of energy from RES in total demand with sizing and allocation of RES only.
Energies 13 03746 g0a3
Figure A4. Capacity structure for 30% share of energy from RES in total demand with sizing and allocation of RES and energy storages (ES).
Energies 13 03746 g0a4
Figure A5. Capacity structure for 40% share of energy from RES in total demand with sizing and allocation of RES and ES.
Energies 13 03746 g0a5
Figure A6. Capacity structure for 50% share of energy from RES in total demand with sizing and allocation of RES and ES.
Energies 13 03746 g0a6
Figure A7. Capacity structure for 30% share of energy from RES in total demand with sizing and allocation of RES and Energy Curtailment (EC).
Energies 13 03746 g0a7
Figure A8. Capacity structure for 40% share of energy from RES in total demand with sizing and allocation of RES and EC.
Energies 13 03746 g0a8
Figure A9. Capacity structure for 50% share of energy from RES in total demand with sizing and allocation of RES and EC.
Energies 13 03746 g0a9
Figure A10. Capacity structure for energy storages in the context of share of energy from RES in total demand.
Energies 13 03746 g0a10

References

  1. European Network of Transmission System Operators for Electricity. Scenario Outlook & Adequacy Forecast; ENTSOE: Brussels, Belgium, 2015. [Google Scholar]
  2. Gozel, T.; Hocaoglu, M.H.; Eminoglu, U.; Balikci, A. Optiml placement and sizing of distributed generation on radial feeder with different static load models. In Proceedings of the 2005 International Conference on Future Power Systems, Amsterdam, The Netherland, 18 November 2005; pp. 2–6. [Google Scholar]
  3. Hung, D.Q.; Mithulananthan, N.; Lee, K.Y. Optimal placement of dispatchable and nondispatchable renewable DG units in distribution networks for minimizing energy loss. Int. J. Electr. Power Energy Syst. 2014, 55, 179–186. [Google Scholar] [CrossRef]
  4. Hung, D.Q.; Mithulananthan, N. Multiple Distributed Generator Placement in Primary Distribution Networks for Loss Reduction. IEEE Trans. Ind. Electron. 2013, 60, 1700–1708. [Google Scholar] [CrossRef]
  5. Patel, C.A.; Mistry, K.; Roy, R. Loss allocation in radial distribution system with multiple DG placement using TLBO. In Proceedings of the 2015 IEEE International Conference on Electrical, Computer and Communication Technologies (ICECCT), Coimbatore, India, 5–7 March 2015; pp. 1–5. [Google Scholar]
  6. Prakash, C.L.D.B. Multiple DG Placements in Distribution System for Power Loss Reduction Using PSO Algorithm. Procedia Technol. 2016, 25, 785–792. [Google Scholar] [CrossRef] [Green Version]
  7. Prenc, R.; Škrlec, D.; Komen, V. Distributed generation allocation based on average daily load and power production curves. Int. J. Electr. Power Energy Syst. 2013, 53, 612–622. [Google Scholar] [CrossRef]
  8. Abu-Mouti, F.S.; El-Hawary, M.E. Optimal Distributed Generation Allocation and Sizing in Distribution Systems via Artificial Bee Colony Algorithm. IEEE Trans. Power Deliv. 2011, 26, 2090–2101. [Google Scholar] [CrossRef]
  9. Mohandas, N.; Balamurugan, R.; Lakshminarasimman, L. Optimal location and sizing of real power DG units to improve the voltage stability in the distribution system using ABC algorithm united with chaos. Int. J. Electr. Power Energy Syst. 2015, 66, 41–52. [Google Scholar] [CrossRef]
  10. Babu, P.V.; Dahiya, R. Direct search approach for multiple distributed generator allocation in radial distribution systems. In Proceedings of the 2014 6th IEEE Power India International Conference (PIICON), Delhi, India, 5–7 December 2014; pp. 1–6. [Google Scholar]
  11. Alinejad-Beromi, Y.; Sedighizadeh, M.; Bayat, M.R.; Khodayar, M.E. Using genetic alghoritm for distributed generation allocation to reduce losses and improve voltage profile. In Proceedings of the 2007 42nd International Universities Power Engineering Conference, Brighton, UK, 4–6 September 2007; pp. 954–959. [Google Scholar]
  12. Gopiya Naik, S.N.; Khatod, D.K.; Sharma, M.P. Analytical approach for optimal siting and sizing of distributed generation in radial distribution networks. IET Gener. Transm. Distrib. 2015, 9, 209–220. [Google Scholar] [CrossRef]
  13. Kumar Injeti, S.; Prema Kumar, N. A novel approach to identify optimal access point and capacity of multiple DGs in a small, medium and large scale radial distribution systems. Int. J. Electr. Power Energy Syst. 2013, 45, 142–151. [Google Scholar] [CrossRef]
  14. Sultana, S.; Roy, P.K. Multi-objective quasi-oppositional teaching learning based optimization for optimal location of distributed generator in radial distribution systems. Int. J. Electr. Power Energy Syst. 2014, 63, 534–545. [Google Scholar] [CrossRef]
  15. Bahram, P.; Peyman, K.; Gharehpetian, G.B.; Abedi, M. Optimal allocation and sizing of DG units considering voltage stability, losses and load variations. Int. J. Electr. Power Energy Syst. 2016, 79, 42–52. [Google Scholar]
  16. Ganguly, S.; Dipanjan, S. Distributed generation allocation with on-load tap changer on radial distribution networks using adaptive genetic algorithm. Appl. Soft Comput. 2017, 59, 45–67. [Google Scholar] [CrossRef]
  17. Atwa, Y.M.; El-Saadany, E.F. Probabilistic approach for optimal allocation of wind-based distributed generation in distribution systems. IET Renew. Power Gener. 2011, 5, 79–88. [Google Scholar] [CrossRef]
  18. Bhullar, S.; Ghost, S. Optimal Integration of Multi Distributed Generation Sources in Radial Distribution Networks Using a Hybrid Algorithm. Energies 2018, 11, 628. [Google Scholar] [CrossRef] [Green Version]
  19. Duong, M.Q.; Pham, T.D.; Nguyen, T.T.; Doan, A.T.; Tran, H.V. Determination of Optimal Location and Sizing of Solar Photovoltaic Distribution Generation Units in Radial Distribution Systems. Energies 2019, 12, 174. [Google Scholar] [CrossRef] [Green Version]
  20. El-Saadany, E.F.; Abdelsalam, A.A. Probabilistic approach for optimal planning of distributed generators with controlling harmonic distortions. IET Gener. Transm. Distrib. 2013, 7, 1105–1115. [Google Scholar]
  21. Singh, A.K.; Parida, S.K. Novel sensitivity factors for DG placement based on loss reduction and voltage improvement. Int. J. Electr. Power Energy Syst. 2016, 74, 453–456. [Google Scholar] [CrossRef]
  22. Gautam, D.; Mithulananthan, N. Optimal DG placement in deregulated electricity market. Electr. Power Syst. Res. 2007, 77, 1627–1636. [Google Scholar] [CrossRef]
  23. Hadian, A.; Haghifam, M.-R.; Zohrevand, J.; Akhavan-Rezai, E. Probabilistic approach for renewable dg placement in distribution systems with uncertain and time varying loads. In Proceedings of the 2009 IEEE Power & Energy Society General Meeting, Calgary, AB, Canada, 26–30 July 2009; pp. 1–8. [Google Scholar]
  24. Mobin, E.; Mostafa, S.; Masoud, E. Multi-objective optimal reconfiguration and DG (Distributed Generation) power allocation in distribution networks using Big Bang-Big Crunch algorithm considering load uncertainty. Energy 2016, 103, 86–99. [Google Scholar]
  25. Gil Mena, A.J.; Martín García, J.A. An efficient approach for the siting and sizing problem of distributed generation. Int. J. Electr. Power Energy Syst. 2015, 69, 167–172. [Google Scholar] [CrossRef]
  26. Doagou-Mojarrad, H.; Gharehpetian, G.B.; Rastegar, H.; Olamaei, J. Optimal placement and sizing of DG (distributed generation) units in distribution networks by novel hybrid evolutionary algorithm. Energy 2013, 54, 129–138. [Google Scholar] [CrossRef]
  27. Haldar, V.; Chakraborty, N. Reliability based multi-objective DG and capacitor allocation in radial distribution system. In Proceedings of the 2016 IEEE Uttar Pradesh Section International Conference on Electrical, Computer and Electronics Engineering (UPCON), Varanasi, India, 9–11 December 2016; pp. 450–455. [Google Scholar]
  28. Shaaban, M.F.; El-Saadany, E.F. Optimal allocation of renewable DG for reliability improvement and losses reduction. In Proceedings of the 2012 IEEE Power and Energy Society General Meeting, San Diego, CA, USA, 22–26 July 2012; pp. 1–8. [Google Scholar]
  29. Zhu, D.; Broadwater, R.P.; Tam, K.; Seguin, R.; Asgeirsson, H. Impact of DG Placement on Reliability and Efficiency With Time-Varying Loads. IEEE Trans. Power Syst. 2006, 21, 419–427. [Google Scholar] [CrossRef]
  30. Kim, S.-Y.; Kim, W.-W.; Kim, J.-O. Determining the Optimal Capacity of Renewable Distributed Generation Using Restoration Methods. IEEE Trans. Power Syst 2014, 29, 2001–2013. [Google Scholar] [CrossRef]
  31. Shaaban, M.F.; Atwa, Y.M.; El-Saadany, E.F. DG allocation for benefit maximization in distribution networks. IEEE Trans. Power Syst. 2013, 28, 639–649. [Google Scholar] [CrossRef]
  32. Viral, R.; Khatod, D.K. An analytical approach for sizing and siting of DGs in balanced radial distribution networks for loss minimization. Int. J. Electr. Power Energy Syst. 2015, 67, 191–201. [Google Scholar] [CrossRef]
  33. Mokhlis, H.; Jasmon, G.B.; Aman, M.M.; Bakar, A.H.A. Optimum tie switches allocation and DG placement based on maximisation of system loadability using discrete artificial bee colony algorithm, IET Gener. Transm. Distrib. 2016, 10, 2277–2284. [Google Scholar]
  34. Kim, I. Optimal distributed generation allocation for reactive power control, IET Gener. Transm. Distrib. 2017, 11, 1549–1556. [Google Scholar] [CrossRef]
  35. Grisales-Noreña, L.F.; Montoya, D.G.; Ramos-Paja, C.A. Optimal Sizing and Location of Distributed Generators Based on PBIL and PSO Techniques. Energies 2018, 11, 1018.
  36. Kumar, S.; Mandal, D.P.K.K.; Chakraborty, N. Optimal allocation of multiple DG units in radial distribution system using modified differential evolution technique. In Proceedings of the 2014 International Conference on Control, Instrumentation, Energy and Communication (CIEC), Calcuta, India, 31 January–2 February 2014; pp. 379–383. [Google Scholar]
  37. Gomez-Gonzalez, M.; Hernandez, J.C.; Vera, D.; Jurado, F. Optimal sizing and power schedule in PV household-prosumers for improving PV self-consumption and providing frequency containment reserve. Energy 2019, 191, 116554. [Google Scholar] [CrossRef]
  38. Babu, P.V.; Singh, S.P. Optimal Placement of DG in Distribution Network for Power Loss Minimization Using NLP & PLS Technique. Energy Procedia 2016, 90, 441–454. [Google Scholar]
  39. Esmaili, M. Placement of minimum distributed generation units observing power losses and voltage stability with network constraints. IET Gener. Transm. Distrib. 2013, 7, 813–821. [Google Scholar] [CrossRef]
  40. Bayat, A.; Bagheri, A.; Noroozian, R. Optimal siting and sizing of distributed generation accompanied by reconfiguration of distribution networks for maximum loss reduction by using a new UVDA-based heuristic method. Int. J. Electr. Power Energy Syst. 2016, 77, 360–371. [Google Scholar] [CrossRef]
  41. Mehdi, R. Simultaneous placement of DG and capacitor in distribution network. Electr. Power Syst. Res. 2016, 131, 1–10. [Google Scholar]
  42. Rosseti, G.J.S.; de Oliveira, E.J.; de Oliveira, L.W.; Silva, I.C.; Peres, W. Optimal allocation of distributed generation with reconfiguration in electric distribution systems. Electr. Power Syst. Res. 2013, 103, 178–183. [Google Scholar] [CrossRef]
  43. ti objective placement and sizing of multiple DGs and shunt capacitor banks simultaneously considering load uncertainty via MOPSO approach. Int. J. Electr. Power Energy Syst. 2015, 67, 336–349. [CrossRef]
  44. Carpinelli, G.; Mottola, F. Optimal allocation of dispersed generators, capacitors and distributed energy storage systems in distribution networks. In Proceedings of the 2010 Modern Electric Power Systems, Wroclaw, Poland, 20–22 September 2010; pp. 1–6. [Google Scholar]
  45. Garcia, R.S.; Weisser, D. A wind–diesel system with hydrogen storage: Joint optimisation of design and dispatch. Renew. Energy 2006, 31, 2296–2320. [Google Scholar] [CrossRef]
  46. Kahrobaee, S.; Asgarpoor, S.; Qiao, W. Optimum sizing of distributed generation and storage capacity in smart households. IEEE Trans. Smart Grid 2013, 4, 1791–1801. [Google Scholar] [CrossRef] [Green Version]
  47. Delille, G.; Malarange, G.; Gaudin, C. Analysis of the options to reduce the integration costs of renewable generation in the distribution networks. Part 2: A step towards advanced connection studies taking into account the alternatives to grid reinforcement. In Proceedings of the CIRED 22nd International Conference on Electricity Distribution, Stockholm, Sweden, 10–13 June 2013. [Google Scholar]
  48. Pagnetti, A.; Fournel, J.; Santander, C.; Minaud, A. A comparison of different curtailment strategies for distributed generation. In Proceedings of the CIRED 23rd International Conference on Electricity Distribution, Lyon, France, 15–18 June 2018. [Google Scholar]
  49. Tonkoski, R.; Lopes, L.A.C.; El-Fouly, T.H.M. Coordinated Active Power Curtailment of Grid Connected PV Inverters for Overvoltage Prevention. IEEE Trans. Sust. Energy 2011, 2, 139–147. [Google Scholar] [CrossRef]
  50. Sun, W.; Harrison, G.P. Influence of generator curtailment priority on network hosting capacity. In Proceedings of the CIRED 22nd International Conference on Electricity Distribution, Stockholm, Sweden, 10–13 June 2013. [Google Scholar]
  51. Impact Assesment-Ocena Skutków Regulacji do Projektu Ustawy o Odnawialnych Źródłach Energii. 12 November 2013. Available online: http://www.toe.pl/pl/wybrane-dokumenty/rok-2013?download=72:ocena-skutkow-regulacji (accessed on 12 November 2013).
Figure 1. Power losses linearization—spline function consisting of five linear functions.
Energies 13 03746 g001
Figure 2. Structure of loads connected to the benchmark network model. Own study.
Energies 13 03746 g002
Figure 3. Benchmark model of medium voltage distribution network.
Energies 13 03746 g003
Figure 4. Structure of capacity for main scenarios—1.
Energies 13 03746 g004
Figure 5. Structure of capacity for main scenarios—2.
Energies 13 03746 g005
Figure 6. Structure of capacity for main scenarios—3.
Energies 13 03746 g006
Figure 7. Costs for main scenarios—1.
Energies 13 03746 g007
Figure 8. Costs for main scenarios—2.
Energies 13 03746 g008
Figure 9. Costs for main scenarios—3.
Energies 13 03746 g009
Table 1. Rated power of the renewable energy sources (RES).
Type SeriesPVWTBG
110 kW10 kW200 kW
2100 kW100 kW500 kW
31000 kW500 kW2000 kW
Table 2. Power lines parameters.
LineConnection Between NodesLine Capacity (MW)Line Resistance (Ω)
11–2400 *
22–37.31.21
33–45.90.77
43–75.90.77
54–55.92.89
65–65.91.77
77–85.90.36
87–115.91.77
98–95.90.29
109–105.90.19
* resistance of a power transformer is negligible and assumed as equal to 0.
Table 3. Costs of RES installation.
Type of CostType of RES
PV 10PV 100PV 1000WT 10WT 100WT 500BG 200BG 500BG 1000
CAPEX [thous. €/MW_year]84848111011099214198188
OPEXfix [thous. €/MW_year]272724363645144183181
OPEXvar [€/MWh]000000917870
Table 4. Computation time and number of variables.
ScenarioComputation Time [s]Number of Variables
30% (RES allocation)24917,532,417
30% (RES + ES allocation)64117,594,652
30% (RES allocation + EC)8117,672,385
40% (RES allocation)8817,532,417
40% (RES + ES allocation)60717,594,652
40% (RES allocation + EC)3617,734,620
50% (RES allocation)10917,532,417
50% (RES + ES allocation)17317,594,652
50% (RES allocation + EC)15617,672,385

