Article

Structural, Textural, and Catalytic Properties of Ni-CexZr1−xO2 Catalysts for Methane Dry Reforming Prepared by Continuous Synthesis in Supercritical Isopropanol

by
Svetlana Pavlova
1,2,
Marina Smirnova
1,2,*,
Aleksei Bobin
1,2,
Svetlana Cherepanova
1,2,
Vasily Kaichev
1,2,
Arcady Ishchenko
1,2,
Aleksandra Selivanova
1,
Vladimir Rogov
1,2,
Anne-Cécile Roger
3 and
Vladislav Sadykov
1,2
1
Boreskov Institute of Catalysis, prosp. Akad. Lavrentieva 5, 630090 Novosibirsk, Russia
2
Department of Natural Sciences, Novosibirsk state University, Pirogova street 1, 630090 Novosibirsk, Russia
3
Institute of Chemistry and Processes for Energy, Environment and Health, University of Strasbourg, 4 rue Blaise Pascal, F-67081 Strasbourg, France
*
Author to whom correspondence should be addressed.
Energies 2020, 13(14), 3728; https://doi.org/10.3390/en13143728
Submission received: 12 May 2020 / Revised: 3 July 2020 / Accepted: 15 July 2020 / Published: 20 July 2020
(This article belongs to the Special Issue Hydrogen and Syngas Generation)

Abstract

:
A series of 5%Ni-CexZr1−xO2 (x = 0.3, 0.5, 0.7) catalysts has been prepared via one-pot solvothermal continuous synthesis in supercritical isopropanol and incipient wetness impregnation of CexZr1−xO2 obtained by the same route. The textural, structural, red-ox, and catalytic properties in methane dry reforming (MDR) of Ni-modified Ce-Zr oxides synthesized by two routes have been compared. It was shown by XRD, TEM, and Raman spectroscopy that the method of Ni introduction does not affect the phase composition of the catalysts, but determines the dispersion of NiO. Despite a high dispersion of NiO and near-uniform distribution of Ni within Ce-Zr particles observed for the one-pot catalysts, they have shown a lower activity and stability in MDR as compared with impregnated ones. This is a result of a low Ni concentration in the surface layer due to segregation of Ce and decoration of nickel nanoparticles with support species.

Graphical Abstract

1. Introduction

The carbon dioxide reforming of methane-generating synthesis gas has now attracted considerable attention as the environmental friendly process transforming undesirable greenhouse gases into syngas [1]. Ni-based catalysts, due to their high activity and low cost, are very promising for the practical use. However, the major problem of nickel nanoparticles deposited on traditional supports is rapid deactivation caused by Ni sintering and coke formation [2]. CeO2-based supports are considered as the promising ones for Ni-based MDR catalysts, because of their ability to store and release oxygen that prevents coke poisoning of Ni nanoparticles [3,4,5,6,7,8,9,10,11,12,13]. It is known that oxygen vacancies and mobile surface/subsurface lattice oxygen provide the activation of CO2 and carbon oxidation near/at the metal-support interface, respectively. Besides this, a strong interaction of Ni with CeO2-based supports ensures high Ni dispersion that helps to enhance the catalytic activity and resistance to coking [6,11,13]. Compared to CeO2 itself, mixed Ce-Zr oxides show a higher thermal stability, improved oxygen mobility and better catalytic performance [3,4,5,7,9].
The performance of Ni-CexZr1−xO2 catalysts in MDR depends on the methods of their synthesis: impregnation of supports [5,7,9,10] or one-pot routes (co-precipitation [4,7,8], sol-gel [3]), which affect Ni interaction with oxide matrix, its dispersion, and, to a large extent, the features of Ce-Zr oxides [3,4,5,6,7,8,9,10,11,12,13]. The MDR activity and stability of Ni/Ce0.75Zr0.25O2 catalysts prepared by impregnation and co-precipitation with or without the surfactant (CTAB) have been studied elsewhere [4]. For the co-precipitated catalysts, Ni cations are embedded into the lattice of Ce0.75Zr0.25O2 that leads to a stronger interaction of nickel species with the support and higher nickel dispersion in comparison with the impregnated catalysts. In addition, the large specific surface area and pore volume of the surfactant-assisted co-precipitated catalyst provide its highest activity [4]. Kumar et al. studied Ni-containing catalysts obtained by impregnation of CexZr1−xO2 solid solutions (x = 0.4 – 0.92), which have been prepared by co-precipitation using alcogel or the surfactant CTAB [9]. Testing in the low-temperature MDR has revealed that the catalysts prepared with CTAB are very active and stable because of a higher dispersion of Ni species and enhanced reducibility of the supports [9]. In contrast, 5%Ni-Ce0.6Zr0.4O2 catalyst prepared by impregnation of the surfactant-assisted precipitated support is not active in MDR, as has been reported in the recent work by Wolfbeisser [7]. This result has been explained by the inaccessibility of Ni particles due to their encapsulation by ceria–zirconia species after reduction at 600 °C, as revealed by TEM and H2 chemisorption.
The dependence of MDR performance of Ni-CexZr1−xO2 on the composition of Ce-Zr-O solid solution has been reported in a number of works but obtained results and their interpretation differ considerably [3,5,7,8,10]. The study of 5%Ni-CexZr1−xO2 with x varied from 0.28 to 0.75 shows superior MDR activity and a high coke resistance of zirconium-rich 5%Ni-Ce0.28Zr0.72O2 catalyst [5]. The amount and type of coke formed in the course of MDR were not straightforwardly related to the activity but obviously depended on the Ce/Zr ratio. On the contrary, the remarkable performance of a Ce-rich Ni/Ce0.8Zr0.2O2 sample and a low activity or fast deactivation of Ni supported on Ce0.5Zr0.5O2 and Ce0.2Zr0.8O2 carriers were observed in [8,10]. Makri et al. studied the carbon formation pathways and carbon reactivity during MDR over 5%Ni/Ce0.8Zr0.2O2 and 5%Ni/Ce0.5Zr0.5O2 catalysts using temperature-programmed methods and transient isotopic experiments [10]. The Ce-rich catalyst was found to be more active and selective despite a lower oxygen capacity. The authors have underlined that the rate of oxygen transfer from the support towards the Ni-support interface is more important parameter than the oxygen storage capacity itself. Roh et al. explained the better performance of co-precipitated Ni-Ce0.8Zr0.2O2 by a proximate contact between finely dispersed Ni and support particles [8]. On the other hand, Ni/Ce0.6Zr0.4O2 was considered as the most active MDR catalyst due to the ability of the Ce-Zr support to provide better transfer of oxygen species to Ni nanoparticles, thus accelerating the removal of carbon [9].
It is well known that the Zr content strongly affect the structure of Ce–Zr mixed oxides. Only a cubic fluorite phase is detected in the Ce-rich samples, while three tetragonal phases (t, t’, t’’) can form at intermediate Zr concentrations [14,15]. Except for the composition, the structural and morphological features of CexZr1−xO2 nanoparticles are determined by their synthesis method [16]. Mixed CeO2-ZrO2 systems can be prepared using various methods including co-precipitation [4,5], sol-gel [3], microemulsion [17], high energy ball milling [18], and synthesis in supercritical fluids (SCS) [19,20,21,22,23,24,25,26,27,28,29,30]. The last one is highly attractive due to its usability and high productivity especially in a continuous mode.
Supercritical (SC) and near-critical (NC) fluids exhibit unique properties, which can be tuned by the reaction temperature and pressure. Along with these parameters, the morphology, crystallinity, dispersion of cerium and zirconium oxides, as well as their solid solutions prepared using SC fluids depend on the process mode (batch or continuous), nature of SC media (for example, water or alcohols), presence of complexing agents, heating rate, and reaction time [19,20,21,22,23,24,25,26,27,28,29,30].
The synthesis of CeO2 and CexZr1−xO2 nanoparticles using NC and SC water was presented in a number of articles [20,21,22,23,24,25]. It was shown that the rapid reaction kinetics in SC water makes possible the preparation of oxide nanoparticles using continuous process, which is easily scalable and attractive for industry [20,22,23,24,25]. The formation of highly crystallized oxide nanoparticles in hydrothermal conditions occurs at relatively low temperatures and does not require calcination that allows preparation of highly dispersed CeO2 and CexZr1−xO2 [22]. Some authors pointed out a higher specific surface area and thermal stability of samples produced by hydrothermal SCS in comparison with those synthesized by conventional co-precipitation method [23,24].
The ligand-assisted hydro- and solvothermal synthesis was developed to produce surface-modified ceria and Ce-Zr mixed oxides. The interaction between the surface hydroxyl groups and organic molecules results in a high dispersion of oxide nanoparticles in organic media and unusual morphology of individual crystals or secondary aggregates [25,26,27,28]. Except this, the usage of surface modifier leads to decrease in the particle size because of the inhibition of crystal growth [25,27].
Some reports suggest that alcohols can act as not only a reaction media, but also as ligand molecules modifying the surface with carboxylate-, alkoxide-, and alkyl- groups [26,29]. The solvothermal continuous synthesis (T = 300 °C, p = 24.5 MPa) of CeO2 nanocrystals with different crystal size and textural properties was reported by Slostowski and co-workers [29,30]. Primary particles of CeO2 (3 – 7 nm) aggregated in spherical agglomerates (20 – 100 nm) have demonstrated two types of thermal behavior depending on the alcohol used (MeOH, EtOH, PrOH, i-PrOH, ButOH, PentOH, or HexOH). First, a significant drop in the specific surface area and an increase in the crystallite size due to a thermal treatment are observed, if alcohol had nC ≤ 3. When alcohol with nC = 4 – 6 is used, CeO2 nanoparticles show an increase in the specific surface area (up to 190 m2/g) and retention of crystallite size. The authors have concluded that the thermal resistance of CeO2 samples depends on the thermal stability of organic grafts provided by different alcohols.
It has been demonstrated in our previous papers that solvothermal continuous synthesis using SC-i-PrOH along with a complexing agent allows to obtain homogeneous CexZr1−xO2 solid solutions, which provide the high MDR activity and stability of Ni/CexZr1−xO2 catalysts prepared by impregnation [31,32]. In the present work, for the first time, we have realized the one-pot solvothermal continuous synthesis of Ni-Ce-Zr-O oxides as precursors of the MDR catalysts. CexZr1−xO2 and 5%Ni-CexZr1−xO2 with the different Ce/Zr ratio were prepared and characterized by the complex of physical–chemical methods. The textural, structural, red-ox, and catalytic properties of the Ni-modified Ce-Zr oxides obtained by one-pot route and impregnation technique were studied. The influence of the preparation method on the physicochemical properties of Ni-CexZr1−xO2 and their catalytic performance in MDR has been discussed.

2. Materials and Methods

CexZr1−xO2 oxides and 5%Ni-CexZr1−xO2 catalysts were prepared by the solvothermal continuous synthesis using SC-i-PrOH along with acetylacetone as a complexing agent, which was added into the Zr solution at the 2:1 molar ratio to Zr. Zr(OBu)4 (Alfa Aesar, 80% solution in n-butanol) and Ce(NO3)3·6H2O (Vecton, pure for analysis grade) i-propanol solutions, were used as Zr and Ce precursors. The mixture of Ce and Zr precursor’s solutions was fed into a U-shaped reactor (l = 75 cm, inner d = 4 mm) at a rate of 5 mL/min along with i-PrOH preheated to 150 °C, which flow rate was 8 mL/min. For one-pot synthesis of NiCeZrO samples, the required amount of Ni(NO3)2·6H2O (Vecton, pure for analysis) was additionally dissolved in the Ce(NO3)3 solution. The synthesis of CexZr1−xO2 and NiCeZrO one-pot catalysts was carried out at 400 °C under a pressure of 120–130 bar using an installation described elsewhere [33]. The solid product separated from a mother liquid by decantation was dried and calcined at 600 °C for 2 h to obtain samples marked as CexZr1−x or Ni-CexZr1−xop. Along with one-pot NiCeZrO samples, Ni was supported on Ce-Zr oxides by a wet impregnation using an aqueous solution of Ni(NO3)2. The obtained catalysts dried and calcined at 600 °C were denoted as Ni-CexZr1−xim.
XRD patterns of the samples were recorded on a D8 Advance diffractometer (Bruker, Germany) in the 2θ angle range of 20 – 85 ° using the CuKα radiation. The data were collected in a step-scanning mode with a step of 0.05 ° and a step-counting time of 3 s. In order to analyze the phase composition of complex oxides, the full-profile analysis was done using the software TOPAS (Bruker, Germany). At first, the lattice constants for each phase contained in the samples have been refined to determine the unit cell volume. The chemical composition of the phases was evaluated from the literature data on the dependence of the cell volume versus the Ce content [14,15]. Then, we fixed the occupancies of Ce and Zr atoms in TOPAS to determine a weight ratio of two or three phases. The average particle sizes of nickel oxide were estimated by the Selyakov–Scherrer equation from the integral broadening of the most intensive (200) peak.
Raman spectra were recorded on a LabRAM HR Evolution spectrometer (Horiba, Japan) in the backscattering configuration excited by 488 nm line of an Ar-ion laser.
The texture of CexZr1−xO2 or Ni-CexZr1−xop samples was studied by low-temperature N2 adsorption technique using an ASAP-2400 instrument (Micromeritics, USA). Prior to analysis, the samples were degassed at 150 °C under vacuum for 16 h. The micropore volume was determined by t-plot analysis. The mean pore size was evaluated as 4V/A. The specific surface area of Ni-CexZr1−xim catalysts was estimated with a SORBI N.4.1 apparatus by the four-point BET method. Prior to measurements, samples were pretreated at 200 °C for 1 h in vacuum.
The TEM-EDX studies were performed using a JEM-2010 instrument (JEOL Ltd., Japan) operated at acceleration voltage of 200 kV and lattice resolution of 0.14 nm. The samples were prepared by depositing drops of the powders dispersed in ethanol onto copper–carbon grids. EDX mappings and line scan spectra were provided using a JEM-2200FS microscope (JEOL Ltd., Japan).
X-ray photoelectron spectroscopy (XPS) study was carried out with a spectrometer from SPECS Surface Nano Analysis GmbH (Germany) using the monochromatic AlKα radiation. The charge correction was performed by setting the Ce3d3/2-u’’’ peak at 916.7 eV. The samples were analyzed in the calcined and reduced state. After ex-situ reduction at 500 °C, they were transferred to the analysis chamber under an ambient atmosphere. The relative element concentrations were determined from the integral intensities of the core-level spectra using the cross-sections according to Scofield [34]. For the detailed analysis, the spectra were fitted into several peaks after the background subtraction by the Shirley method. The fitted procedure was performed using the CasaXPS software.
The reducibility of catalysts was studied by H2-temperature-programmed reduction (TPR). The sample (200 mg) was heated at a rate of 10 °C/min to 900 °C in an installation equipped with a thermal conductivity detector under a H2 (10%)–Ar mixture with a flow of 40 mL/min. To analyze the TPR data, the Asymmetric Gauss Decomposition method (AGDM) was applied.
The catalytic performance in MDR was studied in a conventional fixed-bed quartz microreactor in the feed of 5% CO2+5% CH4 (He – balance) at the contact time of 7.5 ms and 700 °C. All tests were conducted for 3 h. Before the reaction, 15–20 mg of the catalyst (depending on its poured bulk density) was pretreated in-situ at 600 °C for 30 min in the feed of 10% O2 in He. Due to a fast in-situ NiO reduction in the reaction media at 650 °C [30], the pretreatment in H2 flow was not required. The reaction products were analyzed at each 30 min using a Test-201 gas analyzer (Boner, Russia) equipped with optical, IR, and electrochemical sensors.

3. Results

3.1. Textural Properties of Supports and Catalysts

The N2 adsorption and desorption isotherms for CexZr1−xO2 supports and Ni-containing catalysts prepared by one-pot synthesis are shown in Figure 1. According to the classification adopted by the IUPAC, all isotherms belong to IV type with H3 shaped hysteresis loop at P/P0 ~ 0.4–0.7, which is associated with open-ended mesopores [35]. A similar shape of isotherms was obtained for CeO2 prepared by the continuous synthesis in supercritical C4-C6 alcohols, while only micro- or macropores were found when C1, C3, or iso-C3 alcohols were used [30]. It is probable that the formation of mesopores in our CexZr1−xO2 mixed oxides prepared using supercritical isopropanol is due to the presence of zirconium butoxide and acetylacetone in the reaction solution.
The specific surface area (SSA), pore and micropore volume of Ce-Zr mixed oxides and Ni-CexZr1−xop catalysts increase at increasing Ce content, whereas the mean pore size is not directly related to Ce/Zr ratio (Table 1). The introduction of Ni leads to decrease in SSA and pore volume of all samples. In the case of one-pot catalysts, this could be caused by the influence of nickel cations on the formation of CexZr1−xO2 framework during the SC-synthesis, while for the impregnated ones, this could be due to blocking a part of pores with NiO particles formed after calcination at 600 °C.

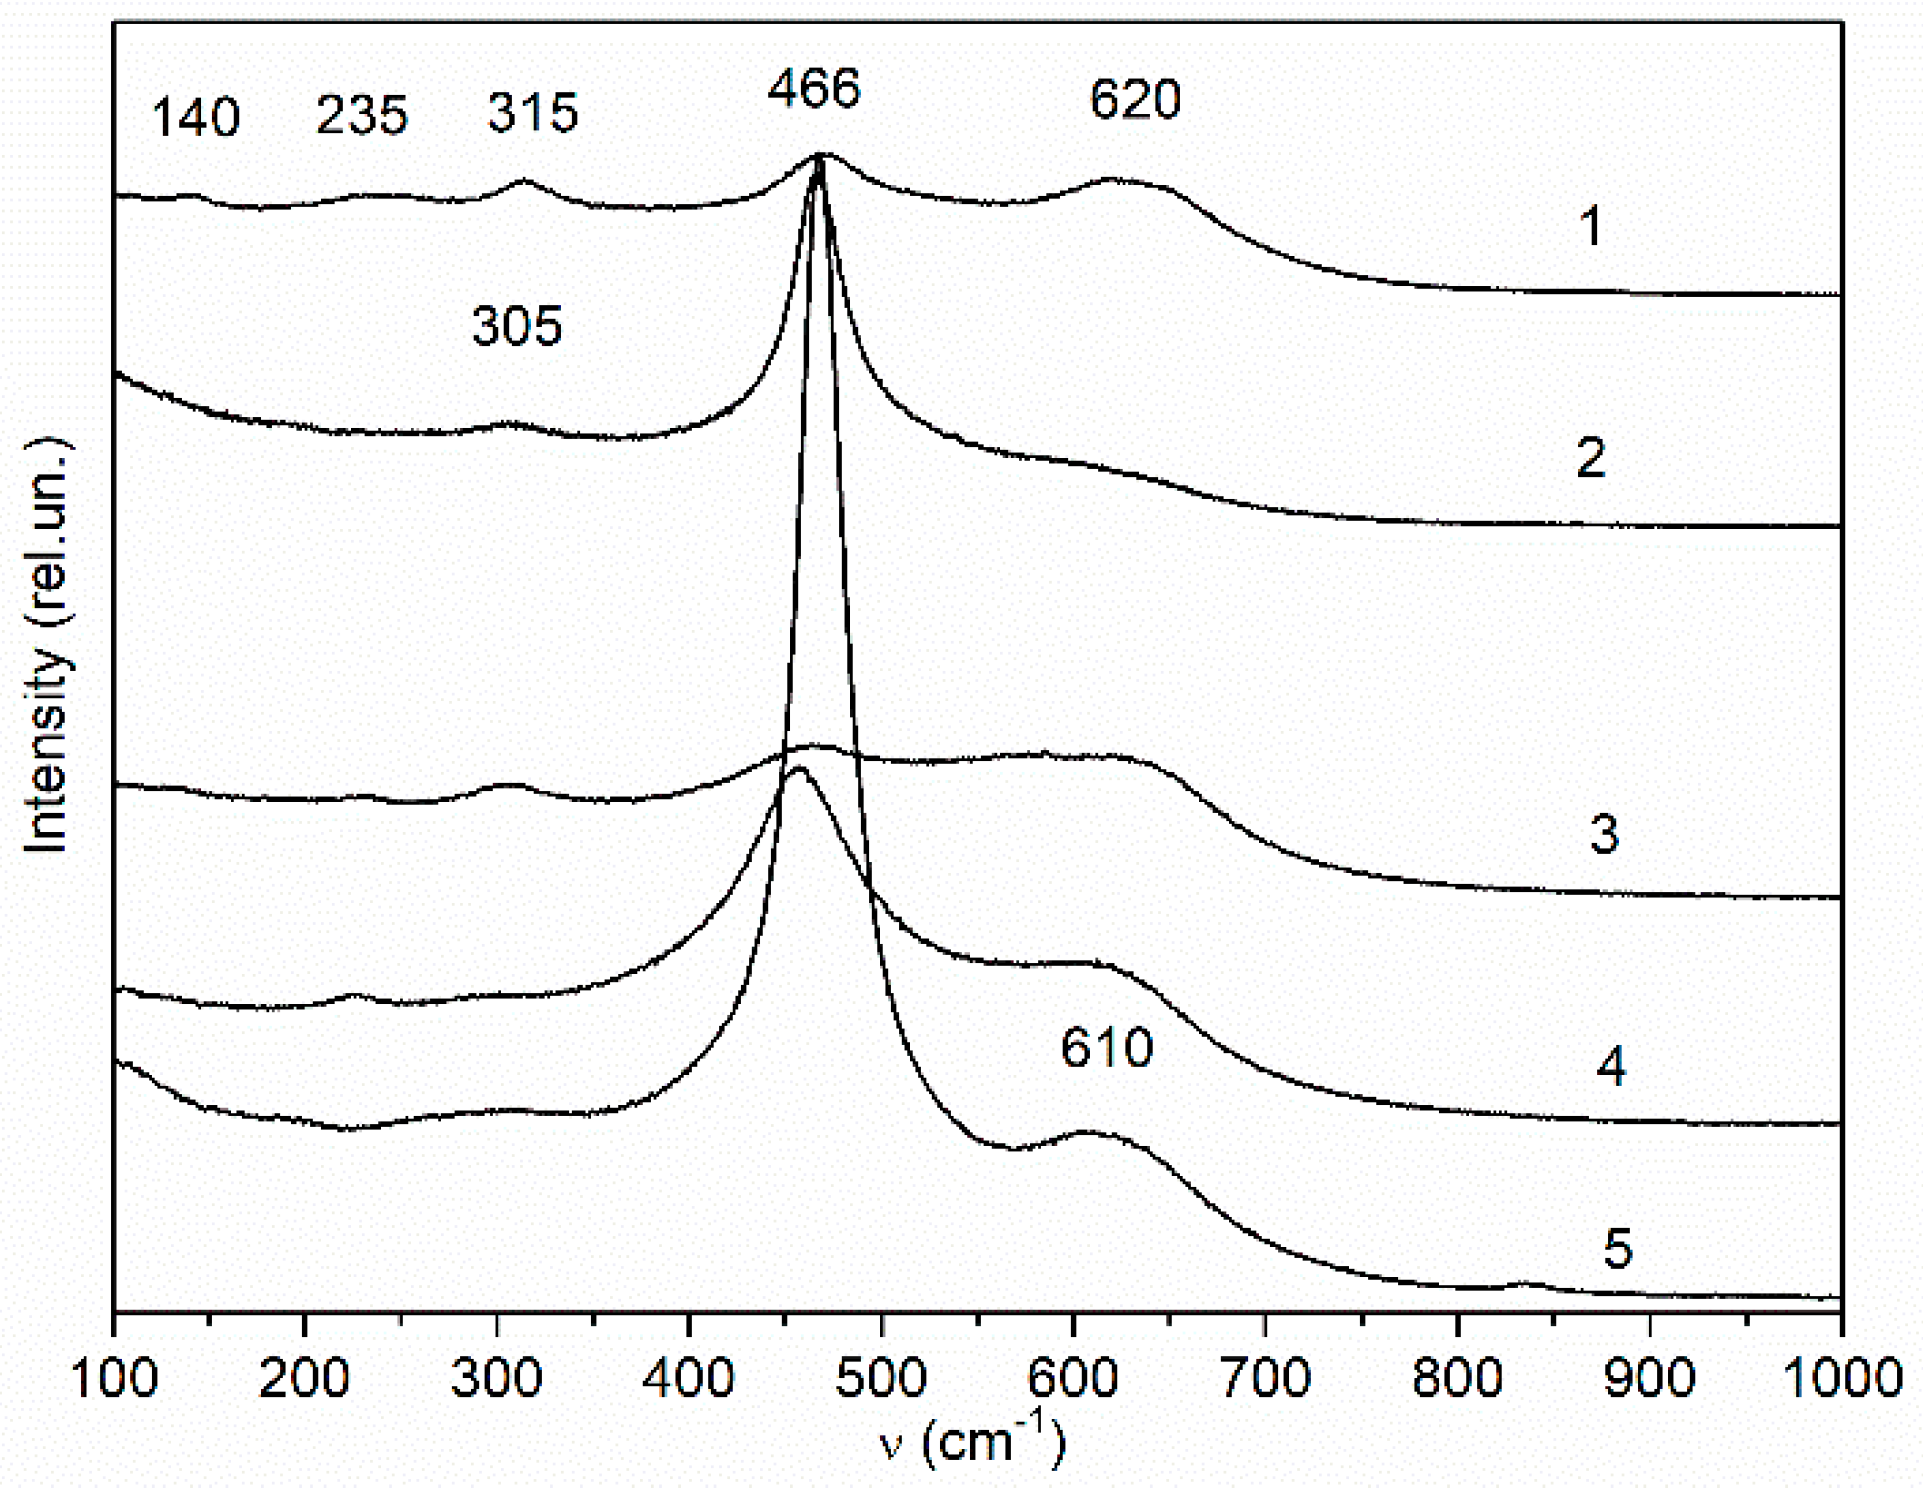
3.2. Structural Properties of Supports and Catalysts
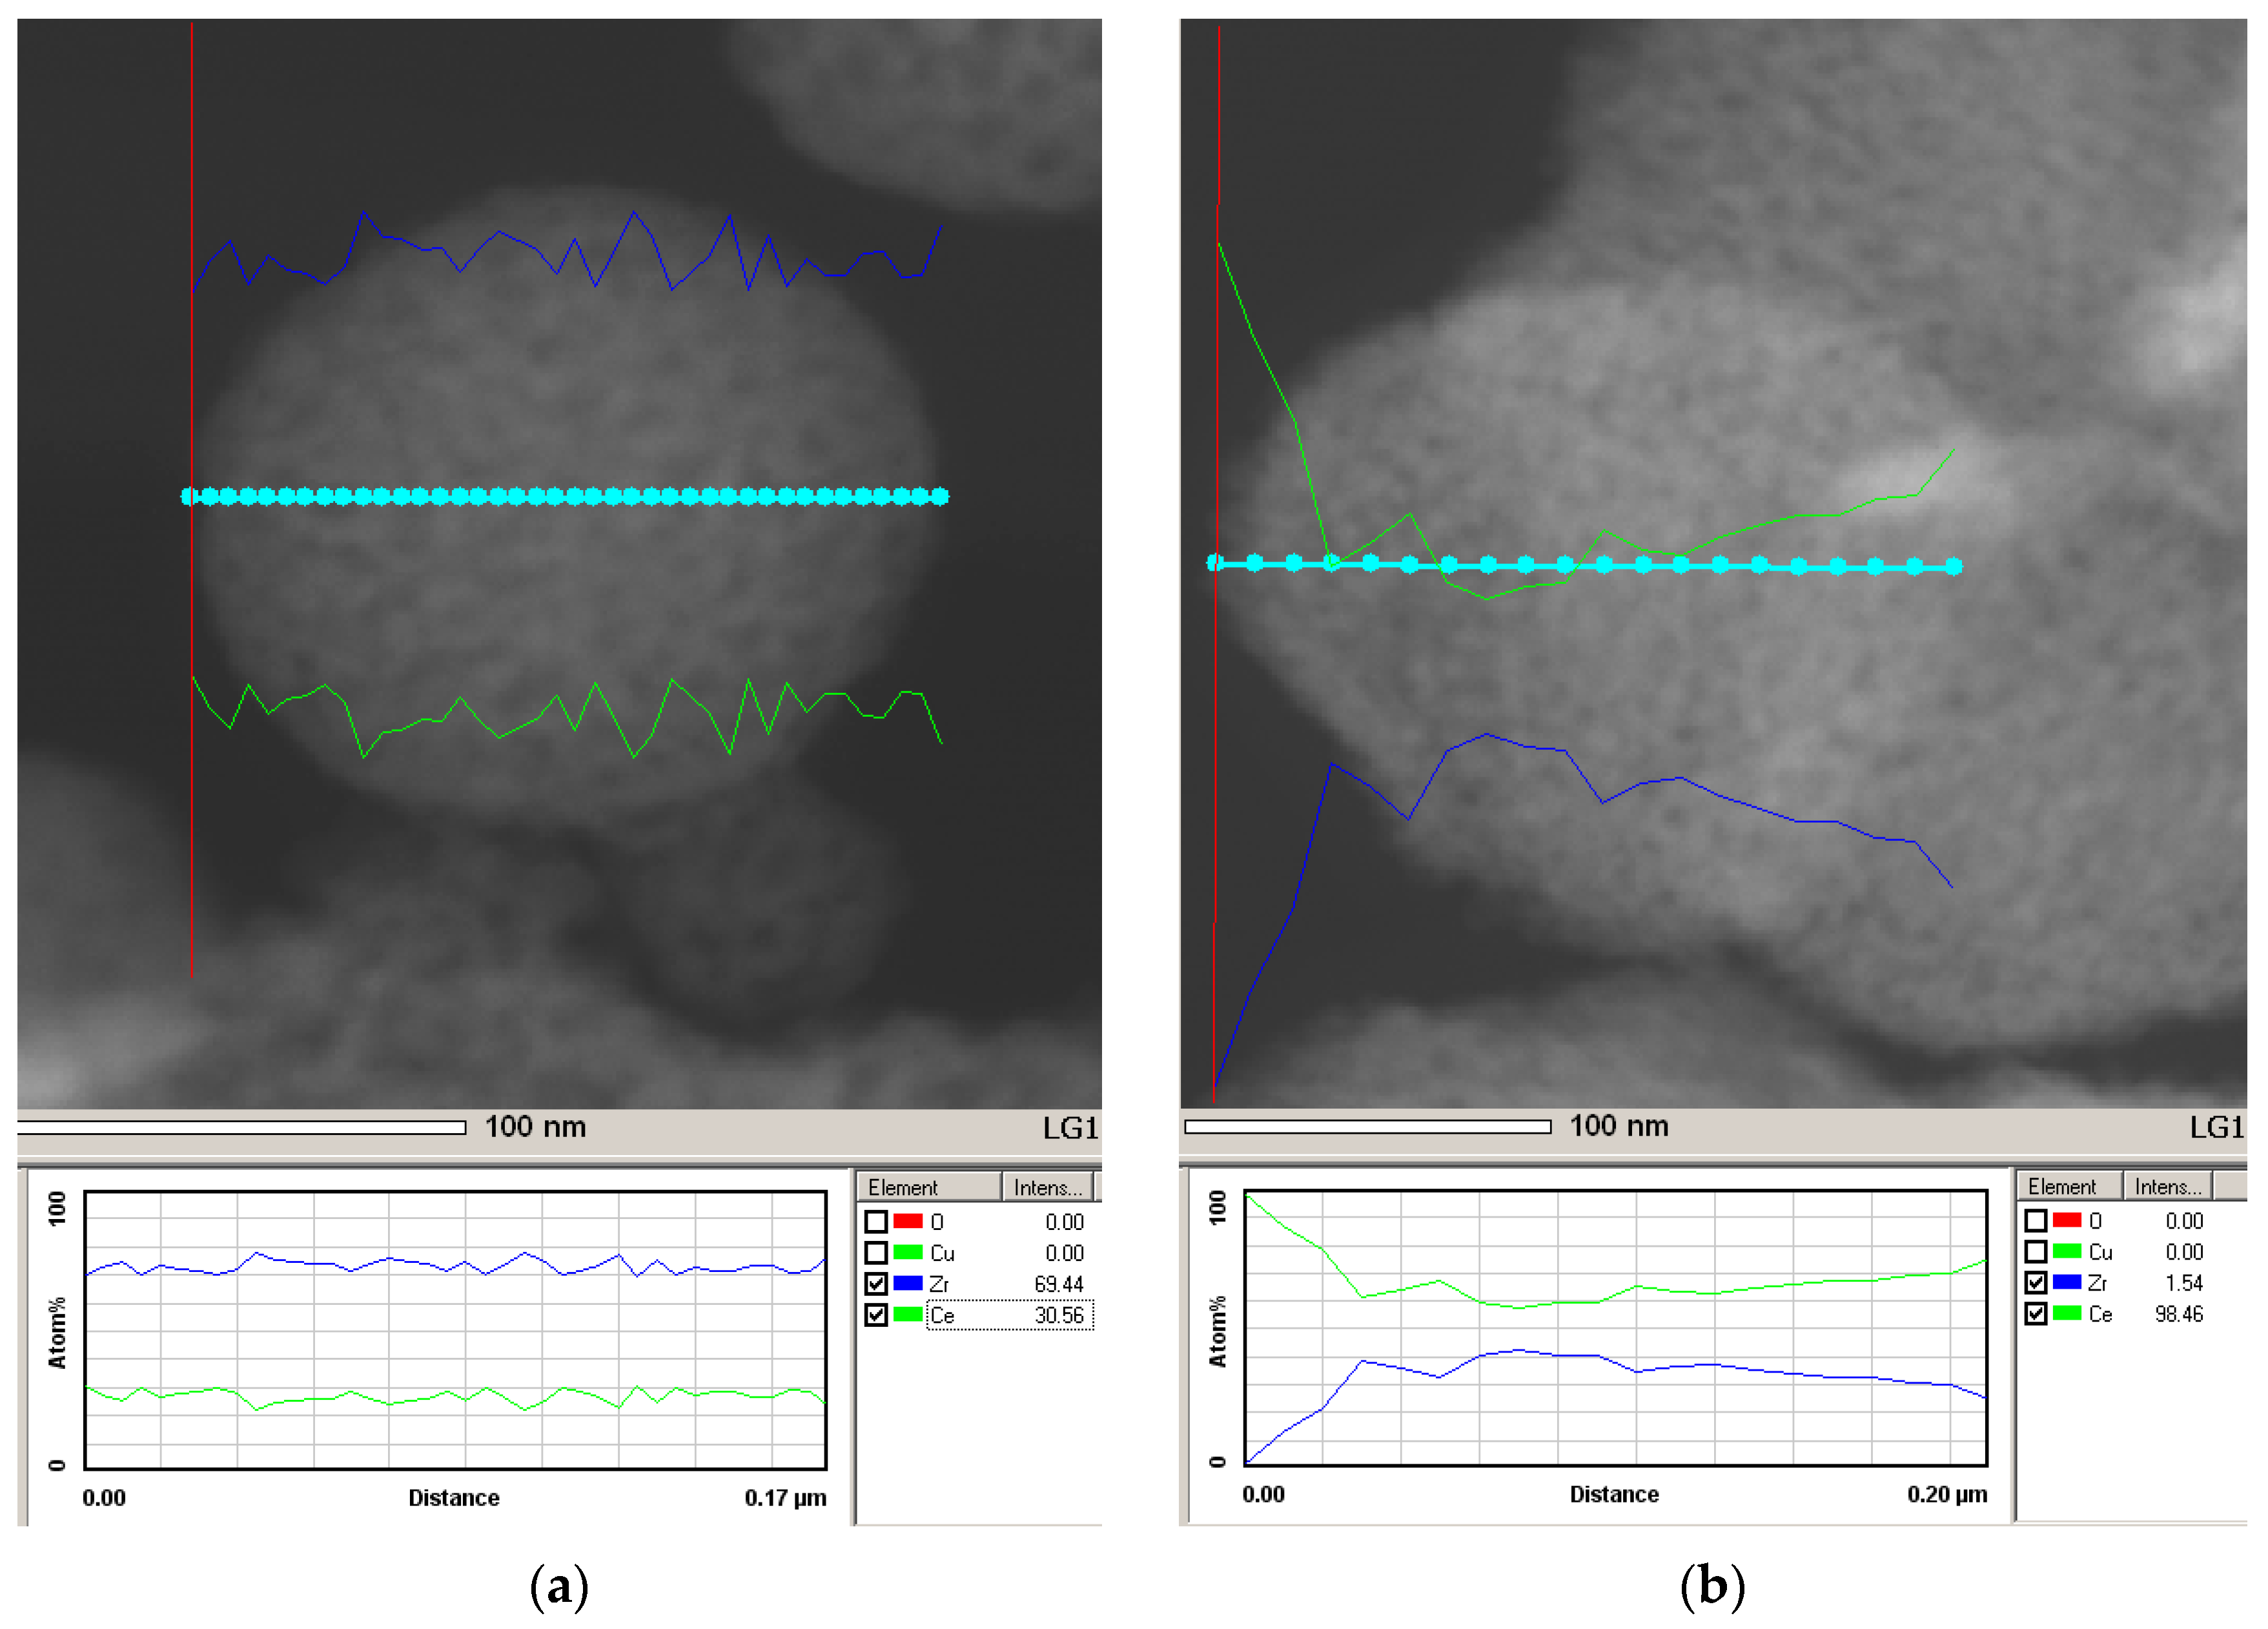
XRD data for the initial CexZr1−xO2 supports with a different Ce/Zr ratio are presented in Table 2 and Figure 2. XRD patterns of all Ce-Zr oxides show rather broad reflections typical for the fluorite-like structure [15,22]. The positions of reflections shift to lower angles at increasing Ce content due to a larger size of Ce4+ cation (ionic radius r = 0.97 Å) as compared with that of Zr4+ (r = 0.84 Å). For CexZr1−xO2 solid solutions with x = 0.2–0.9, three different tetragonal phases could be distinguished according to the literature: the stable phase t, metastable phase t’ obtained through a diffusionless transition, and t’’ - intermediate between t’ and cubic (c) phases [36]. The t’’ phase has the cubic cation sublattice, but the oxygen atoms are shifted from their ideal fluorite sites along c-axis [36].
The results of full-profile analysis presented in Table 2 have shown that only the Ce0.3Zr0.7 sample comprises a single phase solid solution of the stable tetragonal t structure with c/a’ equal to 1.015. The CexZr1−x samples with a larger Ce concentration along with a main tetragonal phase showing c/a’ = 1.005 contain admixtures of other phases. The Ce0.5Zr0.5 sample includes minor impurities of c and t phases enriched by Ce and Zr, respectively, while Ce0.7Zr0.3 contains the admixture phase with composition close to pure CeO2. The mean crystallite size of the CexZr1−xO2 main phases was estimated to be 10–14 nm independent on their composition (Table 2).
The XRD patterns of all catalysts are mainly similar to the patterns of CexZr1−x supports showing the broad reflections of CeO2–ZrO2 complex oxides (Figure 2). The reflections of NiO have been observed only for the impregnated catalysts (Figure 2b). The size of NiO crystallites is within the value of 18–20 nm not depending on the support. The absence of NiO reflections in the case of catalysts prepared by the one-pot method evidences high NiO dispersion. The full-profile analysis of XRD patterns for Ni-CexZr1−xop catalysts has shown that their phase composition, like that of CexZr1−x samples, depends on the Ce content (Table 2). Thus, only the tetragonal t phase is observed in Ni-Ce0.3Zr0.7op likewise for the pure Ce0.3Zr0.7, while for Ni-Ce0.5Zr0.5op and Ni-Ce0.7Zr0.3op admixtures of cubic phases enriched by Ce are present along with the main tetragonal phase.
It is known that the reflections broadening due to a high dispersion of CexZr1−xO2 makes it difficult to distinguish between the cubic and metastable tetragonal phases [14]. In this context, Raman spectroscopy characterizing the anion sublattice can be applied to get the additional information on the structural features of samples [14,37]. Raman spectra of CexZr1−xO2 samples calcined at 600 °C are presented in Figure 3. In the spectrum of Ce0.3Zr0.7, five broad bands of a low intensity correspond to the stable tetragonal t phase [37,38] confirming the XRD data. A band at around 465 cm−1 due to the F2g Raman active mode is a characteristic of CeO2 cubic fluorite-like structure [14,22,37]. The bands at ~ 300–308 cm−1 and ~ 610 cm−1 are usually observed in the spectra of CeO2-ZrO2 oxides with the t’ or t” metastable phases [22,37]. The band near 600–610 cm−1 is associated with structure defects (oxygen vacancies) arising due to the substitution of Zr4+ into the ceria lattice. A weak band in the region of 300–315 cm−1 could be related to the displacement of the oxygen atoms from their ideal positions in the fluorite lattice [14,37]. Taking into account the axial ratio c/a’ ≈ 1 calculated from the XRD data, well-defined symmetric band at 466 cm−1, and two broad bands of a low intensity at ~ 300–308 cm−1 and ~ 610 cm−1 observed in the spectra of Ce0.5Zr0.5 and Ce0.7Zr0.3, the t” tetragonal phase should be considered as the main phase for both these samples. In contrast to Ce-Zr supports, the Raman spectra of Ni-CexZr1−x-op catalysts with Ce occupancy ≥ 0.5 give evidence of a larger tetragonality of anion sublattice. Therefore, the t’ phase rather than the t” one prevails.

3.3. TEM Analysis

TEM images of CexZr1−xO2 supports show large spherical aggregates with the diameter from 20 to 100 nm comprised of stacked nanodomains, with the typical sizes of 10–15 nm (Figure 4) that agree with the XRD data (Table 2). It could be suggested that such morphology promotes formation of mesopores, which we observe by the N2 adsorption method. The distribution of elements in aggregates of the CexZr1−xO2 samples was analyzed by STEM-EDX (Figure 5 and Figure 6). According to these data, the distribution of Ce and Zr along the particles is relatively uniform for Ce0.3Zr0.7, while, in the case of Ce0.5Zr0.5 and Ce0.7Zr0.3, the concentration of Ce in the surface and subsurface layers obviously increases.
The morphology of Ni–CexZr1−xO2 catalysts is similar to the supports except for higher density of aggregates agglomerated into chains (Figure 4c). HRTEM-EDX and HAADF-STEM-EDX were used to study the influence of the preparation method on the distribution of elements in the fresh catalysts. The TEM images of Ni-Ce0.3Zr0.7 and Ni-Ce0.7Zr0.3 catalysts prepared by the one-pot method and by impregnation are presented in Figure 7 and in Supplementary Materials Figures S1–S3. In the case of impregnated catalysts, NiO particles (20–30 nm size) epitaxially bounded with the surface of the support (Figure 7a) as well as separate NiO particles (50–150 nm size) with (111) and (200) planes are clearly resolved (Figure 7c, Figure S1). The elemental mapping of Ni-Ce0.5Zr0.5im demonstrates non-uniform distribution of Ni (Figure 8) that is typical for other impregnated catalysts.
For the one-pot catalysts, the TEM images of NiO particles are fuzzy, and they do not enable to measure the NiO interplanar spacing (Figure 7b,d, Figure S2 and S3). However, EDX data evidencing the presence of Ni and the dark spots visible on the images obtained in the phase contrast mode allow us to suppose that NiO species are decorated by CexZr1−xO2 particles. The elemental mapping for Ni-Ce0.7Zr0.3op catalyst shows a high NiO dispersion and uniform distribution of Ni within the catalyst particles (Figure 9) that could be due to a strong interaction with the support and formation of Ni-Ce-Zr-O solid solution [6,13,39,40]. Moreover, the line scanning along Ni-Ce0.7Zr0.3op particles showing the decrease of Ni concentration in the surface layers confirms the decoration of NiO species (Figure 6d).

3.4. XPS Analysis

The Zr3d and Ce3d core-level spectra for all the catalysts are typical for CexZr1−xO2 oxides (Figures S4, S5). The Ni2p3/2 spectra of the fresh catalysts prepared by impregnation show the main peak at 854 eV and peaks of shake-up satellites at 856.0 and 860.9 eV (Figure 10). These satellites caused by the multielectron processes [41] are typical for Ni2+ compounds, such as NiO, Ni(OH)2, NiSiO3, etc. [42,43,44], while being absent for Ni0 and Ni3+ compounds [42]. The intensive satellite at 856.0 eV observed only in the spectra of NiO [44] evidences that in the case of impregnated catalysts nickel is mainly located in the NiO structure. In the spectra of the fresh catalysts prepared by the one-pot method, the main peak at 855.1–855.5 eV and the peak of shake-up satellite at 861.2–861.5 eV are observed (Figure 10). Such spectra are characteristic of Ni2+ in the state, which is different from that in NiO (Ni*). According to the literature, the peak at 855.5 eV could arise because of the strong interaction between NiOx species and the support [45] or the formation of Ni-Ce-Zr-O solid solution due to diffusion of Ni2+ cations into the fluorite lattice [46].
The spectra of reduced catalysts, except for Ni-Ce0.7Zr0.3im, are similar to ones of the fresh catalysts that could be a result of metallic Ni oxidation during its transfer through the air. The spectrum of Ni-Ce0.7Zr0.3im is complex evidencing the presence of both Ni2+ states: NiO and Ni* with the ratio of 80/20, respectively. The surface concentrations of elements calculated for Ni-containing samples using the XPS spectra are presented in Table 3. The surface of both fresh Ni-Ce0.3Zr0.7 catalysts is enriched with Zr (Ce/Zr < 0.43), while for Ni-Ce0.7Zr0.3 samples the Ce/Zr ratio show the surface enrichment with Ce (Ce/Zr > 2.33). Higher [Ni]/[Ce]+[Zr] ratios were obtained for the impregnated catalysts in comparison with those for the one-pot ones (0.19 against 0.06–0.1) that shows decoration of NiO particles in accordance with TEM data. After the ex-situ reduction, the decrease in the surface Ni content and the Ce/Zr ratio is observed for Ni-Ce0.7Zr0.3im catalyst.

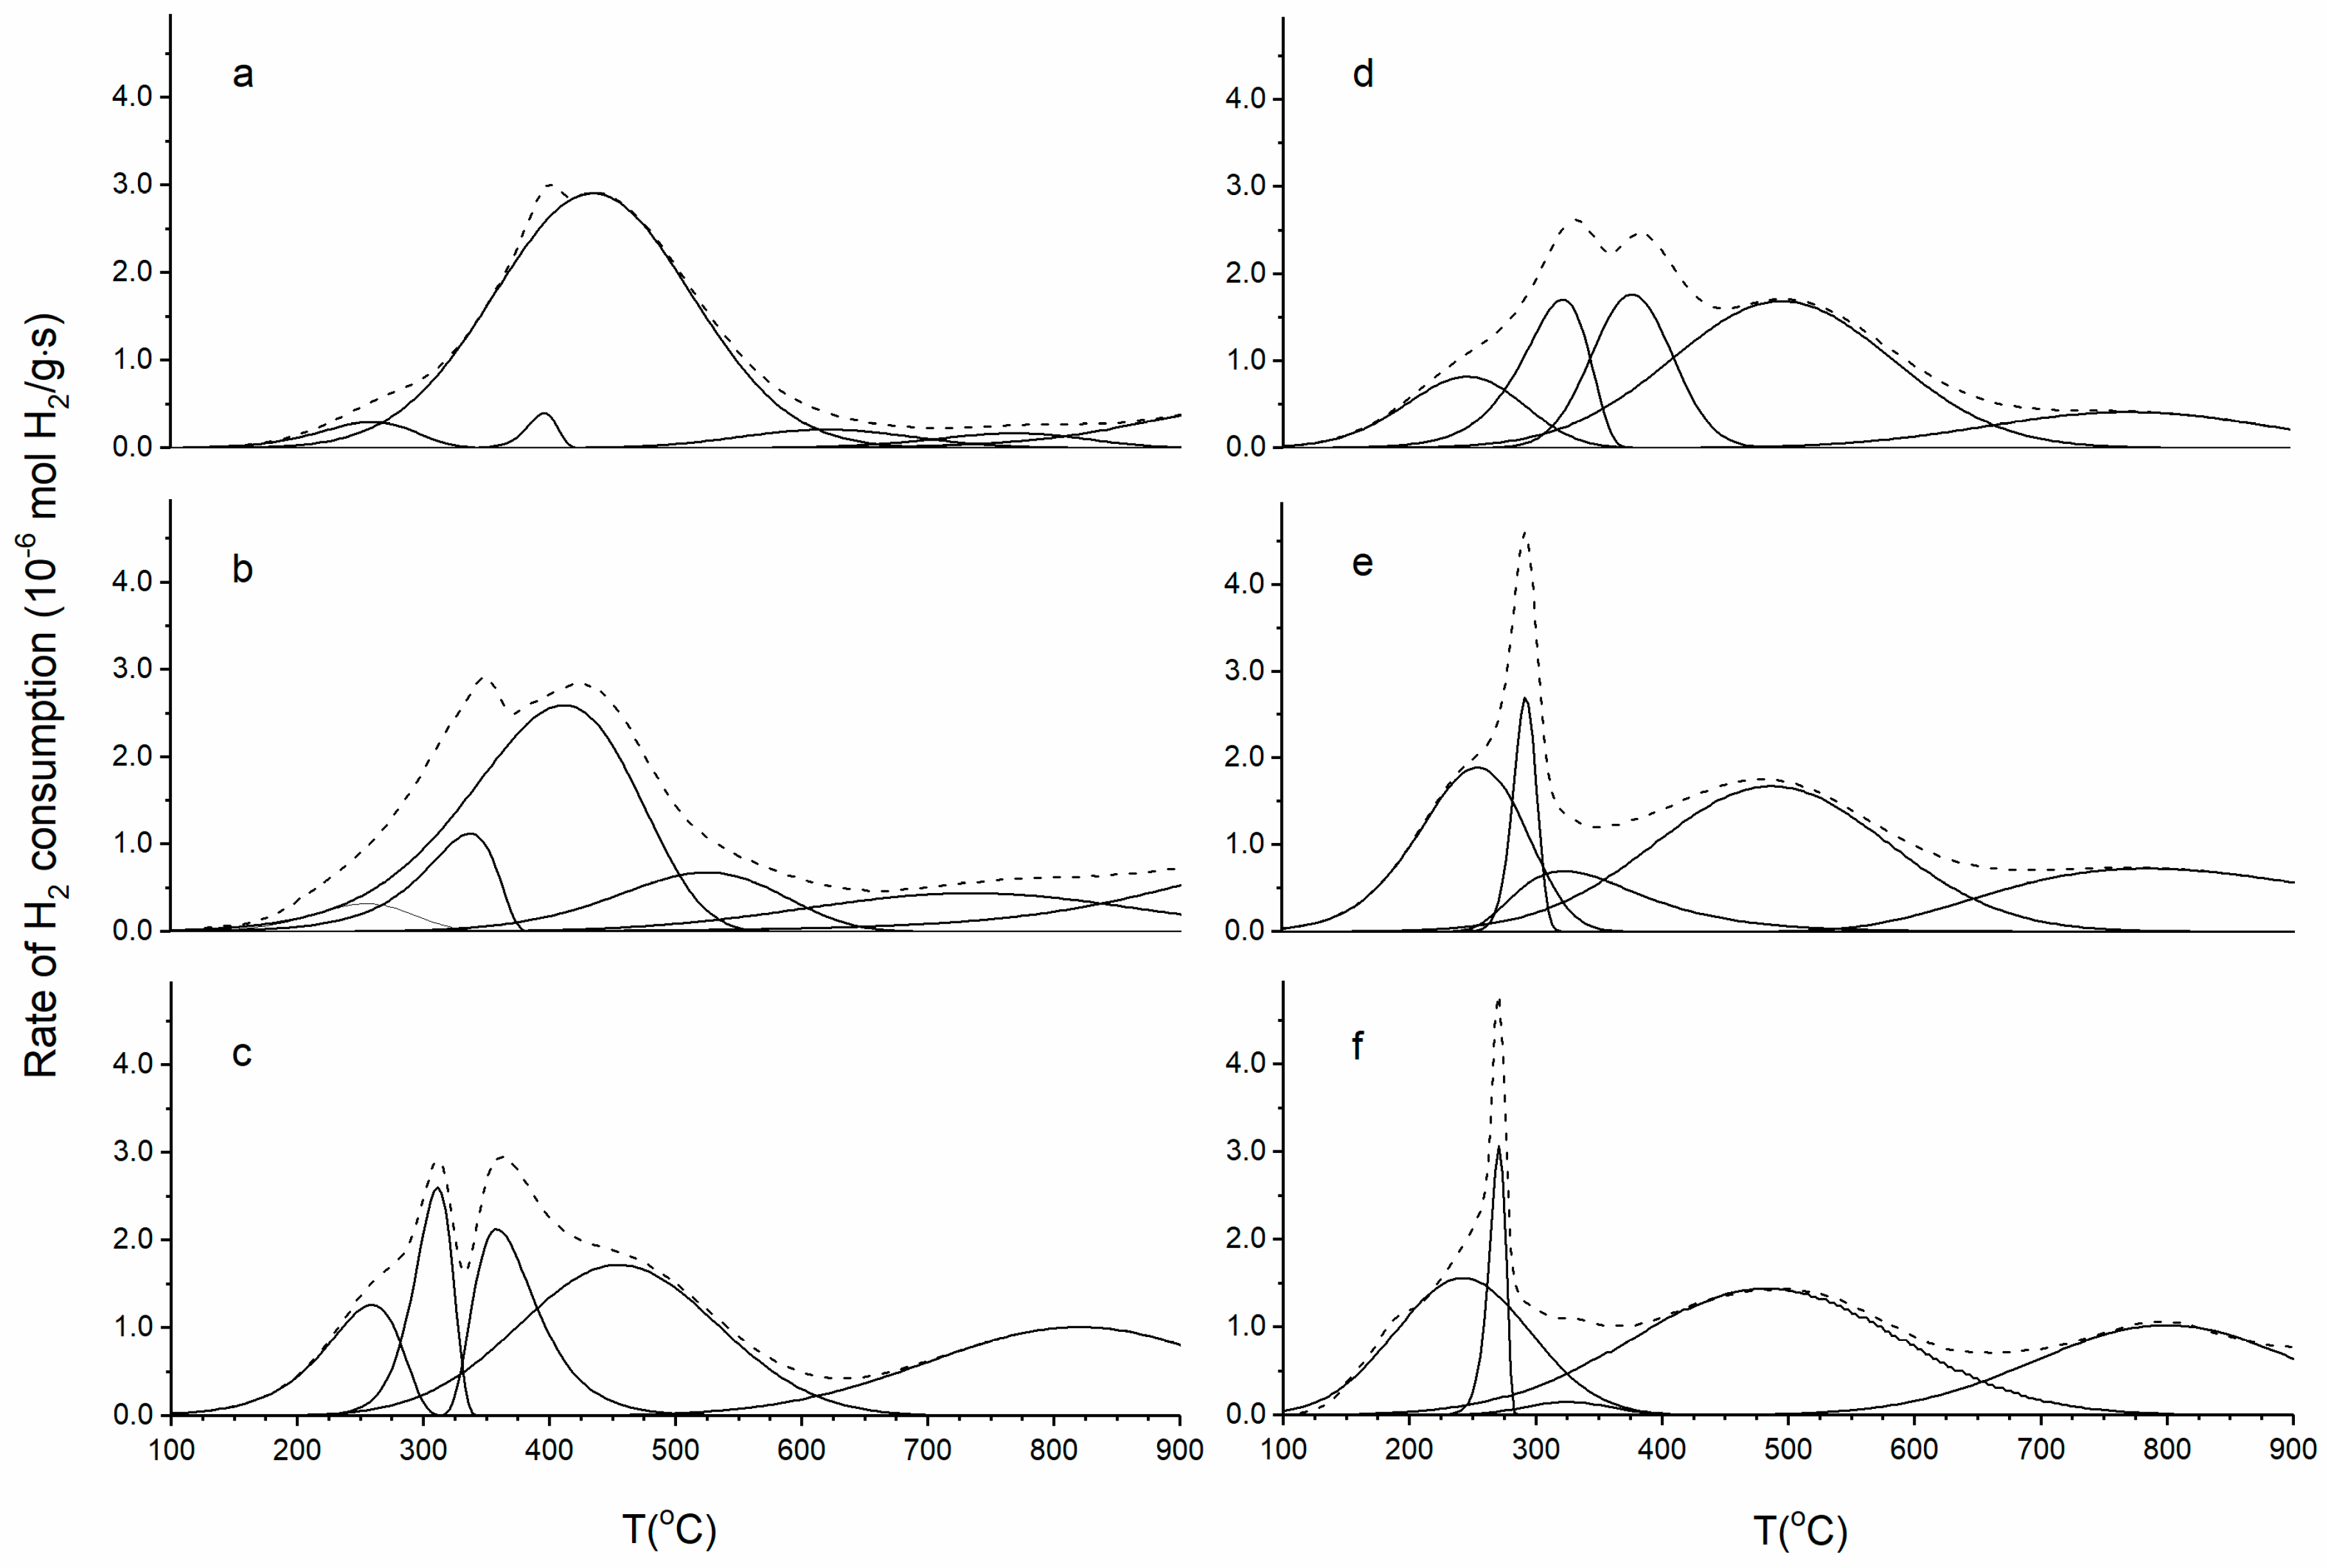
3.5. H2-TPR Analysis

H2-TPR profiles and the values of hydrogen consumption for CexZr1−xO2 samples are presented in Figure 11 and Table 4. The H2-TPR curves of supports showing the intensive asymmetric peak below ~ 700 °C and the high-temperature broad profile are typical for CexZr1−xO2 solid solutions prepared by different routes [3,4,47,48,49,50,51]. The low-temperature peak is usually assigned to the removal of the surface oxygen either regular (main peak) or defect one (a shoulder), while the high-temperature hydrogen consumption is related to reduction of bulk oxygen [3,47,48,49,50,51]. At increasing Ce content in the solid solution, the position of the main peak is shifted to lower temperature showing the increase in oxygen reactivity. A high temperature peak in Ce0.7Zr0.3 profile could be related to the reduction of the cubic phase with a composition close to CeO2 contained in this sample according to the XRD data (Table 2).
To analyze the TPR data, Asymmetric Gauss Decomposition method (AGDM) has been applied (Figure 11,Figure 12, Table 4). The calculated value of the total hydrogen consumption increases with the increase in Ce content but is not straightforwardly related to it: Ce0.3Zr0.7 < Ce0.5Zr0.5 = Ce0.7Zr0.3. The larger share of hydrogen consumed in the high-temperature region for Ce0.7Zr0.3 is due to the presence of a cubic phase with the composition close to CeO2 (Table 2).
The H2-TPR spectra of Ni-CexZr1−x catalysts prepared both by impregnation and one-pot methods are presented in Figure 12. In general, the reduction of all the catalysts starts at a lower temperature, as compared with the pure supports due to hydrogen spillover from Ni species facilitating reduction of CeO2-ZrO2 solid solution [3,4,5,6,13]. The H2-TPR curves of the catalysts shift to lower temperatures at increasing Ce content similarly to the pure supports. The spectra of impregnated catalysts show a broad peak with a double maximum in the region of 314–435 °C (Figure 12). Besides, the shoulder at 460 °C and a broad peak at 820 °C are observed in the spectrum of Ni-Ce0.7Zr0.3im.
The spectra of one-pot catalysts differ from that of impregnated ones. For all one-pot samples, the first clearly marked narrow peak is shifted to lower temperature and the rather resolved peak with the maxima at ~ 500 °C appears (Figure 12). Further, AGDM analysis has been done to describe H2-TPR spectra of the catalysts (Figure 12, Table 4). All the peaks were grouped into three zones for more clear interpretation of TPR data [6,39]. Each zone is related to the predominant reduction of different species. The peaks at temperatures below 300 °C can be assigned to reduction of the surface oxygen species located on clusters of Ni and Ce cations [6,39,52,53], hydrogen consumed at 300–700 °C is related to the co-reduction of CexZr1−xO2 near-surface layers, and NiO particles having different dispersion and degree of interaction with the support [5,6,39,53]. The reduction of the support bulk occurs at the temperatures higher than 700 °C. In all cases, the sum of hydrogen consumed below 700 °C exceeds the value required for complete reduction of Ni2+ contained in the catalysts (0.85 mmol/gcat) (Table 4). In the region of 100–700 °C, the hydrogen consumption evaluated for the one-pot catalysts only slightly exceeds that obtained for the impregnated ones, but the distribution between deconvoluted peaks is various for different series. Thus, for all one-pot catalysts, the hydrogen consumption below 300 °C is substantially larger. Meanwhile, the deconvoluted peaks corresponding to hydrogen consumption in the region of 300–700 °C are shifted to the higher temperatures (500 °C) as compared with impregnated ones (415–470 °C) (Figure 12, Table 4). This indicates more difficult reduction of Ni2+ in the one-pot catalysts that could be explained by stronger interaction of Ni with the supports due to a high NiO dispersion and Ni incorporation into the bulk of Ce-Zr-O solution as XPS data have shown. The correlation between the existence of Ni* state (Figure 10) and more pronounced low-temperature reduction in the case of one-pot catalysts (Table 4) could be because of Ce-Zr-O lattice distortion and generation of additional oxygen vacancies, due to Ni incorporation into the support structure.

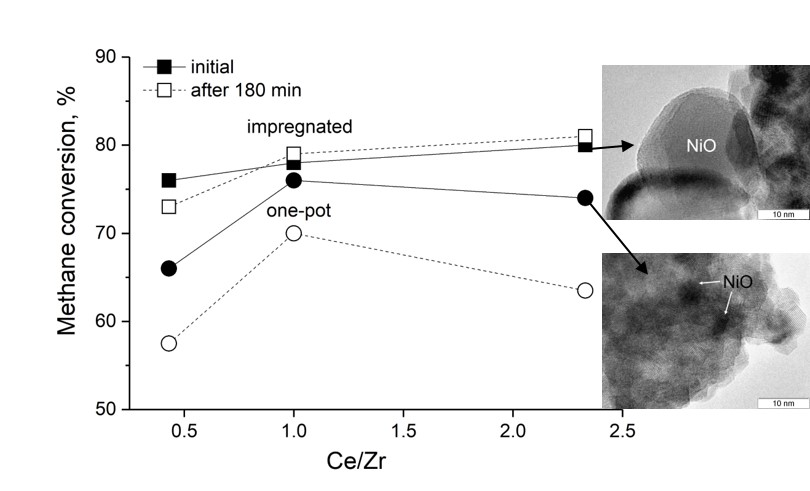
3.6. Catalytic Properties

The time dependence of the CH4 conversion and H2/CO ratio over the impregnated and one-pot catalysts during MDR conducted at 700 °C are presented in Figure 13. In general, both of these parameters are higher over the impregnated catalysts as compared with the one-pot ones. However, for all samples, the CH4 conversions are somewhat lower than those of CO2, and the H2/CO ratio is below 1 (0.8–0.88). The carbon balance is close to 100% in all cases.
All impregnated samples, except for Ni-Ce0.3Zr0.7im (Ce/Zr = 0.43) demonstrating a minor decrease in CH4 conversion, show a stable catalytic behavior during all testing. In contrast, the activity of all one-pot samples decreases with time-on-stream by 6–10% depending on the support composition. Ni-Ce0.5Zr0.5op shows the minimal decrease in the methane conversion as compared with other one-pot samples (Figure 13b).
It is known that concurrently with MDR (Equation (1)) such reactions as reverse water gas shift (RWGS) (Equation (2)), methane decomposition (Equation (3)), and Boudouard reaction or CO disproportionation (Equation (4)) could occur influencing H2/CO ratio and carbon formation on the catalyst surface [2,3,7]. Among these processes only RWGS leads to a higher conversion of CO2 as compared with that of CH4 and also to H2/CO ratio below 1. Therefore, our catalytic data demonstrating X(CH4) < X(CO2) and H2/CO ratio lying in the range of 0.80–0.88 evidence the contribution of RWGS process in the overall reaction.
CH4 + CO2 → 2CO + 2H2, ΔH0 = 248 kJ∙mol−1
CO2 + H2 → CO + H2O, ΔH0 = 41 kJ∙mol1
CH4 → C + 2H2, ΔH0 = 75 kJ∙mol1
2CO → C + CO2, ΔH0 = −172 kJ∙mol−1
It is suggested in the literature that MDR over Ni-CexZr1−xO2 occurs through a bifunctional mechanism when CH4 is activated only on the Ni surface, while CO2 activation proceeds also on oxygen vacancies at/near the Ni-support interface [2,10]. Thus, a high Ni dispersion as well as high oxygen mobility of the support enhance the catalytic activity and resistance to coking. In view of this, a lower activity and stability of the one-pot catalysts with a high dispersion and uniform distribution of Ni is an unexpected result. This could be due to decoration of Ni by support species resulting in a low Ni concentration in the surface layers as TEM and XPS data show (Figure 6d, Table 3). The same effect was observed for 5%Ni/Ce0.6Zr0.4O2 catalyst prepared by impregnation of the mixed oxide, which was synthesized via co-precipitation in the presence of CTAB as a surfactant [7]. It was supposed that this catalyst was not active at all for MDR because of the encapsulation of Ni particles by Ce-Zr oxide particles. In our case, the one-pot catalysts are active in MDR that evidences only a partial Ni decoration. Moreover, estimation of the efficient first-order rate constants k for the initial activity of Ni-Ce0.3Zr0.7 catalysts prepared by both methods (Figure 13a) using well-known integral equation for the ideal plug-flow reactor (-ln(1 − x) = kτ, where x is the CH4 conversion, τ is the contact time [29,30] with a due regard for XPS estimation of the surface concentration of Ni (Table 3) and relating k to the unit of Ni surface revealed that it is equal to 47 s−1m−2Ni and 83 s−1m−2Ni for impregnated and one-pot samples, respectively (the detailed description of the estimation approach is given in Supplementary Materials). As follows from the comparison with H2 TPR data (Table 4), this specific catalytic activity related to the unit of nickel surface perfectly correlates with the amount of reactive surface oxygen removed by H2 at temperatures below 300 °C, the most probably associated with small surface clusters of Ni cations strongly interacting with support.

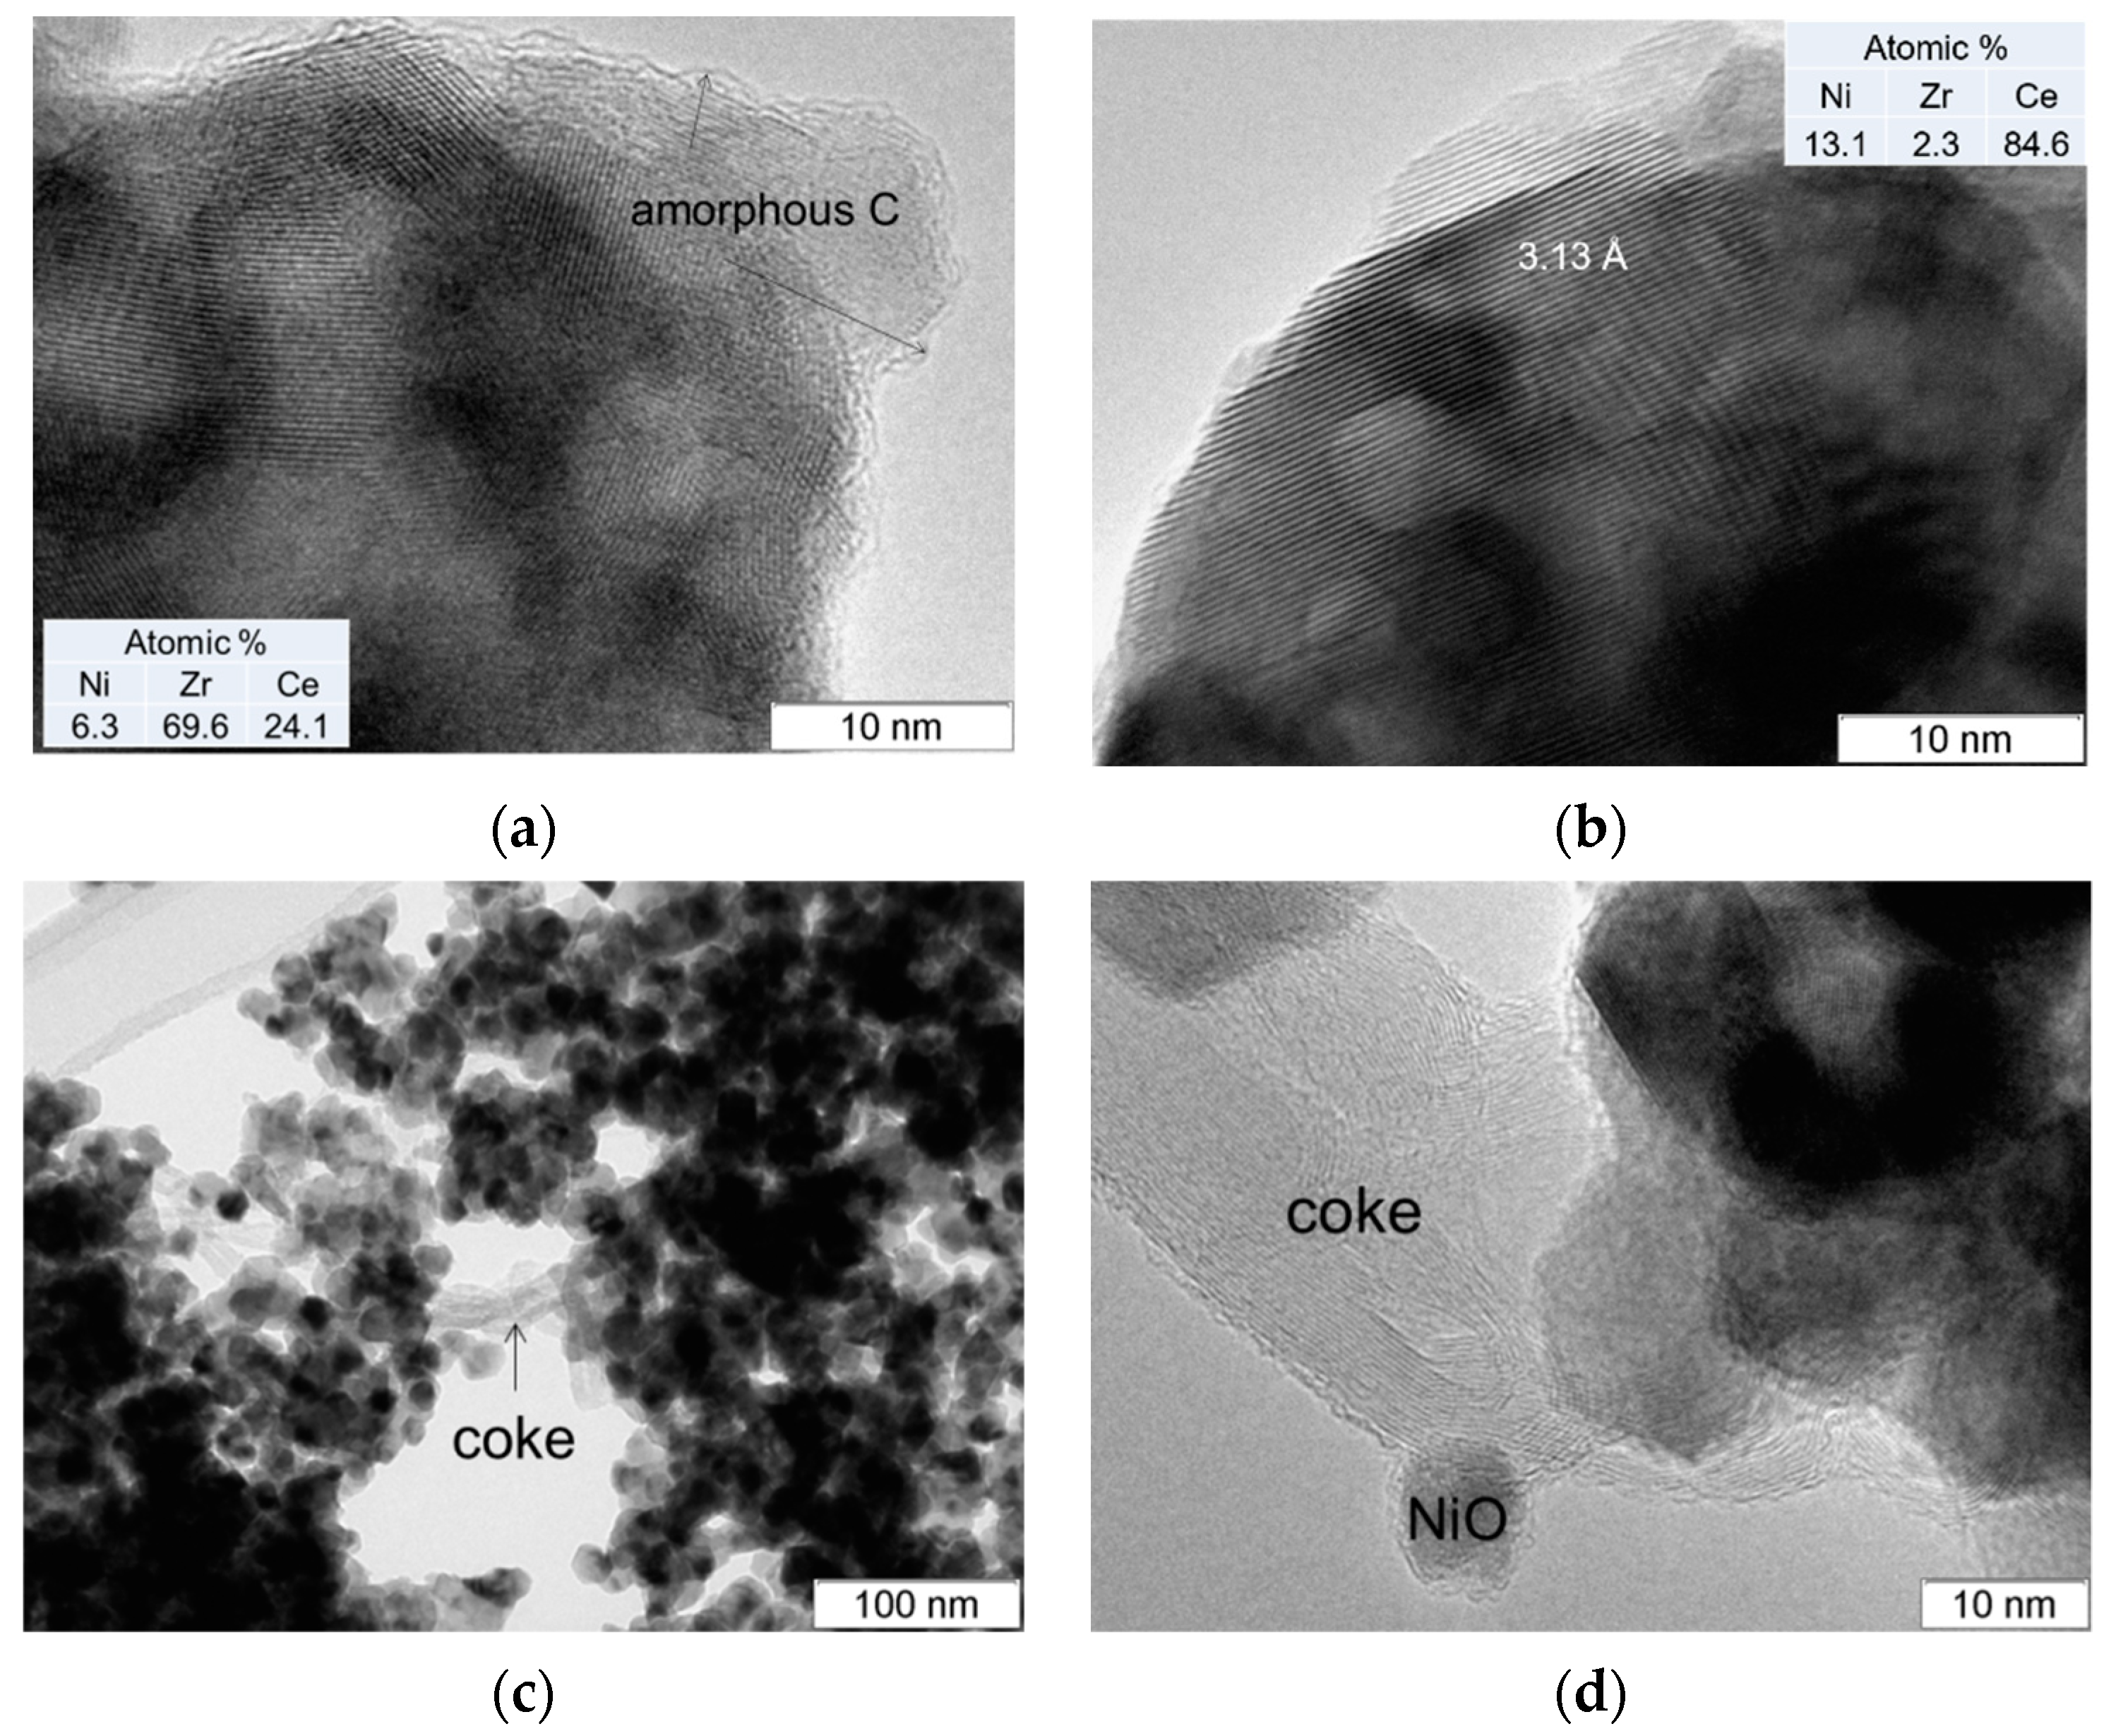
3.7. TEM Analysis of Used Catalysts

The TEM images of used catalysts are presented in Figure 14 and Figure S1–S3. For impregnated samples, Ce-Zr-O agglomerates observed in the initial catalysts break into smaller particles (Figure S1b,d). The well-resolved NiO particles of different size bounded with the support (Figure S1) or detached from the surface by carbon nanofibers are observed (Figure 14d). Such detachment during reduction by CH4 or MDR is typical for the catalysts containing NiO particles slightly bounded with the support (Figure 7c). However, despite incupsulation a part of Ni particles with carbon (Figure S1h), the high MDR activity and stability of the impregnated catalysts is provided by small Ni particles strongly bound with the support surface and Ni species localized on the nanofibers, but not surrounded by them (Figure 14d). It was shown in previous studies [54,55,56] that the metal particles can keep the contact with reagents being on the top of filament thus ensuring the activity of the catalyst.
In the case of one-pot catalysts, Ce-Zr-O agglomerates are retained after their using in the reaction (Figure S2b and S3b). The micrographs of the spent one-pot samples show fuzzy images of Ni(NiO) particles that is due to the presence of thin well-resolved Ce-Zr-O species on their surface. Only amorphous carbon can be found on the surface of Ni-Ce0.3Zr0.7op, and no carbon deposition is observed in TEM images of Ni-Ce0.7Zr0.3op (Figure 14a,b, Figure S2 and S3). The absence of carbon nanotubes in the one-pot samples having very small Ni particles/surface clusters and a stronger metal–support interaction can be explained as follows. The oxygen mobility of ceria or Ce-Zr oxides is reported to play the main role in the elimination of CHx fragments by oxygen species originating from dissociation of CO2. The CO2 activation proceeds on Ni-support interface or nearby region of support and correlates with labile oxygen content of these catalysts [10,57]. To facilitate the removal of carbon species from the metal surface, the metal–support interface must be extended that can be provided by highly dispersed metal particles.
Thus, the TEM results (Figure 14, Figure S2 and S3) as well as TPO profiles (Figure S6) prove that the decrease in activity, which one-pot samples demonstrate with TOS, is not related to carbon accumulation. On the other hand, the migration of reduced ceria moieties onto the surface of Ni particles is widely known [47,58,59]. Due to the extremely small size of Ni particles in one-pot catalysts (fuzzy dark spots of 5–10 nm in TEM images), their surface could be easily covered by Ce-Zr-O support fragments in the conditions of MDR, as Figure 14b and Figure S2 and S3 demonstrate. Therefore, we suggest that a capping effect of the support is a main reason of one-pot catalysts deactivation.

4. Conclusions

In the present work, we have realized a solvothermal continuous synthesis of CexZr1−xO2 with the different Ce/Zr ratio as well as one-pot route for the preparation of Ni-modified Ce-Zr oxides. The admixtures of Ce- or Zr-enriched phases and the formation of Ce-Zr-O aggregates with Ce-enriched surface layer were observed for CexZr1−xO2 with Ce/Zr ≥ 1. The Ce-Zr-O phase composition practically was not influenced by the addition of Ni and synthesis method of the catalysts, while the latter significantly affected NiO dispersion and its interaction with the support. The XRD and TEM data have shown that the one-pot synthesis of Ni-Ce-Zr-O catalysts leads to extremely small NiO nanoparticles/clusters (not observable by XRD), while clearly resolved ones (20–30 nm) are obtained for the impregnated catalysts. Despite the high dispersion of NiO in the initial one-pot catalysts, accessible Ni particles were scarce on the catalysts surface as the XPS and TEM-EDX studies revealed. A stronger metal–support interaction and incorporation of Ni into Ce-Zr-O structure were proposed for one-pot samples based on TEM-EDX, XPS, and TPR data. In accordance with this, the carbon nanotubes were not detected in the one-pot catalysts after reaction, but all of them demonstrated a decrease in reagents conversion during catalytic testing. In contrast, all impregnated samples provided higher activity and stability in MDR despite the carbon filaments accumulation. A capping effect of support due to migration of reduced ceria moieties onto the surface of Ni nanoparticles was therefore suggested as a main reason of one-pot catalysts deactivation in the conditions of MDR.

Supplementary Materials

The following are available online at https://www.mdpi.com/1996-1073/13/14/3728/s1, Figure S1: TEM images of Ni-Ce0.7Zr0.3im catalyst before (a,c,e,g,i) and after MDR tests (b,d,f,h,j) at different magnification. Figure S2: TEM images of Ni-Ce0.7Zr0.3op catalyst before (a,c,e,g) and after MDR tests (b,d,f,h). Figure S3: TEM images of Ni-Ce0.3Zr0.7op catalyst before (a,c,e,g) and after MDR tests (b,d,f,h). Figure S4: Zr3d core-level spectra for the fresh catalysts prepared by impregnation and one-pot method, Figure S5: Ce3d core-level spectra for the fresh catalysts prepared by impregnation and one-pot method. Figure S6: TPO profiles for Ni-Ce0.3Zr0.7op after MDR. Text describing approaches to estimation of specific rate constants.

Author Contributions

Conceptualization, S.P. and M.S.; methodology, M.S., S.P., and V.S.; validation, S.P., M.S., A.-C.R., and V.S.; formal analysis, A.B., S.C., A.I., and A.S.; investigation, A.B., S.C., A.I., V.R., and A.S.; data curation, V.K., V.R., and S.C.; writing—original draft preparation, S.P. and M.S.; visualization, A.B., V.R., V.K., and A.I.; supervision, A.-C.R. and V.S. All authors have read and agreed to the published version of the manuscript.

Funding

This research was funded by NICE project of ERA Net Rus Plus Call and the budget project for Boreskov Institute of Catalysis SB RAS, project no. 0303-2016-0013, registration no. AAAA-A17-117041110045-9.

Acknowledgments

The studies were conducted using the equipment of the Center of Collective Use «National Center of Catalyst Research» at the Boreskov Institute of Catalysis. The authors also acknowledge the resource center “VTAN” (Novosibirsk State University) for the access to experimental equipment (HRTEM).

Conflicts of Interest

The authors declare no conflict of interest.

References

  1. Kumar, N.; Shojaee, M.; Spivey, J. Catalytic bi-reforming of methane: From greenhouse gases to syngas. Curr. Opin. Chem. Eng. 2015, 9, 8–15. [Google Scholar] [CrossRef] [Green Version]
  2. Jang, W.-J.; Shim, J.-O.; Kim, H.-M.; Yoo, S.-Y.; Roh, H.-S. A review on dry reforming of methane in aspect of catalytic properties. Catal. Today 2019, 324, 15–26. [Google Scholar] [CrossRef]
  3. Montoya, J.A. Methane reforming with CO2 over Ni/ZrO2–CeO2 catalysts prepared by sol–gel. Catal. Today 2000, 63, 71–85. [Google Scholar] [CrossRef]
  4. Chen, J.; Wu, Q.; Zhang, J. Effect of preparation methods on structure and performance of Ni/Ce0.75Zr0.25O2 catalysts for CH4–CO2 reforming. Fuel 2008, 87, 2901–2907. [Google Scholar] [CrossRef]
  5. Kambolis, A.; Matralis, H.; Trovarelli, A.; Papadopoulou, C. Ni/CeO2-ZrO2 catalysts for the dry reforming of methane. Appl. Catal. A Gen. 2010, 377, 16–26. [Google Scholar] [CrossRef]
  6. Romero-Nunez, A.; Diaz, G. High oxygen storage capacity and enhanced catalytic performance of NiO/NixCe1−xO2−δ nanorods: Synergy between Ni-doping and 1D morphology. RSC Adv. 2015, 5, 54571–54579. [Google Scholar] [CrossRef]
  7. Wolfbeisser, A.; Sophiphun, O.; Bernardi, J.; Wittayakun, J.; Föttinger, K.; Rupprechter, G. Methane dry reforming over ceria-zirconia supported Ni catalysts. Catal. Today 2016, 277, 234–245. [Google Scholar] [CrossRef] [Green Version]
  8. Roh, H.-S.; Potdar, H.; Jun, K.-W.; Kim, J.-W.; Oh, Y.-S. Carbon dioxide reforming of methane over Ni incorporated into Ce–ZrO2 catalysts. Appl. Catal. A Gen. 2004, 276, 231–239. [Google Scholar] [CrossRef]
  9. Kumar, P.; Sun, Y.; Idem, R.O. Nickel-Based Ceria, Zirconia, and Ceria–Zirconia Catalytic Systems for Low-Temperature Carbon Dioxide Reforming of Methane. Energy Fuels 2007, 21, 3113–3123. [Google Scholar] [CrossRef]
  10. Makri, M.; Vasiliades, M.A.; Petallidou, K.; Efstathiou, A.M. Effect of support composition on the origin and reactivity of carbon formed during dry reforming of methane over 5wt% Ni/Ce1−xMxO2−δ (M=Zr4+, Pr3+) catalysts. Catal. Today 2016, 259, 150–164. [Google Scholar] [CrossRef]
  11. Zonetti, P.C.; Letichevsky, S.; Gaspar, A.B.; Sousa-Aguiar, E.F.; Appel, L.G. The NixCe0.75Zr0.25−xO2 solid solution and the RWGS. Appl. Catal. A Gen. 2014, 475, 48–54. [Google Scholar] [CrossRef]
  12. Bacani, R.; Toscani, L.M.; Martins, T.S.; Fantini, M.C.A.; Lamas, D.G.; Larrondo, S.A. Synthesis and characterization of mesoporous NiO2/ZrO2-CeO2 catalysts for total methane conversion. Ceram. Int. 2017, 43, 7851–7860. [Google Scholar] [CrossRef]
  13. Barrio, L.; Kubacka, A.; Zhou, G.; Estrella, M.; Martínez-Arias, A.; Hanson, J.C.; Fernández-García, M.; Rodriguez, J.A. Unusual Physical and Chemical Properties of Ni in Ce1−xNixO2−y oxides: Structural Characterization and Catalytic Activity for the Water Gas Shift Reaction. J. Phys. Chem. C 2010, 114, 12689–12697. [Google Scholar] [CrossRef]
  14. Adachi, G.-Y.; Masui, T. Synthesis and modification of ceria-based materials. In Catalysis by Ceria and Related Materials; Trovarelli, A., Ed.; Imperial College Press: London, UK, 2002; pp. 51–83. [Google Scholar]
  15. Masui, T.; Fujiwara, K.; Peng, Y.; Sakata, T.; Machida, K.-I.; Mori, H.; Adachi, G.-Y. Characterization and catalytic properties of CeO2–ZrO2 ultrafine particles prepared by the microemulsion method. J. Alloy. Compd. 1998, 269, 116–122. [Google Scholar] [CrossRef]
  16. Trovarelli, A.; Zamar, F.; Llorca, J.; De Leitenburg, C.; Dolcetti, G.; Kiss, J.T. Nanophase Fluorite-Structured CeO2–ZrO2 Catalysts Prepared by High-Energy Mechanical Milling. J. Catal. 1997, 169, 490–502. [Google Scholar] [CrossRef]
  17. Aymonier, C.; Philippot, G.; Erriguible, A.; Marre, S. Playing with chemistry in supercritical solvents and the associated technologies for advanced materials by design. J. Supercrit. Fluids 2018, 134, 184–196. [Google Scholar] [CrossRef]
  18. Darr, J.; Zhang, J.; Makwana, N.M.; Weng, X. Continuous Hydrothermal Synthesis of Inorganic Nanoparticles: Applications and Future Directions. Chem. Rev. 2017, 117, 11125–11238. [Google Scholar] [CrossRef] [Green Version]
  19. Adschiri, T.; Hakuta, Y.; Arai, K. Hydrothermal Synthesis of Metal Oxide Fine Particles at Supercritical Conditions. Ind. Eng. Chem. Res. 2000, 39, 4901–4907. [Google Scholar] [CrossRef]
  20. Cabañas, A.; Darr, J.A.; Lester, E.; Poliakoff, M. Continuous hydrothermal synthesis of inorganic materials in a near-critical water flow reactor; the one-step synthesis of nano-particulate Ce1−xZrxO2 (x = 0–1) solid solutions. J. Mater. Chem. 2001, 11, 561–568. [Google Scholar] [CrossRef]
  21. Kim, J.-R.; Myeong, W.-J.; Ihm, S.-K. Characteristics in oxygen storage capacity of ceria–zirconia mixed oxides prepared by continuous hydrothermal synthesis in supercritical water. Appl. Catal. B Environ. 2007, 71, 57–63. [Google Scholar] [CrossRef]
  22. Kim, J.-R.; Myeong, W.-J.; Ihm, S.-K. Characteristics of CeO2–ZrO2 mixed oxide prepared by continuous hydrothermal synthesis in supercritical water as support of Rh catalyst for catalytic reduction of NO by CO. J. Catal. 2009, 263, 123–133. [Google Scholar] [CrossRef]
  23. Zhang, J.; Ohara, S.; Umetsu, M.; Naka, T.; Hatakeyama, Y.; Adschiri, T. Colloidal Ceria Nanocrystals: A Tailor-Made Crystal Morphology in Supercritical Water. Adv. Mater. 2007, 19, 203–206. [Google Scholar] [CrossRef]
  24. Kim, J.; Park, Y.-S.; Veriansyah, B.; Kim, J.-D.; Lee, Y.-W. Continuous Synthesis of Surface-Modified Metal Oxide Nanoparticles Using Supercritical Methanol for Highly Stabilized Nanofluids. Chem. Mater. 2008, 20, 6301–6303. [Google Scholar] [CrossRef]
  25. Veriansyah, B.; Park, H.; Kim, J.-D.; Min, B.K.; Shin, Y.H.; Lee, Y.-W.; Kim, J. Characterization of surface-modified ceria oxide nanoparticles synthesized continuously in supercritical methanol. J. Supercrit. Fluids 2009, 50, 283–291. [Google Scholar] [CrossRef]
  26. Wang, P.; Kobiro, K. Synthetic versatility of nanoparticles: A new, rapid, one-pot, single-step synthetic approach to spherical mesoporous (metal) oxide nanoparticles using supercritical alcohols. Pure Appl. Chem. 2014, 86, 785–800. [Google Scholar] [CrossRef] [Green Version]
  27. Slostowski, C.; Marre, S.; Babot, O.; Toupance, T.; Aymonier, C. Near- and Supercritical Alcohols as Solvents and Surface Modifiers for the Continuous Synthesis of Cerium Oxide Nanoparticles. Langmuir 2012, 28, 16656–16663. [Google Scholar] [CrossRef] [PubMed]
  28. Slostowski, C.; Marre, S.; Babot, O.; Toupance, T.; Aymonier, C. Effect of Thermal Treatment on the Textural Properties of CeO2Powders Synthesized in Near- and Supercritical Alcohols. ChemPhysChem 2015, 16, 3493–3499. [Google Scholar] [CrossRef]
  29. Smirnova, M.Y.; Pavlova, S.N.; Krieger, T.A.; Bespalko, Y.N.; Anikeev, V.I.; Chesalov, Y.A.; Kaichev, V.V.; Mezentseva, N.V.; Sadykov, V.A. The synthesis of Ce1–xZrxO2 oxides in supercritical alcohols and catalysts for carbon dioxide reforming of methane on their basis. Russ. J. Phys. Chem. B 2017, 11, 1312–1321. [Google Scholar] [CrossRef]
  30. Smirnova, M.Y.; Bobin, A.S.; Pavlova, S.N.; Ishchenko, A.V.; Selivanova, A.; Kaichev, V.; Cherepanova, S.V.; Krieger, T.A.; Arapova, M.V.; Roger, A.-C.; et al. Methane dry reforming over Ni catalysts supported on Ce–Zr oxides prepared by a route involving supercritical fluids. Open Chem. 2017, 15, 412–425. [Google Scholar] [CrossRef]
  31. Anikeev, V.I. Hydrothermal synthesis of metal oxide nano- and microparticles in supercritical water. Russ. J. Phys. Chem. A 2011, 85, 377–382. [Google Scholar] [CrossRef]
  32. Lamas, D.G.; Lascalea, G.E.; Juárez, R.E.; Djurado, E.; Pérez, L.; De Reca, N.E.W. Metastable forms of the tetragonal phase in compositionally homogeneous, nanocrystalline zirconia–ceria powders synthesised by gel-combustion. J. Mater. Chem. 2003, 13, 904–910. [Google Scholar] [CrossRef]
  33. Varez, A.; Garcia-Gonzalez, E.; Jolly, J.; Sanz, J. Structural characterization of Ce1−xZrxO2 (0≤ x≤ 1) samples prepared at 1650 °C by solid state reaction: A combined TEM and XRD study. J. Eur. Ceram. Soc. 2007, 27, 3677–3682. [Google Scholar] [CrossRef]
  34. Scofield, J. Hartree-Slater subshell photoionization cross-sections at 1254 and 1487 eV. J. Electron Spectrosc. Relat. Phenom. 1976, 8, 129–137. [Google Scholar] [CrossRef]
  35. Sing, K.S.; Williams, R.T. Physisorption Hysteresis Loops and the Characterization of Nanoporous Materials. Adsorpt. Sci. Technol. 2004, 22, 773–782. [Google Scholar] [CrossRef]
  36. Lamas, D.; Fuentes, R.O.; Fábregas, I.O.; De Rapp, M.E.F.; Lascalea, G.E.; Casanova, J.R.; De Reca, N.E.W.; Craievich, A.F. Synchrotron X-ray diffraction study of the tetragonal–cubic phase boundary of nanocrystalline ZrO 2 –CeO 2 synthesized by a gel-combustion process. J. Appl. Crystallogr. 2005, 38, 867–873. [Google Scholar] [CrossRef]
  37. Yashima, M.; Arashi, H.; Kakihana, M.; Yoshimura, M. Raman Scattering Study of Cubic-Tetragonal Phase Transition in Zr1−xCexO2 Solid Solution. J. Am. Ceram. Soc. 1994, 77, 1067–1071. [Google Scholar] [CrossRef]
  38. Kim, D.-J.; Jung, H.-J.; Yang, I.-S. Raman Spectroscopy of Tetragonal Zirconia Solid Solutions. J. Am. Ceram. Soc. 1993, 76, 2106–2108. [Google Scholar] [CrossRef]
  39. Mahammadunnisa, S.; Manoj Kumar Reddy, P.; Lingaiah, N.; Subrahmanyam, C. NiO/Ce1−xNixO2−δ as an alternative to noble metal catalysts for CO oxidation. Catal. Sci. Technol. 2013, 3, 730–736. [Google Scholar] [CrossRef]
  40. Koubaissy, B.; Pietraszek, A.; Roger, A.-C.; Kiennemann, A. CO2 reforming of methane over Ce-Zr-Ni-Me mixed catalysts. Catal. Today 2010, 157, 436–439. [Google Scholar] [CrossRef]
  41. Alders, D.; Voogt, F.C.; Hibma, T.; Sawatzky, G.A. Nonlocal screening effects in 2 p x-ray photoemission spectroscopy of NiO (100). Phys. Rev. B 1996, 54, 7716–7719. [Google Scholar] [CrossRef]
  42. Carley, A.; Jackson, S.; O’Shea, J.; Roberts, M. The formation and characterisation of Ni3+—an X-ray photoelectron spectroscopic investigation of potassium-doped Ni(110)–O. Surf. Sci. 1999, 440, L868–L874. [Google Scholar] [CrossRef]
  43. Kosova, N.V.; Devyatkina, E.; Kaichev, V. Mixed layered Ni–Mn–Co hydroxides: Crystal structure, electronic state of ions, and thermal decomposition. J. Power Sources 2007, 174, 735–740. [Google Scholar] [CrossRef]
  44. Kaichev, V.; Teschner, D.; Saraev, A.A.; Kosolobov, S.; Gladky, A.; Prosvirin, I.P.; Rudina, N.; Ayupov, A.; Blume, R.; Havecker, M.; et al. Evolution of self-sustained kinetic oscillations in the catalytic oxidation of propane over a nickel foil. J. Catal. 2016, 334, 23–33. [Google Scholar] [CrossRef] [Green Version]
  45. Daza, C.; Gamba, O.A.; Hernández, Y.; Centeno, M.Á.; Mondragón, F.; Moreno, S.; Molina, R. High-Stable Mesoporous Ni-Ce/Clay Catalysts for Syngas Production. Catal. Lett. 2011, 141, 1037–1046. [Google Scholar] [CrossRef]
  46. Wrobel, G.; Sohier, M.; D’Huysser, A.; Bonnelle, J.; Marcq, J. Hydrogenation catalysts based on nickel and rare earth oxides. Appl. Catal. A Gen. 1993, 101, 73–93. [Google Scholar] [CrossRef]
  47. Bernal, S.; Calvino, J.J.; Cauqui, M.A.; Gatica, J.; Cartes, C.L.; Pérez-Omil, J.A.; Pintado, J. Some contributions of electron microscopy to the characterisation of the strong metal–support interaction effect. Catal. Today 2003, 77, 385–406. [Google Scholar] [CrossRef]
  48. Hosokawa, S.; Imamura, S.; Iwamoto, S.; Inoue, M. Synthesis of CeO2–ZrO2 solid solution by glycothermal method and its oxygen release capacity. J. Eur. Ceram. Soc. 2011, 31, 2463–2470. [Google Scholar] [CrossRef] [Green Version]
  49. Pojanavaraphan, C.; Luengnaruemitchai, A.; Gulari, E. Effect of catalyst preparation on Au/Ce1−xZrxO2 and Au–Cu/Ce1−xZrxO2 for steam reforming of methanol. Int. J. Hydrogen Energy 2013, 38, 1348–1362. [Google Scholar] [CrossRef]
  50. Zhang, G.; Zhao, Z.; Xu, J.; Zheng, J.; Liu, J.; Jiang, G.; Duan, A.; He, H. Comparative study on the preparation, characterization and catalytic performances of 3DOM Ce-based materials for the combustion of diesel soot. Appl. Catal. B Environ. 2011, 107, 302–315. [Google Scholar] [CrossRef]
  51. Wei, Y.; Liu, J.; Zhao, Z.; Duan, A.; Jiang, G. The catalysts of three-dimensionally ordered macroporous Ce1−xZrxO2-supported gold nanoparticles for soot combustion: The metal–support interaction. J. Catal. 2012, 287, 13–29. [Google Scholar] [CrossRef]
  52. Tang, C.; Li, J.; Yao, X.; Sun, J.; Cao, Y.; Zhang, L.; Gao, F.; Deng, Y.; Dong, L. Mesoporous NiO–CeO2 catalysts for CO oxidation: Nickel content effect and mechanism aspect. Appl. Catal. A Gen. 2015, 494, 77–86. [Google Scholar] [CrossRef]
  53. Pino, L.; Vita, A.; Cipitì, F.; Laganà, M.; Recupero, V. Catalytic Performance of Ce1−xNixO2 Catalysts for Propane Oxidative Steam Reforming. Catal. Lett. 2007, 122, 121–130. [Google Scholar] [CrossRef]
  54. Zhang, T.; Amiridis, M.D. Hydrogen production via the direct cracking of methane over silica-supported nickel catalysts. Appl. Catal. A Gen. 1998, 167, 161–172. [Google Scholar] [CrossRef]
  55. San-José-Alonso, D.; Juan-Juan, J.; Illán-Gómez, M.; Román-Martínez, M. Ni, Co and bimetallic Ni–Co catalysts for the dry reforming of methane. Appl. Catal. A Gen. 2009, 371, 54–59. [Google Scholar] [CrossRef]
  56. Villacampa, J.I.; Royo, C.; Romeo, E.; Montoya, J.A.; Del Angel, P.; Monzón, A. Catalytic decomposition of methane over Ni-Al2O3 coprecipitated catalysts: Reaction and regeneration studies. Appl. Catal. A Gen. 2003, 252, 363–383. [Google Scholar] [CrossRef]
  57. Bradford, M.C.J.; Vannice, M.A. CO2 Reforming of CH4. Catal. Rev. 1999, 41, 1–42. [Google Scholar] [CrossRef]
  58. Matte, L.P.; Kilian, A.S.; Luza, L.; Alves, M.D.C.; Morais, J.; Baptista, D.L.; Dupont, J.; Bernardi, F. Influence of the CeO2 Support on the Reduction Properties of Cu/CeO2 and Ni/CeO2 Nanoparticles. J. Phys. Chem. C 2015, 119, 26459–26470. [Google Scholar] [CrossRef]
  59. Caballero, A.; Holgado, J.P.; Gonzalez-Delacruz, V.M.; Habas, S.; Herranz, T.; Salmeron, M. In situ spectroscopic detection ofSMSI effect in a Ni/CeO2 system: Hydrogen-induced burial and dig out of metallic nickel. Chem. Commun. 2010, 46, 1097–1099. [Google Scholar] [CrossRef] [Green Version]
Figure 1. Adsorption–desorption isotherms of CexZr1−xO2 and Ni-CexZr1−xop catalysts: 1—Ce0.7Zr0.3, 2—Ce0.5Zr0.5, 3—Ce0.3Zr0.7, 4—Ni-Ce0.7Zr0.3op, 5—Ni-Ce0.5Zr0.5op, and 6—Ni-Ce0.3Zr0.7op. Note: samples isotherms were shifted along the Y-axis for clarity to avoid superposition.
Energies 13 03728 g001
Figure 2. XRD patterns of CeZrO supports (a) and NiCeZrO catalysts prepared by impregnation (b) and one-pot method (c): 1—Ce0.3Zr0.7; 2—Ce0.5Zr0.5; 3—Ce0.7Zr0.3. #-reflections of NiO phase.
Energies 13 03728 g002
Figure 3. Raman spectra of CexZr1−x O2 supports and Ni-CexZr1−x-op catalysts: 1—Ce0.3Zr0.7, 2—Ce0.5Zr0.5, 3—Ni-Ce0.5Zr0.5-op, 4—Ni-Ce0.7Zr0.3-op, and 5—Ce0.7Zr0.3.
Energies 13 03728 g003
Figure 4. TEM images of Ce0.3Zr0.7 support (a), Ni-Ce0.3Zr0.7im (b), and Ni-Ce0.3Zr0.7op (c) catalysts.
Energies 13 03728 g004
Figure 5. STEM-EDX images for CexZr1−x supports: a—Ce0.3Zr0.7, b—Ce0.7Zr0.3.
Energies 13 03728 g005
Figure 6. The variation of Ce/Zr (a, b, c) and Ni/(Ce+Zr) concentration ratios (d) along different agglomerates (different colors of lines mean different aggregates) calculated from STEM-EDX data: a—Ce0.3Zr0.7, b—Ce0.5Zr0.5, c—Ce0.7Zr0.3, and d—Ni-Ce0.7Zr0.3op.
Energies 13 03728 g006
Figure 7. TEM images of Ni-CexZr1−x catalysts prepared by one-pot method and by impregnation: (a) Ni-Ce0.3Zr0.7im, (b) Ni-Ce0.3Zr0.7op, (c) Ni-Ce0.7Zr0.3im, and (d) Ni-Ce0.7Zr0.3op.
Energies 13 03728 g007
Figure 8. HAADF and STEM-EDX elemental mapping images of Ni-Ce0.5Zr0.5im: green—Zr, blue—Ce, and red—Ni.
Energies 13 03728 g008
Figure 9. HAADF and STEM-EDX elemental mapping images of Ni-Ce0.7Zr0.3op.
Energies 13 03728 g009
Figure 10. Ni2p3/2 spectra for the fresh (a) and reduced (b) catalysts prepared by impregnation and one-pot method.
Energies 13 03728 g010
Figure 11. Temperature-programmed reduction (TPR) curves of Ce-Zr oxides: (a) Ce0.3Zr0.7; (b) Ce0.5Zr0.5; (c) Ce0.7Zr0.3.
Energies 13 03728 g011
Figure 12. TPR curves of Ni-CexZr1−x catalysts: (a) Ni-Ce0.3Zr0.7im; (b) Ni-Ce0.5Zr0.5im; (c) Ni-Ce0.7Zr0.3im; (d) Ni-Ce0.3Zr0.7op; (e) Ni-Ce0.5Zr0.5op; (f) Ni-Ce0.7Zr0.3op.
Energies 13 03728 g012
Figure 13. Conversion of methane and H2/CO during methane dry reforming (MDR) over Ni-CexZr1−x catalysts: (a) Ni-Ce0.3Zr0.7; (b) Ni-Ce0.5Zr0.5; (c) Ni-Ce0.7Zr0.3; (d) dependence of initial (filled symbols) and final (empty symbols) CH4 conversion on Ce/Zr ratio.
Energies 13 03728 g013
Figure 14. TEM images of Ni-CexZr1−x catalysts after reaction: (a) Ni-Ce0.3Zr0.7op; (b) Ni-Ce0.7Zr0.3op; (c, d) Ni-Ce0.7Zr0.3im.
Energies 13 03728 g014
Table 1. Textural characteristics of the CexZr1−xO2 and Ni-containing catalysts.
SampleSSA (m2∙g−1)Vpore (cm3∙g−1)Vmicropore (cm3∙g−1)D 1 (nm)
Ce0.3Zr0.7320.0520.00139.9
Ce0.5Zr0.5420.0470.00025.6
Ce0.7Zr0.3660.0900.00337.5
Ni-Ce0.3Zr0.7im20n.d.n.d.n.d.
Ni-Ce0.5Zr0.5im23n.d.n.d.n.d.
Ni-Ce0.7Zr0.3im50n.d.n.d.n.d.
Ni-Ce0.3Zr0.7op290.04509.8
Ni-Ce0.5Zr0.5op250.0450.001116.9
Ni-Ce0.7Zr0.3op360.0600.00188.9
1 Mean pore size.
Table 2. Lattice parameters and phase composition of CexZr1−xO2 and Ni-CexZr1−xO2op samples.
Samplea (Å)c (Å)c/a’ 1VD (nm)N(Ce) 2W 3 (%)
Ce0.3Zr0.73.686(7)5.291(1)1.01571.9140.34100
Ce0.5Zr0.53.754(1)5.335(2)1.00575.19140.5993
3.674(3)5.27(1)1.01471.16100.284
5.402(3)--157.7110.943
Ce0.7Zr0.33.780(1)5.372(2)1.00576.75140.7186
5.41(1)--158.3140.9714
Ni-Ce0.3Zr0.7op3.677(1)5.277(1)1.01571.3100.29100
Ni-Ce0.5Zr0.5op3.748(1)5.326(1)1.00574.8140.5698
5.405(3)--157.9110.952
Ni-Ce0.7Zr0.3op3.78(2)5.36(7)1.00376.6140.7086
5.410(1)--158.3130.9714
1 a·√2; 2 Ce occupancy in CeO2–ZrO2 oxide; 3 phase content.
Table 3. Surface characteristics of NiCeZrO catalysts.
CatalystCe/Zr[Ni]/([Ce]+[Zr])C(NiO)/C(Ni*)
Ni-Ce0.3Zr0.7im0.330.19100/0
Ni-Ce0.3Zr0.7im reduced0.370.21100/0
Ni-Ce0.3Zr0.7op0.220.060/100
Ni-Ce0.3Zr0.7op reduced0.270.050/100
Ni-Ce0.7Zr0.3im2.70.19100/0
Ni-Ce0.7Zr0.3im reduced1.90.1580/20
Ni-Ce0.7Zr0.3op3.40.100/100
Table 4. H2 consumption during TPR calculated by asymmetric Gauss decomposition method (AGDM).
SampleH2 Consumption (mmol∙g−1)
100–300 °C300–700 °C100–700 °C100–900 °CCeO2-ZrO21
Ce0.3Zr0.700.930.931.07
Ce0.5Zr0.500.940.941.40
Ce0.7Zr0.300.700.701.40
Ni-Ce0.3Zr0.7im0.081.591.671.830.98
Ni-Ce0.5Zr0.5im0.081.461.752.041.19
Ni-Ce0.7Zr0.3im0.251.411.662.221.37
Ni-Ce0.3Zr0.7op0.241.591.832.091.24
Ni-Ce0.5Zr0.5op0.681.231.92.381.53
Ni-Ce0.7Zr0.3op0.640.971.72.171.32
1 Total H2 (100–900 °C) – 0.85 mmol∙g−1 (NiO).

