Article

Dimensioning Methodology of Energy Storage Systems for Power Smoothing in a Wave Energy Conversion Plant Considering Efficiency Maps and Filtering Control Techniques

Centro de Investigaciones Energéticas, Medioambientales y Tecnológicas (CIEMAT), Government of Spain, 28040 Madrid, Spain
*
Author to whom correspondence should be addressed.
Energies 2020, 13(13), 3380; https://doi.org/10.3390/en13133380
Submission received: 28 May 2020 / Revised: 25 June 2020 / Accepted: 28 June 2020 / Published: 1 July 2020
(This article belongs to the Special Issue Energy Storage for Grid Integration of Renewable Energy)

Abstract

:
This paper aims at presenting and describing a dimensioning methodology for energy storage systems (ESS), in particular for one based on flywheels, applied for the specific application of reducing power oscillation in a wave energy conversion (WEC) plant. The dimensioning methodology takes into account the efficiency maps of the storage technology as well as the effect of the filtering control techniques. The methodology is applied to the case study of a WEC plant in operation in Spain, using real power generation profiles delivered into the electric grid. The paper firstly describes the calculation procedure of the efficiency maps for the particular technology of flywheels, although it could be extended to other storage technologies. Then, the influence of using future data values in the dimensioning process and the control of the ESS operation is analysed in depth. A moving average filter (MAF) is defined to compensate for power oscillations, studying the difference between considering prediction and not doing so. It is concluded that a filtering control using future values based on a number of samples equivalent to a 4-min time order provides an important reduction in the energy storage requirements for a power generation plant. Finally, and based on the selection of storage modules previously defined, the efficiency maps, and the MAF used for delivering the power into the grid, an optimal operation strategy is suggested for the storage modules, based on a stepped switching technique. The selection of four flywheel energy storage system (FESS) modules achieves a reduction of 50% in power oscillations, covering 85% of the frequency excursions at the grid.

Graphical Abstract

1. Introduction

European electricity systems are evolving towards high penetration and integration of variable (non-dispatchable) renewable generation (VRG) methods. In order to increase this VRG without compromising the security and reliability of the electric power systems, it is required to enhance the flexibility of the electric networks. The required flexibility, in the short and long term, can be provided by energy storage systems (ESS), among others [1].
One of the most promising emergent sustainable power generation methods is ocean wave energy, with a great number of developers involved in the design of different types of wave energy converters (WEC) [2]. The exploitation of this energy source introduces power oscillations when injecting power into the grid, due to the oscillatory nature of the ocean waves [3].
The power oscillations injected into the grid have a direct and negative impact on the reliability of the power system, causing, from a global perspective, frequency oscillations [4]. In addition, local analyses have shown that power oscillations could cause voltage oscillations [5]. Among the different options for providing short-term flexibility to the grid and reducing the power oscillations in WEC farms [6], electric energy storage systems (EESS) are one of the best possibilities [7,8].
Electrical energy storage technologies are becoming of critical importance in many applications: most of them considered stationary, such as lifts, power generation plants for smoothing power oscillations, and hospitals, while some of them are non-stationary (on board), which include transport applications (electric vehicles, ships and tramways) [9]. There are many ways to classify energy storage devices; the most relevant are based on their nature or on their cycle duration. Based on their cycle duration, the following categories can be determined: short-term storage, which includes electric double layer capacitors (EDLCs), also named supercapacitors, flywheels, and Superconducting Magnetic Energy Storage (SMES) medium-term storage, which includes most battery technologies, and long term storage which includes compressed air (CAES) and hydro pumped energy storage (HPES) [9,10]. The technology selected for this paper, a flywheel energy storage system (FESS), is an electrical energy storage system (EESS) grouped within the kinetic energy storage systems (KESSs).
The main attributes of ESSs are capacity (energy that can be stored), specific energy (capacity per unit of mass), charging/discharging power, and useful life (number of charge/discharge cycles without significant degradation) [11]. In FESSs, the ratio between the power and the energy stored is high and is characterised by a short charge/discharge cycle. This is related to the secondary attributes of ESSs, which are not considered in a first-dimension process; energy efficiency is considered one of them. However, in some applications, efficiency can play a predominant role, such as non-stationary applications (smartphones, electric vehicles, aeronautical satellites, etc.), or technologies with a high energy cost (supercapacitors, flywheels, and some types of batteries). The efficiency must be considered part of the usable energy of the device, since the higher the efficiency, the higher the available energy. Based on that, a smaller amount of usable stored energy is needed to fulfil the requirements in a high efficiency ESS and, indirectly, the size and cost of the selected ESS are reduced.
The majority of ESSs are complex non-linear systems whose efficiency cannot be stated with a number (average efficiency of 90%, for instance) [11,12,13,14,15], since there are several aspects which have to be taken into account: the application (the working cycle), the efficiency of each module and system of the ESS plant (the product of the efficiency of each ESS module), the operating point of the device, and the instantaneous profile of the power supplied by the ESS plant, among others. Based on this, considering the ESS efficiency as a single constant value should be avoided. Instead, a complex evaluation of the efficiency based on a number of parameters (power required, consumed or generated, by system and state of charge (SoC)) is required to properly characterise the ESS system and improve the dimensioning process of the ESS plants. Moreover, that efficiency value must be linked to a specified application and a particular working cycle [16,17].
This work describes a methodology for obtaining smart global efficiency maps for a selected electrical ESS technology (FESS), including the description of a modular reduced-cost flywheel device. Furthermore, the main losses of the device are described. Finally, the obtained efficiency map is applied to a real case study—a wave energy conversion power plant (WEC power plant)—to determine the size of the ESS needed to reduce the power oscillations injected into the grid. Indirectly, this power smoothing reduces the number of events where the frequency oscillations are out of bounds [4] (±150 mHz according to the Spanish grid code [18]). The ESS is dimensioned assuming different smoothing control algorithms, based on moving average filters (MAF) with and without ideal predicted samples. In this document, the results for different smoothing control algorithm conditions, with and without predicted samples, and with different numbers of samples for the MAF, are analysed. Other uses of MAF algorithms in control strategies related to ESS management can be found in the literature. For example, in [19], a similar approach, where the ESS is used to smooth power generated by a wave farm, was presented, but in this case the ESS was integrated into the power uptake of the WECs of the wave farm, being necessary for the design of the ESS and its control in the wave farm design process; in [20], the MAF algorithm was used to manage an ESS in a micro-grid in a sampling time of a few hours, solving a different problem, that of load matching.
Several approaches are also considered in order to improve electric grid sustainability, especially in short-term scenarios, in which the high penetration of renewable power sources (solar, wind, and wave energy resources, among others) will be carried out. The objective of the paper is to describe the dimensioning process of the ESS for a renewable energy plant, which improves grid stability, reduces power oscillations, and optimises the amount of energy needed for the energy storage system [21]. In addition, this paper evaluates the use of predicted values in the MAF control to reduce the amount of usable capacity of the ESS.
The paper is organised as follows: Section 2 introduces the WEC power plant considered as a case study, from which the power generation data is obtained. In Section 3, the FESS module used in the study is presented and its main components are detailed. Section 4 addresses the loss model of an FESS, presenting the methodology for obtaining its complete efficiency map. Following this, Section 5 describes the simulation model considered during the analysis, including the control algorithms used for power smoothing. They are based on moving average windows assuming a short-term prediction algorithm. Moreover, the methodology is applied to the case study of the WEC power plant and the results are presented in Section 6. Finally, some conclusions and recommendations are given in Section 7.

2. Wave Energy Conversion (WEC) Power Plant

The case study considered in this paper is based on a wave energy generation plant located in Mutriku (Spain). Built in the breakwater at the harbour in Mutriku, the plant has been supplying electricity to the grid since 2011. This plant comprises 16 modules of oscillating water column converters (OWC-WECs) of 296 kW rated power, with an overload capacity of 125% [22]. The operating principle of an OWC is based on the effect of the air pressure in a chamber, produced when the wave arrives. The compressed air inside it emerges through an orifice at the top and drives a turbine connected to an alternator that produces electricity. When the wave retreats, a depression in the air chamber is created. An air flow is produced through the turbine in the opposite direction, but spins the turbine and generator in the same direction due to the particular design of the turbine. The scheme of the plant and its main parts are depicted in Figure 1a. Moreover, the functionality of an OWC is displayed in Figure 1b. The power plant allows for power regulation in each turbine and the possibility to install an energy storage plant to adjust the power injected into the grid.

3. FESS Technology Description

Among the various available energy storage technologies, the most convenient for this application are supercapacitors or flywheels. Both are more appropriate for power applications than for energy ones. The particular case of flywheels presents an additional advantage which is the decoupling of power and energy. These parameters are related to the rotating mass and the electrical machine, respectively. In fact, the power and energy levels of some particular flywheels accurately cover the power and energy requirements of power smoothing. In this paper, a high-performance FESS module (basic unit of storage), taking into account cost, usable life and recyclability, is considered to fit the total power and energy requirements, being competitive with other technologies (such as supercapacitors or SMES), and achieving high efficiency. The characteristics of the system are the following:
  • Connecting the FESS to a generic electrical system is performed through a 950V DC link. The scheme of the connection and the main FESS parts is shown in Figure 2a.
  • The power and energy rating characteristics of the FESS are 125 kW and 0.5 kWh, respectively. The maximum power is related to SoC, i.e., the power at each point depends on the speed of the system as illustrated in Figure 2b.
  • In an FESS, the common practice is to set the usable stored energy as 50% of the maximum energy, which fixes the minimum speed value, according to Equation (2). This is related to the efficiency of the energy transformation at low angular speeds [23].
S o C K E S S [ % ] = E E m a x · 100 = 0.5 · J · ω 2 0.5 · J · ω m a x 2 · 100 = ω 2 ω m a x 2 · 100
ω m i n = ω m a x 2 S o C K E S S , m i n = 50 %
where
  • S o C K E S S   [ % ] : FESS state of charge for each speed;
  • E   [ J ] : energy stored in the FESS module;
  • E m a x   [ J ] : maximum energy stored in the FESS module;
  • ω   [ r a d / s ] : speed of the flywheel;
  • ω m a x   [ r a d / s ] : maximum speed of the flywheel;
  • ω m i n   [ r a d / s ] : minimum speed of the flywheel; and
  • J   [ k g · m 2 ] : total inertia of the system (flywheel and switched reluctance machine rotor).
  • A metallic rotor, instead of carbon fibre, is used in order to reduce the cost while maintaining the performance level required.
  • Conventional hybrid angular contact ball bearings are used as a guidance system, with an additional magnetic levitation system. A 3D scheme of the FESS system with all these considerations is illustrated in Figure 3a. Moreover, a picture of the flywheel prototype is depicted in Figure 3c.
  • The flywheel and the rotor of the switched reluctance machine (SRM) are placed in a chamber with low air pressure to reduce windage losses [24,25,26,27], as shown in Figure 3a.
  • The electrical machine topology is a 6/4 SRM used in a magnetic saturated state to maximise its performance. The reasons for using this technology are its robustness, simplicity, low free-wheeling losses, and reliability [28,29,30,31,32,33]. A representation is depicted in Figure 3b. The coils’ manufacture uses Litz wire due to its improvement of the performance of AC currents compared with conventional materials (copper bars). Likewise, other types of materials for the coils and electrical steel could be used using the same methodology.

4. Loss Model and Efficiency Map

One of the main considerations in developing a useful model of a system, with the additional possibility to decide on its most appropriate operation point, is to have complete information about its efficiency in the whole range of operation. In order to answer this question, an efficiency map (similar to the maps developed for other types of engines or machines [34,35,36]) of the specific technology of the FESS was obtained as a function of the operating torque and speed. The efficiency of this system is related to the device losses and the theoretical mechanical power stored in the rotating mass (see Equation (4)). In this paper, the main losses of the FESS taken into account include electromagnetic losses on the electrical machine [37,38], mechanical losses on friction elements and around the rotating mass, power electronics losses, and the consumption of the vacuum pump to maintain the low air pressure inside the chamber. Each of these losses is briefly described in the following points. The detailed process to calculate the power losses was previously addressed in [16] for FESSs and supercapacitors.

4.1. Electrical Machine Losses: Copper and Iron Losses

The complete dynamic, including the main parts of the system (electrical machine [37], power electronics, and spinning mass), was simulated in the software Matlab-Simulink [39] using the SimScape Power Systems toolbox. The model evaluates the current on the coils of each phase and, from it, the skin and proximity effects as well as the Joule losses [40,41]. The copper losses in the entire operation range of the FESS were calculated by analysing the current time series by means of a FFT (Fast Fourier Transform) function.
Regarding iron losses in an SRM, there are different methods [40,42]. In this paper, analytical methods based on electromagnetic simulations with advanced loss surface (LS) models were used. The FESS uses a hysteresis-band current control which can be implemented in this LS model to calculate the switching frequency. This frequency is variable according to the speed and power level supplied by the FESS. Based on the harmonic components of the current profile on each phase, an analysis which takes into account the change in magnetic induction with respect to time ( d B / d t ) can be performed. The results for electrical losses (copper and iron losses) are depicted in Figure 4a.

4.2. Mechanical Losses: Bearings and Windage Losses

Bearings and windage losses are quite relevant because they are not present in other alternative and non-dynamic storage technologies such as supercapacitors. The methodology to calculate friction torque on the bearings is based on the process developed by the company SKF (Gothenburg, Sweden) [43]. The input data for the process are the dynamic load on the bearings, calculated from the equivalent dynamic force over them, and bearing characteristics, selected taking into account the maximum speed, the load ratio, and the operating conditions.
The first step is to fix the air pressure range inside the chamber. In this case, this range was established in a range from 1 to 25 mbar to reduce aerodynamical losses. A vacuum pump, which satisfies the technical characteristics [44], is selected and quantified in terms of consumption. Regarding the calculation process for aerodynamic losses, several sub-models using Computational Fluid Dynamics (CFD) software (ANSYS-Fluent Canonsburg, Pennsylvania, United States of America) allow the evaluation of the aerodynamic losses of the FESS [16,26,27]. These results are calculated as a function of the pressure operation range and speed, obtaining the windage loss map.
Finally, both terms, windage losses and vacuum pump consumption, are taken into account to obtain an optimum operating pressure value of 5 mbar. The total mechanical losses, including the friction losses on bearings, the windage losses and the vacuum pump consumption, are depicted in Figure 4b.

4.3. Power Converter Losses

A electromagnetic model which includes the SRM and the associated power converter was simulated on Matlab-Simulink [39,40,45] to achieve two main goals: firstly, calculating the inductance values, and setting the proper semiconductor module and its associated cooling system; and secondly, calculating conducting time over the IGBTs and diodes and the switching frequency in order to obtain the value of the losses on the power converter [46]. Regarding the converter topology used for the SRM, a three half-bridge IGBT converter was considered [46] in order to maintain full controllability of each phase. The power electronics losses, which include cooling turbine consumption, were evaluated as a function of the speed (affecting the switching frequency, and hence, the commutation losses) and torque (affecting the current, and hence, the conduction losses) of the electric machine of the flywheel. The results of this power loss study are depicted in Figure 4c.

4.4. FESS Loss and Efficiency Map

The last step on the efficiency maps calculation is to apply the superposition principle to obtain the FESS losses; see Equation (3). The efficiency of the system can be calculated with Equation (4).
P F E S S = P i = P P o w e r   C o n v e r t e r + P i r o n + P c o p p e r + P v a c u u m   p u m p + P w i n d a g e + P b e a r i n g s
η F E S S = P m e c P m e c + P F E S S = T · ω T · ω + P F E S S
where
  • P F E S S   [ W ] : FESS total losses as a function of the speed and torque operation;
  • P P o w e r   C o n v e r t e r   [ W ] : FESS power converter losses;
  • P i r o n   [ W ] : iron losses in the SRM of the FESS;
  • P c o p p e r   [ W ] : copper losses in the coils of the SRM;
  • P v a c u u m   p u m p   [ W ] : vacuum pump consumption of the pressure system;
  • P w i n d a g e   [ W ] : aerodynamical losses in the rotating parts of the FESS;
  • P b e a r i n g s   [ W ] : bearing friction losses as a function of the speed and torque operation;
  • P m e c   [ W ] : mechanical power in the flywheel;
  • η F E S S : FESS efficiency as a function of the speed and torque; and
  • T   [ N m ] : mechanical torque in the flywheel.
Figure 5a illustrates the total losses of the device as a function of the SoC, which is related to the speed in a flywheel, and the torque, which is related to the load. Similarly, Figure 5b displays the FESS efficiency map as a function of SoC and torque. As expected, the losses’ dependence on torque is stronger than on SoC. In addition, the maximum efficiency is achieved at rated power, which corresponds with high torque.

5. Case Study: Simulation Model, Control Algorithm and Flowchart of the Dimensioning Process

The case study presented in the paper analyses a power generation profile from the Mutriku wave energy generation plant, based on oscillating water column converters (OWC-WECs) technology, provided by Biscay Marine Energy Platform (BiMEP, Armintza, Bizkaia, Spain) [47]. The study was undertaken for two representative days from the last year. For the sake of an example, the 2 h grid power profile is displayed in Figure 6.

5.1. Simulation Model

The simulation model was implemented in Matlab-Simulink [39] without any additional toolboxes or libraries apart from the basic ones. The model had the following parts: a WEC plant incorporating the power generation profile; an ESS plant involving the FESS and the efficiency maps of each module, represented by lookup tables and basic Simulink blocks; and a power smoothing control algorithm which collected the MAF of the power oscillations to smooth the power injected into the grid [17] (see Figure 7), implemented by blocks of the basic Simulink library. In addition, the model took into account the following parameters: the number of FESS modules needed to achieve the power and energy requirements, the FESS efficiency map, the FESS characteristics of the device (inertia, maximum and minimum speed, maximum current, etc.), the initial SoC of the FESS and its change over time, and the WEC farm power profile and power smoothing control algorithm parameters (see Section 5.2). The control strategy proposed for the ESS plant, with several FESS units available, was “stepped switching”, described as follows. Considering that a number “k” of FESS modules have to reach a power reference ( P F E S S * ), the criterion is to switch on the minimum number of modules, operating them at the maximum power rate. An additional module is only activated when the power needs to be increased and the power limit of the already operating modules has been reached. This strategy has demonstrated to improve the efficiency of the global system since it maintains an optimal operation mode for a maximum time in each energy storage device.

5.2. ESS Plant Control

The ESS installed in the WEC plant for power smoothing is connected at the named point of common coupling (PCC). The PCC is a point on the electric grid located close to a particular load or power supply [48].
The power generated by the WEC plant is filtered by the ESS. As a consequence, average power is delivered into the grid ( P G r i d ) and the rest of the power oscillations are compensated for by the ESS ( P F E S S ) [7], as presented in Figure 7. The ESS required to accomplish that functionality is defined by its power and energy values, which are calculated taking into account historical data from typical/representative power generation profiles. This analysis was carried out by means of a statistical study with different power smoothing control parameters and conditions, as explained in Section 6. Once these parameters have been defined, the power supplied to the grid and the storage power profile can be determined. It has to be noted that the ESS described could be installed in any WEC plant to solve the power oscillations problem since the system uses only the power at the PCC as an input parameter.
The WEC power profile for one day was divided into steps of 15 min for which the power needed by the ESS was calculated. The ESS power ( P F E S S ) considered in this step time was the maximum power required, taking into account both energy delivering and energy storing cases, and the energy storage of the ESS ( E F E S S ) was the peak-to-peak value during the energy storing time profile. This denotes the maximum value of energy storage required considering the power profile (charge and discharge cycle); see Equation (5). Moreover, an example of this calculation is displayed in Figure 8.
E F E S S = [ P F E S S · d t ] m a x [ P F E S S · d t ] m i n
where
  • P F E S S   [ W ] : power value needed to cover the reference value supplied by the control system.
Power smoothing reduces the power oscillations at the PCC, avoiding a certain number of events in the electric grid due to frequency oscillations. The power oscillation level of the power injected into the grid is quantified by means of the standard deviation value ( σ P g r i d ) [4]. The larger the power oscillations, the higher the standard deviation of the power injected. Two different control algorithms to determine the power injected into the grid have been proposed:
  • Moving average filter (MAF).
  • Moving average filter (MAF) considering future (predicted) values.
A moving average filter, also named running average, is based on a calculation to analyse data points by creating a series of averages corresponding with time. In this case, a simple moving average (SMA) was used to calculate the reference smoothed power profile. The SMA is an unweighted mean of the previous “n” data points [49]. The equation to calculate the filters in both cases is the same (see (6)). The main difference is that in the second case the future values of generated power are considered inside the window length of the filter. Both filters can be implemented in the control of the ESS in an iterative way as described in Equation (6):
P s m o o t h * ( t ) = k = 1 W S Δ t 1 ( W S Δ t ) · P W E C ( t ( k 1 ) · Δ t ) P s m o o t h * ( t Δ t ) + 1 ( W S Δ t ) ( P W E C ( t ) P W E C ( t Δ t ) )
where
  • P s m o o t h *   [ W ] : reference value for the smoothed power after MAF application. Considering an ideal ESS, this value represents the power injected into the grid.
  • W S : window length—this parameter represents the number of samples used for the MAF.
  • P W E C   [ W ] : power generated by the WEC plant.
  • Δ t   [ s ] : time step used for each value of the time series. In this case, the power series considered is the WEC-generated power.

5.3. Dimensioning Process Flowchart

The main stages of the ESS dimensioning process for this particular case were defined as follows and are compiled in a flowchart in Figure 9:
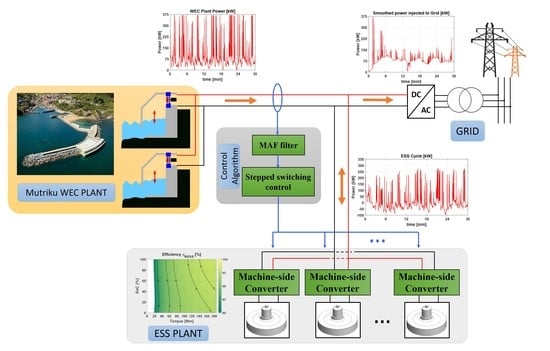
  • The power generation time profile of the WEC plant ( P W E C ) was used as input for a model which defined the energy storage requirements to achieve a certain requirement of power smoothing in the grid. Efficiency maps of the energy storage technology as well as the control filter based on the MAF were included in this model.
  • Using a time profile based on ESS power, the energy and power rating values were calculated for the system ( P F E S S r a t e d and E F E S S r a t e d ).
  • Once the analysis had been done for different control filters, the optimisation process for the MAF parameter was carried out. The first step was to set the value of the window length (number of MAF samples, nMAF). The constraints on this selection are:
    • Minimum number of samples.
    • Maximum reduction of the power oscillation.
  • Due to the independence between the two filter parameters (nMAF and nP), the number of future samples was selected with the objective of minimising the ESS energy required ( E E S S ).
  • Setting the minimum number of FESS modules (nESS) needed to cover a certain number of cases (85% of cases).
All of these points are explained in detail in Section 6.
The flowchart represented in the above figure was implemented in a Matlab script, following a step-by-step structure. Moreover, parametric analysis was performed using the Parallel toolbox in Matlab to reduce computation time.

6. Application of the ESS Dimensioning and Control Algorithms to the Case Study

The dimensioning of an ESS plant involves the characterisation of the different variables in the study. In this case, the parameters were the number of samples of the MAF, the number of future samples or window length of the filter considered in the MAF, and the standard deviation of the power injected into the grid. The first step was to calculate the correlation between these variables, since this allows the setting of the parameters of the filter, with the number of samples of the MAF (nMAF) and the number of predicted samples (nP) being independent from each other. The results of this first step are presented in Figure 10.
From the results in Figure 10, it can be concluded that:
  • The correlation value (nMAF vs. σ P G r i d ) is close to 1. This means that the value of the standard deviation of the injected power is related to window length. As the correlation value is negative for the entire range of predicted samples, the greater the filter window length, the smaller the standard deviation, and the lower the oscillations in the power injected into the grid.
  • The correlation between the number of predicted samples and the standard deviation (nP vs. σ P G r i d ) is very low, almost negligible, for the whole window length range considered in the study. Therefore, the number of samples predicted could be selected independently of the standard deviation for any window length considered.
Once the control filter was selected according to MAF window length and the number of future samples, the results for different filters (different window lengths and number of samples predicted) were analysed.
Figure 11a shows a box graph in which the change in the standard deviation of the power delivered into the grid as a function of the filter window length used is displayed. Beside it, Figure 11b shows the change in standard deviation in two cases (the average value and a value including 95% of the cases in each analysis) as a function of the filter window length. From the graphs in Figure 11a,b the following conclusions can be drawn:
  • The higher the window length or number of MAF samples, the lower the mean value of the standard deviation of the power injected into the grid.
  • Both graphs show the benefits of a higher number of samples, but beyond a window length of 500 samples, the improvement in the reduction of power oscillations is not significant. Therefore, the optimal value for the MAF window length is defined as 500 samples.
The next step in the analysis was to evaluate the influence of the MAF with future samples on the results of ESS dimensioning. The influence of the number of samples predicted on the MAF was evaluated in order to establish whether the MAF filter with predicted values increased or reduced the amount of energy required by the ESS. Figure 12 shows the cumulative distribution function (CFD) of the energy required for different cases of nMAF and nP, increasing the number of samples predicted up to 1000. Focusing on the curve n M A F = 500 , it can be observed that as nP increases, the energy stored required decreases, and therefore, the size of the ESS plant is smaller. The black curve in Figure 12 represents results without future values. As a consequence, a value of n M A F = 500 has been selected.
The conclusion drawn from Figure 12 is that the filter using future values improves the results compared with the filter without prediction. It demonstrates that the use of a prediction algorithm in the control of energy storage plants leads to a reduction in the power and energy requirements of the ESS.
The next step was to set the number of predicted samples for each window length based on the ESS energy required. This value was fixed according to the matrix shown in Figure 13a,b. Figure 13a depicts the ESS energy rating for different MAF window lengths and different numbers of predicted samples. Firstly, the values of the energy required by the ESS to cover 85% of the cases for each filter configuration with MAF window length and number of samples predicted were obtained from Figure 12. Choosing to cover more than 85% of cases does not imply higher improvement in the reduction of power oscillations, and requires a greater amount of ESS energy. Moreover, Figure 14b shows the ratio of energy required by the ESS with respect to the energy needed in those cases with no predicted samples. This matrix can be calculated using Equation (7):
% E r a t e d n P   ( k ) ,   n M A F   ( j ) = E E S S n P   ( k ) ,   n M A F   ( j ) E E S S w i t h o u t   p r e d i c t i o n ,   n M A F   ( j )
where
  • % E r a t e d n P   ( k ) ,   n M A F   ( j ) : the energy ratio required by the ESS to cover 85% of the cases. This value takes into account the energy reduction of the ESS using a predictive filter versus the MAF filter without prediction.
  • E E S S n P   ( k ) ,   n M A F   ( j )   [ M J ] : the energy required by the ESS to cover 85% of the cases for a specific MAF filter, considering a window length with a number of samples “j” and a value “k” of samples predicted.
  • E E S S w i t h o u t   p r e d i c t i o n ,   n M A F   ( j )   [ M J ] : the energy required by the ESS to cover 85% of the cases for a specific MAF filter without prediction, considering a window length with a number of samples “j”.
From Figure 11 and Figure 13, we can conclude that the higher the window length or the number of MAF samples, the lower the mean value of the standard deviation of the power injected into the grid and the higher the ESS energy requirements.
It can be understood from Figure 13b that the number of predicted samples that minimises the energy rating for a MAF filter with a window length of 500 samples is 250 samples. This means that the amount of energy for n M A F = 500 without prediction ( n P = 0 ) is 6.59 MJ, and in the case of using a filter with n P = 250 the energy rating of the ESS is reduced to 5.3 MJ, which is a 20% reduction.
Once the design procedure is performed, the optimised filter includes the values shown in Equation (8). Moreover, in the same equation, equivalence in time is listed in order to establish the order of magnitude of the MAF window.
n M A F = 500   s a m p l e s   ( 250   s   ~   4   m i n ) n P = 250   s a m p l e s   ( 125   s   ~   2   m i n )
Once the optimal control parameters for the moving average filter have been defined, the next step is to select the number of ESS modules required to reduce the power oscillations. Figure 14a shows the power histogram associated with the WEC plant, from which the power value of the ESS could be drawn. In this case, the power level was 350 kW.
On the other hand, Figure 14b displays the joint cumulative distribution function (joint CDF) of two variables, the power and energy of the ESS, in a range of 15 min. In this case, two different curves are marked in red, indicating 85% and 99% coverage of cases for the WEC plant studied, which refers to the percentage of the time in which the power generated by the WEC plant was smoothed. From this figure, the amount of energy and power required by the ESS plant to smooth the power generated 85% of the time can be extracted. Therefore, three FESS modules are needed to satisfy the aim of covering 85% of the cases and smoothing the power generated 85% of the time.
Finally, Figure 15 shows the percentage of utilisation of each FESS module considered as part of the ESS. This graph leads to the following conclusions related to the operation of the flywheels in the system:
  • The first FESS module was activated up to 80% of the time, while the second was only used 20%. This effect is due to the stepped switching control algorithm used. In order to maintain a similar level of ageing among the different FESS modules, a rotating shift should be established, updating the storage module which provides the energy each time.
  • As Figure 15 also shows, the usage time for the fourth and the fifth FESS modules was negligible, which means that the benefits of using more than three FESSs for the dimensioning process are not sufficient, since their operation time is negligible and their cost should be taken into account.

7. Conclusions

Several conclusions can be obtained relating to the dimensioning methodology of the particular energy storage system addressed in this paper.
The efficiency maps calculated provide a practical and commercial-based method of comparing different ESS technologies, since these maps could be calculated for other ESSs, such as batteries, supercapacitors, SMES, etc. The efficiency maps show the main losses and the best way to operate ESS technology. The efficiency maps are useful for optimising the amount of energy needed and, indirectly, the cost of an ESS.
The benefits of using an ESS control strategy with predicted values in the dimensioning process of an ESS comprising the number of ESS modules necessary to achieve the power and energy requirements of a specific power cycle have been analysed and its effects are shown. The predicted values improve the usable capacity of the ESS, since it reduces the energy needed and with it the cost of the ESS plant. The number of predicted samples needed to apply this methodology is related to the period of time of the WEC power profile and the characteristics of the plant. In the case study, the number of samples selected for the moving average filter (MAF) was 500, which is equivalent to 4 min. For future values, 250 samples are the optimum value, representing 2 min. From those values, a conclusion can be deduced: the amount of predicted values is in the order of several minutes due to the period of time of the power generation profile being in the order of around twenty seconds. As a result, the optimum values are obtained when the future values of the MAF window refer to several periods of the power cycle. Therefore, the higher the window length or the number of MAF samples, the lower the power oscillations in the power injected into the grid and the higher the ESS energy requirements. The results show that the solution with future values reduces the energy requirements by 20% with respect to the solution without predicted values, maintaining the rest of the variables, especially the mean value of the standard deviation of the power injected into the grid.
ESS plant dimensioning could be also applied for other ESS technologies or hybrid ESS plants in which several technologies are considered. In particular, a hybrid energy storage system should be a good solution to introduce the required flexibility into power systems and optimise the ESS energy and power requirements. Moreover, the methodology described in the paper could be applied to any WEC plant since the input is the power measured at the PCC and is not affected by the control of the WEC plant.
Once the number of FESS modules required is calculated, an evaluation of their usage time can be addressed. The results of the study show that four FESS modules with the characteristics defined in the paper reduce power oscillations to 50% (covering 85% of cases). Providing the system with additional modules does not result in a better performance being achieved, since their usage time is negligible.
Finally, the methodology could be automated through optimisation algorithms to obtain the optimum values for different parameters (control parameters and the number of ESS modules) in cascade, since there is no relationship among different control filter parameters, or through a multi-objective algorithm.

Author Contributions

J.T., M.B., and M.L. undertook the writing and compiled the sections of the paper; J.T., J.N., and G.N. developed the loss models and the smart efficiency maps; J.T. and M.B. performed the simulation analysis; J.T., M.B., and M.S.-H. analysed the results; J.T. and M.L. wrote the paper; J.N. and M.L. completed the review of the paper. All authors have read and agreed to the published version of the manuscript.

Funding

This research received no external funding.

Acknowledgments

This work was supported by Biscay Marine Energy Platform (BiMEP), which contributed to it by providing the data generated by the wave energy plant in Mutriku.

Conflicts of Interest

The authors declare no conflict of interest.

References

  1. ENTSO-E. European Network of Transmission System Operators for Electricity (ENTSO-E); ENTSO-E: Brussels, Belgium, 2016. [Google Scholar]
  2. EMEC EMEC: European Marine Energy Centre. Available online: http://www.emec.org.uk/ (accessed on 19 March 2019).
  3. Blanco, M.; Navarro, G.; Lafoz, M.; Pérez, J.I. How harmful is the wave energy penetration in an electric grid? In Proceedings of the Twelfth European Wave and Tidal Energy Conference, Cork, Ireland, 27 August–1 September 2017; Lewis, A., Ed.; University College Cork: Cork, Ireland, 2017; p. 942. [Google Scholar]
  4. Villalba, I.; Blanco, M.; Pérez-Díaz, J.I.; Fernández, D.; Díaz, F.; Lafoz, M. Wave farms grid code compliance in isolated small power systems. IET Renew. Power Gener. 2019, 13, 171–179. [Google Scholar] [CrossRef]
  5. Blavette, A.; O’Sullivan, D.L.; Alcorn, R.; Lewis, T.W.; Egan, M.G. Impact of a medium-size wave farm on grids of different strength levels. IEEE Trans. Power Syst. 2014, 29, 917–923. [Google Scholar] [CrossRef]
  6. Lafoz, M.; Blanco, M.; Ramirez, D. Grid connection for wave power farms. In Proceedings of the 2011 14th European Conference on Power Electronics and Applications, Birmingham, UK, 30 August–1 September 2011; pp. 1–10. [Google Scholar]
  7. Lafoz, M.; Pasquotto, M.; Moreno-Torres, P.; Blanco, M. Reduction of power oscillations combining energy storage with prediction techniques. In Proceedings of the 12th European Wave and Tidal Energy Conference, Cork, Ireland, 27 August–1 September 2017; Lewis, A., Ed.; University College Cork: Cork, Ireland, 2017; p. 823. [Google Scholar]
  8. Moreno-Torres, P.; Lafoz, M.; Navarro, G.; Blanco, M.; García-Tabarés, L. Sistema para el acondicionamiento de la potencia eléctrica generada en un sistema de generación undimotriz. 2016, 1–32. Available online: https://www.patentes-y-marcas.com/fr/brevet/sistema-para-el-acondicionamiento-de-la-potencia-electrica-generada-en-un-sistema-de-generacion-undimotriz-p201530980 (accessed on 19 March 2019).
  9. International Electrotechnical Commission. Electrical Energy Storage—White Paper; International Electrotechnical Commission: Geneva, Switzerland, 2011; pp. 1–78. [Google Scholar]
  10. Grbovic, P.J. Ultra-Capacitors in Power Conversion Systems: Analysis, Modeling and Design in Theory and Practice; Wiley–IEEE: Chichester, UK, 2014. [Google Scholar]
  11. EASE; EERA. European Energy Storage Technology Development Roadmap; European Association for Storage of Energy: Brussels, Belgium, 2017. [Google Scholar]
  12. Zhao, C.; Yin, H.; Ma, C. Quantitative efficiency and temperature analysis of battery-ultracapacitor hybrid energy storage systems. IEEE Trans. Sustain. Energy 2016, 7, 1791–1802. [Google Scholar] [CrossRef]
  13. Gatta, F.M.; Geri, A.; Lauria, S.; Maccioni, M.; Palone, F. Battery energy storage efficiency calculation including auxiliary losses: Technology comparison and operating strategies. In Proceedings of the 2015 IEEE Eindhoven PowerTech, Eindhoven, The Netherlands, 29 June–2 July 2015. [Google Scholar]
  14. Patil, V.C.; Ro, P.I.; Kishore Ranganath, R. End-to-end efficiency of liquid piston based ocean compressed air energy storage. In Proceedings of the OCEANS 2016 MTS/IEEE Monterey, Monterey, CA, USA, 19–23 September 2016. [Google Scholar]
  15. Funaki, T. Evaluating energy storage efficiency by modeling the voltage and temperature dependency in EDLC electrical characteristics. IEEE Trans. Power Electron. 2010, 25, 1231–1239. [Google Scholar] [CrossRef]
  16. Torres, J.; Moreno-Torres, P.; Navarro, G.; Blanco, M.; Lafoz, M. Fast energy storage systems comparison in terms of energy efficiency for a specific application. IEEE Access 2018, 6, 40656–40672. [Google Scholar] [CrossRef]
  17. Torres, J.; Navarro, G.; Blanco, M.; González-de-Soto, M.; García-Tabares, L.; Lafoz, M. Efficiency Map to Evaluate the Performance of Kinetic Energy Storage Systems Used with Renewable Generation. In Proceedings of the 2018 20th European Conference on Power Electronics and Applications (EPE’18 ECCE Europe), Riga, Latvia, 17–21 September 2018; pp. 1–9. [Google Scholar]
  18. Spanish Government; REE. Spanish Grid Code: P.O. 1: Funcionamiento de los Sistemas Eléctricos Insulares y Extrapeninsulares; REE: Madrid, Spain, 2006. [Google Scholar]
  19. Yan, Z.; Zhang, X.-P. Master-slave wave farm systems based on energy filter with smoothed power output. Glob. Energy Interconnect. 2018, 1, 559–567. [Google Scholar]
  20. Saidi, R.; Olivier, J.C.; Machmoum, M.; Chauveau, E. Energy management strategy for hybrid power systems based on moving average filters and power forecasting. In Proceedings of the 2018 IEEE International Conference on Industrial Technology (ICIT), Lyon, France, 20–22 February 2018; Volume 2018, pp. 966–971. [Google Scholar]
  21. Beaudin, M.; Zareipour, H.; Schellenberg, A.; Rosehart, W. Energy Storage for Mitigating the Variability of Renewable Electricity Sources. Energy Storage Smart Grids Plan. Oper. Renew. Var. Energy Resour. 2014, 14, 1–33. [Google Scholar]
  22. EVE—Ente Vasco de la Energía EVE—Ente Vasco de la Energía. Available online: http://www.eve.eus/Proyectos-energeticos/Proyectos/Energia-Marina.aspx?lang=es-ES (accessed on 28 November 2017).
  23. Genta, G. Kinetic Energy Storage: Theory and Practice of Advanced Flywheel Systems; Butterworths: London, UK, 1985. [Google Scholar]
  24. Burnand, G.; Araujo, D.M.; Koechli, C.; Perriard, Y. Validation by measurements of a windage losses model for very-high-speed machines. In Proceedings of the 2017 20th International Conference on Electrical Machines and Systems (ICEMS), Sydney, NSW, Australia, 11–14 August 2017; pp. 1–4. [Google Scholar]
  25. Nachouane, A.B.; Abdelli, A.; Friedrich, G.; Vivier, S. Estimation of windage losses inside very narrow air gaps of high speed electrical machines without an internal ventilation using CFD methods. In Proceedings of the 2016 XXII International Conference on Electrical Machines (ICEM), 4–7 September 2016; pp. 2704–2710. [Google Scholar]
  26. Calverley, S.D.; Jewell, G.W.; Saunders, R.J. Aerodynamic losses in switched reluctance machines. IEE Proc. Electr. Power Appl. 2000, 147, 443. [Google Scholar] [CrossRef]
  27. Romanazzi, P.; Howey, D.A. Air-gap convection in a switched reluctance machine. In Proceedings of the 2015 Tenth International Conference on Ecological Vehicles and Renewable Energies (EVER), Monte Carlo, Monaco, 31 March–2 April 2015; pp. 1–7. [Google Scholar]
  28. Moreno-Torres, P.; Lafoz, M.; Blanco, M.; Navarro, G.; Torres, J.; García-Tabarés, L. Switched Reluctance Drives with Degraded Mode for Electric Vehicles. In Modeling and Simulation for Electric Vehicle Applications; InTech: London, UK, 2016. [Google Scholar]
  29. Jack, A.G.; Mecrow, B.C.; Haylock, J.A. A comparative study of permanent magnet and switched reluctance motors for high-performance fault-tolerant applications. IEEE Trans. Ind. Appl. 1996, 32, 889–895. [Google Scholar] [CrossRef]
  30. Zeraoulia, M.; Benbouzid, M.E.H.; Diallo, D. Electric Motor Drive Selection Issues for HEV Propulsion Systems: A Comparative Study. IEEE Trans. Veh. Technol. 2006, 55, 1756–1764. [Google Scholar] [CrossRef] [Green Version]
  31. Stephens, C.M. Fault Detection and Management System for Fault-Tolerant Switched Reluctance Motor Drives. IEEE Trans. Ind. Appl. 1991, 27, 1098–1102. [Google Scholar] [CrossRef]
  32. Mir, S.; Islam, M.S.; Sebastian, T.; Husain, I. Fault-Tolerant Switched Reluctance Motor Drive Using Adaptive Fuzzy Logic Controller. IEEE Trans. Power Electron. 2004, 19, 289–295. [Google Scholar] [CrossRef]
  33. Hennen, M.D.; Niessen, M.; Heyers, C.; Brauer, H.J.; De Doncker, R.W. Development and Control of an Integrated and Distributed Inverter for a Fault Tolerant Five-Phase Switched Reluctance Traction Drive. IEEE Trans. Power Electron. 2012, 27, 547–554. [Google Scholar] [CrossRef]
  34. Hong, G.; Wei, T.; Ding, X. Multi-Objective Optimal Design of Permanent Magnet Synchronous Motor for High Efficiency and High Dynamic Performance. Publ. IEEE Access 2018, 6, 23568–23581. [Google Scholar] [CrossRef]
  35. Imakawa, T.; Chimata, K.; Hoshi, N.; Chiba, A.; Takemoto, M.; Ogasawara, S. Characteristic measurements of switched reluctance motor on prototype electric vehicle. In Proceedings of the 2012 IEEE International Electric Vehicle Conference, Greenville, SC, USA, 4–8 March 2012. [Google Scholar]
  36. Guo, Q.; Zhang, C.; Li, L.; Wang, M.; Pei, L.; Wang, T.; Model, A.L. Maximum Efficiency Control of Permanent Magnet Synchronous Motor System with SiC MOSFETs for Flywheel Energy Storage. In Proceedings of the 2016 19th International Conference on Electrical Machines and Systems (ICEMS), Chiba, Japan, 13–16 November 2016. [Google Scholar]
  37. Raulin, V.; Radun, A.; Husain, I. Modeling of Losses in Switched Reluctance Machines. IEEE Trans. Ind. Appl. 2004, 40, 1560–1569. [Google Scholar] [CrossRef]
  38. Rafajdus, P.; Hrabovcova, V.; Hudak, P. Investigation of losses and efficiency in switched reluctance motor. In Proceedings of the 2006 12th International Power Electronics and Motion Control Conference, Portoroz, Slovenia, 30 August-1 September 2007; pp. 296–301. [Google Scholar]
  39. The Mathworks Inc. MATLAB—MathWorks. Available online: http://www.mathworks.com/products/matlab/ (accessed on 21 October 2017).
  40. Pyrhönen, J.; Jokinen, T.; Hrabovcová, V. Design of Rotating Electrical Machines; John Wiley & Sons: Hoboken, NJ, USA, 2013. [Google Scholar]
  41. Carstensen, C. Eddy Currents in Windings of Switched Reluctance Machines; Aachen University: Aachen, Germany, 2007. [Google Scholar]
  42. Krings, A.; Soulard, J. Overview and Comparison of Iron Loss Models for Electrical Machines. J. Electr. Eng. 2010, 10, 162–169. [Google Scholar]
  43. SKF Bearing Friction, Power Loss and Starting Torque. Available online: http://www.skf.com/group/products/bearings-units-housings/principles/bearing-selection-process/operating-temperature-and-speed/friction-powerloss-startingtorque/index.html (accessed on 28 November 2017).
  44. Vacuum Pump/Integrated OEM Vacuum Pumps for Labs. Available online: https://www.vacuubrand.com/us/page509.html (accessed on 23 October 2017).
  45. Miller, T.J.E. Switched Reluctance Motors and Their Control; Hammond, P., Miller, T.J.E., Kenjo, T., Eds.; Oxford University Press: Oxford, UK, 1993; Volume 31. [Google Scholar]
  46. Krishnan, R. Switched Reluctance Motor Drives: Modeling, Simulation, Analysis, Design, and Applications; CRC Press: Boca Raton, FL, USA, 2001. [Google Scholar]
  47. BiMEP BiMEP Mutriku. Available online: https://bimep.com/pages/mutriku (accessed on 19 March 2019).
  48. Committee, D.; Power, I.; Society, E. IEEE Std 519-2014 IEEE Recommended Practice and Requirements for Harmonic Control in Electric Power Systems; 2014; Volume 2014. Available online: https://standards.ieee.org/standard/519-2014.html (accessed on 19 March 2019).
  49. Bauer, B.N.; Chou, Y. Statistical Analysis: With Business and Economic Applications. J. Am. Stat. Assoc. 1971, 66, 427. [Google Scholar] [CrossRef]
Figure 1. (a) Mutriku wave energy conversion (WEC) plant scheme; (b) Mutriku WEC plant [22].
Energies 13 03380 g001
Figure 2. (a) Basic layout of the flywheel energy storage system (FESS) module connecting to a generic electrical system through a DC link; (b) Maximum power per unit as a function of speed.
Energies 13 03380 g002
Figure 3. (a) 3D FESS unit scheme; (b) 2D representation of the electrical machine; (c) Flywheel unit module of the system.
Energies 13 03380 g003
Figure 4. Main FESS losses with respect to the state of charge (SoC) and torque: (a) Electromagnetic; (b) Mechanical; (c) Power electronics.
Energies 13 03380 g004
Figure 5. FESS maps with respect to the SoC and the mechanical torque on the electrical machine: (a) FESS loss map; (b) FESS efficiency map.
Energies 13 03380 g005
Figure 6. Power generation profile of the WEC plant.
Energies 13 03380 g006
Figure 7. Scheme of the energy storage system (ESS) plant with the control algorithm implemented and the WEC plant connected to the grid.
Energies 13 03380 g007
Figure 8. Scheme of an example of the ESS energy storage calculation.
Energies 13 03380 g008
Figure 9. Flowchart of the ESS dimensioning and control parameter selection methodology.
Energies 13 03380 g009
Figure 10. Correlation between the standard deviation of the power injected into the grid and the window length of the moving average filter (MAF) as a function of the number of predicted samples used in the MAF; correlation between the standard deviation of the power injected into the grid and the number of predicted samples used in the MAF as a function of the number of samples considered in the MAF.
Energies 13 03380 g010
Figure 11. (a) Box and whisker diagram: standard deviation of the power generated by the WEC plant as a function of the number of MAF samples; (b) Standard deviation change in two cases: the average value and a value including 95% of the cases in each analysis, both as a function of the number of MAF samples.
Energies 13 03380 g011
Figure 12. Cumulative distribution function of energy storage required for different window lengths (nMAF) and future samples (nP).
Energies 13 03380 g012
Figure 13. (a) ESS energy rating matrix for different MAF filters (window length “nMAF” and number of samples predicted “nP”); (b) % of rated energy with respect to energy rating with no predicted cases.
Energies 13 03380 g013
Figure 14. (a) Power histogram of the WEC Plant; (b) ESS power rating level and its useful energy with respect to the coverage level curves (the black line corresponds with the FESS module’s power–energy curve).
Energies 13 03380 g014
Figure 15. Percentage of utilisation time per each FESS module of the ESS system.
Energies 13 03380 g015

