1. Introduction
The new paradigm of the Internet of Things (IoT) is changing the way in which we interact with devices in the domestic and non-domestic environment. Conditioning systems are not an exception. We are starting to see air conditioning machines that connect to the Internet. This opens a large amount of opportunities. The control of conditioning systems has always been an interesting research area. It is not only the control of the machine, but also being able to understand what users want. This is even more complex when several users have to control a conditioning machine with a single thermostat. The necessity of physically approaching a device in the wall to either check the temperature at which the machine is operating or to change the thermostat value seems not to be optimal in the new paradigm of IoT and with all users having a smartphone.
We have seen here a new avenue of research that consists of the interconnection of the conditioning systems with the opportunities that are brought by the new IoT paradigm. The thermostats will be able to be changed from the smartphones of users, and users will be able to visualize the operation of the machines using visualization techniques such as augmented reality (AR). The use of the so-called crowd sensing for the acquisition of the opinion of the users with respect to comfort temperature has been explored very little, but the augmented reality techniques are more common in domestic and commercial applications.
Augmented reality can be defined as the superposition of virtual elements over a vision of reality, so that it adds additional information to that reality [
1]. The birth of augmented reality is linked to the virtual reality from its inception and will not be until later, when the augmented reality is sufficiently perfected to separate the two branches. In this work, augmented reality has been considered as a vehicle to improve energy literacy as the reduction of energy consumption in buildings is essential to meet the emission reduction objectives, which has been marked, among other actions, as essential by the European Union [
2]. It has been established that buildings are responsible for up to 40% of emissions in developed countries [
3].
People are not aware of energy waste, partly because of a lack of energy literacy [
4]. There are initiatives such as the FIESTA project, financed by the Intelligent Energy-Europe Program, whose main purpose is to promote new daily consumption habits that are more energy-efficient, especially concerning the use of heating and air conditioning, given that the spending on air conditioning represents 66% of the total use of energy in the home [
5]. Moreover, people often over-turn the thermostat dials when they do not know how to respond to uncomfortable conditions, causing a waste of energy and a worse environment [
6]. To achieve this change of habits that leads to better energy consumption, it is necessary to put the user in perspective, providing the necessary information simply and directly.
The user cannot manage what he/she cannot measure. Making visible the invisible attracts people’s attention [
7,
8], which is why in this work an application for mobile phones and tablets called “Panoptic” has been developed. It makes use of two-dimensional codes (QR (quick response) codes) and augmented reality, intending to show energy consumption in real-time of air-conditioning consoles.
The first study to be highlighted is that in [
9]. This study proposed a power visualization system for industrial machinery. In the study [
10], researchers focused on passive energy efficiency. An application was developed that allowed placing a house on a plot of land and changing the parameters in terms of the orientation of the house, size, proportions, or shade; besides, the user can select the time of day or the season of the year.
The questionnaire through an Internet of Things (IoT) application is based on the thermal comfort standards of ISO 7730:2005. According to the regulation, thermal comfort is defined as “that condition of mind which expresses satisfaction with the thermal environment”. Hence, as a condition of mind, it cannot be standardized and every human being has a different level of satisfaction. Dissatisfaction can be caused by a discomfort of the body as a whole, depending on the indoor temperature, or by a local discomfort, that is, discomfort of one particular part of the body or discomfort caused by warm or cold floor, walls, and/or ceilings (radiant asymmetry).
Both objective and subjective parameters affect people’s thermal comfort and they are resumed through the concept of predicted mean vote (PMV) [
11]. In particular, indoor main temperature, mean radiant temperature, and relative air velocity are requested as objective values, while metabolic rate and clothing insulation are requested as subjective values. In ISO 7730 annexes, tables to estimate the metabolic rate of different activities and the thermal insulation of clothing ensembles are presented. Contrariwise, the objective parameters can be calculated with proper thermal sensors.
A recent approach suggests to apply users-centric models through the use of IoT [
12]. Humans are used as sensors, so that changes in temperature can effectively improve occupants’ comfort [
13]. Researchers implemented several methods to achieve this goal: energy plus simulation [
14], human machine interface [
15,
16,
17,
18], and portable devices, among others. In this context, mobile apps are widely used to evaluate subjective parameters [
19] and to have real-time feedback about thermal sensations [
20,
21]. Li et al. in [
22] gave an interesting contribution to determine the optimum space conditioning mode basing on users’ votes. In most cases, the mobile device is part of a platform that involves other tools, too. For instance, many studies integrated connections to the building management system (BMS) to increase thermal satisfaction and energy-saving [
23,
24,
25]. Likewise, other studies discussed an approach that also considers the heat balance equation of the human body, through both smartphones and wearable devices [
26,
27].
Providing thermostatic control via an IoT platform has several advantages. Among them one can find the fact that the existence of a single thermostat makes difficult the access to control to several of the users of the building, making their opinion less important in the set-point. Moreover, the incorporation of this IoT control makes possible advanced control thanks to access to third party data such as weather prediction or other relevant information that can be accessed over the Internet. On the other hand, IoT platforms can make larger the surface sensitive to suffering cyber-attacks. The incorporation of these systems must always have the necessary security layers to ensure protection against these attacks. In addition to this, the IoT framework allows to include data from third parties, which will allow to make a much more advanced control. We have seen this to be a substantial benefit. Moreover, a two-sided blade is the complexity of the design of the platform, one can see at first that the learning curve is steeper, but as users and building managers get used to the new environment, the improvement in the management of the conditioning systems is worth the extra effort.
With this research, we wanted to evaluate what the behaviour of thermostatic controls based on an IoT democratic platform would be. It was important to test if the dynamics of the occupants of the building can get in resonance with the compensation of the conditioning machines; for this, a framework with the capacity of performing simulations of different scenarios was created. In the same way, this paper aims to investigate if new control algorithms will need to be developed to control platforms such as the one presented here.
It is believed that the new avenue of research that represents the democratic control of thermostats will require scientific frameworks that will allow the investigation of options. The paper here can be a first step in this research, and can be a stepping stone to more detailed research methodologies in this direction.
The rest of this paper is organized as follows.
Section 2 presents the methodology followed in our experiments. The attained results are shown and discussed in
Section 3. The paper ends in
Section 4, highlighting the most important findings.
2. Methodology
This work is based on a mobile application able to combine IoT’s and Augmented Reality (AR)’s potentialities. The work presents an IoT framework that mimics a situation in which users are requested to download a mobile application that collects thermal preferences and that allows them to see the operation of the Heating Ventilation and Air Conditioning (HVAC) through augmented reality.
With this, we want to accomplish the research goal of investigating the kind of response that a democratized IoT-based thermostatic control would have. We designed the framework that allows us to simulate the response that people are likely to have with respect to thermal comfort. To make that possible, we created an app that received the votes of the participants, and we also implemented an algorithm that mimics the response of the occupants for the tests in which the framework is evaluated via simulation. The framework will be tested for a variety of scenarios; the characteristics of the building will only be the lag with which the building will reach the set-point temperature. This can be related to the power of the conditioning machine, and it is sufficient to evaluate the framework.
This framework consists of an app that allows users to report on the thermal comfort at they will, using the personal app that also tells them the operation of the air conditioning machine in an interactive way using virtual reality. This was crucial, as the crowd-sensing philosophy of the reporting of the occupants needed a counterpart for them to read the situation of the conditioning system, as the control of the machine via reporting and with no thermostat forces the need to have another way for them to read the situation of the machine (previously represented by the screen of the thermostat).
2.1. The Comfort Crowd-Sensing Module
The standard ISO 7730:2005 is the most commonly used to regulate the determination of indoor thermal comfort. It is based on the predicted mean vote (PMV) model, which expresses the thermal preferences of respondents on a seven-point thermal sensation scale.
The main challenge of this work was to study a way to make accessible to users all the physical principles behind this theory. As a consequence, we developed an app for this purpose that is intuitive and easy-to-use for respondents. It allows us to bring the normal standard-based questionnaire into a proactive reporting of the users.
The main section of the app is the questionnaire (
Figure 1). The survey includes six items with seven questions. The user is requested to choose an answer among two or three options for every question.
Predicted Mean Vote and Predicted Percentage of Dissatisfied
The reporting aim is to calculate the thermal comfort of respondents, and the aforementioned PMV based on the heat balance of the human body. According to the standard ISO 7730:2005, the thermal balance is obtained when the internal heat production in the body is equal to the loss of heat to the environment. This means that the PMV allows us to predict what users would vote in specific conditions, depending on both personal parameters such as clothing or activity and those relative to the environment such as air temperature.
Objective data about the environment can be collected from thermal sensors, which are able to capture values such as air temperature, mean radiant temperature, relative air velocity, water vapour partial pressure, and convective heat transfer coefficient. When the test starts, users will have to identify the indoor space that they are evaluating, and they will work as subjective sensors, precisely capturing the drivers of discomfort and decreases in productivity, the users themselves.
Concerning heat production of the body, the parameters requested by PMV’s equations can be resumed in two main categories: metabolic rate and clothing insulation. Annex B of ISO 7730 contains the equivalent between metabolism and activities. Nevertheless, a study of Rowe et al. [
28] explains how it is not sufficient to consider activities at the moment of the questionnaire, being necessary to also apply a reduced factor for activities, food, and beverage had in the hour before. A strategy used in literature consists of letting respondents wait at least 30 min (or better a whole hour) in the environment before starting. In this way, it is possible to assure that they did not practice any physical activity in a sufficient time frame, and thus they did not consume any drinks or food that could alter their metabolism. With this method, we can evaluate just the activity performed at present, that is, sedentary activity in the case of students and office workers that we are considering.
For clothing insulation, Annex C of ISO 7730 shows an accurate estimation of thermal insulation owing to clothing ensembles. In particular, it resumes the equivalent value for a typical combination of garments both for work clothing and daily wear clothing. For the aim of this project, combinations are grouped into three main categories: very little warm clothing, warm clothing, and very warm clothing.
As a conclusion, the first item of the survey includes two questions (
Figure 2):
2.1.1. Local Thermal Discomfort
In the previous section, thermal discomfort is considered for the body as a whole. Even so, discomfort can be also caused by local discomfort or thermal asymmetries. In the questionnaire, we created several items to investigate different kinds of local thermal discomfort considered in ISO 7730.
The concept of radiant asymmetry refers to anomalies in temperature of floor, ceiling, and walls. Consequently, users are requested to evaluate whether or not they are satisfied with the following:
Distribution of temperature in the space;
Feet temperature compared with the rest of the body;
Walls and windows temperature compared with the rest of the room.
Moreover, according to the standard, the most common cause of local discomfort is draught. The correspondent three-option item invites the respondents to express their opinion about the following:
2.1.2. Indoor Air Quality
Although air condition does not directly affect the thermal perception of occupants, it does affect the global sensation of dissatisfaction. It is for this reason, and to make sure that the research was holistic, we included a module on the app that would allow users to be compliant with air quality. According to British Standard BS EN 15251:2007 standard, the presence of CO
2 has to be monitored and limited in both residential and non-residential buildings. The required ventilation is based on comfort and health criteria, but a common standard index does not exist for indoor air quality. Hence, the standard proposes the expected percentage of dissatisfied according to three different methods: based on persons and building component, based on ventilation rate per person, based on CO
2 concentration in energy balance. In the questionnaire (
Figure 3), a last three-option item is proposed to estimate the following:
2.2. The Augmented Reality Module
The second part of the experiment, about augmented reality, involves an interaction with the air conditioning (A/C) device. The functionality is based on the reading of a QR code that has been placed in each one of the devices to be monitored. This code includes a unique identifier that will be used to consult, through an application programming interface (API), users’ current consumption level. The panoptic application was developed using Unity3D, a free engine for cross-platform applications. The reason for using this technology is to facilitate integration in a variety of applications. This tool can be used to create applications (primarily games) both in 3D and 2D, cross-platform, using a language of scripting in C# or Javascript. More about the AR app can be read on the
Appendix A.
The Vuforia project allowed to include virtual reality within a project created with Unity. Vuforia is an augmented reality library for mobile SDK. It uses computer vision to recognize and make tracking of flat images and simple objects in 3D in real time. It allows us to position and orient virtual objects, such as 3D models, in relation to the real world in such a way that the user can navigate through the scene keeping the perspective of the virtual object within the real world, leaving it completely integrated into the scene. The library of open-source ZXing that allows us to read QR codes was also integrated. An example of Augmented reality can be seen in
Figure 4.
3. Case Study
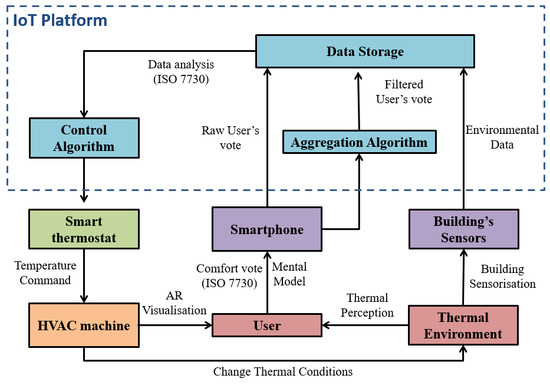
In the case study presented here, we put in place the framework that allows users to have a complete close cycle of interaction with the conditioning machine, and that is based on IoT devices and maximises the satisfaction. The framework is presented in
Figure 5.
In this case study, we used a module representing the user, which makes decisions for comfort according to the predicted mean vote (PMV) as established in the ISO 7730. After this, the IoT platform stores the votes and makes an aggregation with a weighting function that gives more importance to the latest votes in a summative manner.
The aggregation of the votes is used to determine how many (if any) degrees the set-point is modified. It is assumed that the set-point temperature of the HVAC will be achieved by the space in a given time, and so this was implemented in the case study. A lag factor was introduced for the representation of the building. The complete diagram can be seen in
Figure 6.
Using the framework presented here, it was possible to perform a study that allows us to understand the control problem that we are facing when over imposing IoT crowd-sensing to the response of the users according to the PMV method.
3.1. Simulation
The simulations run had a starting point out of the comfort area; more specifically, they were initiated with a temperature of 10 °C. This was done to better evaluate the effect that distortion out of the area of comfort will have in the control system. Moreover, the aggregator was selected to be the summation of the number of votes in each time-step weighted with an accumulative growing series (1, 2, 3, 6, 12,…). This is a preliminary approach, but more research is foreseen in the selection of this algorithm.
The simulation was performed using 50 users and eventually a simulation with 4 users to underpin the effect that relatively small samples could have on the functioning of the algorithm. In the simulations shown here, a proportional controller was chosen. Concerning the users, they were included in the simulation to mimic what would happen if the platform was used by real people. To make sure that the values they voted were realistic, we coded the PMV algorithm shown above. The users are key for the evaluation of this platform, so the algorithm was written with all the parameters to make sure that the response of the simulated users was as accurate as possible.
The controller receives a parameter of dissatisfaction from the aggregation of votes and selects the number of degrees that the thermostat should decrease or increase with a value that has been chosen differently in each simulation to investigate its impact. The building is considered to introduce a lag in the output of the HVAC, leading to a temperature in the space (and perceived by the users) that reaches the set-point temperature after the HVAC has been running for a given time. This delay was fixed differently in each simulation.
3.2. Results of Simulation
Several aspects have to be considered when studying a control system; as the case presented here does not have an analytic expression, we ran several simulations with different parameters to provide light on the phenomenon.
Figure 7 shows a response of the building together with the value of the thermostat chosen by the smart thermostat block, the comfort limits, and the PMV in percentage. We can see in
Figure 7 that the closed-loop system has at least order two, as there exists an oscillation at the beginning of the response. This implies that the control loop can lead to a sub-damped system and an over-damped system. Depending on the requirements of the users, the controller will have to consider this and, overall, must avoid the system getting into resonance and becoming unstable.
The simulation in
Figure 8 was completed with the lag factor that would correspond to a light-weight building. In this case, the temperature set in the thermostat is achieved more rapidly, which causes the period of the oscillation to reduce significantly, resulting in a larger oscillation typical of a sub-damped control system. Although we see that the control system reaches the desired value (within the comfort limits), the oscillations would produce a high level of dissatisfaction in the users. So much is so, that the votes several times reach 40% of dissatisfaction in the group of users. Moreover, it is interesting to see in this graph how the value of the PMV will be seen to have a frequency double to that shown by the temperature of the space. This will have to be taken into account when designing controllers and when sampling the data.
Figure 9 was generated with a simulation performed with a heavy-weight building with a slow response (large lag). This simulation was to prove that, when reducing the gain of the controller in a heavy-weight building, the system does not oscillate and the comfort temperature is reached without oscillations in the PMV. In this case, the function representing the PMV over time is seen to be monotonically decreasing. This is desirable for the users, however, it lacks the speed at which the system is capable of adapting the temperature. When comparing this graph with the previous, one can see that the time at which the system reaches the comfort temperature for the first time is faster in the previous cases than it is in this case. To achieve both objectives, that is, minimising the time of reaching the desired temperature and reducing oscillations, a more complex controller will have to be investigated. This could be based on PID controllers, in model predictive control, when knowing the characteristics of the building or in advanced mechanisms such as fuzzy logic or artificial intelligence.
To demonstrate that the oscillations of the system can have different periods depending on the building at hand, the simulation that leads to
Figure 10 was performed. In this case, the building was taken to have a very slow response (will be equivalent to a heavy masonry building). Compensating the heavy-weight with a high gain will only lead to overcompensation, which results in large oscillations with a large period and a large amplitude, leading to substantial dissatisfaction.
As mentioned before, a high gain in the controller, especially in a light-weight building, could lead to an unstable system. This is shown in
Figure 11. We can see that the system enters into a resonance and that the oscillations in dissatisfaction grow with time. As the PMV function saturates in 100%, the value does not keep growing, which limits the other variables. However, one can see in the first 50 min of the simulation how the control system has failed to turn the temperature of the space to comfortable values.
For the number of users, we investigated the effect that having a limited number of “crowd-sensed” participants may have in the control loop. The PMV provides the stochastic value of the dissatisfied users that one may find for given conditions. This value will be more determined as the number of users grows. However, a limited number of users makes more probable the fact that the votes received are not representative of the situation. This is shown in
Figure 12 and
Figure 13, where the scenario with four users has larger oscillations in the temperature that diverge from the comfort, although the conditions of the building and the control gain are the same.
Looking at the phenomenon that occurs when configuring a control system for comfort based on crowd-sensing, and augmented reality feedback, it is important to realise that the parameters of control must be such that they allow us to (1) reach the comfort temperature as fast as possible, and (2) eliminate (or reduce as much as possible) any overcompensation of the temperature producing rebounds. Because of these two objectives, we generated a battery of experiments that show the time taken to reach a comfortable temperature, and the temperature maximum rebound observed for a variety of cases. Although the parameters of the controllers can be many, we carried out these tests using two: the delay of the building to reach the temperature of set-point, and the gain in the controller. The results are shown in
Table 1.
The table with the different simulations under different parameters provides a clear perspective of how the objectives of minimizing the time to achieve comfort and the overcompensation seem to be conflicting objectives. The case of simulation 4 shows clearly this point. Simulation 4 presents a rather short time to reach the comfort condition. However, it can be seen that the overcompensation is one of the highest. On the contrary, the over-compensation of simulation 9 is rather low (2 °C), but the time to reach comfort is one of the highest (12 min).
It seems then that these kinds of controllers for IoT control of the thermal comfort point to a multi-objective optimisation for the finding of the optimal parameters that minimise time to reach comfort and overcompensation. The result of these types of algorithms is the so-called Pareto front. Pareto fronts are a subset of points of the decision space, in which none of the points are worse than any other point in both objectives. The results of the simulations are shown in
Figure 14.
4. Research Strengths, Limitations, and Further Work
This work shows, to the knowledge of the authors, the first presentation of an IoT solution to democratize thermostats used together with an augmented reality module to make the interaction totally accessible for every single user. The main strength of this work is that it gives light to a rather novel problem. We have seen how a control system of this kind can resonate. This was unseen before and is an important limiting factor of the technology if not handled properly. The study was performed with simulated individuals, so the results have the limitation of coming from a set of equations. The results from real humans may differ, but the general outcomes of the study should stay true. For the further work, it is recommended to test this kind of systems in real setups with a number of participants larger than the dozen, so the system can be evaluated fully.
5. Conclusions
There is little research performed on the possibility of controlling HVAC for conditioning using crowd-sensing within an IoT paradigm. The work presented here aims at evaluating scenarios that may appear when introducing these technologies. For this, a crowd-sensing app was created together with an AR app, which allows the user to both send messages to the HVAC and receive messages from it.
The app, created to provide thermal comfort through crowd-sensing, is connectable to an IoT platform to digest the data and to provide smart controlling of the HVAC’s thermostat.
The data pointed out that the willingness to use the system is directly linked to the educational level of the users. Besides, the will to use the system does not depend on being in charge of the bills.
According to the results obtained in the analysis of the willingness to use the system, it is possible to conclude that it is quite high and very transversal. In terms of the evaluation of the usability of the developed system, even considering that it is still at a very early stage, the result was far above expectations, obtaining a score of 89.6 points on the test, which corresponds to an “excellent” rating, very close to the “best imaginable”.
Within the display models proposed for evaluation, users have chosen the model based on particles as the one that generates more impact on them. They were not especially motivated with specific proposed models to correct a high consumption level, but if they claim that they felt a special urgency to correct a high consumption level, it was when the sound-based model was presented to them. A priori, it seems that models based on particles with sound alerts when consumption is high are the best option.
The complete framework is adequate to perform a theoretical analysis of the behaviour that a control loop based on crowd-sensing would have in real life. The PMV was used as a model of the complaint that the users may rise, but a preliminary aggregator was also included in the framework, which weighs the votes to make sure that the set-point selected minimises the discomfort of the users. Moreover, the thermal inertia of the building is included in the framework as an inertial system.
The tests of the framework were highly valuable. The case study shows that a control based on crowd-sensing is strongly dependent on the control mechanisms that are used in the form of algorithms that aggregate the votes, and in terms of the controller selected. Moreover, the thermal inertia of the building takes a substantial part in the final response, which makes it crucial to understand that the time constant of the thermal transfer phenomena in the building takes part in the response.
The experiments have shown that a bad control system could lead to resonance that causes the system to never converge, so relaxation elements or slow controllers are needed to ensure that the system will always reach comfortable conditions for most users in the shortest amount of time. Indeed, the number of simulations is not large enough to complete a comprehensive study. However, we were able to identify the main situations that one may encounter with this new thermostatic control (over-compensated, un-stable, or under-compensated), so we think the findings are relevant. Moreover, the simulations are enough to show in the Pareto front that the objectives are conflicting. Nevertheless, the results should be taken into consideration with the acknowledgement of the reduced number of simulations.
In conclusion and after observing all the results, it can be said that it is possible to move forward on crowd-sensing controlling of HVAC using IoT devices and comfort capturing. Users will have a human-centric system that is usable, economic, simple, and understandable; that informs in real-time their needs; and that maximises their satisfaction and productivity.

 ,
, 


