1. Introduction
Power system security defines the probability of the system’s operating point remaining within acceptable criteria, given the likelihood of changes in contingencies and the operational environments. The uncertainties in demand load and generation supply concern both operational reliability and the stability of the system. Both system frequency and voltage provide the base for reliable assessments of the system grid. Hence, adhering to frequency and voltage regulations is essential for the operational security of the network in an unforeseen contingency.
Frequency indicates the system’s active power adequacy in system operation. Real-time operation of a power system with high renewable penetration, variable demand loads and renewable power, and frequent generator failures could cause considerable variations in system frequency. Load frequency control (LFC) techniques [
1,
2,
3] are used to address such problems. Over the years, reliability standards such as control performance standards (CPS) [
4] and European Network of Transmission System Operators for Electricity (ENTSO-E) [
5] and assessment methods, such as loss of load probability (LOLP) [
6] and loss of load expectation (LOLE) [
7] have been effective for long-term evaluation and reliability performance assessments of the system grid. Until now, many long-term reliability assessment methods have been effective for system planning. The reliability assessment base such methods on the steady-state probability of grid components. Reliability indices based on steady-state probability components do well for long-term but not short-term reliability assessments, since the steady-state probabilities cannot account for the variability in the operating conditions.
The solution to the abovementioned limitations is the short-term reliability assessment technique. This short-term reliability assessment technique, based on real-time operation information from the SCADA/EMS, performs the reliability assessments based on the state probability of system components. In the last decade, several studies demonstrated methods for short-term evaluation of the system reliability. These methods could be classified as an analytical technique [
8,
9,
10,
11,
12,
13], or Monte Carlo simulation (MCS) approaches [
14,
15,
16,
17,
18]. The analytic technique dwells on physics concepts and precise mathematical models; thereby, performing consequential analysis and probability estimation on the incorporated states of the system [
19,
20,
21]. Nonetheless, the technique requires state-enumeration techniques whose complexity increases exponentially with increasing sampling space. On the other hand, the MCS method chronologically models random samples of grid components and system state; hence, it provides detailed information on the reliability of the system. However, MCS is computationally expensive [
22,
23,
24,
25]; therefore, [
26] proposes a non-sequential Monte Carlo simulation framework for short-term risk evaluation of the composite power system. Nevertheless, it failed to consider renewable energy sources generation inclusion in the framework. In [
27], a hybrid analytical and simulation technique to evaluate the short-term risk of a wind-integrated composite power system, but the hybrid framework only evaluates the probability of the generating system just to meet or fail to meet the expected load for a short time. Short-term evaluation criteria such as failure rate for frequency regulation by Han et al., estimate the failure probability of the grid [
28]. However, this criterion measures the steady-state probability of demand–supply balance failing to incorporate energy storage systems and transient properties, like the droop rate of the generators. [
29] presents a fast sorting technique to select the required system states in descending order probability with the minimum number of computations for online short-term reliability evaluation. However, this technique limits the assessments to selected system states to hasten computational time. In [
30], a technique based on universal generating function and stochastic process methods assesses the time-varying behaviour of large system reliabilities. Even so, this hybrid technique ignores system response for frequency correction error.
Despite the worthy contributions by these works, the reliability assessments procedure was devoid of the system frequency considerations, sufficient modelling of renewable energy sources, and transient-state features incorporation. The system frequency is the heartbeat of the system grid and, therefore, a key measure of power quality. As such, traditionally, system planners and operators define various reliability performance assessment schemes: by setting maximum system frequency deviation constant as a criterion, as shown in
Table 1. This criterion enables operators to plan the necessary resources to ensure system reliability. Ergo, to assess the short-term reliability of the grid, this paper proposes a predictive frequency-based reliability index to evaluate the short-term operational reliability of the power system with considerations of the set criteria, dynamic system response, and system frequency regulation processes.
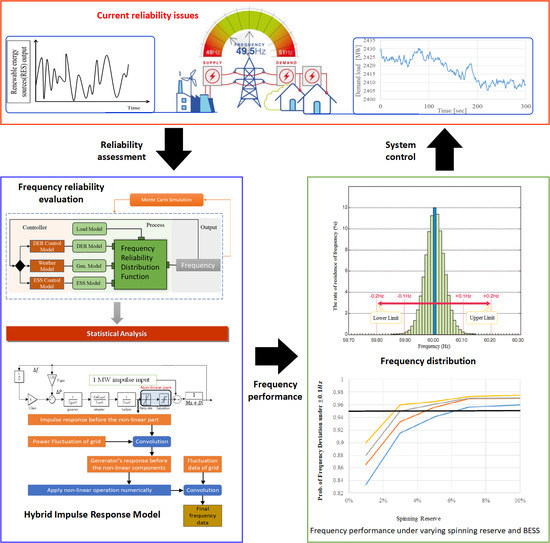
The proposed index could facilitate optimal selection of spinning reserve (SR) capacity during system planning. Optimal SR capacity selection is momentous for the operational reliability evaluation and economic operation of the network. The proposed method addresses the problems mentioned above with forecasted stochastic time-series demand load and renewable energy generation. Practically, it is difficult to forecast the operational reliability of the system for any given specific time. System frequency could be a perfect reliability criterion only if we could predict its magnitude and rate of change inexactitude in real-time. Our motivation, in this regard, is to use the concept of stochastic grid modelling to predict the statistical behaviour of the system frequency. To this end, we propose a method to predict the system frequency statistics called the frequency reliability distribution function (FRDF) as shown in
Figure 1, whose output describes the frequency distribution of the system frequency deviation of the grid over a short period (i.e., 5–10 min). In respect of this, the following outline our contributions to this course:
To develop a short-term stochastic operational reliability index considering system dynamic and frequency regulation processes.
To develop a one-second interpolated prediction load model from a low-sampled load data.
To develop a hybrid-impulse response (HIR) model to shorten the computational time for real-time operational reliability assessment.
To develop selection criteria for optimal SR capacity with a battery energy storage system (BESS) for system economic operation.
The remaining of the paper is organized as follows:
Section 2 discusses the design considerations that we implemented in formulating this new reliability criterion. In
Section 3, we construct a mathematical model with the physical constraints of the system. Finally, several case studies are performed, proving the efficacy of the suggested index in
Section 4.
2. Design Consideration
2.1. Model Structure
Our primary goal was to forecast a statistical representation of system frequency for a specific period, and utilize it for reliability criteria. The output of FRDF was frequency histogram elements (FHE). FHE, a frequency metric, is defined as the probabilistic distribution of sampled system frequency fluctuations existing under specified reliability criteria, for a specified period. Frequency performance distribution index was estimated with FHE. With dynamic stochastic time-series input parameters such as load demand, intermittent renewable generation, forced outage rate of generators, and battery energy storage systems (BESS), FRDF estimated system frequency for performance evaluation. A Monte Carlo simulation repeatedly executed the model to generate time-series system frequency samples. This technique leverages the risk impact and uncertainty in the prediction models. The time series outcome for each trial in the simulation was accumulated and statistically defined to build FHE.
FHE, as shown in
Figure 2, describes the degree of system frequency deviation from its nominal value for a given time under set criteria. Therefore, statistical summaries such as existing probability within a specified deviation range and frequency dispersion could serve as a reliability criterion.
2.2. Stochastic Random Time-Series Input Variables
Each input of FRDF was stochastically generated based on deterministic time-series input variables. However, inputs such as load demand, and renewable energy sources data as recorded by SCADA/EMS systems, were in minutes and higher sampling intervals. Such sampling rates are not adequate for short-term transient analysis, as FRDF performs frequency transient state analysis, with high sampling rates (i.e., 1-s) sampled data. So, for such a simulation, we developed a one-second interpolation load predictive fluctuation model from a 15-min sampled data. The predictive fluctuation model formulation, and its usage in generating random time-series data for sequential input variables, are discussed in the subsequent section.
2.3. Computational Time Limitation
The usage of high-sampled data in the transient-state analysis contributed to the practical evaluation assessment of the system reliability but was computationally expensive. Practically, such analysis involves a complete inclusion of all grid components. However, such additions lead to colossal time consumption and are computationally expensive, even for single scenario simulation. So, we proposed a reduced simulation scheme (RSS) to expedite the computational simulation time, which would not relent on the evaluation performance. The reduced scheme lumps up grid components type, such as load-following generators types, renewable energies, and base loads, as one for each component type. The RSS showed significant computational time reduction when compared with the original grid model. Including the RSS model, nonetheless, for a repeated simulation with much-varying grid components, the computational time was still not desirable. Hence, we introduced an additional analytic method called a hybrid-impulse response (HIR) model. HIR enhances the computational time dramatically compared to the pure numerical simulation model while maintaining the accuracy of the evaluation assessment in a reasonable range. The subsequent section discusses the formulations of both the RSS and HIR models.
3. Estimation Procedure of Short-Term Frequency Reliability Assessment
3.1. Predictive Fluctuation Model
The predictive fluctuation model devised in this work comprises two stages: load fluctuation estimation and low-sampling load interpolation, as shown in
Figure 3. The load fluctuation model defines a relationship between a low-sampled predictive load period and its load fluctuation distribution for dynamic load fluctuation estimation. To derive such a relationship, we simulated the load fluctuation based on an actual investigation of a 15-min data sample and 1-s sampled data.
From the sample data, we obtained deviation data by measuring the difference between adjacent sample points for each sample data. Outliers and missing data were respectively compensated for and removed by a preprocessing algorithm. Following this, a normalized histogram was fitted to the sample deviation data, as shown in
Figure 4, to define a load fluctuation distribution. For the low-sample distribution to be adapted for transient state analysis, which requires high-sampling data, the correlation between a high-sampled and low-sampled data should be evident. From the simulation results, for a 3-h sampling period, it is evident that there was a positive correlation between the distributions mentioned above with a correlation coefficient of 0.67 at a 95% confidence interval. Hence, low-sampled low fluctuation could suffice for transient state load fluctuation estimation. Algorithm 1 details the procedure for the modelling process.
| Algorithm1: Algorithm for the load fluctuation model. |
| Input: Time-series 15-min instantaneous load data. |
| Output: Probability mass function (PMF) of load fluctuation. |
| 1: | Choose a load profile, L1 from accumulated interpolated simulated historical data. |
| 2: | For each chosen load profile, L1, sample the load profile into a set of ranges, Rn based on a defined sampling interval, k. and . |
| 3: | Define , where is the power at the time, t for the T sampling period. . |
| 4: | For a defined range , estimate the deviation, , where . |
| 5: | is normalized as , where . |
| 6: | Fit a histogram to . From the histogram, we estimate the error distribution. |
| 7: | Repeat the process for all k. |
| 8: | Fit a model to estimate k with the minimum estimation error. |
Following the load-fluctuation model was the interpolation model definition. With an initial forecasted value, the interpolation model estimated interpolated pseudo-1-s values for a given sampling period based on a one-dimensional random walk algorithm. The interpolated values were estimated based on the load fluctuation and error distribution function for the given forecast period. Successive values were estimated based on the previous value, random load fluctuation, and error distribution, and are shown in Equation (1).
With a known dataset, the efficacy of the proposed model was verified. An actual set sample of demand loads: 1-s sampled data and 15-min sampled data were acquired from the Korea Power Exchange company [
33] for the evaluation of the proposed model. The results of the assessment, as depicted in
Figure 5, showed high similarities in the patterns of the original 15-min sampled demand and the corresponding 1-s sampled demand load data. The statistics of the evaluation results proved the efficacy of the proposed model. The error margin associated with the predictive model was minimal with a goodness of fit, 0.041 root mean square error (RMSE). The predictive model was adapted in estimating the fluctuation and interpolation for each stochastic input variables.
In the case of the demand power model, time-series data was randomly generated stochastically based on the aforementioned predictive model. With a 15-min sampled demand value and the assumption that the fluctuation in the demand data happening in every second was independent of each other, the predictive model was utilized to forecast a demand load profile for the transient state analysis of the frequency reliability. Similarly, wind power dynamic data input was generated with the proposed predictive fluctuation model. A time-series wind power profile was created based on forecasted wind speed, the rated power of the wind turbines, and the size of the wind farm. Based on a known (i.e., in this case, 490 kW) wind power generator data, and wind power generation curve, a corresponding relationship between the wind speed and the power was defined.
3.2. Reduced Simulation
A simplified simulation reduction scheme was devised to minimize computational simulation time. The model was made up of base generators, load-following generators, renewable energies, and battery energy storage system (BESS). With this model, a set of generators, demand, wind power, and BESS were connected, as shown in
Figure 6. The reduced scheme lumped up grid components type, such as load-following generators types, renewable energies, and base loads, with one for each component type to form a virtual grid to hasten the computational time. However, in a real-world scenario, such a phenomenon could be discretely applied considering the most common parameters among the committed set of generators. The model has stochastically modelled inputs: demand load, generators, and wind power, along with the control schemes of each resource type. For the BESS control, a high-pass filter was employed to consider the energy-limiting feature. Variable factors such as rate of spinning reserve, BESS capacity, the number of wind turbines were also defined in the model.
The RSS framework adopted in this work mimics the real-world scenario. In evaluating the reliability of the power system, the forced outage rate is applied to the generators. For each simulation trial, generators are selected based on the MTTF and MTTR parameters specified in Equation (2) from the total number of generators in a generating unit.
The selection of the generators was done by the stochastic estimation of the forced outage rates of the generators. The forced outage rate of a generator in a given period indicated the operational status and the maximum amount of power supplied. This phenomenon is wildly adapted in long-term reliability evaluation such as LOLP. However, concerning our proposed model, as stated earlier, our prime goal was to evaluate the reliability of the system for a short period. Hence, our interest lies in the probability that the grid balance was achieved with the total demand power and the entire supplied generation. Therefore, for each given scenario, we estimated the failure probability of the already determined generators in the units. The failure probability in this analysis was defined as the reciprocal of the MTTF, which is expressed in (3).
Six (6) different types of generator units with different characteristics were used in the simulation. The oil/steam generators U100 and U197 were utilized as load-following generators to make up the power imbalance in the system. Other generators units such as U400 (i.e., nuclear) were used as a base generator of which the output power was maintained continuously. Due to the adjustment of the spinning reserve, the number of generators and their operating rate were configured deterministically and deployed in different scenarios. The spinning reserves used in the various simulations was varied between 1–10%. Based on Equation (3), the failure probability of each generator was estimated.
In the course of the statistical estimation of the frequency deviation, the frequency control scheme and relative performance parameters, such as the droop-rate of the generators, were considered. The area control error was distributed among the allowable generators and the BESS. These errors were filtered by two filter components: low-pass filter and high-pass filter based on the fluctuation rate. Higher frequency fluctuations were filtered by the high-pass filter, whereas the low-pass filter filtered lower frequency fluctuations. The BESS control model dealt with the higher frequency fluctuations, while the remainder of the load fluctuations went to the load-following generators according to their droop-rates. The BESS model connected the energy storage batteries to the power grid. A cutoff frequency of Hz was defined for every 10 min cycle. The time constant was considered as a mechanical delay. The incorporation of BESS for LFC was as a result of its high response rate as compared with conventional generators. As a result, BESS could discharge energy faster to respond to higher load variations. BESS was combined with the spinning reserve for each simulation scenario. The effect of BESS on load variations was observed by varying the BESS capacity between 0–150 MW on an interval of 50 MW. A 490-kW rated capacity wind turbine generators (WTGs) with two different wind speeds: 5 m/s and 10.1 m/s were deployed in the simulation. The penetration levels of the wind turbines were varied at 0%, 30%, 60%, and 100% of the committed wind generators. The purpose of these variations was to measure the effect on the system frequency with increasing intermittencies in wind power generation.
3.3. Reliability Evaluation Method
For short-term reliability evaluation, traditionally, grid operators analyze the behaviour of the frequency by using a defined criterion to maintain the reliability and stability of the system operation. This standard has become a convention for reliability evaluation. In this work, the structure of the model, as shown in
Figure 7, defined our reliability evaluation processes.
The quantitative index representation of β can be defined, as shown in (15).
where
and
are defined as the mean factor of safety and standard deviation of the factor of safety, respectively.
can be express in terms of the rate of system frequency change and the total number of critical elements (
N).
Similarly,
can be expressed in terms of dispersion of system frequency and
N.
With this process, the frequency reliability was estimated based on the set reliability criteria. The output frequencies from FRDF formed a frequency distribution using a histogram. From this, frequency performance index as a reliability index was estimated to determine the reliability of the system. The system reliability index, β, can be defined in terms of the rate of system frequency change () and dispersion of system frequency change (), as shown in Equations (4) and (8), respectively, where is the frequency change under specified criteria ().
3.4. Hybrid Simulation Scheme for Reduced Simulation Time
The simulation configuration of MCS takes a lot of computational time and resources, even with the reduced simulation scheme. So, in addition to RSS, we developed a hybridized approach of numerical and analytical methods to reduce the computational time while maintaining the accuracy of the results. To build the analytical model to hasten the computational time, we first applied the concept of the system impulse response for the linear part in the simulation model. For a linear and time-invariant (LTI) system, an input signal can be decomposed into smaller (i.e., 1 MW) simple additive components called impulses, which are passed through a linear system, and the resulting output components called impulse response, are synthesized. In effect, the impulse decomposition provides a way to analyze signals one sample at a time. The signal resulting from this divide-and-conquer procedure was identical to that obtained by directly passing the original signal through the system. Hence, with the system’s impulse response, we could estimate what the output would be for any given input signal by convolving the input signal with the system impulse response. Convolution is important because it relates the input signal, the output signal, and the impulse response of the system. The grid control model can be expressed as a linear system, except for the ramp rate and limiter output, as shown in
Figure 8. The non-linearity of the grid model inhibits the direct application of impulse response to enhance the computation time.
Hence, we developed a composite model that deals with the linear part with impulse response before applying the non-linear part of the system model. Such a composite model was termed the hybrid-impulse response model (HIR). HIR, for each scenario, with the definition of the relevant grid parameters, the impulse response of the system was taken for the linear part of the grid model. Every generator output was acquired before the limiter by convolving with the input signal, which constituted the summation of the demand power, wind power output fluctuations, and 1 MW impulse response.
Then, the output of the convolution was numerically manipulated to apply the non-linear characteristic of the system, say the limitations of ramp rate and saturation. The frequency impulse response was then convolved with the grid input parameters again to yield the final output of the system with the non-linear characteristic.
Figure 9 depicts the simulation results of the hybrid-impulse model and the original simulation. From the results, it is clear that HIR does not relent on the performance accuracy even for a shorter computational time. The figure shows an instance of the simulation results for the control frequency simulation under a scenario which adopted a 7% spinning reserve with 100 MW BESS and 490 kW wind power. From this result, it was convincing to note that the hybrid-impulse model can be used in place of the regular simulation model and still maintain the reliability of the evaluation quality.


