1. Introduction
The world energy scenario is showing a progressive growth in demand due to economic and population expansion, which implies a substantial increase in fossil fuels consumption that harm the environment and compromise the lifestyle of current and future generations [
1].
Recent researches propose the use of new technologies for energy generation and storage (green energy) with low particulate and greenhouse gases emissions, aiming to diversify the generating base and, simultaneously, enhancing the role of energy efficiency. Meeting global challenges in energy security, climate change and economic growth requires the development of low carbon technologies such as biofuels, photovoltaic solar energy, solar thermal energy, wind energy and efficient storage systems [
2].
This research proposes and technically evaluates a solid-state hybrid generator (photoelectric and thermoelectric) for harnessing solar radiation directly on photovoltaic generators (PVG) and, simultaneously, to recovery the residual thermal energy through thermoelectric generators (TEG), thus promoting the arrangement energy efficiency.
At first, the technologies involved are presented (PVG and TEG generators). Subsequently, the device itself is presented and the analytical and numerical–experimental evaluations that allowed to verify the performance, potentiality and applicability of the hybrid generator in Foz do Iguaçu city (25°32′35.52″ S; 54°34′59.16″ W) were described. Finally, the main findings regarding the device response under the expected operating conditions are break down.
This work was developed following the classical methodology of scientific research, slightly modified with respect to the experimental design. The response of the PVG device was evaluated, both from the analytical approach and from the numerical–experimental perspective for a steady state operating condition in each month of the year and specifically in the southern hemisphere solstices and equinoxes days. The TEGs set behavior was analyzed from the perspective of the maximum power transfer point in both southern hemisphere solstices and equinoxes. The numerical–experimental analyzes were based on computational simulations, incorporating thermal and thermoelectric variables, assigning boundary conditions consistent with the research purpose, taking into consideration the local solar geometry and using experimental data. The novelty of this research stems from the field power generation forecast and efficiency gain analysis, in southern hemisphere, for a new STEG device that combines photovoltaic cells and solid-state thermoelectric modules.
1.1. Photovoltaic Generator
Photovoltaic generators (PVGs) are semiconductor devices based on the photoelectric impact ionization effect, i.e., the generation of electron–gap pairs (photoconductive effect) by the incident photons action on the very surface of PVGs with an energy greater than the band energy gap (Eg) of the material [
3]. The energy associated with the incident photon is quantified through Equation (1).
Absorption of photons with energy exceeding the band energy gap of the photovoltaic material results in excess energy accumulation that is dissipated as heat, a phenomenon known as thermalization, which the fundamental principle of device presented in this study.
In terms of technological development, advances in PVGs focus on altering the solar cell material itself, enhancing the power controller and tracking system, optimizing the energy storage system, amending the temperature control systems, and, improving the solar uptake. However, the theoretical maximum efficiency, known as the Shockley Queisser limit [
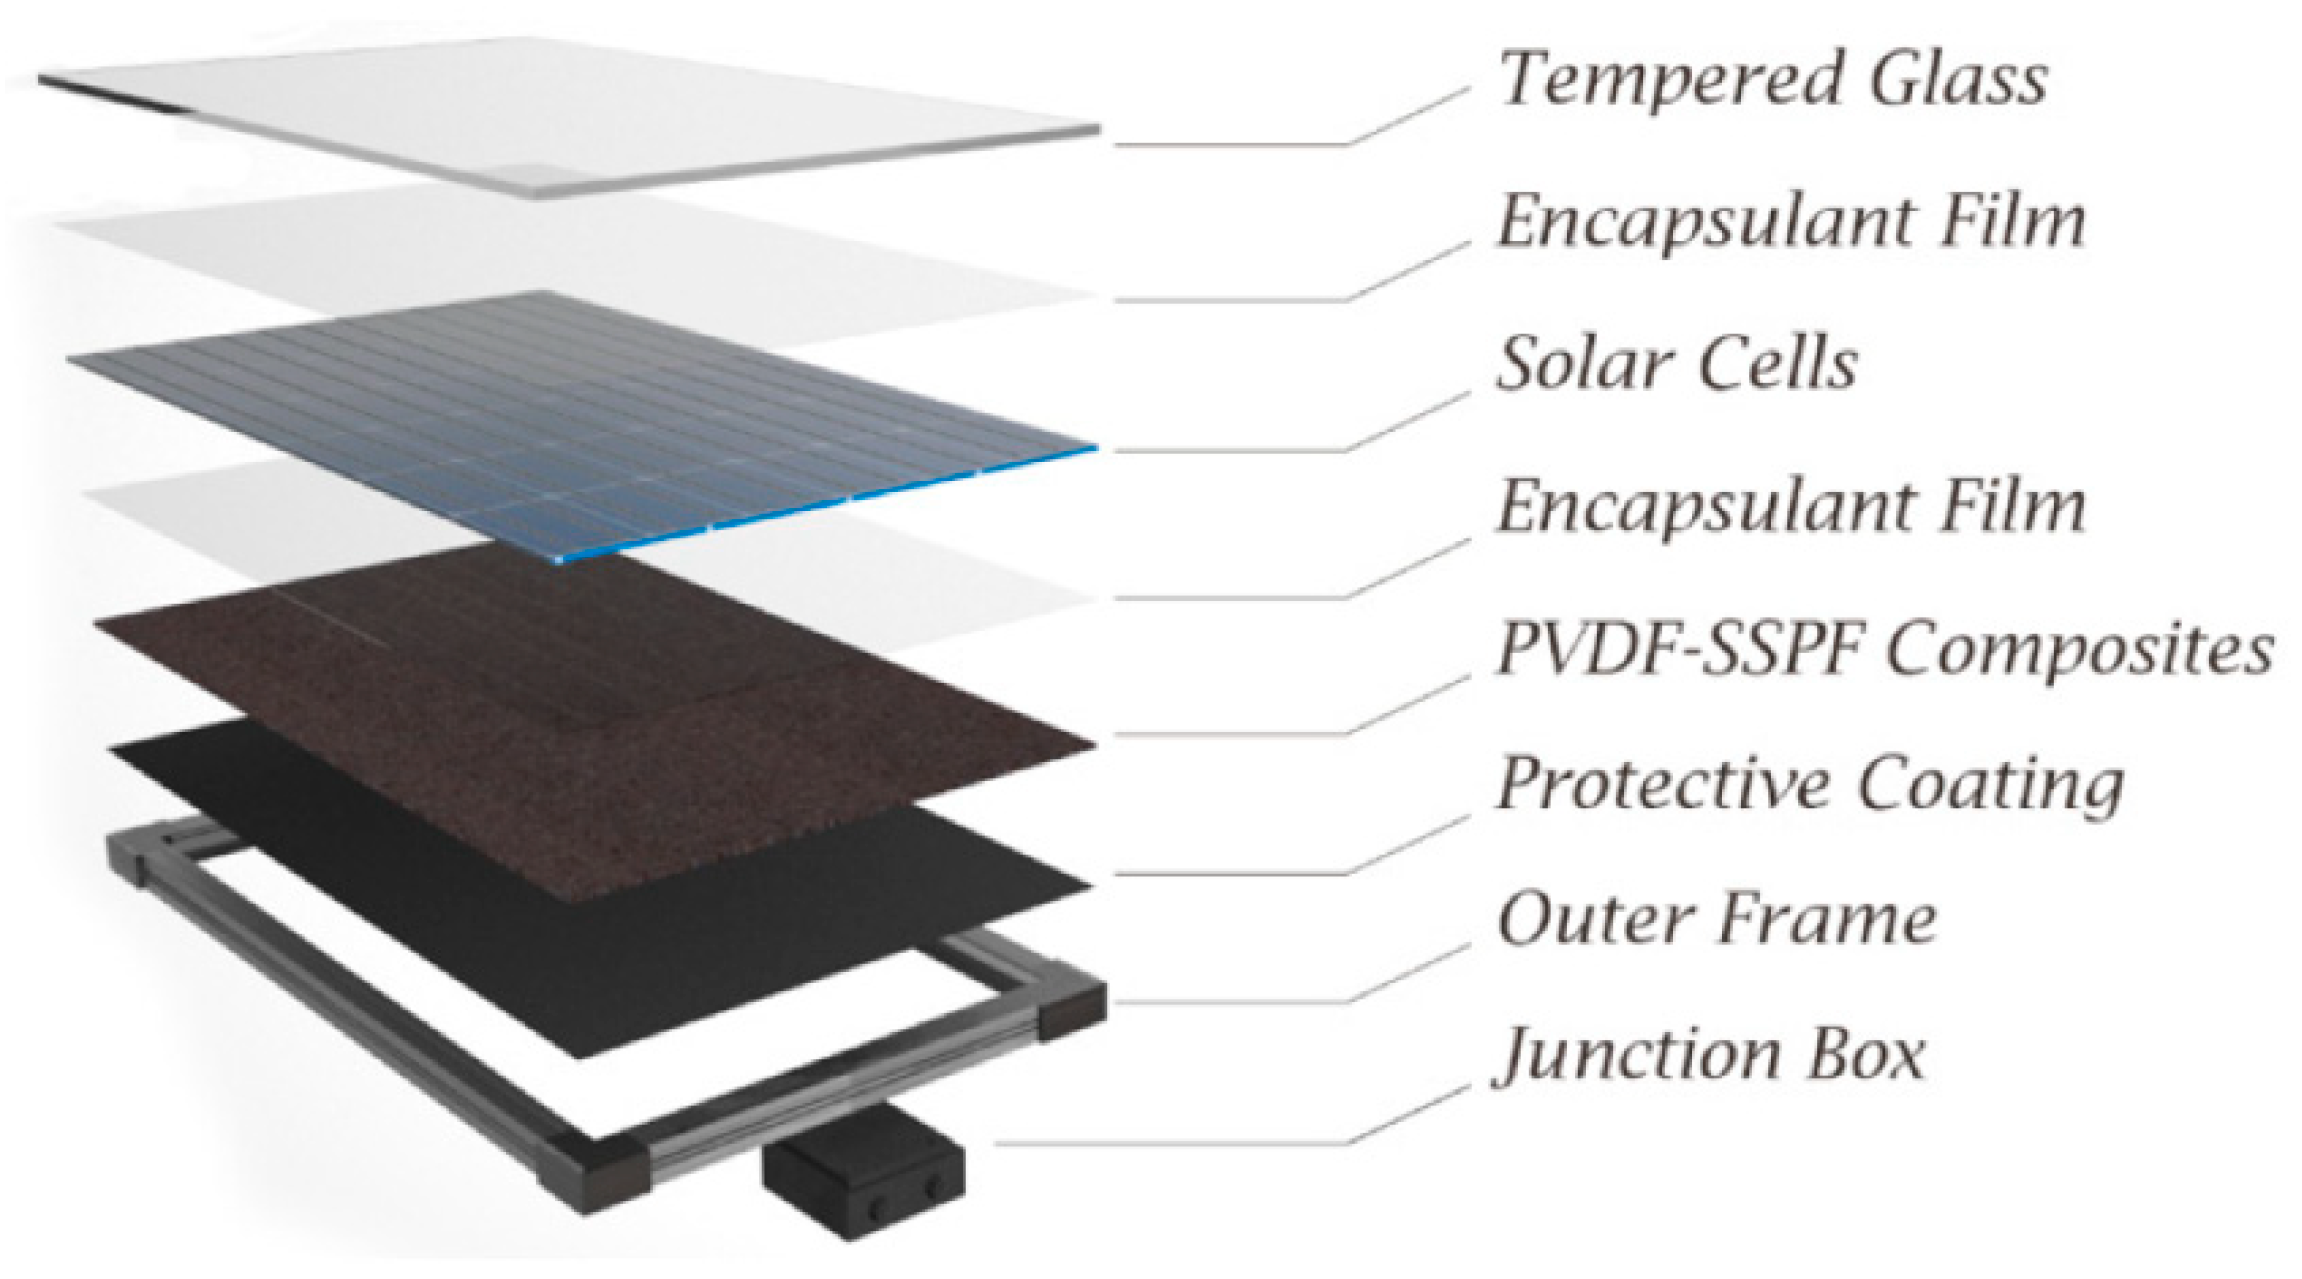
4], of a silicon solar junction cell, as the one used in this research, is approximately 30%. Commercial PVGs are built in layers, as shown in
Figure 1. In this type of device all layers are embedded in a single structure.
Regarding the materials used in the manufacture of PVG, silicon (26.7% maximum real recorded efficiency) remains the most popular with an 85% share of the global market [
6,
7,
8]. However, there are other technologies available, namely:
- (i)
GaAs (gallium arsenide): this multi-junction cells have gained ground since the 1970 s due to their high absorptivity. It is a type of technology still under development with advances in reducing surface recombination. Its efficiency can reach up to 32.9% [
8,
9];
- (ii)
CIGS (copper–indium–gallium–selenium): these are cells made with thin layers deposited with chalcopyrite (Cu(In,Ga)Se2), generally abbreviated as CIGS, are considered one of the most promising solar technologies. Their disadvantage lies in the presence of cadmium sulfide (CdS) precursor (highly toxic) required for CIGS layers deposition. Its efficiency is typically between 20.4% and 23.4% [
8,
10];
- (iii)
Cd free CIGS: these are CIGS cells that do not use cadmium sulfide as a precursor during the deposition of semiconductor thin layers. Recent researches propose the exchange of cadmium sulfide with zinc sulfide (ZnS) or indium sesquisulfide (In2S3). Its efficiency ranges from 11.06% to 13.00% [
10,
11];
- (iv)
DSSC (dye-sensitized solar cells): this technology incorporates a colored and luminescent layer to increase the PVG current density. This layer favors light uptake in terms of scattering and downshifting effect with short circuit current gains in the order of 64%. Its efficiency is low and varies between 4.02% and 12.6% [
8,
12];
- (v)
Perovskite: solar cells that have been widely commercialized in recent years due their low cost, the ability to counteract conversion discontinuities and the relative ease in depositing crystals. Its efficiency ranges from 22.0% to 25.2% [
7,
8];
- (vi)
OSC (organic solar cells): based on heterojunctions of conjugated polymers, they are produced from a solution, which allows the printing and deposition of this cell type to obtain different geometries and even reversible morphologic changes (elastic solar cells). Its efficiency varies from 3.67% to 17.4% [
8,
13];
From an operational point of view, PVGs can be optimized in different ways: by sloping position control based on solar trackers, whether using single-axis solar tracker or multi-axis solar tracker, and even using parabolic solar concentrators [
14]; by operating temperature regulation to improve efficiency, considering the fact that a significant fraction of solar radiation that strikes PVGs is converted into heat and reduces the device efficiency by approximately 0.5% and 0.25% to every one °C increase in operating temperature for crystalline silicon PVGs and amorphous silicon PVGs, respectively [
15]. In this sense, several cooling techniques have been studied and implemented, namely:
- (i)
Air (natural ventilation): this technique uses ambient air flow to reduce the temperature of the PVG. Heat transfer can be optimized by increasing the heat transfer area or by using fins. PVGs using this technology can operate at 50–70 °C [
16,
17];
- (ii)
Air (forced ventilation): this heat removal technique is based on the forced air flow at the front and rear of the photovoltaic modules. However, it consumes a significant amount of fan power. PVGs using this technology can reach a 20–30 °C operating temperature [
18];
- (iii)
Water (active cooling): cooling performance is improved as water flow velocity is increased. However, the increase in volumetric flow per unit of time implies an increase in energy consumption. PVGs using this technology can operate at 22 °C [
16,
19];
- (iv)
Water (passive cooling): uses a naturally circulating water flow (mass and heat natural convection), to remove PVG heat, avoiding the use of pumps and optimizing energy use [
15];
- (v)
Liquid immersion: this technique involves the removal of heat from PVG device by its immersion in a dielectric liquid inside a transparent elongated tube. The liquid requires a specific refractive index that allows the concentration of solar radiation in the photovoltaic cells. PVGs using this technology operate at 30–45 °C [
16];
- (vi)
Nanofluid: this cooling approach uses nanofluids containing suspended metal particles to promote heat transfer but may cause corrosion on the PVG contact surface [
20].
1.2. Thermoelectric Generators
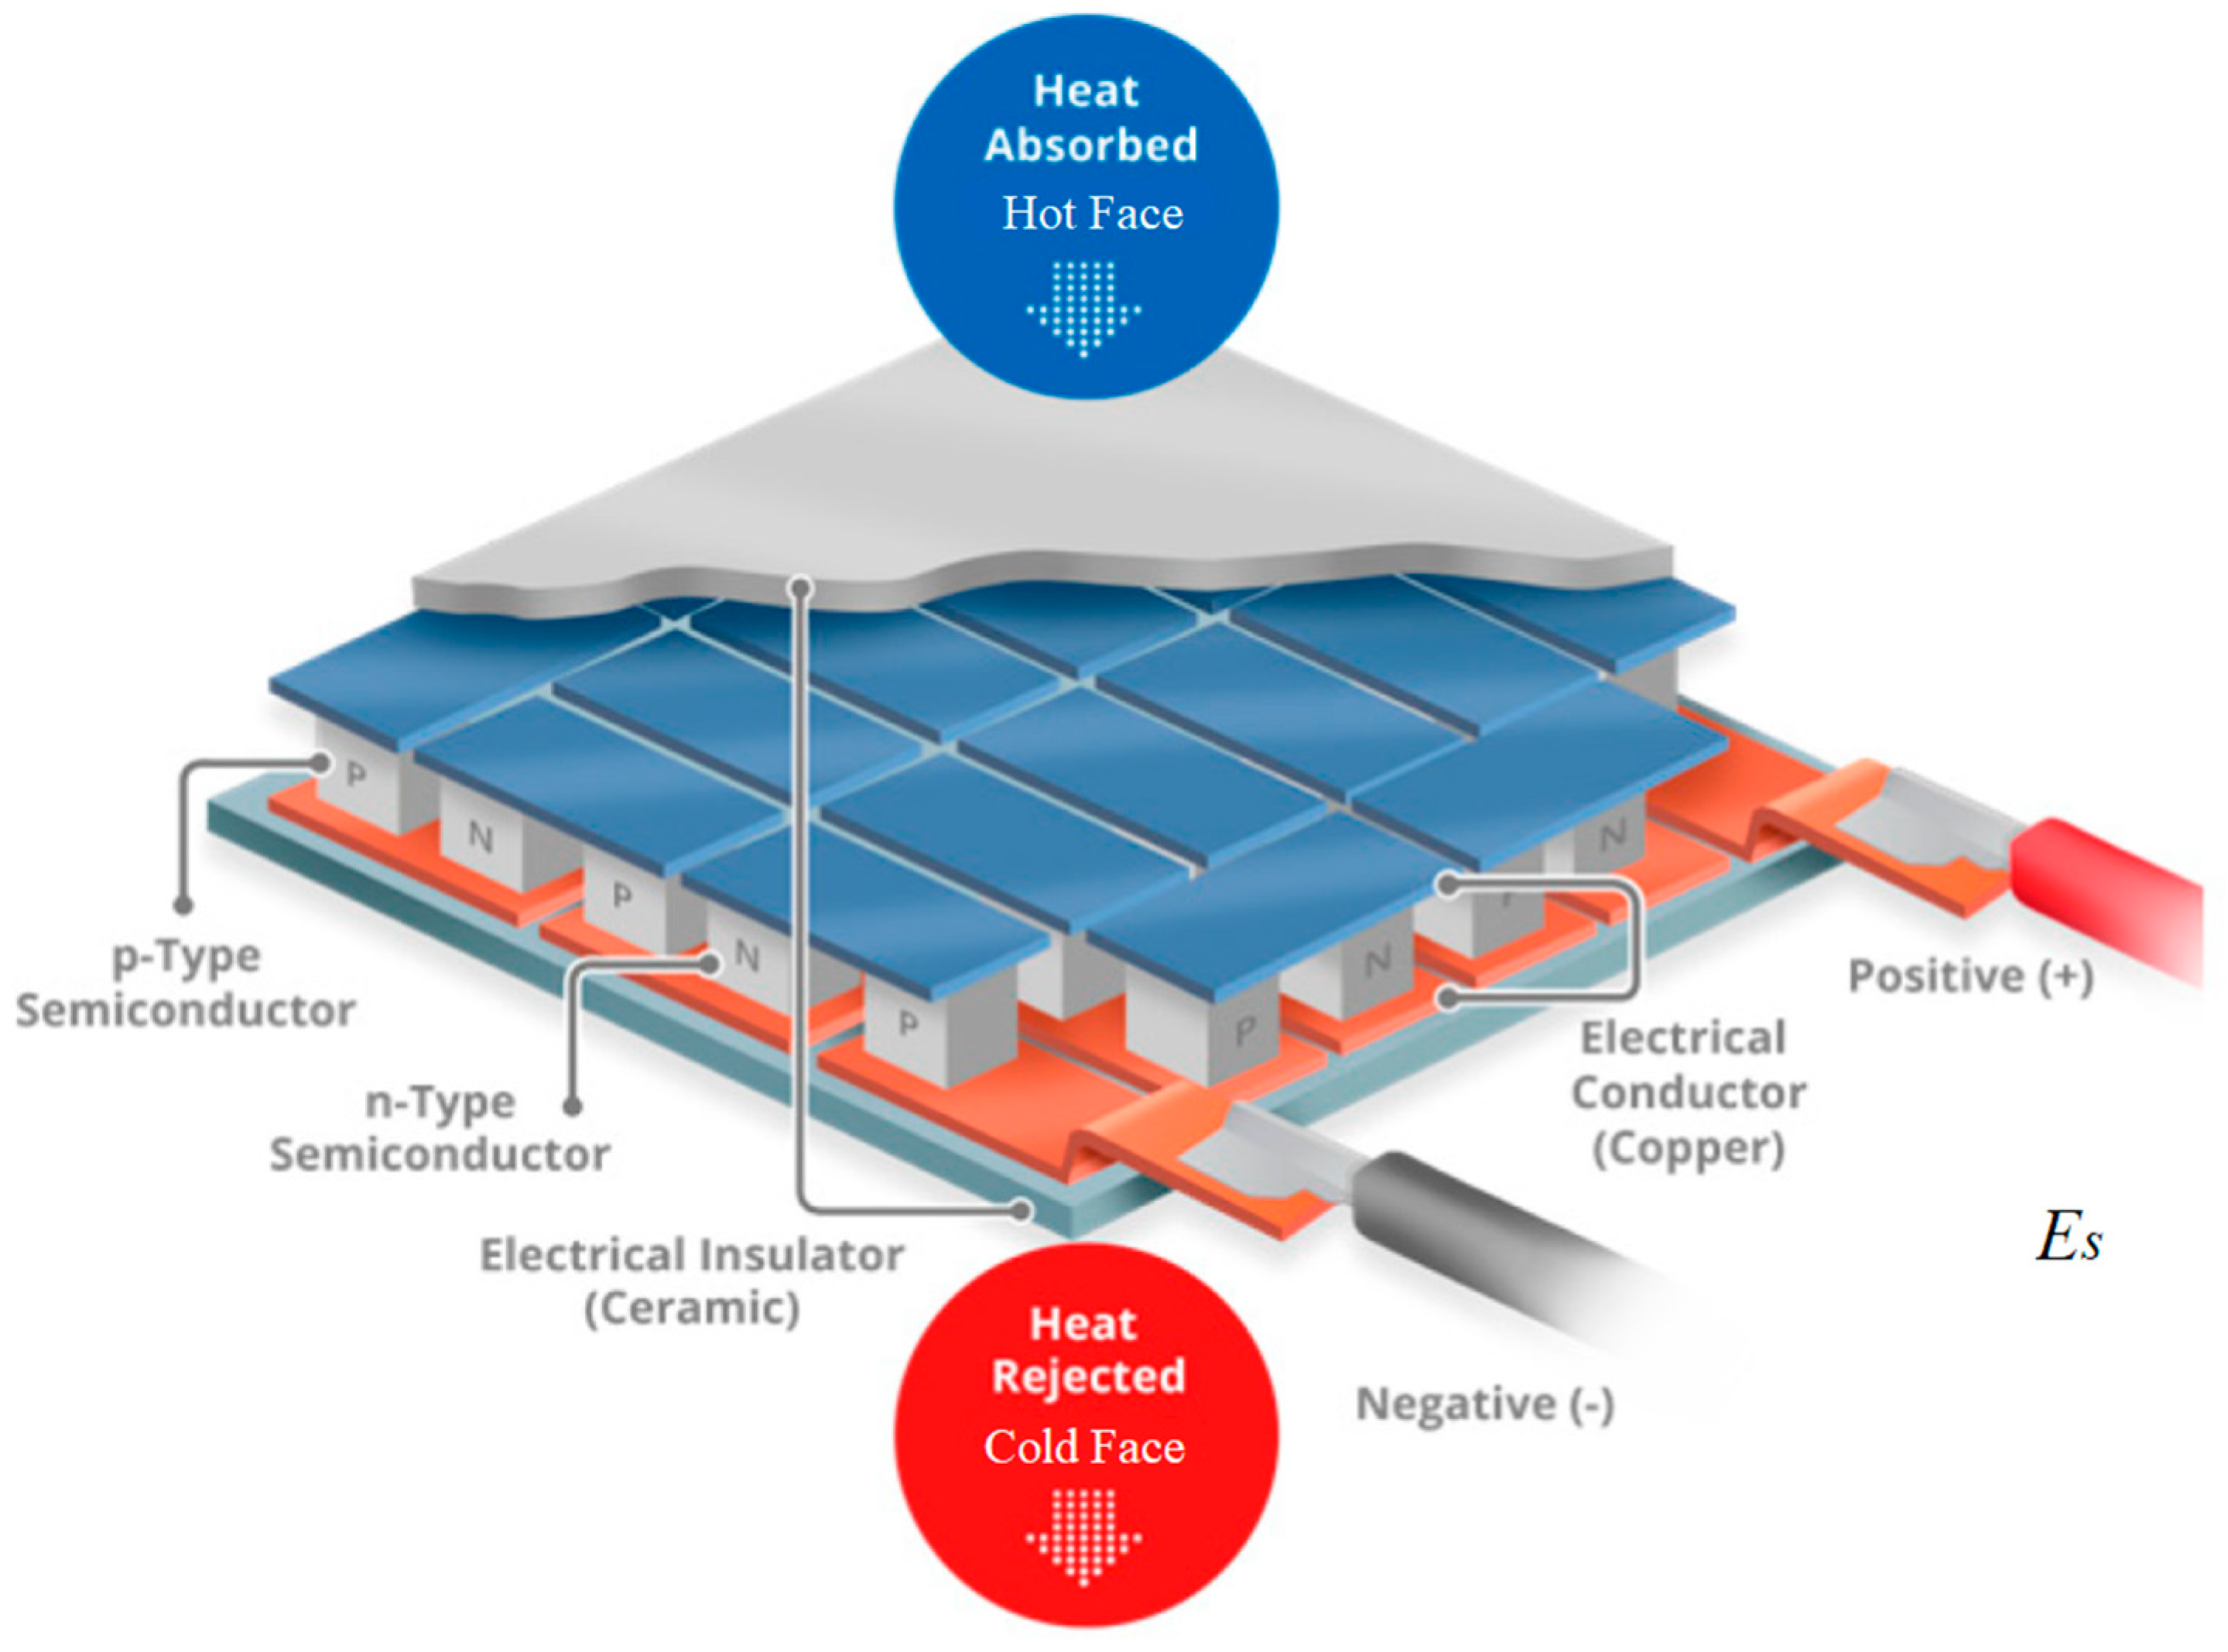
Thermoelectric generators (TEGs) are solid-state devices whose operation is based on the Seebeck effect; this phenomenon describes the direct conversion of thermal energy into electrical energy when the TEG is submitted to a temperature difference [
21].
Figure 2 shows the constructive structure of a modern TEG and the arrangement of the P and N semiconductors inside, as well as the resulting Seebeck voltage
Es at the terminals when a temperature difference is applied to device faces.
Seebeck voltage can be easily determined when material properties and joint temperatures are known as follows [
23]
The maximum efficiency of thermoelectric material can be determined by the dimensionless number zT, known as dimensionless figure of merit and given by Equation (4). Current silicon TEGs present dimensionless figures of merit between 0.015 and 0.200 depending on operating temperature and manufacturing material [
24], they have remarkable advantages over conventional technologies, namely: reliability, size and weight, simplicity of maintenance (no moving parts), wide operating temperature range, remote applicability and environmentally friendly [
21,
25,
26].
Recently, TEGs have been used in cogeneration systems, improving the overall efficiency up to 4% in industrial processes by harnessing residual thermal energy [
27,
28]. In [
29] a theoretical model for designing thermoelectric devices with geometry and performance optimized for use in thermosolar systems is presented reaching a
around 1.5, comparable to the dimensionless figure of merit of silicon-based photovoltaic solar cells. In [
30] a computational model is developed and validated to increase energy generation in polymeric TEGs; power generation from thermoelectric devices located at the system exhaust can reach up to 21.73 MWh/year.
In [
31] it was tested, experimental and computationally, the non-stationary operation of a TEG subjected to heterogenous temperature gradients across its thickness in order to establish the impact on output voltage. In some cases, an unexpected TEG behavior was observed due to the appearance of a reverse temperature gradient.
Some flexible portable thermoelectric generators without cooling system for portable applications were experimentally tested in [
32]; a temperature difference around 1.8 K was achieved between the junctions in operating conditions similar to those typically found in human body. This investigation showed that a thermopile needs a thermal difference of about 2 K between hot and cold faces to switch on a voltage boost DC–DC converter.
In [
33] it was proposed a TEG 1-D model that takes into account the properties of thermoelectric materials and their relationship of dependence with temperature and the effects of thermal losses by radiation, conduction and the Thomson effect. As result, it was found a power decrease up to 10% a efficiency decrease up to 31%. Heat losses imputable to conduction and radiation were small, and the Thomson effect reduced significantly the TEG performance.
An analytical study on the effect of pressure on the heat transfer coefficient of TEGs was developed in [
34]. The obtained results allowed forecasting the behavior of such devices and they were used to define an optimal clamping pressure of thermoelectric modules (compressive stress of 0.35 MPa).
In the automotive industry different studies have been developed to evaluate the feasibility of implementing TEGs devices in the exhaust ducts of internal combustion vehicles, assessing the potential for energy recovery from engine car exhaust gases under various operating regimes. The results showed a gross energy gain of between 1.54% and 1.68% [
35,
36]; it has been proven that some TEG models can be used as an input for developing a control system for operating the energy harvesting mechanism ensuring safe and efficient operation.
On the other hand, in relation to the losses due to the contact resistance of the TEG module faces, [
37] experimentally evaluated its effects on the TEG performance showing that, with the increase of the load pressure, there is a decrease in the contact thermal resistance in both hot face and cold face of the thermoelectric generator and an increase in the TEG temperature difference. Thereby increasing the delivered power between 1.09% and 33.00% depending on contact resistance reduction strategy.
1.3. Systems Combining TEGs and PVGs
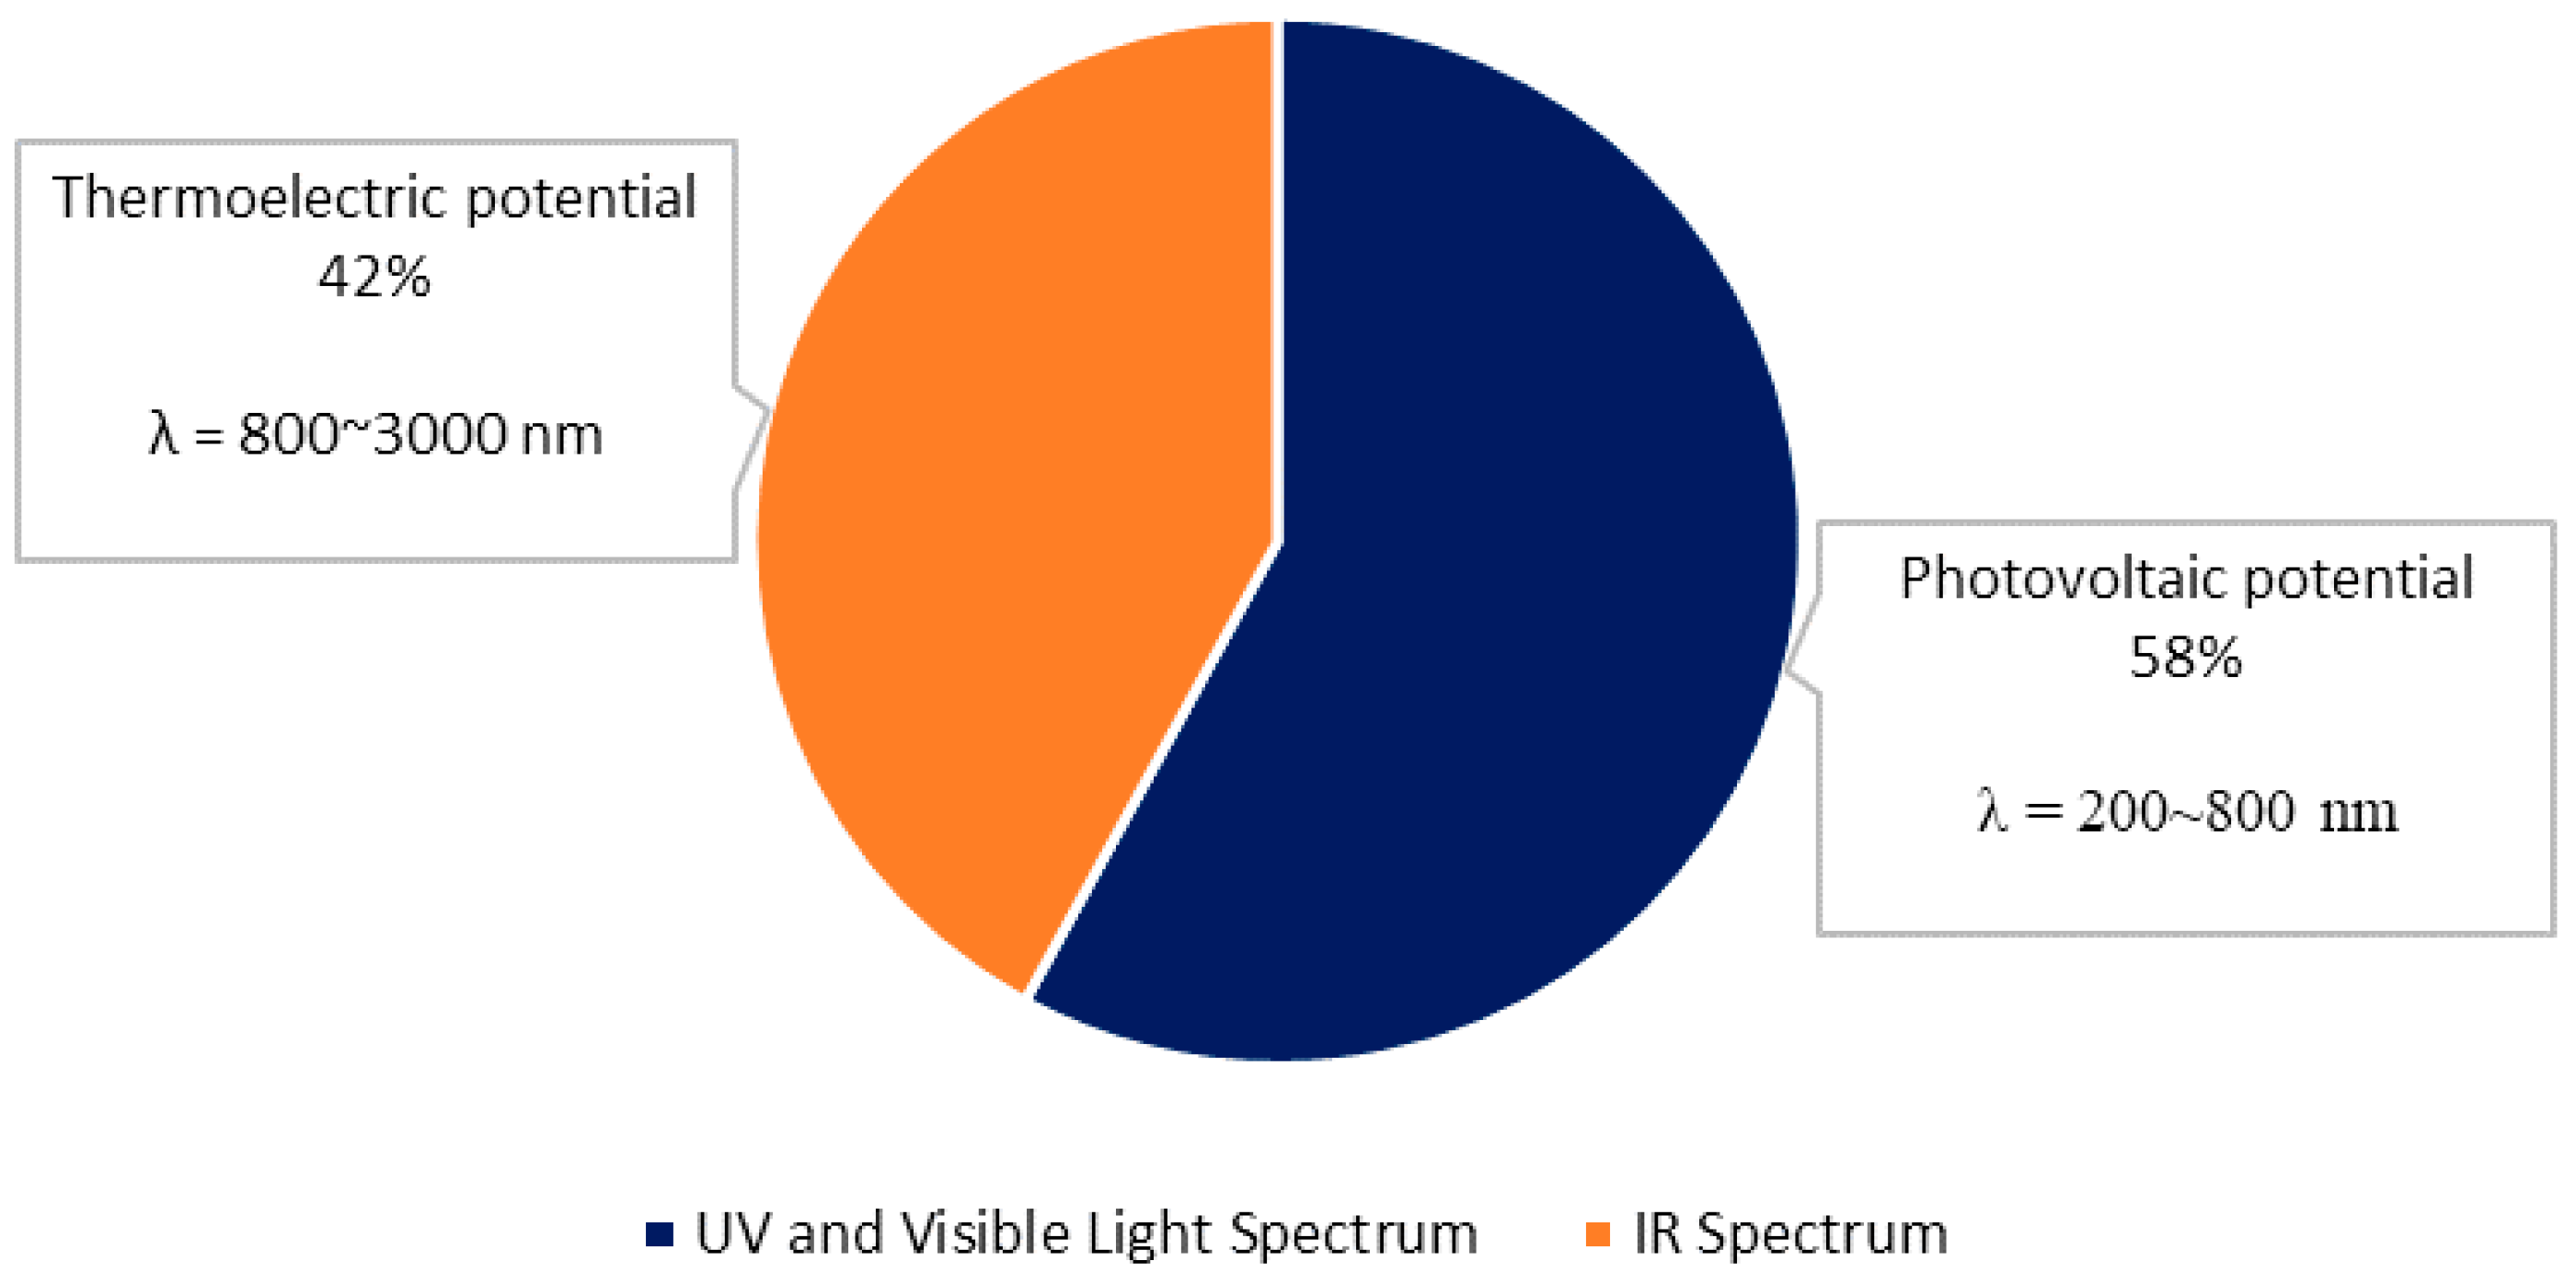
When a photovoltaic device is exposed to sunlight, a portion of solar radiation is absorbed by the photoactive material (solar cell) and a portion of the energy is absorbed by the non-photoactive substance (other layer of the module) and converted into heat. If this thermal energy could be converted into electricity, the overall performance of the harnessing process would increase. In addition, a photovoltaic solar cell utilizes the ultraviolet and visible regions of the solar spectrum (200–800 nm), while thermoelectric generators harness the infrared region (800–3000 nm) of incident electromagnetic radiation [
38,
39]. As a result, more than 42% of the total energy is directly disposed as heat (see
Figure 3), without including the amount of energy that PVG device cannot harness through photoelectric effect and which also ends up being dissipated as heat to the surrounding.
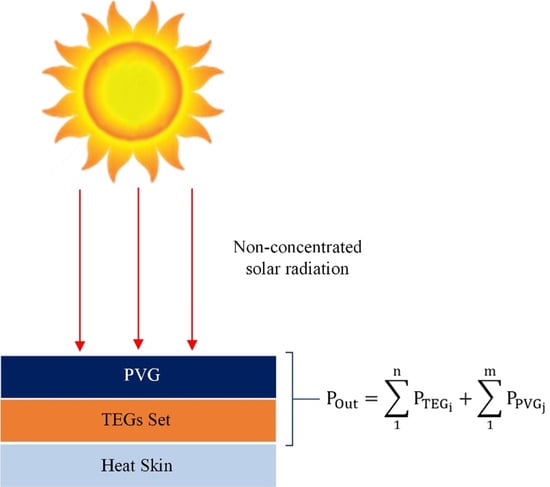
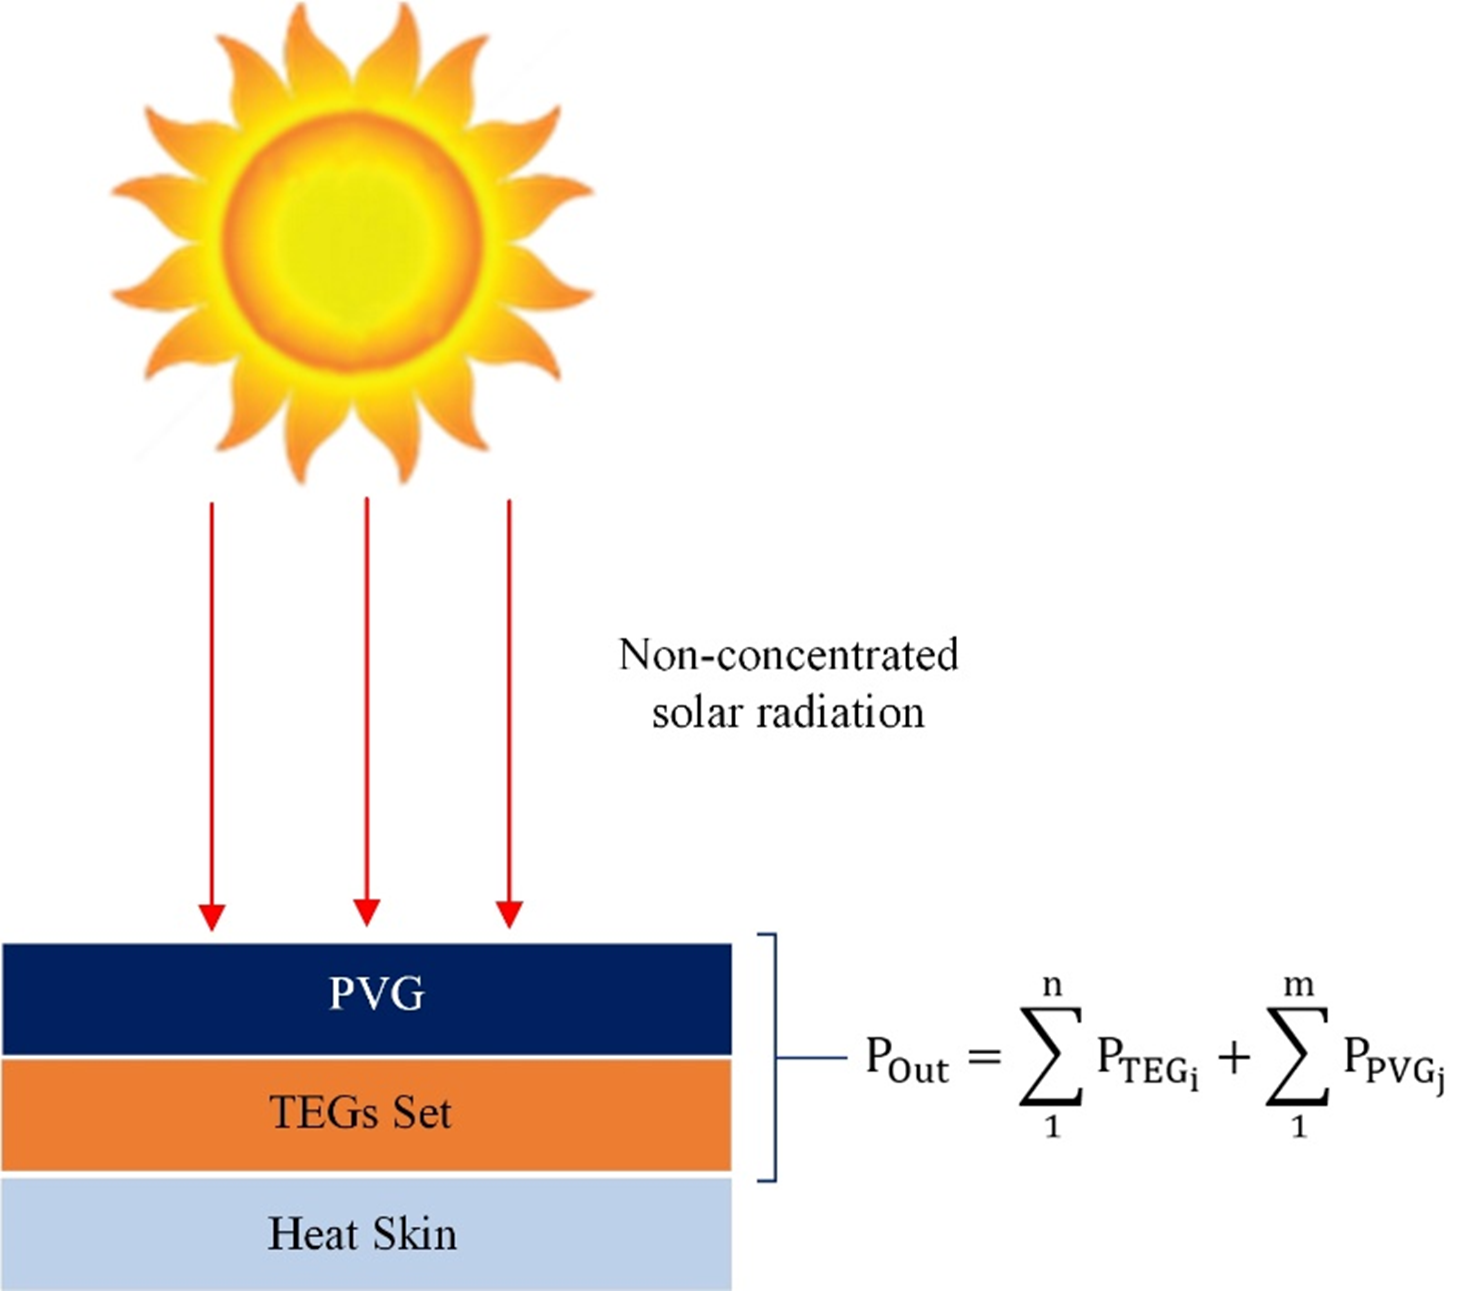
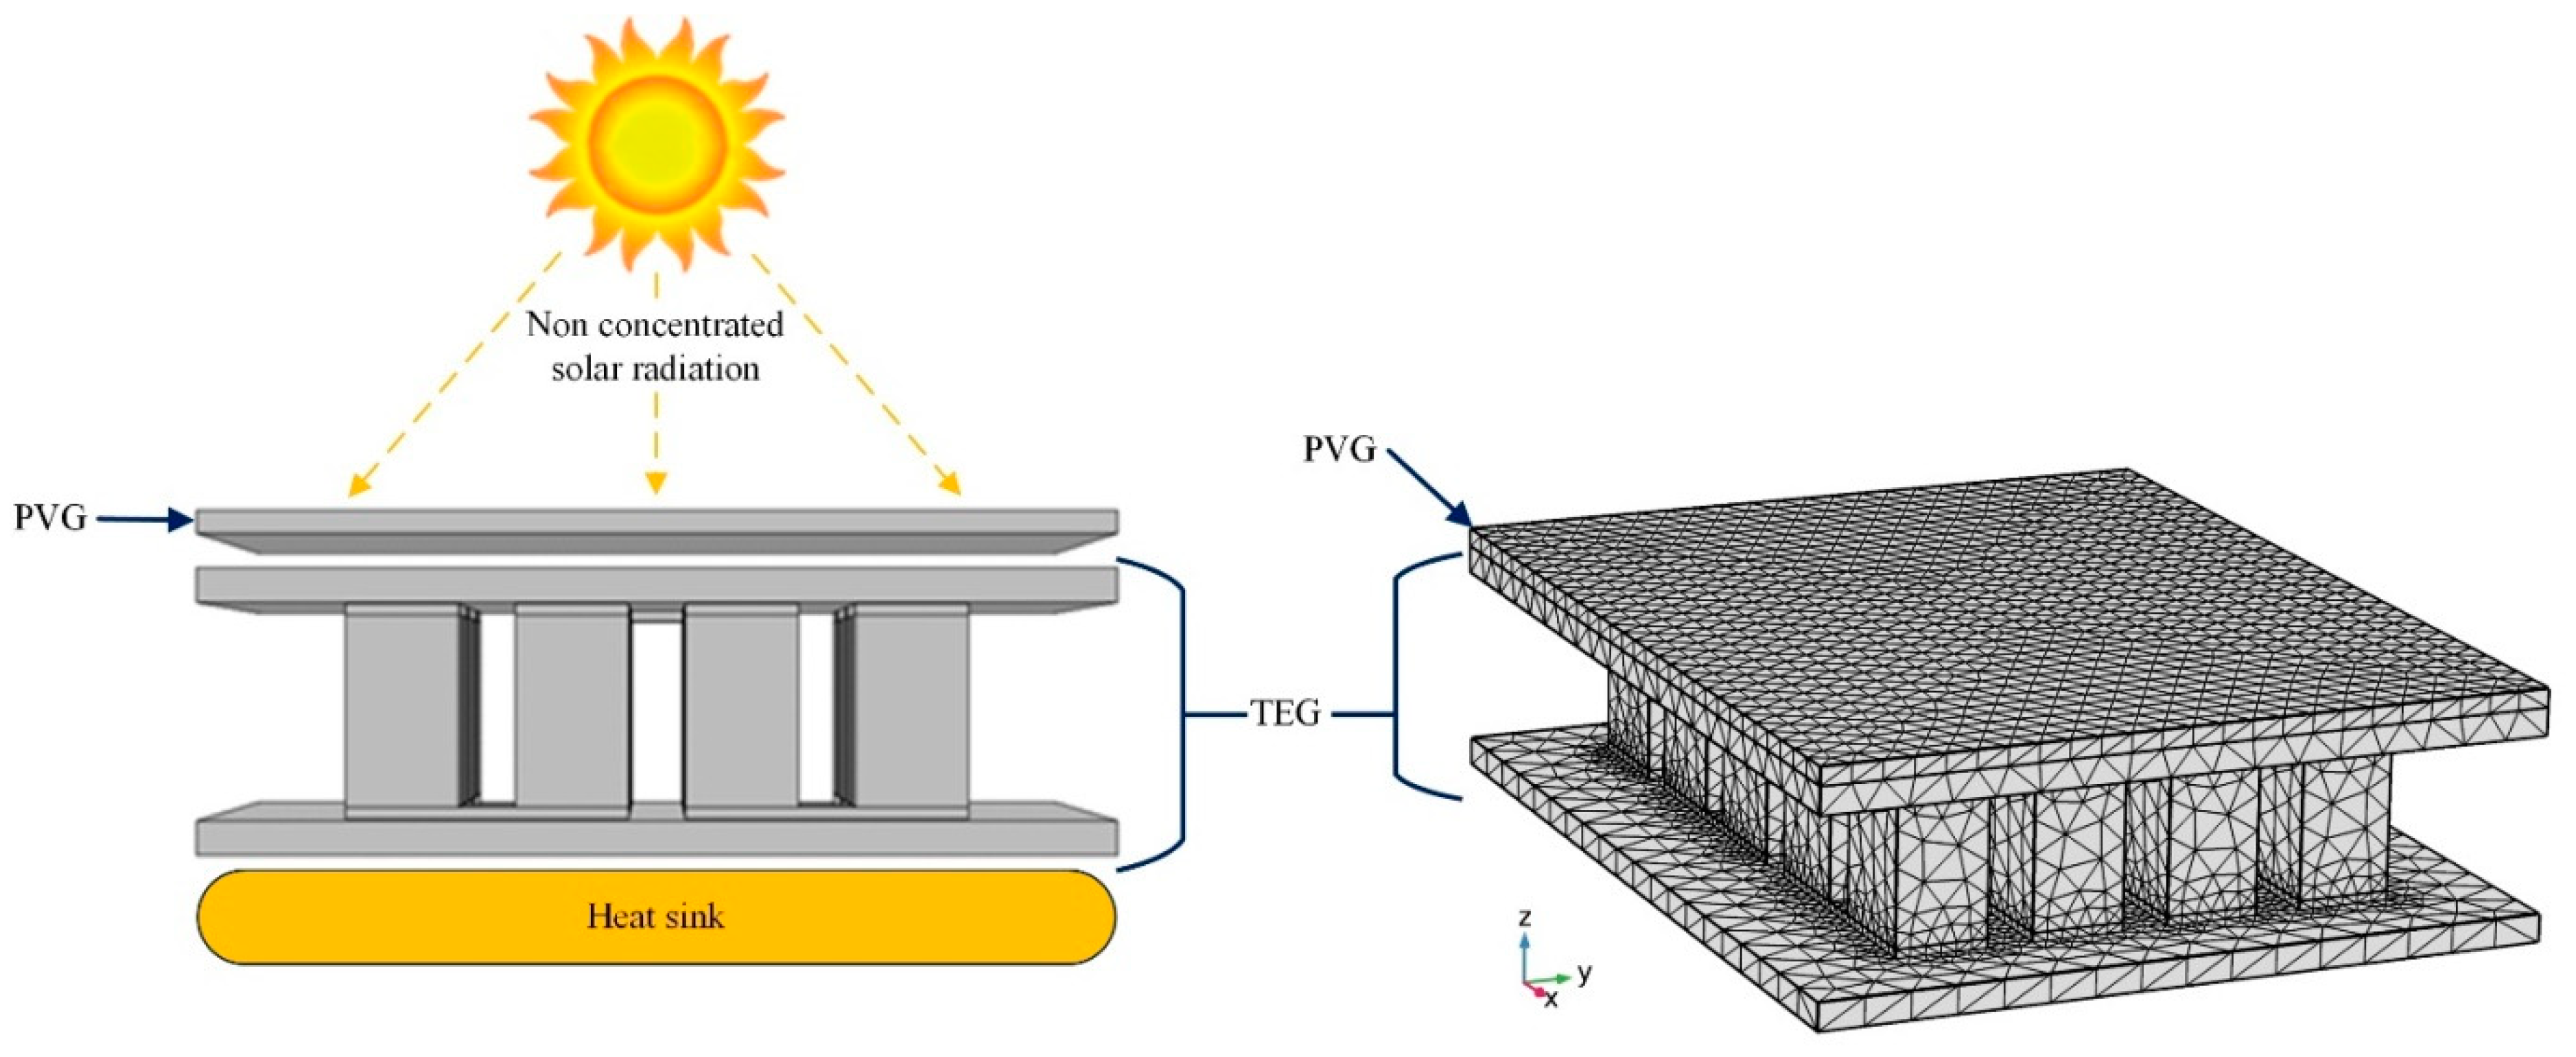
A solar thermoelectric hybrid device or STEG (Solar Thermoelectric Generator), consists of a PVG layer, a TEG layer and a cooling system, where different components are added or modified to optimize the array performance [
38]. The overall power of the system is the sum of the power output of both PVG and TEG devices. STEGs have theoretical potential to convert solar energy with a registered efficiency of up to 32.09% [
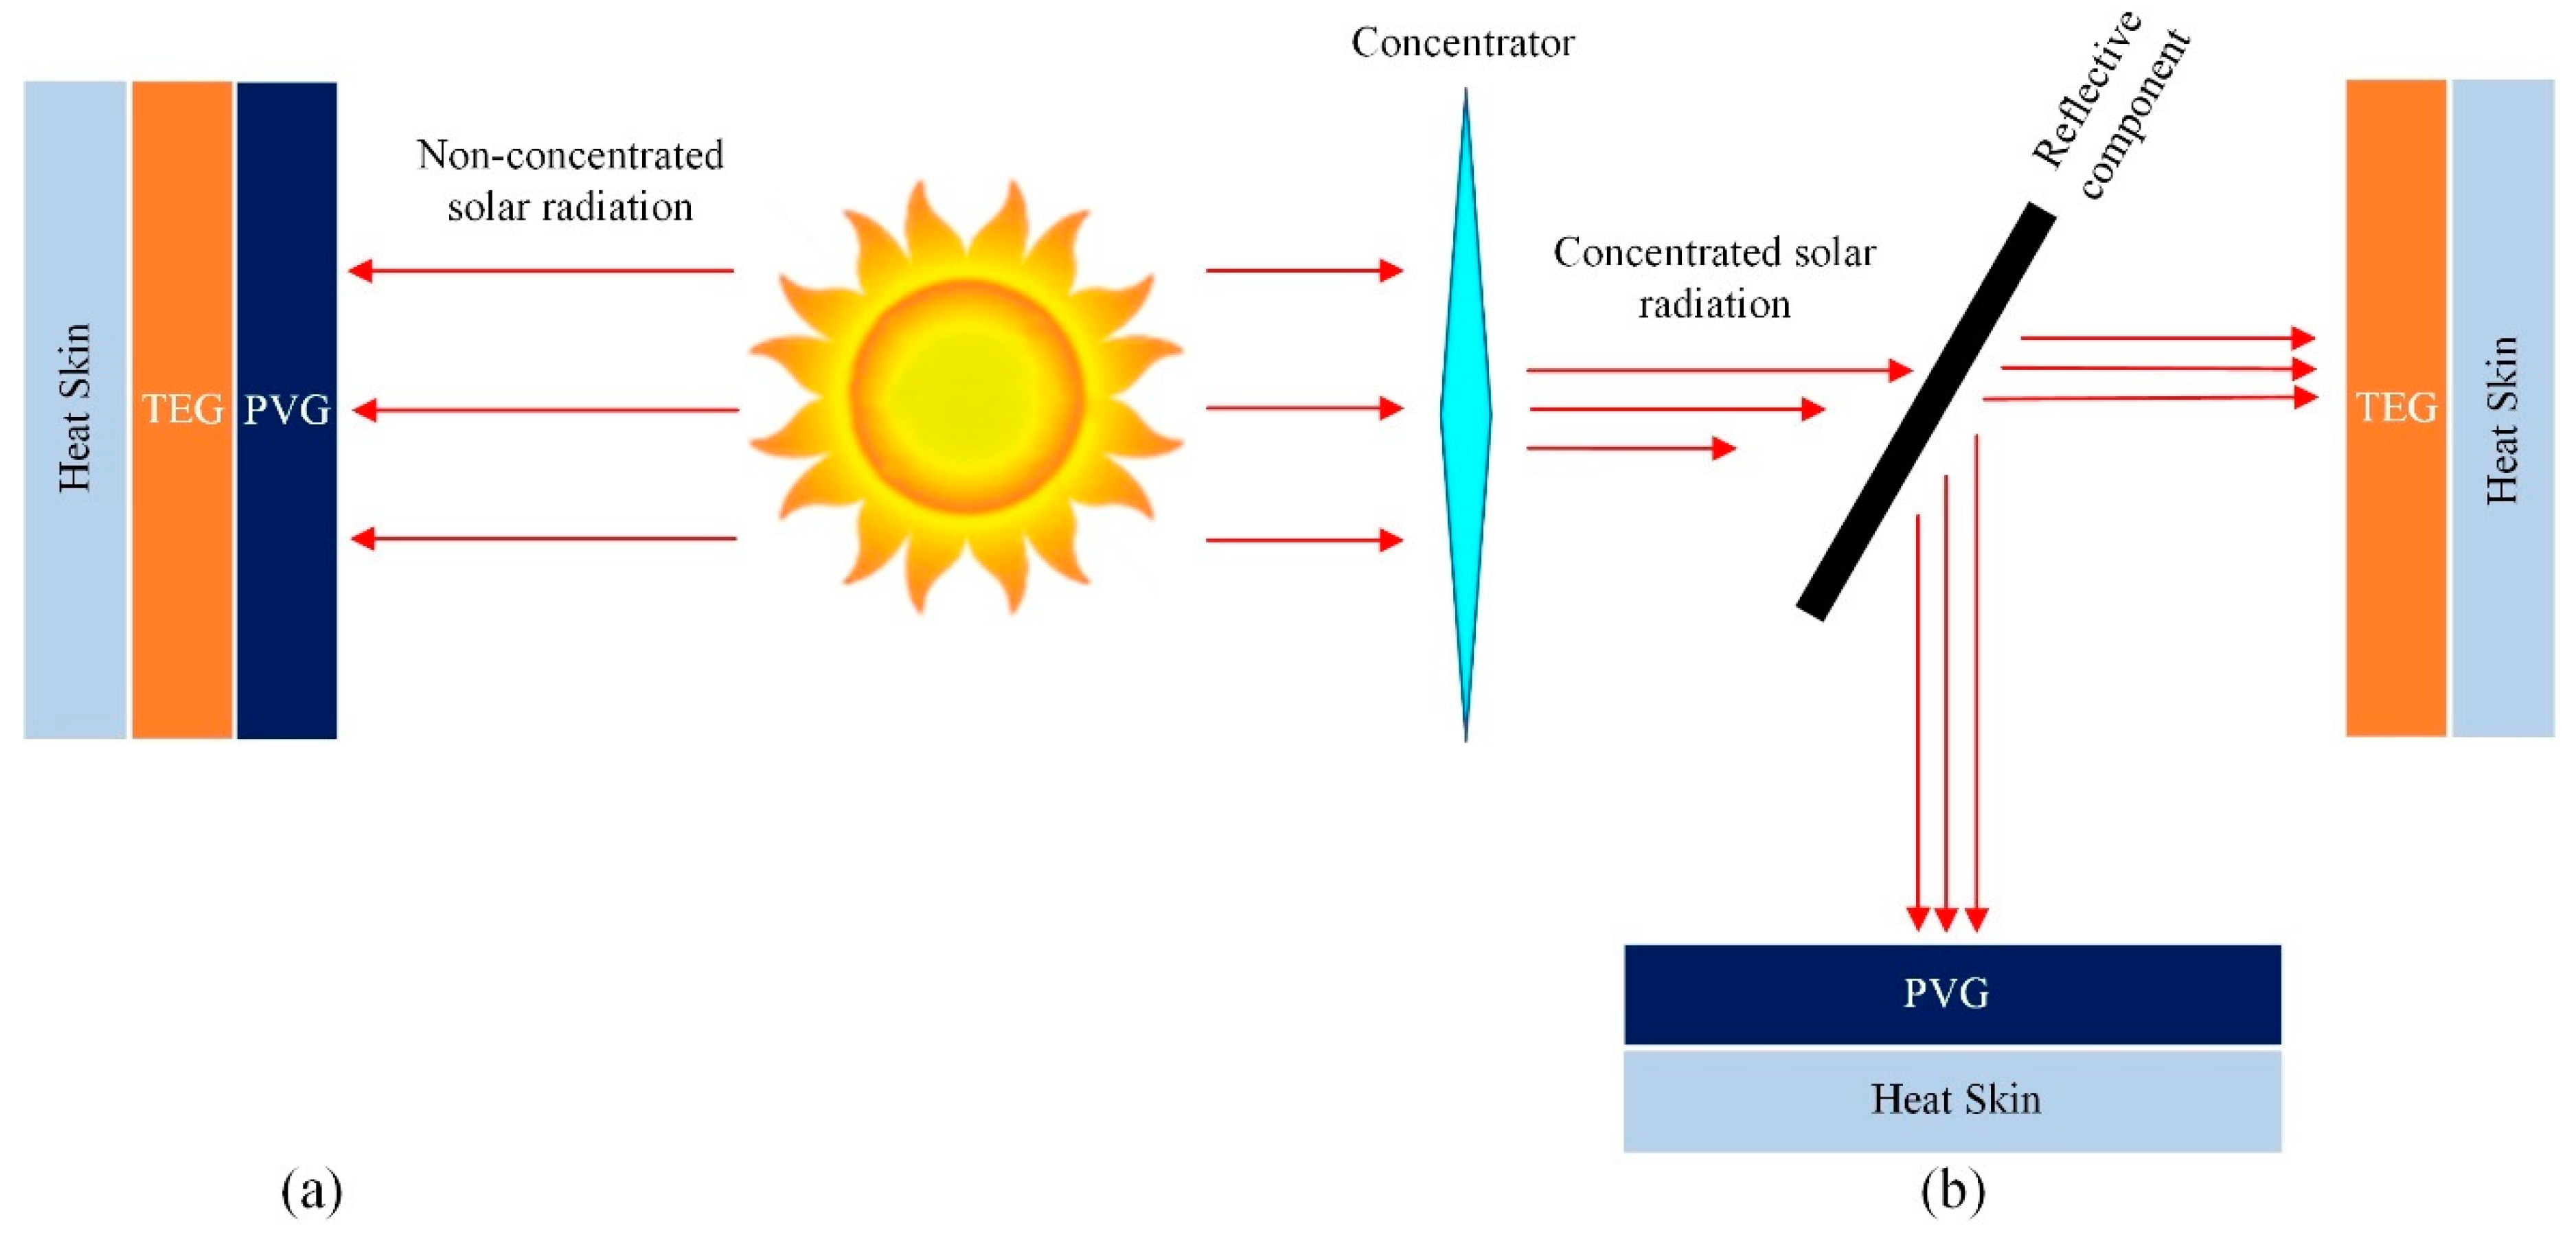
38]. In general, there are two types of operating structures for STEG hybrid devices, as shown in
Figure 4, namely:
- (i)
Based on non-reflective component: in these devices, both the PVG and TEG are physically arranged in parallel. Since PVG primarily absorbs short wavelengths (visible and UV spectrums) and TEG absorbs longer wavelengths (IR spectrum), PVG is generally configured as the top component and TEG as the bottom component, as shown in
Figure 4a. A heat sink is placed on the bottom of the TEG (cold face) to maintain a temperature gradient;
- (ii)
Based on reflective component: this type of STEG device, shown in
Figure 4b, has a reflective component (also called spectrum splitter or prism) that receives light previously concentrated through Fresnel lenses or mirrors. PVG and TEG are placed perpendicularly. When concentrated sunlight radiates the device from the top, part of the solar radiation is reflected by the spectrum splitter at a certain wavelength (cutoff length) to feed the TEG, while the rest of the radiation can pass through the reflective component to feed the PVG. A cooling system is installed in the TEG rear face (the cold face TEG as shown in
Figure 2) to maintain the temperature gradient.
According to [
40], the STEG efficiency depends on both PVG opto-thermal efficiency and TEG figure of merit. An increase in TEG hot side temperature will favor its performance, but at the same time will cause a reduction in PVG opto-thermal efficiency. Thus, there is an optimum hot spot temperature for maximum system efficiency. According to [
40], this temperature is between 150 and 250 °C for STEGs based on bismuth telluride (Bi2Te3) using solar radiation concentration.
In [
41,
42] were proposed STEGs systems similar to the one presented in this study, however using thermosyphons and vacuum tubes to directly collect solar thermal energy and transport it to the hot face of TEGs, that are cooled by conventional finned heatsinks.
The maximum conversion efficiency of a non-concentrating STEG is analytically determined in [
43]. The TEG is assumed to work under to Carnot efficiency and the PVG performance is assumed independent of temperature; the maximum efficiency increase was 4.5% and conditioned to a lower dimensionless figure of merit (zT). However, [
44] reported an efficiency gain of up to 11.0% on steady state using water active cooling system and an efficiency gain of up to 8.0% with water passive cooling system.
It is noteworthy that the present research produced a customized STEG without concentrator that takes into consideration local operating conditions and brings the following highlights:
- (i)
Response assessment of a non-concentration STEG device operating in southern hemisphere;
- (ii)
Determining STEG behavior throughout the day at different times of the year;
- (iii)
Quantification of STEG maximum efficiency increase compared to PVG operating alone;
- (iv)
Quantification of STEG maximum power increase and both PVG and TEG technologies weighted contributions.
The objective of this research was to evaluate the behavior of a STEG device without concentrator, capable of taking advantage of both the photoelectric and thermoelectric effects, aiming to obtain an efficiency gain in the utilization of solar energy in southern hemisphere; from the results obtained it is possible to achieve an efficiency gain of up to 6.05% depending on operating conditions.
2. Proposed Devices
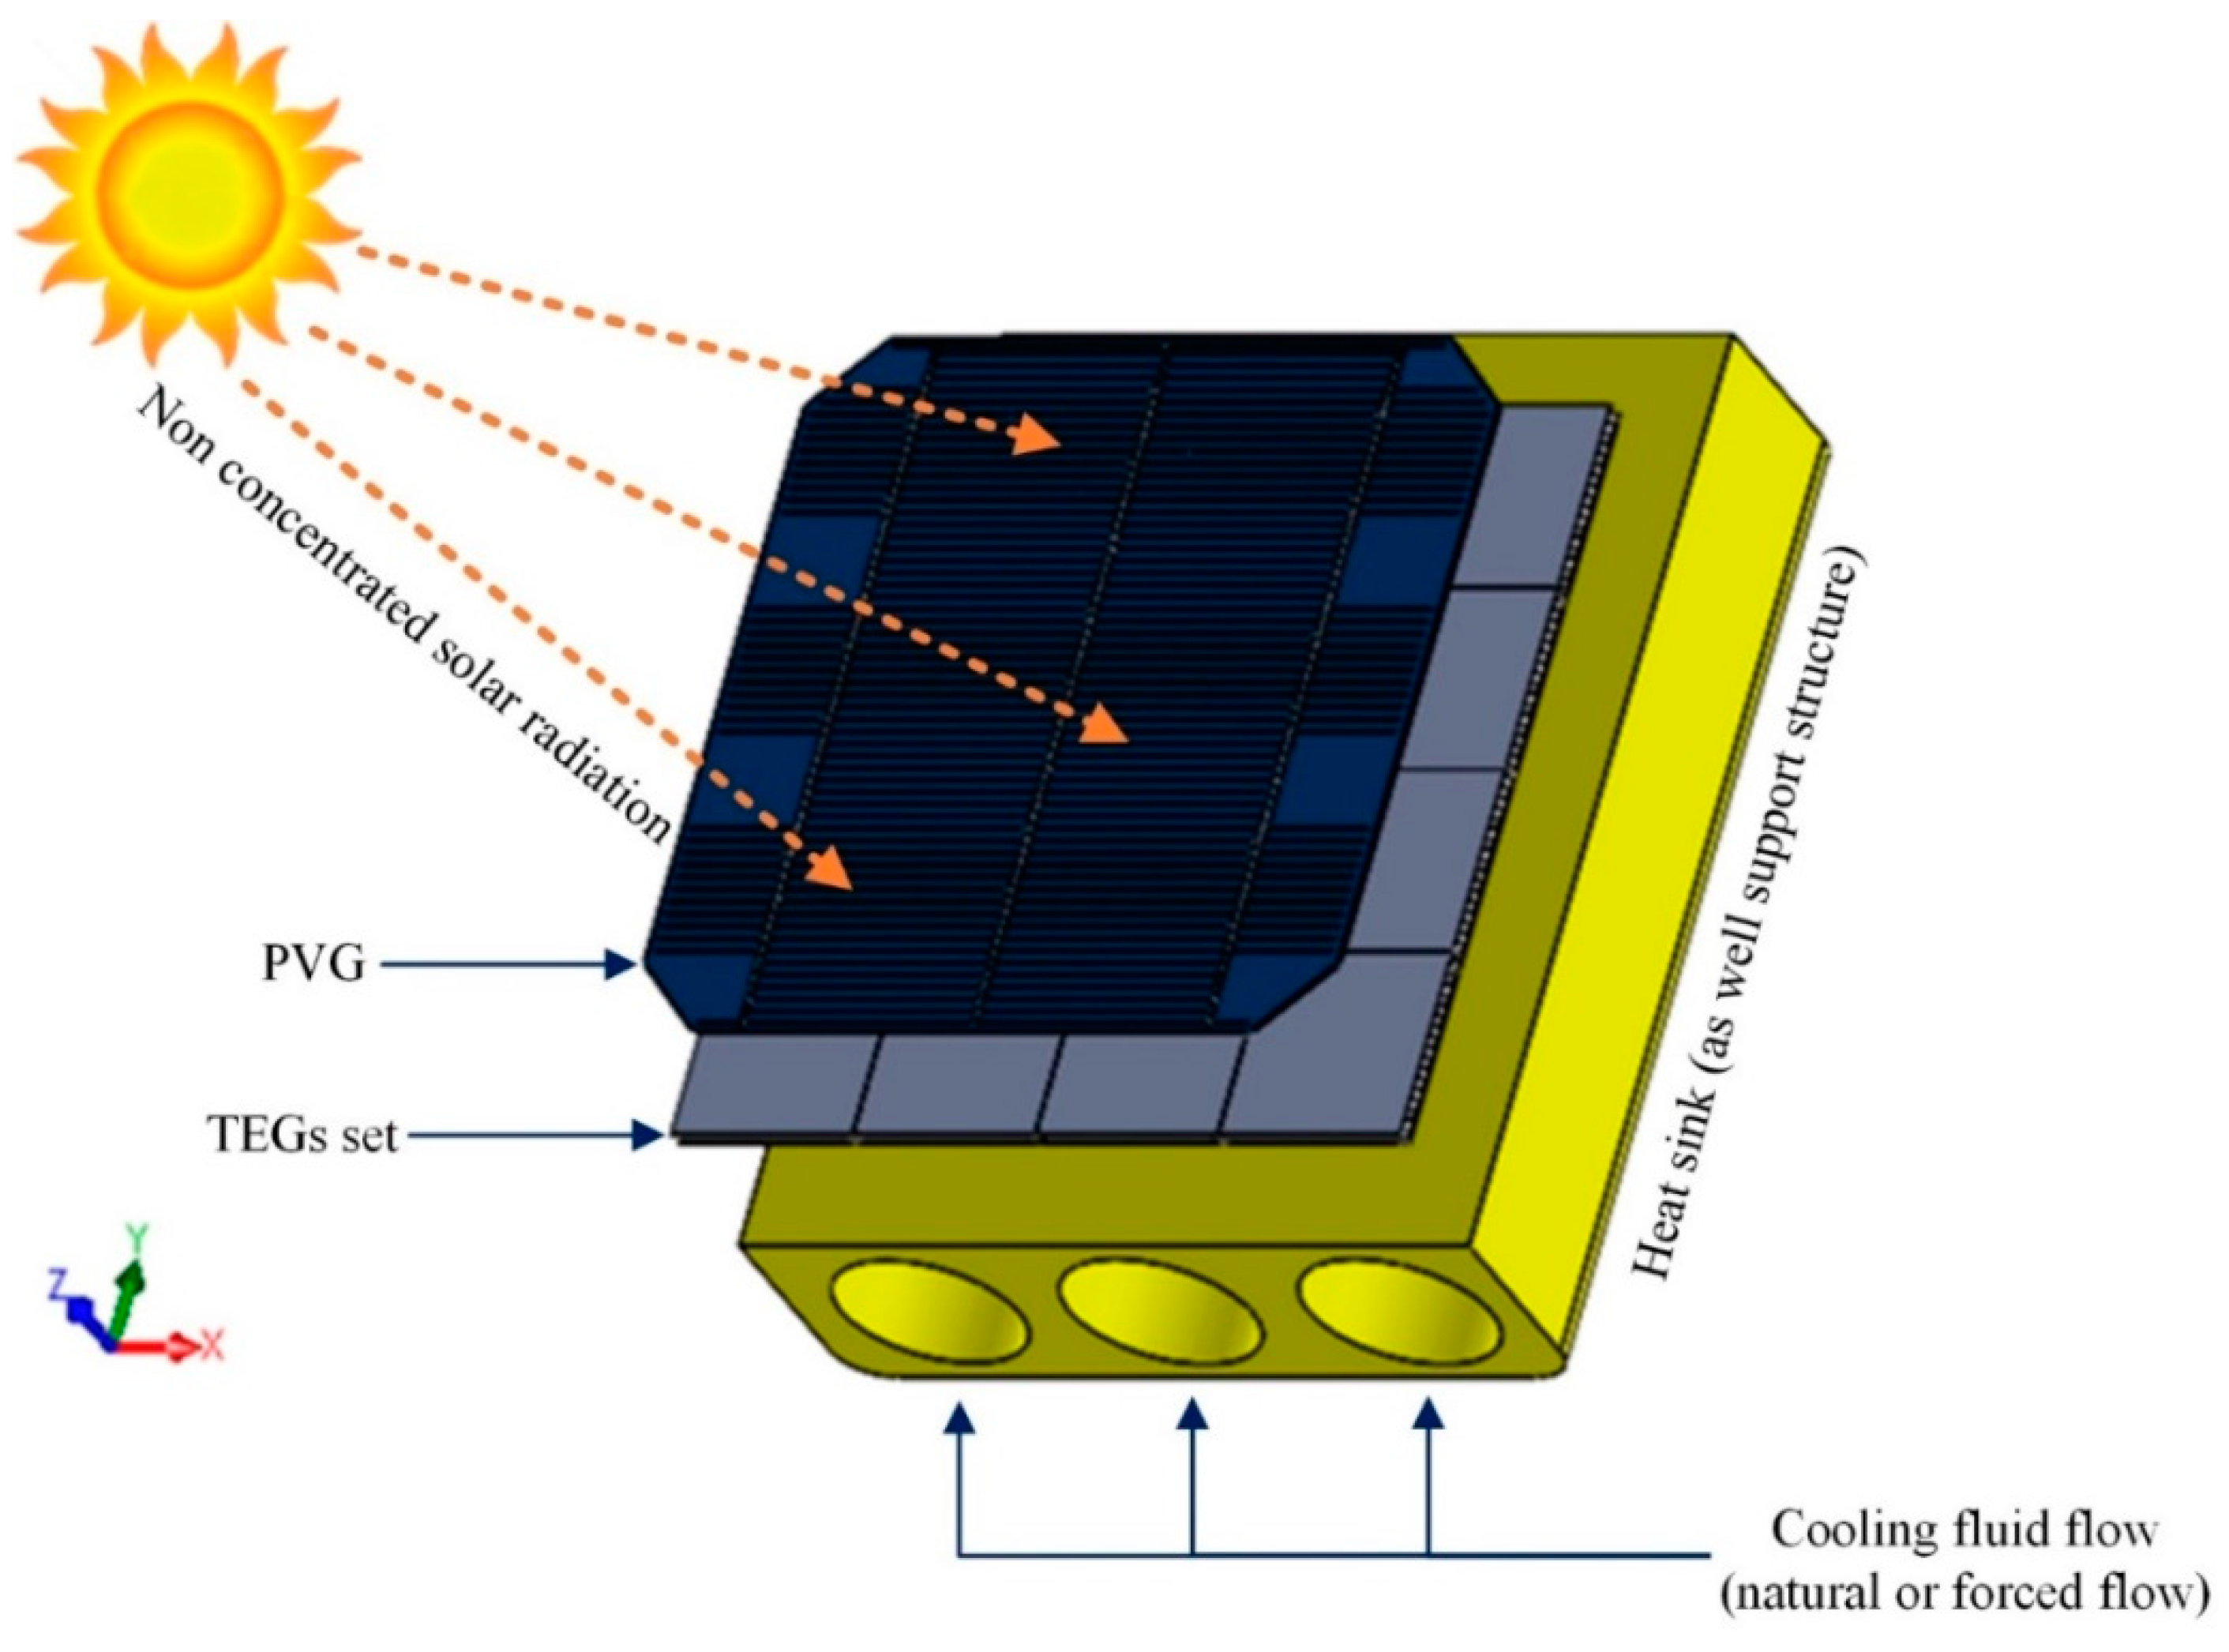
The proposed STEG device (
Figure 5) consists of an arrangement formed by a single crystalline silicon PVG device (Neo Solar Power™, Hsinchu, Taiwan), model NS6WL.2060, with side of 15.67 cm. The TEGs set used in the arrangement is formed by 16 inbC1-127.08HTS modules (WAtronix™, West Hills, CA, USA), with 4 cm side.
The non-concentration STEG device is coupled to a passive or active heat removal system to maximize the temperature gradient. At first, undrained vertical heat pipes (thermosiphons) can act as heat sinks at the rear of the system (passive cooling); note that the fluid contained within the thermosiphon must have a saturation temperature slightly above ambient temperature to ensure proper cooling of the device. In this sense, it would also be possible to couple the generator system to ducts with regular fluid flow at or below ambient temperature (active cooling), ensuring an adequate temperature gradient. An isothermal surface was implemented during the modeling process, considering the monthly average ambient temperature acting on the cold face of the TEGs set.
It is noteworthy that the STEG of
Figure 5 optimizes the PVG performance while maximizing the amount of energy harnessed as it allows the control of the temperature of the PVG and simultaneously promotes an increase in the incident solar radiation conversion rate; note that in addition to harnessing the remaining thermal energy, the TEGs layer also acts a complementary cooling system for PVG. The portion of the residual thermal energy not used by the TEGs set is transferred to the heat sink that also serves as a support structure for the STEG device. This proposal stands out in the following aspects:
- (i)
Built-in cooling system: initially based on passive recirculation of a cooling fluid that takes advantage of its specific mass change within a thermosyphons to promote heat exchange, although it would also be possible to use an active cooling system (for instance, ducts with regular fluid flow at or below ambient temperature);
- (ii)
Compact layout: as it physically couples the constituent elements in parallel, taking up diminutive space;
- (iii)
It uses easily accessible components: the constituent elements of the proposed STEG are easily found in electronic parts stores, so it is possible to assemble and implement the device anywhere.
3. Device Assessment
This section presents the tests and analyzes performed in order to evaluate the response of the new non-concentration STEG and the behavior of its main components operating separately.
3.1. Photovoltaic Generator (PVG)
The PVG NS6WL-2060 datasheet, manufactured by Neo Solar Power
® and used in this research, is presented in
Table 1.
From the study of local solar geometry for the city of Foz do Iguaçu (Brazil), using the method proposed by [
3] and adapted from [
46] (Equation (5) to Equation (7)) it was possible to determine the number of average daily sun hours during each month of the year. The equivalent full sun hours was estimated from the database published by [
47]. The results are summarized in
Table 2.
From the information in
Table 1 and
Table 2 and considering the average operating temperature of the PVGs available in Brazilian market (45.85 °C) [
49], the local efficiency of the PVG and its respective maximum electric power was determined following the method proposed by [
50], using Equation (8) to Equation (10).
Alternatively, it is possible to estimate the peak power of the PVG by the method proposed by [
3]. In this case, the maximum power delivered by the analyzed PVG as a function of operating temperature and actual local irradiance, considering the average NOCT temperature of PVGs available in Brazilian market, is given by Equation (11) [
3]. The results of this approach for the average PVG monthly power produced are also presented in
Table 3.
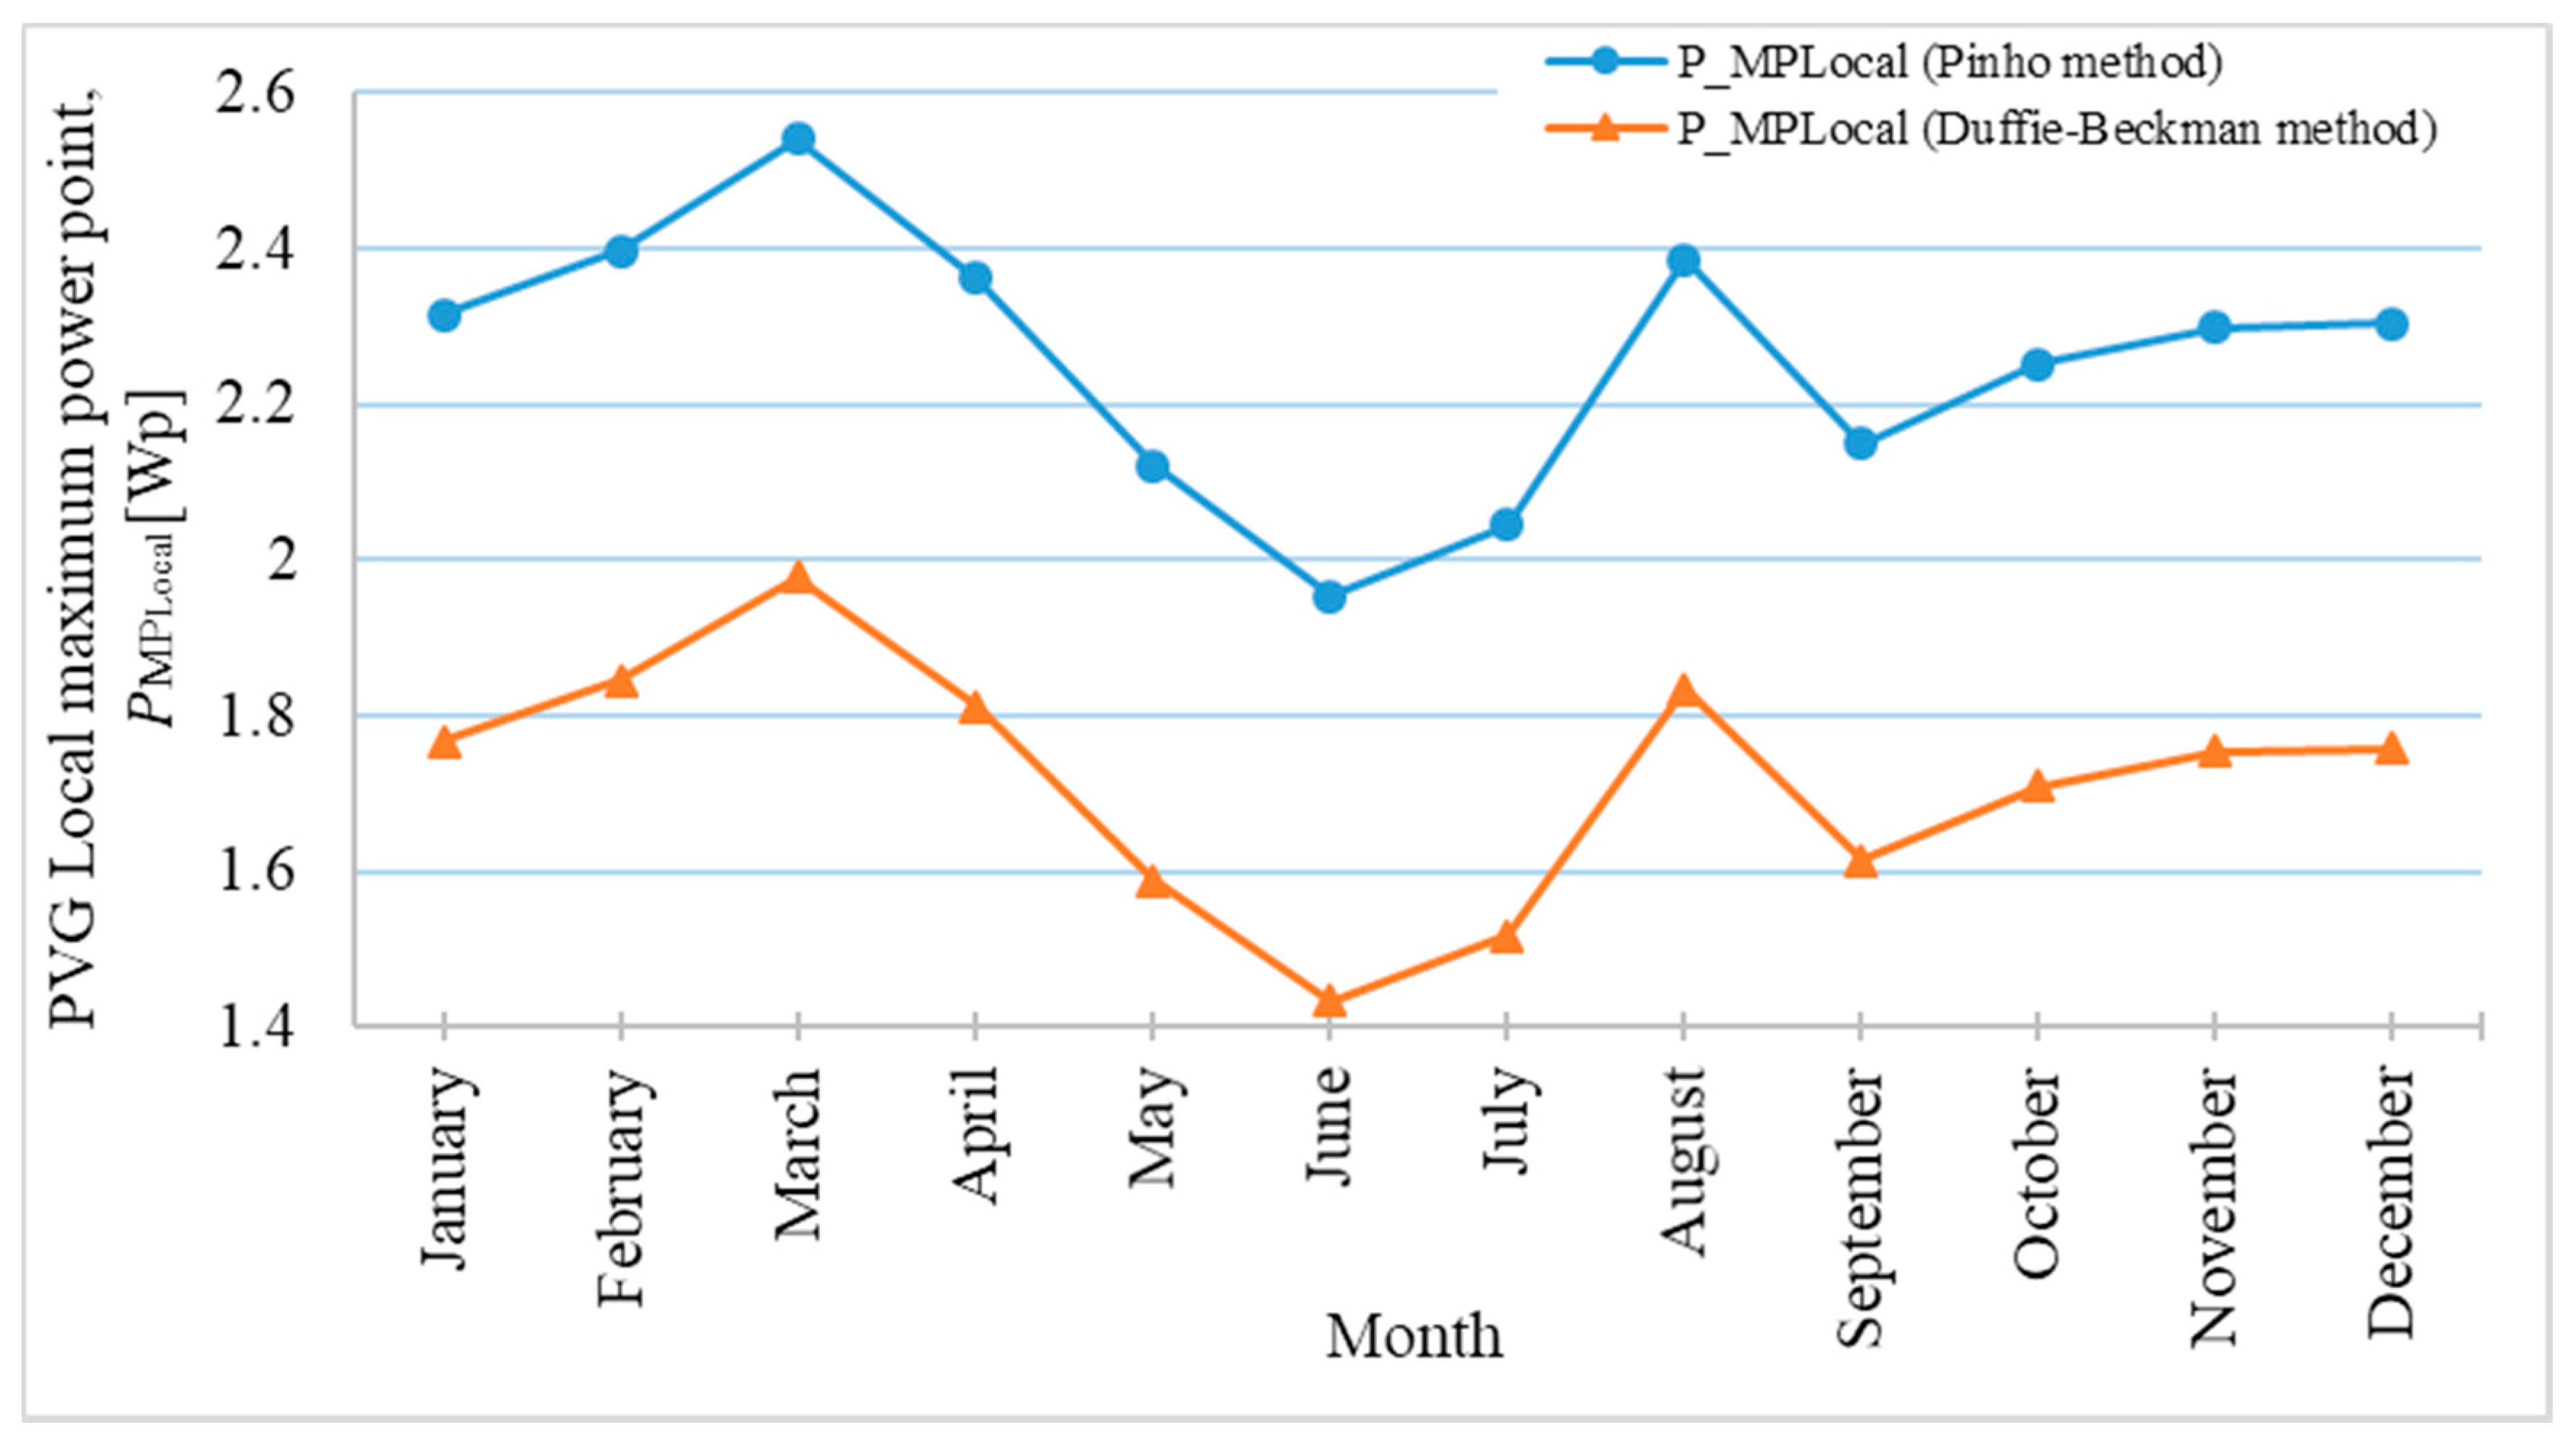
Thus, the electric power generated at the maximum power point condition of the PVG, under the monthly average local irradiance, ranges from 1.43 to 1.98 Wp (Duffie–Beckman method) and between 1.95 and 2.54 Wp (Pinho method). The behavior of the PVG local maximum power obtained by both Pinho and Duffie–Beckman methods are consistent, as shown in
Figure 6, although the magnitudes present an average divergence of 22.35%. It should be noted that during the southern hemisphere winter equinox, the critical month (June) has the lowest year-round solar energy yield rate.
3.2. Thermoelectric Generators (TEGs set)
The proposed STEG is integrated by 16 WAtronix™ inbC1-127.08HTS TEGs units, electrically connected in series. The validation of TEG performance used the characterization data previously published in [
51,
52,
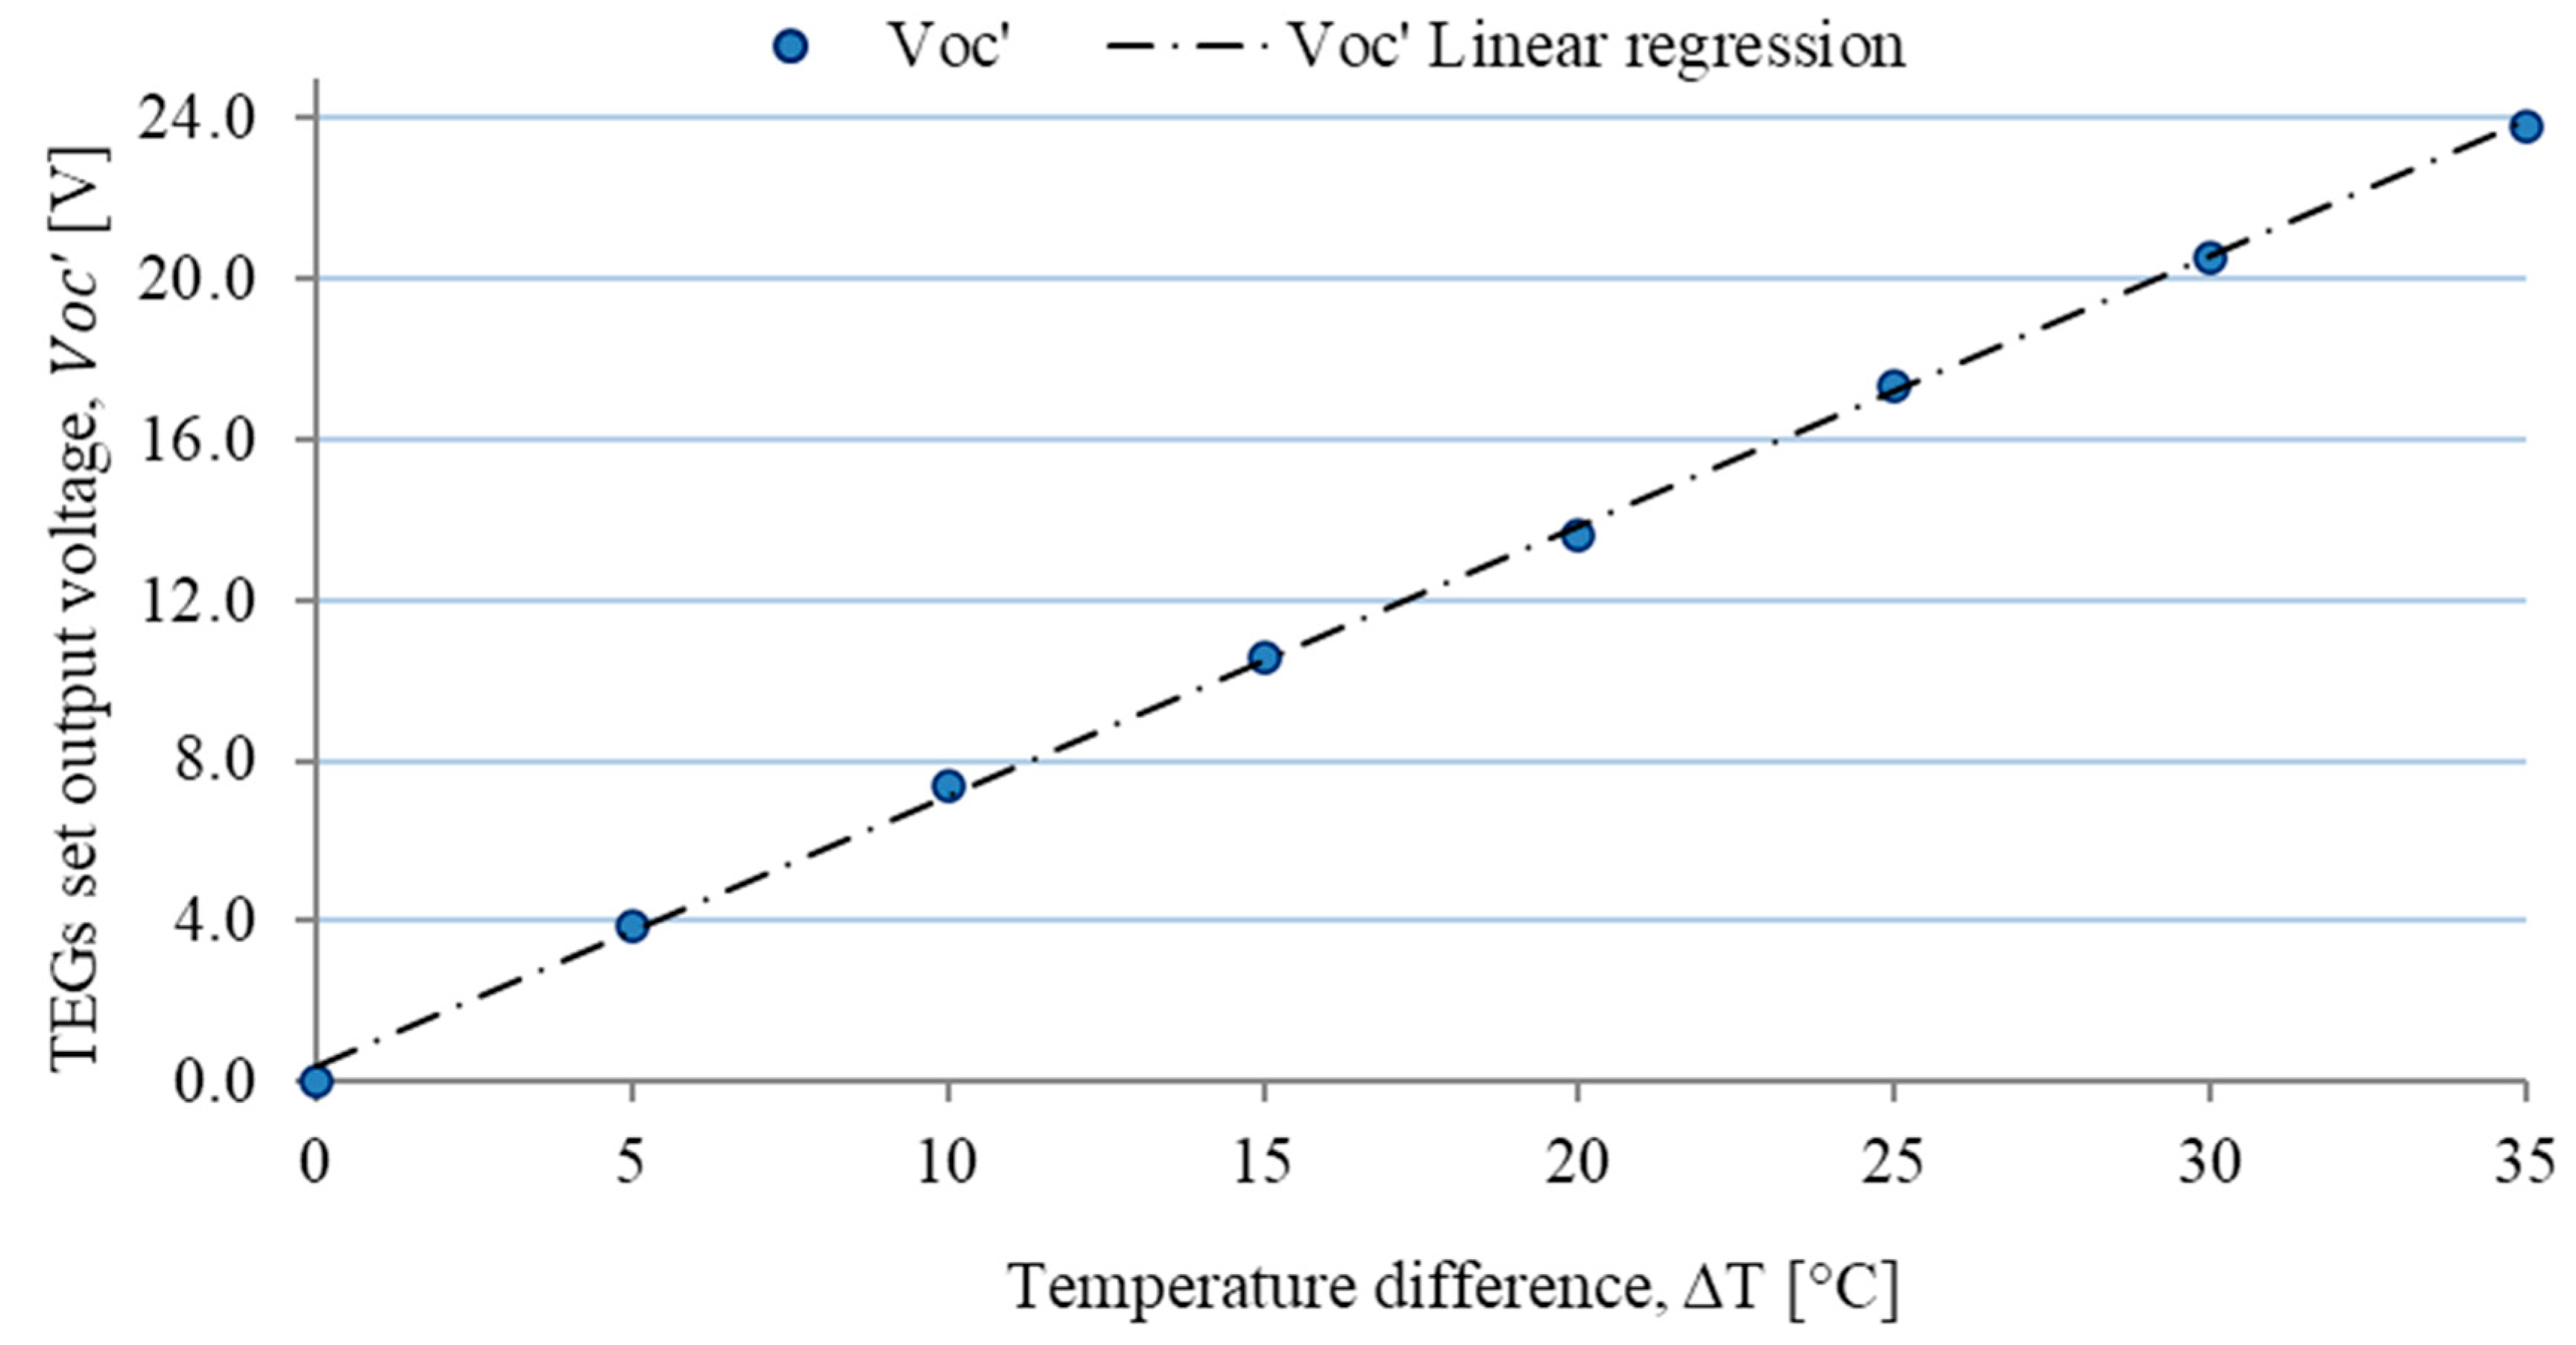
53] through both open circuit and resistive load tests. During TEG set tests, the average temperature of the cold face was 22.29 °C. Based on the test results, the data were extrapolated and adapted from the general theory of direct current electric circuits.
The TEGs set open circuit test allowed determining the variation of the output voltage (
) at no load condition for contrasting temperature differences (∆T) as shown in
Figure 7.
Note that the open circuit voltage varies linearly with the temperature difference. Thus, by applying the least squares method, it is possible to determine a linear expression for the TEGs set output voltage as a function of the temperature difference, given by Equation (12).
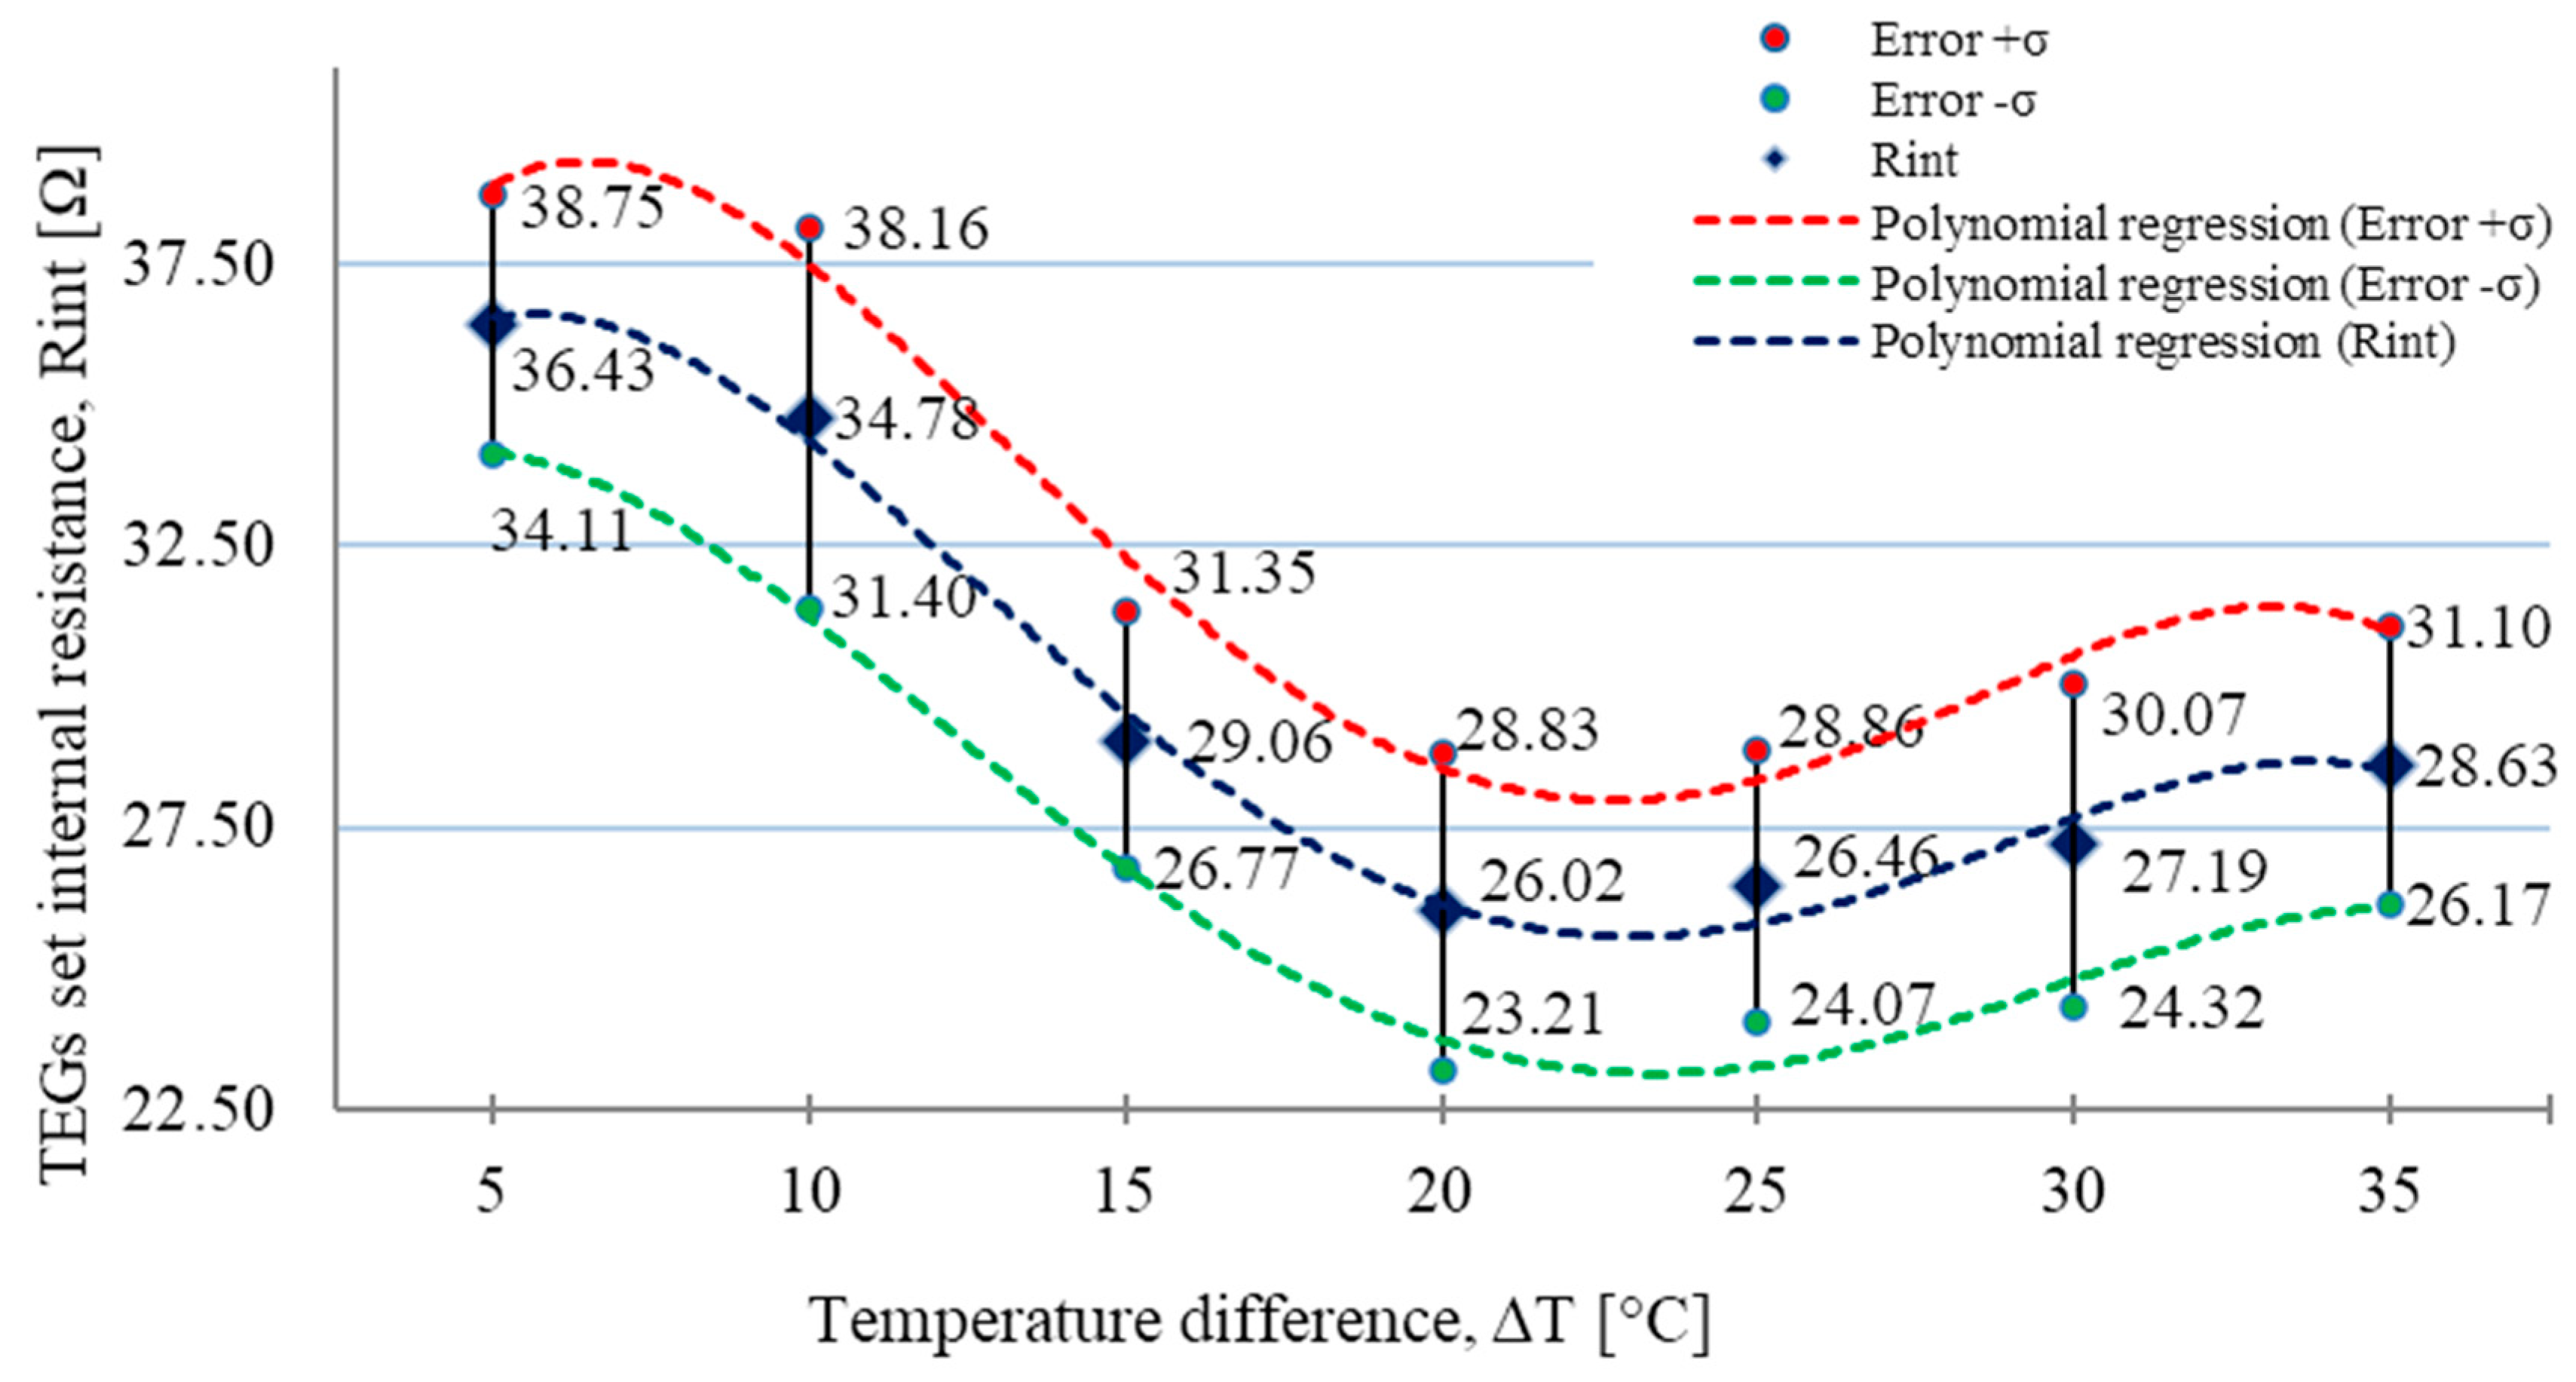
By analyzing the behavior of the internal electrical resistance of the TEGs set with the temperature difference variation (
Figure 8) it can be seen that there is a fourth-degree polynomial relationship between the internal resistance and the temperature difference variation (Equation (13)). The average internal resistance of the TEGs set is 29.80 Ω and its respective standard deviation is ± 2.64 Ω.
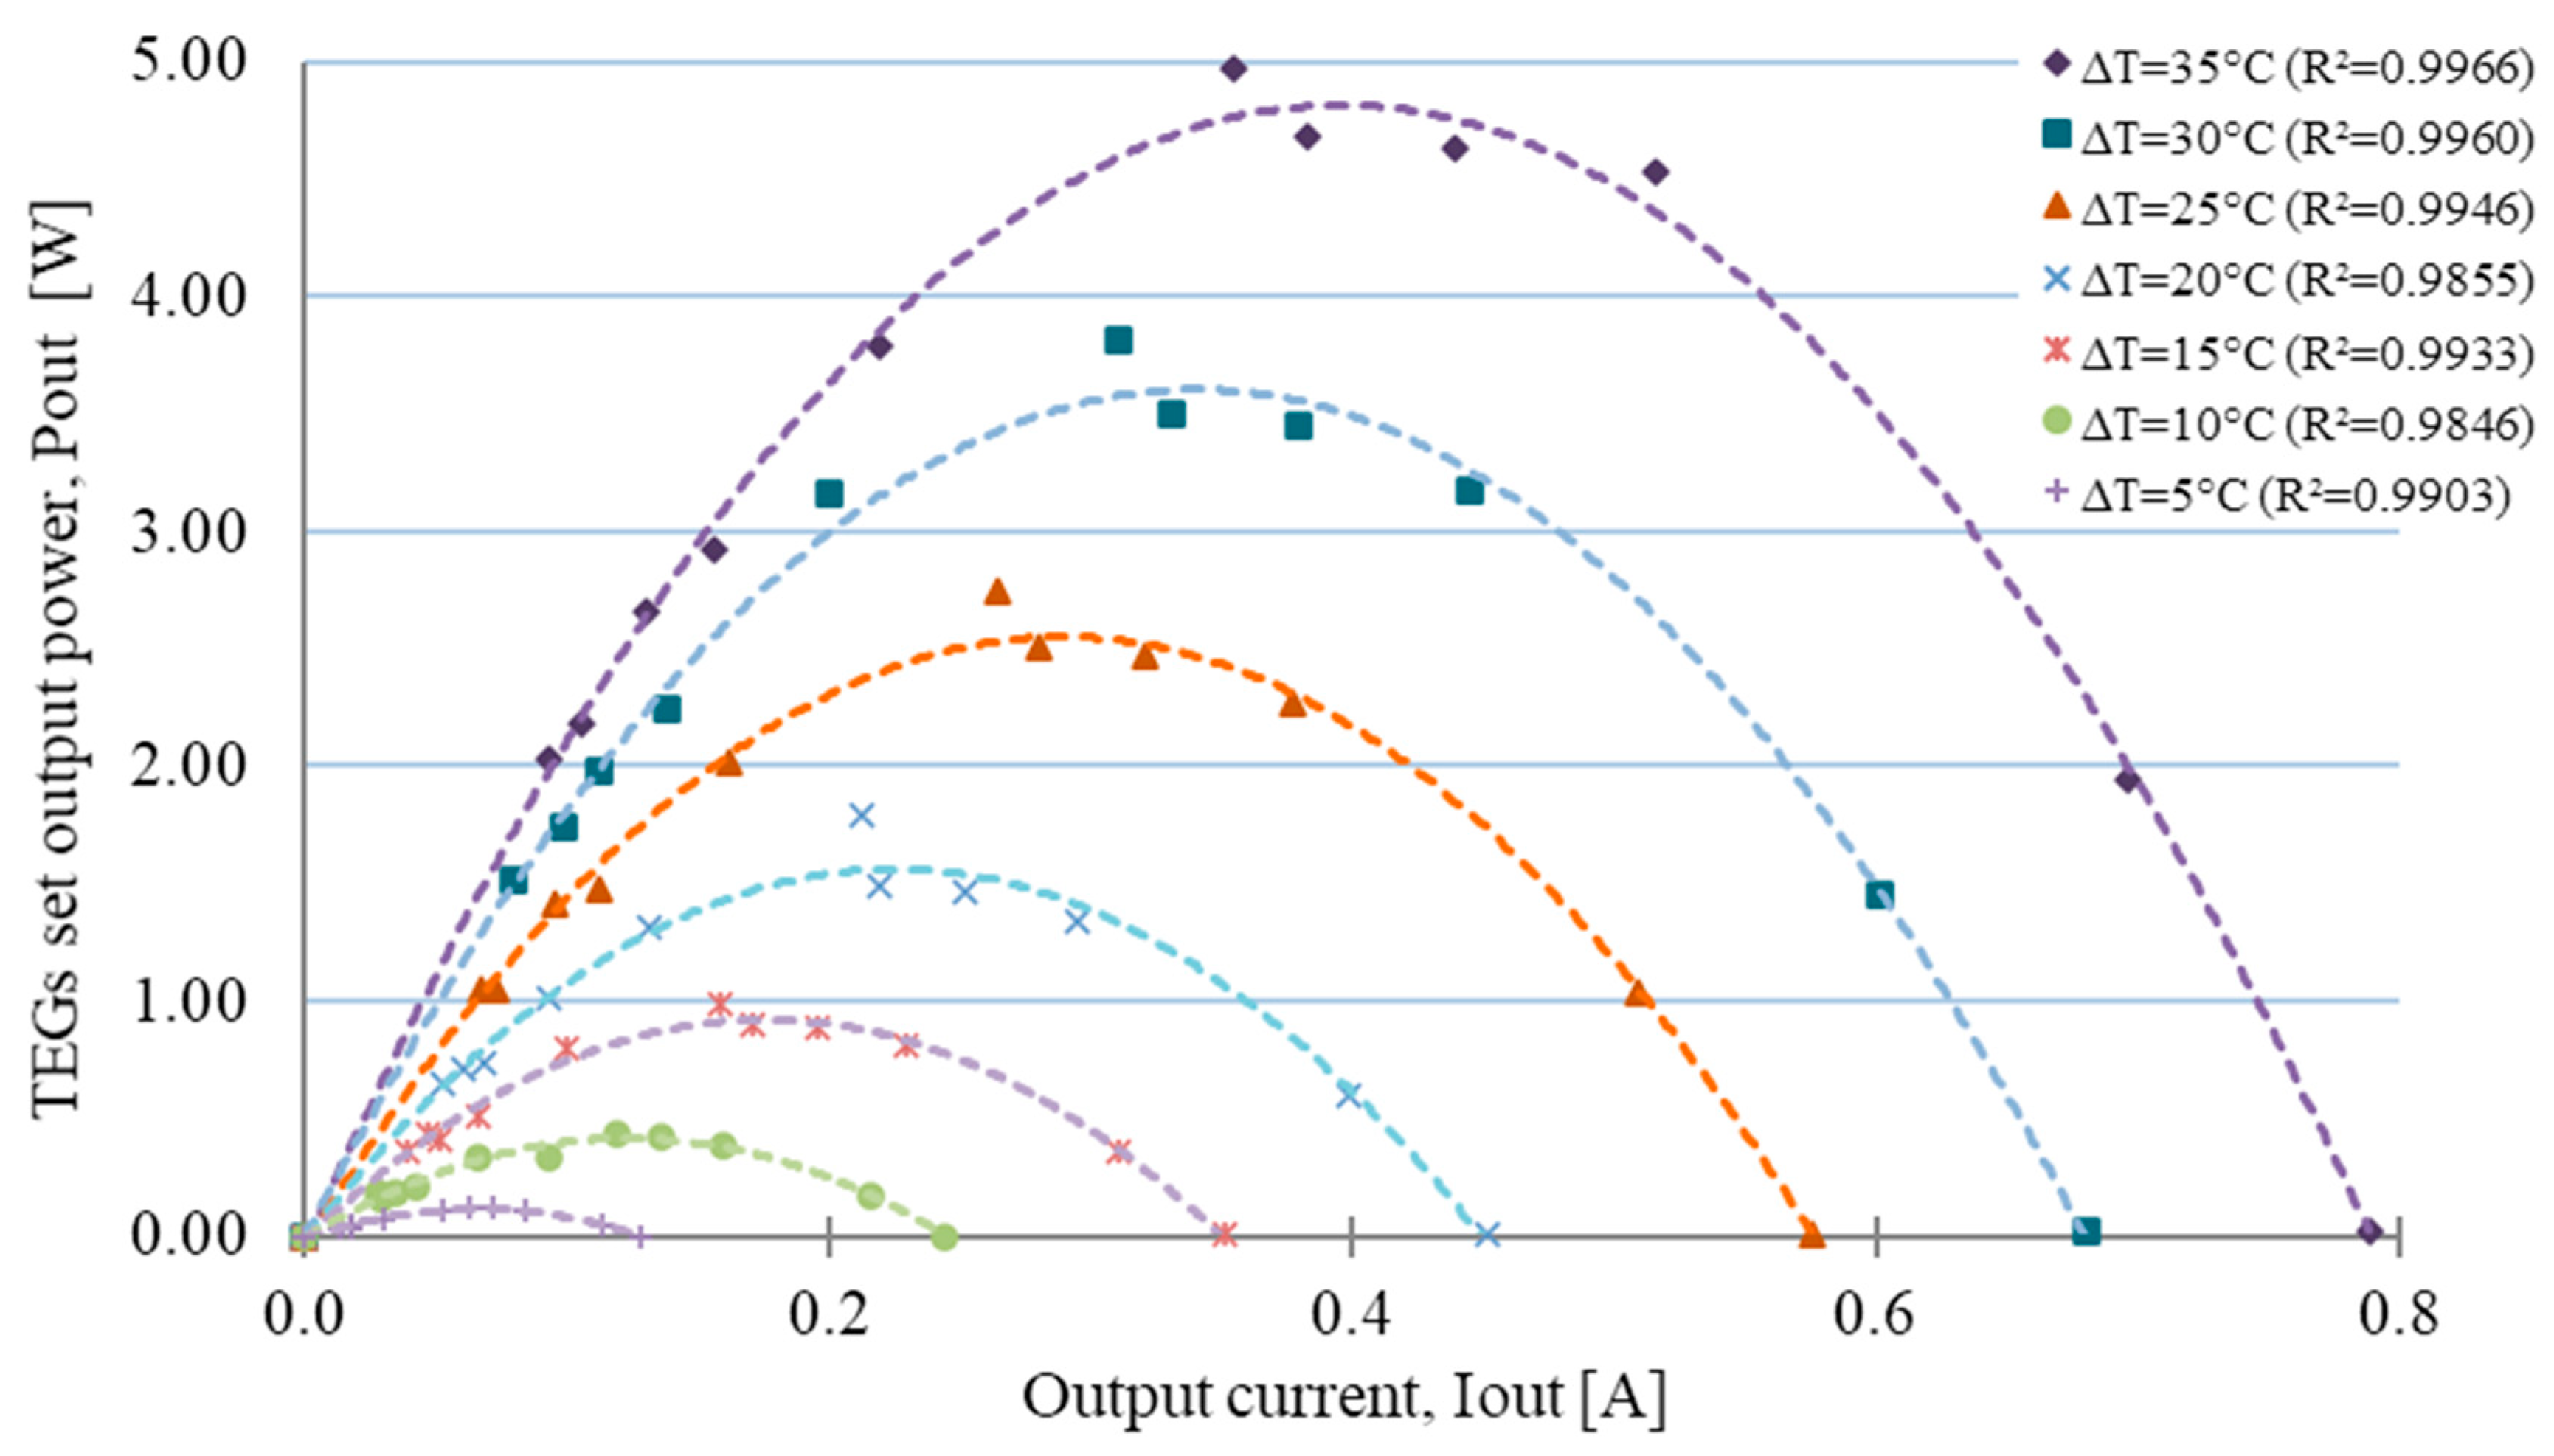
The load test allowed to determine the I
out, V
out and P
out for different resistive loads under different temperature gradients. Analyzing
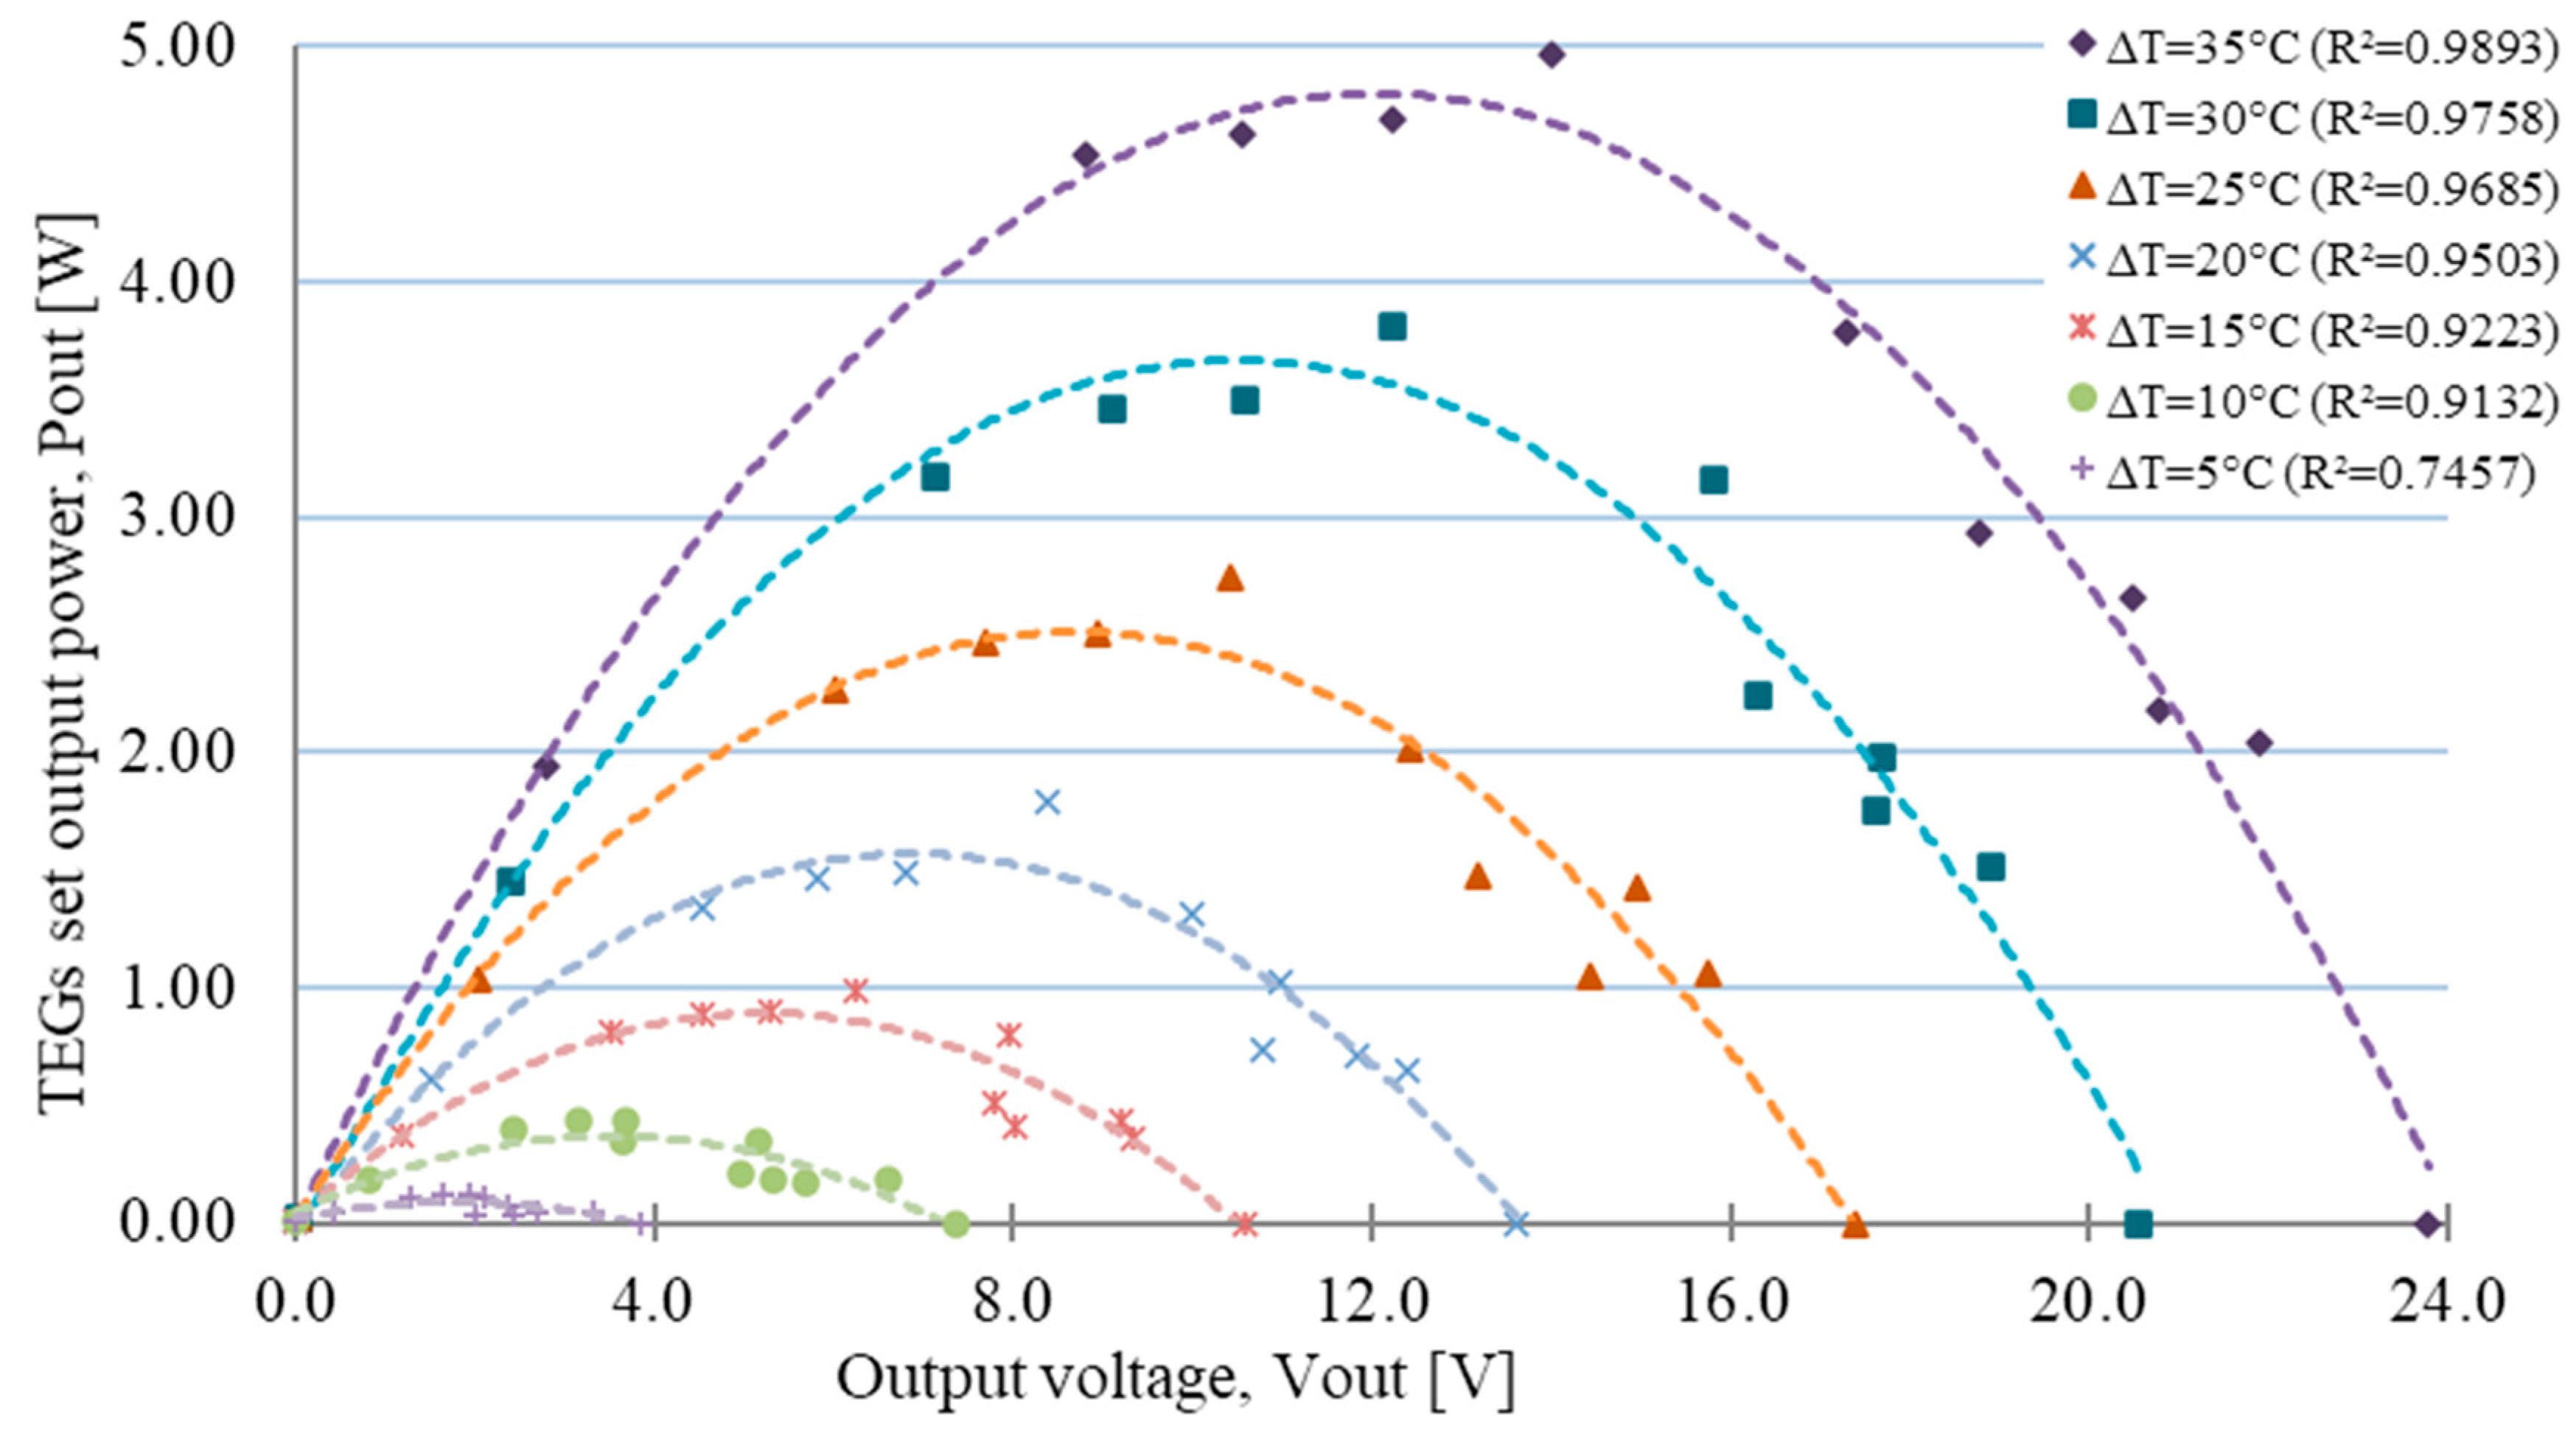
Figure 9, it is possible to notice an increase in the Pout proportional to the increase in the temperature difference for different I
out; as well from
Figure 10 it was observed a similar behavior for the P
out as a function of V
out as the temperature difference increases. Test data were required to determine the actual power delivered by the TEGs set during the STEG operation, as well as to establish the resistive load that ensures a maximum power transfer.
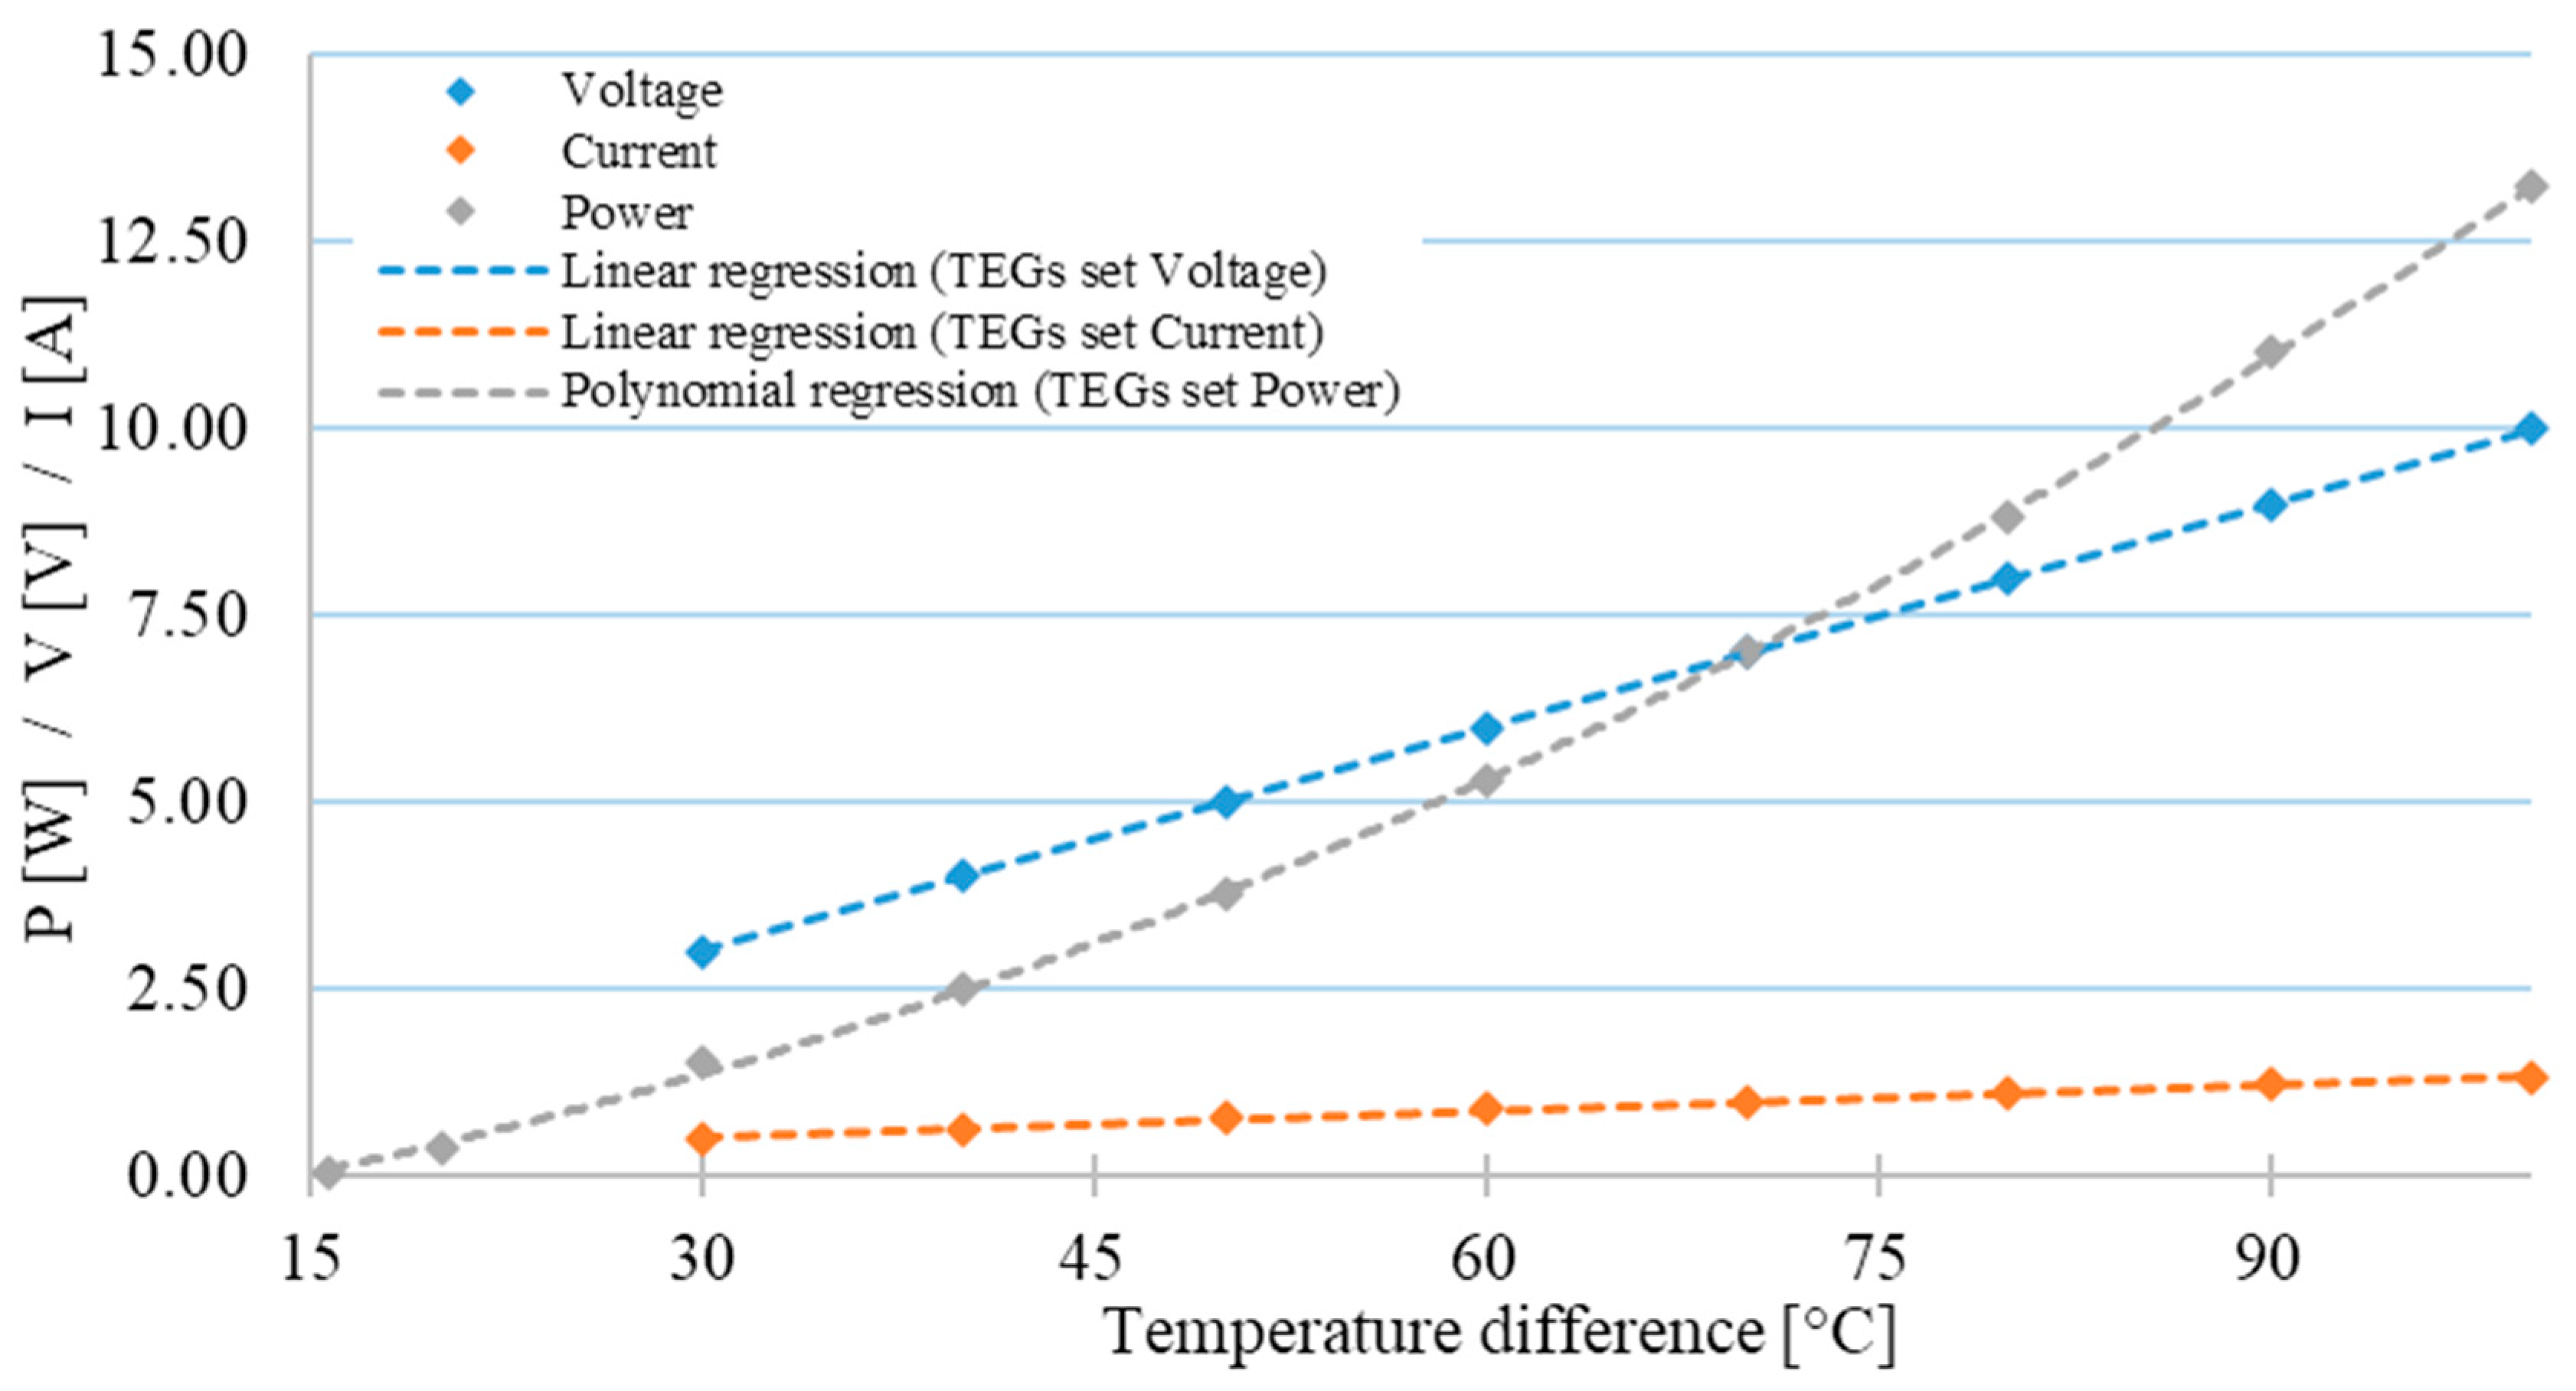
The power of the TEGs set can be established through the operating curves provided by its manufacturer. Note that by extrapolating the data shown in
Figure 11 it is possible to define an expression to determine the TEGs set power as a function of the temperature difference in steady state operation, as shown in Equation (14).
3.3. Hybrid Device—STEG
As proven by [
15], the actual operating temperature of a silicon PVG can reach up to 76.7 °C when no cooling system is available, while the average NOCT temperature of monocrystalline silicon modules sold in Brazilian market is around 45.85 °C [
49]. On the other hand, based on simulations performed under Foz do Iguaçu city irradiance conditions, the used arrangement with cooling system can reach a temperature of up to 39.24 °C in summer equinox and 31.49 °C in winter equinox (critical month).
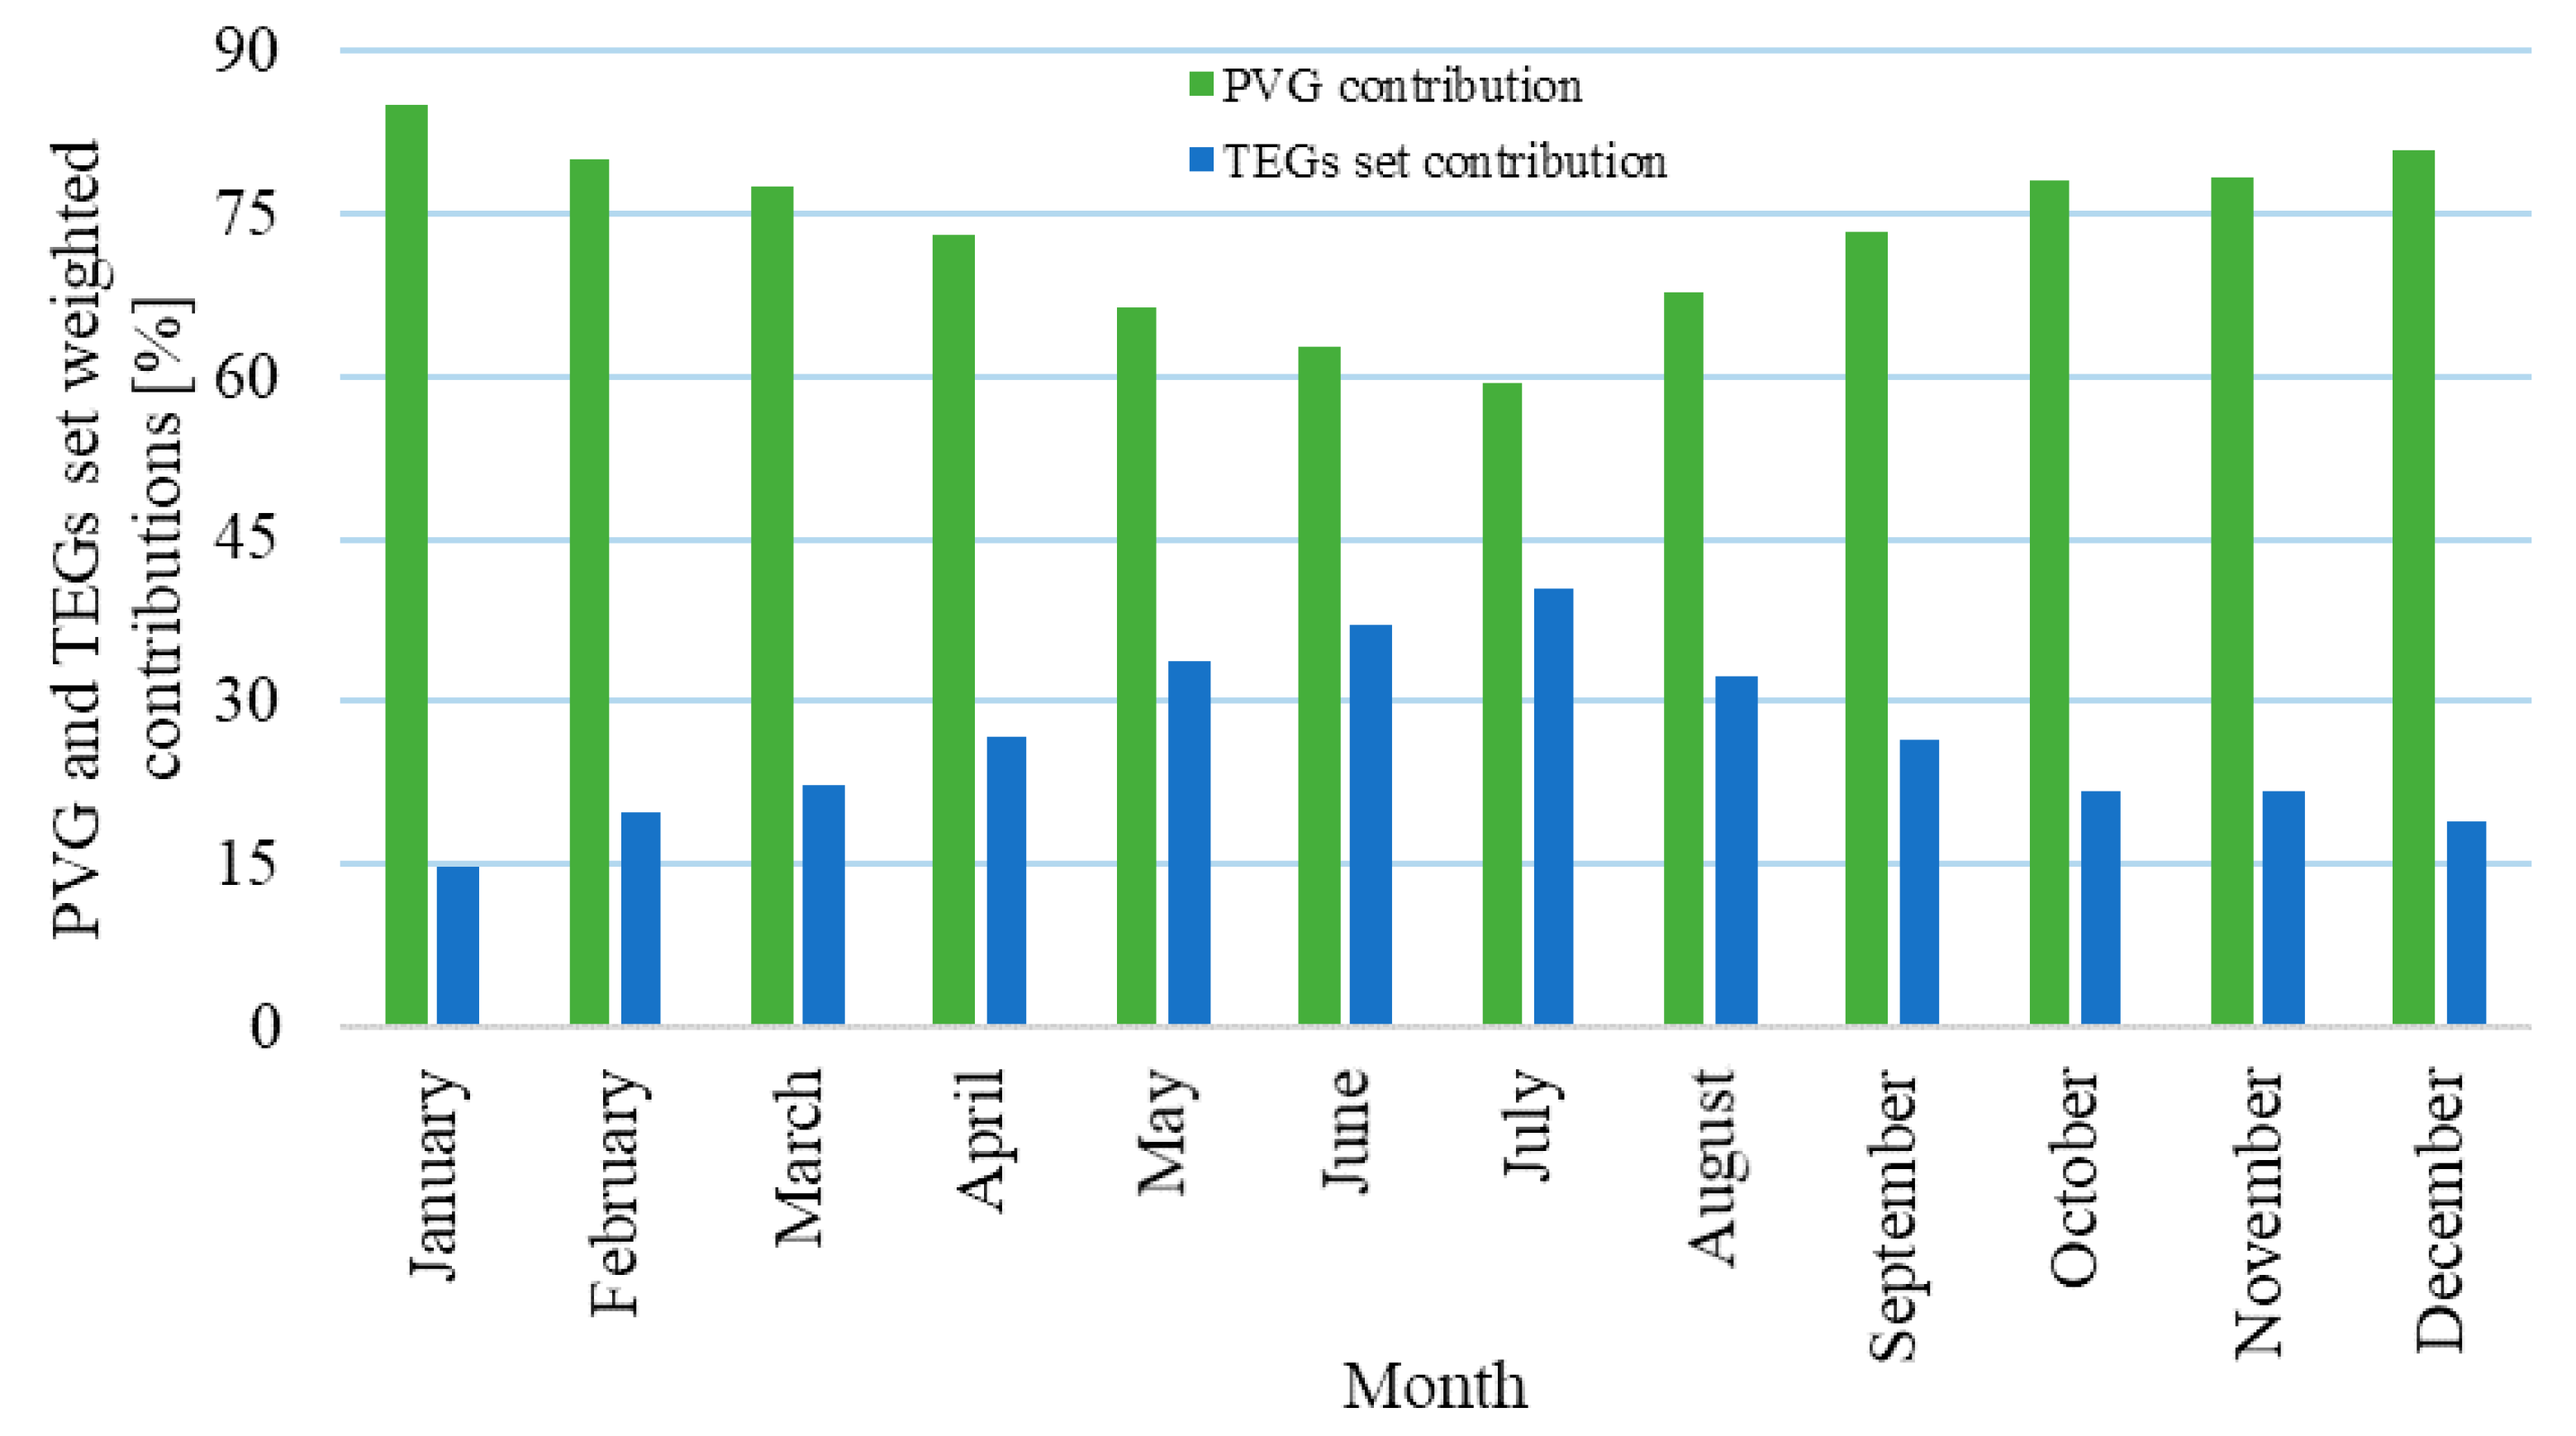
Assuming the average PVG NOCT of monocrystalline silicon modules sold in the Brazilian market (45.85 °C) as the TEGs set hot face temperature and the monthly average ambient temperature as the TEGs set cold face temperature, i.e., the saturation temperature of a fluid circulating inside the vertical thermosiphon (passive cooling) or the presumed temperature of the forced flow inside the heat sink (active cooling), an average annual production of 2.72 W is expected from de proposed STEG device. The average annual TEGs set production is 0.73 W while the average annual PVG production is 1.99 W. These results are detailed in
Table 4 and the weighted contribution of each technology is presented in
Figure 12.
The inherent cooling effect of the TEGs set installation on the back of the PVG has not yet been inserted, when this happens (see
Section 3.3.2) the temperature gradient should fall substantially, as a consequence of the first law of thermodynamic, until reaching thermal equilibrium.
3.3.1. Modeling Strategy
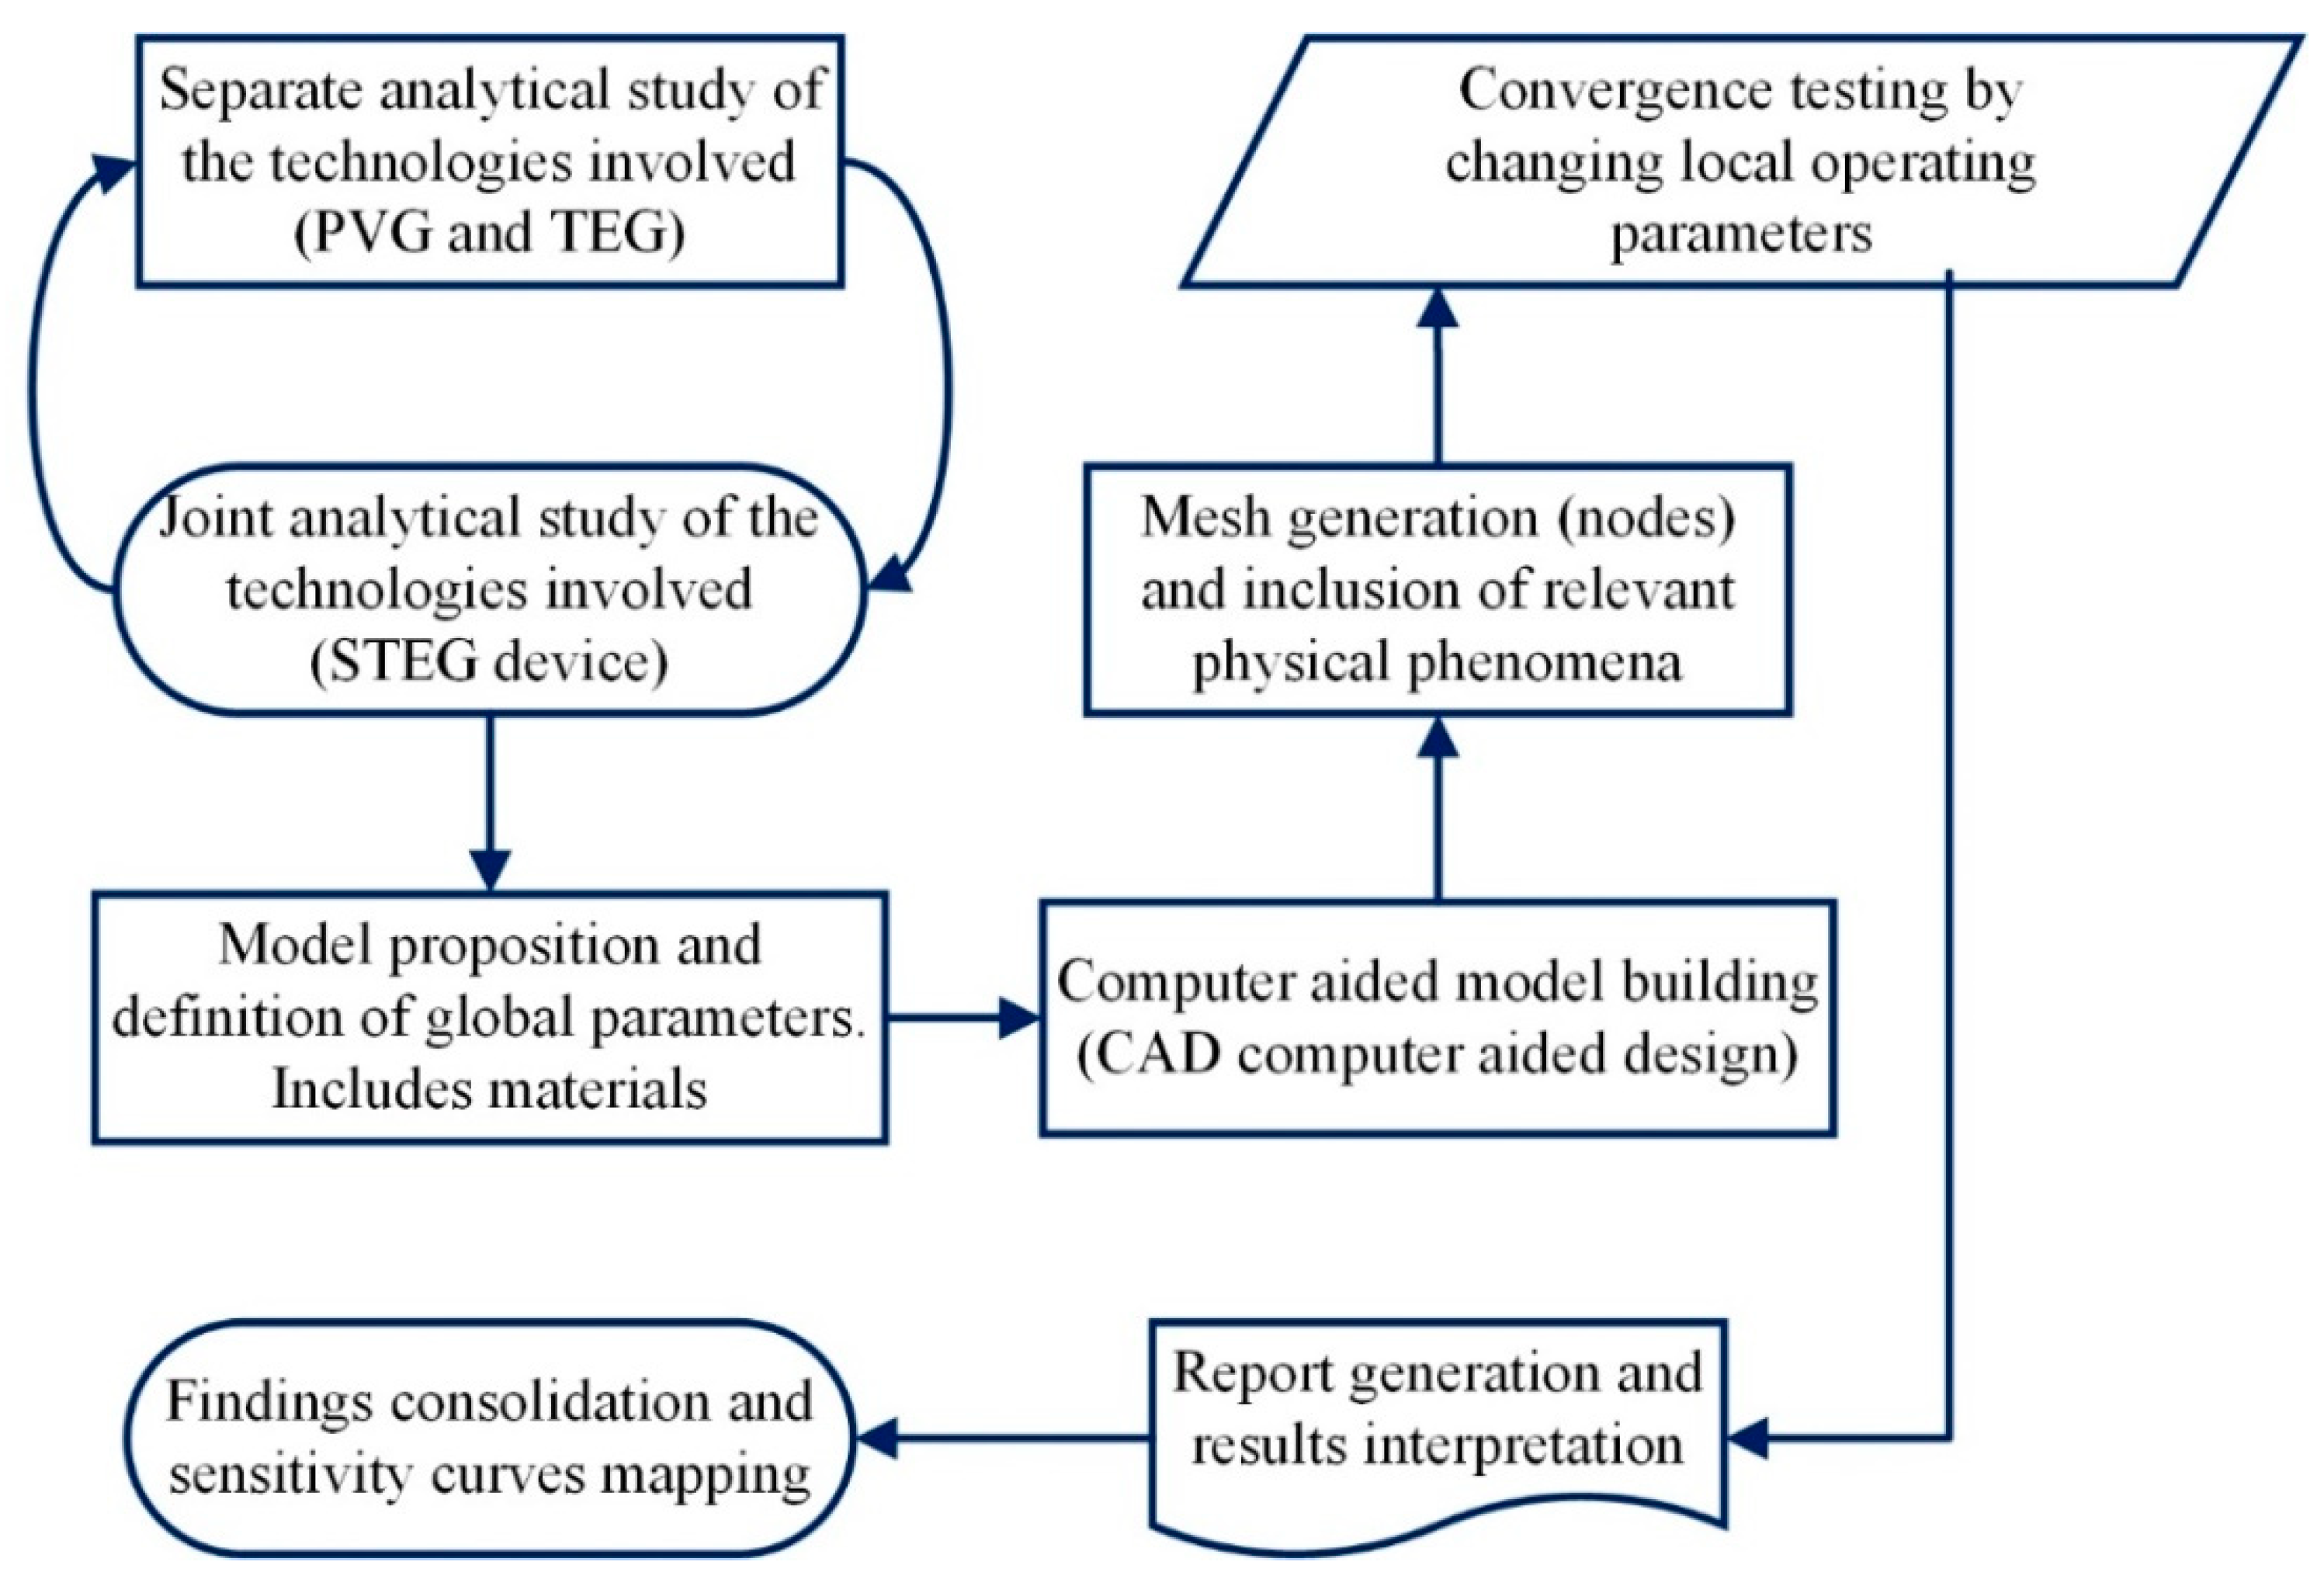
The proposed STEG was modeled according to the flow chart presented in
Figure 13. Initially, both technologies used by the STEG device (PVG and TEG) were evaluated separately. As a result of the analysis of researches published in the specialized literature and taking into consideration the commercial limitations of PVG and TEG devices a STEG computational model was developed (see
Section 3.3.2). The TEGs set was studied experimentally and the PVG behavior was forecasted using the COMSOL Multiphysics
® software, handling the data stated by the manufacturer and taking into account the local operating conditions. The numerical–experimental results were consolidated and the main findings are listed in this study.
The power generated by the STEG device corresponds to the sum of the power generated by both PVG and TEGs set, as described by Equation (15).
To determine the monthly amount of solar energy actually converted to electricity, simply integrate Equation (15) in relation to the STEG operating time; the integration interval is limited by the monthly average sun–hours per day presented in
Table 2. It should be clarified that the analytically determined powers from the boundary conditions correspond to a hypothetical steady state at the optimum operating point, but in practice it is impossible to achieve these results in a prolonged way given the intermittent nature of solar radiation itself.
3.3.2. Numerical–experimental Modeling
STEG’s numerical–experimental study is based on simulations using COMSOL Multiphysics
® software (Version 5.3, COMSOL Inc., Burlington, MA, USA) and derived from the previously presented laboratory data. The TEGs set was studied experimentally and the PVG behavior was forecasted using the COMSOL Multiphysics
® software, handling the data stated by the manufacturer and taking into account the local operating conditions. First, the thermal behavior of the prototype was established by simulating the representative STEG segment of
Figure 14 and then, considering the intensive nature of the temperature, extending the results to the entire STEG.
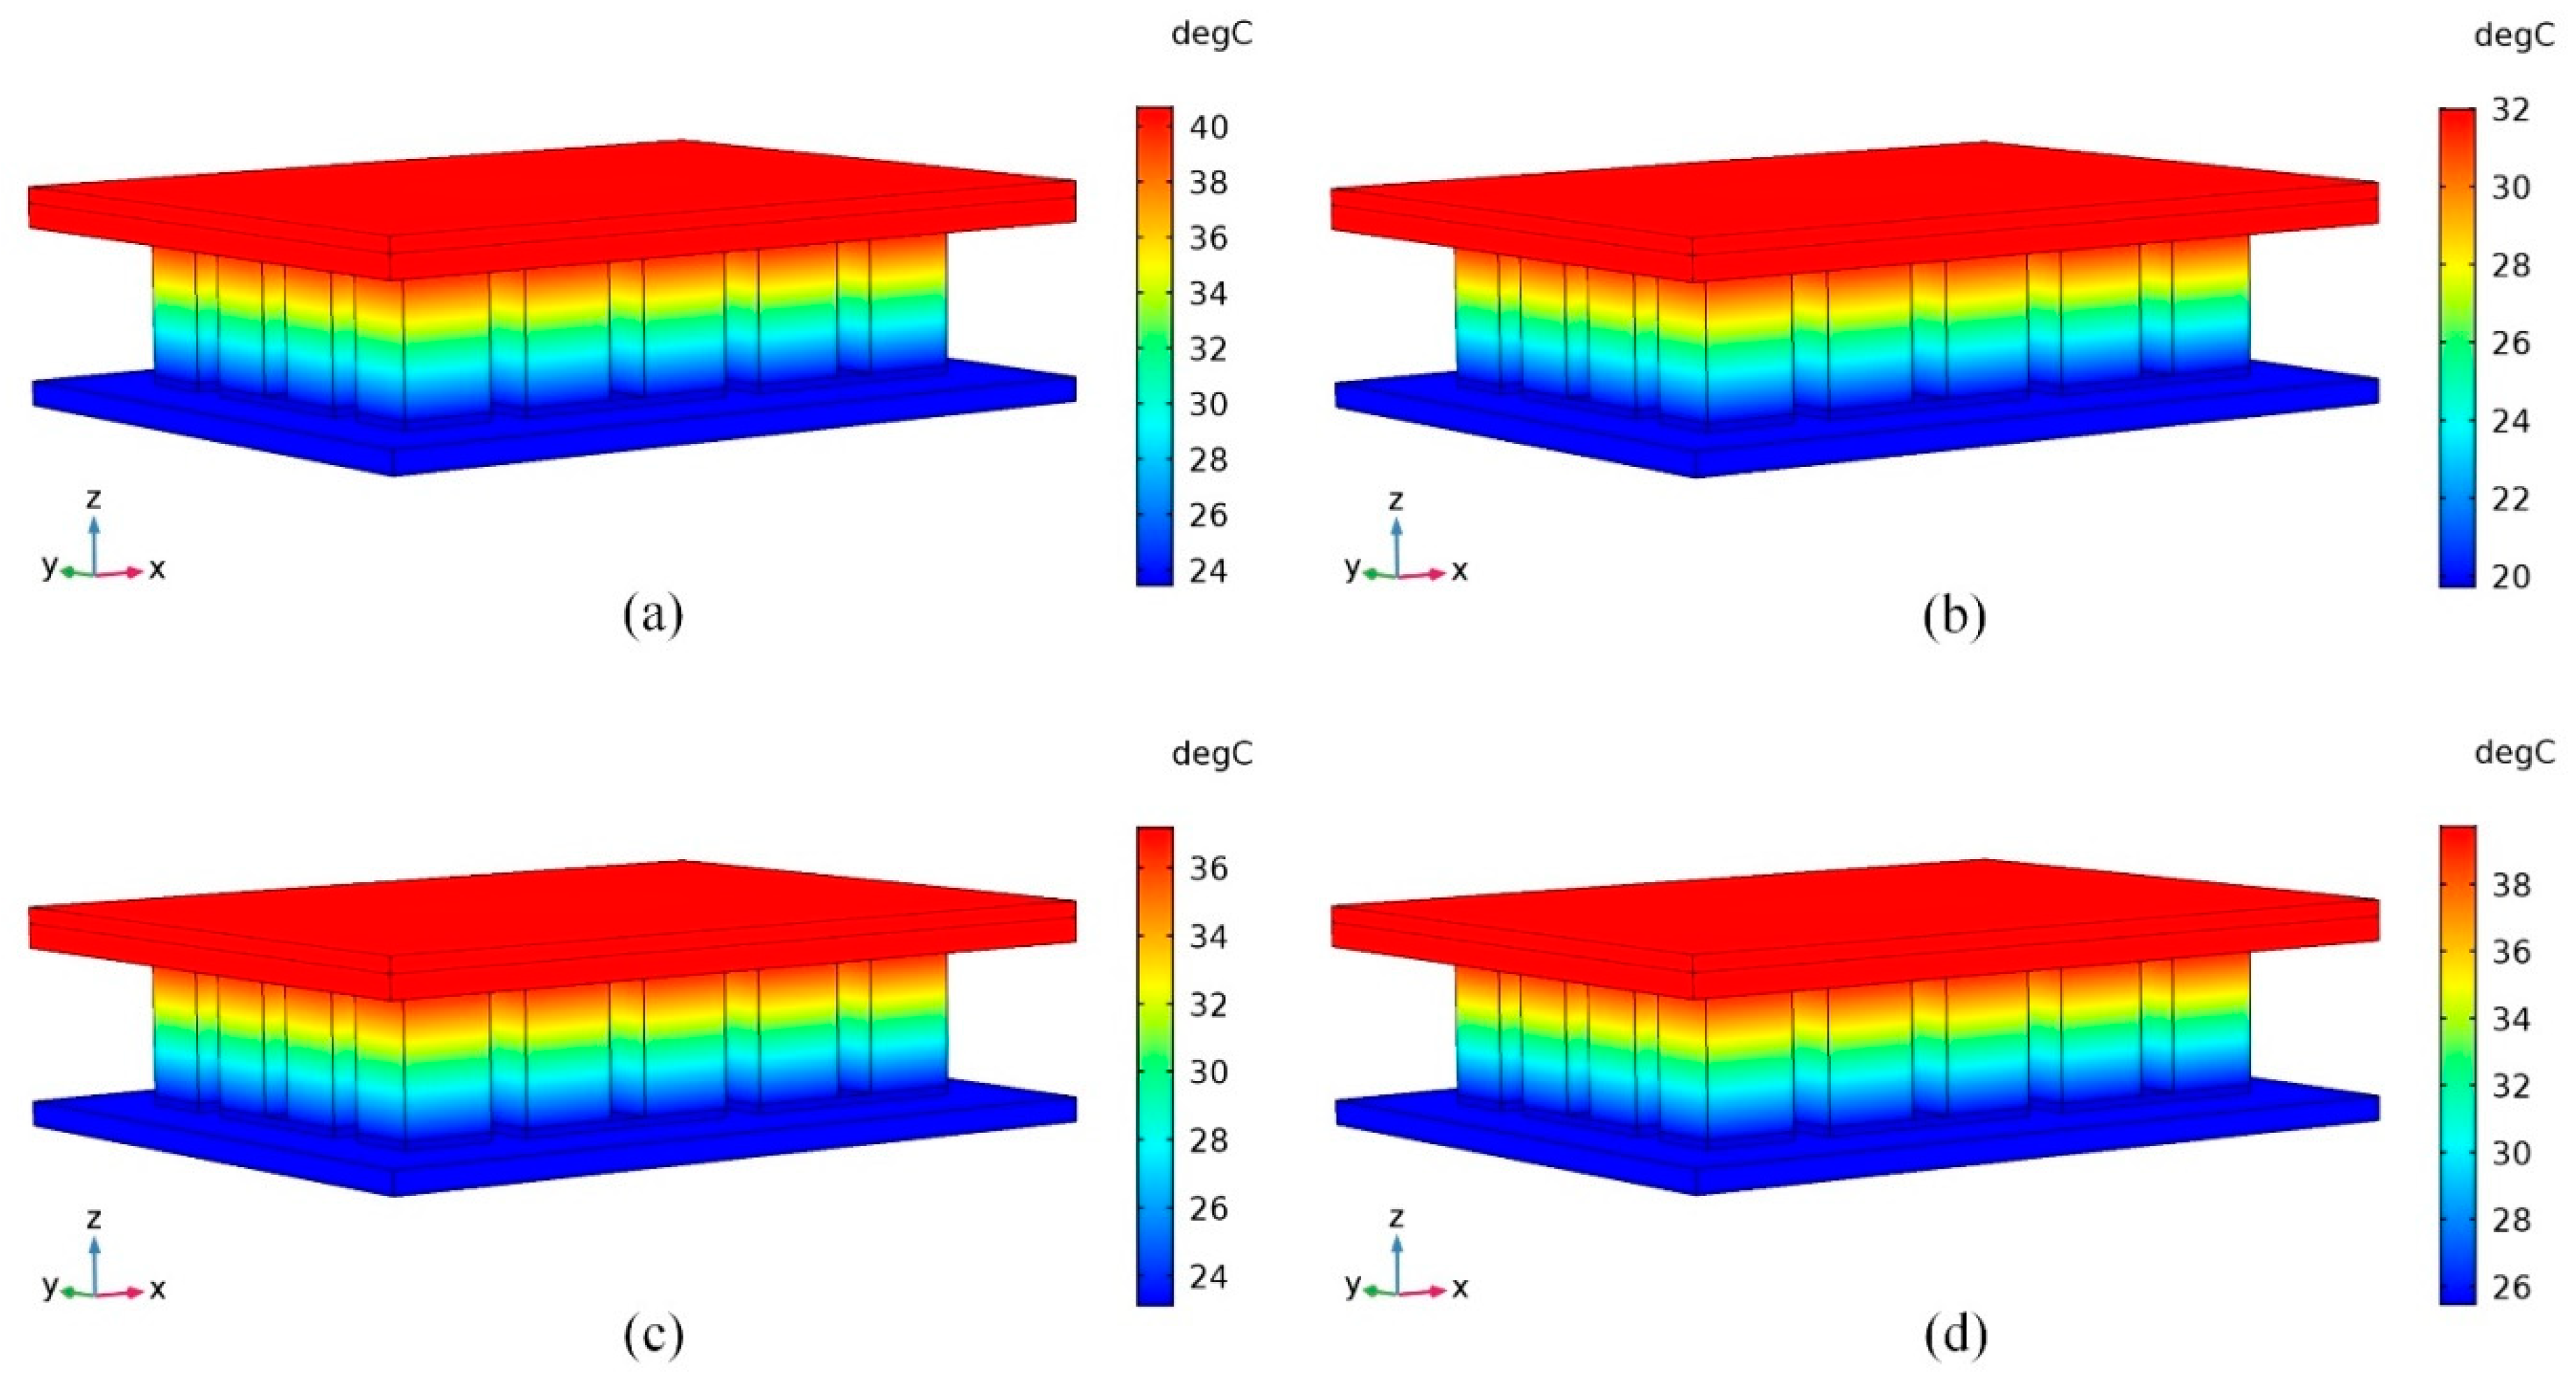
Once the global thermal behavior of the proposed STEG is known, both in the spring and fall equinoxes and in the winter and summer solstices—and considering the average monthly ambient temperature and irradiance conditions—different operating scenarios were analyzed. In this sense, non-concentration STEG operating without cooling system achieves operating temperatures of around 62 °C while the temperature distributions when the cooling system is present are shown in
Figure 15. The experimental-numerical study was developed for a geometric domain with 39,884.00 external degrees of freedom and 24,824.00 internal degrees of freedom.
For the purpose of numerical modeling, it was considered the ambient temperature limit cases in both solstices and equinoxes as well as their respective average irradiance rates. The simulations were performed to represent a solar day, highlighting the results in the range from 9:00 a.m. to 5:00 p.m. and incorporating the variation of solar position (orientation and inclination) throughout the day. Other factors that were considered to perform the simulations were:
- (i)
The thermal and electrical properties of each material used in the manufacture of PVG and TEGs set and their variation with temperature;
- (ii)
The heat transfer by conduction into STEG;
- (iii)
The emissivity of the exposed surface to solar radiation and the effects of diffuse radiation;
- (iv)
The detailing of the geometric domain mesh for finite element analysis;
- (v)
The thermal insulation of the STEG side faces; and
- (vi)
The STEG operating in transient state.
4. Results
From the experimental data and results of the computer simulations it was possible to establish the temperature differences and the STEG powers throughout the day in the southern hemisphere solstices and equinoxes, as described in
Table 5.
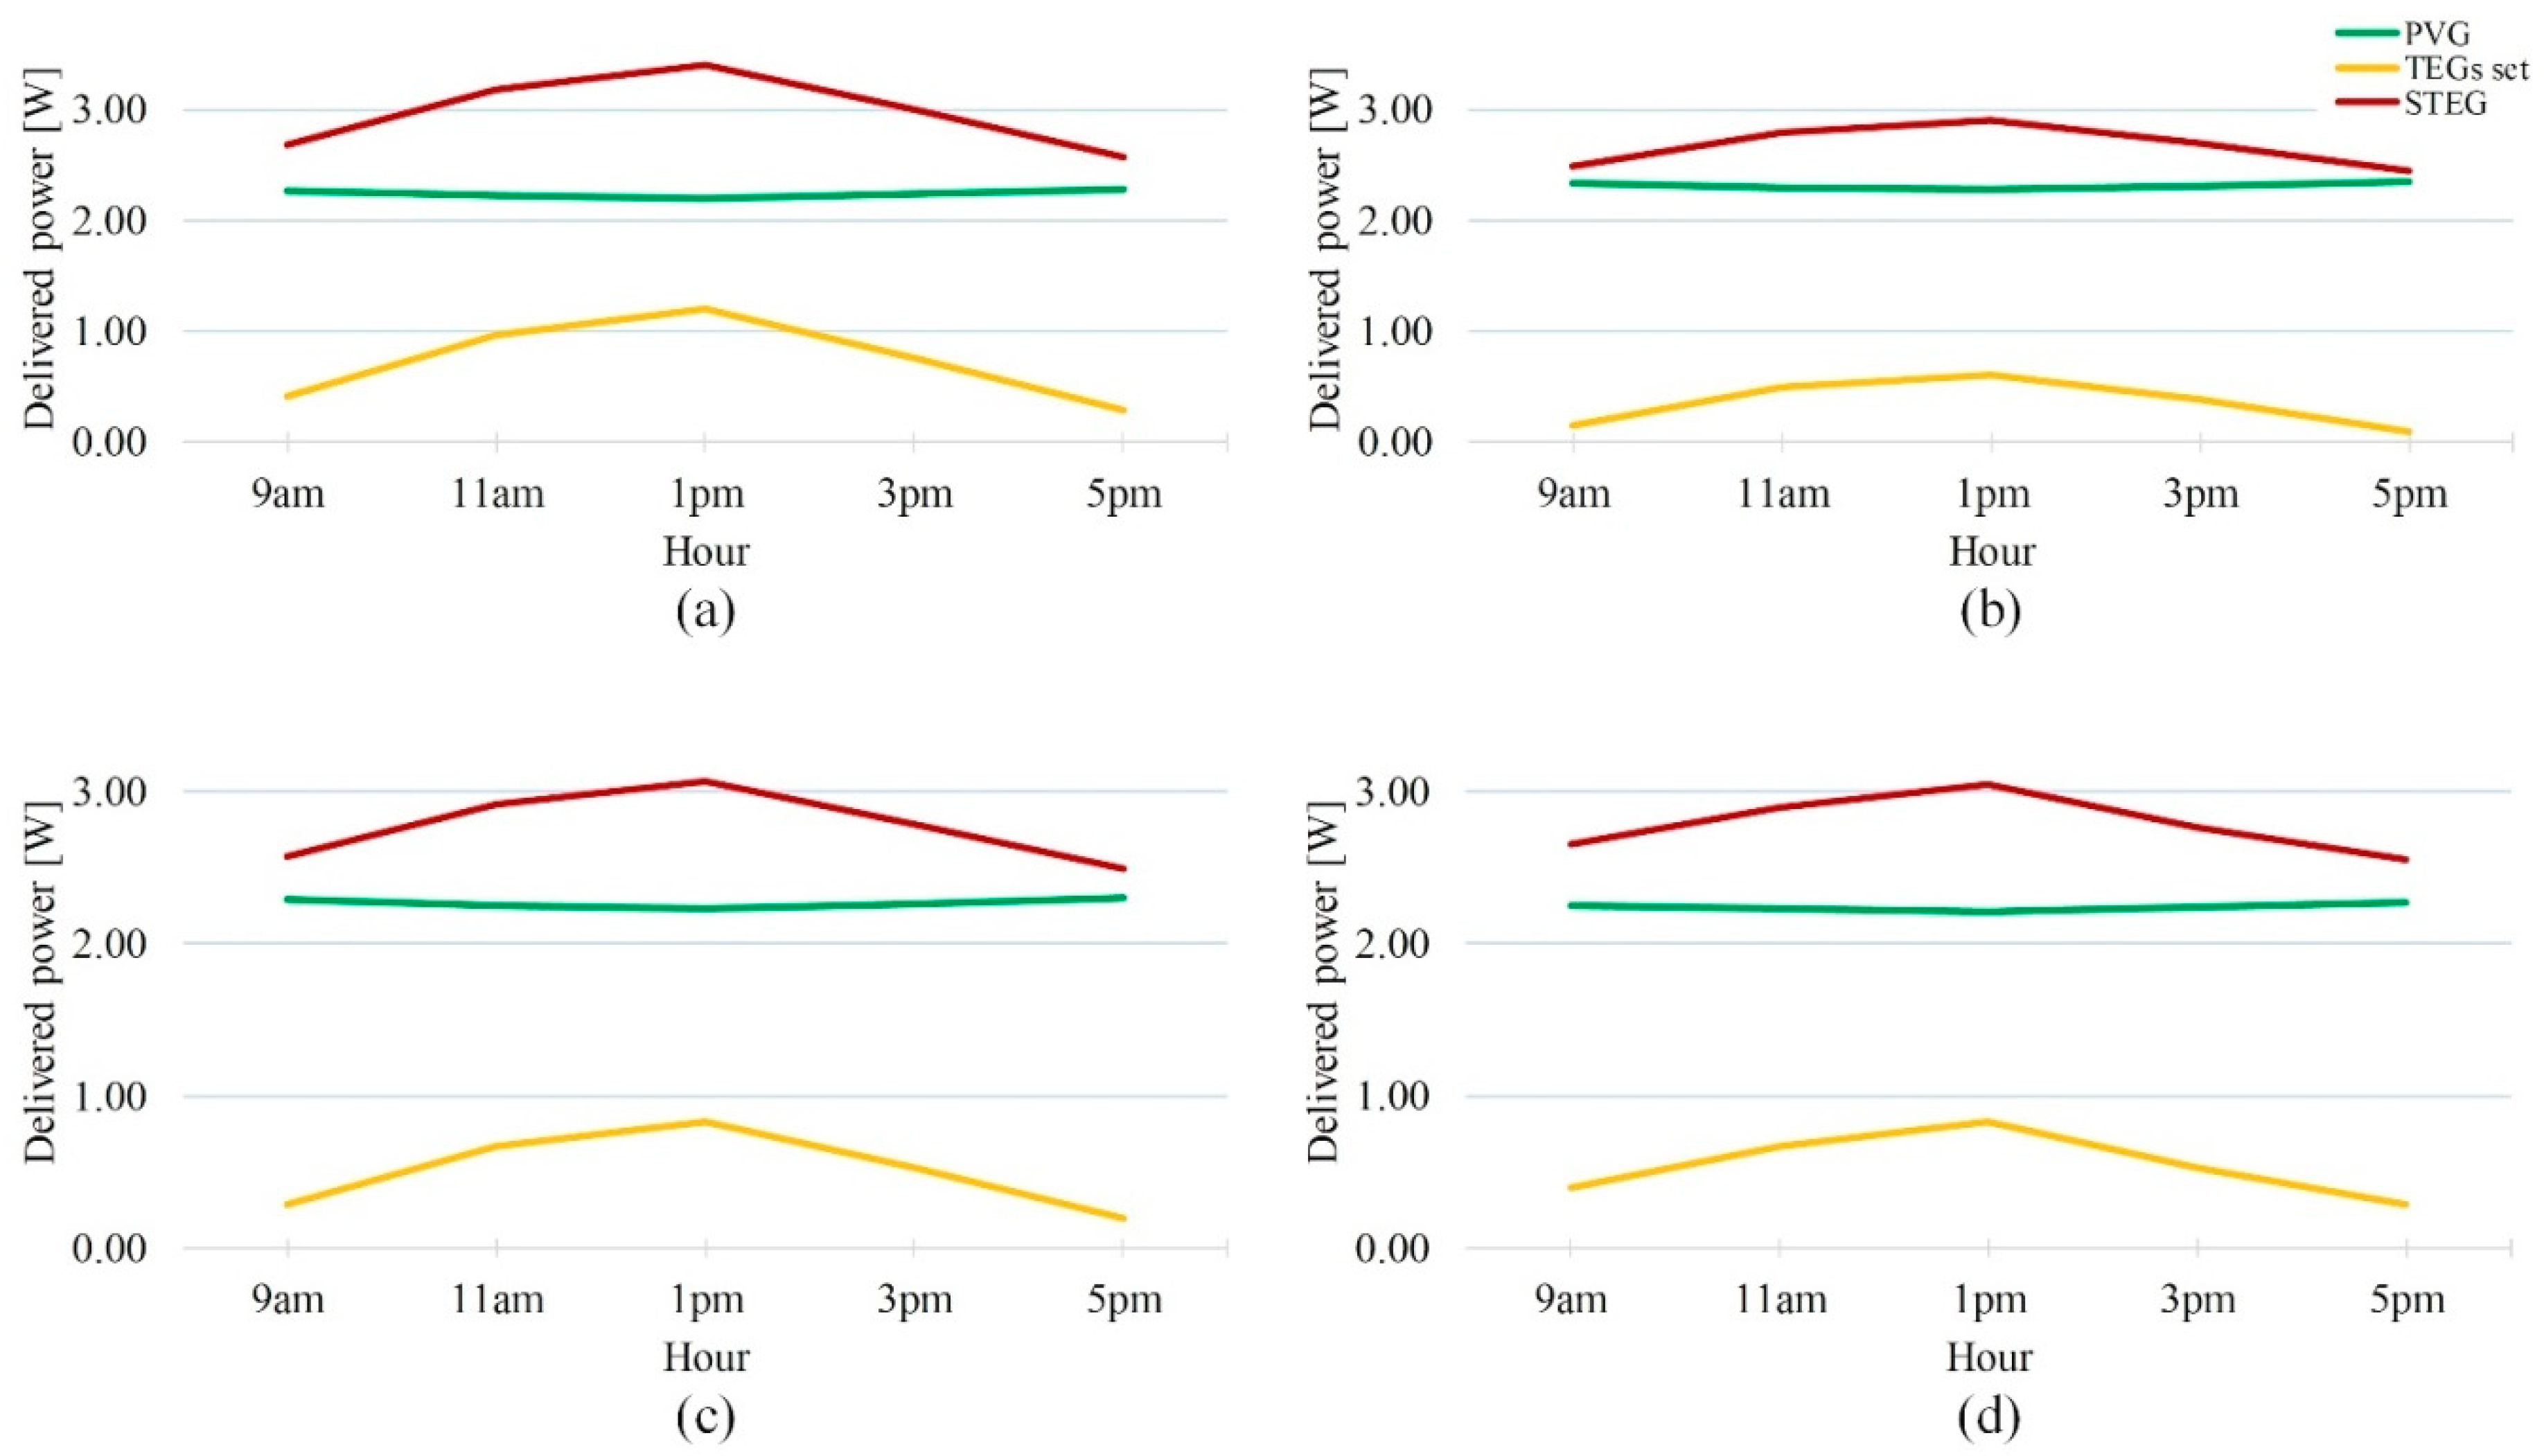
From the results obtained in the simulations it is possible to verify that the average temperature difference acting on the set of TEGs set is approximately 12.41, 8.29, 10.29 and 10.87 °C under regular operating conditions over the fall equinox, winter solstice, spring equinox and summer solstice days, respectively. The power delivered exclusively by PVG, varies throughout the day depending on its temperature and available local irradiance. The average electric power delivered by the STEG device was 2.97, 2.66, 2.77 and 2.78 W under regular operating conditions over the fall equinox, winter solstice, spring equinox and summer solstice days, respectively.
Figure 16 details the power delivered from both STEG device and its constitutive elements (PVG and TEGs set) throughout the day in the southern hemisphere solstices and equinoxes.
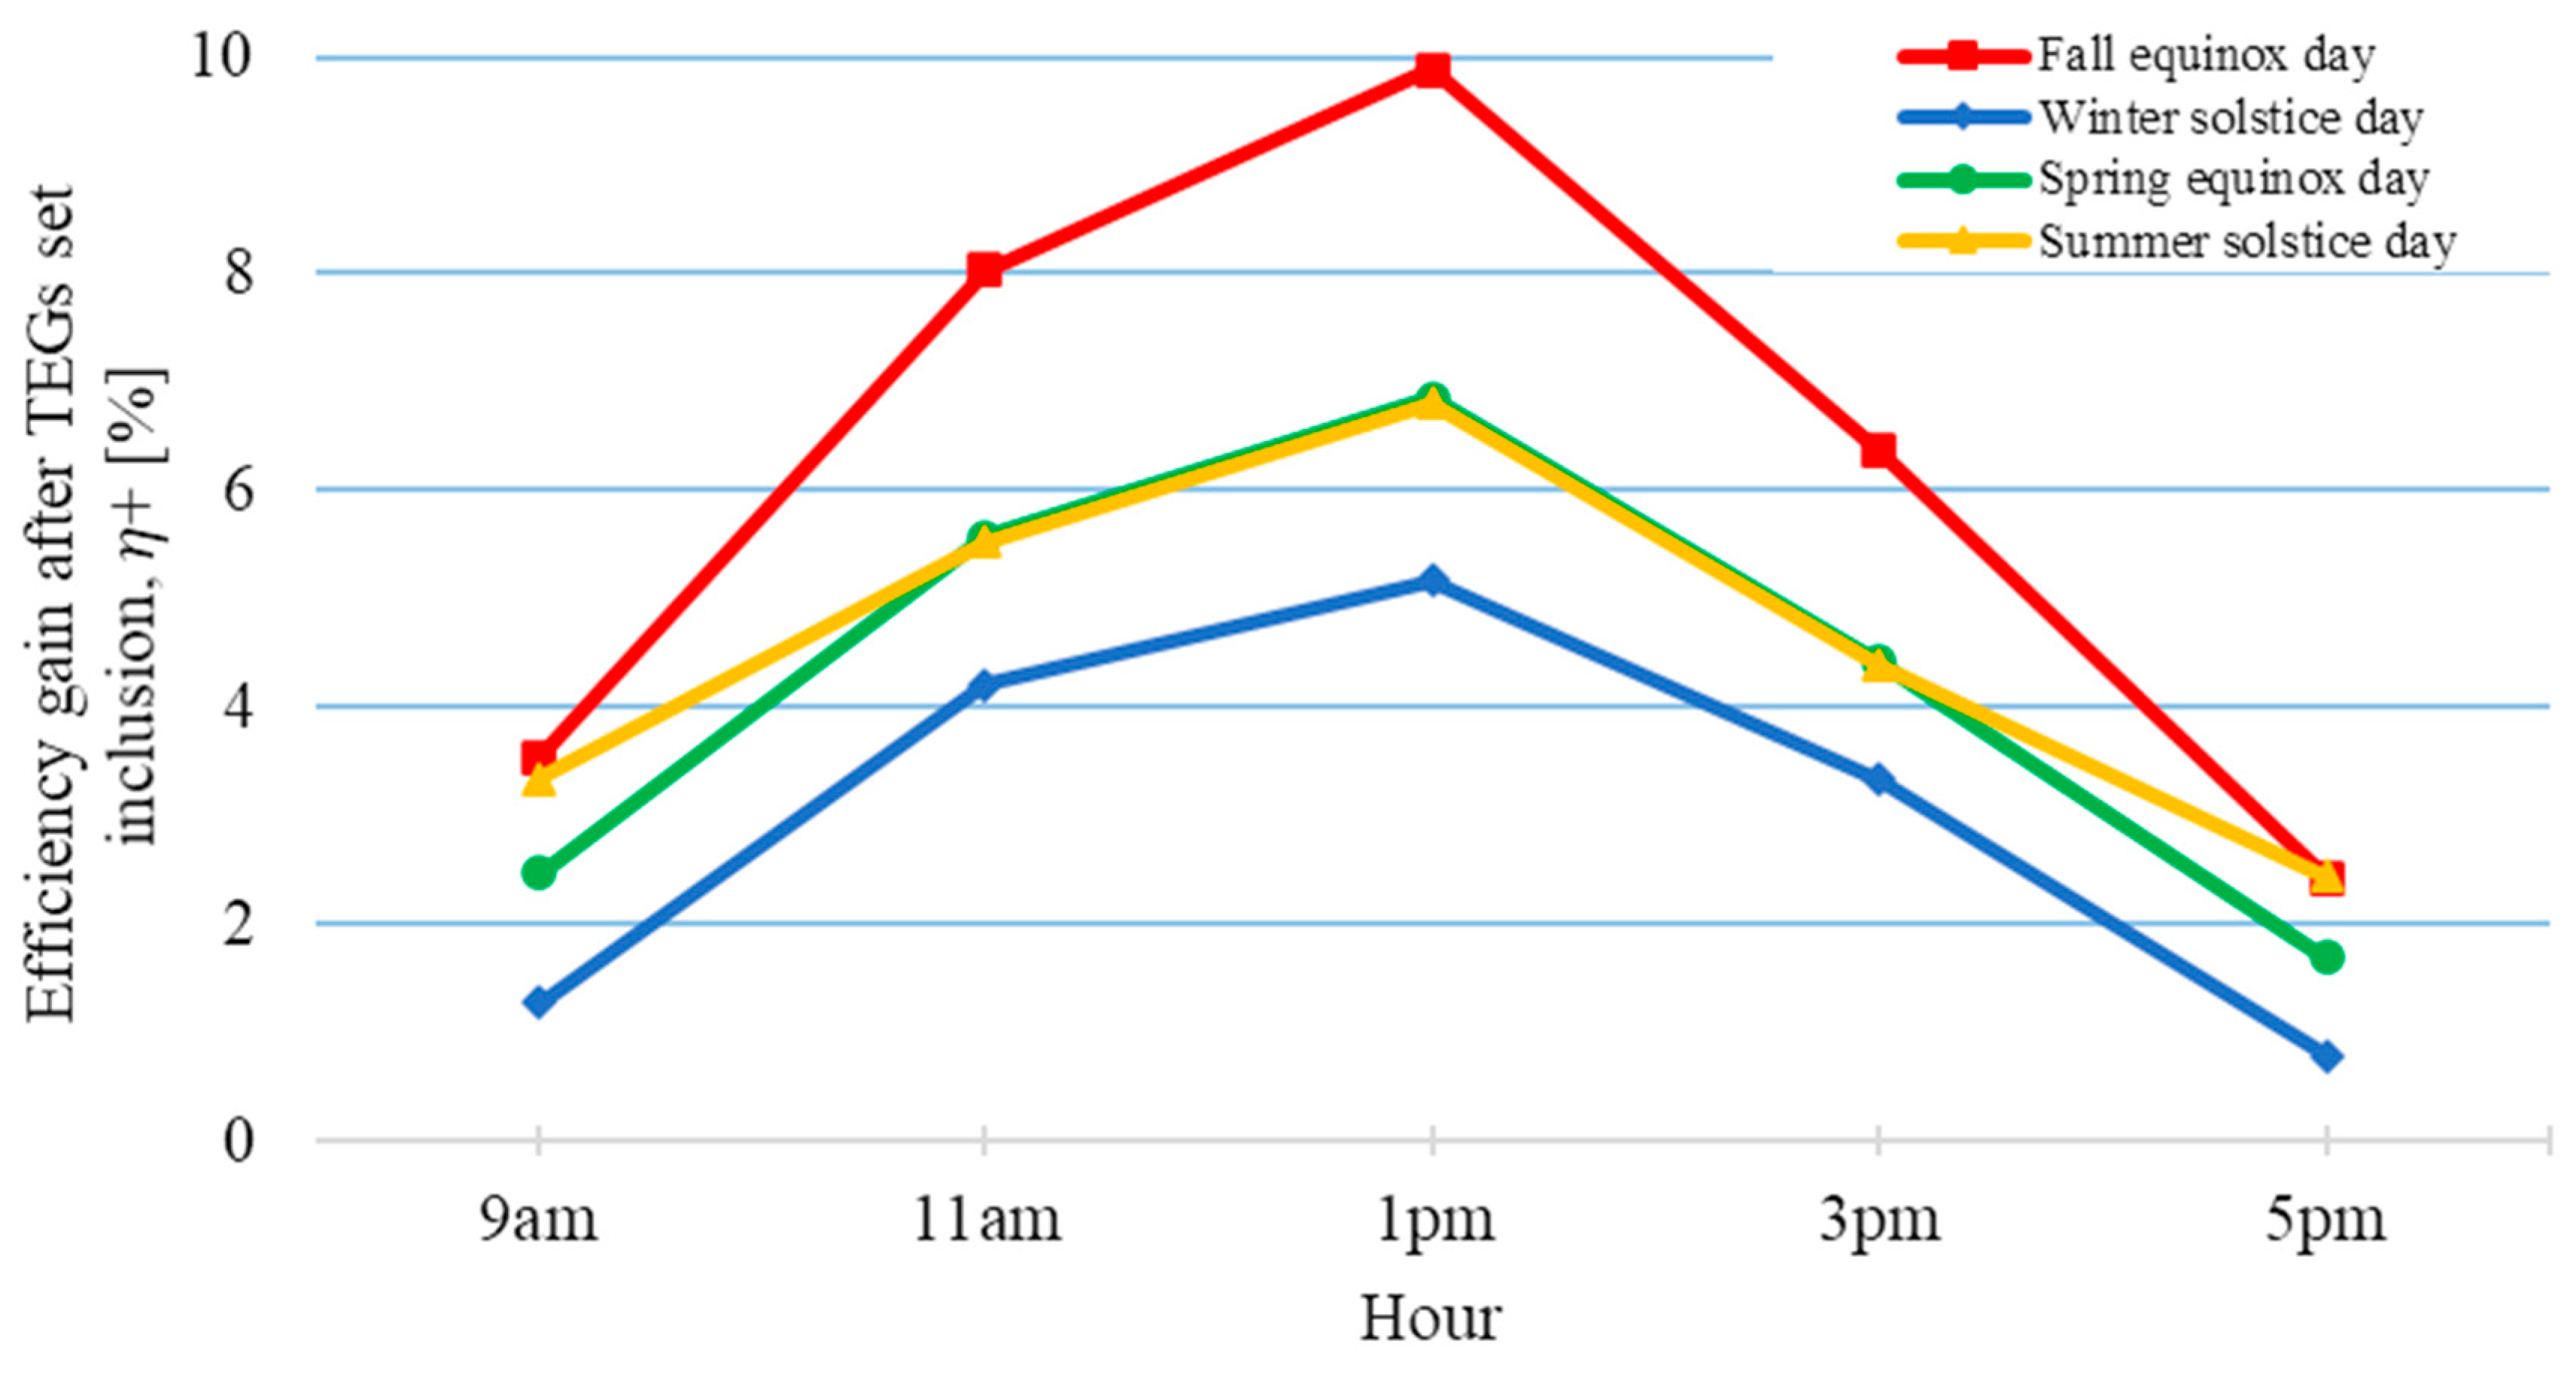
The percentage of thermal efficiency gains obtained from the inclusion of TEGs set can be estimated from Equation (16), and the results are graphically shown in
Figure 17.
Thus, it can be stated that the incorporation of TEGs set provides an average gain in STEG efficiency of 6.05%, 2.95%, 4.19% and 4.50% under regular operating conditions over the fall equinox, winter solstice, spring equinox and summer solstice days, respectively.
5. Conclusions
The combination of TEG and PVG technologies can bring an efficiency gain of up to 6.05% depending on the local operating conditions. Therefore, the increase in actual STEG devices efficiency will not exceed this limit until better figure of merit TEGs or PVGs that can exceed the Shockley-Queisser limit are developed. However, within the development of the proposed STEG it was possible to notice that a solar thermal device such as the one presented here not only increases the energy conversion efficiency, but also reduces the operating temperature of the PVG and therefore extends its service life.
On the other hand, ambient temperature, local irradiance and NOCT temperature are key factors during the operation of the device as they influence the temperature gradient acting on the TEGs set and, therefore, determinate the performance of the energy harvesting process.
The use of the STEG technology can bring the following advantages:
- (i)
Postponement of the installation of new generation plants due to power gain (up to 40.54% as shown in
Figure 12);
- (ii)
Reduction in fossil fuel use as well as its negative environmental impacts;
- (iii)
Greater independence from possible network failures;
- (iv)
Financial benefits which in turn translate into social benefits;
- (v)
Extension of photovoltaic generator service life.
On the other hand, the main disadvantages of the system are the increase in both installation costs and arrangement complexity.
As a continuation of this research, it is suggested to identify the variables that will determine the economic viability of STEG when combining the available PVG and TEG technologies. It also highlights the need to establish the effects of localization for different latitudes and orientations aiming to universalize the use of STEG devices. For future research it would also be interesting to determine the durability of the device through a life cycle analysis to identify wear as a function of time and temperature distribution during its operation. In this new study, it would also be worth evaluating the arrangement response on larger scales.
Author Contributions
Conceptualization, N.C.-H. and O.H.A.J.; methodology N.C.H., O.J.V. and E.E.S.L.; software, N.C.-H., H.F.S., D.M.Y.M. and E.H.M.F.; investigation, N.C.-H. and O.H.A.J.; writing—original draft preparation, N.C.-H., H.F.S., D.M.Y.M. and E.H.M.F.; writing—review and editing, N.C.-H., O.J.V., E.E.S.L. and O.H.A.J.; supervision O.J.V., E.E.S.L. and O.H.A.J.; funding acquisition, O.H.A.J. All authors have read and agreed to the published version of the manuscript.
Funding
This research was funded by the Triple Agenda Institutional Program of the Federal University of Latin American Integration (UNILA), Grant Number Edital PRPPG 137/2018. The N.C.H. was funded by the Brazilian National Council for Scientific and Technological Development (CNPq). The O.H.A.J. was funded by the Brazilian National Council for Scientific and Technological Development (CNPq), Grant Number 307223/2017-5 and 407531/2018-1.
Acknowledgments
The authors would like to thank to the Federal University of Latin American Integration (UNILA), Coordination for the Improvement of Higher Education Personnel (CAPES) and the Brazilian Council for Scientific and Technological Development (CNPq) for financial support.
Conflicts of Interest
The authors declare no conflict of interest.
Nomenclature
| PVG area |
| Ef | Photon energy |
| Eg | Band energy gap |
| Es | Seebeck voltage |
| f | Incident electromagnetic wave frequency |
| Local irradiance |
| Standard test condition irradiance |
| h | Planck constant (6.63 × 10⁻³⁴ [J · s]) |
| Monthly average sun-hours per day |
| PVG current at maximum power point |
| Iout | TEGs set current output |
| ISC | PVG short circuit current |
| Thermal conductivity |
| Day of the year (representative of the month) |
| PVG local maximum power point |
| PVG maximum power point at standard test conditions |
| TEGs set output power |
| Power delivered by PVG |
| Power delivered by jth PVG |
| Power delivered by ith TEG module |
| Power delivered by TEGs set |
| Total power generated by STEG device |
| Internal resistance |
| Resistive load |
| Seebeck coefficient |
| Temperature |
| TEGs set cold face temperature |
| TEGs set hot face temperature |
| PVG operating temperature |
| PVG manufacturer’s test temperature |
| VMP | PVG voltage at maximum power point |
| PVG open circuit voltage (output voltage at no load) |
| TEGs set open circuit voltage (output voltage at no load) |
| TEGs set output voltage under load |
| Dimensionless figure of merit |
| Greek symbols |
| α | PVG temperature coefficient for short circuit current |
| Seebeck differential coefficient |
| PVG temperature coefficient for open circuit voltage |
| PVG temperature coefficient for maximum power point |
| Solar declination |
| ∆T | Temperature difference |
| PVG manufacturer’s stated efficiency under standard test conditions |
| PVG local efficiency |
| PVG efficiency at maximum power point |
| Percentage of efficiency gain after TEGs set inclusion |
| Wavelength |
| PVG maximum efficiency temperature coefficient |
| Pi number |
| electrical conductivity |
| Local latitude |
| Sunset hour angle |
| Abbreviations |
| IR | Infrared radiation |
| NOCT | PVG nominal operating cell temperature |
| PVG | Photovoltaic generator |
| STEG | Solar Thermoelectric Generator |
| TEG | Thermoelectric generator |
| UV | Ultraviolet radiation |
References
- Antonakakis, N.; Chatziantoniou, I.; Filis, G. Energy consumption, CO2 emissions, and economic growth: An ethical dilemma. Renew. Sustain. Energy Rev. 2017, 68, 808–824. [Google Scholar] [CrossRef]
- Gupta, J.G.; De, S.; Gautam, A.; Dhar, A.; Pandey, A.K. Introduction to Sustainable Energy, Transportation Technologies, and Policy. Energy Environ. Sustain. 2018, 3–7. [Google Scholar] [CrossRef]
- Pinho, J.T.; Galdino, M.A. Manual de Engenharia para Sistemas Fotovoltaicos, Rio de Janeiro: CEPEL—CRESESB. Rio Jan. RJ Cepel Cresesb 2014, 1, 106. [Google Scholar]
- Shockley, W.; Queisser, H.J. Detailed Balance Limit of Efficiency of p-n Junction Solar Cells. J. Appl. Phys. 1961, 32, 510–519. [Google Scholar] [CrossRef]
- Sapuan, S.M.; Hana, A.M.H.A.; Zuhri, M.Y.M.; Zainudin, E.S.; Al-Oqla, F.M. Development of Photovoltaic Module with Fabricated and Evaluated Novel Backsheet-Based Biocomposite Materials. Materials 2019, 12, 3007. [Google Scholar] [CrossRef] [Green Version]
- Yadav, P.K.; Pandey, K.; Bhatt, V.; Kumar, M.; Kim, J. Critical aspects of impedance spectroscopy in silicon solar cell characterization: A review. Renew. Sustain. Energy Rev. 2017, 76, 1562–1578. [Google Scholar] [CrossRef]
- Intermite, S.; Arbizzani, C.; Soavi, F.; Gholipour, S.; Cruz, S.H.T.; Baena, J.P.C.; Saliba, M.; Vlachopoulos, N.; Ali, A.M.; Hagfeld, A.; et al. Perovskite solar cell—Electrochemical double layer capacitor interplay. Electrochim. Acta 2017, 258, 825–833. [Google Scholar] [CrossRef]
- National Renewable Energy Laboratory. Best Research-Cell Efficiency Chart; NREL: Golden, CO, USA, 2020.
- Belghachi, A.; Helmaoui, A.; Cheknane, A. High efficiency all-GaAs solar cell. Prog. Photovolt. Res. Appl. 2010, 18, 79–82. [Google Scholar] [CrossRef]
- Li, F.-Y.; Dang, X.-Y.; Zhang, L.; Liu, F.-F.; Sun, D.; He, Q.; Li, C.-J.; Li, B.-Z.; Zhu, H.-B. Fabrication of high-quality ZnS buffer and its application in Cd-free CIGS solar cells. Optoelectron. Lett. 2014, 10, 266–268. [Google Scholar] [CrossRef]
- Kim, K.; Larina, L.; Yun, J.H.; Yoon, K.H.; Kwon, H.; Ahn, B.T. Cd-free CIGS solar cells with buffer layer based on the In2S3 derivatives. Phys. Chem. Chem. Phys. 2013, 15, 9239–9244. [Google Scholar] [CrossRef]
- Hosseini, Z.; Taghavinia, N.; Diau, E.W.-G. Application of a dual functional luminescent layer to enhance the light harvesting efficiency of dye sensitized solar cell. Mater. Lett. 2017, 188, 92–94. [Google Scholar] [CrossRef]
- Li, L.; Liang, J.; Gao, H.; Li, Y.; Niu, X.; Zhu, X.; Xiong, Y.; Pei, Q. A Solid-State Intrinsically Stretchable Polymer Solar Cell. ACS Appl. Mater. Interfaces 2017, 9, 40523–40532. [Google Scholar] [CrossRef] [PubMed]
- Motiei, P.; Yaghoubi, M.; GoshtashbiRad, E.; Vadiee, A. Two-dimensional unsteady state performance analysis of a hybrid photovoltaic-thermoelectric generator. Renew. Energy 2018, 119, 551–565. [Google Scholar] [CrossRef]
- Chandel, S.; Agarwal, T. Review of cooling techniques using phase change materials for enhancing efficiency of photovoltaic power systems. Renew. Sustain. Energy Rev. 2017, 73, 1342–1351. [Google Scholar] [CrossRef]
- Darkwa, J.; Kokogiannakis, J. Thermal management systems for photovolatics installations. Sol. Energy 2013, 97, 238–254. [Google Scholar]
- Yun, G.Y.; McEvoy, M.; Steemers, K. Design and overall energy performance of a ventilated photovoltaic façade. Sol. Energy 2007, 81, 383–394. [Google Scholar] [CrossRef]
- Krauter, S.; Araújo, R.G.; Schroer, S.; Hanitsch, R.; Salhi, M.J.; Triebel, C.; Lemoine, R. Combined photovoltaic and solar thermal systems for facade integration and building insulation. Sol. Energy 1999, 67, 239–248. [Google Scholar] [CrossRef]
- Krauter, S. Increased electrical yield via water flow over the front of photovoltaic panels. Sol. Energy Mater. Sol. Cells 2004, 82, 131–137. [Google Scholar] [CrossRef]
- Sardarabadi, M.; Passandideh-Fard, M.; Heris, S.Z. Experimental investigation of the effects of silica/water nanofluid on PV/T (photovoltaic thermal units). Energy 2014, 66, 264–272. [Google Scholar] [CrossRef]
- Ismail, B.; Ahmed, W. Thermoelectric Power Generation Using Waste-Heat Energy as an Alternative Green Technology. Recent Pat. Electr. Eng. 2010, 2, 27–39. [Google Scholar] [CrossRef]
- Kumar, P.M.; Babu, V.J.; Subramanian, A.; Bandla, A.; Thakor, N.; Ramakrishna, S.; Wei, H. The Design of a Thermoelectric Generator and Its Medical Applications. Designs 2019, 3, 22. [Google Scholar] [CrossRef] [Green Version]
- Maran, A.L.O.; Henao, N.C.; Silva, E.A.; Schaeffer, L.; Junior, O.H.A. Use of Thermoelectricity for Energy Harvesting. Rev. IEEE Am. Lat. 2016, 14. [Google Scholar] [CrossRef]
- Díez, G.G.; Gordillo, J.M.S.; Pujadó, M.P.; Salleras, M.; Fonseca, L.; Morata, Á.; Rubio, A.T. Enhanced thermoelectric figure of merit of individual Si nanowires with ultralow contact resistances. Nano Energy 2019, 67, 104191. [Google Scholar] [CrossRef]
- Dziurdzia, P. Modeling and Simulation of Thermoelectric Energy Harvesting Processes. In Sustainable Energy Harvesting Technologies—Past, Present and Future; Tan, Y.K., Ed.; Intechopen: London, UK, 2011; pp. 109–128. [Google Scholar]
- Siddique, A.R.M.; Mahmud, S.; Van Heyst, B. A review of the state of the science on wearable thermoelectric power generators (TEGs) and their existing challenges. Renew. Sustain. Energy Rev. 2017, 73, 730–744. [Google Scholar] [CrossRef]
- Yadav, A.; Pipe, K.P.; Shtein, M. Fiber-based flexible thermoelectric power generator. J. Power Sources 2008, 175, 909–913. [Google Scholar] [CrossRef]
- Zheng, X.; Yan, Y.Y.; Simpson, K. A potential candidate for the sustainable and reliable domestic energy generation—Thermoelectric cogeneration system. Appl. Therm. Eng. 2013, 53, 305–311. [Google Scholar] [CrossRef]
- Tayebi, L.; Zamanipour, Z.; Vashaee, D. Design optimization of micro-fabricated thermoelectric devices for solar power generation. Renew. Energy 2014, 69, 166–173. [Google Scholar] [CrossRef]
- Aranguren, P.; Roch, A.; Stepien, L.; Abt, M.; Von Lukowicz, M.; Dani, I.; Astrain, D. Optimized design for flexible polymer thermoelectric generators. Appl. Therm. Eng. 2016, 102, 402–411. [Google Scholar] [CrossRef]
- Blandino, J.R.; Lawrence, D.J. Transient response of a thermoelectric generator subjected to spatially non-uniform heating: Implications for heat and IR sensing applications. Measurement 2016, 80, 125–137. [Google Scholar] [CrossRef]
- Francioso, L.; De Pascali, C.; Sglavo, V.M.; Grazioli, A.; Masieri, M.; Siciliano, P. Modelling, fabrication and experimental testing of an heat sink free wearable thermoelectric generator. Energy Convers. Manag. 2017, 145, 204–213. [Google Scholar] [CrossRef]
- Kanimba, E.; Pearson, M.; Sharp, J.; Stokes, D.; Priya, S.; Tian, Z. A comprehensive model of a lead telluride thermoelectric generator. Energy 2018, 142, 813–821. [Google Scholar] [CrossRef]
- Eddine, A.N.; Chalet, D.; Faure, X.; Aixala, L.; Chessé, P. Optimization and characterization of a thermoelectric generator prototype for marine engine application. Energy 2018, 143, 682–695. [Google Scholar] [CrossRef]
- Kim, T.Y.; Kim, J. Assessment of the energy recovery potential of a thermoelectric generator system for passenger vehicles under various drive cycles. Energy 2018, 143, 363–371. [Google Scholar] [CrossRef]
- Lan, S.; Yang, Z.; Chen, R.; Stobart, R. A dynamic model for thermoelectric generator applied to vehicle waste heat recovery. Appl. Energy 2018, 210, 327–338. [Google Scholar] [CrossRef] [Green Version]
- Wang, S.; Xie, T.; Xie, H. Experimental study of the effects of the thermal contact resistance on the performance of thermoelectric generator. Appl. Therm. Eng. 2018, 130, 847–853. [Google Scholar] [CrossRef]
- Huen, P.; Daoud, W.A. Advances in hybrid solar photovoltaic and thermoelectric generators. Renew. Sustain. Energy Rev. 2017, 72, 1295–1302. [Google Scholar] [CrossRef]
- Tritt, T.M.; Böttner, H.; Chen, L. Thermoelectrics: Direct Solar Thermal Energy Conversion. Harnessing Mater. Energy 2008, 33, 366–368. [Google Scholar] [CrossRef] [Green Version]
- Chen, G. Theoretical efficiency of solar thermoelectric energy generators. J. Appl. Phys. 2011, 109, 104908. [Google Scholar] [CrossRef]
- Manikandan, S.; Kaushik, S.C. Energy and exergy analysis of solar heat pipe based annular thermoelectric generator system. Sol. Energy 2016, 135, 569–577. [Google Scholar] [CrossRef]
- Ding, L.; Akbarzadeh, A.; Tan, L. A review of power generation with thermoelectric system and its alternative with solar ponds. Renew. Sustain. Energy Rev. 2018, 81, 799–812. [Google Scholar] [CrossRef]
- Bjørk, R.; Nielsen, K.K. The maximum theoretical performance of unconcentrated solar photovoltaic and thermoelectric generator systems. Energy Convers. Manag. 2018, 156, 264–268. [Google Scholar] [CrossRef] [Green Version]
- Narducci, D.; Lorenzi, B. Challenges and Perspectives in Tandem Thermoelectric—Photovoltaic Solar Energy Conversion. IEEE Trans. Nanotechnol. 2016, 15, 348–355. [Google Scholar] [CrossRef]
- Neo Solar Power Corporation. NSP Solar Cells: NS6WL-2060. Available online: https://www.nsp.com/wp-content/uploads/2017/04/NSP_B21_5BB_FSBB_SVF_M2_01.pdf (accessed on 13 January 2018).
- Sarbu, I.; Sebarchievici, C. Solar Heating and Cooling Systems: Fundamentals, Experiments and Applications; Elsevier—Academic Press: London, UK, 2017. [Google Scholar]
- LABREN Laboratory of Modeling and Studies of Renewable Energy Resources. Brazilian Atlas of Solar Energy—Metadata; INPE—National Institute for Space Research: Foz do Iguaçu, Brazil, 2019. [Google Scholar]
- Maleki, S.M.; Hizam, H.; Gomes, C. Estimation of Hourly, Daily and Monthly Global Solar Radiation on Inclined Surfaces: Models Re-Visited. Energies 2017, 10, 134. [Google Scholar] [CrossRef] [Green Version]
- Instituto Nacional de Metrologia, Qualidade e Tecnologia. Tabelas de Consumo/Eficiência Energética; INMETRO: Rio de Janeiro, Brazil, 2017.
- Duffie, J.A.; Beckman, W.A. Solar Engineering of Thermal Processes, 2nd ed.; John Wiley & Sons: Hoboken, NJ, USA, 1991. [Google Scholar]
- Carmo, J.; Antunes, J.; Silva, M.; Ribeiro, J.F.; Gonçalves, L.M.; Correia, J. Characterization of thermoelectric generators by measuring the load-dependence behavior. Measurement 2011, 44, 2194–2199. [Google Scholar] [CrossRef]
- Ando Junior, O.H.; Izidoro, C.; Gomes, J.M.; Carmo, J.; Schaeffer, L.; Correia, J. Acquisition and Monitoring System for TEG Characterization. Int. J. Distrib. Sens. Netw. 2015, 11, 531516. [Google Scholar] [CrossRef] [Green Version]
- Izidoro, C.; Ando Junior, O.H.; Carmo, J.; Schaeffer, L. Characterization of thermoelectric generator for energy harvesting. Measurement 2017, 106, 283–290. [Google Scholar] [CrossRef]
- WAtronix, Inc. The INB Thermoelectric Product Line. Thermoelectric Power Generator inbC1-127.0HTS: Specifications. Available online: http://www.inbthermoelectric.com/ (accessed on 1 October 2019).
- Instituto Nacional de Meteorologia do Brasil—INMET. BDMEP—Banco de Dados Meteorológicos para Ensino e Pesquisa; Ministério da Agricultura, Pecuária e Abastecimento—MAPA: Foz do Iguaçu, Brazil, 2019.
Figure 1.
Typical structure of a modern photovoltaic generator (PVG). Reprinted with permission [
5]; 2019; MDPI.
Figure 1.
Typical structure of a modern photovoltaic generator (PVG). Reprinted with permission [
5]; 2019; MDPI.
Figure 2.
Constructive structure of a modern thermoelectric generator (TEG). Reprinted with permission [
22]; 2019; MDPI.
Figure 2.
Constructive structure of a modern thermoelectric generator (TEG). Reprinted with permission [
22]; 2019; MDPI.
Figure 3.
Energy potential of solar radiation as a function of wavelength.
Figure 3.
Energy potential of solar radiation as a function of wavelength.
Figure 4.
Generic scheme of current solar thermoelectric generators (STEGs) (a) without reflective component and (b) with reflective component.
Figure 4.
Generic scheme of current solar thermoelectric generators (STEGs) (a) without reflective component and (b) with reflective component.
Figure 5.
Constructive scheme of the proposed STEG.
Figure 5.
Constructive scheme of the proposed STEG.
Figure 6.
Monthly PVG electric power generated at the maximum power point.
Figure 6.
Monthly PVG electric power generated at the maximum power point.
Figure 7.
Open circuit voltage of inbC1-127.08HTS TEGs set as a function of temperature difference.
Figure 7.
Open circuit voltage of inbC1-127.08HTS TEGs set as a function of temperature difference.
Figure 8.
TEG set internal resistance as a function of temperature difference.
Figure 8.
TEG set internal resistance as a function of temperature difference.
Figure 9.
TEGs set output power as a function of current for various temperature differences.
Figure 9.
TEGs set output power as a function of current for various temperature differences.
Figure 10.
TEGs set output power as a function of voltage for various temperature differences.
Figure 10.
TEGs set output power as a function of voltage for various temperature differences.
Figure 11.
inbC1-127.08HTS TEGs set rated electrical parameters. Reprint with permission [
54]; 2019, WAtronix, Inc.
Figure 11.
inbC1-127.08HTS TEGs set rated electrical parameters. Reprint with permission [
54]; 2019, WAtronix, Inc.
Figure 12.
Weighted average monthly power contribution.
Figure 12.
Weighted average monthly power contribution.
Figure 13.
Research modeling strategy.
Figure 13.
Research modeling strategy.
Figure 14.
Free-concentrator STEG representative segment.
Figure 14.
Free-concentrator STEG representative segment.
Figure 15.
STEG temperature distribution with heat sink (a) fall equinox—March, (b) winter solstice—June, (c) spring equinox—September, (d) summer solstice—December.
Figure 15.
STEG temperature distribution with heat sink (a) fall equinox—March, (b) winter solstice—June, (c) spring equinox—September, (d) summer solstice—December.
Figure 16.
Power delivered from both STEG device and its constitutive elements (a) Fall equinox day, (b) Winter solstice day, (c) Spring equinox day, (d) Summer solstice day.
Figure 16.
Power delivered from both STEG device and its constitutive elements (a) Fall equinox day, (b) Winter solstice day, (c) Spring equinox day, (d) Summer solstice day.
Figure 17.
Percent efficiency gain after TEGs set inclusion.
Figure 17.
Percent efficiency gain after TEGs set inclusion.
Table 1.
Solar Cell Neo Solar Power
® NS6WL-2060 Datasheet. Reprint with permission [
45]; 2018; Neo Solar Power NSP.
Table 1.
Solar Cell Neo Solar Power
® NS6WL-2060 Datasheet. Reprint with permission [
45]; 2018; Neo Solar Power NSP.
| Parameter | Measurement Unit | Magnitude |
|---|
| ηMP | % | 20.60 |
| PMáx | WP | 5.03 |
| VOC | V | 0.66 |
| ISC | A | 9.65 |
| VMP | V | 0.55 |
| IMP | A | 9.16 |
| α | mA/K | 4.40 |
| β | mV/K | −2.00 |
| γ | %/K | −0.40 |
| Size | mm × mm | 156.75 × 156.75 |
| Thickness | µm | 200 |
Table 2.
Foz do Iguaçu City solar geometric parameters.
Table 2.
Foz do Iguaçu City solar geometric parameters.
| Month | Representative Day of the Year [48] | Solar Declination, (rad) | Sunset Hour Angle, (rad) | Average Monthly Sun–Hours per Day, (h) | Full Sun Hours per Day (h) [47] | Average Monthly Irradiance on Tilted Plane, (W/m2) |
|---|
| January | 17 | −0.3651 | 1.7538 | 13.40 | 5.69 | 424.85 |
| February | 47 | −0.2261 | 1.6796 | 12.83 | 5.65 | 440.03 |
| March | 75 | −0.0422 | 1.5914 | 12.16 | 5.67 | 466.37 |
| April | 105 | 0.1643 | 1.4944 | 11.42 | 4.95 | 433.41 |
| May | 135 | 0.3280 | 1.4101 | 10.77 | 4.19 | 389.23 |
| June | 162 | 0.4029 | 1.3662 | 10.44 | 3.74 | 358.64 |
| July | 198 | 0.3697 | 1.3849 | 10.58 | 3.97 | 375.32 |
| August | 228 | 0.2348 | 1.4573 | 11.13 | 4.87 | 437.81 |
| September | 258 | 0.0387 | 1.5514 | 11.85 | 4.67 | 394.37 |
| October | 288 | −0.1675 | 1.6484 | 12.59 | 5.20 | 413.18 |
| November | 318 | −0.3301 | 1.7324 | 13.23 | 5.58 | 421.94 |
| December | 344 | −0.4023 | 1.7749 | 13.56 | 5.73 | 422.88 |
Table 3.
Photovoltaic generators (PVG) power yield at local operating conditions.
Table 3.
Photovoltaic generators (PVG) power yield at local operating conditions.
| Month | Average Monthly Irradiance on Tilted Plane,
(W/m2) | PVG Maximum Efficiency Temperature Coefficient,
| PVG Local Efficiency,
(%)
| PVG Local Maximum Power Point (Duffie–Beckman model), (Wp)
| PVG Local Maximum Power Point (Pinho Model), (Wp)
|
|---|
| January | 424.85 | −0.00175 | 16.94 | 1.77 | 2.32 |
| February | 440.03 | −0.00169 | 17.07 | 1.85 | 2.40 |
| March | 466.37 | −0.00160 | 17.27 | 1.98 | 2.54 |
| April | 433.41 | −0.00172 | 17.01 | 1.81 | 2.36 |
| May | 389.23 | −0.00192 | 16.61 | 1.59 | 2.12 |
| June | 358.64 | −0.00208 | 16.27 | 1.43 | 1.95 |
| July | 375.32 | −0.00199 | 16.46 | 1.52 | 2.05 |
| August | 437.81 | −0.00170 | 17.05 | 1.83 | 2.39 |
| September | 394.37 | −0.00189 | 16.66 | 1.61 | 2.15 |
| October | 413.18 | −0.00180 | 16.84 | 1.71 | 2.25 |
| November | 421.94 | −0.00177 | 16.92 | 1.75 | 2.30 |
| December | 422.88 | −0.00176 | 16.92 | 1.76 | 2.30 |
Table 4.
Average monthly power by technology and weighted contribution.
Table 4.
Average monthly power by technology and weighted contribution.
| Month | Average Monthly Ambient Temperature (°C) [55] | Average Monthly PVG Power (Wp) | Average monthly TEGs Set Power (W) | Average Monthly STEG Power (W) | Weighted PVG Contribution (%) | Weighted TEGs Set Contribution (% ) |
|---|
| January | 26.89 | 2.04 | 0.36 | 2.40 | 85.18 | 14.82 |
| February | 24.91 | 2.12 | 0.52 | 2.65 | 80.17 | 19.83 |
| March | 23.46 | 2.26 | 0.65 | 2.91 | 77.54 | 22.46 |
| April | 22.23 | 2.09 | 0.77 | 2.85 | 73.13 | 26.87 |
| May | 20.38 | 1.85 | 0.94 | 2.80 | 66.29 | 33.71 |
| June | 19.74 | 1.69 | 1.01 | 2.70 | 62.75 | 37.25 |
| July | 17.65 | 1.78 | 1.21 | 3.00 | 59.46 | 40.54 |
| August | 19.73 | 2.11 | 1.01 | 3.12 | 67.71 | 32.29 |
| September | 23.14 | 1.88 | 0.68 | 2.57 | 73.35 | 26.65 |
| October | 24.62 | 1.98 | 0.55 | 2.53 | 78.24 | 21.76 |
| November | 24.49 | 2.03 | 0.56 | 2.59 | 78.29 | 21.71 |
| December | 25.48 | 2.03 | 0.48 | 2.51 | 81.04 | 18.96 |
Table 5.
STEG device power delivered under different operating conditions.
Table 5.
STEG device power delivered under different operating conditions.
| Operating Condition | Parameter | Units | Hour |
|---|
| 9 a.m. | 11 a.m. | 1 p.m. | 3 p.m. | 5 p.m. |
|---|
| Fall equinox day | PVG temperature | °C | 33.07 | 38.32 | 40.06 | 36.57 | 31.33 |
| TEGs set temperature difference | °C | 9.61 | 14.86 | 16.6 | 13.11 | 7.87 |
| STEG power delivered | W | 2.69 | 3.19 | 3.40 | 3.00 | 2.57 |
| Winter solstice day | PVG temperature | °C | 25.31 | 30.26 | 31.49 | 29.02 | 24.07 |
| TEGs set temperature difference | °C | 5.57 | 10.52 | 11.75 | 9.28 | 4.33 |
| STEG power delivered | W | 2.49 | 2.79 | 2.90 | 2.70 | 2.44 |
| Spring equinox day | PVG temperature | °C | 31.11 | 35.46 | 36.91 | 34.01 | 29.66 |
| TEGs set temperature difference | °C | 7.97 | 12.32 | 13.77 | 10.87 | 6.52 |
| STEG power delivered | W | 2.58 | 2.92 | 3.07 | 2.79 | 2.50 |
| Summer solstice day | PVG temperature | °C | 34.9 | 37.79 | 39.24 | 36.35 | 33.45 |
| TEGs set temperature difference | °C | 9.42 | 12.31 | 13.76 | 10.87 | 7.97 |
| STEG power delivered | W | 2.65 | 2.90 | 3.04 | 2.77 | 2.56 |
© 2020 by the authors. Licensee MDPI, Basel, Switzerland. This article is an open access article distributed under the terms and conditions of the Creative Commons Attribution (CC BY) license (http://creativecommons.org/licenses/by/4.0/).

 ,
, 


