Article

Forecasting the Structure of Energy Production from Renewable Energy Sources and Biofuels in Poland

1
Faculty of Organization and Management, Silesian University of Technology, 44-100 Gliwice, Poland
2
Faculty of Mining, Safety Engineering and Industrial Automation, Silesian University of Technology, 44-100 Gliwice, Poland
3
Mining Engineering Department, University of Engineering and Technology, Lahore 54890, Pakistan
*
Author to whom correspondence should be addressed.
Energies 2020, 13(10), 2539; https://doi.org/10.3390/en13102539
Submission received: 25 April 2020 / Revised: 10 May 2020 / Accepted: 15 May 2020 / Published: 17 May 2020
(This article belongs to the Special Issue Renewable Energy Resource Assessment and Forecasting)

Abstract

:
The world’s economic development depends on access to cheap energy sources. So far, energy has been obtained mainly from conventional sources like coal, gas and oil. Negative climate changes related to the high emissions of the economy based on the combustion of hydrocarbons and the growing public awareness have made it necessary to look for new ecological energy sources. This condition can be met by renewable energy sources. Both social pressure and international activities force changes in the structure of sources from which energy is produced. This also applies to the European Union countries, including Poland. There are no scientific studies in the area of forecasting energy production from renewable energy sources for Poland. Therefore, it is reasonable to investigate this subject since such a forecast can have a significant impact on investment decisions in the energy sector. At the same time, it must be as reliable as possible. That is why a modern method was used for this purpose, which undoubtedly involves artificial neural networks. The following article presents the results of the analysis of energy production from renewable energy sources in Poland and the forecasts for this production until 2025. Artificial neural networks were used to make the forecast. The analysis covered eight main sources from which this energy is produced in Poland. Based on the production volume since 1990, predicted volumes of renewable energy sources until 2025 were determined. These forecasts were prepared for all studied renewable energy sources. Renewable energy production plans and their share in total energy consumption in Poland were also examined and included in climate plans. The research was carried out using artificial neural networks. The results should be an important source of information on the effects of implementing climate policies in Poland. They should also be utilized to develop action plans to achieve the objectives of the European Green Deal strategy.

Graphical Abstract

1. Introduction

One of the basic factors that has a significant impact on the development of the world economy and the entire civilization is access to large amounts of cheap energy. Energy is one of the basic resources that determine economic, social and political development of individual countries and regions [1,2,3,4,5,6,7]. The world’s dynamic economic development results in an energy demand that has been growing rapidly in the last dozen or so years. In order to meet these needs, especially by developing countries, energy produced from conventional sources is essential. However, such production generates huge amounts of harmful substances emitted into the environment [8,9]. Pollution caused by energy production from these sources contaminates water, soil and air. Various types of gases are particularly dangerous, including greenhouse gases and dust [10,11,12,13]. Combined with emissions from other sectors of the world economy, these emissions are becoming a real threat to life on earth. That is why it is crucial to take measures to reduce emissions of harmful substances. In order to achieve noticeable effects in the surrounding ecosystem, global actions need to be taken into account.
The initiator of such activities has been the United Nations (UN) for many years. At climate summits, it calls for faster and more decisive actions to protect the environment. The European Union (EU) is an increasingly active participant in this process.
At the last UN Conference of the Parties (COP25) climate summit in December 2019, which took place in Madrid, Spain, the European Commission presented a new European climate strategy called the European Green Deal [14]. This strategy assumes that by 2050 the EU economy should become a zero-emission economy, i.e., climate neutral [15,16]. It is associated with, among others, a significant increase in the share of renewable energy sources (RES) in the energy mix of the EU Member States.
These assumptions should be considered immensely ambitious. So far, no region of the world or country has taken such decisive actions in the field of climate and environmental protection.
This strategy is furthest reaching in terms of climate protection since the commitments made under the Kyoto Protocol [17], which should be recognized as the most important factor stimulating the development of renewable energy both in the world and the EU.
One of the most essential areas of economic activity in the EU is meeting the energy needs of its inhabitants [18,19]. The forecast is that in the perspective of the next 25–30 years, energy demand in the EU countries will be systematically increasing [20].
The growing demand for energy in the EU countries and the need to protect the environment, including meeting the requirements of the European Green Deal strategy, means that the EU needs to develop and implement a common climate policy that is acceptable to all countries.
In order to reconcile these seemingly contradictory goals, which focus on the increase in energy production while limiting the negative impact of this process on the environment, energy transition is a must. Conventional energy sources must be replaced and supplemented by RES.
At the same time, the increase in energy production from RES should be large enough to meet the growing demand and additionally allow the reduction of production from conventional sources. Undoubtedly, this task is really demanding and requires many activities in the political, economic and social sphere. Also, such a transition requires large financial outlays, especially in the scope of unavoidable investments. The unit value of energy produced from RES is low, but large investments are needed to obtain this energy [21,22,23]. Such activities, especially in countries where the energy industry is based on conventional raw materials (hard coal and lignite, oil, gas), require both political will and social acceptance.
However, it seems that the environmental awareness of societies, especially in the EU, is at a level that creates an opportunity to conduct such changes.
For many years, the EU’s energy policy has been based on an integrated approach to the issue of energy security of countries and the competitiveness of the economy as well as environmental and climate protection [24,25]. The importance and role of RES in the energy production structure have been reported to be growing in the EU countries. The result is an increasing share of energy obtained from RES in the energy mix of the EU countries.
Also, from a political point of view, more and more countries tend to accept the presented strategy. As in any such project, the essence is in the details. Nevertheless, the EU countries are generally aware that the implementation of the European Green Deal strategy is a must.
This strategy raises a lot of controversy, especially in Poland, in which the economy largely uses energy produced from hard and brown coal. A similar situation is also reported for the Czech Republic and Hungary.
In Poland, more than 91% of gross available energy is obtained from conventional sources (fossil fuels). In 2018, the most important energy resource was hard coal, the share of which in the production of this energy was 47.8%, and of brown coal 29% [26].
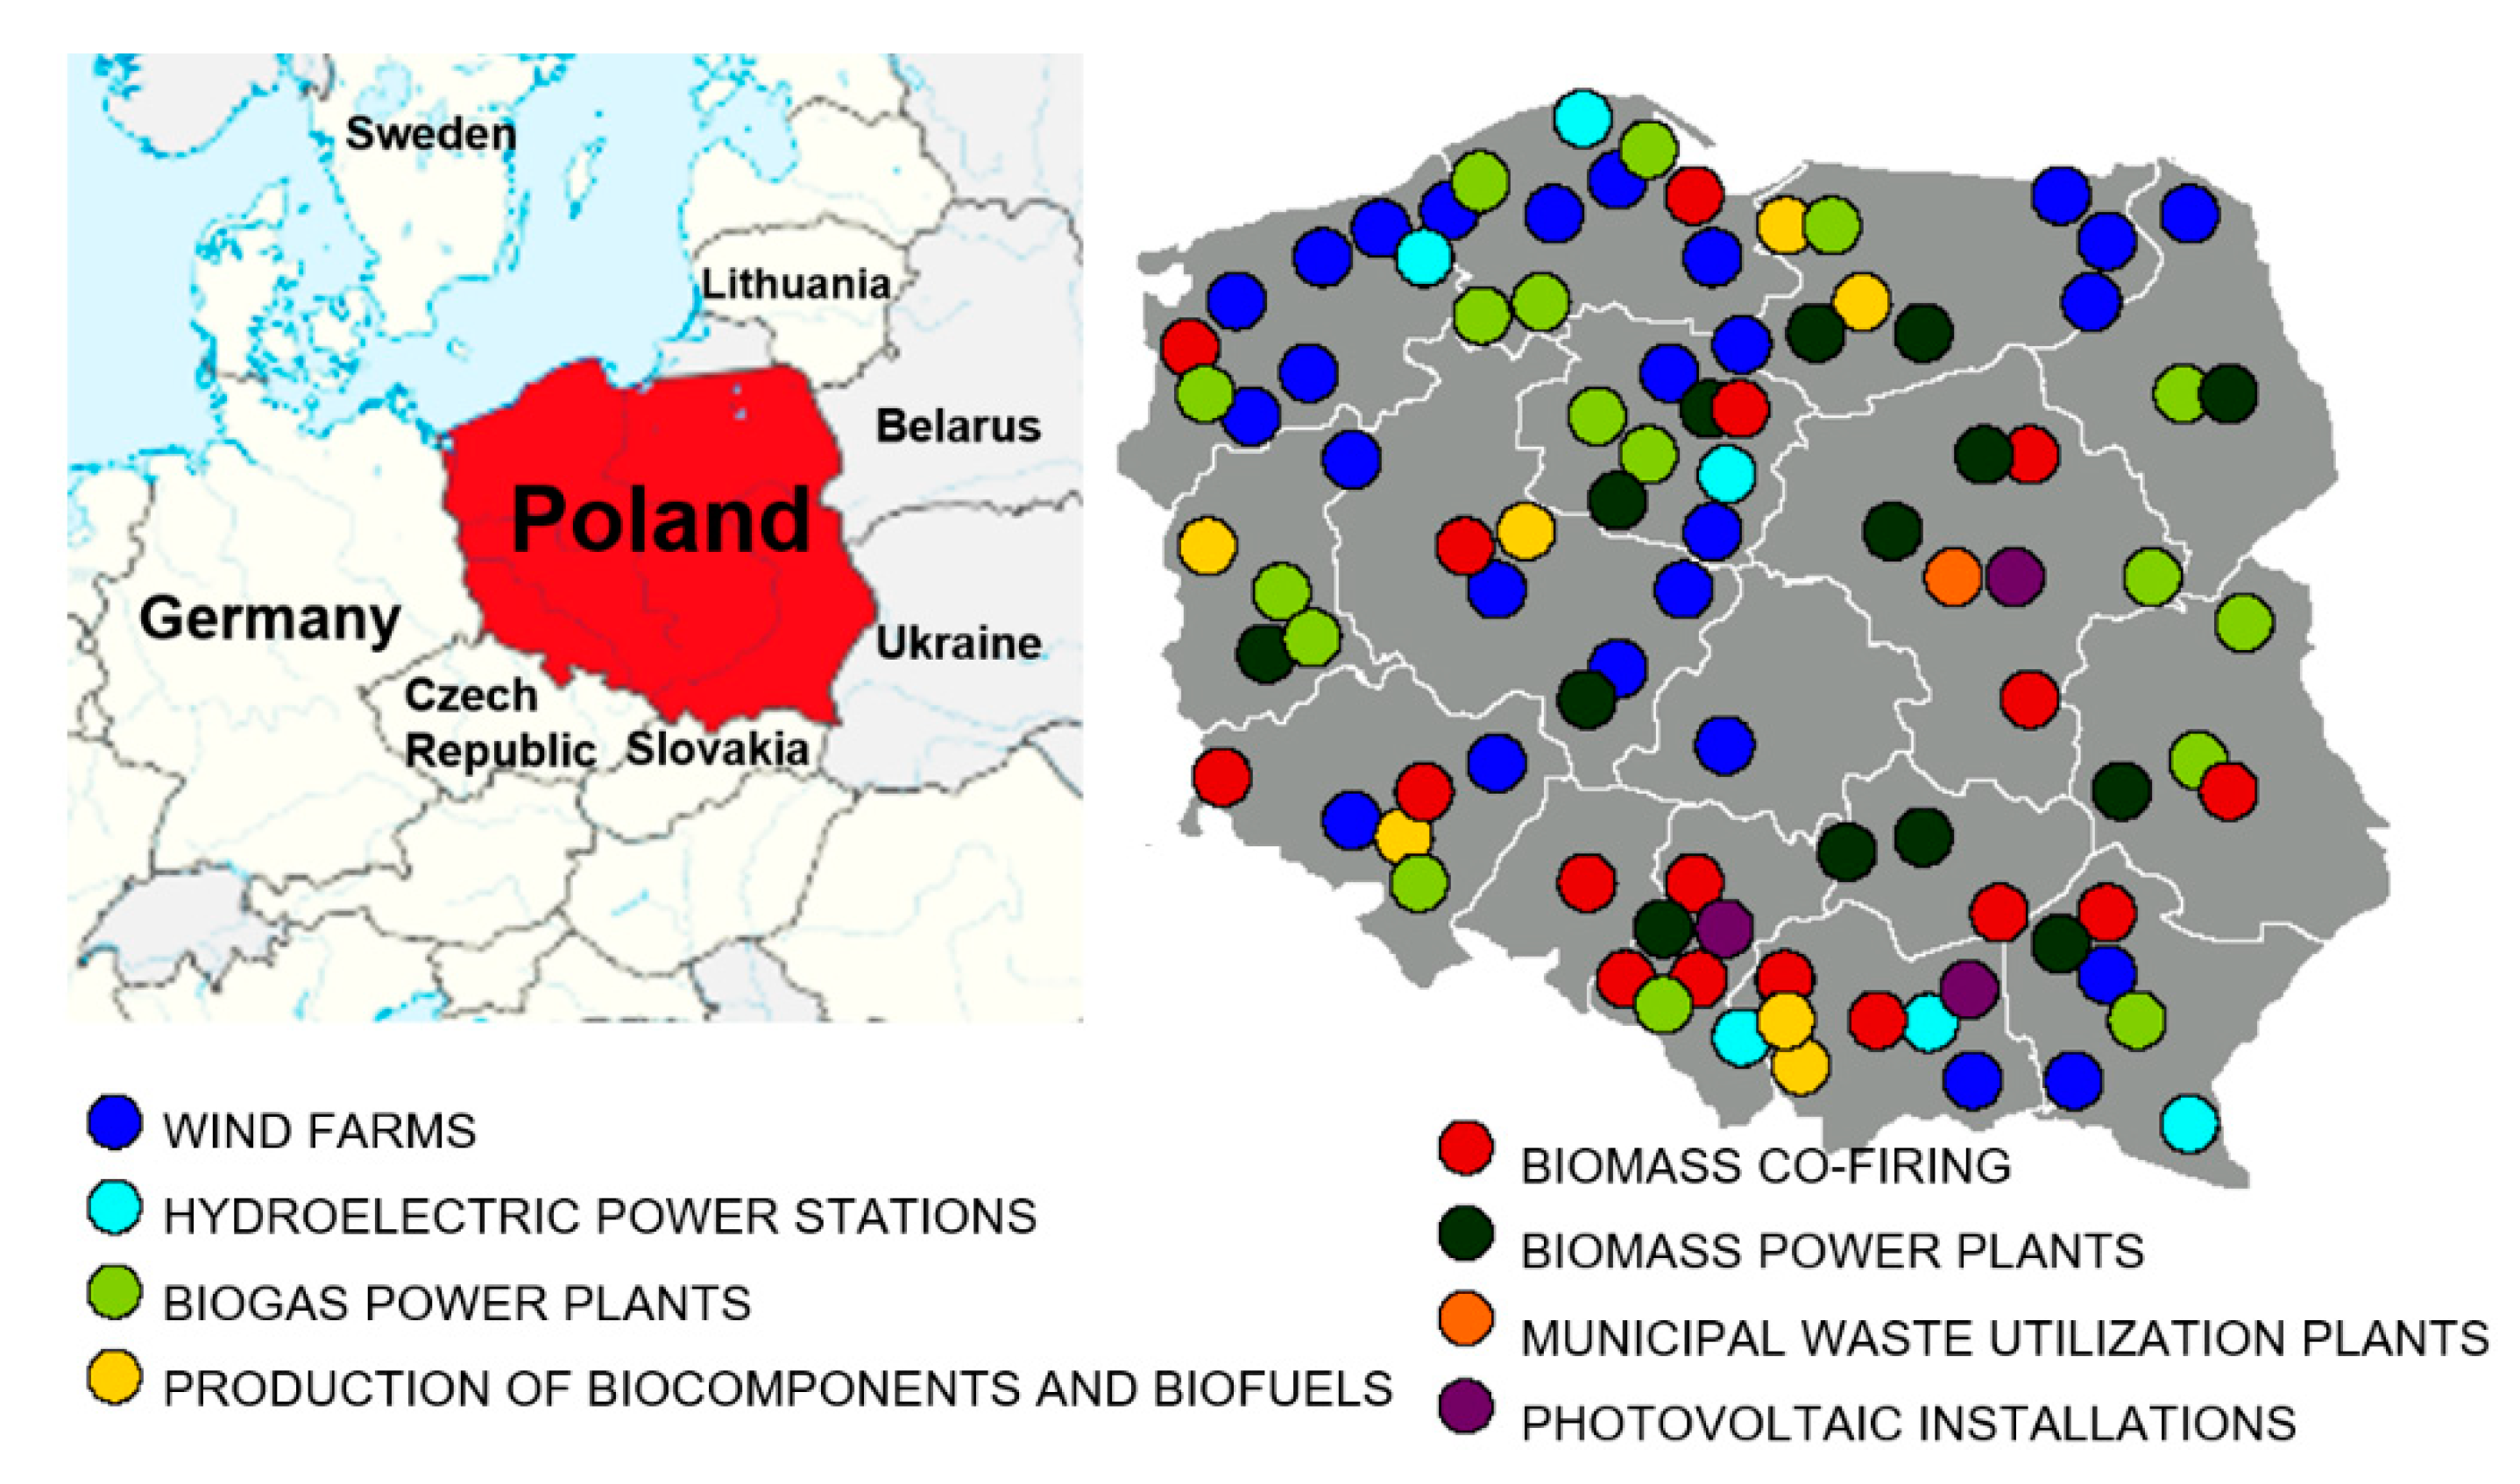
According to data from the International Renewable Energy Agency (IRENA), electricity production from RES in Poland in 2018 accounted for only 11.2% of total energy production [
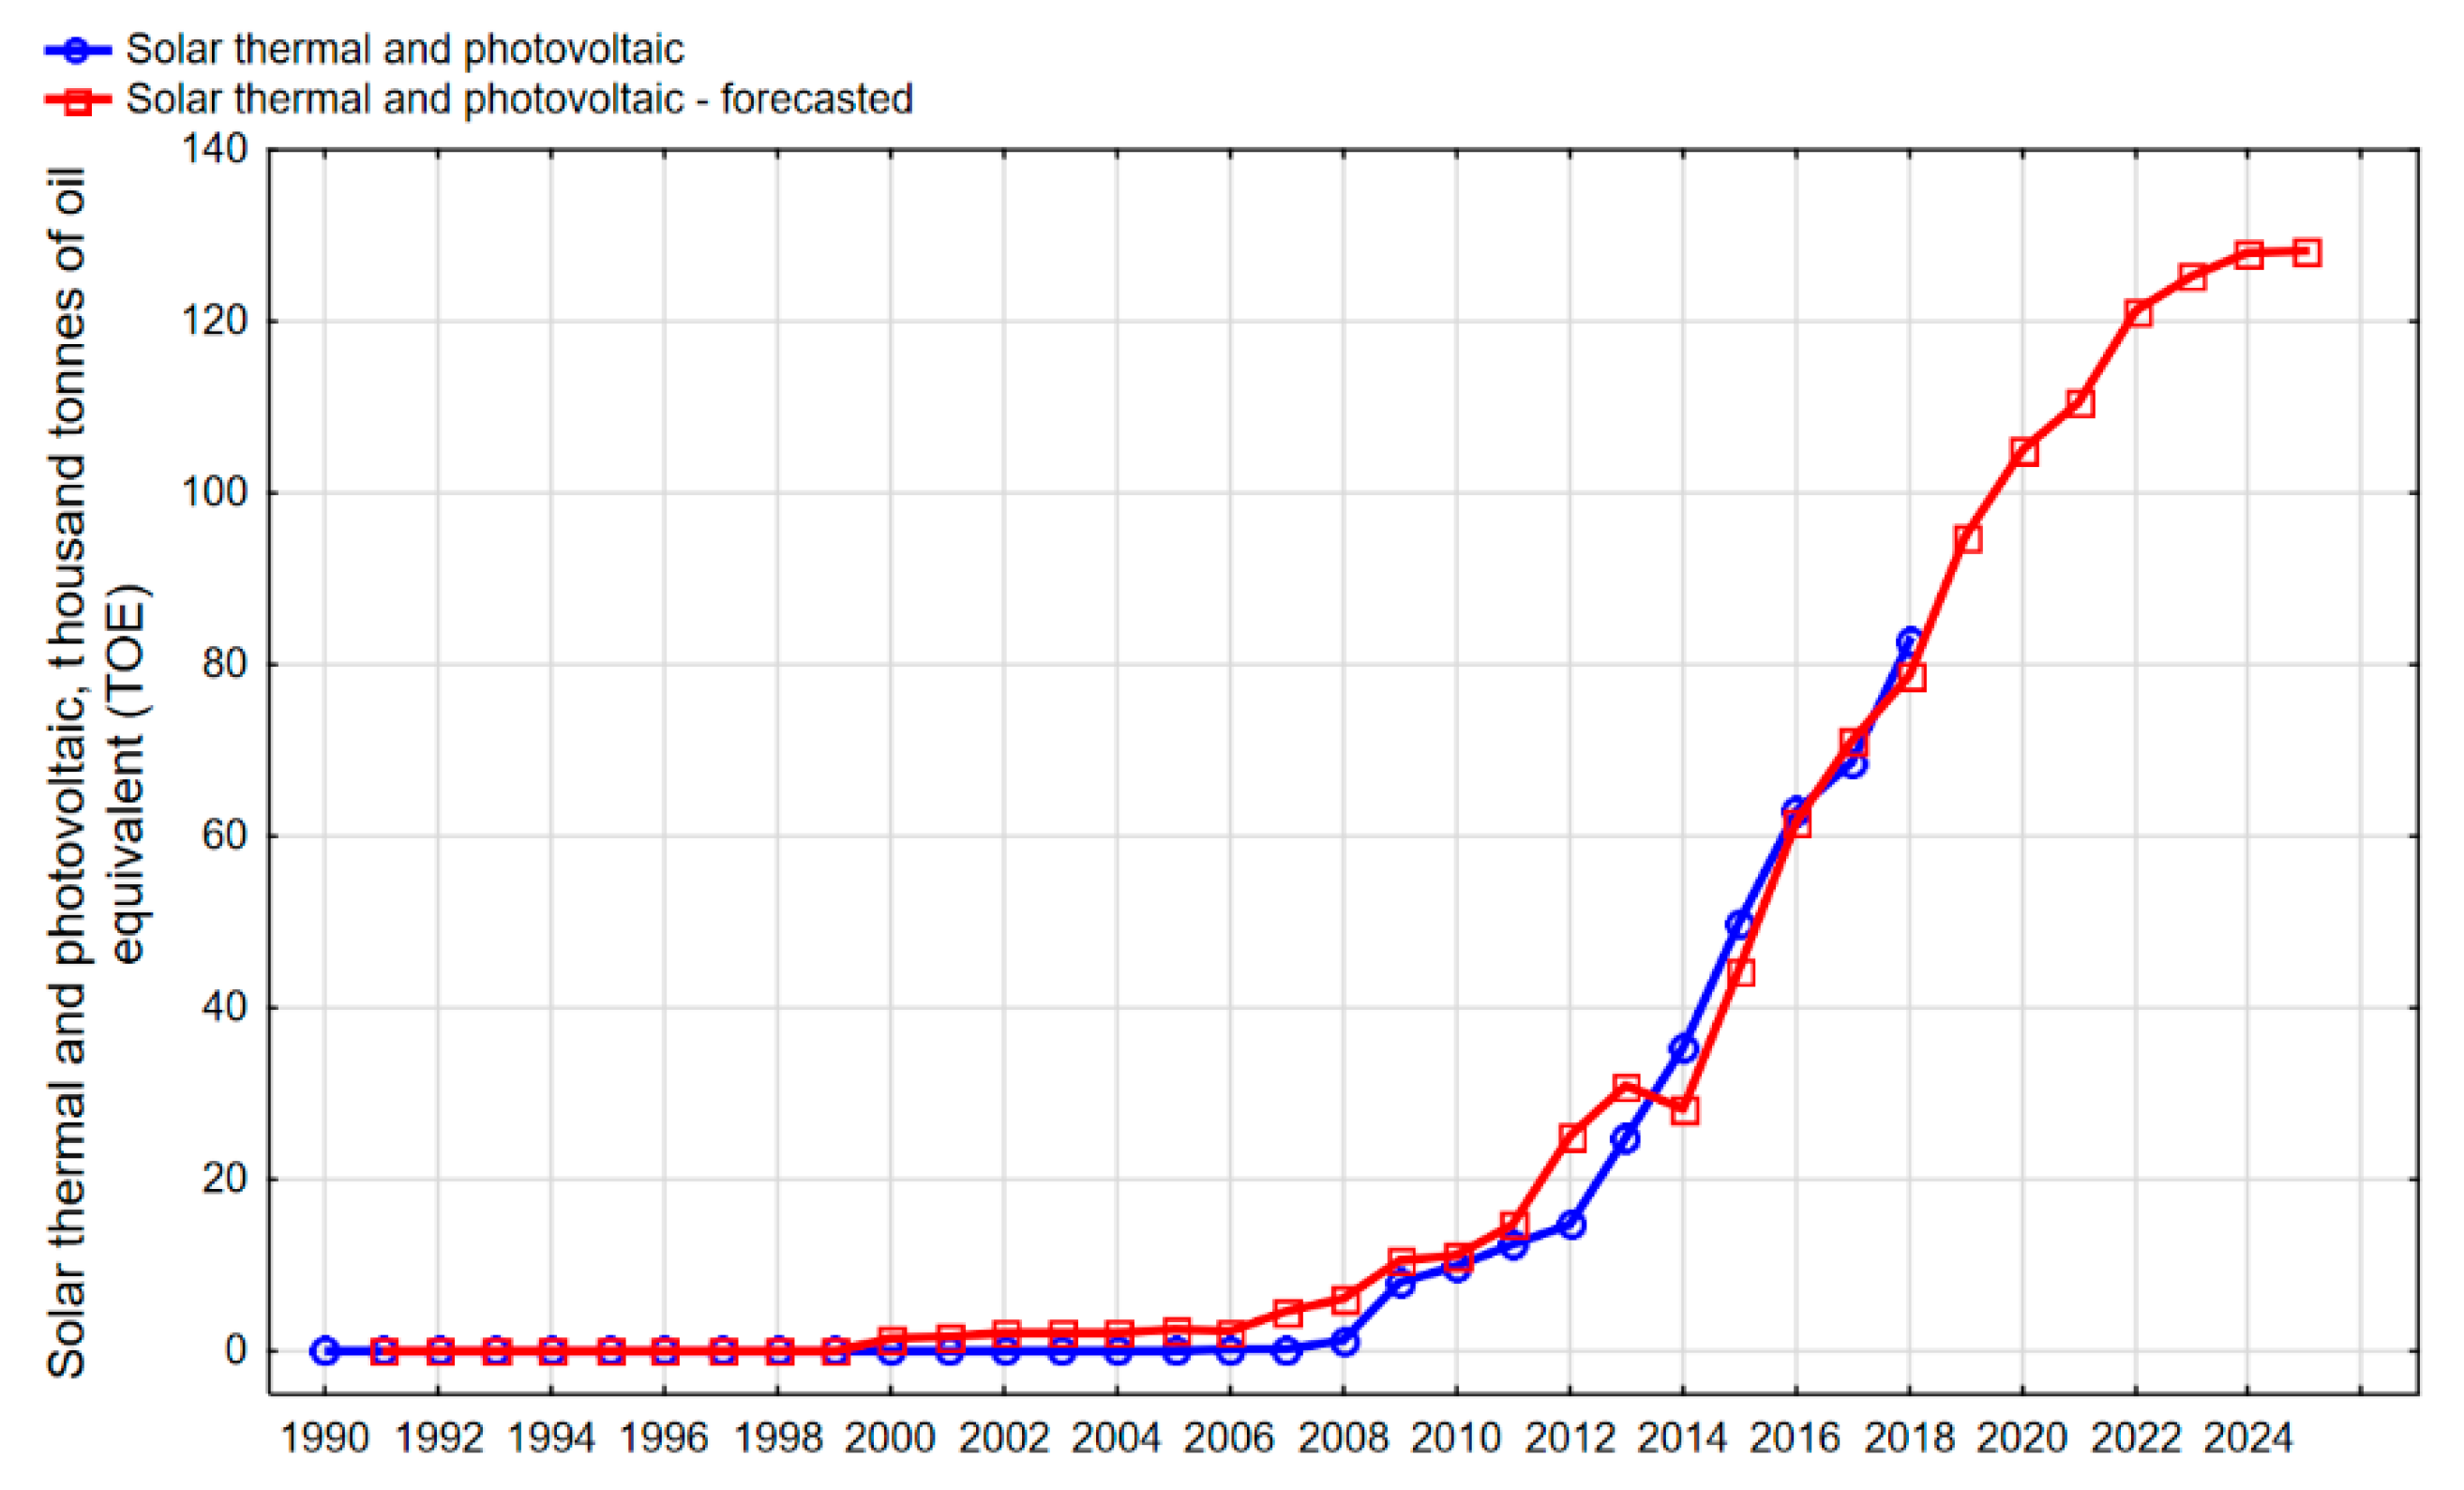
27]. Most of this energy was obtained from biomass, wind and biogas. The share of solar energy has currently been found to be small. However, since 2012, it has been characterized by a significantly growing trend (Figure 1) [
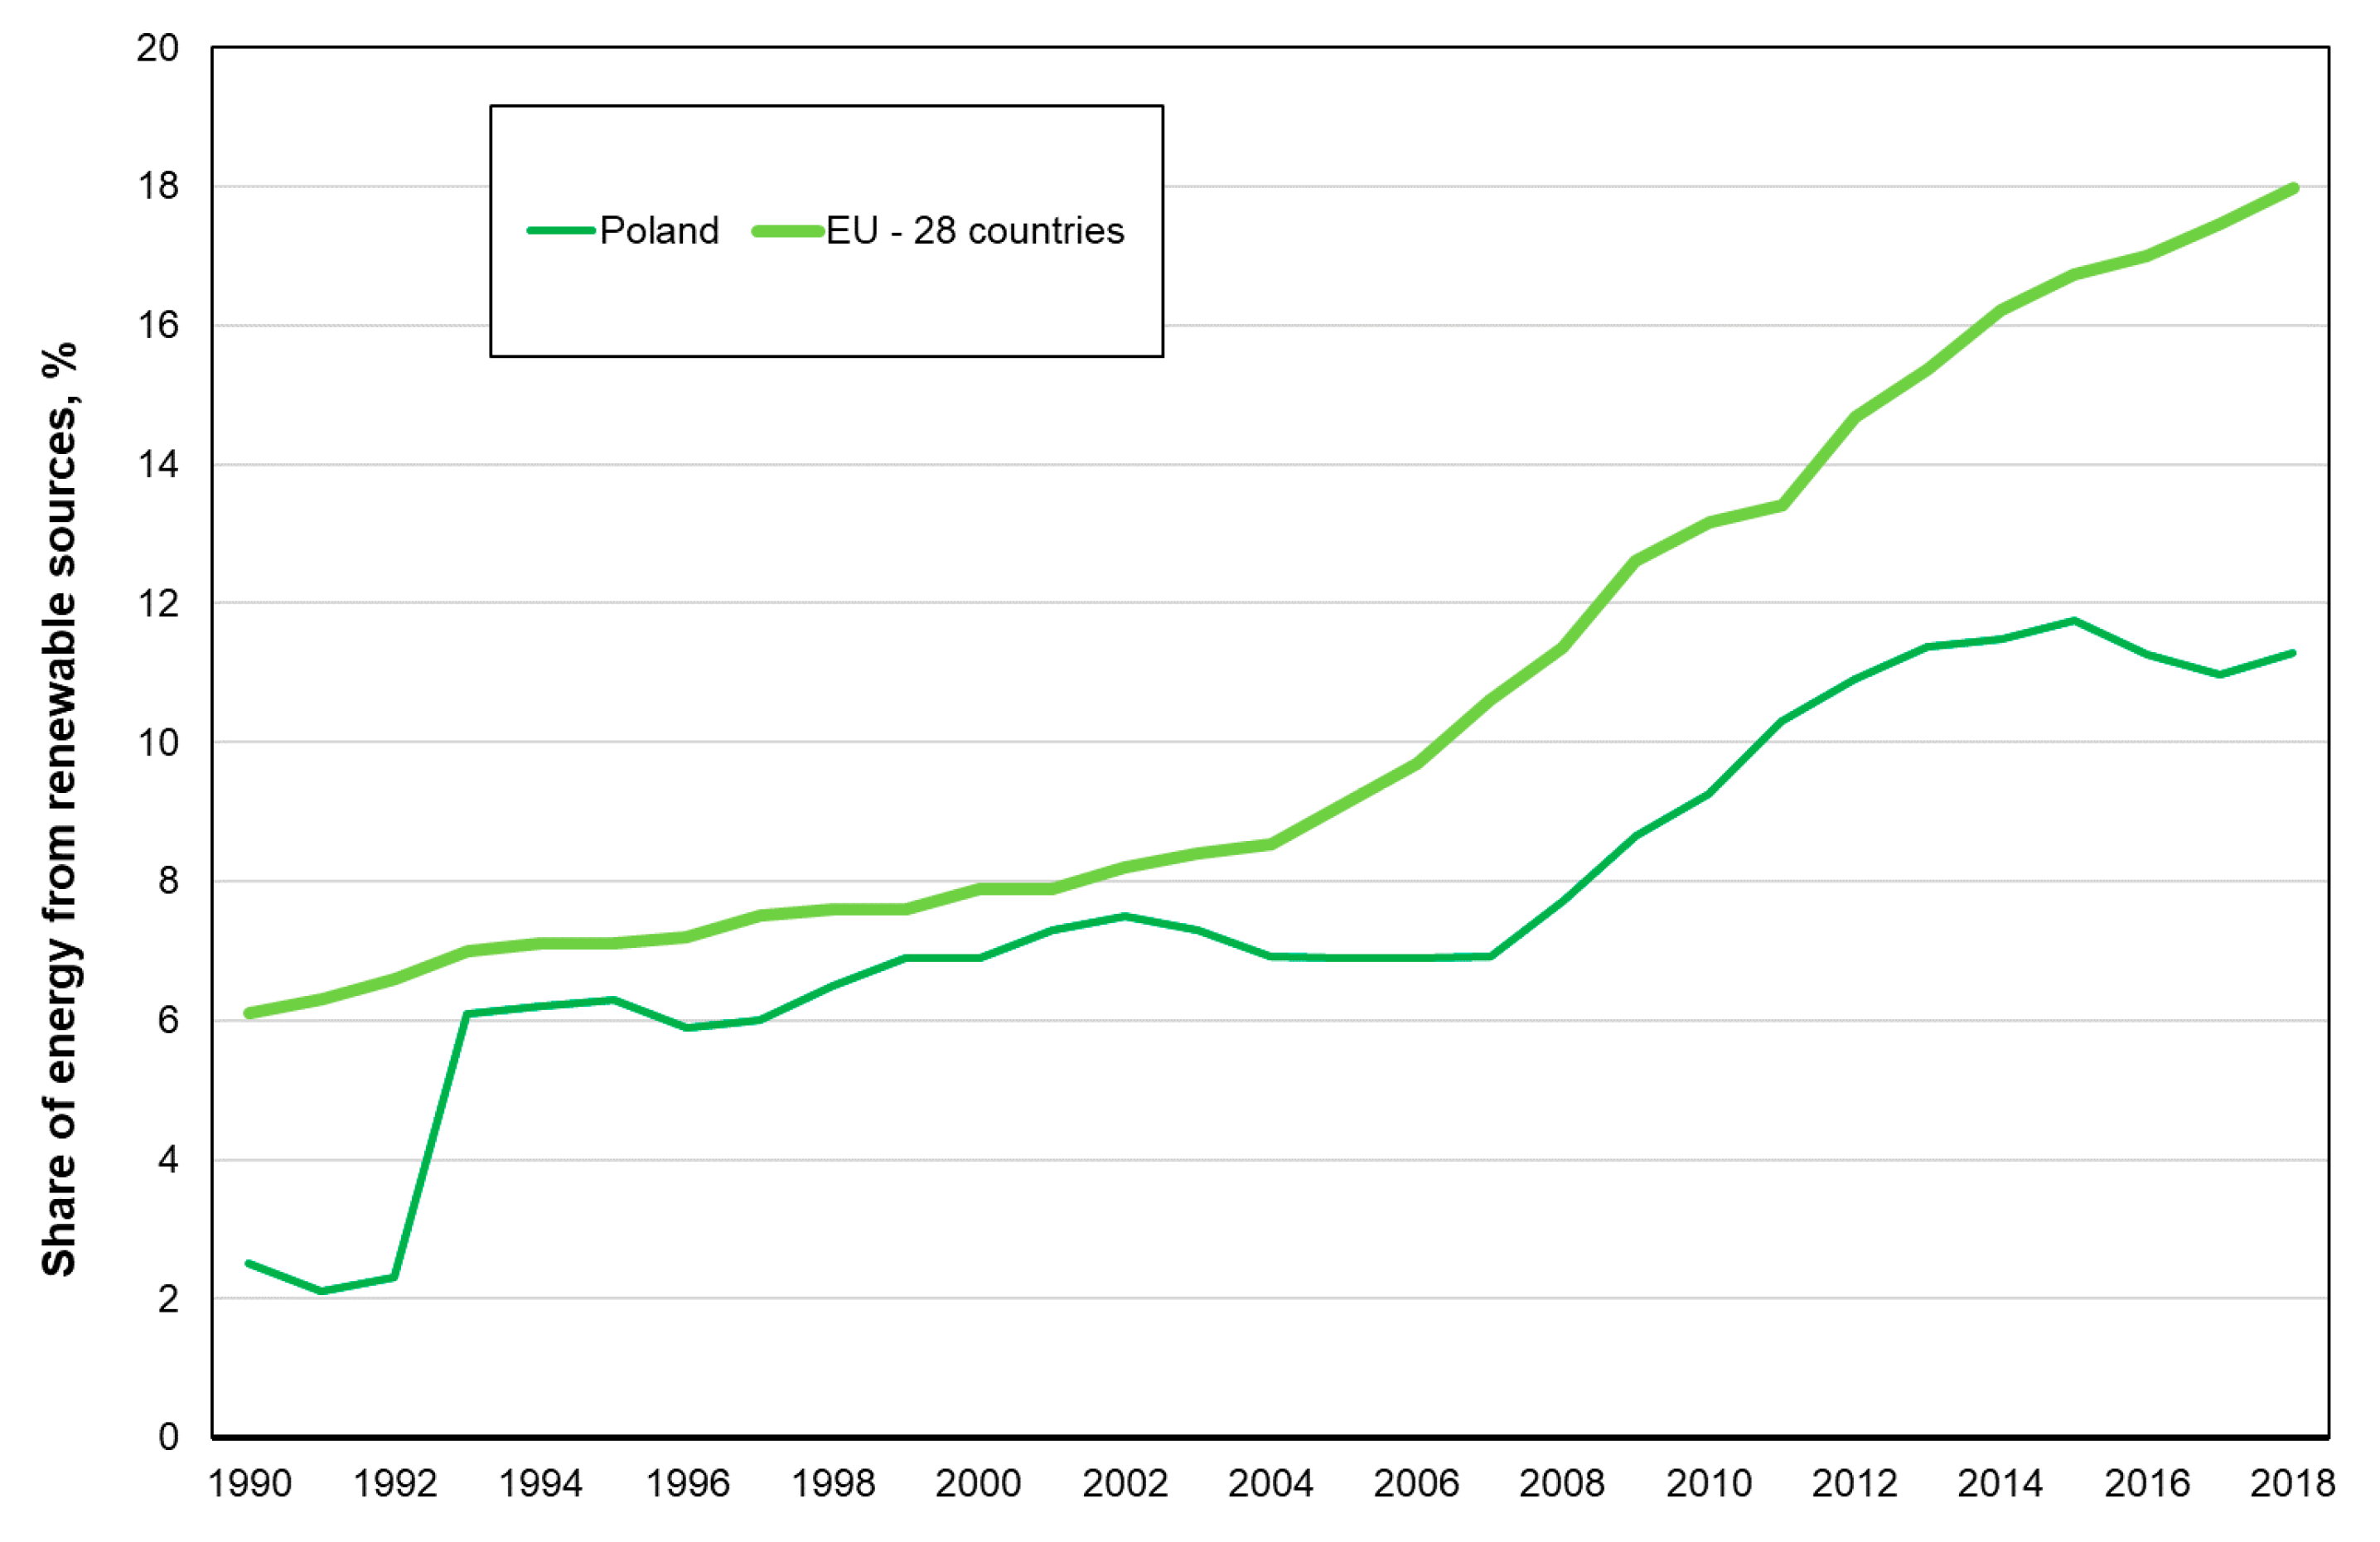
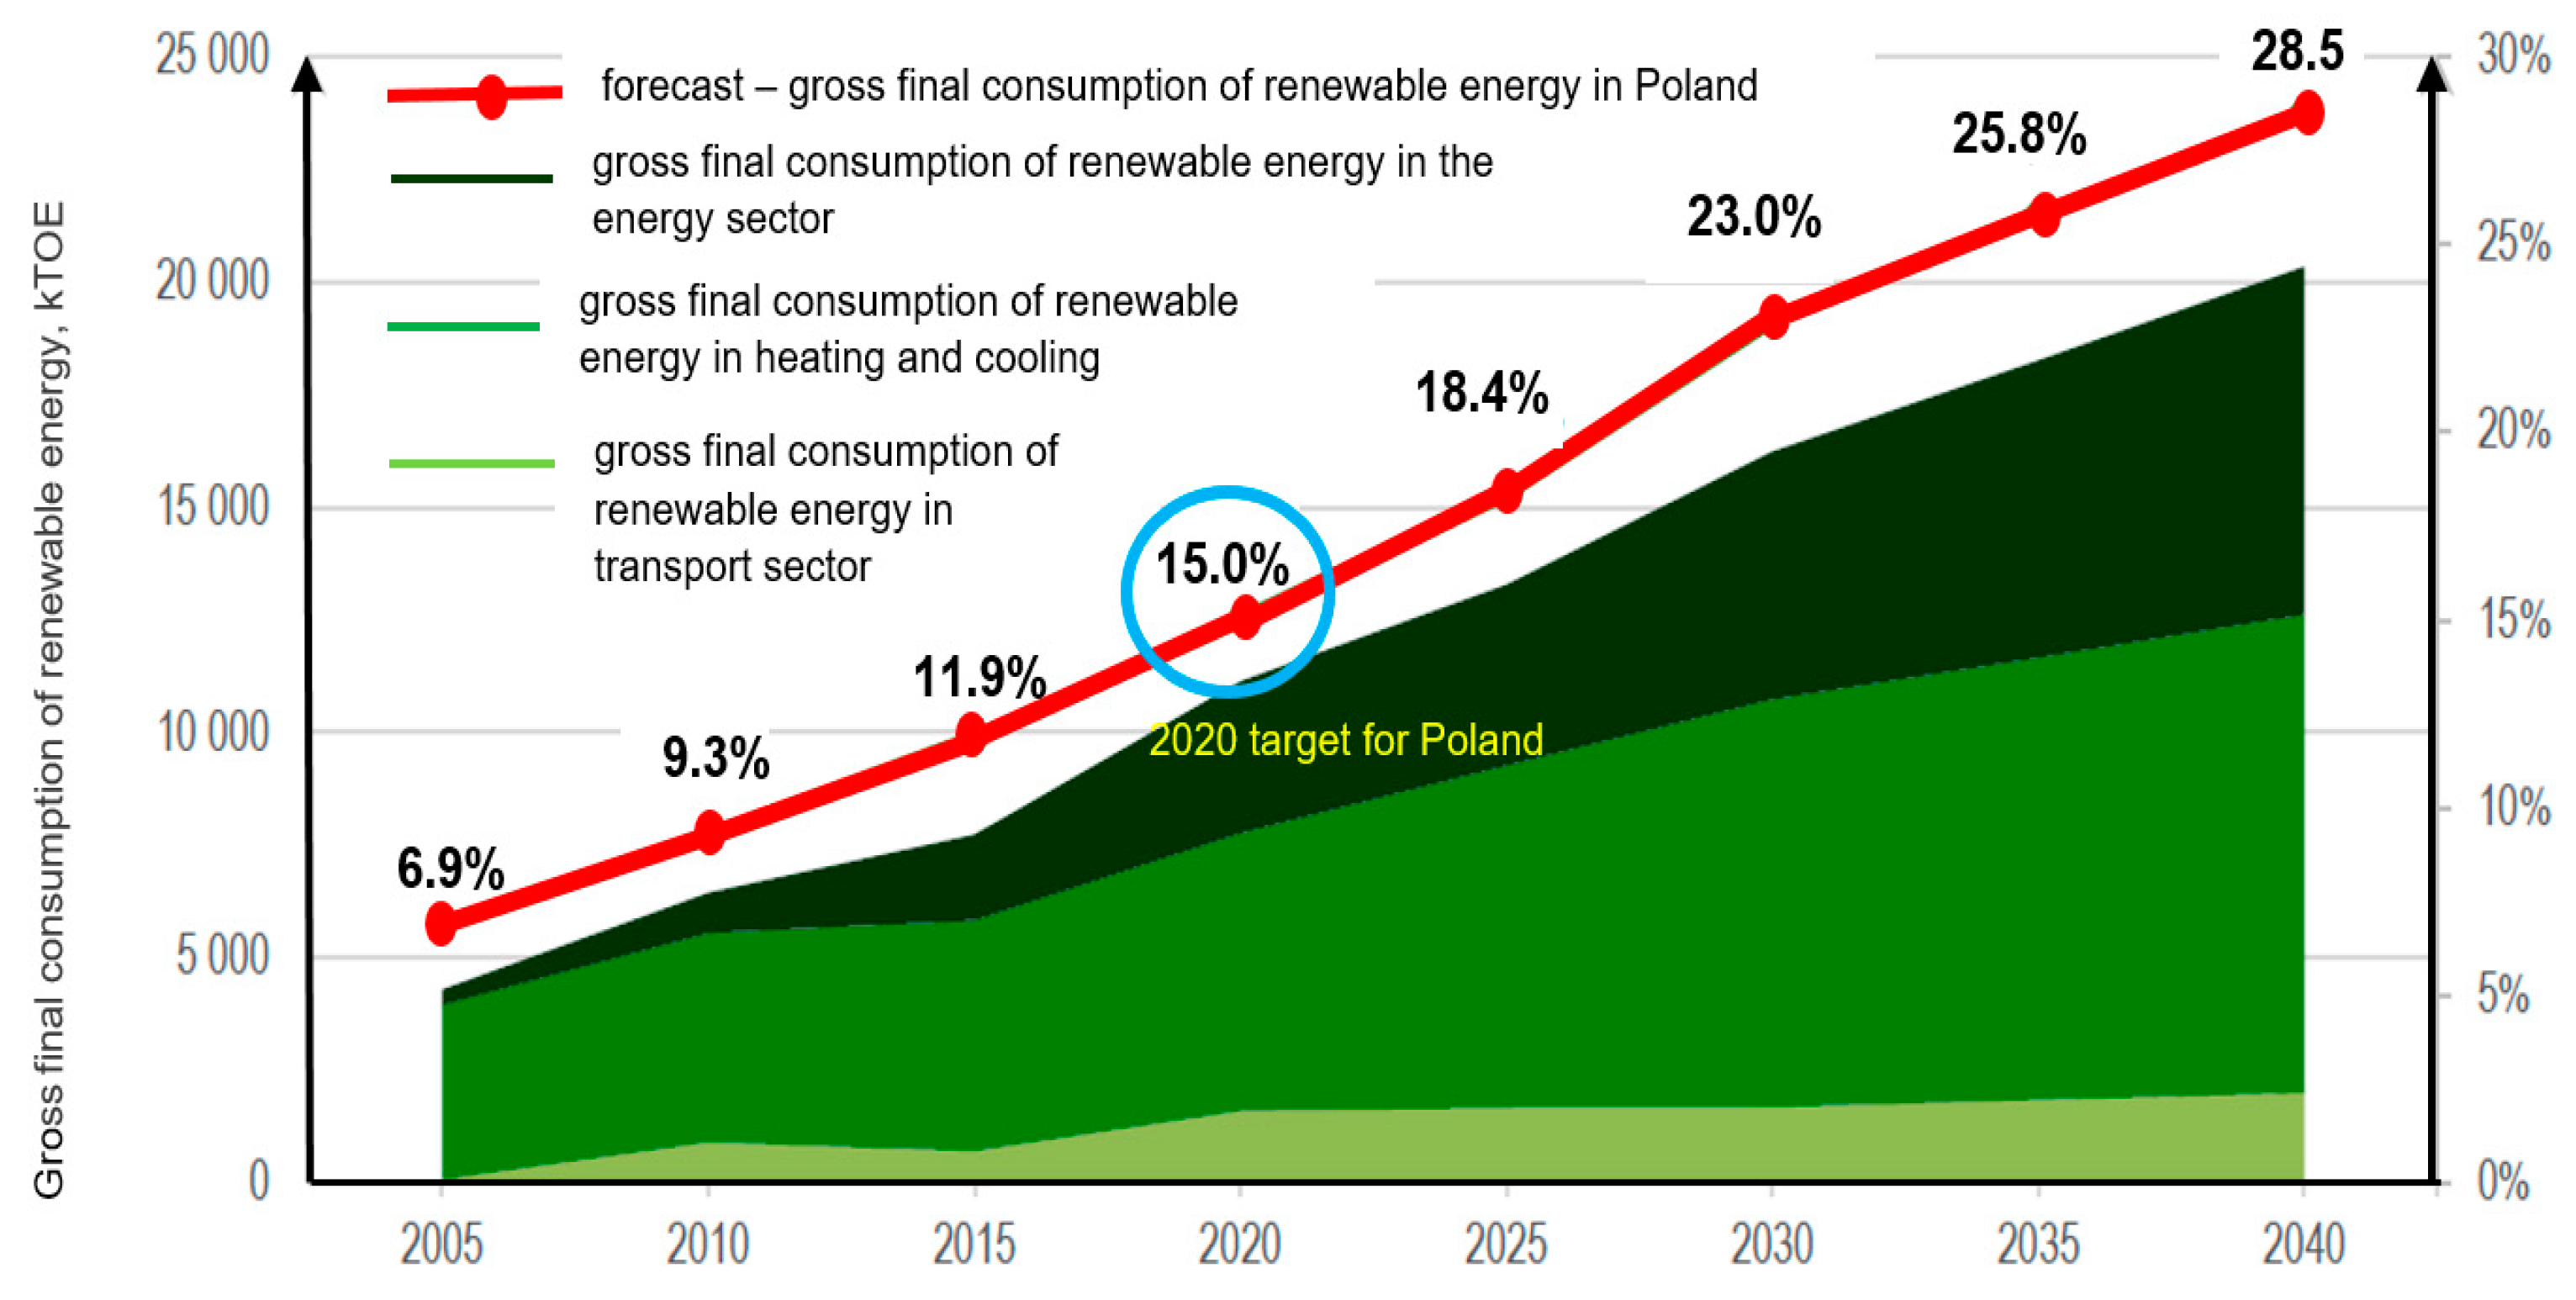
27]. It should also be noted that the share of RES in total energy consumption increased from 2.5% in 1990 to 11.28% in 2018 (Figure 2) [26]. However, this is still a much weaker result than that achieved by the EU countries.
The data presented in 
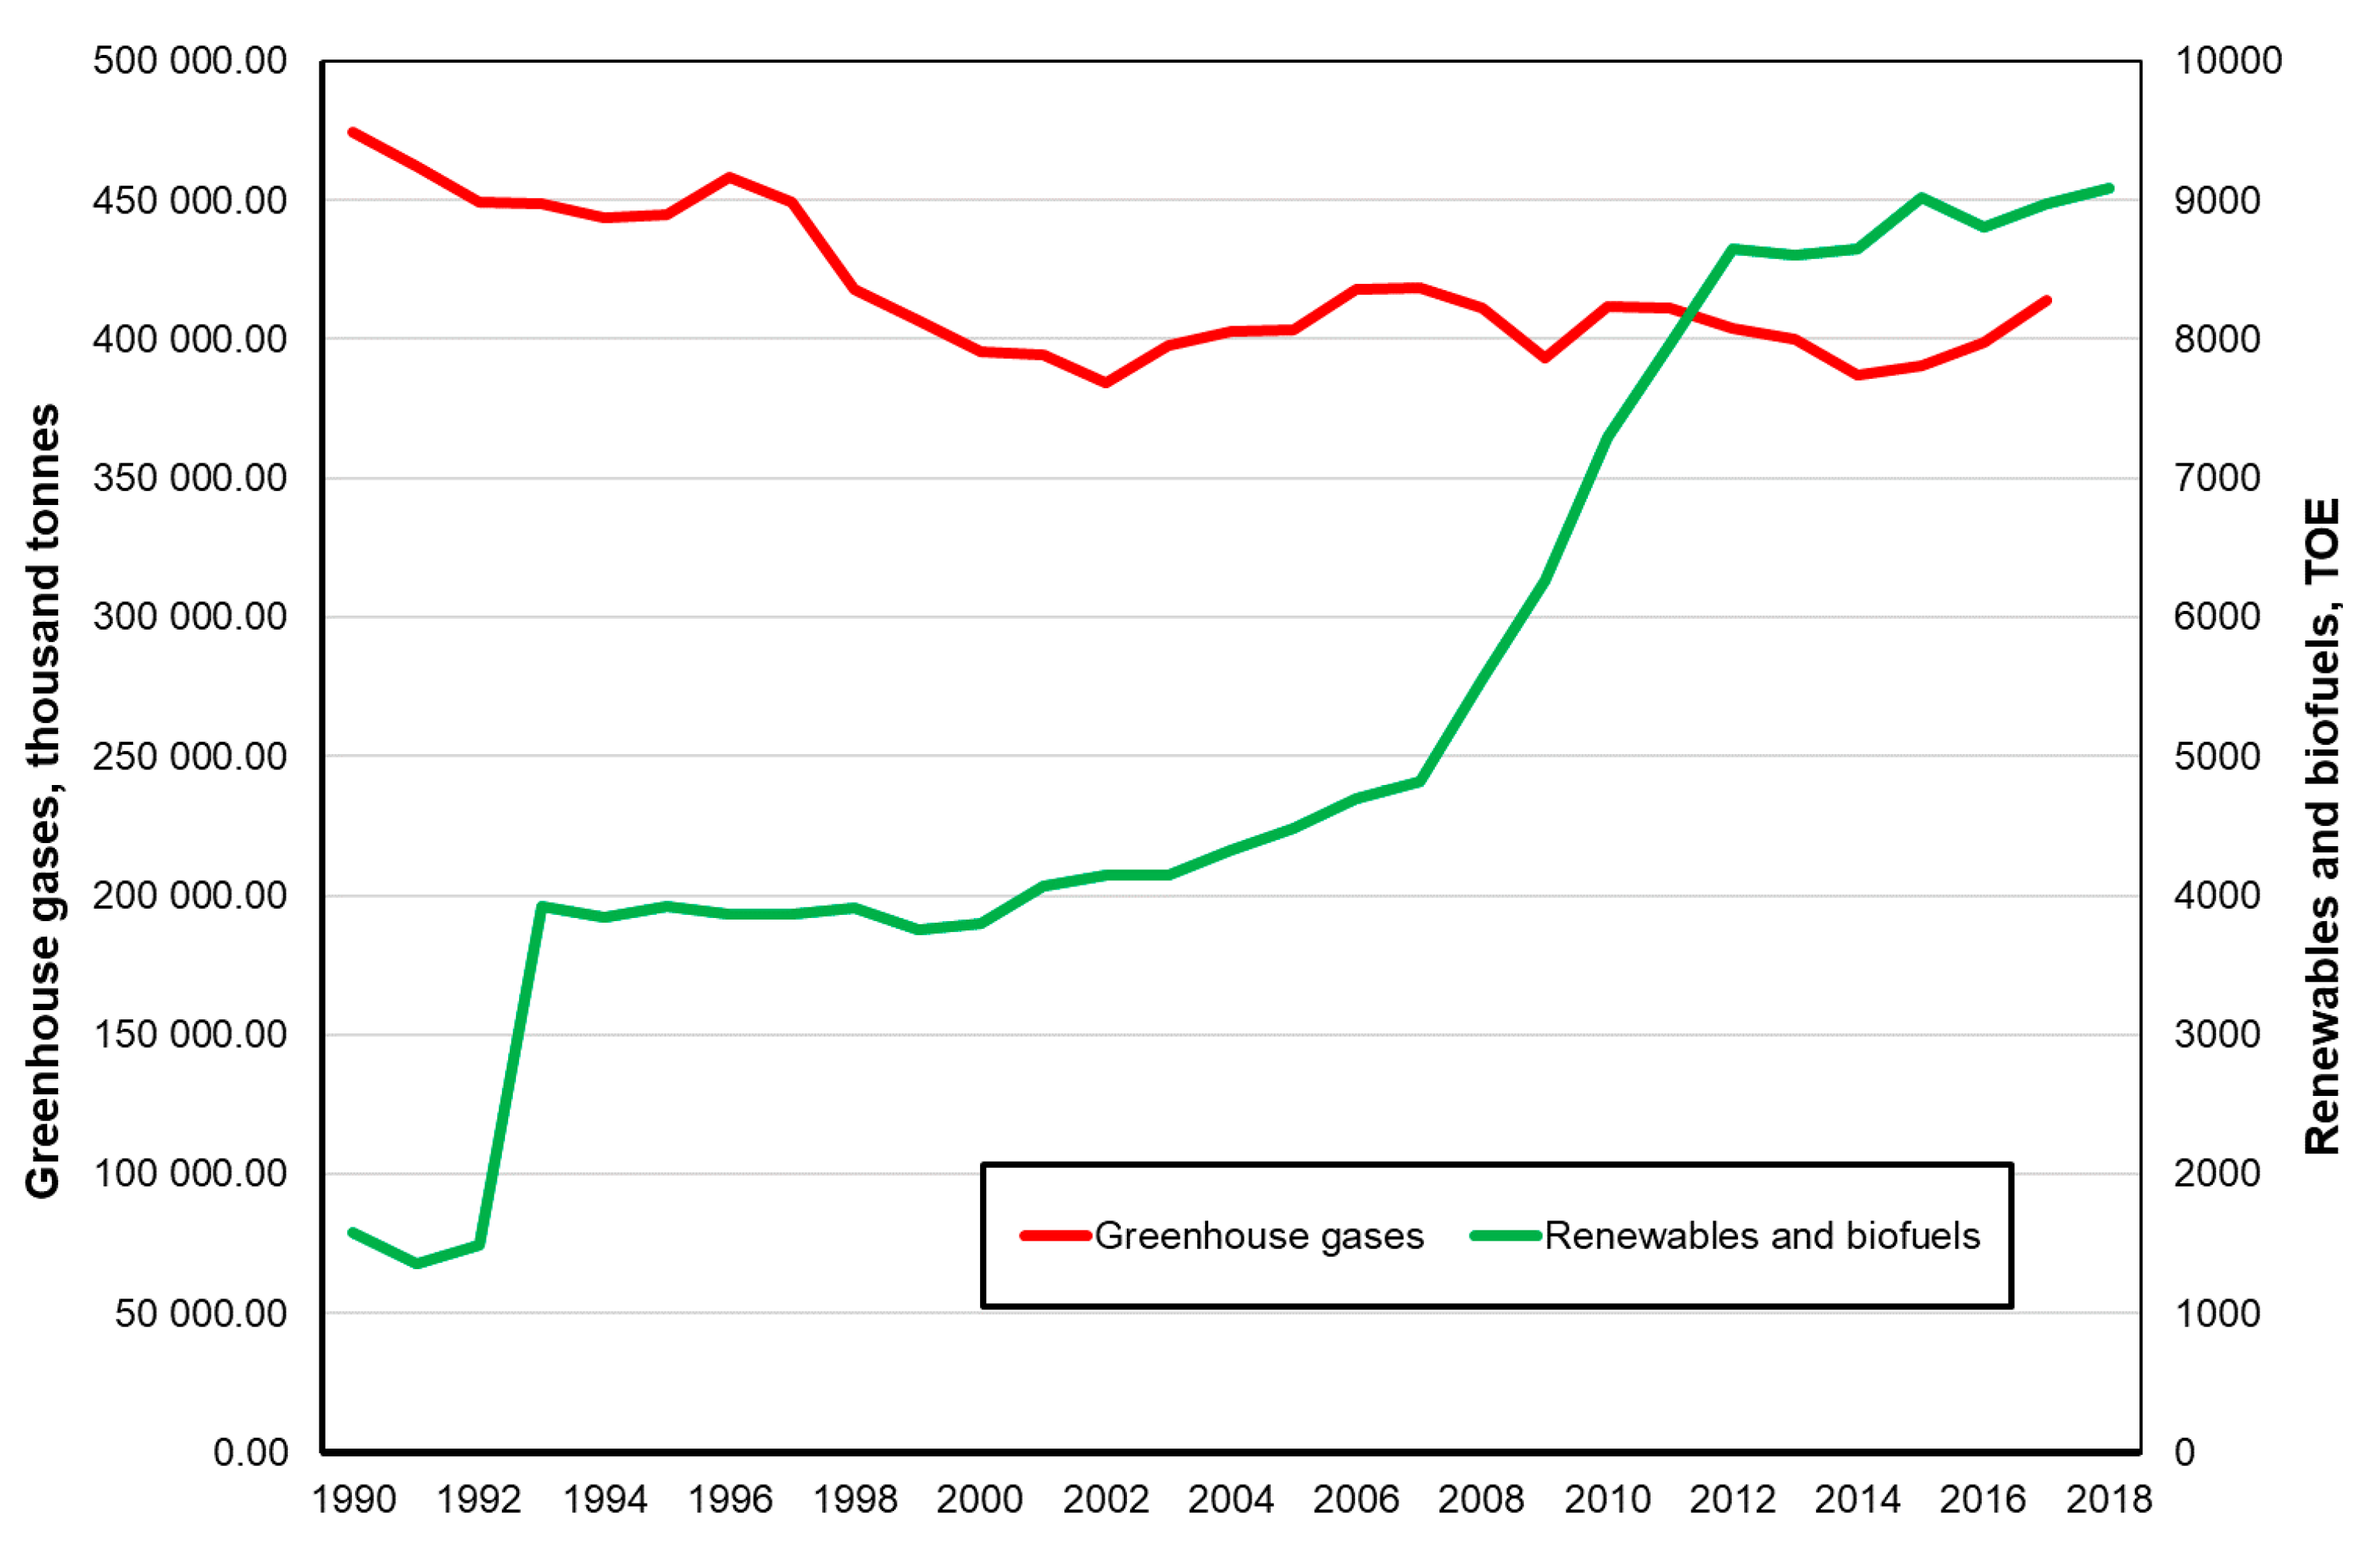
Figure 2 is extremely unfavorable for Poland. The economy based on conventional raw materials has a very negative impact on the environment. In the context of negative climate change, which is the result of such an economy, it becomes inevitable to replace conventional energy sources with RES [28]. The impact of these changes on the emission of harmful substances (greenhouse gases) is shown in Figure 3.
With regard to the foregoing, it is therefore reasonable to state that changing the structure of energy production in Poland is essential. On the one hand, it is required by the EU [30,31] and on the other by public opinion [32,33]. Society is increasingly aware that the huge pollution of the environment has a very negative influence on the climate of the whole Earth and the lives and health of individual citizens.
In general, it can be claimed that the social acceptance of Polish citizens to change the structure of energy production is greater than the political will of the government. The way to achieve the objectives set by the EU in this regard is to increase the share of energy produced from RES in the country’s energy mix. It is also important to maintain the reliability of the energy system (energy security) [34] in terms of meeting energy needs, obtaining energy in a cost-effective way and reducing negative impact on the environment [35]. In this context, attention should be paid to the storage of energy produced from RES due to the fact that energy production from RES, as well as demand for it, can be characterized by variability in time [36]. In the context of renewable energy production, it should be borne in mind that both solar and wind energy have virtually zero marginal production costs, but these types of energy are only available when there are favorable weather conditions, i.e., the sun shines or the wind blows. Therefore, it is necessary to store this energy, which is not an easy task [37].
Little research is devoted to the issue of energy production from RES, including forecasts for its production in Poland in the upcoming years.
Onkisz-Popławska et al. presented the prospects for the development of renewable energy in Poland [38]. Igliński et al. showed the state of production of geothermal energy [39] in Poland and biogas-based energy [40]. In turn, in [41], the same authors discussed the state of renewable energy in one of the Polish voivodeships. In [42], the authors present the assessment of the RES penetration and the RES generation ramps (generation variety) within the time horizon until 2025. Bugała et al. in [43] showed the short-term forecast of electric energy generation in photovoltaic systems in Poland.
A number of studies devoted to renewable energy concern the perspectives of their development both in Poland and in the world [44,45,46,47,48,49,50].
With regard to forecasting the volume of energy produced from RES, numerous studies concern China [51], Turkey [52], and the United States [53].
Undoubtedly, the results of these papers give a picture of the existing situation in terms of the structure of energy production in the near future.
As already mentioned, there is no such research in the area of predicting energy production from RES in Poland. The only studies on how the production of renewable energy in Poland will look over the next few decades were conducted at the request of the government [54,55,56] and are very optimistic, despite the signals that the increase in this production in Poland in relation to the increases observed in other EU countries is at a very unsatisfactory level. Thus, according to the authors, such a forecast should be developed by independent researchers. Also, it must be reliable, not based on general plans or approximate estimates, but on current data with the use of modern, advanced methods, which currently include artificial neural networks.
Such forecasts should broaden knowledge in the field of energy production from RES and their perspectives. It is crucial to see when Poland, with the current state of the economy, can achieve the assumed goal of a 15% share of this energy in the total amount of energy produced. According to the original assumptions, this goal should be accomplished in 2020 [30].
Therefore, this article focuses on analyzing the structure and amount of energy produced from RES. Based on the changes taking place in recent years, analyses were carried out to predict energy production from RES until 2025. It was assumed that the results achieved in this period will have a decisive impact on meeting the criteria assumed by the EU. The results should also show the state that can be achieved in 2025 with the current dynamics of change and the policy pursued. In addition, the research also looked at individual sources from which renewable energy is produced in Poland. The analysis of the structure of this production and its prediction should form the basis for developing an energy policy for the coming years.
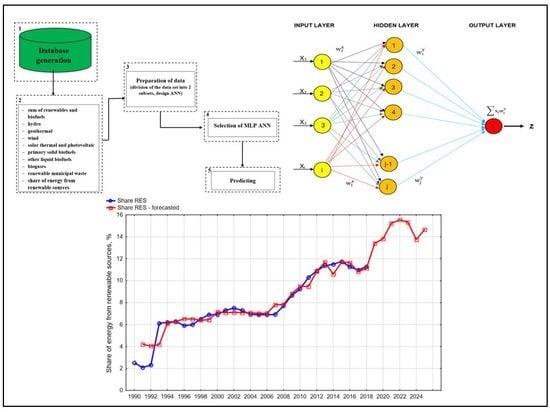
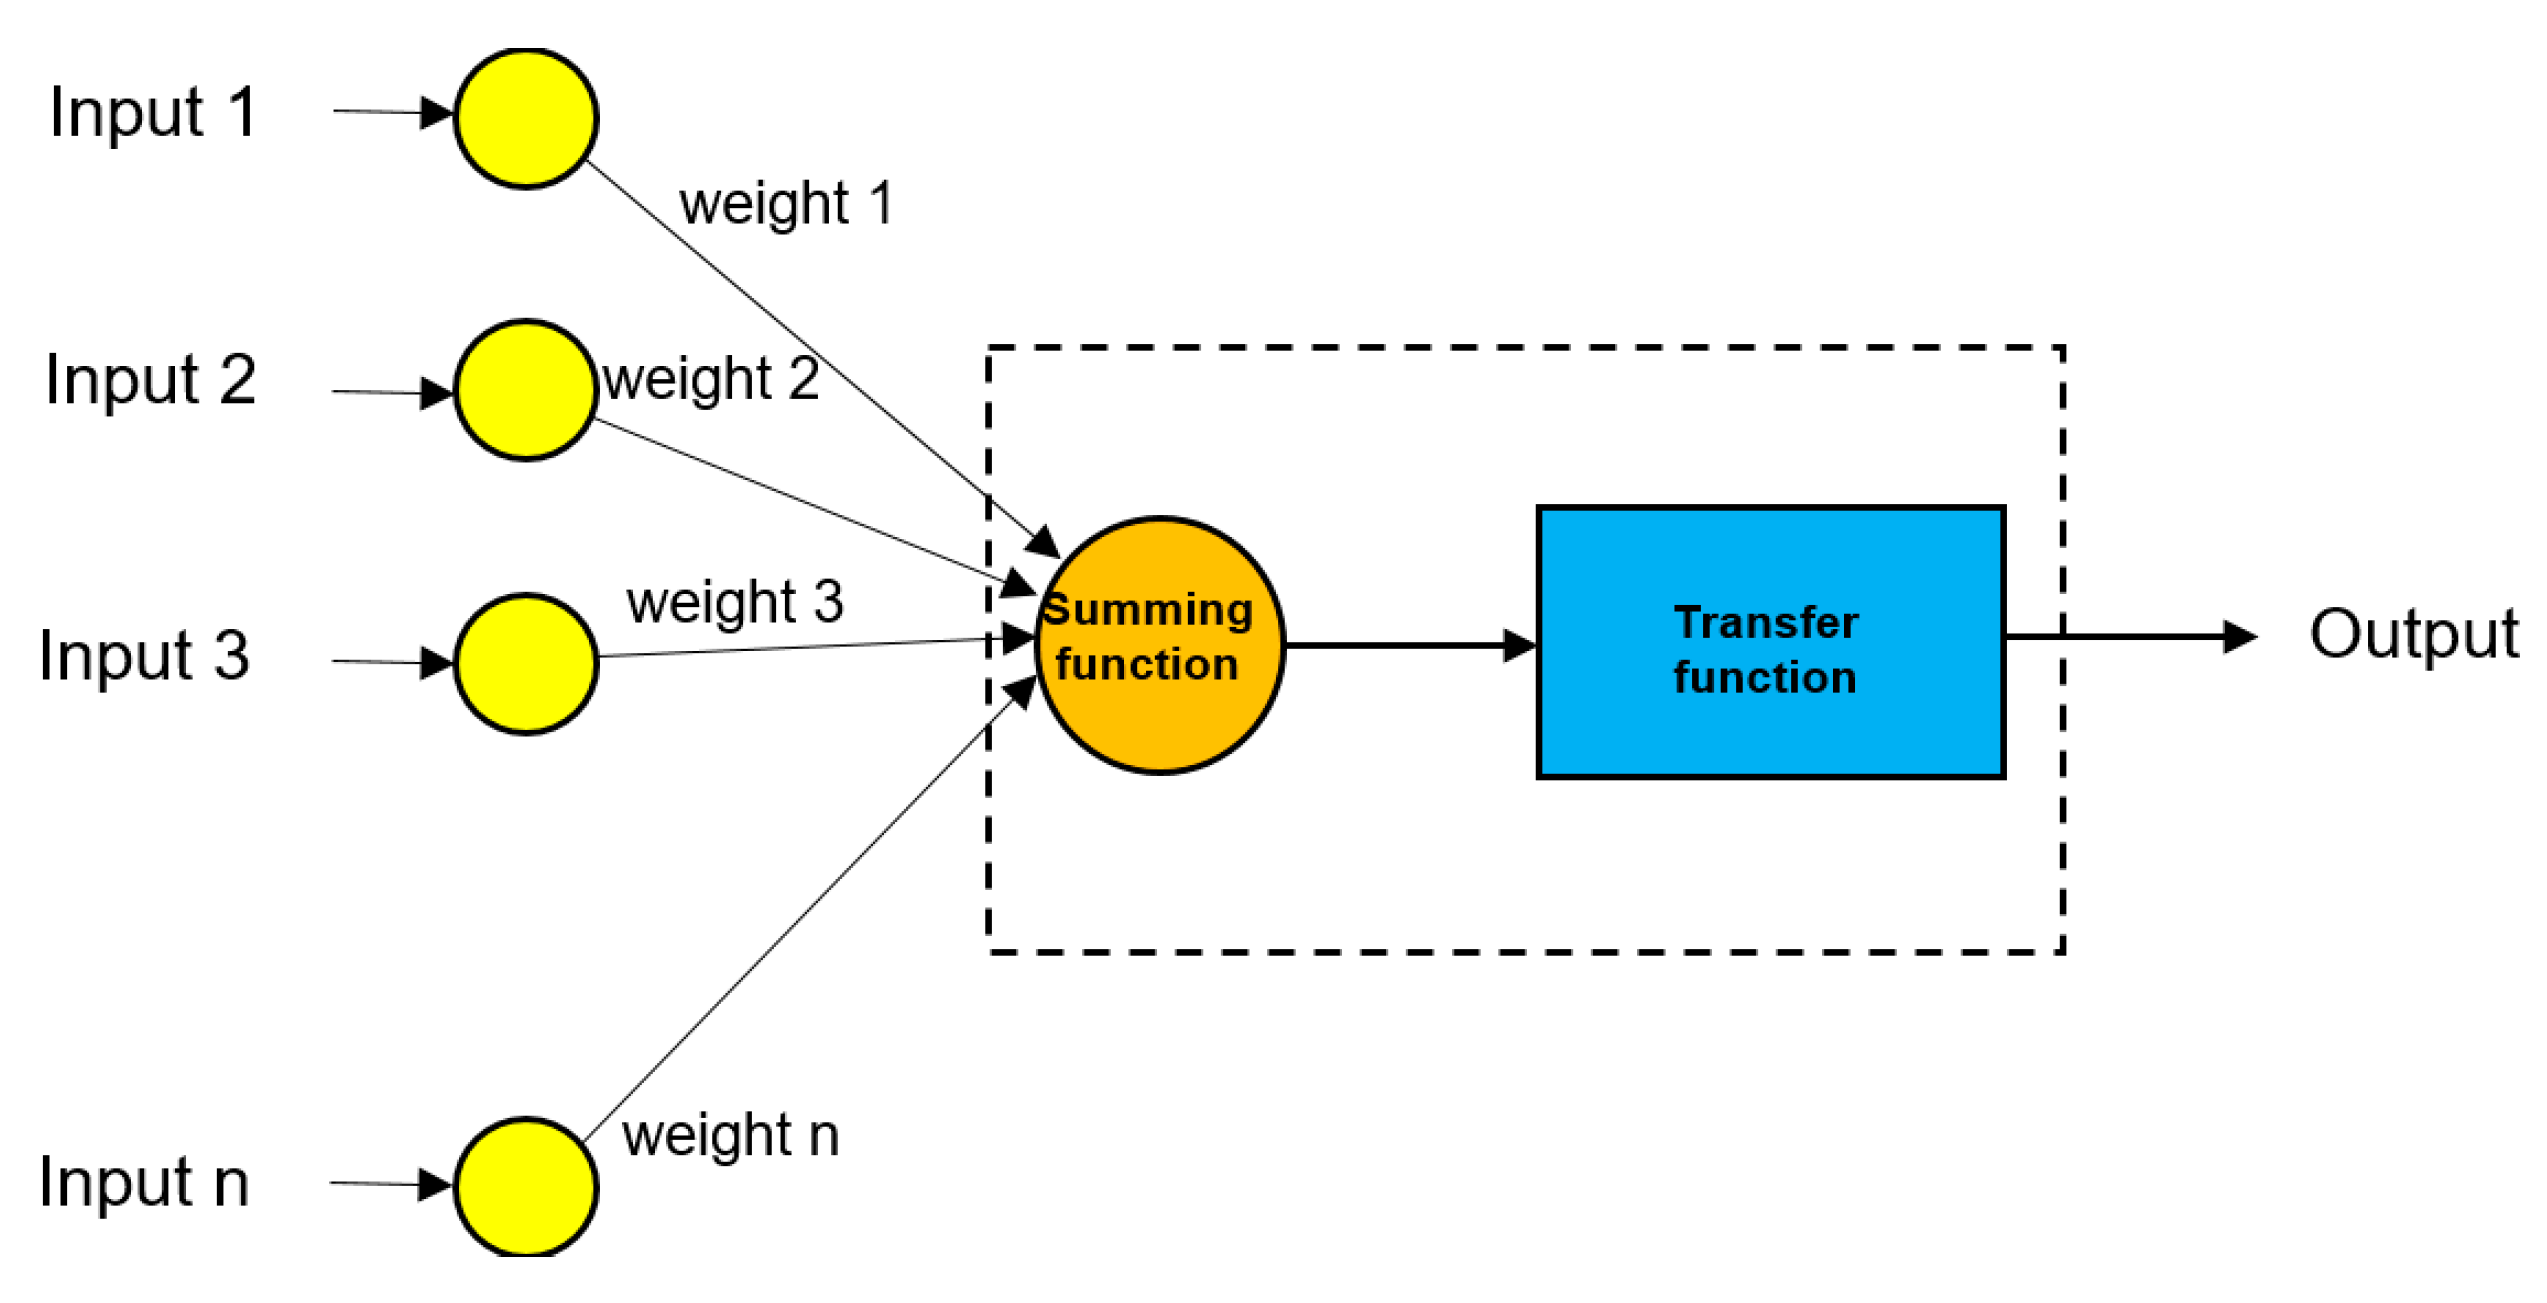
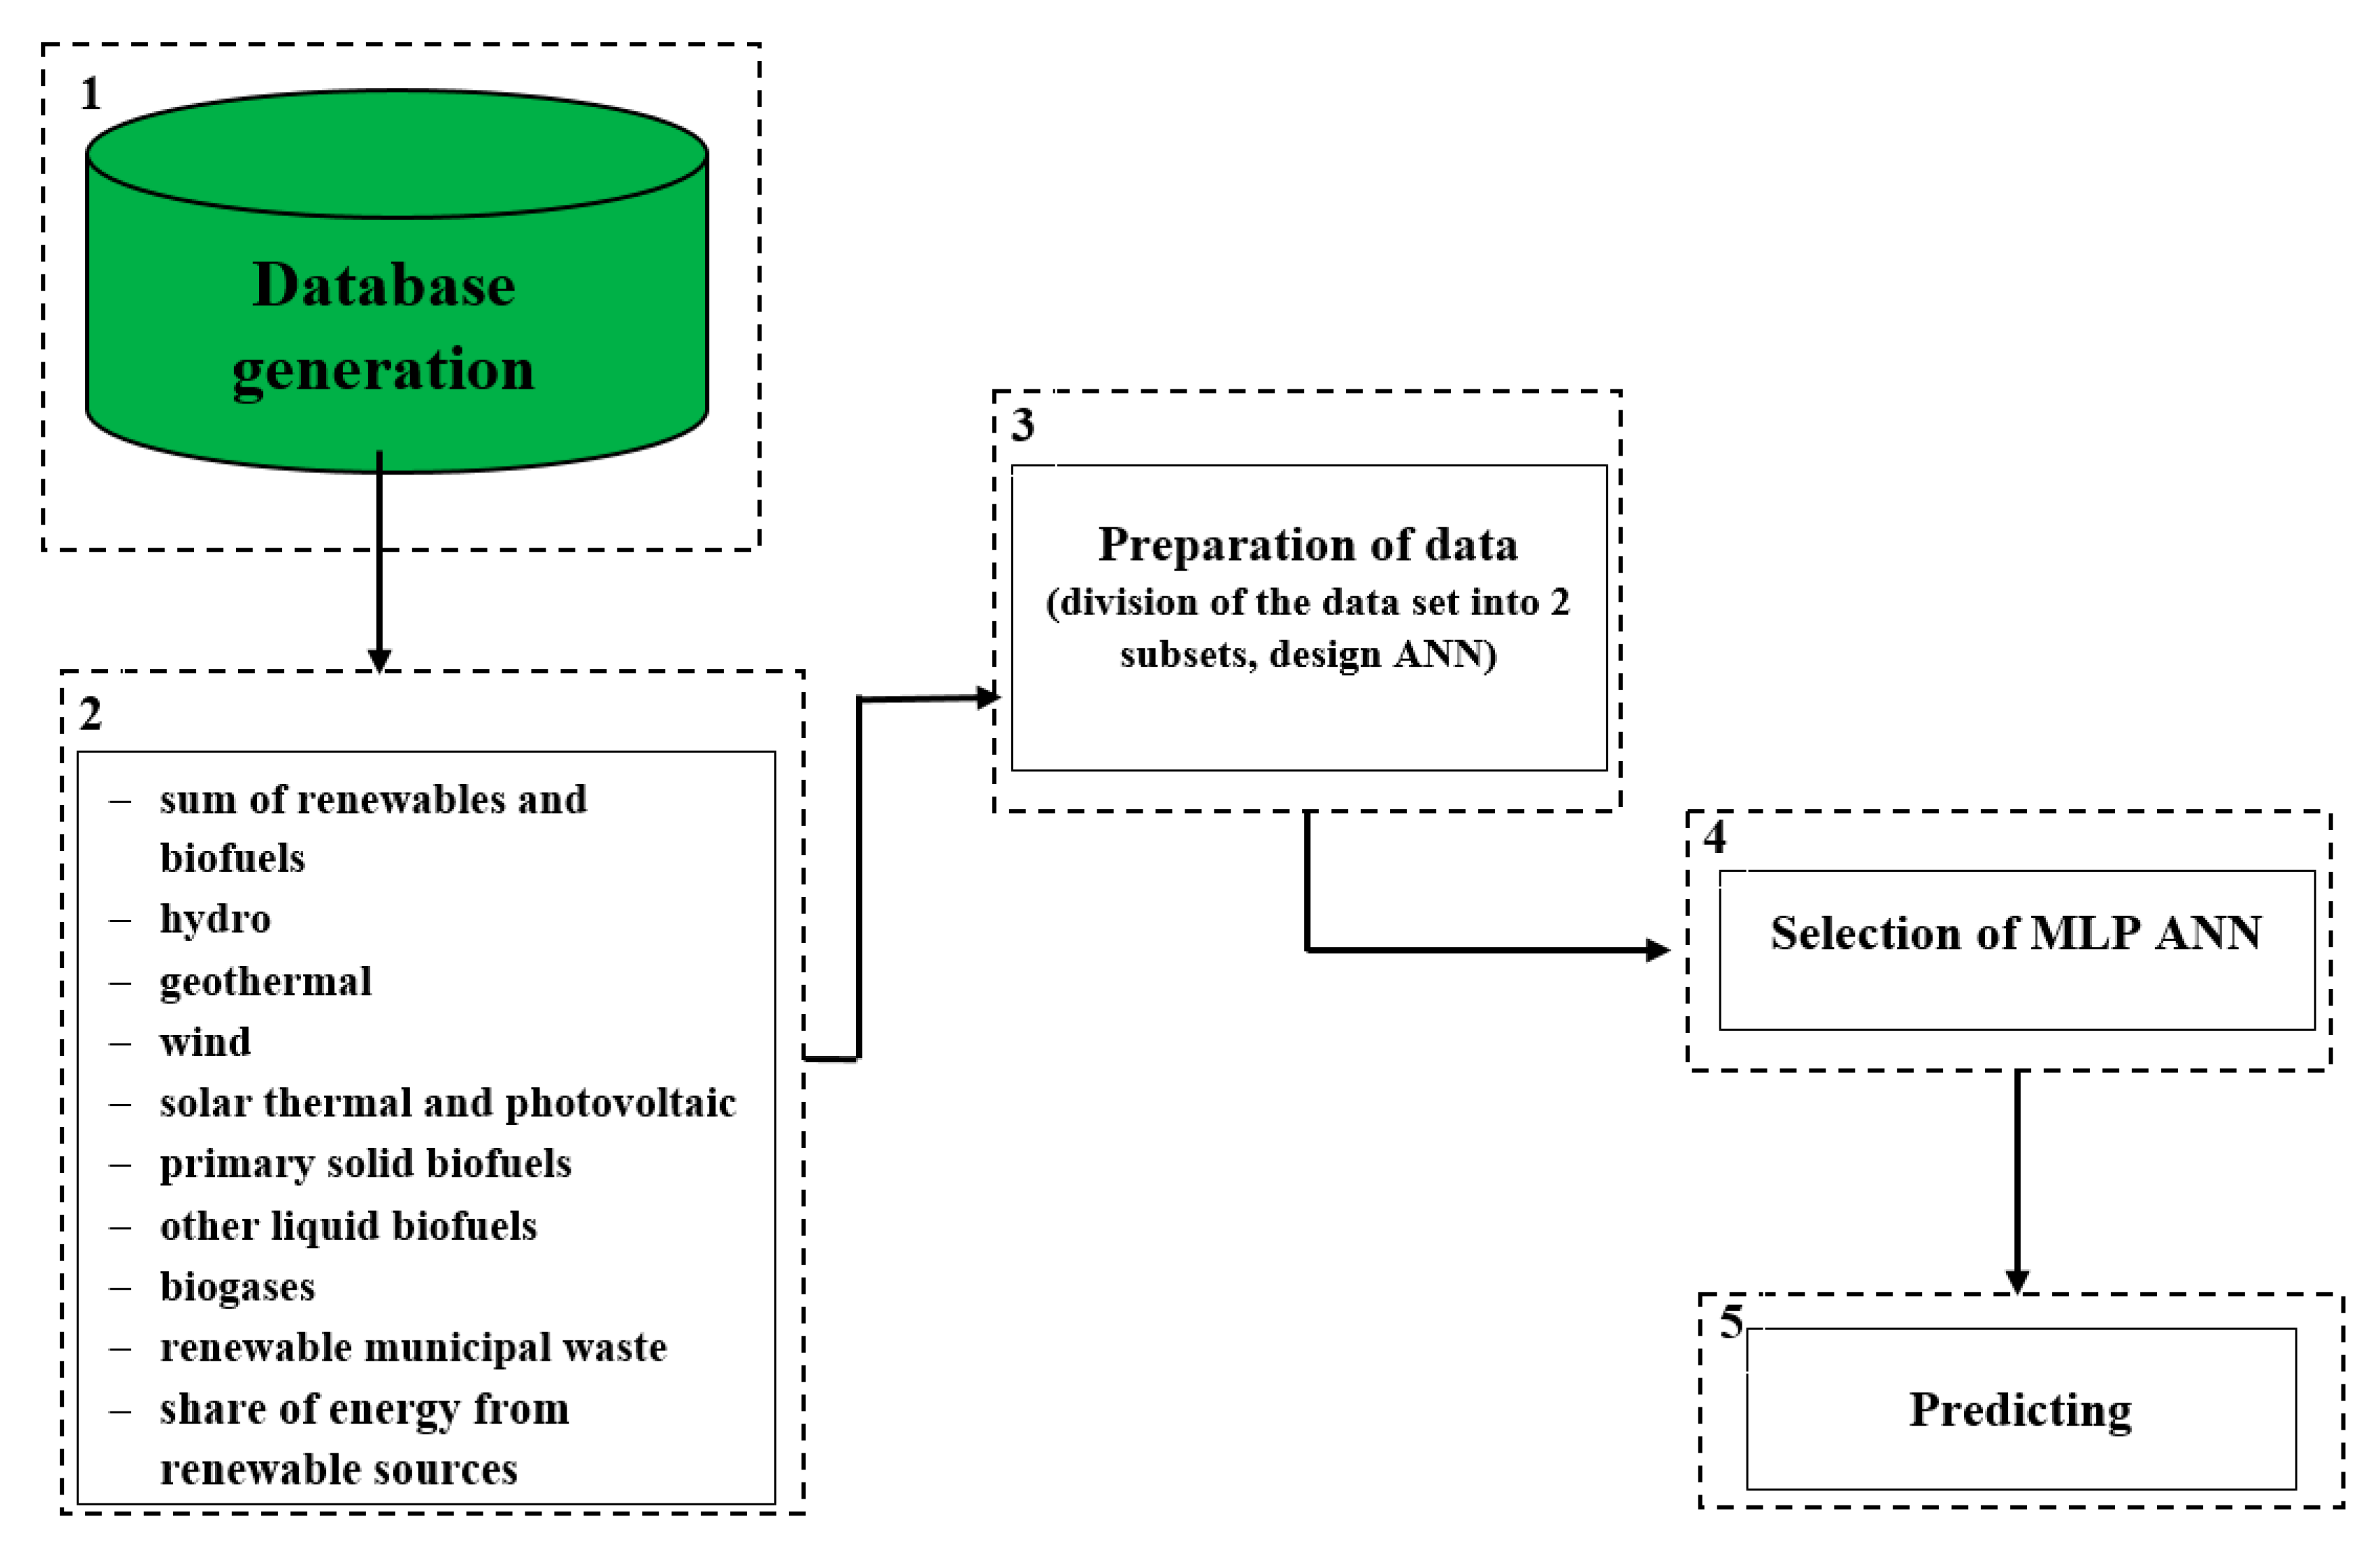
In order to prepare the forecast of energy production from RES in Poland (until 2025), the method of artificial neural networks was utilized. It belongs to the group of intelligent methods and, according to the authors, its advantages allow it to provide the best results in this type of analysis. Artificial neural networks give the opportunity to build models that can map the complex relationships between input and output data for selected phenomena, the structure and causal relationships, which have not been sufficiently known to build effective mathematical models.
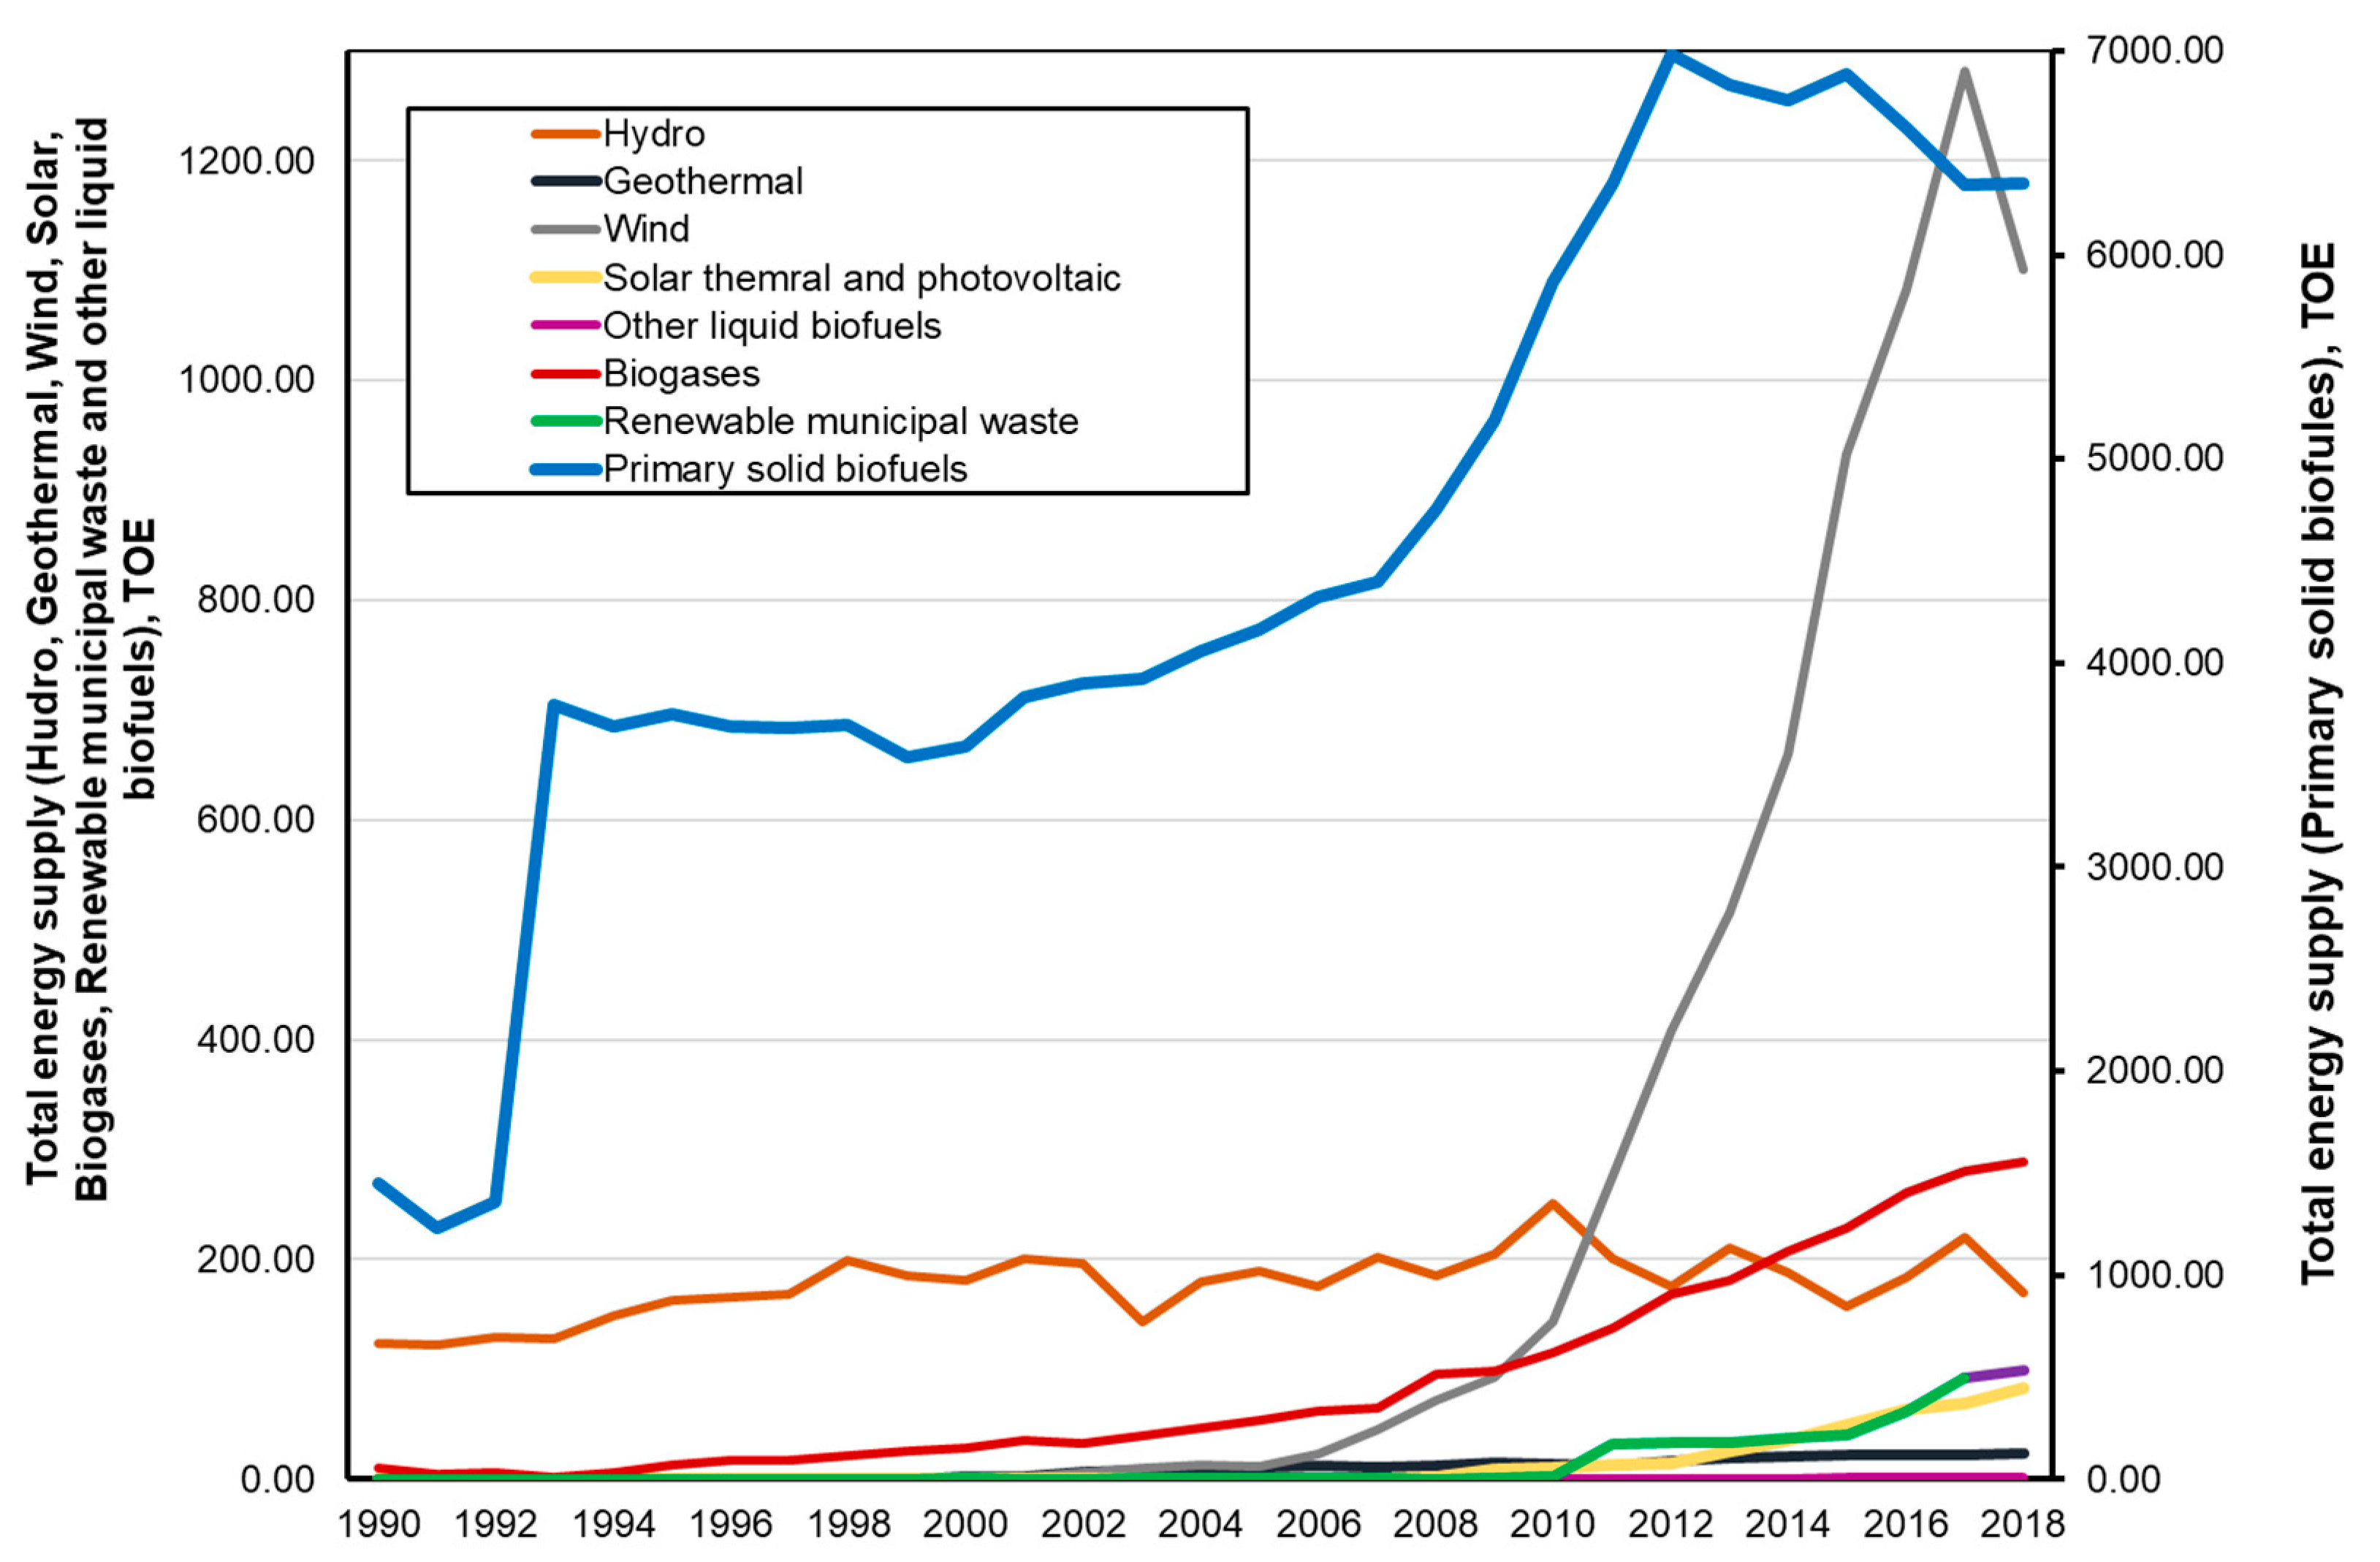
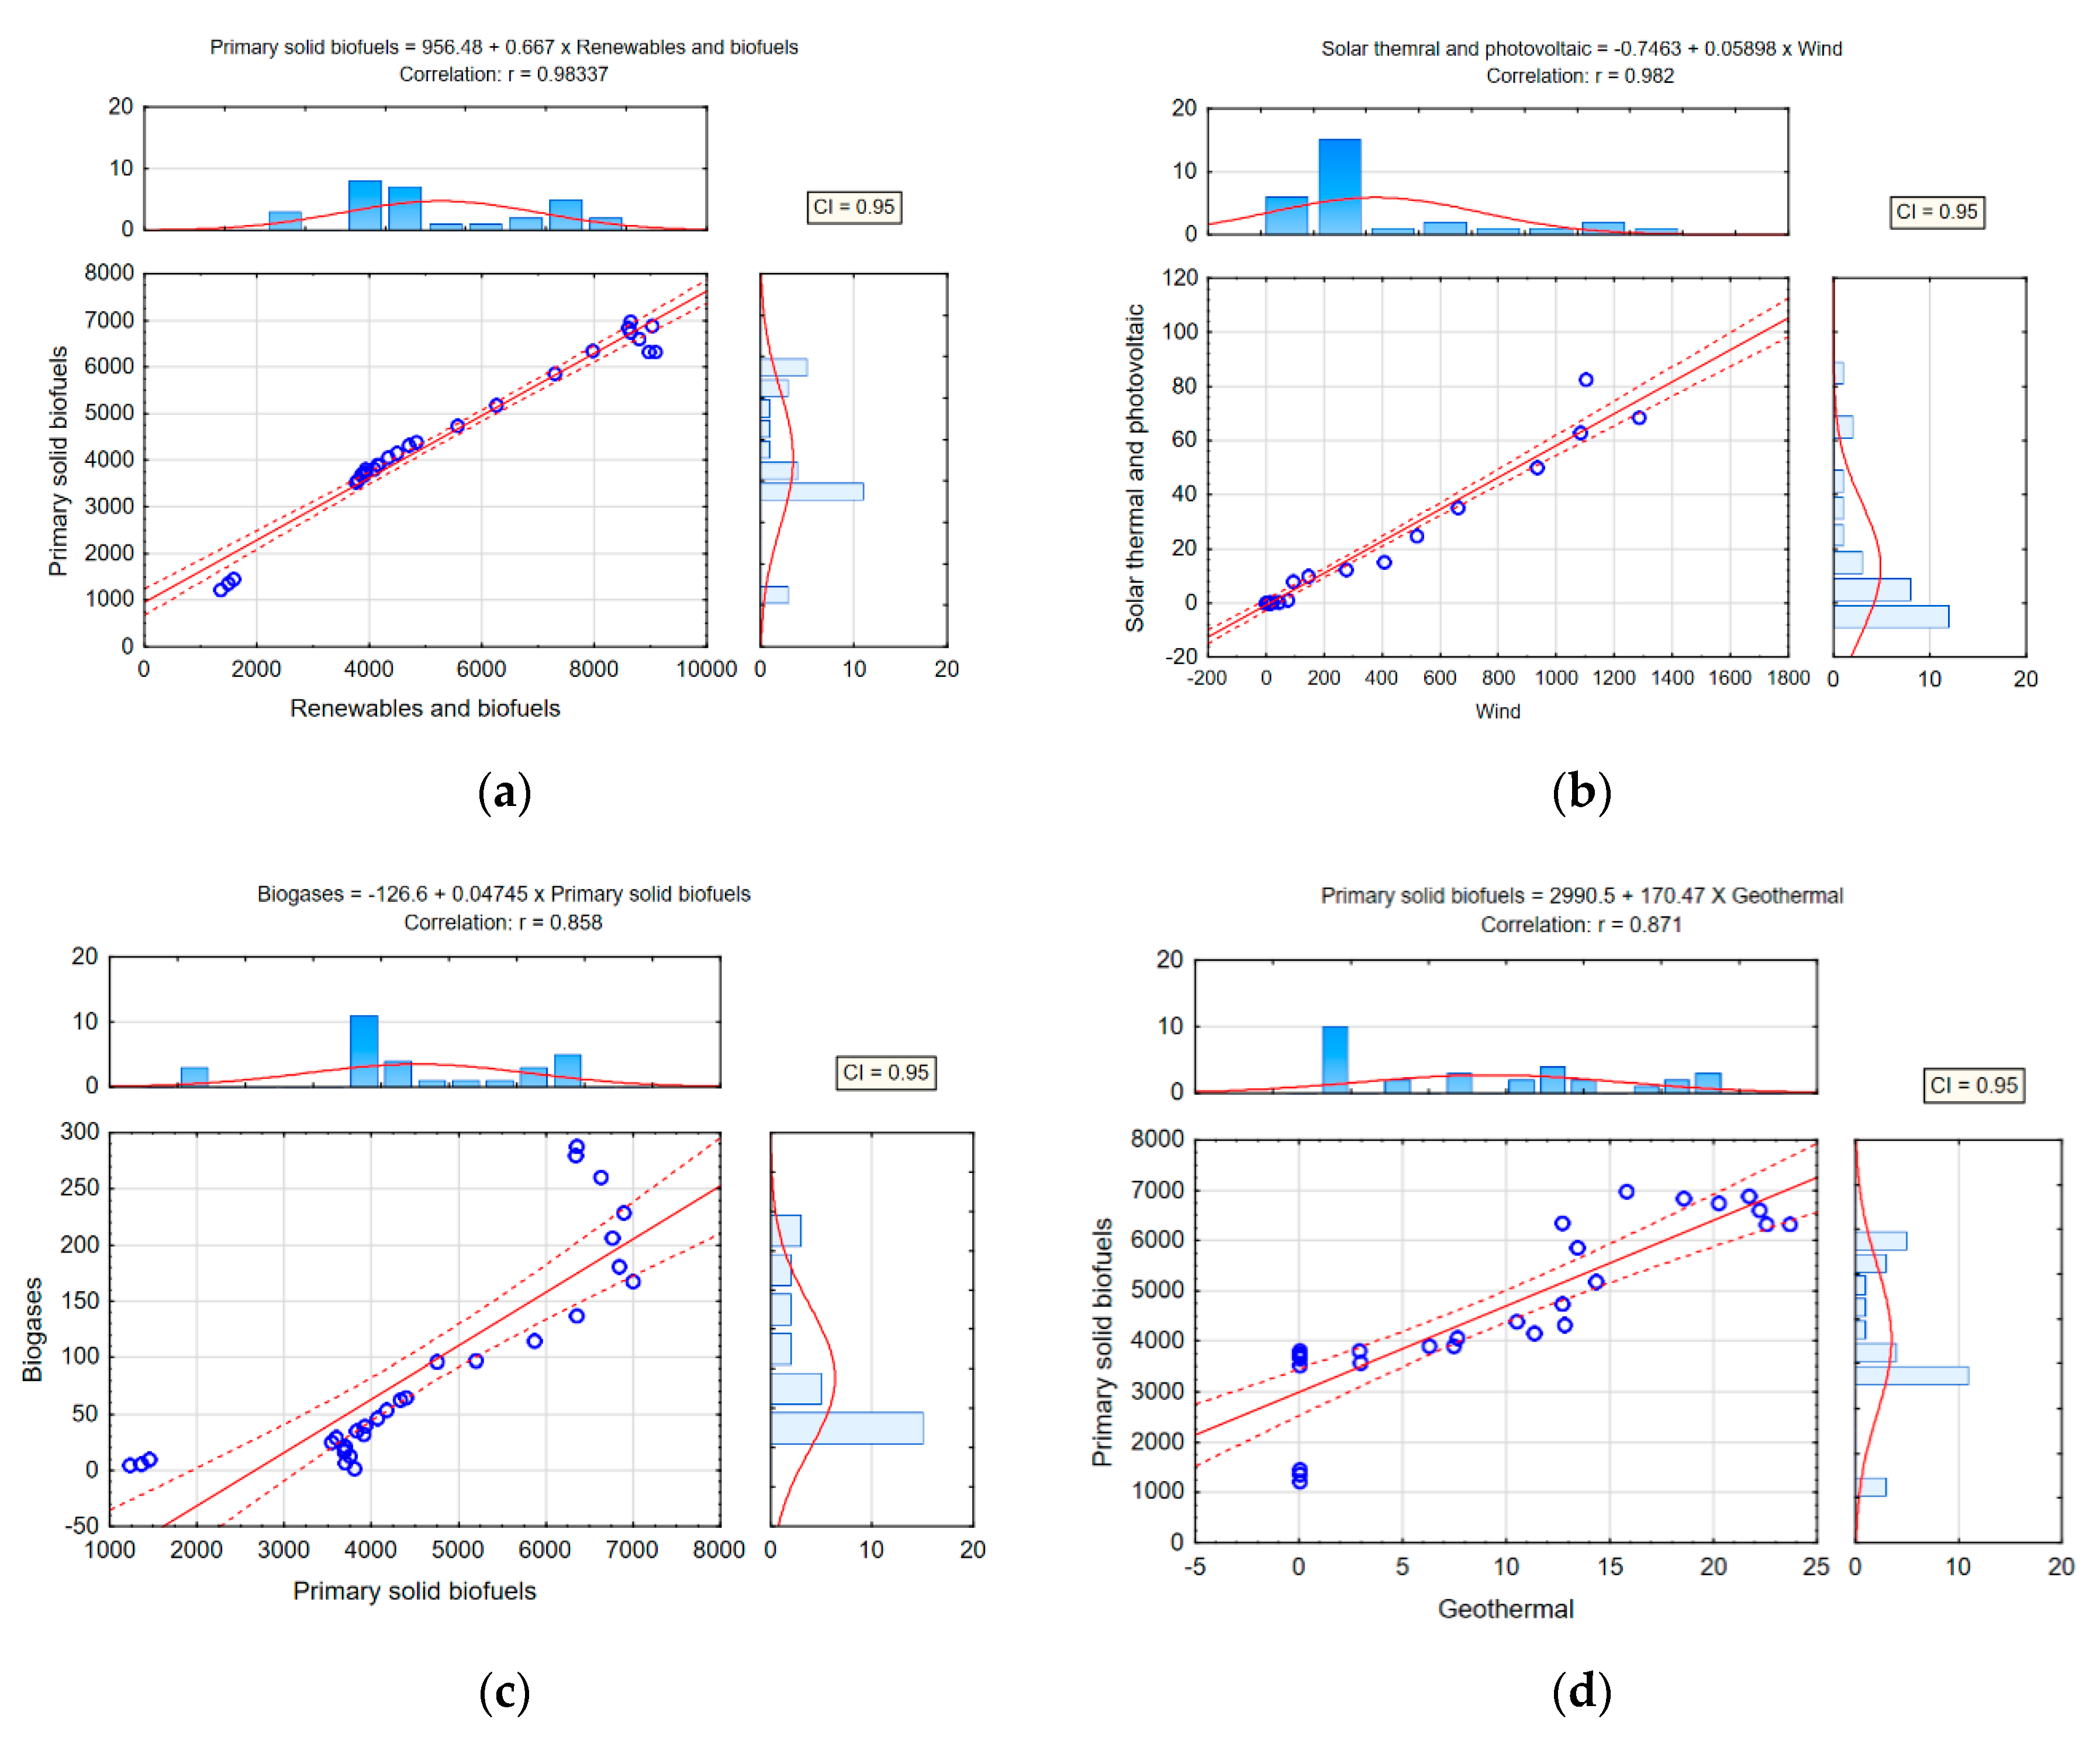
This study characterizes the examined area and discusses the developed research methodology. The forecast takes into account the total production of energy from RES and from selected sources (Hydro, Geothermal, Wind, Solar thermal and photovoltaic, Primary solid biofuels, Other liquid biofuels, Biogases, and Renewable municipal waste). Correlations between energy production from these sources were also shown. In addition, an analysis was also performed, based on which the forecast of the share of renewable energy in total energy consumption by 2025 in Poland was made. For all the presented calculations, error and statistical analyses were conducted, the results of which are presented in this paper.

2. Materials and Methods

2.1. Area of Research

Poland is a country located in Central Europe between the Baltic Sea in the north and the Sudetes and the Carpathian Mountains in the south (Figure 4). From the north, Poland borders with Russia through its Kaliningrad region and Lithuania; from the east with Belarus and Ukraine; from the south with Slovakia and the Czech Republic; from the west with Germany. Most of the northern border of Poland defines the coast of the Baltic Sea. Poland’s borders with Ukraine, Belarus and Russia also constitute the external border of the EU and the Schengen area.
As regards the structure of energy production, in 2009, the Polish government adopted the Polish Energy Policy until 2030 [55], which contains the main development directions of the energy sector. In 2019, Poland’s draft energy policy until 2040 was adopted. With regard to renewable energy, it presents a plan for the development of RES, expected to reduce the emissivity of the energy sector based mainly on conventional energy sources and the change in the structure of energy production [56].
The Polish energy strategy until 2040 assumes that the use of RES will be significantly affected by technological progress associated with already known methods of generating this energy (e.g., an increase in the use of wind by wind farms or solar radiation by photovoltaic panels), as well as with the development of new production technologies and energy storage.
In order to accomplish the assumed goals, an increase in energy production from RES and its wide use in all sectors of the economy will be inevitable.
This document presents the forecast of renewable energy consumption between 2020–2040. It assumes reaching a level of about 21%–23% share of energy from RES in final energy consumption in 2030 (in power engineering—possible increase in the share to 32%, in heating and cooling—1.1% point y/y increase in the share, in transport—14%), while in 2040, this share is expected to be 28.5%. The assumptions of Poland’s energy policy regarding the use of RES until 2040 are shown in Figure 5.
One of the aims of the presented study was to check whether, at the current pace of development of the renewable energy sector, the assumptions presented in Figure 5 are being implemented and to what extent.

2.2. Materials

For the analysis of the current state and prediction of renewable energy production in the perspective until 2025, data from the European Statistical Office [26] and the Data World Bank databases was used [57].
Information on the volume of renewable energy production between 1990–2018 is summarized in Table 1. This data includes energy production from the following RES: total renewables and biofuels, hydro, geothermal, wind, solar thermal and photovoltaic, primary solid biofuels, other liquid biofuels, biogases, and renewable municipal waste.
The variables presented in Table 1 were initially statistically analyzed and their basic statistical parameters were determined (mean, maximum, minimum, standard deviations and coefficient of variation), which is summarized in Table 2.
The analysis of basic statistics on variables that determine the volume of production from RES showed that they are significantly differentiated, which means that they meet the condition of diagnostic features. The values of the coefficient of variation for studied variables are characterized by a considerable range. The highest value of the coefficient of variation was found for the variable other liquid biofuels (202.26%), and the lowest for the variable hydro (16.96%). Skewness for most of the studied variables (except hydro and primary solid biofuels) was shown to have a positively skewed (right-skewed) distribution.
The statistical analysis of the data presented in Table 1 also involved the determination of the Pearson correlation coefficient between studied variables and the correlation matrix between these coefficients. The results are summarized in Table 3.
The analysis of correlation between variables was carried out for the level of statistical significance of p < 0.05. The analysis of the results showed that the studied variables are marked by different values of this coefficient, and all correlations are positive. The smallest correlation was reported to occur between hydro and other liquid biofuels and amounted to 0.19. In most cases, correlation coefficients were found to have achieved high values.
Graphic relationships with the determined parameters of the statistical analysis between selected variables are presented in Figure 6.
The results constituted the input material for the basic analysis aimed at determining the predicted values of energy production from RES in Poland until 2025 and the values of the share of energy from RES in gross final energy consumption.

2.3. Methods

Artificial neural networks (ANN) intensively developed for several decades are a universal approximation system that allows mapping multidimensional data sets. They have the ability to both learn and adapt to changing environmental conditions and to generalize acquired knowledge, being in this respect an artificial intelligence system [58,59,60,61,62,63,64].
The neural network is a simplification of the structure of the human brain and is used in many disciplines of science. The main advantage of these networks is the possibility of obtaining solutions to complex problems that are difficult to solve by other conventional methods. They are frequently used as a forecasting tool, also for short-term forecasts [65,66,67]. The main elements of artificial neural networks are three layers: input, hidden and output (Figure 7).
One of the most commonly used neural network model for forecasting is the Multi-layer perceptron (MLP) network, which consists of three layers: the first—Input layer, the last—Output layer and the middle—Hidden layer.
With regard to the neural network operation (Figure 8), signals carrying input data appear at its entry. From the input layer, xi signals are sent to all hidden neurons of the Y layer. Each hidden neuron has a specific number of entries, and each entry has a weight w i X associated with it. Inside the hidden layer neurons, based on information from the input layer neurons xi and weights wij, the aggregated input value is calculated, which is the sum of the weighted inputs Σ xi w i X . In turn, the neuron activation functions allow for the determination of the output values of hidden layer neurons yi and the output values of the output layer neurons z. These values are then added together, resulting in the signal si [68]:
s i = j = 1 n w i x · x i
The activation function can be either a linear or non-linear function. The most commonly used activation functions are [69]:
Logistic function:
ϕ ( x ) = 1 1 e 1
Hyperbolic tangent function:
ϕ ( x ) = e x e x e x + e x
Exponential function:
ϕ ( x ) = e x
Linear function:
ϕ ( x ) = x
For the studied process of forecasting energy production from RES using artificial neural networks, the research procedure consisted of the following stages (Figure 9):
  • Database generation.
  • Division of the data set into the training and test sets and determination of the minimum number of neurons in the input and hidden layers.
  • Selection of the best network (criterion of correlation coefficient between actual and predicted values).
  • Prediction.

2.4. Error Estimation Methods

For the obtained forecasts of the total renewable energy production, and based on the sources included in the analysis, the mean error, mean percentage error, mean absolute error and the mean absolute percentage error were determined. These errors were determined from the following relationships [70,71]:
Mean error (ME):
M E = 1 n i = 1 n ( X A , i X P , i )
Mean percentage error (MPE):
M P E = 1 n i = 1 n ( X A , i X P , i X A , i ) × 100 %
Mean absolute error (MAE):
M A E = 1 n i = 1 n | X A , i X P , i |
Mean absolute percentage error (MAPE):
M A P E = 1 n i = 1 n | X A , i X P , i X A , i | × 100 %
where XA,i and XP,i represent the observed and predicted values.

3. Results

The data set presented in Table 1, characterizing the amount of renewable energy production from various sources, was divided into two subsets (by the limited size of the data set): training data set (80% of cases) and test data set (20% of cases).
In order to forecast energy production from RES by 2025, a specific network structure was adopted, and it consists of an input layer, a hidden layer and an output layer.
Table 4 summarizes the structures of neural networks that obtained the highest values of correlation coefficients between the actual and predicted quantities in the training tests. As can be seen, for each of the predicted variables, the best values of these coefficients were obtained by networks of different structure.
The obtained correlation coefficient values for the training data set are at a satisfactory level, especially when taking into account the small amount of data adopted for prediction (29 values defining the predicted variables). Neural networks have a special property, which means that the more data on the predicted variable, the better the network quality, and the more accurate the forecasts.
As already mentioned, the data used for the forecast come from the Eurostat database, which applies to renewable energy production for the years 1990–2018. This data constitutes time series characterized most frequently by non-stationarity (for variables like renewables and biofuels, geothermal, wind, solar thermal and photovoltaic, primary solid biofuels, other liquid biofuels, biogases, and renewable municipal waste, etc.) (Figure 1). The time series, which is characterized by a very small degree of stationarity, applies to the variable hydro energy.
The structures of neural networks determined based on tests were used to perform basic calculations (Table 4).
Based on the analyses carried out, the predicted values of energy production from RES were determined in the perspective until 2025. The time horizon of the forecast covered the period from 2019 to 2020. The analysis involved the determination of predicted energy production values from individual studied RES and the percentage share of this energy in gross final energy consumption
Figure 10 presents the results of the forecast for the total amount of energy produced from RES together with the actual values (until 2025). In turn, Figure 11, Figure 12, Figure 13, Figure 14, Figure 15, Figure 16, Figure 17 and Figure 18 show the actual and predicted volume of renewable energy production from selected RES.
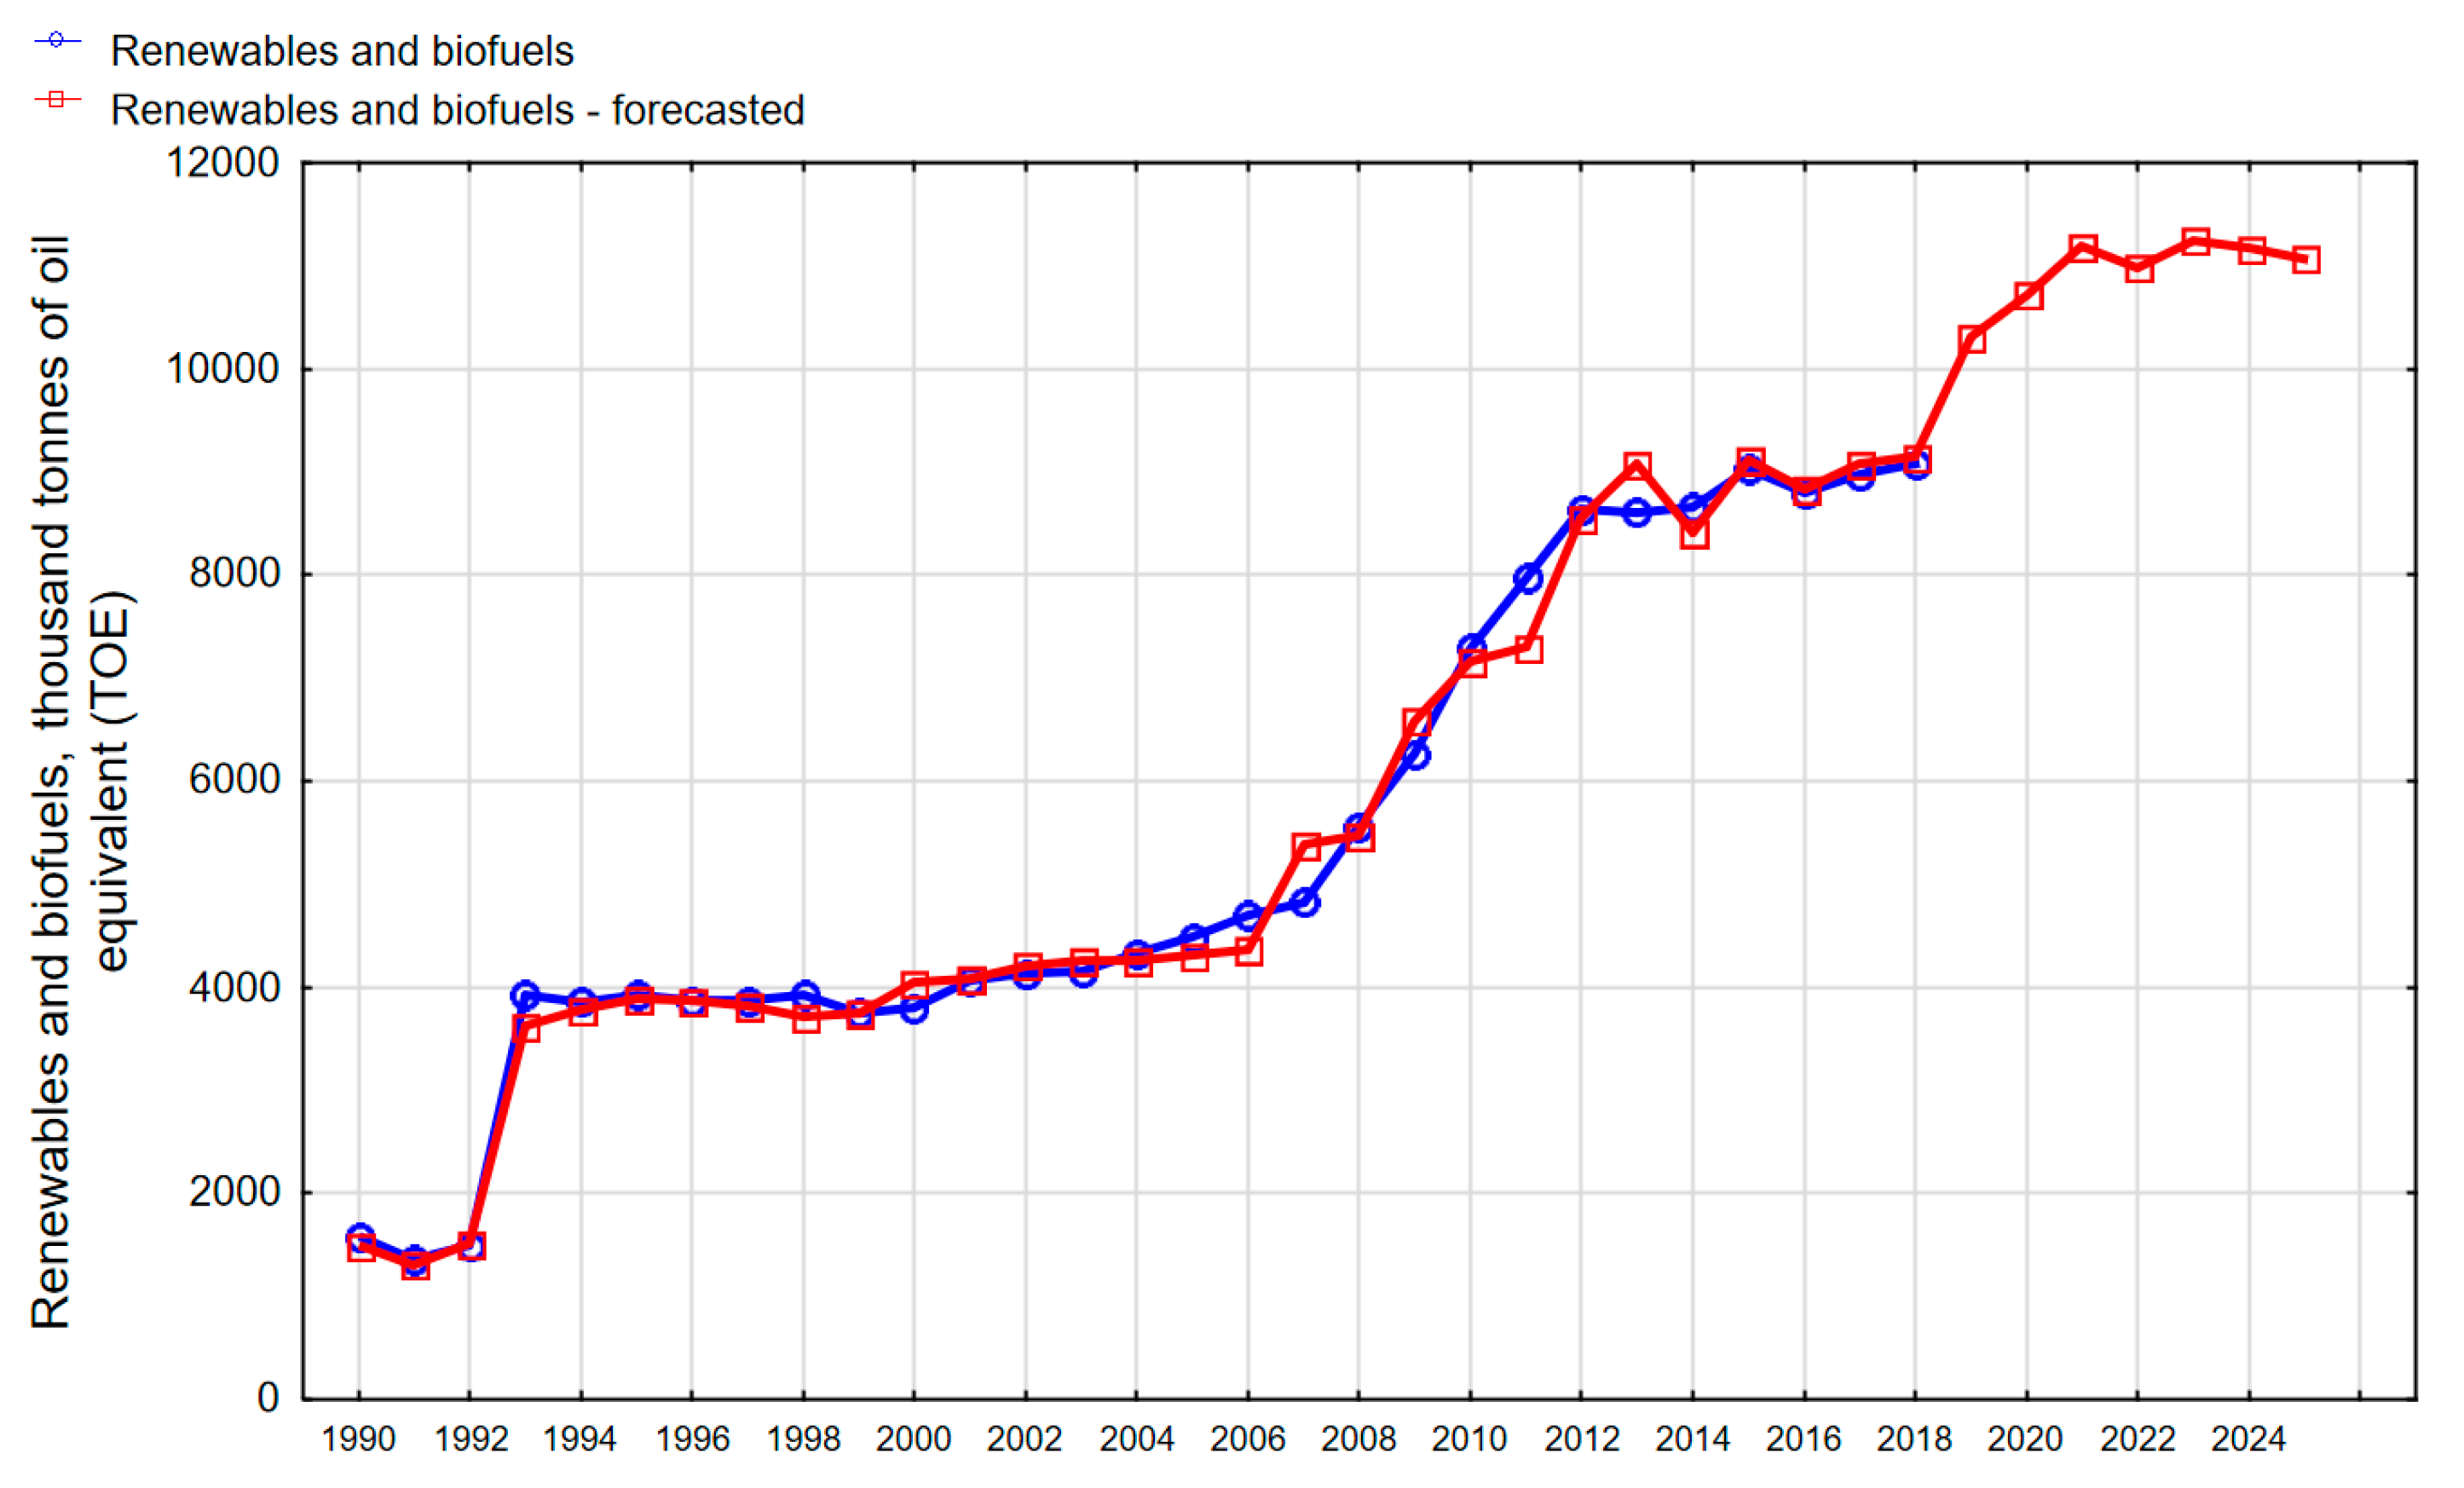
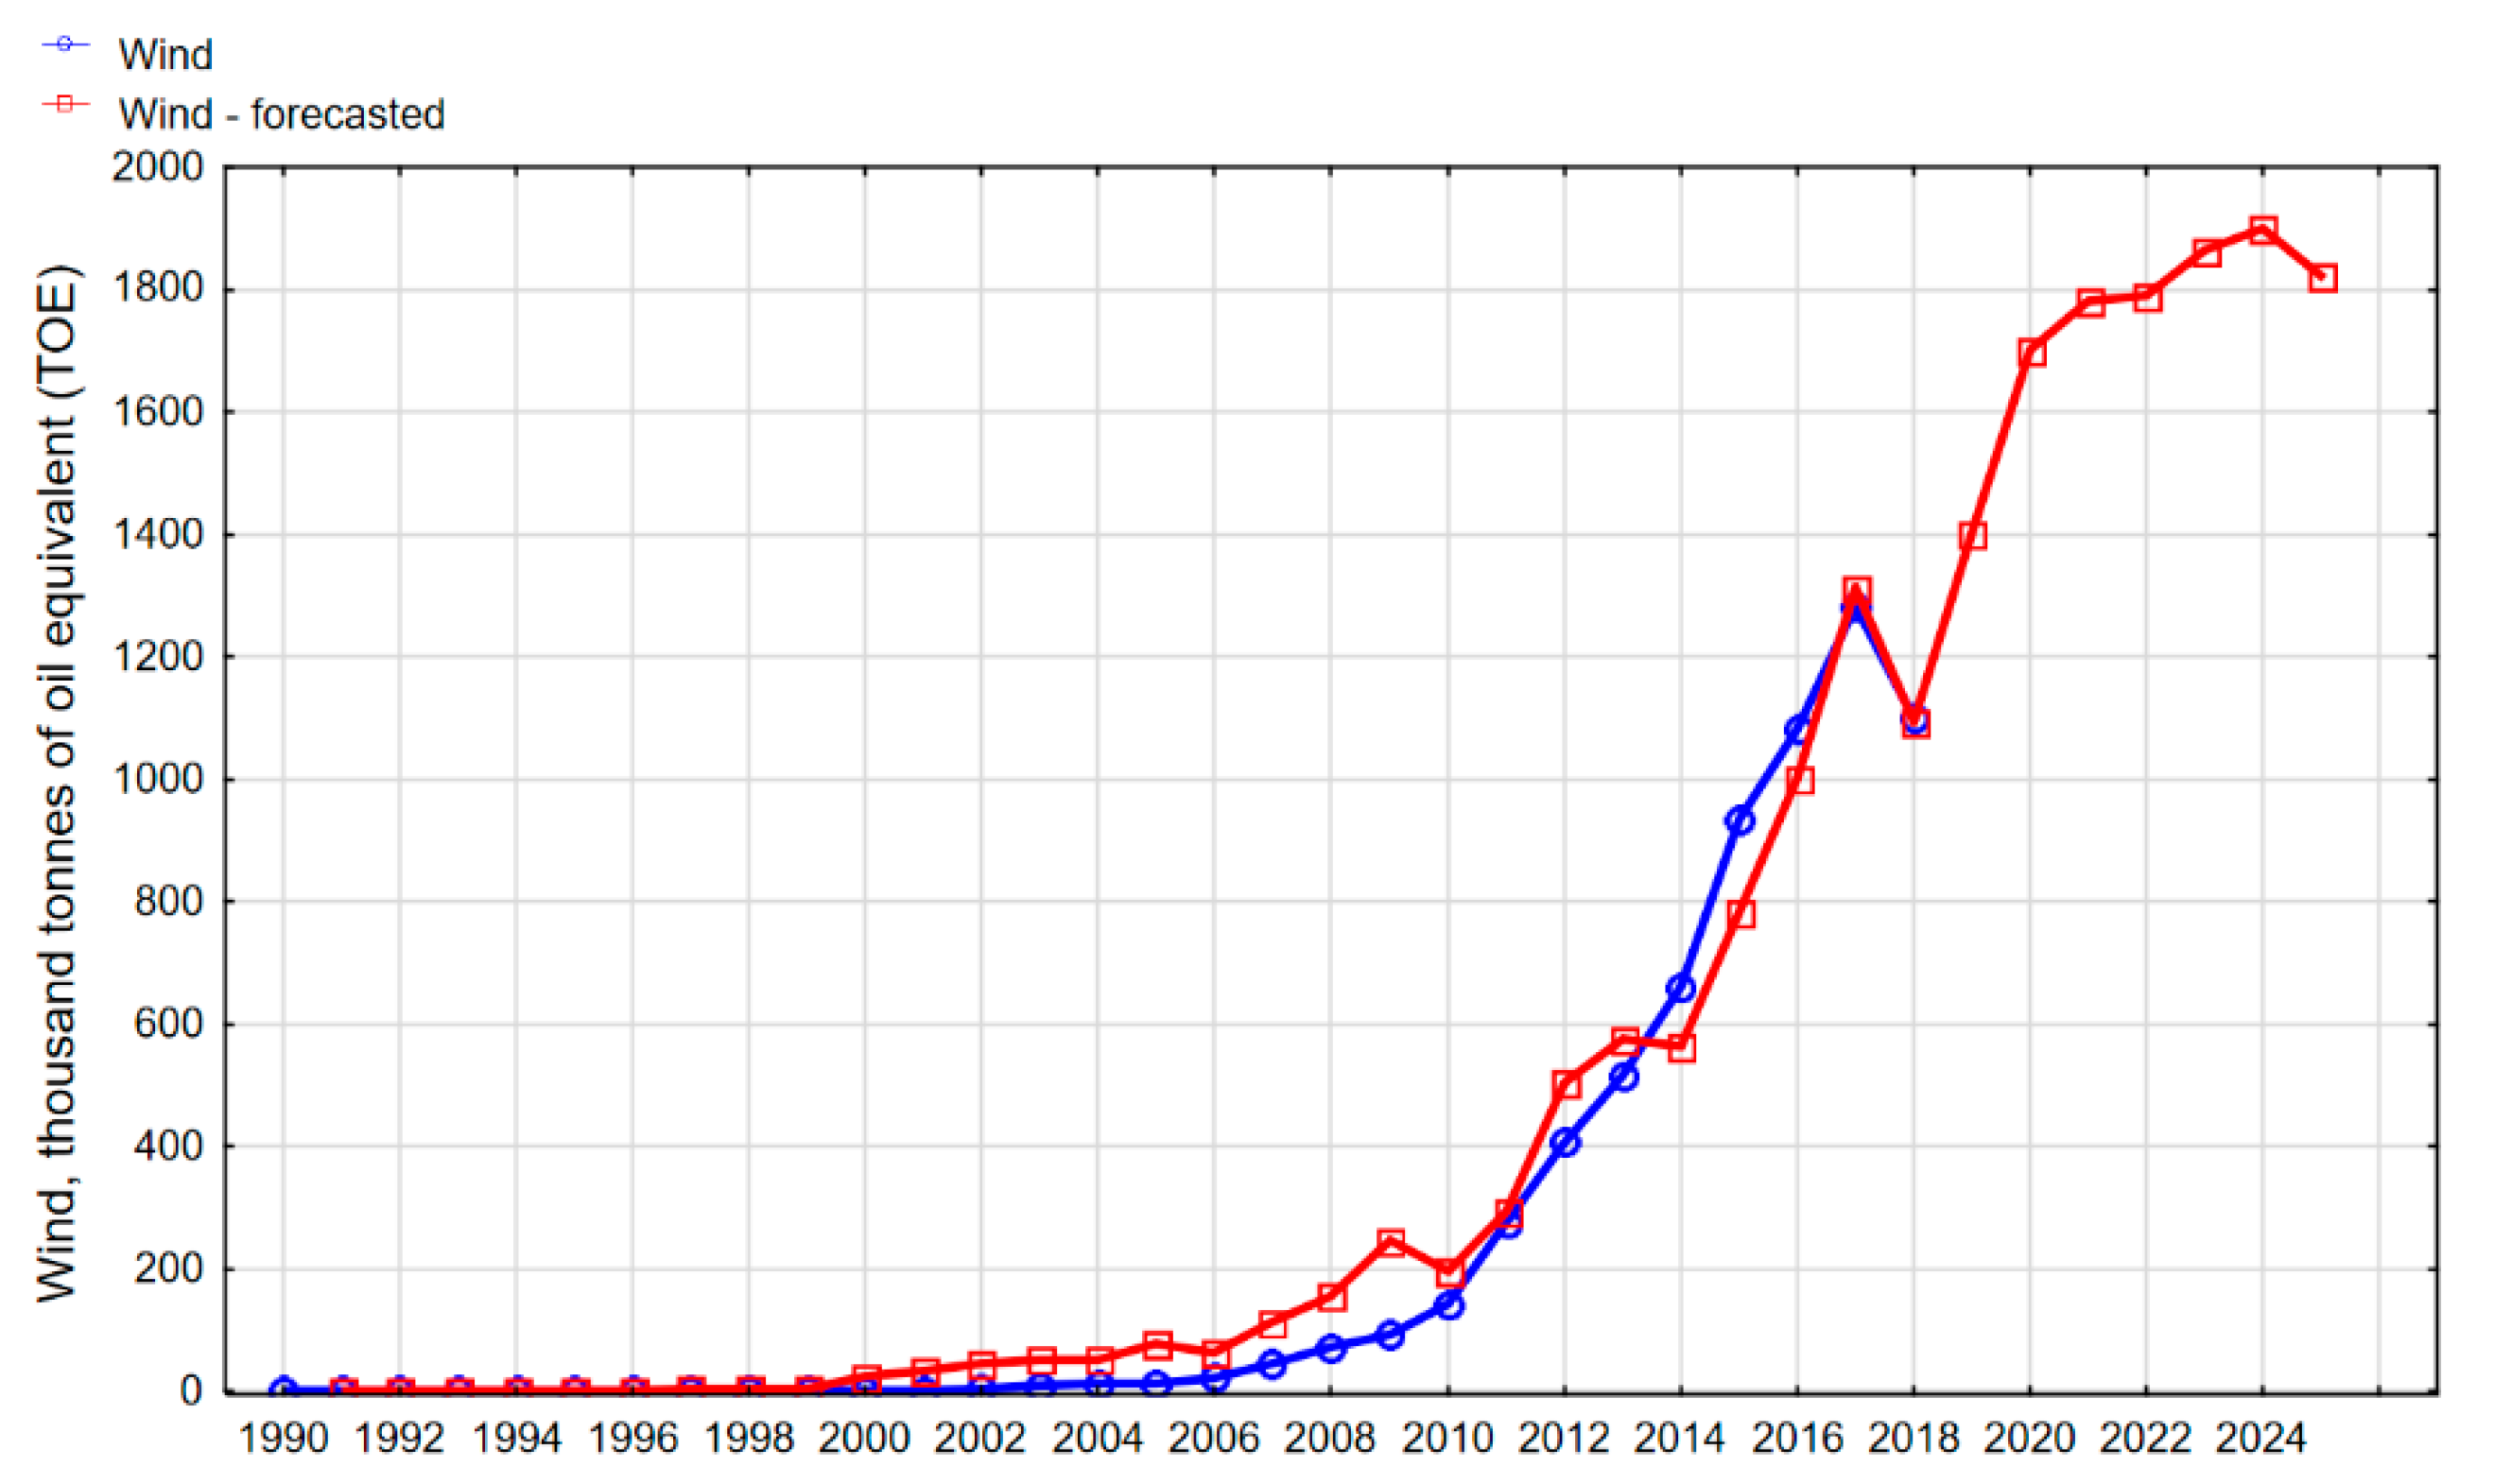
Based on the results, it can be concluded that the most accurate was the mapping of total actual production of renewable energy (Figure 10), wind energy (Figure 13), solar energy (Figure 14), primary solid biofuels energy (Figure 15), biogas energy (Figure 17), and renewable municipal waste energy (Figure 18). The least accurate mapping was achieved for hydro energy production (Figure 11). This is due to the fact that the actual time series fluctuated significantly and there was no clear trend, which, combined with a small amount of data, made it very difficult to provide this forecast. All this can be seen in the results.
The results in the training part indicate that the predicted values are slightly more often overestimated than underestimated in relation to the actual values. This is mainly due to the approximation system of neural network models.
In general, however, it can be stated that the adopted MLP network architecture for the predicted variables allowed for the forecast of renewable energy production from the studied sources with satisfactory accuracy.
Moreover, it can also be stated that in the coming years, an increase in renewable energy production should be expected, practically from all sources. The exception is the production of energy from water. This is due to the fact that Poland is a lowland country with decreasing rainfall. As a consequence, the hydropower potential is relatively low, which results in decreasing financial expenditure on the development of hydropower [72]. According to statistics, the utilization of hydroenergetic potential of power plants in Europe is on average around 47%, and in Poland only 12% [73]. It is also important that Poland’s existing hydropower potential is used to a much lesser extent than in the past [74]. Therefore, more decisive actions are needed to increase the use of this potential. One of the barriers limiting the development of hydropower in Poland is also the widespread belief in the harmful effects of river regulation on the natural environment [75]. All these problems make investing in hydropower very risky.
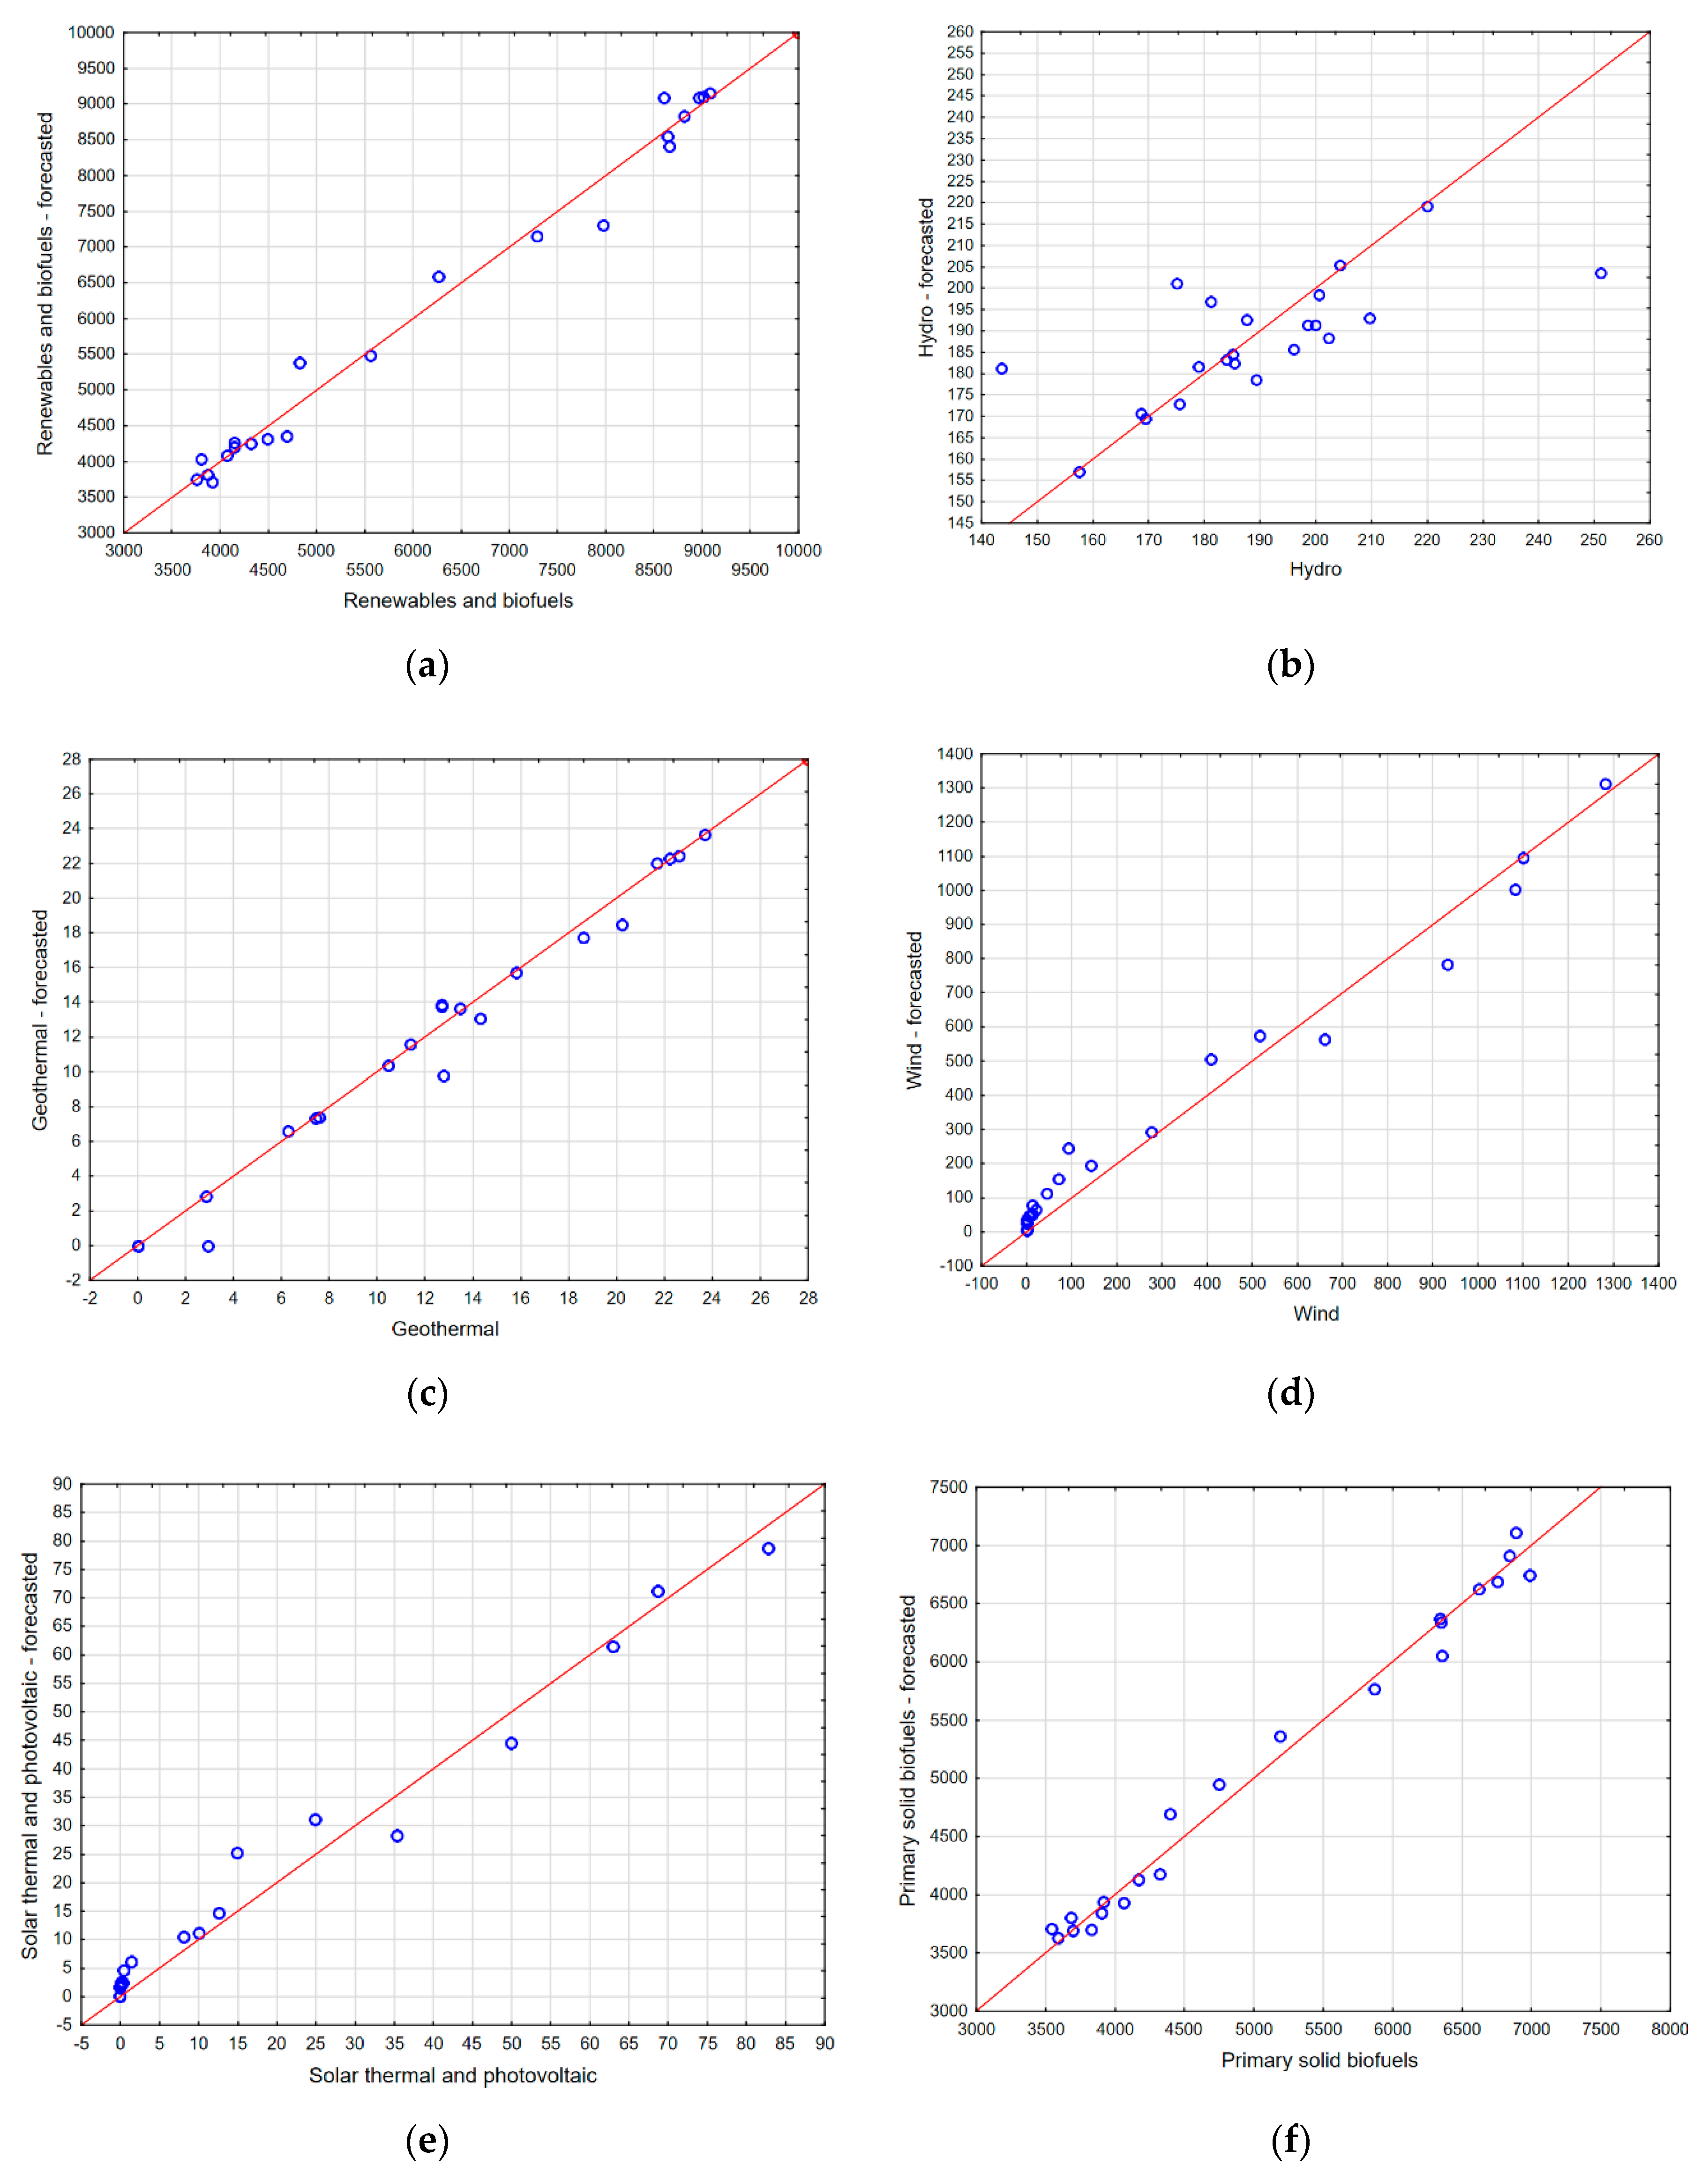
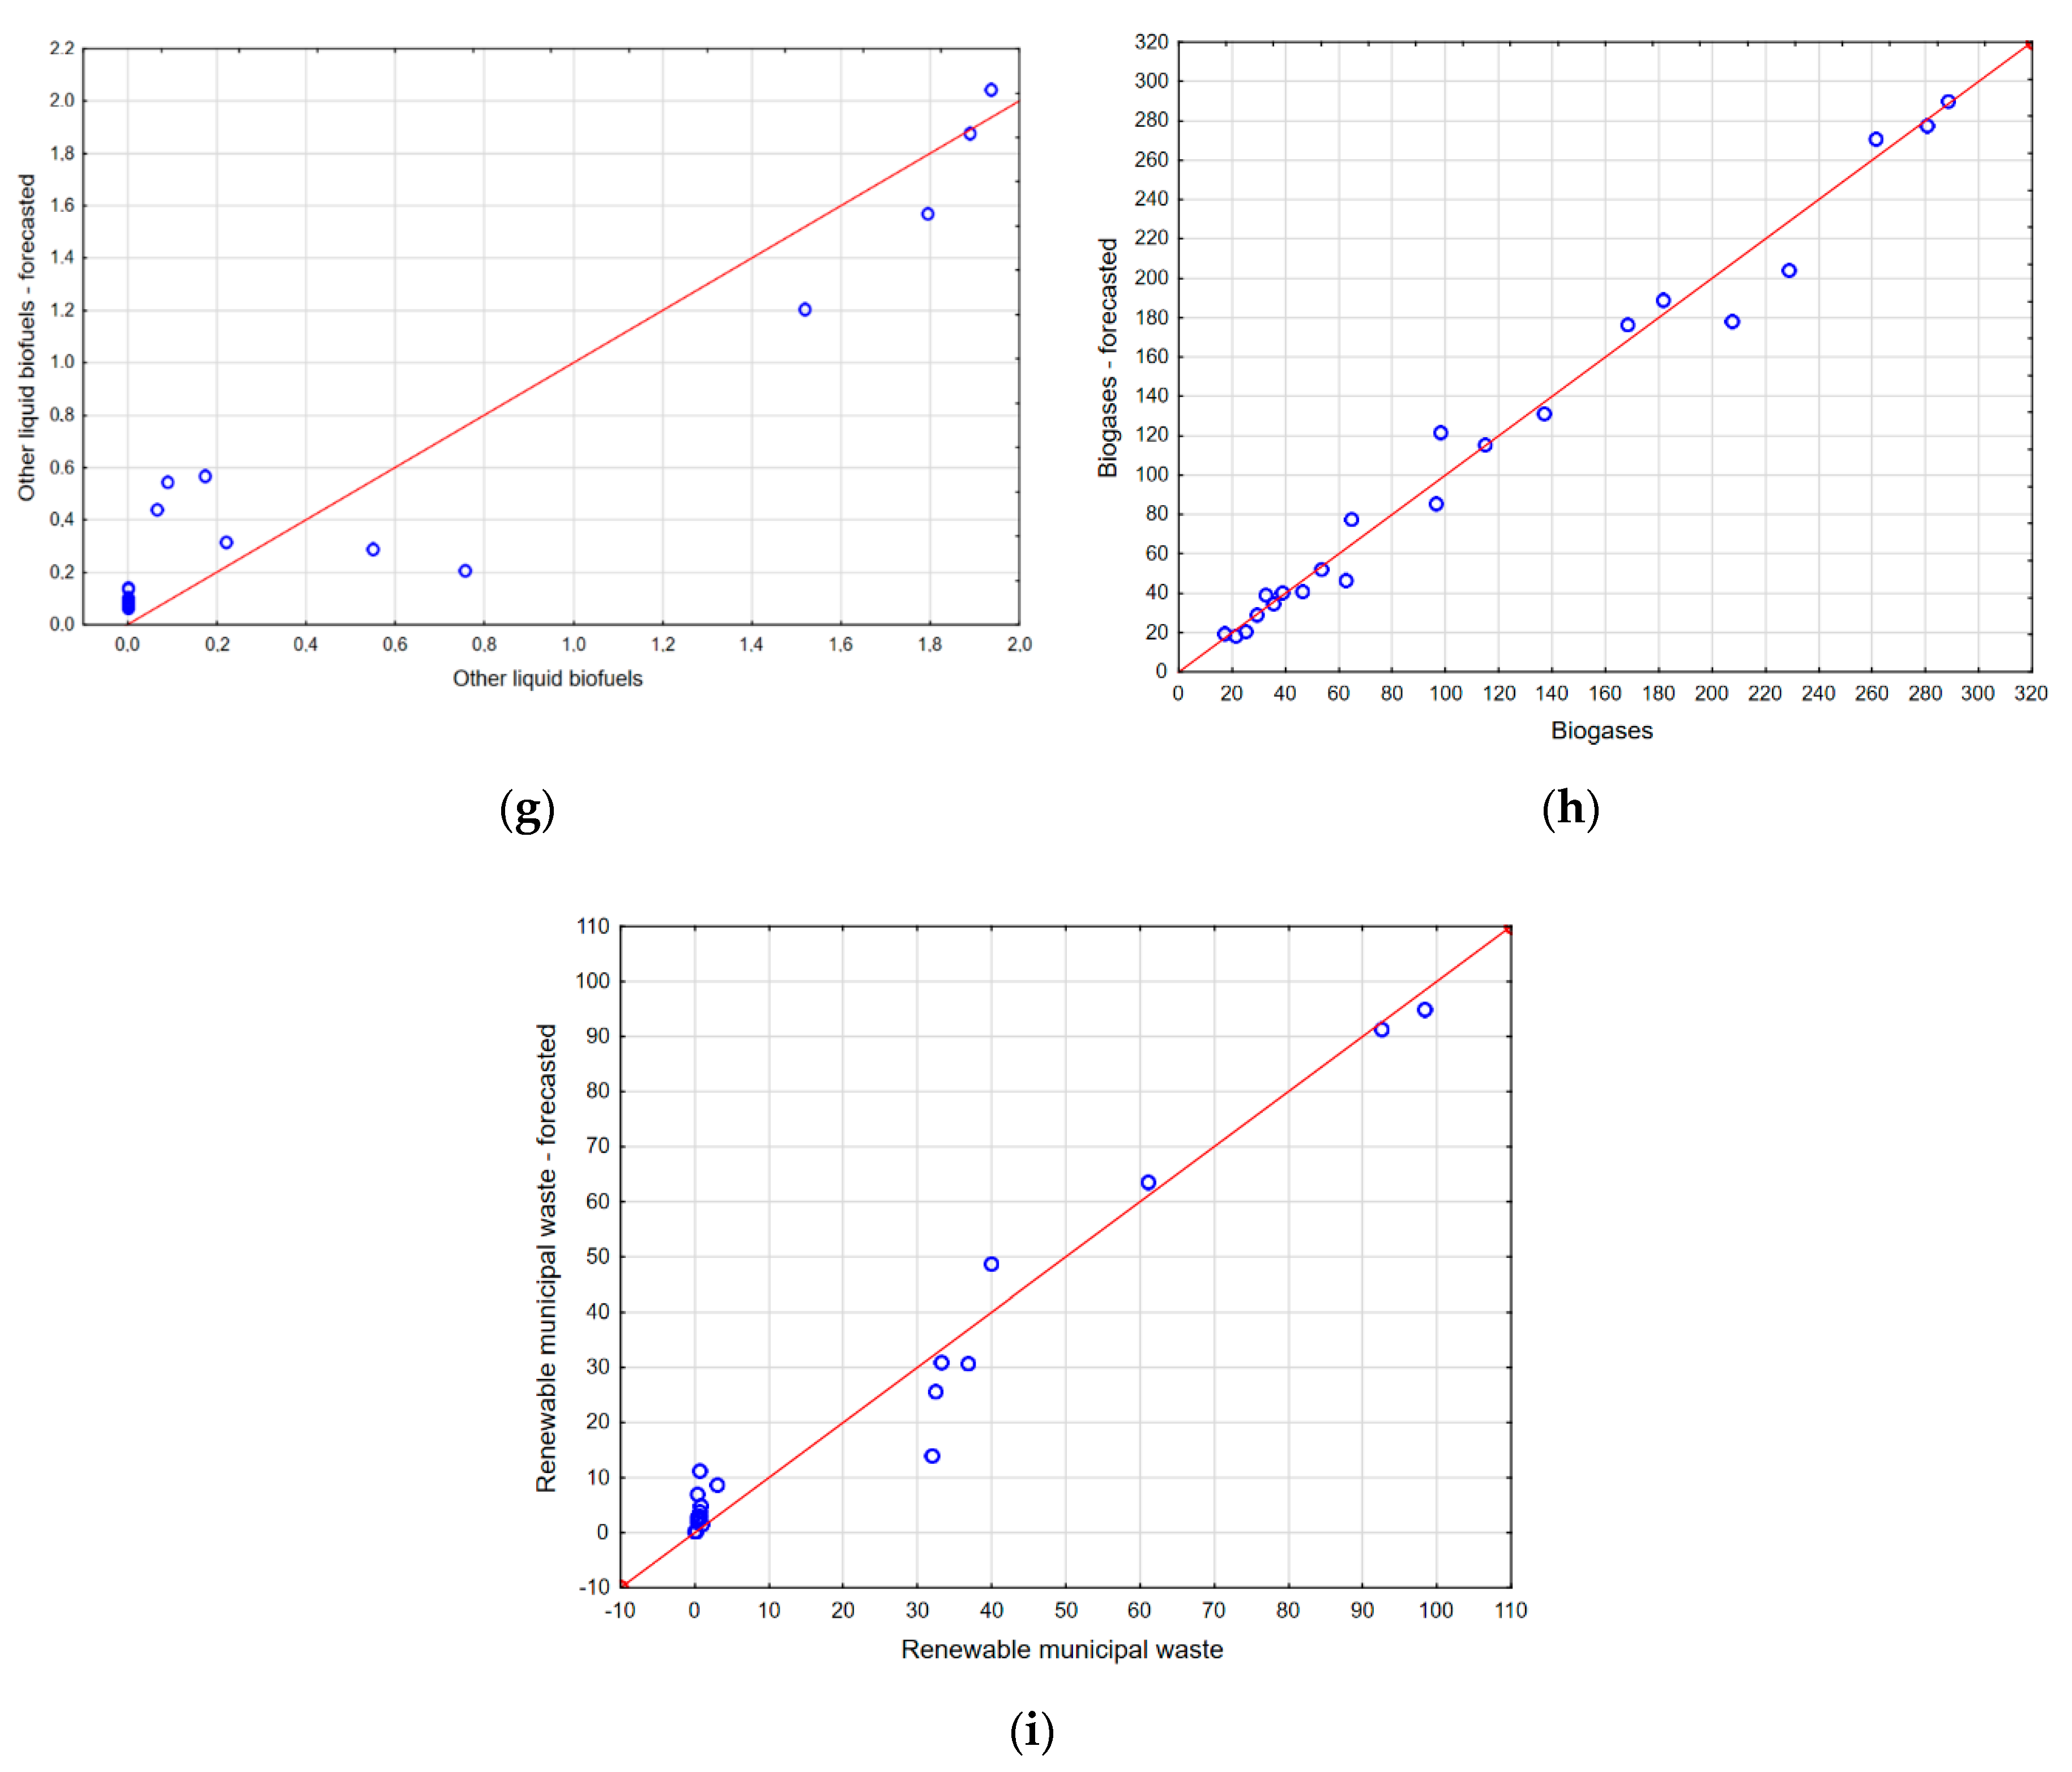
Based on the results, an analysis of the dispersion of the actual and predicted values of studied variables was also performed. The results are shown graphically in Figure 19.
When analyzing the distribution presented in Figure 19, it can be concluded that the largest dispersion is shown by the results of hydro energy production. For this forecast, the correlation coefficient between the actual and predicted data is the smallest (0.630 for the training sample and 0.621 for the test sample) (Table 4). Despite the attempts to use networks with different configurations (e.g., by increasing the maximum number of neurons in the hidden layer), no better correlation of the forecast with the actual values for this case was obtained.
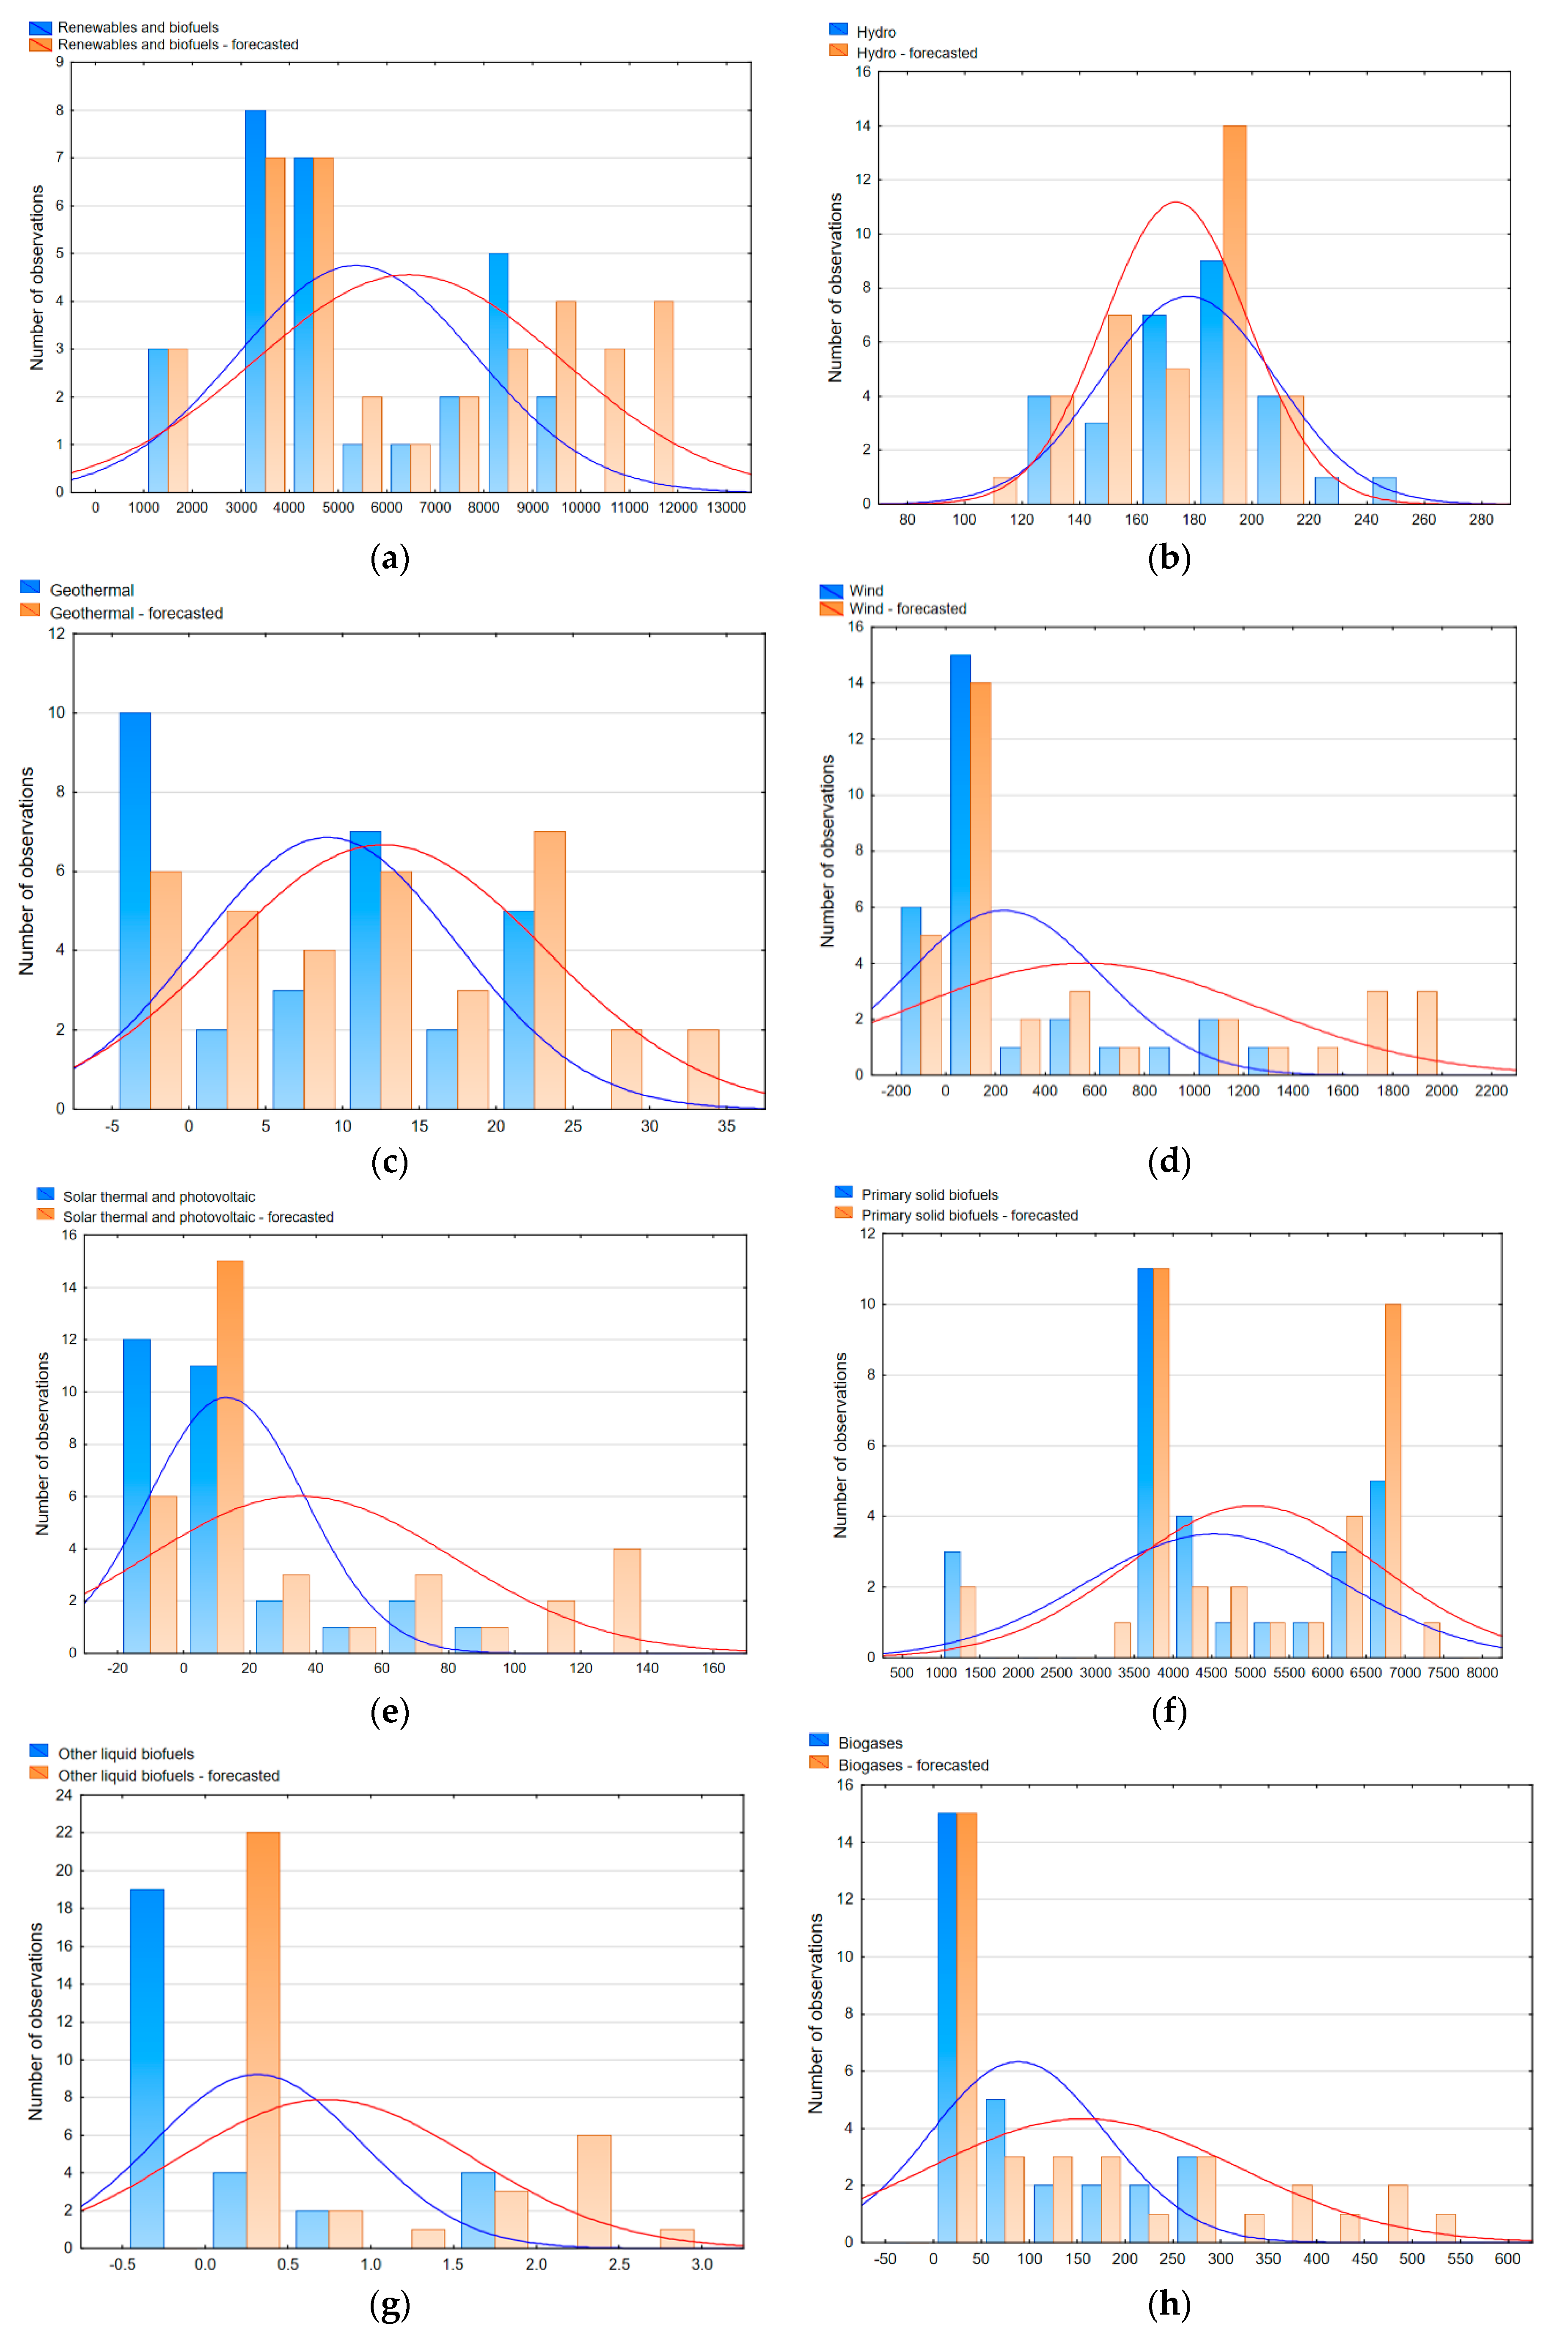
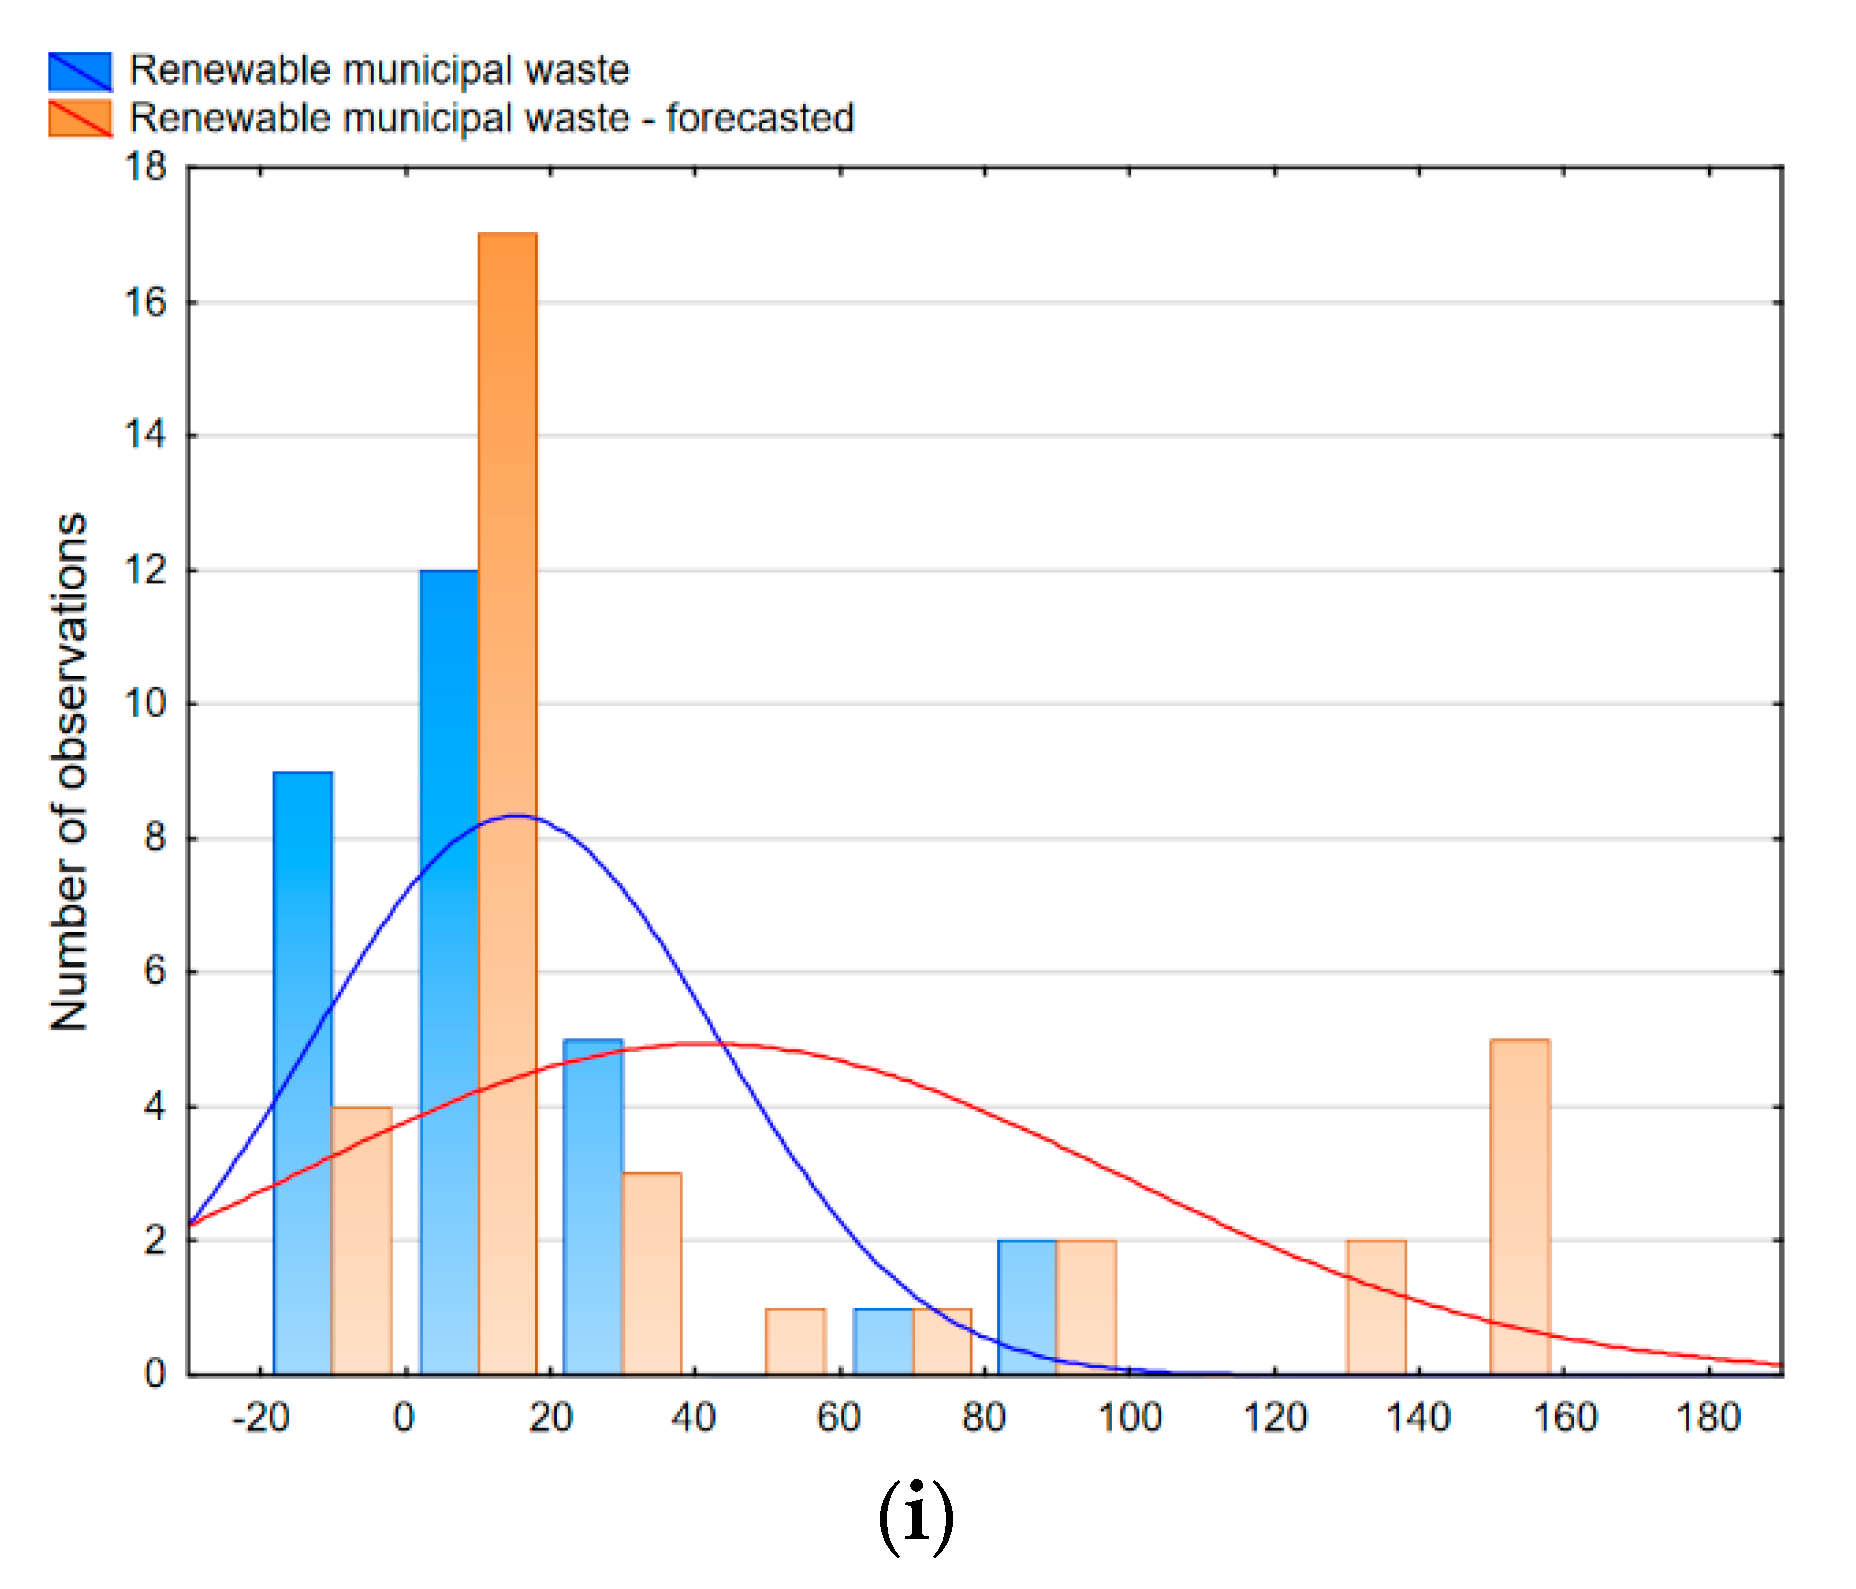
In order to better visualize the results, Figure 20 presents histograms of the actual and predicted values of studied variables along with the marked density functions.
Based on these histograms, the courses of both the actual and predicted values of studied parameters were found to be asymmetrical. Also, the determined density functions of the actual and predicted distributions show certain differences, which is confirmed by their recorded dispersion. It is also possible to determine the distribution of the values of studied parameters depending on the number of observations (number of studied years). Moreover, it can be seen that the inclusion of predicted values in these distributions only slightly widens the range of these values. The predicted values most often coincide with the values characterizing the volume of renewable energy production in the examined years.
Moreover, an analysis of errors was made between the actual values of studied parameters and their values obtained from calculations from neural networks (for both training and test data). The values of these errors are summarized in Table 5.
When analyzing the forecast errors determined in terms of total RES energy production volume and selected sources, it can be stated that they are at an acceptable level.
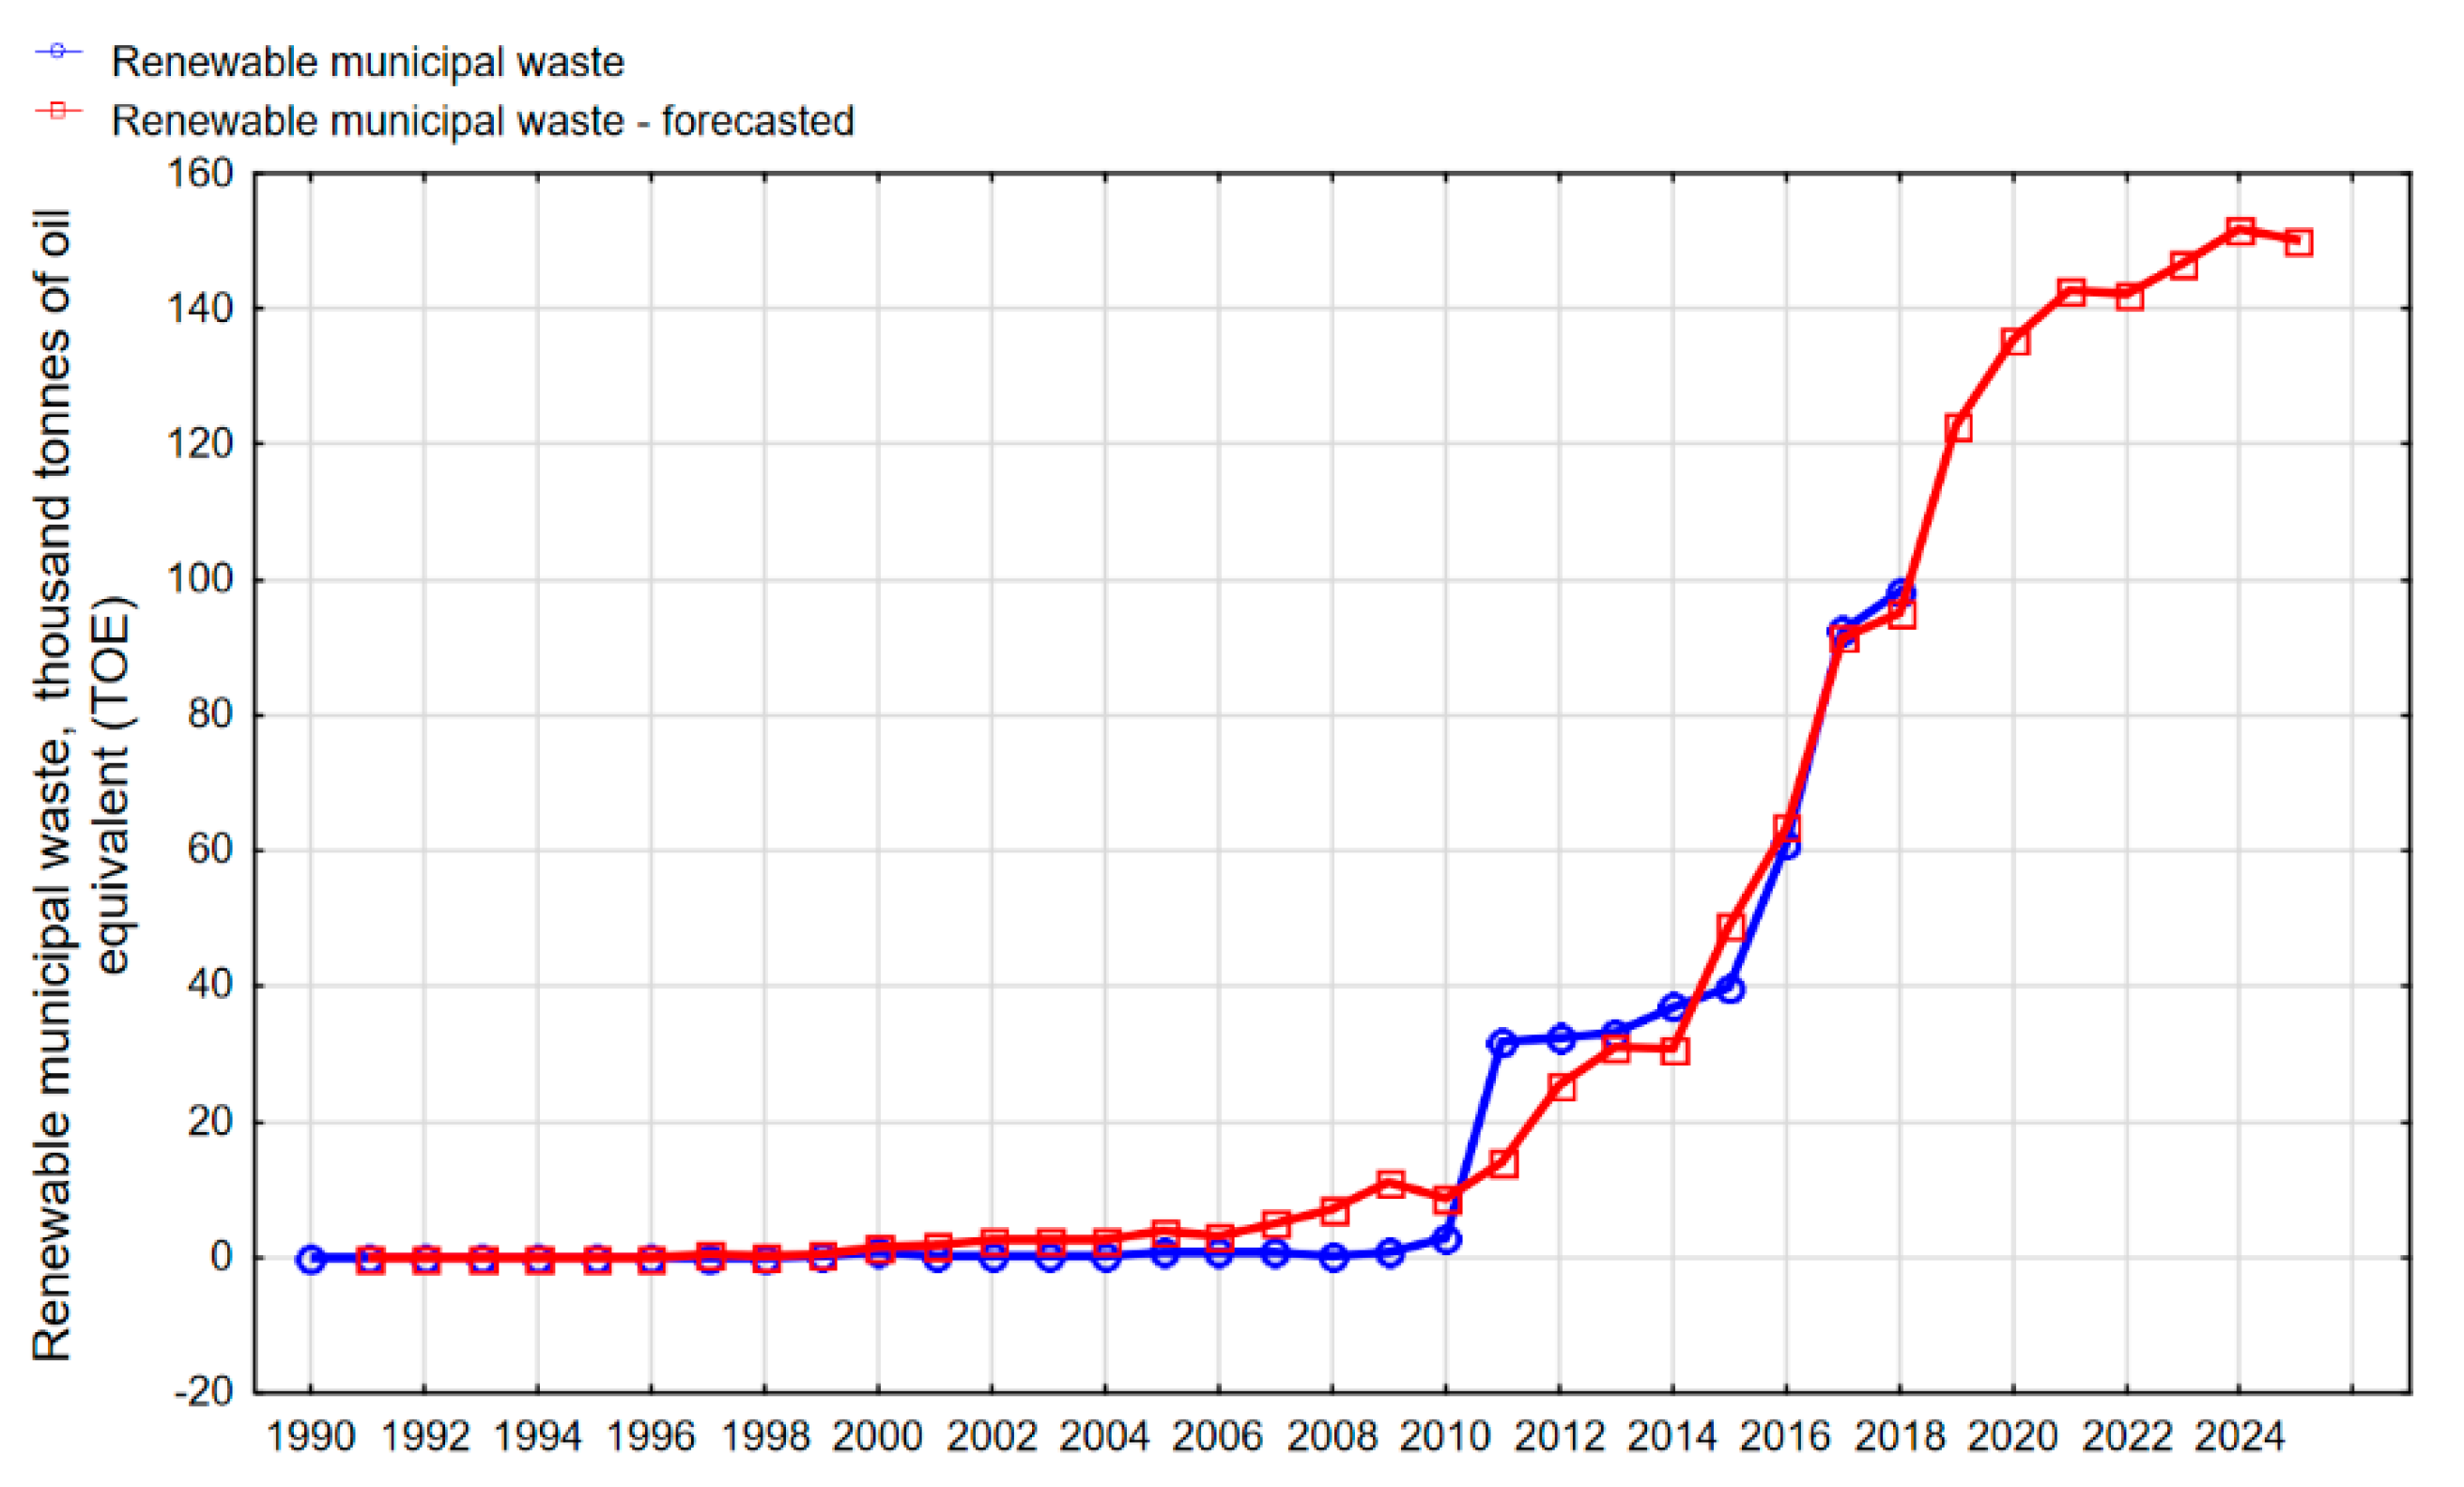
The highest value of the average MAPE forecast error was 20.74% and concerned the production of energy from renewable municipal waste. The lowest MAPE error value was 2.93% for energy production from primary solid biofuels.
It can therefore be concluded that, despite the limited amount of data, the results obtained are satisfactory and allow the inference process to be carried out in terms of the predicted values of renewable energy production. This, in turn, may become the basis for assessing the effectiveness of operations and determine further directions of work to increase the production of energy from RES.
Pursuant to the Renewable Energy Directive (2009/28/EC) [
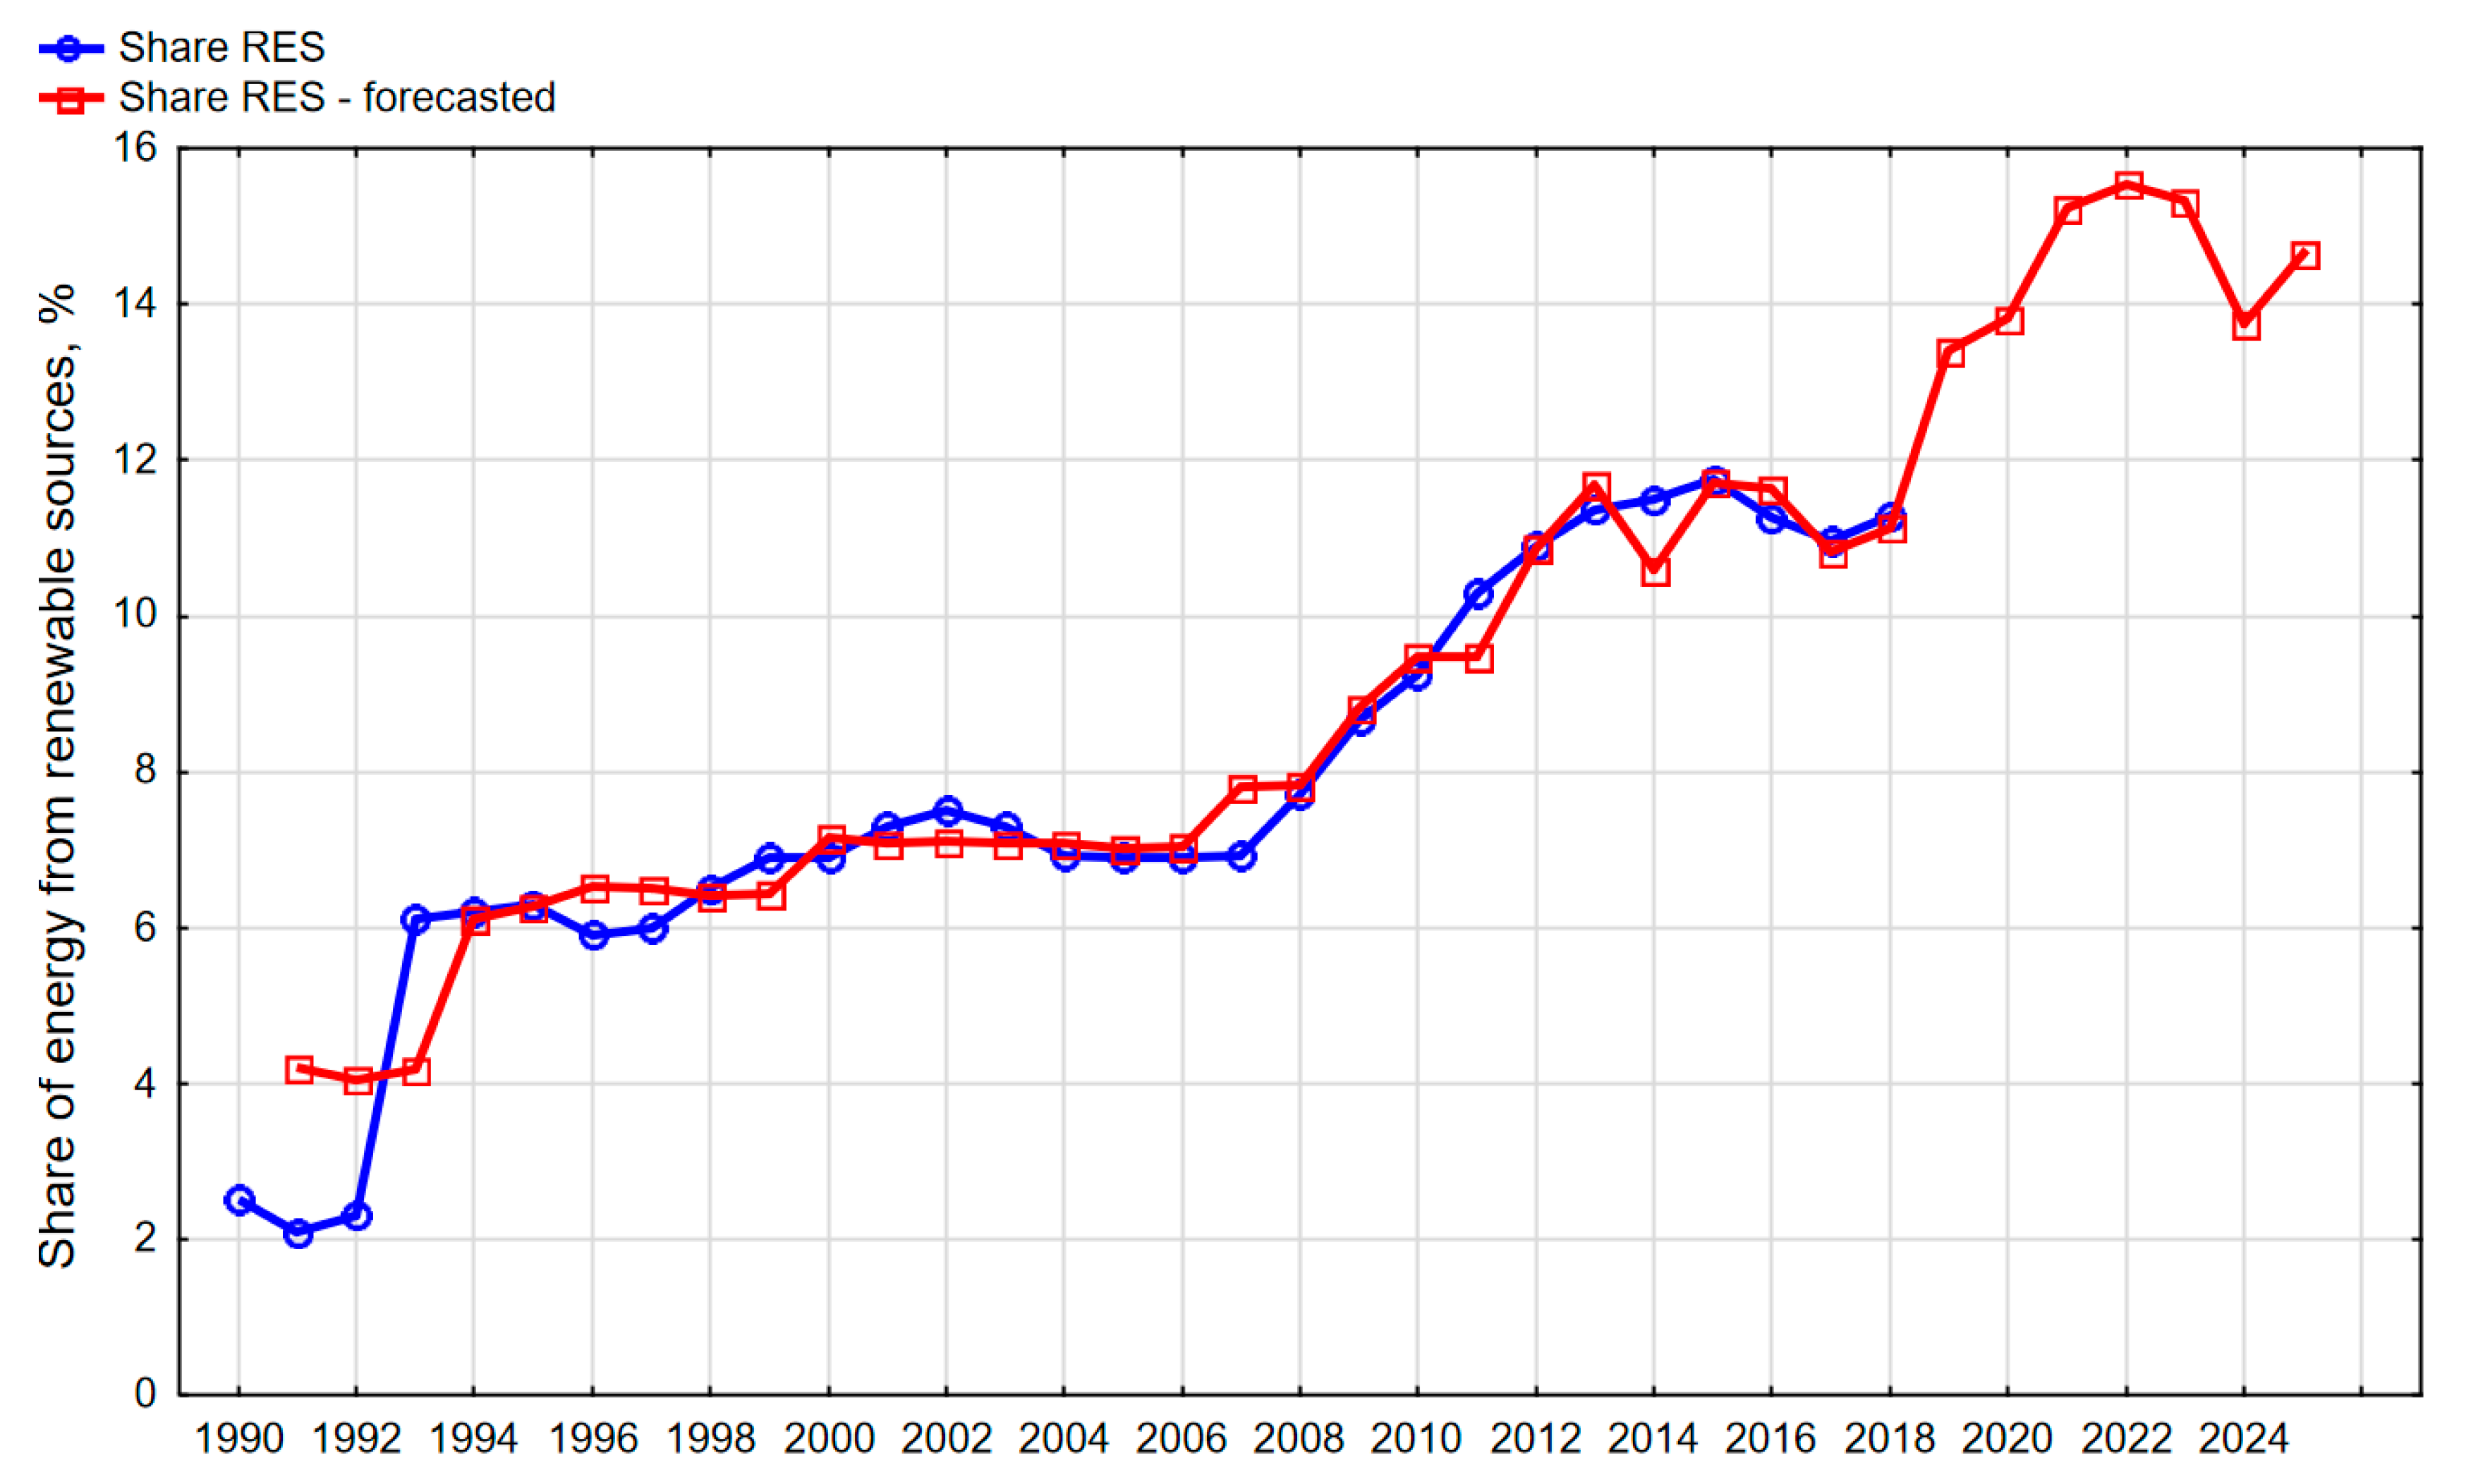
76], Poland has undertaken that, in 2020, the share of energy from RES in the total amount of energy used will be at least 15%. To determine if and possibly when this goal can be achieved, an additional analysis was conducted to make the forecast of the share of RES in total energy consumption by 2025. In order to prepare this forecast, a new neural network was developed consisting of an input layer, a single hidden layer and an output layer.
Parameters characterizing this network are presented in Table 6, and the designated forecast in Figure 21.
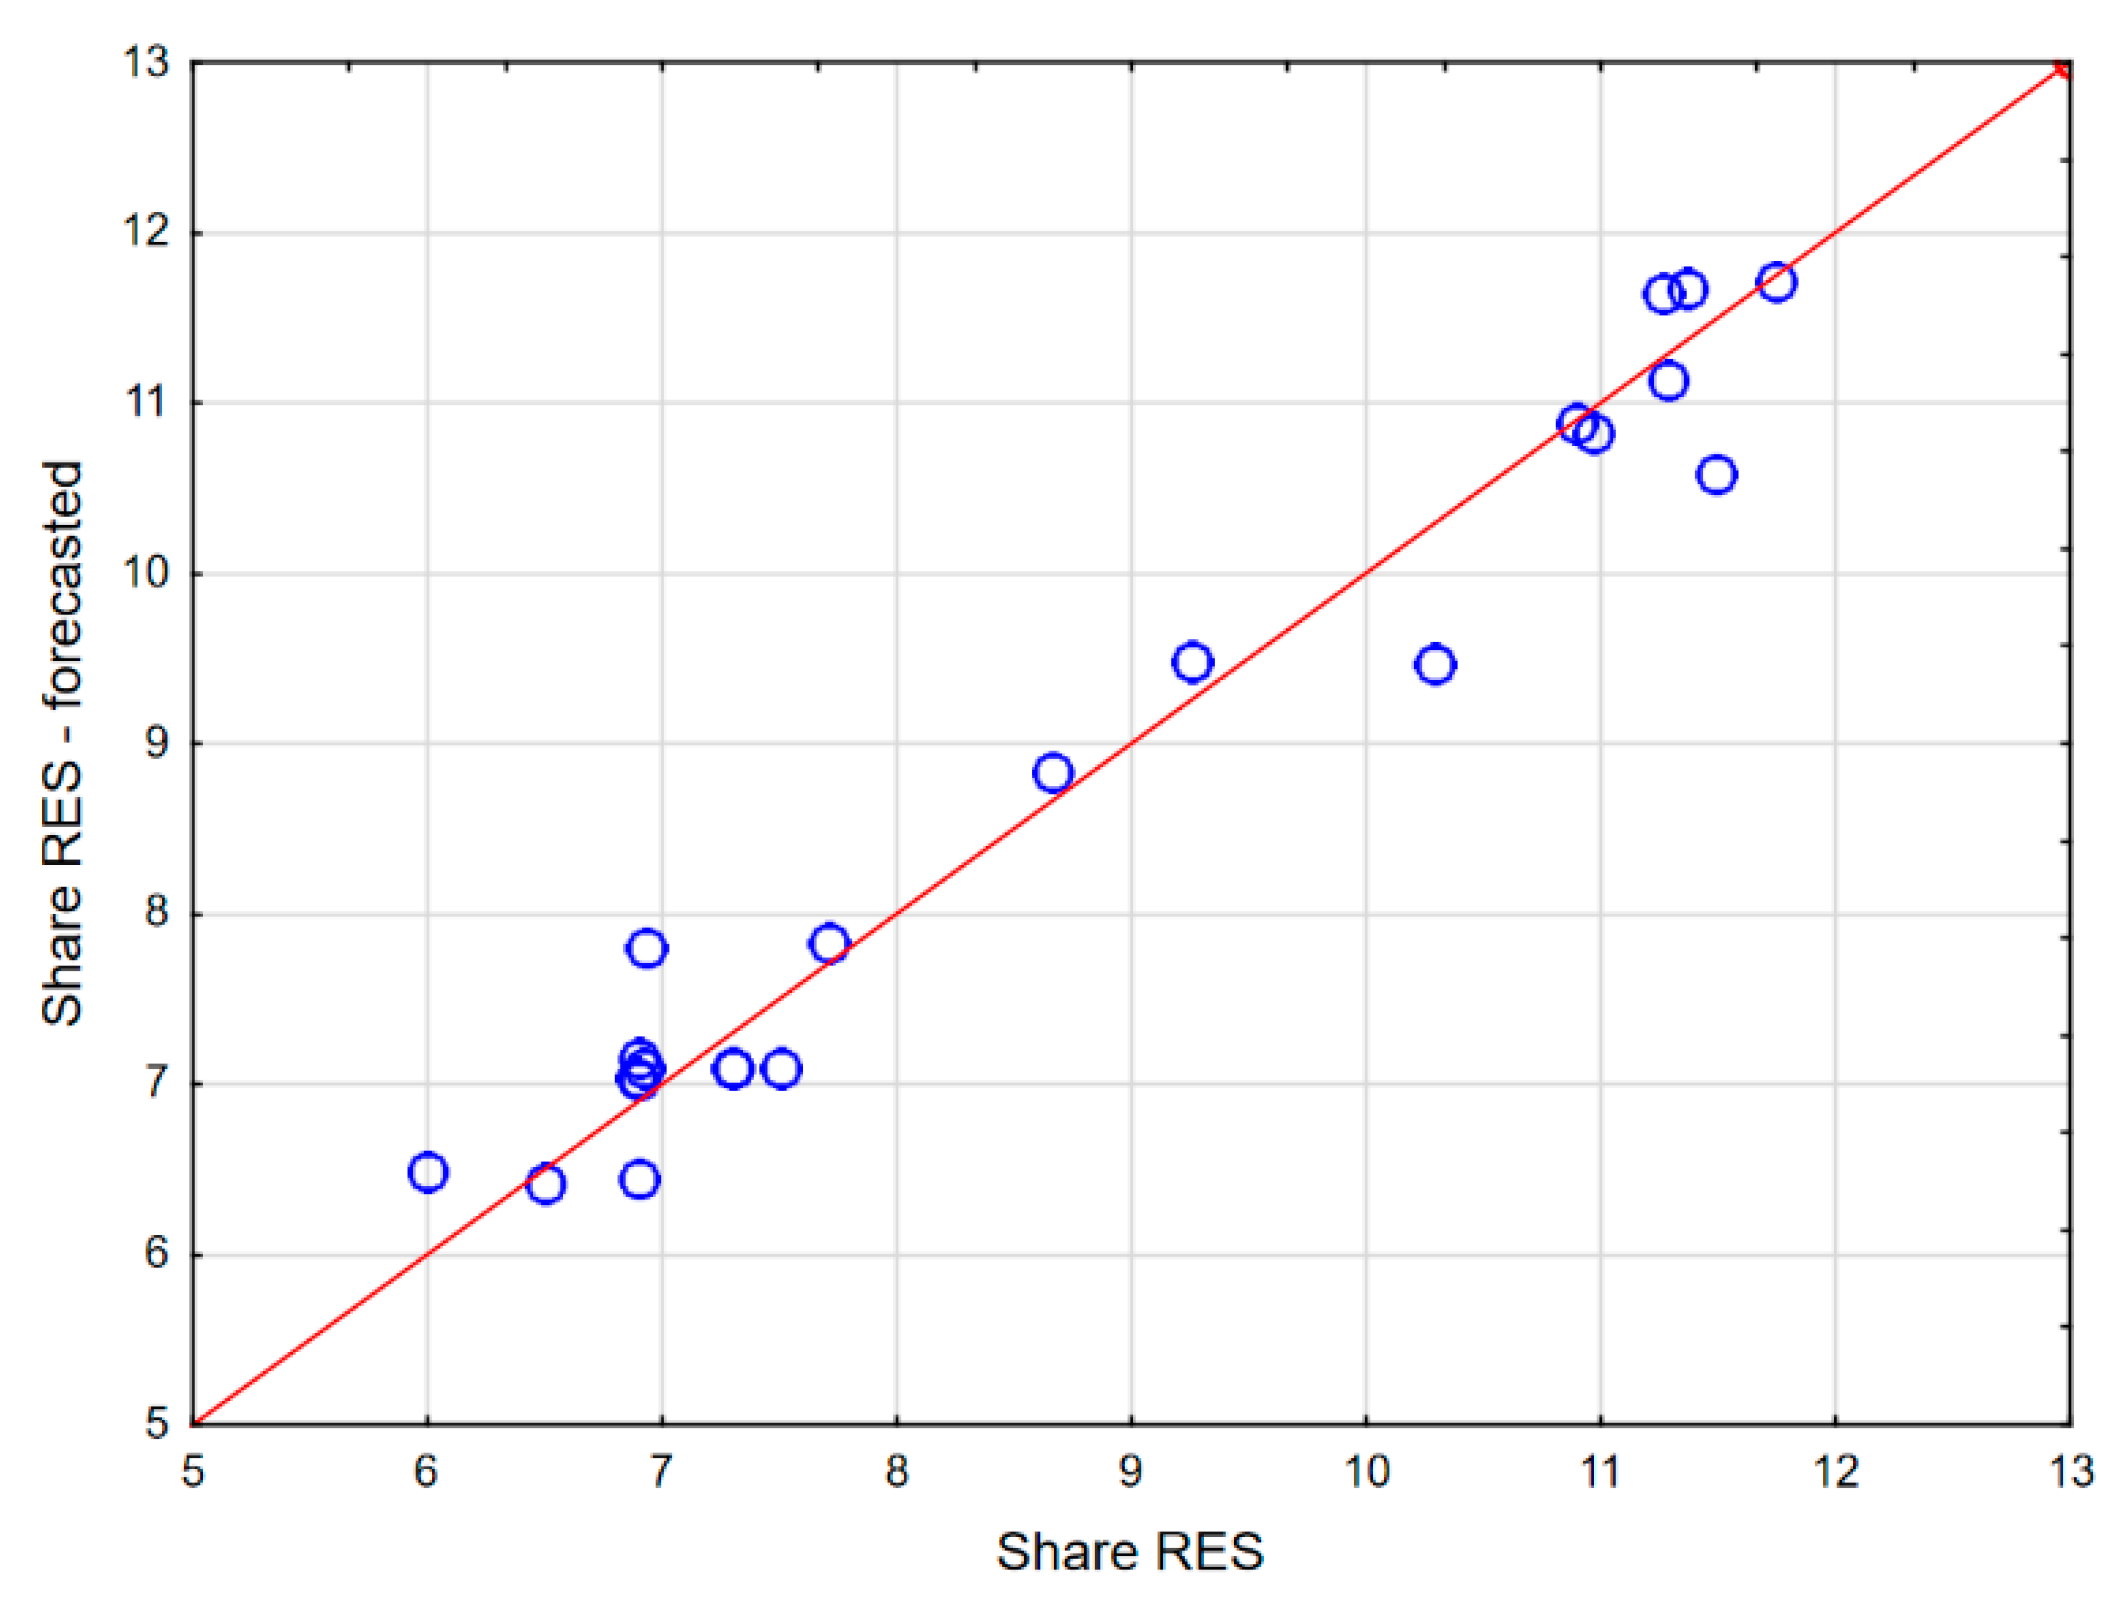
An analysis of the dispersion of the actual and predicted values of the actual and predicted variables was also made, which is presented graphically in Figure 22, while Figure 23 presents a histogram of these values with the density function marked.
The results of this forecast indicate that Poland will not achieve the assumed 15% target for the share of energy from RES in gross final energy consumption in 2020. This goal can only be met in 2021, which is not a negative result (share of around 15.34%). Obviously, from the point of view of implementing this plan, the forecast shows that in 2020, the share of energy from RES in gross final energy consumption will be at the level of 13.81%. However, the forecast for the coming years is quite worrying. Although in 2022 the share will increase to over 15.53%, in the following year there will be a slight decrease to the level of 13.76% and another increase in 2025 to 14.65%.
Based on the results, an error analysis was also made between the actual values of studied parameters and their values obtained from the calculations (Table 7).
When studying the forecast errors in terms of the value of the share of energy from RES in gross final energy consumption, it can be stated that they are at an acceptable level. The MAPE error value is less than 11% and the MAE error value is 0.47.

4. Discussion

Based on the results, it can be stated that within the predicted total amount of energy produced from RES in Poland by 2025, there should be a slight increase in this production (Figure 10). However, this growth seems to be not very dynamic. In principle, between 2021–2025, a constant level of this production can be noted, which, with the overall growing energy consumption, is not a favorable trend.
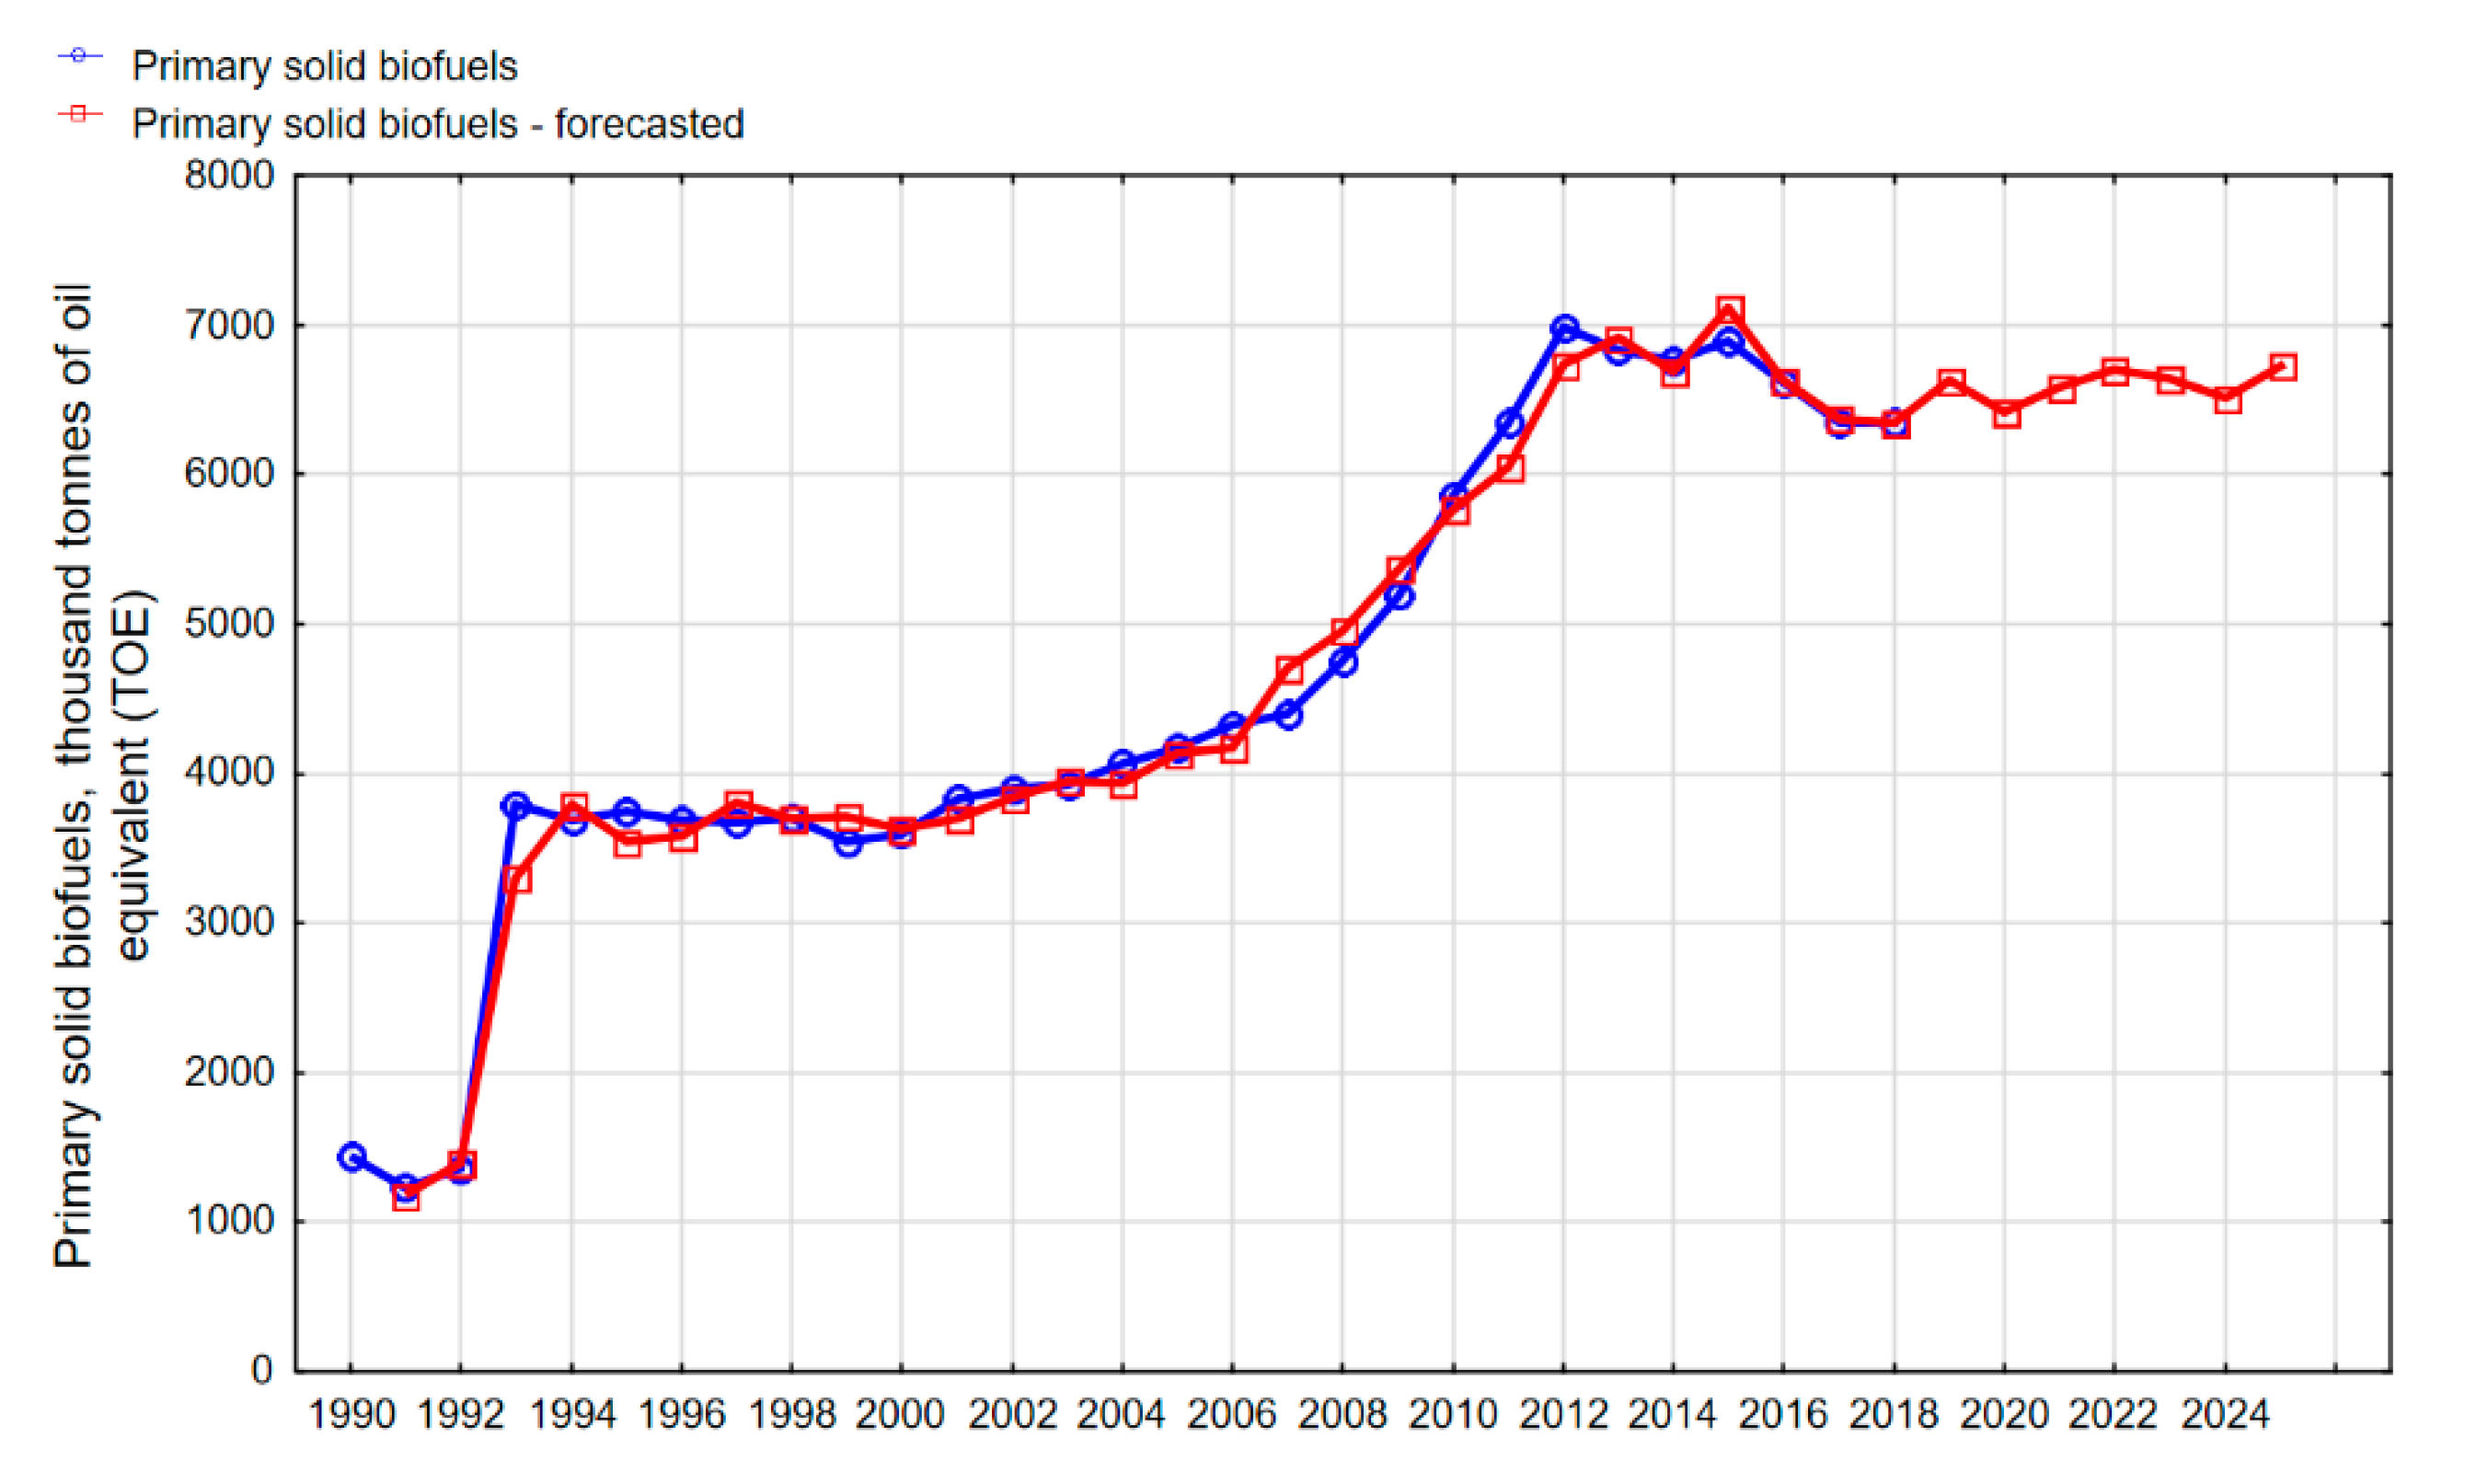
When analyzing the structure of RES in Poland, it is immensely diverse. This energy is mainly obtained from primary solid biofuels. Unfortunately, a significant stabilization of energy production from this source can be observed (Figure 15). The development of this area depends on many factors, including agriculture, where stagnation has been observed in recent years. Thus, this area needs to be stimulated so the growth can be more dynamic. This would significantly improve the total value of energy produced from RES.
Also, in recent years, the share of energy produced from wind has increased significantly. It is clear that the investments made, especially by the private sector, bring measurable effects (Table 1). The forecast for wind energy production is also exceptionally optimistic (Figure 13). In general, this is the result of large investments that have been made in this respect and favorable climate conditions in Poland.
Vastly dynamic development has also been reported in the field of energy production from solar thermal and photovoltaic energy (Figure 14). In this case, the state policy regarding co-financing of solar and photovoltaic installations and an increase in the number of sunny days in Poland encourage investments in this area. It seems that it is currently one of the most promising areas of energy production from RES.
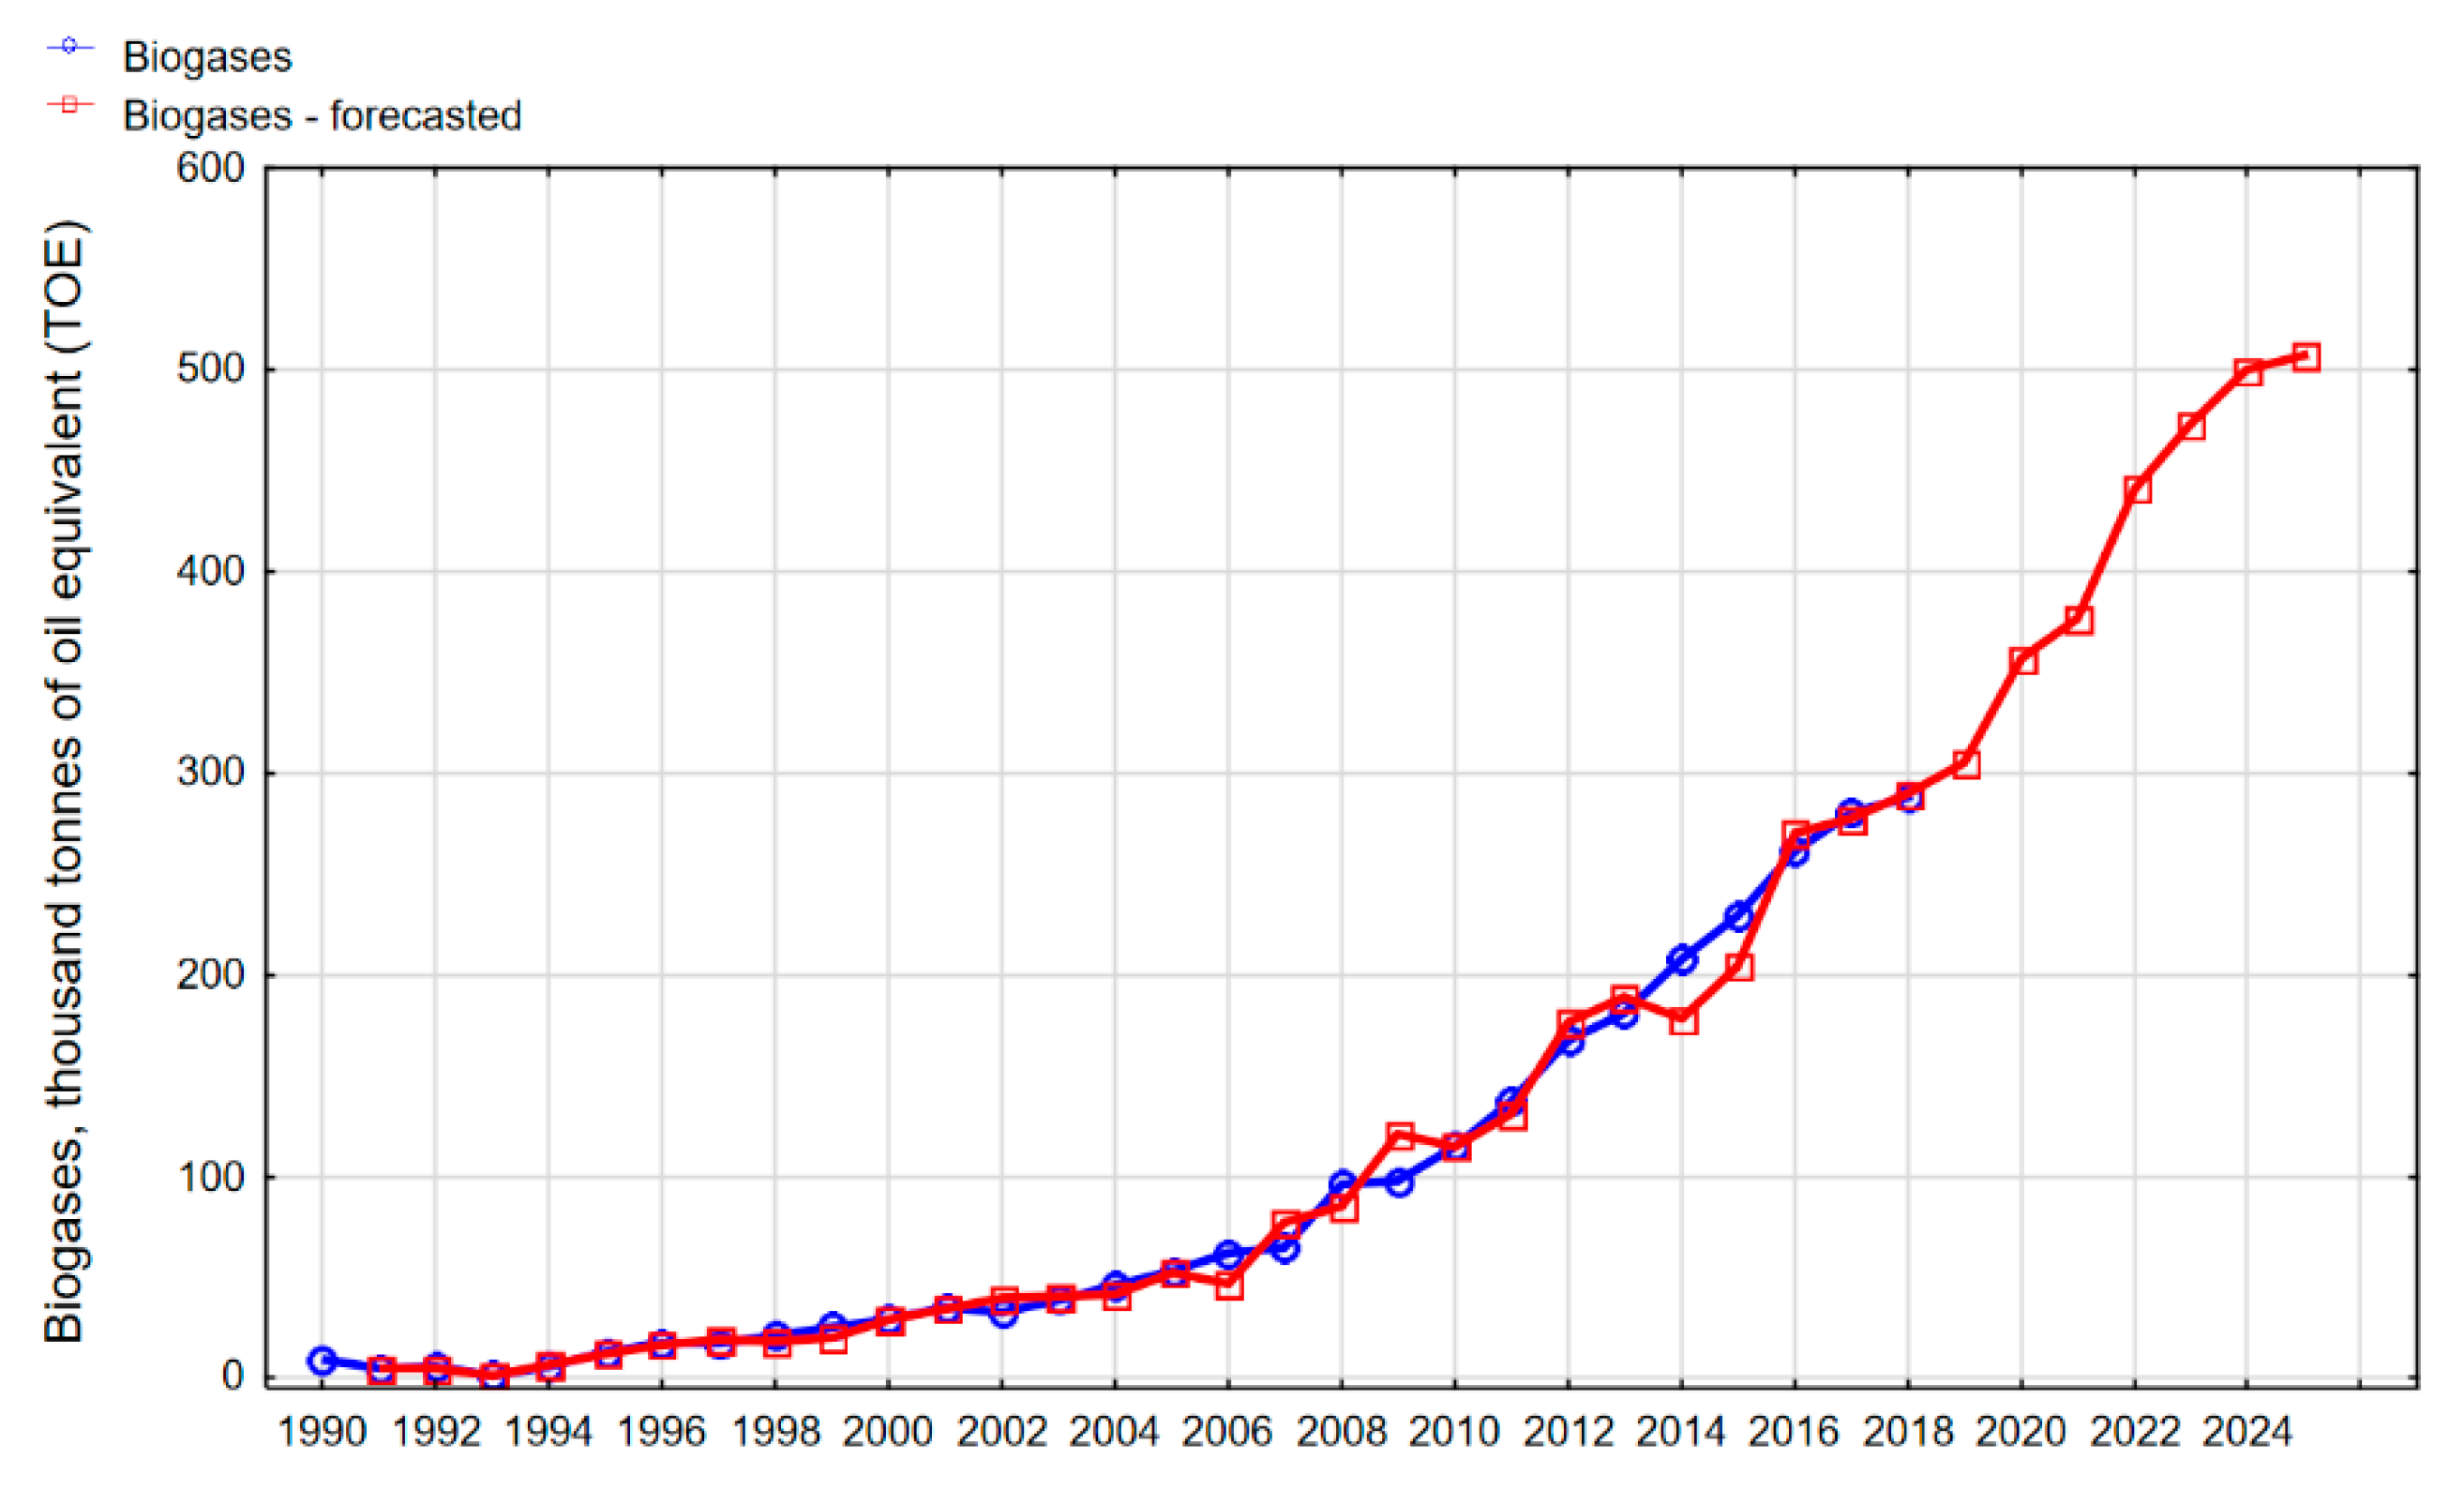
Energy production from biogases (Figure 17) and renewable municipal waste (Figure 18) also have positive development prospects. In both cases, these sources show high growth dynamics. This is associated with the development and implementation of new technologies in the field of waste utilization and a new policy in the field of waste segregation. The implementation of the circular economy and the increase in public awareness of the sustainable development economy are very conducive to the development of this sector. There are also large reserves in this area, which, with appropriate incentives (also financial), can affect the increase in energy produced.
For these sources, high consistency of the forecast with the actual production values can also be noted (Figure 19 and Figure 20). It can therefore be assumed that the energy production values determined in the forecasting process will be achieved.
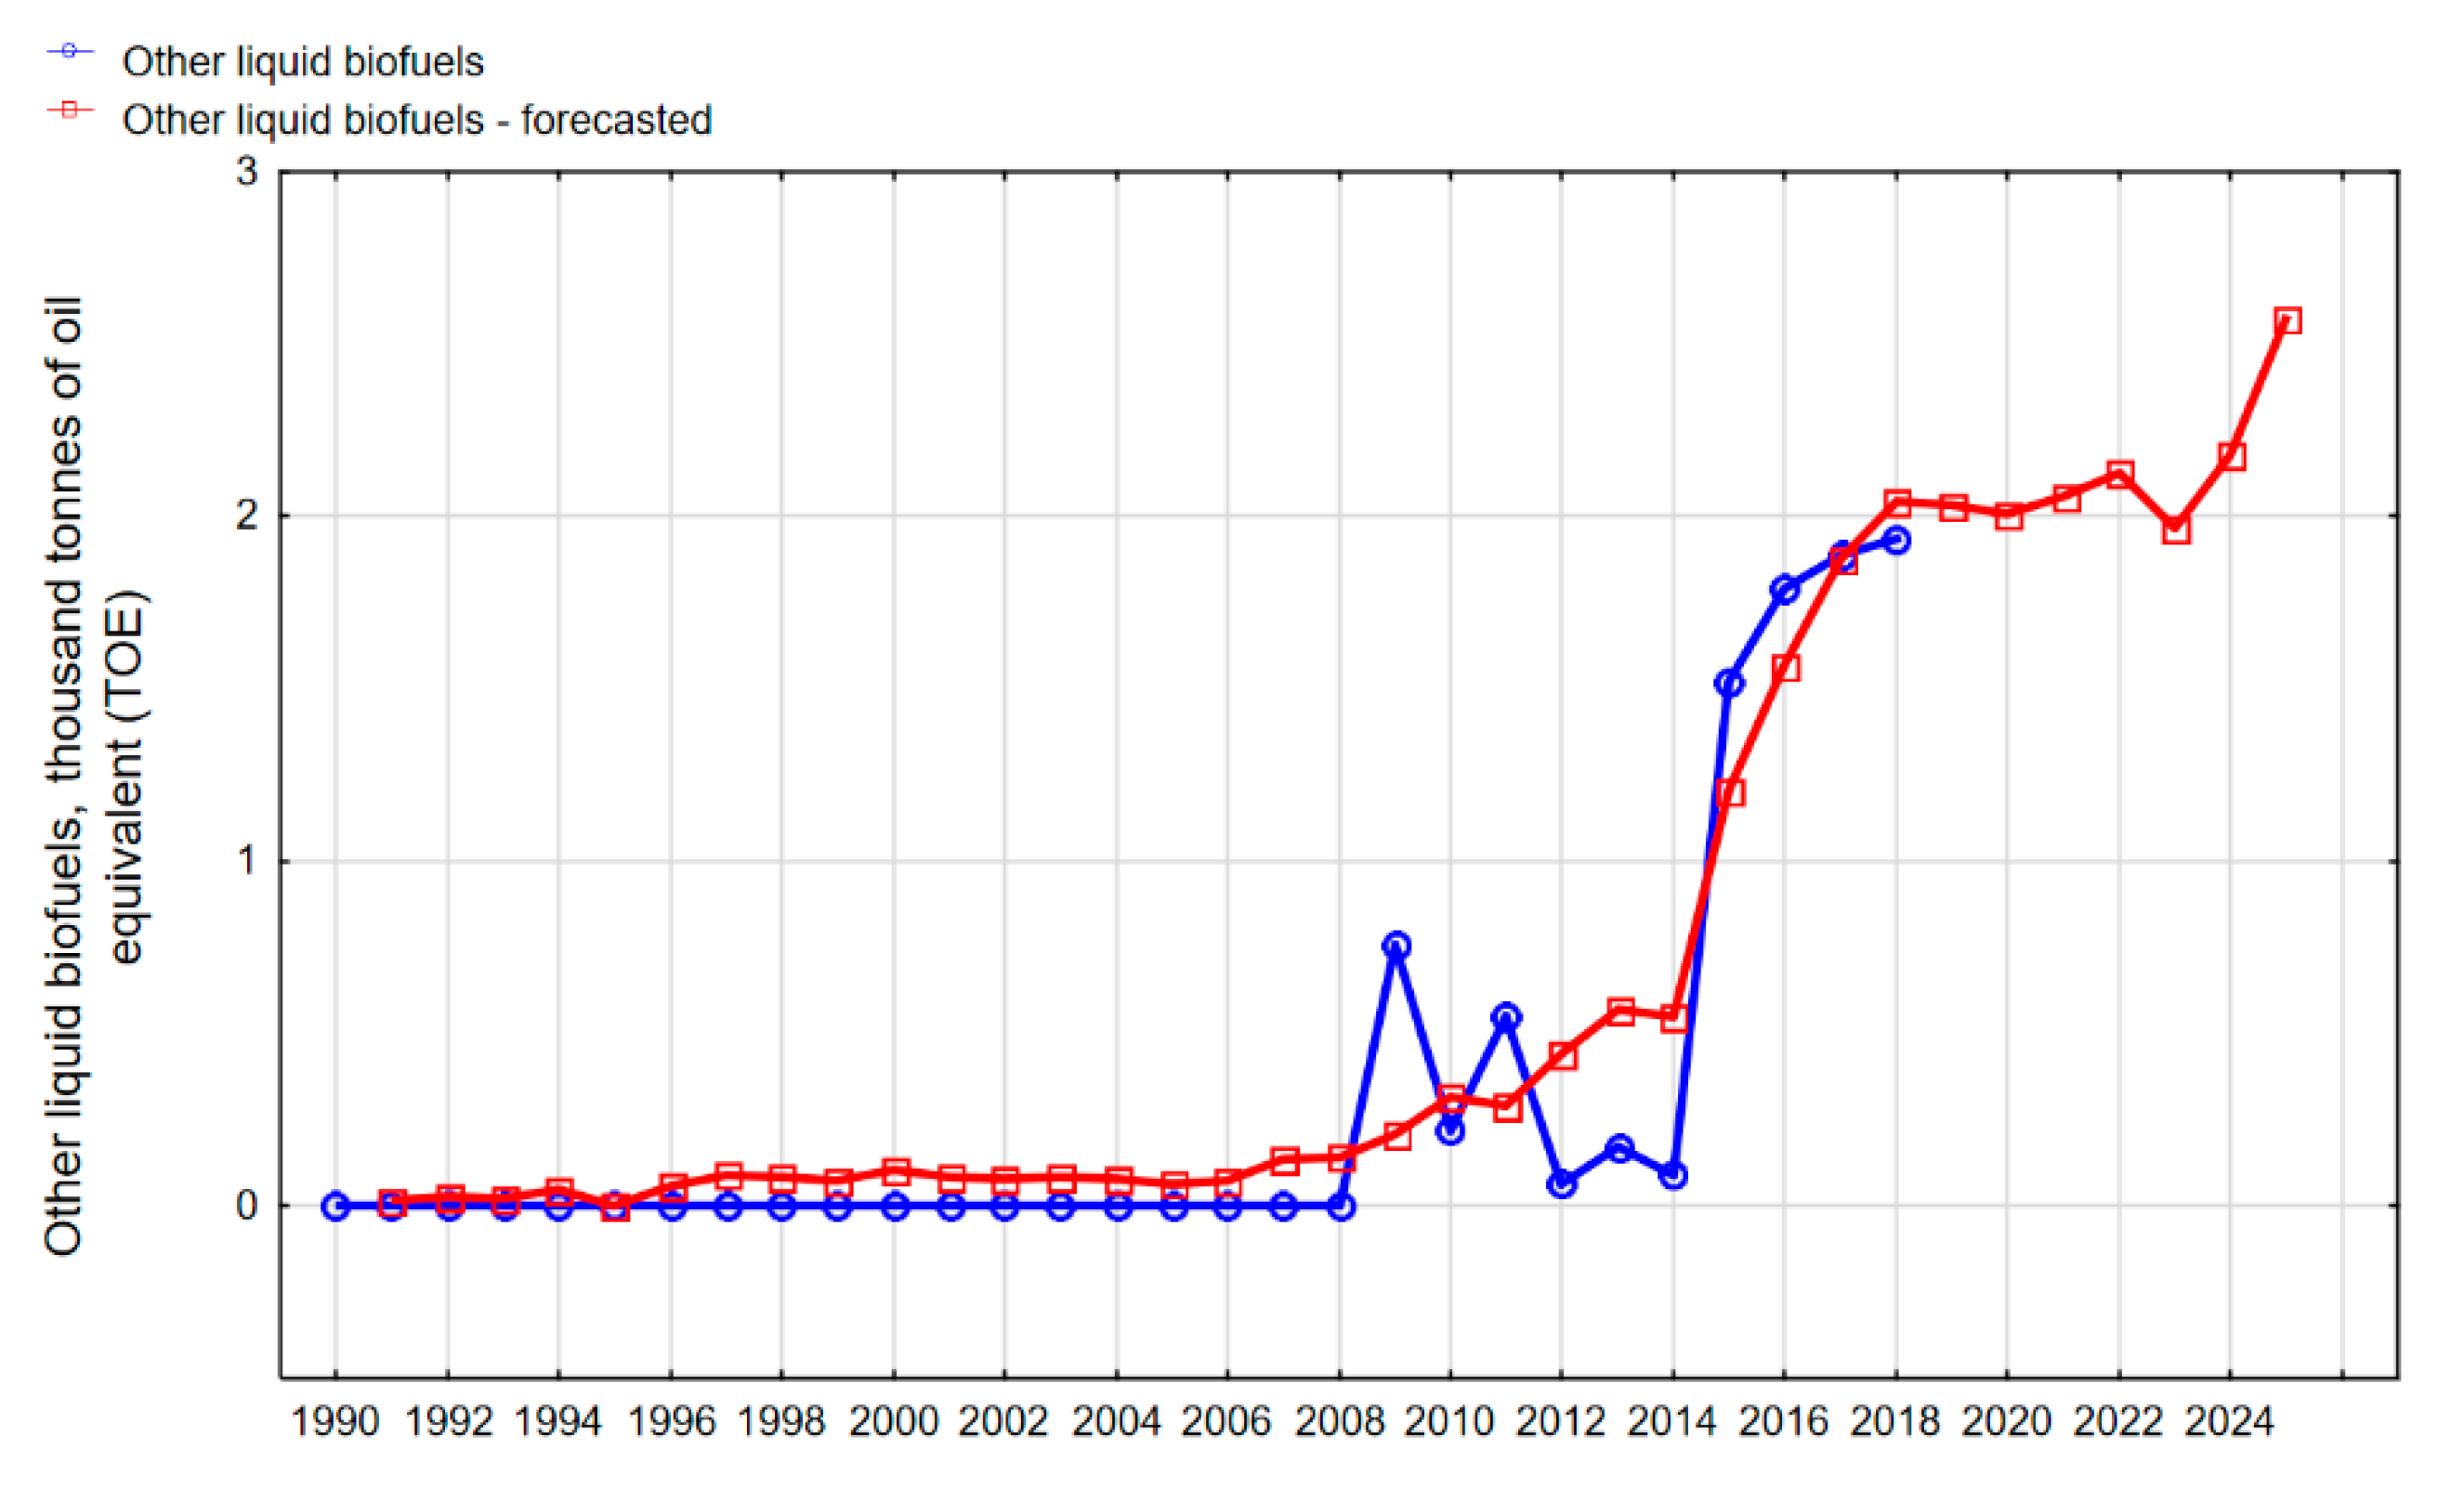
However, in the case of energy produced from other liquid biofuels, it can be seen that after a period of stabilization, a large increase in energy produced from this source is expected (Figure 16). In other words, the amount of energy produced from other liquid biofuels is currently relatively small, but it is constantly increasing. There is also a lot of potential in the area of raw materials needed to produce this energy. However, tax exemptions and greater state support are essential in this case.
As regards obtaining energy from geothermal sources, great development prospects can be observed. Despite the disturbances in the production of this energy, an upward trend can be noted (Figure 12). Due to favorable geographical conditions, this energy sector should grow more and more dynamically in the coming years.
For energy produced from water, it is reported to have the weakest development prospects (Figure 11). As already mentioned, the deteriorating hydrological conditions have significantly worsened the investment climate in this area. Rainfall forecasts for Poland in the coming years are also not optimistic. Due to the high costs of hydroelectric plants, no increase in energy produced from water should be expected in the near future.
When analyzing the presented structure of sources from which renewable energy is produced in Poland together with the development perspectives, it can be stated that it has great growth potential. With special emphasis on solar and wind energy, as well as other liquid biofuels, biogas and geothermal sources, the development opportunities are really huge. Both geographical and atmospheric conditions are favorable for this to be achieved. Therefore, it seems reasonable to create favorable legal conditions for investing in RES. In this respect, both private and large state-owned enterprises show great interest in this sector. A comprehensive development strategy for this sector should result in a large increase in energy produced from RES.
It is also worth referring the results to the forecasts presented as part of the EUCALC Explore Sustainable European Futures [77] project, under which a multifunctional calculator was developed. This tool makes it possible to calculate electricity production in Poland (as well as in the EU and its Member States) by 2050. Certain differences were reported between the results of forecasts presented in the article and those obtained from the calculations presented in [77]. This is due to the calculation algorithms and input data used. One of the differences concerns geothermal energy. According to the forecast, in 2025, it should be produced at slightly over 30 thousand tonnes of oil equivalent, while according to the calculator, such energy in Poland will not be produced at all. In this regard, the forecast seems to be more reliable, as today (and also in previous years) in Poland, certain amounts of energy from this source have been produced. The outlook in this area is also rather optimistic.
Some slight differences were also observed for the production of energy from water. According to the forecast presented in the article, this production in 2025 will fall below the level of 160 thousand tonnes of oil equivalent, while according to the results shown in [77], energy from this source will be generated at around 183 thousand tonnes of oil equivalent. As noted by the authors, due to the current conditions, for example, associated with rainfall deficit and watercourse desiccation, as well as the restrictions discussed earlier, the decrease in energy production from this source is more probable. However, these slight differences do not significantly affect the overall positive assessment of this tool.
The analysis of the percentage share of energy from RES in its total consumption in Poland (Figure 21) shows that it will be difficult to increase this share in the near future. Unless more decisive measures are taken to promote energy from RES, it will be difficult to meet the requirements of the European Green Deal strategy. It is also key that investments are intended for those sources that have the greatest development prospects.
In order to effectively direct the necessary changes, it is sensible to conduct research to broaden the knowledge of the current state of Polish energy, in particular, renewable energy. It is undisputable that energy produced from RES is definitely more ecological and constitutes a real alternative to production from conventional sources. The analyses carried out and the results obtained should support this process and broaden the knowledge of the structure of renewable energy production in Poland. In this context, the use of the methodology of artificial neural networks seems fully justified.

5. Conclusions and Further Directions

In the context of climate change observed for many years, caused by greenhouse gas and other harmful substance emissions, the use of conventional energy sources should become an absolute priority of the energy and climate policy of the EU countries, including Poland.
In the case of Poland, it also has symbolic significance, as it is one of the very few countries in Europe in which the energy sector is based to a large extent on conventional energy sources (hard coal and lignite). Although the unit costs of energy production from these sources are low, the environmental impact of this production is immensely negative. The emission of this sector in Poland is especially high. Growing public awareness and increasingly restrictive climate strategies adopted by the EU mean that also in Poland, it is necessary to change the structure of energy production. The use of conventional energy sources should be limited and replaced by RES. The process of energy transition, however, is costly and meets with great resistance on the part of society, especially the one associated with the conventional energy sector.
In order to change this, it is obligatory to develop a coherent, transparent and practicable policy on decarbonizing the economy and alternative solutions. In this respect, solutions implemented by the EU can be very helpful, including those reducing bureaucracy.
When analyzing the development perspectives of the energy sector, it is impossible not to mention its high dependence on various political, economic and demographic factors, among other aspects. In addition, these factors may differ significantly at different times. In this respect, very dynamic technological development (Industry 4.0), the construction of smart cities and factories, and many other changes that await us are of great importance. These changes can undoubtedly affect the forecasts. With their high dynamics, it will be difficult to determine the real demand for both electricity and heat.
The best example is the currently prevailing pandemic associated with the SARS-CoV-2 coronavirus, which has significantly disrupted all forecasts to date, and not only in the energy sector. It seems that in the context of this pandemic, energy from conventional sources has returned. In the long run, however, renewable energy should start to dominate the market. This energy also seems to be more resistant to economic factors and crises as opposed to conventional energy. For Poland, it can be a very important advantage, as after the current crisis, there will be even more pressure on the development of this sector of the economy.
While today the basic stimulus for the economy are still ongoing production and investment processes, after the eradication of the coronavirus, the key to success will be access to cheap energy supplied to plants restarting their business after a few weeks of stagnation or reduction of production. Undoubtedly, this will provide a huge opportunity for the development of RES from sources with low fixed costs, including wind and solar farms. The new social approach to ecology will probably also be important for this development. It is clear that this pandemic will increase ecological awareness, and this is undeniably positive news for RES.
Presented in December 2019, the European Green Deal concept assumes achieving climate neutrality in the perspective of the next 30 years (by 2050). This concept, with very ambitious assumptions and goals, is a great opportunity for the inhabitants of Europe and individual countries both in terms of improving the quality of the environment and achieving a high technological level. Currently, it is difficult to assess whether all the assumed goals of this strategy can be accomplished, but the very adoption of such an ambitious plan is both a great challenge and opportunity for the world to reduce environmental devastation. The introduction of changes related to the implementation of this strategy requires the approval of all EU countries, which will not be easy to achieve.
The European Green Deal requires political commitment to climate protection and is consistently paving the way for a more sustainable future. However, the basis of its success will be the financial activities that need to be implemented. The Just Transition Fund will have to support countries and initiatives that will increase the use of RES at the expense of conventional sources.
These solutions are a great chance for a civilization leap for the Polish economy. They create an opportunity to finance some of the activities related to energy transition and decarbonization of the economy. In the case of Poland, this transition from conventional to alternative energy is associated with large investments. In this respect, the EU assistance will be needed. The basis of the energy transition is the development of RES, which will allow the Polish economy to become more competitive. Nevertheless, this process requires both strong political actions and financial resources.
The research results presented in the article clearly show that there is a lot to be done in Poland regarding the development of RES. The forecasts are not very optimistic, and without more decisive actions, the share of energy produced from RES will be hard to reach, as assumed in the plans at the level of 18.4% in 2025. In 2030, it should be 23%. Compared to other European countries, Poland’s achievements are currently not satisfactory, and thus achieving and maintaining the goals set in the plans is unrealistic for the time being.
For the further development of this sector in Poland, analyses of the structure of sources from which renewable energy is produced and forecasts for its production up to 2025 are significant. Focusing on several sources that have the best development perspectives seems obvious. The results clearly indicate these sources and should be achieved in the coming years. Obviously, these forecasts did not take into account the revolutionary changes that may occur in the near future and change these forecasts.
Undoubtedly, the coronavirus pandemic, which is currently spreading around the world, will be of great significance in this respect. Time will tell what effects this phenomenon will have on the global economy. However, a large global economic slowdown can already be observed. This is also associated with a decrease in energy demand, which significantly distorts any forecasts regarding the share of individual sources in its production. Perhaps, this is another signal that may encourage a more decisive approach to climate protection and to increase the pace of producing modern zero-emission energy and building the entire global economy.
Thus, it is reasonable to state that in order to increase public awareness and broaden the knowledge in the field of RES, research is inevitable to obtain new information.
Undoubtedly, this study has generated the knowledge that should be used to create and later implement climate policies both in Poland and Europe.

Author Contributions

Conceptualization, M.T. and J.B.; methodology, J.B. and M.T.; software, M.T.; and J.B.; formal analysis, J.B. and M.T.; investigation, J.B. and M.T.; resources, J.B.; M.T. and S.A.S.; data curation, J.B. and M.T.; writing of the original draft preparation, J.B. and M.T. and S.A.S.; writing of review and editing, J.B.; M.T.; visualization, M.T.; supervision, M.T. and J.B.; project administration, M.T. and J.B.; funding acquisition, J.B. All authors have read and agreed to the published version of the manuscript.

Funding

This publication was funded by The Silesian University of Technology, grant number 13/030/RGJ19/0050 (Rector’s Grants in Research and Development) and by the statutory research performed at Silesian University of Technology, Department of Production Engineering, Faculty of Organization and Management (13/030/BK-20/0059).

Conflicts of Interest

The authors declare no conflicts of interest.

Abbreviations

The following abbreviations are used in this manuscript:
ANNArtificial neural network
COPConference of the Parties
EUEuropean Union
MAEMean absolute error
MAPEMean absolute percentage error
MEMean error
MPEMean percentage error
MLPMulti-layer perceptron
RESRenewable energy sources
TOEThousand tonnes of oil equivalent
UNUnited Nations

References

  1. Chiou-Wei, S.Z.; Chen, C.-F.; Zhu, Z. Economic growth and energy consumption revisited—Evidence from linear and nonlinear Granger causality. Energy Econ. 2008, 30, 3063–3076. [Google Scholar] [CrossRef]
  2. Kanagawa, M.; Nakata, T. Assessment of access to electricity and the socio-economic impacts in rural areas of developing countries. Energy Policy 2008, 36, 2016–2029. [Google Scholar] [CrossRef]
  3. Brodny, J.; Tutak, M. Analyzing Similarities between the European Union Countries in Terms of the Structure and Volume of Energy Production from Renewable Energy Sources. Energies 2020, 13, 913. [Google Scholar] [CrossRef] [Green Version]
  4. Karekezi, S.; Kimani, J. Have power sector reforms increased access to electricity among the poor in East Africa? Energy Sustain. Dev. 2004, 8, 10–25. [Google Scholar] [CrossRef]
  5. Nouni, M.; Mullick, S.; Kandpal, T. Providing electricity access to remote areas in India: Niche areas for decentralized electricity supply. Renew. Sustain. Energy Rev. 2008, 34, 430–434. [Google Scholar] [CrossRef]
  6. Oseni, M. Household’s access to electricity and energy consumption pattern in Nigeria. Renew. Sustain. Energy Rev. 2012, 16, 990–995. [Google Scholar] [CrossRef]
  7. Slough, T.; Urpelainen, J.; Yang, J. Light for all? Evaluating Brazil’s rural electrification progress. Energy Policy 2015, 86, 315–332. [Google Scholar] [CrossRef]
  8. Dogan, E.; Seker, F. Determinants of CO2 emissions in the European Union: The role of renewable and non-renewable energy. Renew. Energy 2016, 94, 429–439. [Google Scholar] [CrossRef]
  9. Sharma, S.S. Determinants of carbon dioxide emissions: Empirical evidence from 69 countries. Appl. Energy 2011, 88, 376–382. [Google Scholar] [CrossRef]
  10. Bose, B.K. Global Warming: Energy, Environmental Pollution, and the Impact of Power Electronics. IEEE Ind. Electron. Mag. 2010, 4, 6–17. [Google Scholar] [CrossRef]
  11. Saboori, B.; Sulaiman, J. Environmental degradation, economic growth and energy consumption: Evidence of the environmental Kuznets curve in Malaysia. Energy Policy 2013, 60, 892–905. [Google Scholar] [CrossRef]
  12. Shafiei, S.; Salim, R.A. Non-renewable and renewable energy consumption and CO2 emissions in OECD countries: A comparative analysis. Energy Policy 2014, 66, 547–556. [Google Scholar] [CrossRef] [Green Version]
  13. Ezzati, M.; Kammen, D.K. The Health Impacts of Exposure to Indoor Air Pollution from Solid Fuels in Developing Countries: Knowledge, Gaps, and Data Needs. Environ. Health Perspect. 2002, 110, 1057–1068. [Google Scholar] [CrossRef] [Green Version]
  14. COP25 Summary Report. Available online: https://www.ieta.org/resources/Documents/IETA-COP25-Report_2019.pdf (accessed on 10 April 2020).
  15. European Commission. Available online: https://ec.europa.eu/info/strategy/priorities-2019-2024/european-green-deal_en (accessed on 10 April 2020).
  16. European Commission. Available online: https://ec.europa.eu/regional_policy/en/newsroom/news/2020/01/14-01-2020-financing-the-green-transition-the-european-green-deal-investment-plan-and-just-transition-mechanism (accessed on 10 April 2020).
  17. UNFCCC. Kyoto Protocol Reference Manual on Accounting of Emissions and Assigned Amount United Nations Framework Convention on Climate Change. 2008. Available online: http://unfccc.int/kyoto_protocol/items/3145.php (accessed on 10 April 2020).
  18. Haas, R.; Panzer, C.; Resch, G.; Ragwitz, M.; Reece, M.; Held, A. A historical review of promotion strategies for electricity from renewable energy sources in EU countries. Renew. Sustain. Energy Rev. 2011, 15, 1003–1034. [Google Scholar] [CrossRef]
  19. Streimikiene, D.; Ciegis, R.; Grundey, D. Energy indicators for sustainable development in Baltic States. Renew. Sustain. Energy Rev. 2007, 11, 877–893. [Google Scholar] [CrossRef]
  20. Tomaszewski, K. Energy policy of the European Union in the context of economic security issues. Przegląd Politol. 2018, 1, 133–145. [Google Scholar] [CrossRef] [Green Version]
  21. Browne, O.; Poletti, S.; Young, D. How does market power affect the impact of large scale wind investment in ‘energy only’ wholesale electricity markets? Energy Policy 2015, 87, 17–27. [Google Scholar] [CrossRef]
  22. 2018 Cost of Wind Energy Review. Available online: https://www.osti.gov/servlets/purl/1581952 (accessed on 10 April 2020).
  23. Reuter, W.F.; Szolgayová, J.; Fuss, S.; Obersteiner, M. Renewable energy investment: Policy and market impacts. Appl. Energy 2012, 97, 249–254. [Google Scholar] [CrossRef]
  24. Kilinc-Ata, N. The evaluation of renewable energy policies across EU countries and US states: An econometric approach. Energy Sustain. Dev. 2016, 31, 83–90. [Google Scholar] [CrossRef]
  25. Haas, R.; Resch, G.; Panzer, C.; Busch, S.; Ragwitz, M.; Held, A. Efficiency and effectiveness of promotion systems for electricity generation from renewable energy sources—Lessons from EU countries. Energy 2011, 36, 2186–2193. [Google Scholar] [CrossRef]
  26. Eurostat Database. Available online: https://ec.europa.eu/eurostat/web/energy/data/database (accessed on 10 April 2020).
  27. International Renewable Energy. Available online: https://www.irena.org/ (accessed on 10 April 2020).
  28. Zsiborács, H.; Baranyai, N.H.; Vincze, A.; Zentkó, L.; Birkner, Z.; Máté, K.; Pintér, G. Intermittent Renewable Energy Sources: The Role of Energy Storage in the European Power System of 2040. Electronics 2019, 8, 729. [Google Scholar] [CrossRef] [Green Version]
  29. Eurostat Database. Available online: https://ec.europa.eu/eurostat/statistics-explained/index.php/Environment (accessed on 10 April 2020).
  30. Directive (EU) 2018/2001 of the European Parliament and of the Council of 11 December 2018 on the Promotion of the Use of Energy from Renewable Sources. Available online: https://eur-lex.europa.eu/legal-content/EN/TXT/?uri=uriserv:OJ.L_.2018.328.01.0082.01.ENG&toc=OJ:L:2018:328:TOC (accessed on 10 April 2020).
  31. In Focus: Renewable Energy in Europe. Available online: https://ec.europa.eu/info/news/focus-renewable-energy-europe-2020-mar-18_en (accessed on 10 April 2020).
  32. Directions of Energy Development in Poland. Opinions about Energy Sources and Their Use. Available online: https://www.cbos.pl/SPISKOM.POL/2015/K_017_15.PDF (accessed on 10 April 2020).
  33. Mroczek, B.; Kurpas, D. Social Attitudes Towards Wind Farms and other Renewable Energy Sources in Poland. Med. Środowiskowa-Environ. Med. 2014, 17, 19–28. [Google Scholar]
  34. Nyga-Łukaszewska, H.; Aruga, K.; Stala-Szlugaj, K. Energy Security of Poland and Coal Supply: Price Analysis. Sustainability 2020, 12, 2541. [Google Scholar] [CrossRef] [Green Version]
  35. Brown, T.; Schäfer, M.; Greiner, M. Sectoral Interactions as Carbon Dioxide Emissions Approach Zero in a Highly-Renewable European Energy System. Energies 2019, 12, 1032. [Google Scholar] [CrossRef] [Green Version]
  36. Gyalai-Korpos, M.; Zentkó, L.; Hegyfalvi, C.; Detzky, G.; Tildy, P.; Hegedűsné Baranyai, N.; Pintér, G.; Zsiborács, H. The Role of Electricity Balancing and Storage: Developing Input Parameters for the European Calculator for Concept Modeling. Sustainability 2020, 12, 811. [Google Scholar] [CrossRef] [Green Version]
  37. Kaldellis, J.K.; Zafirakis, D. Optimum energy storage techniques for the improvement of renewable energy sources-based electricity generation economic efficiency. Energy 2007, 32, 2295–2305. [Google Scholar] [CrossRef]
  38. Oniszk-Popławska, A.; Rogulska, M.; Wiśniewska, G. Renewable-energy developments in Poland to 2020. Appl. Energy 2003, 76, 101–110. [Google Scholar] [CrossRef]
  39. Igliński, B.; Buczkowski, R.; Kujawski, R.; Cichosz, M.; Piechota, G. Geoenergy in Poland. Renew. Sustain. Energy Rev. 2012, 16, 2545–2557. [Google Scholar] [CrossRef]
  40. Igliński, B.; Buczkowski, R.; Cichosz, M. Biogas production in Poland—Current state, potential and perspectives. Renew. Sustain. Energy Rev. 2015, 50, 686–695. [Google Scholar] [CrossRef]
  41. Igliński, B.; Kujawski, R.; Buczkowski, R.; Cichosz, M. Renewable energy in the Kujawsko-Pomorskie Voivodeship (Poland). Renew. Sustain. Energy Rev. 2010, 14, 1336–1341. [Google Scholar] [CrossRef]
  42. Andrychowicz, M.; Olek, B.; Przybylski, J. Review of the methods for evaluation of renewable energy sources penetration and ramping used in the Scenario Outlook and Adequacy Forecast 2015. Case study for Poland. Renew. Sustain. Energy Rev. 2017, 74, 703–714. [Google Scholar] [CrossRef]
  43. Bugała, A.; Zaborowicz, M.; Boniecki, P.; Janczak, D.; Koszela, K.; Czekała, W.; Lewicki, A. Short-term forecast of generation of electric energy in photovoltaic systems. Renew. Sustain. Energy Rev. 2018, 81, 306–312. [Google Scholar] [CrossRef]
  44. Kupczyk, A.; Mączyńska, J.; Redlarski, G.; Tucki, K.; Bączyk, A.; Rutkowski, D. Selected Aspects of Biofuels Market and the Electromobility Development in Poland: Current Trends and Forecasting Changes. Appl. Sci. 2019, 9, 254. [Google Scholar] [CrossRef] [Green Version]
  45. Piwowar, A.; Dzikuć, M. Development of Renewable Energy Sources in the Context of Threats Resulting from Low-Altitude Emissions in Rural Areas in Poland: A Review. Energies 2019, 12, 3558. [Google Scholar] [CrossRef] [Green Version]
  46. Mardani, A.; Jusoh, A.; Zavadskas, E.K.; Cavallaro, F.; Khalifah, Z. Sustainable and Renewable Energy: An Overview of the Application of Multiple Criteria Decision Making Techniques and Approaches. Sustainability 2015, 7, 13947–13984. [Google Scholar] [CrossRef] [Green Version]
  47. Momete, D.C. Measuring Renewable Energy Development in the Eastern Bloc of the European Union. Energies 2017, 10, 2120. [Google Scholar] [CrossRef] [Green Version]
  48. Muradin, M.; Foltynowicz, Z. Potential for Producing Biogas from Agricultural Waste in Rural Plants in Poland. Sustainability 2014, 6, 5065–5074. [Google Scholar] [CrossRef] [Green Version]
  49. Nasirov, S.; Silva, C.; Agostini, C.A. Investors’ Perspectives on Barriers to the Deployment of Renewable Energy Sources in Chile. Energies 2015, 8, 3794–3814. [Google Scholar] [CrossRef]
  50. Xu, X.; Niu, D.; Qiu, J.; Wu, M.; Wang, P.; Qian, W.; Jin, X. Comprehensive Evaluation of Coordination Development for Regional Power Grid and Renewable Energy Power Supply Based on Improved Matter Element Extension and TOPSIS Method for Sustainability. Sustainability 2016, 8, 143. [Google Scholar] [CrossRef] [Green Version]
  51. Liu, T.; Xu, G.; Cai, P.; Tian, L.; Huang, Q. Development forecast of renewable energy power generation in China and its influence on the GHG control strategy of the country. Renew. Energy 2011, 36, 1284–1292. [Google Scholar] [CrossRef]
  52. Celiktas, M.S.; Kocar, G. From potential forecast to foresight of Turkey’s renewable energy with Delphi approach. Energy 2010, 35, 1973–1980. [Google Scholar] [CrossRef]
  53. Daim, T.; Harell, G.; Hogaboam, L. Forecasting Renewable Energy Production in the US. Foresight 2012, 14, 225–241. [Google Scholar] [CrossRef]
  54. The Polish Investment and Trade Agency. Available online: https://www.paih.gov.pl/sektory/odnawialne_zrodla_energii (accessed on 10 April 2020).
  55. Energy Policy of Poland Until 2030. Available online: http://www.lse.ac.uk/GranthamInstitute/wp-content/uploads/laws/1564%20English.pdf (accessed on 10 April 2020).
  56. Ministry of State Assets. Available online: https://www.gov.pl/web/aktywa-panstwowe/zaktualizowany-projekt-polityki-energetycznej-polski-do-2040-r (accessed on 10 April 2020).
  57. The Data World Bank. Available online: https://databank.worldbank.org/reports.aspx?source=2&series=EG.FEC.RNEW.ZS&country=POL (accessed on 10 April 2020).
  58. Drew, P.J.; Monson, R.T. Artificial neural networks. Surgery 2000, 127, 3–11. [Google Scholar] [CrossRef] [PubMed]
  59. Chen, F.D.; Li, H.; Xu, Z.H.; Hou, S.X.; Yang, D.Z. User-friendly optimization approach of fed-batch fermentation conditions for the production of iturin A using artificial neural networks and support vector machine. Electron. J. Biotechnol. 2015, 18, 273–280. [Google Scholar] [CrossRef] [Green Version]
  60. Li, H.; Chen, F.D.; Cheng, K.W.; Zhao, Z.Z.; Yang, D.Z. Prediction of Zeta Potential of Decomposed Peat via Machine Learning: Comparative Study of Support Vector Machine and Artificial Neural Networks. Int. J. Electrochem. Sci. 2015, 10, 6044–6056. [Google Scholar]
  61. Zhao, M.; Li, Z.; He, W. Classifying Four Carbon Fiber Fabrics via Machine Learning: A Comparative Study Using ANNs and SVM. Appl. Sci. 2016, 6, 209. [Google Scholar] [CrossRef] [Green Version]
  62. Hopfield, J.J. Artificial neural networks. IEEE Circuits Devices Mag. 1988, 4, 3–10. [Google Scholar] [CrossRef]
  63. Dayhoff, J.E.; DeLeo, J.M. Artificial neural networks. Cancer 2001, 91, 1615–1635. [Google Scholar] [CrossRef]
  64. Lula, P.; Tadeusiewicz, R. Wprowadzenie do Sieci Neuronowych; StatSoft: Kraków, Poland, 2001. [Google Scholar]
  65. Tealab, A.; Hefny, H.; Badr, A. Forecasting of nonlinear time series using ANN. Future Comput. Inform. J. 2017, 2, 39–47. [Google Scholar] [CrossRef]
  66. Tutak, M.; Brodny, J. Forecasting Methane Emissions from Hard Coal Mines Including the Methane Drainage Process. Energies 2019, 12, 3840. [Google Scholar] [CrossRef] [Green Version]
  67. Krzemień, A. Dynamic fire risk prevention strategy in underground coal gasification processes by means of artificial neural networks. Arch. Min. Sci. 2019, 64, 3–19. [Google Scholar]
  68. Jasiński, T.; Marszal, A.; Bochenek, A. Selected Applications Artificial Neural Networks on the Currency Market, Forward Market and in Spatial Economy; Politechnika Łódzka: Łódź, Poland, 2016. [Google Scholar]
  69. Bhardwaj, S.; Chandrasekhar, E.; Padiyar, P.; Gadre, V.M. A comparative study of wavelet-based ANN and classical techniques for geophysical time-series forecasting. Comput. Geosci. 2020, 138, 104461. [Google Scholar] [CrossRef]
  70. Yu, C.; Li, Y.; Zhang, M. Comparative study on three new hybrid models using Elman Neural Network and Empirical Mode Decomposition based technologies improved by Singular Spectrum Analysis for hour-ahead wind speed forecasting. Energy Convers. Manag. 2017, 147, 75–85. [Google Scholar] [CrossRef]
  71. Jahangir, H.; Golkar, M.A.; Alhameli, F.; Mazouz, A.; Ahmadian, A.; Elkamel, A. Short-term wind speed forecasting framework based on stacked denoising auto-encoders with rough ANN. Sustain. Energy Technol. Assess. 2020, 38, 100601. [Google Scholar] [CrossRef]
  72. Bajkowski, S.; Górnikowska, B. Hydroenergetics against other sources of renewable energy. Przegląd Nauk. Inżynieria I Kształtowanie Środowiska 2013, 59, 77–87. [Google Scholar]
  73. Kułagowski, W. Hydroenergetics in Poland—current state, development prospects. Gospod. Wodna 2001, 3, 119–123. [Google Scholar]
  74. Kowalczyk, K.; Cieśliński, R. Analysis of the hydroelectric potential and the possibilities of its use in the Pomeranian voivodeship. Water-Environ. Rural Areas 2018, 18, 69–86. [Google Scholar]
  75. Kalda, G. Analysis of the hydropower industry in Poland. J. Civ. Eng. Environ. Archit. 2014, 61, 81–92. [Google Scholar] [CrossRef]
  76. Directive 2009/28/EC of the European Parliament and of the Council of 23 April 2009 on the Promotion of the Use of Energy from Renewable Sources and Amending and Subsequently Repealing Directives 2001/77/EC and 2003/30/EC. Available online: https://eur-lex.europa.eu/legal-content/EN/ALL/?uri=CELEX:32009L0028 (accessed on 10 April 2020).
  77. EUCALC. Available online: http://www.european-calculator.eu/ (accessed on 10 May 2020).
Figure 1. Total energy supply from renewable energy sources (RES) in Poland (own elaboration based on data from [26]).
Energies 13 02539 g001
Figure 2. Percentage share of electricity produced from RES in Poland and the EU countries (own elaboration based on data from [26]).
Energies 13 02539 g002
Figure 3. The course of changes in the amount of energy produced from RES and its impact on the emission of harmful gases (own elaboration based on data from [26,29]).
Energies 13 02539 g003
Figure 4. Location of Poland in Europe and RES installations in Poland (own elaboration based on [54]).
Energies 13 02539 g004
Figure 5. Assumptions for Poland’s energy policy regarding the use of energy from RES until 2040 according to [56] (own elaboration based on [56]).
Energies 13 02539 g005
Figure 6. The relationship between selected variables determining the volume of energy production from RES in Poland. (a) Correlation between renewables and biofuels and primary solid biofuels; (b) correlation between wind and solar energy; (c) correlation between primary solid biofuels and biogases; (d) correlation between geothermal and primary solid biofuels (own elaboration).
Energies 13 02539 g006
Figure 7. The basic structure of a neural network (own elaboration).
Energies 13 02539 g007
Figure 8. Construction of the Multi-layer perceptron (MLP) network with one hidden layer (own elaboration).
Energies 13 02539 g008
Figure 9. Diagram of the research procedure (own elaboration).
Energies 13 02539 g009
Figure 10. Actual and predicted volume of renewable energy production in Poland (own elaboration).
Energies 13 02539 g010
Figure 11. Actual and predicted volume of hydro energy production in Poland (own elaboration).
Energies 13 02539 g011
Figure 12. Actual and predicted volume of geothermal energy production in Poland (own elaboration).
Energies 13 02539 g012
Figure 13. Actual and predicted volume of wind energy production in Poland (own elaboration).
Energies 13 02539 g013
Figure 14. Actual and predicted volume of solar thermal production from photovoltaic energy in Poland (own elaboration).
Energies 13 02539 g014
Figure 15. Actual and predicted volume of primary solid biofuels energy production in Poland (own elaboration).
Energies 13 02539 g015
Figure 16. Actual and predicted volume of other liquid biofuel energy production in Poland (own elaboration).
Energies 13 02539 g016
Figure 17. Actual and predicted volume of biogas energy production in Poland (own elaboration).
Energies 13 02539 g017
Figure 18. Actual and predicted volume of renewable municipal waste energy production in Poland (own elaboration).
Energies 13 02539 g018
Figure 19. Predicted versus actual values of the volume of renewables and biofuels energy production (a), hydro energy production (b), geothermal energy production (c), wind energy production (d), solar thermal and photovoltaic energy production (e), primary solid biofuels energy production (f), other liquid biofuels energy production (g), biogases energy production (h) and renewable municipal waste energy production (i) (own elaboration).
Energies 13 02539 g019aEnergies 13 02539 g019b
Figure 20. Histograms of the actual and predicted values of renewables and biofuels energy production (a), hydro energy production (b), geothermal energy production (c), wind energy production (d), solar thermal and photovoltaic energy production (e), primary solid biofuels energy production (f), other liquid biofuels energy production (g), biogases energy production (h) and renewable municipal waste energy production (i) (own elaboration).
Energies 13 02539 g020aEnergies 13 02539 g020b
Figure 21. Actual and predicted share of energy from RES in gross final energy consumption (own elaboration).
Energies 13 02539 g021
Figure 22. Predicted versus actual values of the share of energy from RES in gross final energy consumption (own elaboration).
Energies 13 02539 g022
Figure 23. Histogram of the actual and predicted values of the share of energy from RES in gross final energy consumption (own elaboration).
Energies 13 02539 g023
Table 1. The structure of renewable energy production from selected sources in Poland between 1990–2018 (own elaboration based on data from [26]).
YearRenewables and BiofuelsHydroGeothermalWindSolar Thermal and PhotovoltaicPrimary Solid BiofuelsOther Liquid BiofuelsBiogasesRenewable Municipal Waste
Thousand Tonnes of Oil Equivalent (TOE)
19901581.603123.7830001448.43309.3870
19911355.546122.5280001228.48004.5380
19921496.088129.5790001361.01605.4930
19933925.738127.9450003796.31201.4810
19943847.349149.0110003692.24706.0910
19953924.018162.25300.08603748.519013.1600
19963868.649166.03600.00003685.225017.3880
19973866.886168.61600.17203680.997017.1010
19983916.280198.53800.34403696.355021.0420
19993752.804185.29700.34403541.846025.1740.143
20003801.557181.0832.9620.43003587.298028.9240.860
20014070.756199.9142.8661.20403831.231035.2780.263
20024142.185195.9596.2825.2450.0243902.121032.3160.239
20034148.118143.6807.42810.6620.0243918.983038.7890.334
20044320.780178.9977.59512.2370.0964061.718046.3600.310
20054486.514189.24211.36911.6480.1434166.213053.5730.717
20064694.944175.58812.77822.0190.2634323.923062.4100.717
20074823.745202.24710.48544.8480.3584394.597064.6790.836
20085559.413185.05212.68371.9521.294750.669096.1590.215
20096265.283204.22514.33192.6298.0015190.1690.75798.0220.693
20107293.909251.07013.447143.10710.0325866.1990.220114.5742.938
20117966.178200.46312.683275.54212.4836350.6260.549136.90631.958
20128644.125175.12915.788408.13314.9066987.7230.065167.98032.483
20138606.385209.70518.582516.23424.8486836.7970.173181.35633.223
20148652.992187.65720.230659.98535.3456755.3980.089207.43836.878
20159019.135157.54021.711933.65149.8926883.6341.520228.83839.959
20168805.893183.95922.2131082.33862.9346620.1631.793261.05961.049
20178970.596220.08422.5841281.94768.6956340.9361.888280.57692.452
20189084.209169.38923.6711100.49882.7626347.2281.937288.33798.327
Table 2. Basic statistical parameters of studied variables (own elaboration).
VariableMeanMedianMinimumMaximumSumaStandard DeviationCoefficient of Variation, %SkewnessKurtosis
Thousand Tonnes of Oil Equivalent (TOE)
Renewables and Biofuels5341.0924320.7801355.5469084.209154891.72435.63145.600.31−1.05
Hydro177.399181.083122.528251.0705144.630.08916.96−0.050.23
Geothermal8.9557.5950.00023.671259.78.43794.220.35−1.30
Wind230.18111.6480.0001281.9476675.3393.830171.101.691.54
Solar themral and photovoltaic12.8310.0960.00082.762372.123.646184.291.942.68
Primary solid biofuels4517.0714061.7181228.4806987.723130995.11651.15036.55−0.16−0.44
Other liquid biofuels0.3100.0000.0001.9379.00.627202.261.992.48
Biogases87.73946.3601.481288.3372544.491.368104.141.07−0.16
Renewable municipal waste14.9860.3340.00098.327434.627.761185.252.003.40
Table 3. Linear correlations of the variables (own elaboration).
VariableRenewables and BiofuelsHydroGeothermalWindSolar Themral and PhotovoltaicPrimary Solid BiofuelsOther Liquid BiofuelsBiogasesRenewable Municipal Waste
Renewables and Biofuels1.000.550.920.830.790.980.690.930.78
Hydro0.551.000.470.230.210.590.190.400.22
Geothermal0.920.471.000.830.810.870.730.940.78
Wind0.830.230.831.000.980.730.910.960.96
Solar Themral and Photovoltaic0.790.210.810.981.000.680.930.930.97
Primary Solid Biofuels0.980.590.870.730.681.000.580.860.68
Other Liquid Biofuels0.690.190.730.910.930.581.000.840.88
Biogases0.930.400.940.960.930.860.841.000.92
Renewable Municipal Waste0.780.220.780.960.970.680.880.921.00
Table 4. List of neural network structures used for research together with the results of training tests (own elaboration).
Forecast VariantNetwork StructureCorrelation CoefficientMatching ErrorActivation Function—Neurons
LearningTestLearningTestHiddenOutput
Renewables and biofuelsMLP 9-5-10.9270.93422,473.1014,457.60exponentialexponential
HydroMLP 8-7-10.6300.62155.046129.812logisticlinear
GeothermalMLP 8-12-10.9160.9590.0991.041logisticexponential
WindMLP 8-7-10.9720.9871712.202731.323exponentialexponential
Solar thermal and photovoltaicMLP 8-5-10.9770.9885.2632.887exponentialexponential
Primary solid biofuelsMLP 7-5-10.9050.9008695.7441942.004hyperbolic tangentexponential
Other liquid biofuelsMLP 9-14-10.9370.6090.0180.012logisticlinear
BiogasesMLP 8-10-10.9480.97335.10755.967hyperbolic tangentlinear
Renewable municipal wasteMLP 8-8-10.9650.97813.0003.815logisticexponential
Table 5. Summary of errors (own elaboration).
Forecast VariantMEMPE, %MAEMAPE, %
Renewables and biofuels13.900.38163.453.07
Hydro2.801.059.725.43
Geothermal0.254.400.496.39
Wind−0.01−13.7723.8716.54
Solar thermal and photovoltaic−0.05−3.411.738.71
Primary solid biofuels19.460.48126.982.93
Other liquid biofuels0.02−5.390.0719.19
Biogases1.111.416.569.75
Renewable municipal waste0.55−13.242.1420.74
Table 6. Parameters of the network structure to predict the share of energy from RES in gross final energy consumption by 2025 (own elaboration).
Forecast VariantNetwork StructureCorrelation CoefficientMatching ErrorActivation Function—Neurons
LearningTestLearningTestHiddenOutput
Share of energy from renewable sourcesMLP 10-13-10.8740.8680.0480.049sinusoidalexponential
Table 7. Summary of errors (own elaboration).
Forecast VariantMEMPE, %MAEMAPE, %
Share of energy from renewable sources−0.08−5.670.4710.72

