Article

Experimental Investigation of Natural Lighting Systems Using Cylindrical Glass for Energy Saving in Buildings

by
Atthakorn Thongtha
* and
Piromporn Boontham
Department of Physics, Faculty of Science, Naresuan University, Phitsanulok 65000, Thailand
*
Author to whom correspondence should be addressed.
Energies 2020, 13(10), 2528; https://doi.org/10.3390/en13102528
Submission received: 21 April 2020 / Revised: 11 May 2020 / Accepted: 13 May 2020 / Published: 16 May 2020
(This article belongs to the Special Issue Green Energy Technology)

Abstract

:
This research focuses on the use of natural lighting integrated into buildings. Cylindrical glass was fitted into the top of our test model, which was 1 m × 1 m × 1 m, which enhanced the light inside it. The glass fitted comprised a single layer (G), two layers (2G), or two layers of glass filled with distilled water (2GW). Each combination of glass increased the number of glass cylinders from two to six. The nine formats were tested indoors using a light intensity of 1000 W/m2 and the temperature was controlled at 25 °C. The lowest temperature averaged 34.4 °C, which was recorded using only two glass cylinders that had two layers of glass filled with distilled water. The average internal illumination was 549 lux, which agreed with the CIE standard. Then, the two layers of glass filled with water were examined under natural conditions. It was found that the highest average inside temperature was 40.4 °C at 1:30 p.m. The average illuminant values for three days were in the range of 300–500–750 lux, which concurred with the CIE standard. Additionally, the use of the 2S-2GW resulted in the conservation of electrical energy consumed by the cooling load and the illumination of the building between 9:00 a.m. and 3:00 p.m.

1. Introduction

Building energy consumption figures have risen from 26% in 1980 to 54% in 2010 and are predicted to rise to 84% in 2050. They will continuously increase day by day because of the rise in population, the growth of modern society, and quality of life improvements [1,2]. Lighting in offices contributes to approximately 30% of the total energy consumption in buildings [3,4,5,6]. In recent years, buildings have been appropriately developed, constructed, and maintained so as to supply their inhabitants with a better environment quality and electrical energy conservation through optimal design and functional practices [6,7].
Natural daylight is a very important source of illumination in buildings because it is free and helps reduce energy consumption [8,9,10]. Sufficient and effective daylight utilization results in energy saving. The use of natural daylight in buildings will also be significant for the visual and physical comfort and health of the people working within them [6,11,12,13,14]. The advance of daylight investigation contributes to energy conservation, improves human welfare, enhances physiological capacities, and avoids disease. One of the consequences of the adjustment of the human eyes to light over time is visual ability, and subsequently, the significant function of the psychophysical levels of daylight for numerous activities is affected. Undoubtedly, daylight conditions can impact the inhabitants of buildings both mentally and physically. Many studies have proven that the hormone melatonin is suppressed by daylighting, which enables us to improve regular light–dark rhythms that can help individuals gain satisfactory rest [15,16,17,18]. Daylighting will be used for various applications and it has outstanding solutions to reduce energy consumption for internal building areas. The regular daylight system comprises a top skylight and a window. Windows allow natural light to illuminate the interior of a building while also allowing for the transfer of heat. Some areas of a building cannot be reached by natural light, so they do not heat up as much as the external parts of the structure [19]. The effects of inadequate daylight deeper in a building necessitate extra use of electricity from lighting, which contributes to approximately 30% of total energy consumption [20].
The conservation of artificial lighting during the daytime allows for great energy saving [21,22]. Architectural structures can be designed to provide adequate and efficient daylight for the internal areas of a building, which will result in energy conservation [19,23,24,25,26]. Daylight illuminates the inside of a building and transfers infrared radiation, which can be significantly absorbed by water vapor in the air, which is an important cause of thermal gain in buildings [27,28]. As a result of excessive heat gain in the building, ventilating fans and air conditioners are essential for providing a cool, controlled environment, removing the hot air from the building, or cooling the interior air. This is necessary for providing a comfortable environment for the inhabitants. This requires significant power consumption. To significantly reduce thermal accumulation in buildings and appropriately utilize natural lighting, the top of the test box was designed and constructed using wood and glass cylinders filled with distilled water. Our experiment concentrated on testing both thermal performance and the amount of natural light inside the box by using various glass cylinders that were constructed to meet the required heat transfer reduction and energy conservation levels within buildings.

2. Materials and Methods

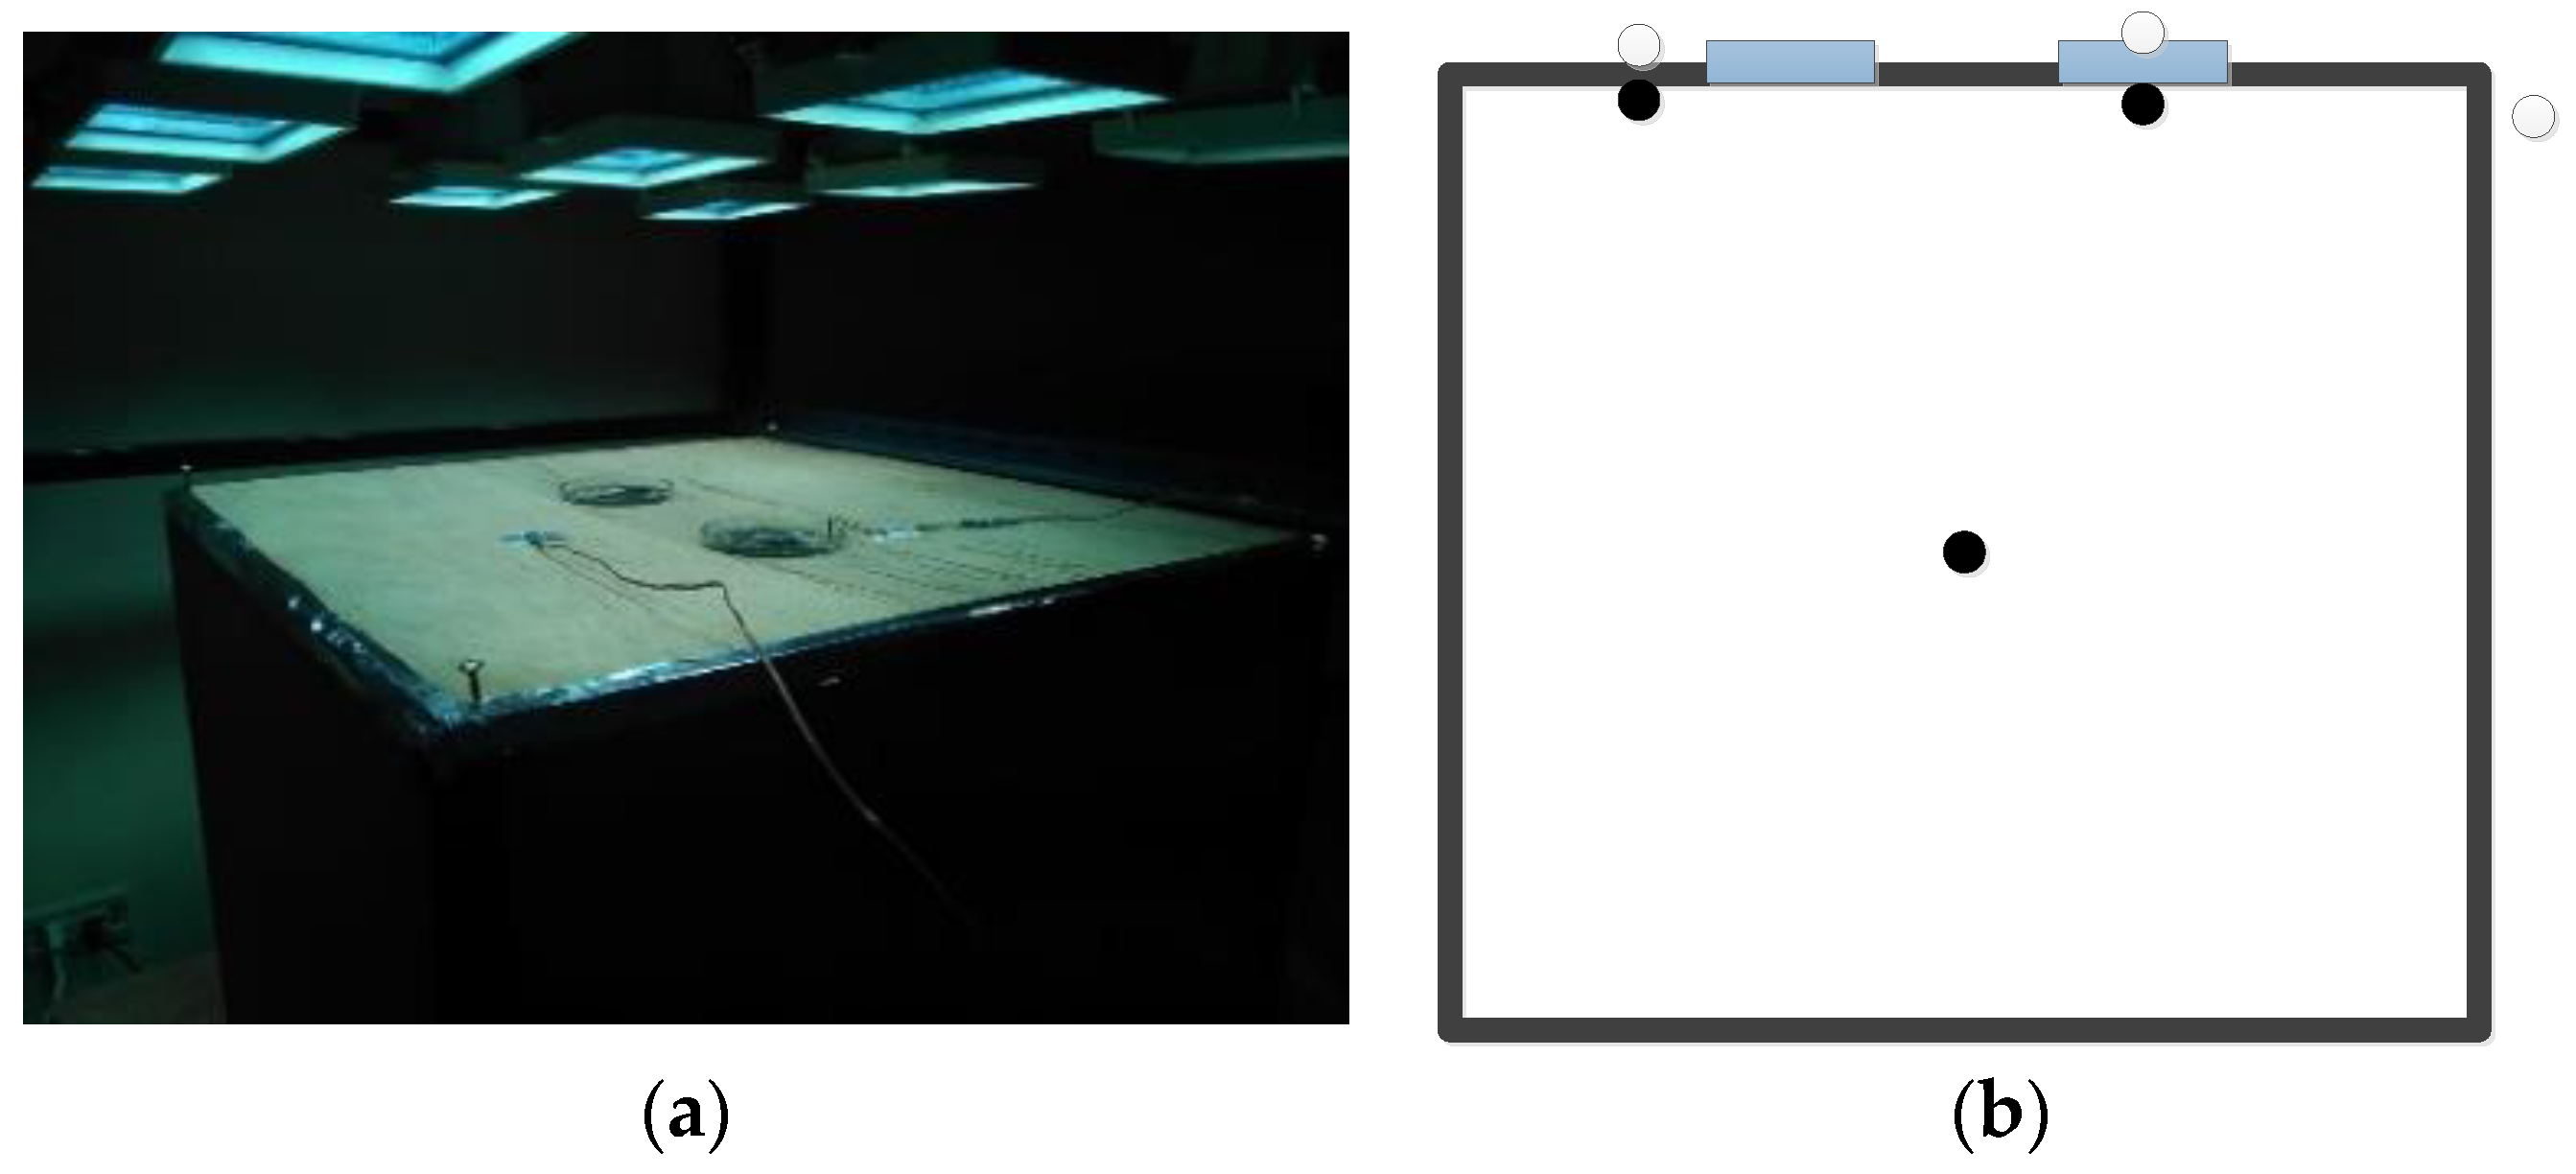
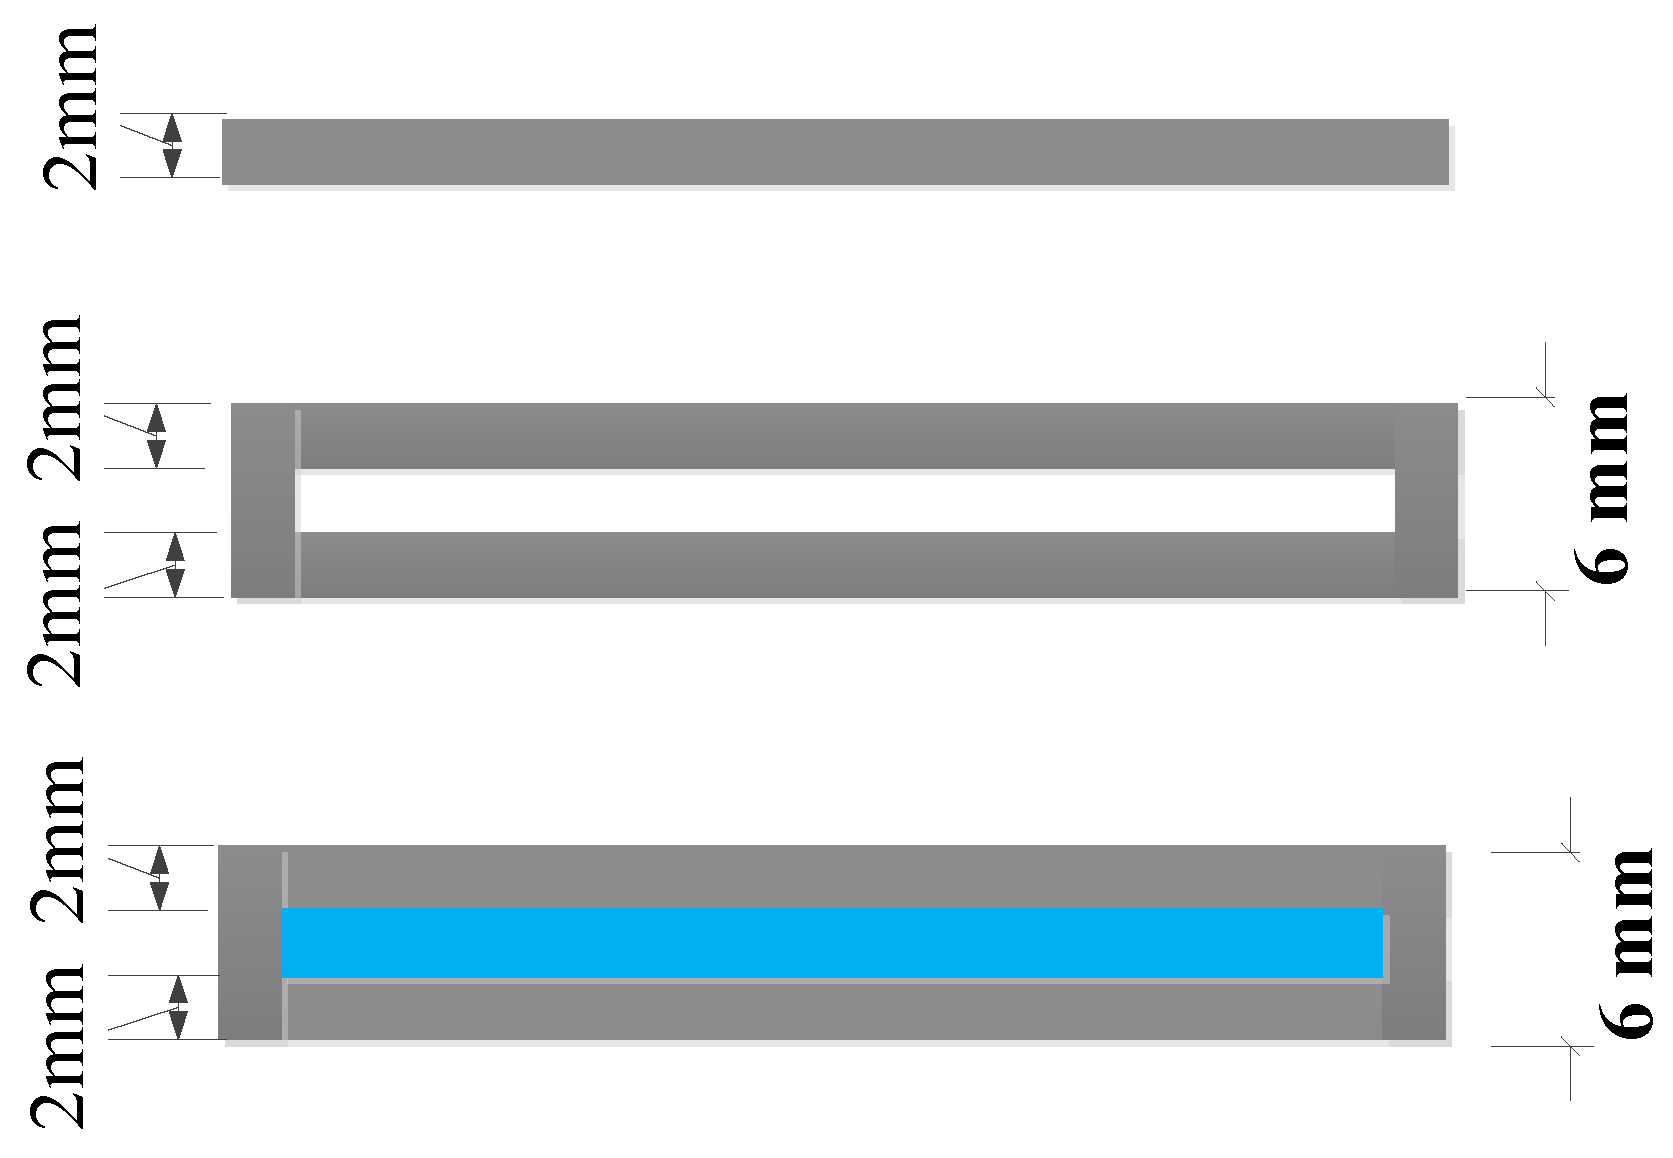
2.1. Testing Model Design, Temperature, and Illuminant Measurements under Controlled Conditions

The thermal and illuminant performance of our model, which was constructed from wood on five sides and insulated using polyethylene sheets with different configurations of glass inserted into the top of the box, were investigated using nine different cylindrical glass designs. The dimensions of our model had an area of 1 m2, and a volume of 1 m3, as shown in Figure 1. The top of the testing unit was interchanged using two glass cylinders (2S), four glass cylinders (4S), and six glass cylinders (6S) to allow light to enter the box, creating illumination within it. Each glass design was constructed as either a single layer of glass (G), two layers of glass (2G) or two layers of glass filled with distilled water (2GW), as shown in Figure 2. Insolation was provided by nine 500 W halogen lamps placed 0.25 m away from the top of the unit. The nine lamps were calibrated to deliver a light intensity of 1000 W/m2, which was regulated using a basic voltage control device. K-type thermocouples with an accuracy of ±0.5 °C were employed to measure the temperature changes, and were attached to both the exterior and interior surfaces of the glass and the top of the unit using thermal paste to ensure good thermal contact, and were insulated using aluminum foil tape. The ambient temperature in the laboratory was set at approximately 25 °C using an air conditioner. The temperature inside the box was measured by suspending a thermocouple in the center of it. All data were recorded at 2 min intervals continuously for 3 h using a data logger, and the illuminance was measured using a lux meter (DIGICON LX-70).

2.2. Testing the Boxes’ Thermal Behaviors and Illuminant Measurements under Natural Light and Weather Conditions

The following experiment was conducted under natural light and weather conditions. The surrounding solar radiation intensity swung from 0 to 0.840 kW/m2 throughout the day between 6:00 a.m. to 6:00 p.m. The surrounding temperature fluctuated between ~24 °C in the morning and the maximum value of approximately 35.8 °C at around 1:00 p.m. Wind speed surrounding the testing area was between 0.10 and 3.50 m/s. The thermal and illuminant performance of the optimum model was further studied using two experimental boxes, as shown in Figure 3. Both test boxes were built to the same specifications using identical materials. The ambient temperature, internal temperature, and exterior and interior surface temperatures of the top of the units were measured and recorded at 5 min intervals continuously for 12 h in actual ambient conditions. A pyranometer was set in an outdoor area to measure the solar radiation intensity, and the wind speed was recorded using an anemometer. The illuminance measurement was recorded using a lux meter (DIGICON LX-70).

3. Results and Discussion

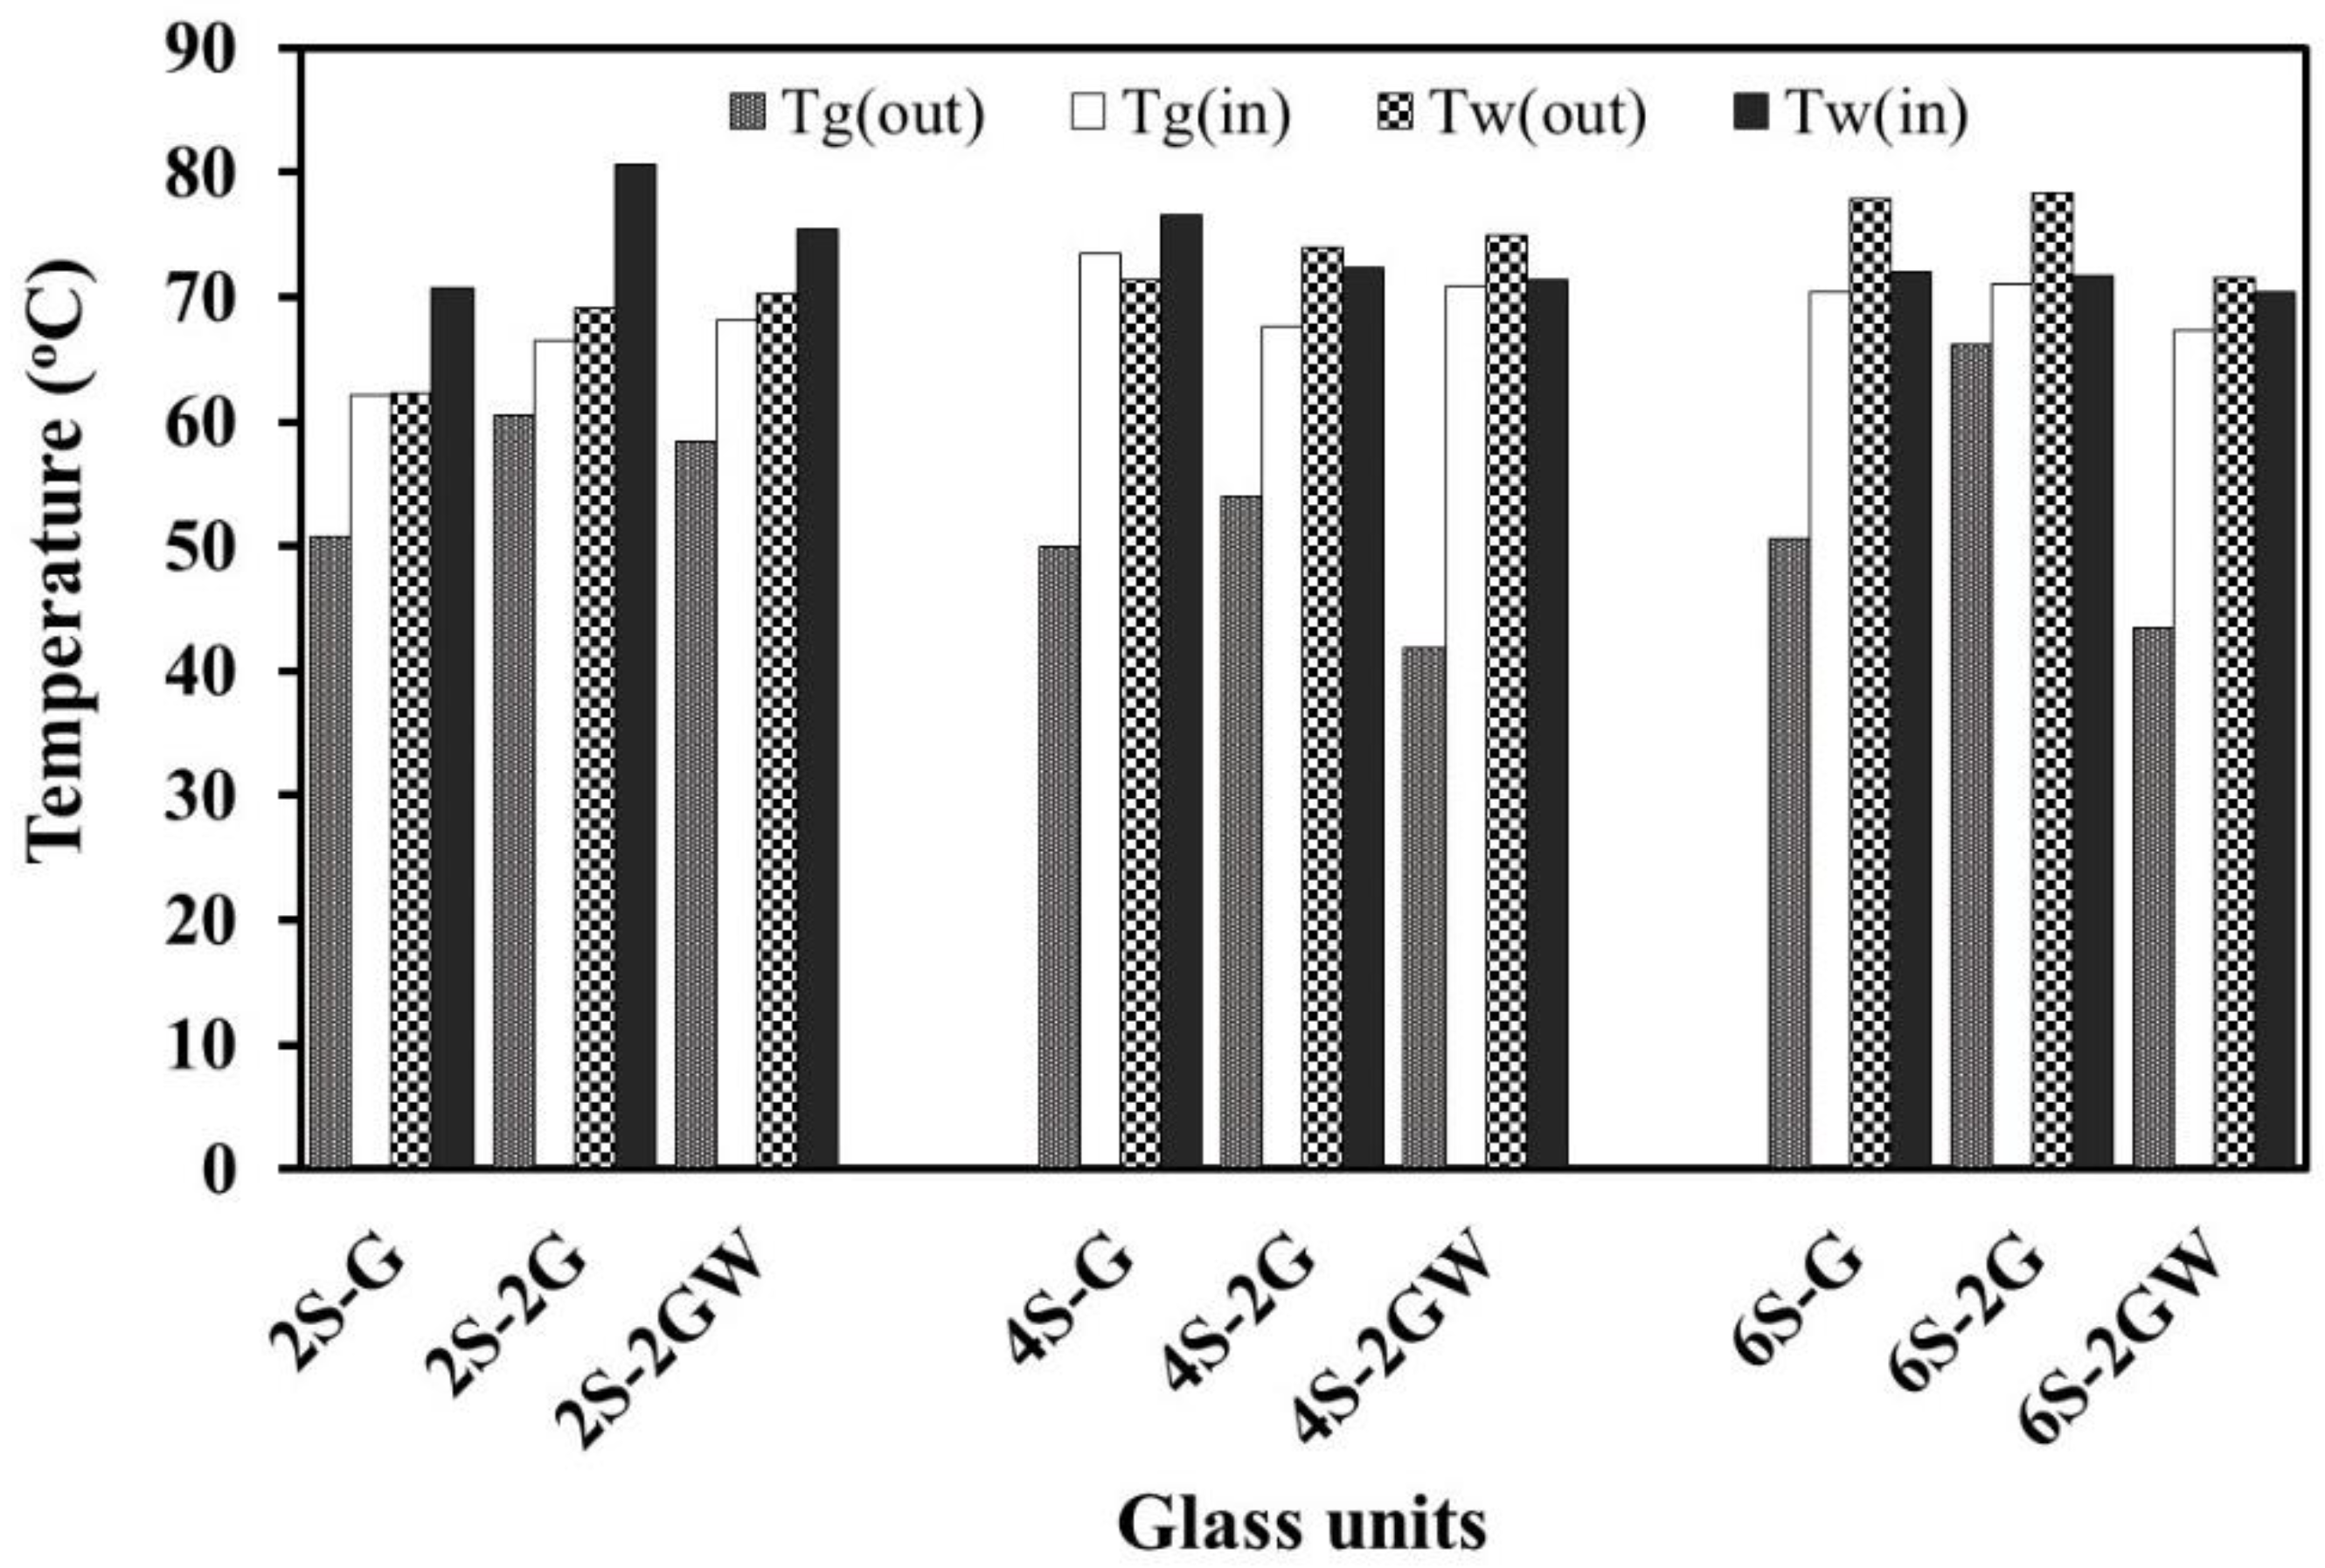
3.1. Surface Temperatures on the Top and Internal Temperatures of Each Model under Controlled Conditions

The exterior (Tgo) and interior (Tgi) glass surface temperatures on the top of the box, the exterior (Two) and interior (Twi) surface temperatures of the wooden top, and the internal temperature (Tr) and ambient temperature (Ta) of the testing model, using two glass units constructed from two layers of glass sealed with air inside (2S-2G), are shown in Figure 4. While controlling the artificial light intensity at 1000 W/m2, the temperature variations in each position were observed for 180 min. When the testing time exceeded 40 min, the temperature in each location remained stable. The temperature values for longer than 40 min were calculated to determine the average temperatures in each position, as exhibited in Figure 5 and Figure 6. For the 2S-2G, the average temperatures of Tgo, Tgi, Two, Twi, Tr, and Ta were approximately 58.7 °C, 63.5 °C, 66.8 °C, 77.7 °C, 37.2 °C, and 24.9 °C, respectively, as shown in Figure 4, Figure 5 and Figure 6. The average temperatures of the other glass units were similar to those of the 2S-2G, as exhibited in Figure 5 and Figure 6.
The internal temperatures of the 2S-G, 2S-2G, 2S-2GW, 4S-G, 4S-2G, 4S-2GW, 6S-G, 6S-2G, and 6S-2GW, increased until they reached a steady value at a testing time of longer than 40 min, as shown in Figure 4. The average internal unit temperatures of the models were approximately 35.6 °C, 37.2 °C, 34.4 °C, 38.0 °C, 38.8 °C, 37.8 °C, 38.0 °C, 38.4 °C, and 36.3 °C, respectively, as shown in Figure 6. It was observed that the internal temperature of the 2S-2GW was lower than those of the 2S-G, 2S-2G, 4S-G, 4S-2G, 4S-2GW, 6S-G, 6S-2G, and 6S-2GW units, which were 1.2 °C, 2.8 °C, 3.6 °C, 4.4 °C, 3.4 °C, 3.6 °C, 4.0 °C and 1.9 °C, respectively. The two glass units constructed from two layers of glass sealed with distilled water inside (2S-2GW) reduced the inside unit temperature by more than 3% when compared with the other glass units. This demonstrated that a decrease in heat propagation from the exterior surface to the interior was achieved in the test unit. This clearly indicates that the optimum glass units, which were filled with distilled water, demonstrated optimal insulating properties, which led to a reduction in the heat transmission load. The lower interior temperature of the box created by the 2S-2GW unit could lead to energy savings in buildings and a significant reduction in the yearly peak cooling requirement [29,30,31].

3.2. Indoor Illuminance under Controlled Conditions

The average illuminances of the nine different glass designs (2S-G, 2S-2G, 2S-2GW, 4S-G, 4S-2G, 4S-2GW, 6S-G, 6S-2G, and 6S-2GW) are shown in Figure 7. When using the 2S-G, 2S-2G, and 2S-2GW in a two-unit configuration, the average interior illuminances decreased from 710 lux to 549 lux, respectively. The average illuminances of the 4S and 6S were similar to those of the 2S, as displayed in Figure 7. Although the average interior illuminances decreased when the model of the two layers of glass filled with distilled water was used instead of the single glass unit, the illuminance level of this configuration was in the range of 300–500–750 lux, which is also based on the International Commission on Illumination standard. Additionally, this unit reduced the room temperature by more than 3% when compared with the single glass unit. When using the single layer of glass in a configuration of two, four, or six units, the average illuminance values increased from 710 lux to 748 lux, respectively, as shown in Figure 7. For the cases of the two-layer glass (2G) and the one filled with distilled water (2GW), the average illuminances were similar to that of a single layer of glass (G), as shown in Figure 7. This demonstrated that an increase in the number of glass units directly increased the illumination. The average interior illuminance of each of the nine configurations was in the range of 300–500–750 lux, which achieved the International Commission on Illumination standard (CIE standard).

3.3. Comparison of Thermal Behavior and Inside Illuminance under Natural Weather Conditions

The difference between the thermal behaviors and interior illuminance of two of the models was investigated using two glass units, with two layers of glass filled with distilled water (2S-2GW) in only one of the models under natural weather conditions, which were concurrently tested from 6:00 a.m. to 6:00 p.m. daily for three days, giving a 12 h test cycle (29 October, 31 October, and 4 November 2019). The fluctuations in the solar radiation, ambient temperature, interior surface temperature, exterior surface temperature, and room temperature of the two models were examined and compared, as illustrated in Figure 8, Figure 9, Figure 10 and Figure 11 and Table 1 and Table 2.

3.3.1. Surface Temperature Fluctuation

Periodically, clouds altered the intensity of solar radiation throughout the day from 6:00 a.m. to 6:00 p.m. with a maximum intensity of approximately 0.840 kW/m2 at around midday, as shown in Figure 8, Figure 9 and Figure 11. The surrounding temperature was affected by both the weather conditions and the wind speed which was recorded at 0.10 to 3.50 m/s. The surrounding temperature fluctuated between ~24 °C in the morning, around 6:00 a.m., and approximately 35.8 °C at around 1:00 p.m.
The surface temperature fluctuation of the reference model is shown in Figure 8 and Table 1. The average maximum exterior and interior temperatures of the wooden top, and the ambient temperatures for three days reached as high as 47.6 °C, 50.7 °C, and 35.8 °C, at around 12:00, 12:30, and 1:00 p.m., respectively, and then decreased in value. The average exterior and interior surface temperatures of the wooden top, and the ambient temperatures for three days, were approximately 36.3 °C, 38.1 °C and 31.2 °C, as listed in Table 2, which were observed consecutively from 6:00 a.m. to 6:00 p.m. each day.
The surface temperature variation of the 2S-2GW model is exhibited in Figure 9 and Table 1. The average highest exterior and interior temperatures of the wooden top, and the glass top, including the ambient temperatures for three days, reached as high as 43.8 °C, 50.1 °C, 39.5 °C, 48.1 °C, and 35.8 °C, at around 12:00 p.m., 1:00 p.m., 12:00 p.m., 1:00 p.m., and 1:00 p.m., respectively, and then decreased in value, while the overall averages were approximately 34.7 °C, 38.2 °C, 33.0 °C, 38.3 °C, and 31.2 °C, respectively, as shown in Table 2, which were observed consecutively from 6:00 a.m. to 6:00 p.m. each day.

3.3.2. Temperature Gradient

The temperature gradients on both the interior and exterior surfaces of the top of the two test units were investigated for three days, as shown in Figure 10. The temperature gradients on the top surface of the units were positive when the outer surface temperatures were higher than those inside, while the temperature gradients on the top surfaces were negative when the outer surface temperatures were less than those of the interior. The temperature gradients of the 2S-2GW and reference models had a positive gradient of temperature for three days, with the highest average values being approximately 23 °C/m and 26 °C/m around midday, which then decreased in value during the afternoon. The temperature gradients of the top of the 2S-2GW glass units after 9:00 a.m. were negative when the temperature on the outer surface was lower than that of the inside of the model. The average maximum negative value on the top of the 2S-2GW glass unit surfaces was approximately 15 °C/m. This shows that the heat from the surrounding weather can obviously transfer to the inside of the box during the daytime, while part of the heat can flow through the glass and back into the ambient weather at the same time. This relates to a decrease in heat accumulation within the box when using the 2S-2GW glass unit, and implies a conservation of energy consumption from cooling loads in buildings, which is clearly a significant result.

3.3.3. Indoor Space Temperature and Illuminance

Figure 11 presents the variations of the inside space temperatures of the 2S-2GW and reference models. The natural fluctuation in solar radiation, surrounding temperature, and exterior and interior surface temperatures on the top of the boxes affected the inside space temperatures, which varied throughout the day, and were recorded from 6:00 a.m. to 6:00 p.m. for three days. It was observed that the inside temperatures of the two test units were approximately equal between 6:00 a.m. and 10:00 a.m., and then after 10:30 a.m. their temperatures started to diverge, which was due to different peak temperatures being reached at various times. The interior temperatures of the 2S-2GW and reference units rose more rapidly, and achieved the highest peak value of 40.4 °C and 41.4 °C, as shown in Table 1, which averaged at 12:30 p.m. and 12:00 p.m., respectively. The average inside temperatures of the 2S-2GW and reference test unit were 34.3 °C and 34.8 °C, respectively, over a period of three days, as shown in Table 2. It was observed that the peak and average temperatures inside the 2S-2GW were lower than the reference model by around 1.0 °C and 0.5 °C, which demonstrates a decrease in heat propagation from the exterior surface to the interior. Using the 2S-2GW glass units to reduce the temperature in a room allows for energy saving in buildings and a significant decline in the yearly peak cooling requirement [29,30,31].
The average indoor illuminance of the 2S-2GW is shown in Figure 12. The average indoor illuminance increased and reached its highest at around midday, and then dropped in value, which was recorded between 300 and 750 lux from 9:00 a.m. to 3:00 p.m. The interior illuminance of the 2S-2GW glass unit was in the range 300–500–750 lux, which adhered to the International Commission on Illumination standard (CIE standard). If this glass unit was to be adopted into buildings according to geographical locations in the tropics, the energy consumption reduction in both the cooling load of air conditioners and artificial lighting would be achieved, creating a significant decline in the yearly peak energy consumption requirement. Although a life cycle assessment of the 2S-2GW roof window costs has not been investigated in this specific context, we may analyze a more widespread context in the next work. In view of long-term benefits, the design using the two glass units that had two layers of glass filled with distilled water can reduce the internal space temperature at the highest peak and provide adequate and efficient daylight illuminance, which leads to this new form of knowledge.

4. Conclusions

This paper contained sufficient contributions which were based on sound scientific knowledge. The application of natural light integrated into the test box was successfully investigated by using the novel glass units, which provided adequate and efficient daylight illuminance into its interior and decreased heat transmission through the building frames. The average highest room temperature of the two glass units that had two layers of glass filled with distilled water decreased the value at the highest peak of the day by 1.0 °C when compared with that of the reference testing model under natural weather conditions. The average internal illuminant values for three days were in the range of 300 to 750 lux from 9:00 a.m. to 3:00 p.m., which agreed with the standard of the International Commission on Illumination. Lower room temperatures were achieved by utilizing the integration of natural light into buildings which led to the conservation of energy consumption from the cooling load of air conditioners and lighting systems. This demonstrates a significant decline in yearly peak cooling and lighting energy consumption.

Author Contributions

Conceptualization, A.T.; methodology, A.T. and P.B.; formal analysis, A.T. and P.B.; investigation, A.T. and P.B.; resources, A.T.; data curation, A.T.; writing—original draft preparation, A.T. and P.B.; writing—review and editing, A.T.; visualization, A.T.; supervision, A.T.; project administration, A.T.; funding acquisition, A.T. All authors have read and agreed to the published version of the manuscript.

Funding

This research was funded by the Faculty of Science, Naresuan University, grant number R2563E026.

Acknowledgments

The authors would like to thank the Thailand Research Fund (TRF), the Faculty of Science, Naresuan University for providing financial support to this research work, and their research center. Thanks are given to Peter Barton from the Division of International Affairs and Language Development (DIALD), Naresuan University, for editing the English in this document.

Conflicts of Interest

The authors declare no conflict of interest.

References

  1. Ürge-Vorsatz, D.; Cabeza, L.F.; Serrano, S.; Barreneche, C.; Petrichenko, K. Heating and cooling energy trends and drivers in buildings. Renew. Sustain. Energy Rev. 2015, 41, 85–98. [Google Scholar] [CrossRef] [Green Version]
  2. Ürge-Vorsatz, D.; Petrichenko, K.; Staniec, M.; Eom, J. Energy use in buildings in a long-term perspective. Curr. Opin. Environ. Sustain. 2013, 5, 141–151. [Google Scholar] [CrossRef]
  3. Caicedo, D.; Pandharipande, A.; Willems, F.M. Daylight-adaptive lighting control using light sensor calibration prior-information. Energy Build. 2014, 73, 105–114. [Google Scholar] [CrossRef]
  4. Doulos, L.T.; Sioutis, I.; Tsangrassoulis, A.; Canale, L.; Faidas, K. Revision of threshold luminance levels in tunnels aiming to minimize energy consumption at no cost: Methodology and case studies. Energies 2020, 13, 1707. [Google Scholar] [CrossRef] [Green Version]
  5. Alrubaih, M.S.; Zain, M.F.M.; Alghoul, M.A.; Ibrahim, N.L.N.; Shameri, M.A.; Elayeb, O. Research and development on aspects of daylighting fundamentals. Renew. Sustain. Energy Rev. 2013, 21, 494–505. [Google Scholar] [CrossRef]
  6. Yoo, S.; Kim, J.; Jang, C.Y.; Jeong, H. A sensor-less LED dimming system based on daylight harvesting with BIPV systems. Opt. Express 2014, 22, A132–A143. [Google Scholar] [CrossRef]
  7. Saxena, R.; Biplab, K.; Rakshit, D. Quantitative assessment of phase change material utilization for building cooling load abatement in composite climatic condition. J. Sol. Energy Eng. 2017, 140, 1–15. [Google Scholar] [CrossRef]
  8. Kim, I.T.; Kim, Y.S.; Cho, M.; Nam, H.; Choi, A.; Hwang, T. High-performance accuracy of daylight-responsive dimming systems with illuminance by distant luminaires for energy-saving buildings. Energies 2019, 12, 731. [Google Scholar] [CrossRef] [Green Version]
  9. Kim, C.H.; Kim, K.S. Development of sky luminance and daylight illuminance prediction methods for lighting energy saving in office buildings. Energies 2019, 12, 592. [Google Scholar] [CrossRef] [Green Version]
  10. Freewan, A.A.Y. Impact of external shading devices on thermal and daylighting performance of offices in hot climate regions. Sol. Energy 2014, 102, 14–30. [Google Scholar] [CrossRef]
  11. Berardi, U.; Wang, W. Daylighting in an atrium-type high performance house. Build. Environ. 2014, 76, 92–104. [Google Scholar] [CrossRef]
  12. Kwon, C.W.; Lee, K.J. Integrated daylighting design by combining passive method with daysim in a classroom. Energies 2018, 11, 3168. [Google Scholar] [CrossRef] [Green Version]
  13. Kaminska, A.; Ożadowicz, A. Lighting control including daylight and energy efficiency improvements analysis. Energies 2018, 11, 2166. [Google Scholar] [CrossRef] [Green Version]
  14. Lee, K.S.; Han, K.J.; Lee, J.W. The impact of shading type and azimuth orientation on the daylighting in a classroom–focusing on effectiveness of façade shading, comparing the results of DA and UDI. Energies 2017, 10, 635. [Google Scholar] [CrossRef] [Green Version]
  15. Van der Rhee, H.J.; de Vries, E.; Coebergh, J.W. Regular sun exposure benefits health. Med. Hypotheses 2016, 97, 34–37. [Google Scholar] [CrossRef]
  16. Leslie, R.P. Capturing the daylight dividend in buildings: Why and how? Build. Environ. 2003, 38, 381–385. [Google Scholar] [CrossRef]
  17. Kechichian, E.; Ezzedine, K. Vitamin D and the Skin: An Update for Dermatologists. Am. J. Clin. Dermatol. 2018, 19, 223–235. [Google Scholar] [CrossRef]
  18. Valles, X.; Alonso, M.H.; Lopez-Caleya, J.F.; Diez-Obrero, V.; Dierssen-Sotos, T.; Lope, V.; Molina-Barcelo, A.; Chirlaque, M.D.; Jimenez-Moleon, J.J.; Tardon, G.F.; et al. Colorectal cancer, sun exposure and dietary vitamin D and calcium intake in the MCC-Spain study. Environ. Int. 2018, 121, 428–434. [Google Scholar] [CrossRef]
  19. Kim, J.T.; Kim, G. Overview and new developments in optical daylighting systems for building a healthy indoor environment. Build. Environ. 2010, 45, 256–269. [Google Scholar] [CrossRef]
  20. Pandharipande, A.; Caicedo, D. Daylight integrated illumination control of LED systems based on enhanced presence sensing. Energy Build. 2011, 43, 944–950. [Google Scholar] [CrossRef]
  21. Musumeci, S.; Bojoi, R.; Armando, E.; Borlo, S.; Mandrile, F. Three-legs interleaved boost power factor corrector for high-power LED lighting application. Energies 2020, 13, 1728. [Google Scholar] [CrossRef] [Green Version]
  22. Cannavale, A.; Ayr, U.; Fiorito, F.; Martellotta, F. Smart electrochromic windows to enhance building energy efficiency and visual comfort. Energies 2020, 13, 1449. [Google Scholar] [CrossRef] [Green Version]
  23. Acosta, I.; Campano, M.Á.; Amarillo, S.D.; Muñoz, C. Dynamic daylight metrics for electricity savings in offices: Window size and climate smart lighting management. Energies 2018, 11, 3143. [Google Scholar] [CrossRef] [Green Version]
  24. Galatioto, A.; Beccali, M. Aspects and issues of daylighting assessment: A review study. Renew. Sustain. Energy Rev. 2016, 66, 852–860. [Google Scholar] [CrossRef]
  25. Sibley, M. Let There Be Light! Investigating Vernacular Daylighting in Moroccan Heritage Hammams for Rehabilitation, Benchmarking and Energy Saving. Sustainability 2018, 10, 3984. [Google Scholar] [CrossRef] [Green Version]
  26. Baglivo, C.; Bonomolo, M.; Congedo, P.M. Modeling of light pipes for the optimal disposition in buildings. Energies 2019, 12, 4323. [Google Scholar] [CrossRef] [Green Version]
  27. Chylek, P.; Lesins, G.B.; Videen, G.; Wong, J.G.D.; Pinnick, R.G.; Ngo, D.; Klett, J.D. Black carbon and absorption of solar radiation by clouds. J. Geophys. Res. Atmos. 1996, 101, 23365–23371. [Google Scholar] [CrossRef]
  28. Zhang, Q.; Thompson, J.E. A model for absorption of solar radiation by mineral dust within liquid cloud drops. J. Atmos. Solar Terres. Phys. 2015, 133, 121–128. [Google Scholar] [CrossRef]
  29. Maneewan, S.; Janyoosuk, K.; Chan, H.Y.; Thongtha, A. Incorporating black dust into autoclaved aerated concrete wall for heat transfer reduction. J. Metals Mater. Miner. 2019, 29, 82–87. [Google Scholar]
  30. Thongtha, A.; Khongthon, A.; Boonsri, T.; Chan, H.Y. Thermal effectiveness enhancement of autoclaved aerated concrete wall with PCM-contained conical holes to reduce the cooling load. Materials 2019, 12, 2170. [Google Scholar] [CrossRef] [Green Version]
  31. Punlek, C.; Maneewan, S.; Thongtha, A. Phase change material coating on autoclaved aerated lightweight concrete for cooling load reduction. Mater. Sci. (MEDŽIAGOTYRA) 2017, 23, 145–149. [Google Scholar] [CrossRef] [Green Version]
Figure 1. (a) View of the test unit in controlled conditions. (b) Fixed locations of the thermocouples for temperature testing.
Energies 13 02528 g001
Figure 2. Views of the glass units.
Energies 13 02528 g002
Figure 3. View of the testing boxes in actual weather conditions.
Energies 13 02528 g003
Figure 4. Temperature variations at different locations of the 2S-2G glass units.
Energies 13 02528 g004
Figure 5. Comparison of the internal and external temperatures of the top surface of the box and the nine glass units.
Energies 13 02528 g005
Figure 6. Comparison of internal unit temperatures of each configuration of the glass units.
Energies 13 02528 g006
Figure 7. Comparison of illuminance of each of the configurations of the glass units.
Energies 13 02528 g007
Figure 8. Reference testing of the exterior and interior surface temperatures of the box under natural weather conditions: (a) 29 October 2019, (b) 31 October 2019, and (c) 4 November 2019.
Energies 13 02528 g008
Figure 9. Testing the exterior and interior surface temperatures of the 2S-2G glass unit under natural weather conditions: (a) 29 October 2019, (b) 31 October 2019, and (c) 4 November 2019.
Energies 13 02528 g009
Figure 10. Comparison of the temperature gradients of both boxes under natural weather conditions: (a) 29 October 2019, (b) 31 October 2019, and (c) 4 November 2019.
Energies 13 02528 g010
Figure 11. Inside temperatures of the two testing units under natural weather conditions: (a) 29 October 2019, (b) 31 October 2019, and (c) 4 November 2019.
Energies 13 02528 g011
Figure 12. Variability of the average indoor illuminance under natural weather conditions: (a) 29 October 2019, (b) 31 October 2019, and (c) 4 November 2019.
Energies 13 02528 g012
Table 1. Average highest temperatures at different locations of the reference and 2S-2GW glass models under natural weather conditions for three days.
DayType of Model
Reference2S-2GW
Two (°C)Twi (°C)Tr (°C)Ta (°C)Two (°C)Twi (°C)Tgo (°C)Tgi (°C)Tr (°C)Ta (°C)
1st52.453.343.037.846.453.643.449.842.337.8
2nd47.049.339.934.445.449.337.847.839.534.4
3rd43.449.641.335.339.747.437.346.739.435.3
Avg.47.650.741.435.843.850.139.548.140.435.8
Table 2. Average temperatures at various positions of the reference and 2S-2GW glass units under natural weather conditions.
DayType of Model
Reference2S-2GW
Two (°C)Twi (°C)Tr (°C)Ta (°C)Two (°C)Twi (°C)Tgo (°C)Tgi (°C)Tr (°C)Ta (°C)
1st39.440.637.133.235.741.035.740.536.733.2
2nd34.936.133.129.834.136.431.136.832.729.8
3rd34.737.734.330.634.337.332.337.733.630.6
Avg.36.338.134.831.234.738.233.038.334.331.2

