1. Introduction
The degradation of environmental quality is one of the causes of global warming and climate change. Global warming and climate change have adverse effects on economy, cropping pattern, food security, and livelihoods. The climate change could affect production of rice, wheat, and maize in tropical zones, and extreme heat events are likely to be more intense and last longer. Moreover, climate change not only affects socio-economic systems but also adversely affects human health and welfare. Human activities contaminate the environment, which could lead to morbidity, malnutrition, and shortening of life spans. Thus, for these genuine issues, global warming and climate change are core issues for researchers and policy makers around the globe. The international community has concern for environmental degradation as well, but it only focuses on the activities or emissions responsible for global warming and climate change. The emissions of greenhouses gases (GHG) have implications for global warming, climate change, and ecological imbalances. Since the industrial revolution, there has been a continuous increase in GHG and carbon emissions, which constitute a major portion of GHG and accounts for about 76% of GHG. Industry, energy, land-use, agriculture, and forestry are major sectors of GHG emissions. One can blame a region or a country for global warming and climate change; nevertheless, each and every region and country is responsible to some extent. As far as India is concerned, it surfaced as the fourth major contributor of carbon emissions from fossil fuel and cement industry in 2013, following China, the US, and the EU [
1]. However, it is worthy to mention that on the basis of per capita carbon emissions from the aforementioned sectors, India fell in the bottom 100 among 196 countries [
2].
Until the 1980s, the Indian economy was considered a closed economy. There were quantitative restrictions on trade, and the average tariff was above 200%. Taxes on foreign trade were above 28% of the total tax revenue for the Indian government in 1990. India had a deficit in foreign trade, and to address the shortage of foreign reserve, the Indian government initiated reforms in the early 1990s. These reforms were designed to open up its economy to the world for trade and investment. These reforms resulted in a reduction of average non-agricultural tariffs, which fell below 15%, and the imports quota was abolished. Since then, the Indian economy has been performing well, witnessing remarkable progress on some socio-economic indicators. Gross domestic product (GDP) per capita has more than quadrupled, infant mortality has significantly decreased from above 88 to below 40 (per 1000 live births), and life expectancy has increased from 58.5 to 66.5. Trade as a percentage of GDP increased from 15.2 to 53.33 between 1990 and 2014. The Indian economy grew at 5.53% in the 1990s, and its maximum annual GDP growth of 8.85 was recorded in 1999. The economy grew at an annual growth rate of 7.25 in the 2000s, where its maximum and minimum annual growth rates were recorded in 2010 and 2003, respectively [
3].
India has a huge number of skilled managerial and technical experts, as well as cheap labor and a huge market, which makes it a preferred destination for foreign direct investment (FDI). The strong suitability of the Indian economy for foreign investment lies in information technology in addition to other significant areas, such as apparels, chemicals, jewelry, pharmaceuticals, and auto components. Policy regarding FDI was restrictive until the 1980s, which hindered FDI in the past. Reforms in the early 1990s and deregulation of the economy from time to time attracted good foreign investment into India, and FDI as a percentage of GDP increased from 0.07 to 1.66 between 1990 and 2014. FDI policy was further liberalized in 2014, the sectors prohibited from FDI were opened, and now FDI is even allowed in the defense sector through the Indian government. Some sectors disproportionately attracted FDI—for instance, the automobile industry, computer software and hardware, construction, chemicals, telecommunications, services, and power. Since 2000, the total FDI mounted to more than
$350 billion USD [
2].
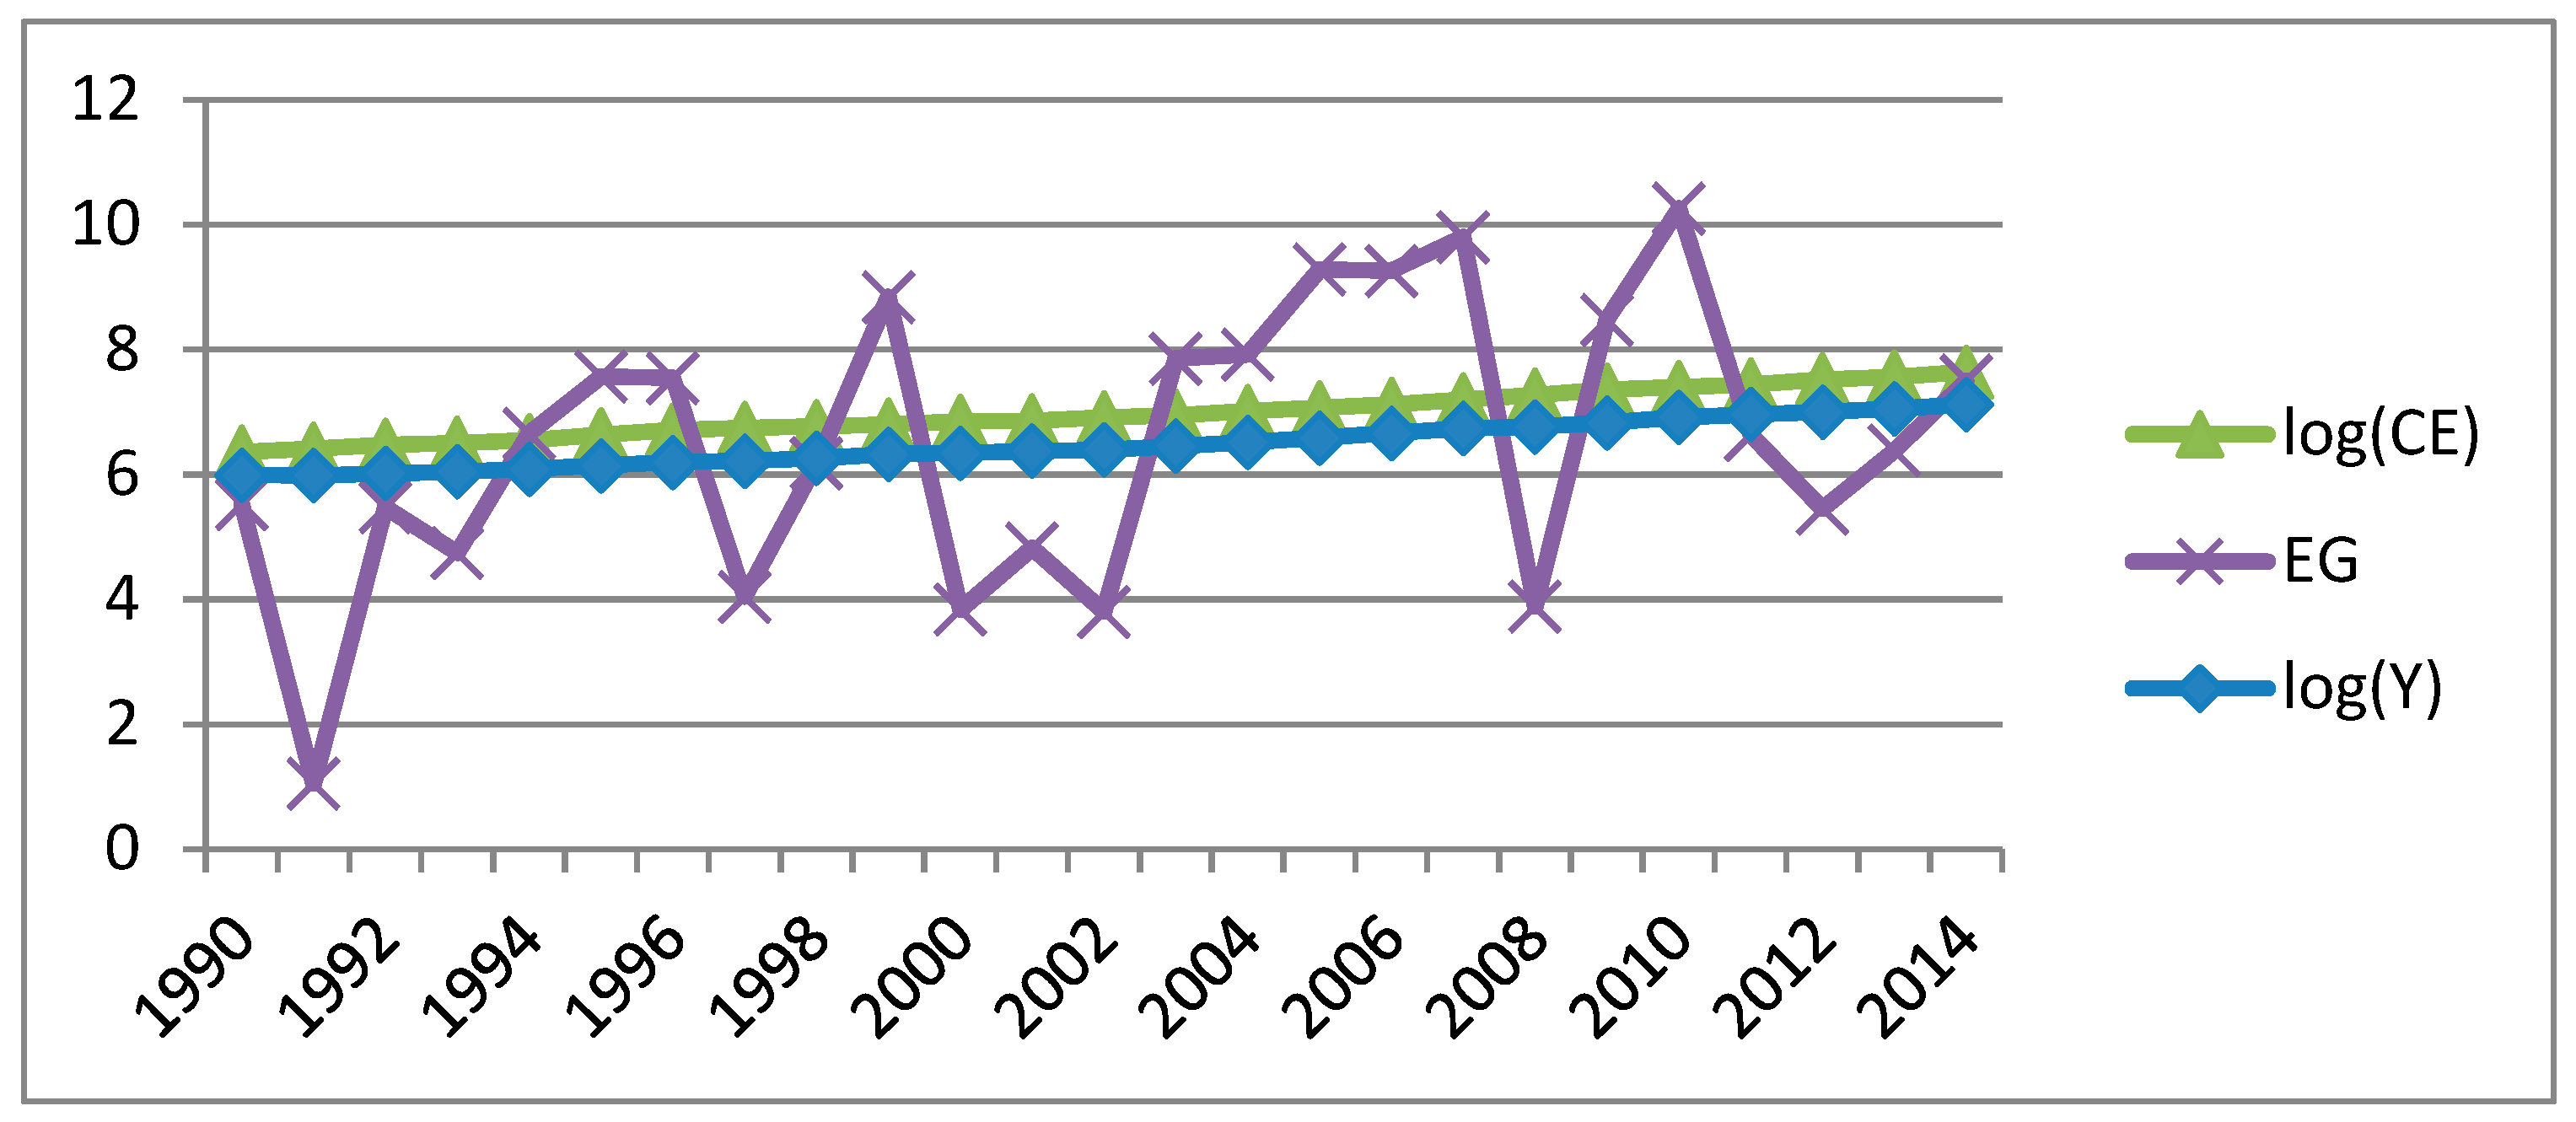
Figure 1 presents the economic performance and carbon emissions trends in India. During 1990 and 2014, the Indian economic growth (EG) was around 6.5%, whereas the lowest EG was recorded in 1991. The Indian economy achieved its highest ever EG in 2010. Since 1990, there has been a continuous increase in carbon emissions (
logCE) per capita (
logY) of India [
3].
The economic size of the Indian economy and its status as one of the major emitters of carbon emissions globally makes the country a good location to study the determinants of environmental degradation in the context of the environmental Kuznets curve (EKC) hypothesis. Energy is treated as a very crucial determinant of environmental degradation in the context of EKC hypothesis testing in a country [
4,
5,
6,
7,
8]. Other important factors of environmental degradation that have drawn attention from researchers in testing the EKC hypothesis are trade [
5,
6,
7] and FDI [
9,
10]. The individual impact of exports and imports on environmental degradation is very crucial for policy implications [
11]. Very few studies have determined the effect of exports on environmental degradation [
12,
13,
14,
15]. This paper makes itself distinct from others studies on the basis of two main contributions to existing literature. First, FDI is used as a potential contributor to environmental degradation in India in multi-variant cointegration analysis. Second, this study is unique in the sense that it is the first study to analyze the impact of export variety on environmental degradation, as we were not able to trace any paper that treated export variety as a potential factor of environmental degradation in the Indian context. The reason is that the producers offer diversified products to meet consumers’ wants, as consumers love variety. Additionally, they believe that one can not only earn more profit by offering product variety range in the product line but could also avoid direct competition by producing a greater range of variety. However, offering a greater range of variety leads to reckless production processes, which leads to environmental issues [
16]. The other point to consider is that export variety specifically measured through exports commodities enables us to know whether the production process when generating product variety in India is good enough to secure environmental quality or if it is detrimental to the environment. Besides this, the inclusion of export variety also enables us to know how much the private sector in India is taking responsibility for environmental quality. Thus, this study recommends some policy measures regarding how the Indian government can mitigate environmental degradation.
This paper is organized as follows: the next section describes the literature review, the third section presents materials and methods along with the model of the study, and results are interpreted in the fourth section. The fifth section of the article is devoted to a discussion of our results, and the last section concludes the article.
2. Literature Review
Grossman and Krueger [
17] established an inverted U-shape relationship between national income and environmental degradation. This relationship is referred to as the environmental Kuznets curve (EKC) hypothesis in the literature. The EKC hypothesis postulates that in the initial stage of development, an increase in national income is also followed by an increase in environmental degradation. Then, a stage is reached in the developmental process of a country after which an increase in national income is not followed by an increase in environmental degradation. The reason is that nations usually do not care for environmental quality in initial levels of development, as they extensively utilize the natural resources. However, once a certain level of income is achieved, nations try to care about environmental quality, as certain environmental issues cause health issues and difficulty in sustaining economic development.
A good number of empirical studies confirmed the EKC hypothesis, and some of those empirical studies are discussed here. For instance, Nasir and Rehman [
5] found the impact of energy and trade on carbon emissions in Pakistan in the context of EKC hypothesis. They applied a cointegration technique to determine the long run relationship between the aforementioned variables of the study. They also derived the long run estimates through the cointegration technique. They concluded that the EKC hypothesis was valid in the case of Pakistan in the long run. Moreover, they documented that energy and trade aggravated carbon emissions, thus deteriorated the environmental quality in Pakistan. They opined that energy inefficiency, the lack of sound sharing of renewable energy in total energy, and the trade structure of Pakistan were responsible for environmental degradation.
Tang and Tan [
10] investigated non-linear relationships between income and carbon emissions for Vietnam. They found that carbon emissions, income, energy, and FDI were cointegrated in the long run. Their results also revealed that the EKC hypothesis exists in Vietnam. Energy consumption stimulated carbon emissions in the study period, whereas FDI lessened the carbon emissions. They found a feedback effect between FDI and carbon emissions and between income and carbon emissions and also confirmed unidirectional causality from energy to carbon emissions. They concluded that FDI is not just helping Vietnam in economic pace but it is also helping to improve the environmental quality.
Mohammed et al. [
18] studied the effects of energy, financial development, and government expenditure on carbon emissions in Venezuela. This study found that variables of the study were in the long run relationship, and the long run estimates showed that the EKC hypothesis holds in Venezuela. Moreover, government expenditure and energy aggravated environmental degradation, whereas financial development restrained the environmental degradation in Venezuela. They argued that financial institutions can help the government implement sustainable energy policies.
There is also large number of empirical studies that did not find the EKC hypothesis. Here, we discuss some such empirical studies. For example, Soytas, Sari, and Ewing [
4] examined the EKC hypothesis for the USA. They included labor and fixed capital formation as control variables in the emission-energy-growth nexus. They employed the Toda and Yamamoto granger causality procedure along with generalized impulse response and variance decompositions to examine the EKC hypothesis. Their study results nullified the existence of the EKC hypothesis in the USA. They concluded that energy consumption is the main contributor of emissions in the long run, and there is no sign of trade-off between income growth and carbon emissions. They also opined that the USA should not adopt policy to reduce carbon emissions at the expense of income loss. The USA has to design policies related to production and consumption of energy for combating carbon emissions instead of hurting economic pace. Similarly, the study carried out by Tan, Lean, and Khan [
19] did not find the EKC hypothesis in Singapore. Moreover, in a study conducted by Gill, Viswanathan, and Hassan [
20], the EKC hypothesis was analyzed for carbon emissions through the cointegration technique. They concluded that the EKC hypothesis is not valid in case of Malaysia. They also documented that renewable energy has a negative influence on carbon emissions, thus they recommended the Malaysian government come up with a special renewable energy policy to mitigate carbon emissions.
Naradda Gamage, Kuruppage, and Haq [
8] examined the EKC hypothesis in Sri Lanka by considering tourism and energy consumption along with income level and carbon emissions. They tested the time series data for stationarity before establishing the long run relationship between variables of the study. Long run estimates were produced through the cointegration test. The results of their study did not affirm the EKC hypothesis in Sri Lanka. They recommended that energy conservation policies and exploring new projects of renewable energy sources can help Sri Lanka to mitigate environmental degradation. Moreover, environmental policies will not restrict the economic pace of the Sri Lankan economy. It can be concluded from the studies conducted on the EKC hypothesis that the confirmation of the EKC hypothesis depends on variables selection as well as time period and methodology—for instance, Dinh and Shih-Mo [
9] and Tang and Tan [
10] conducted the study for the Vietnamese economy to check the EKC hypothesis; the former studies did not confirm the EKC hypothesis, while the latter study did.
Economic development needs energy, and energy emissions are hurting the environmental quality across the globe. Thus, energy production and consumption has grabbed the attention of researchers as potential factors of environmental degradation. Numerous studies have considered energy as a potential factor of environmental degradation, such as Soytas, Sari, and Ewing [
4], Nasir and Rehman [
5], Ozturk and Acaravci [
21], Shahbaz et al. [
22], Haq, Zhu, and Shafiq [
7], and Gamage, Kuruppage, and Haq [
8], among others. Moreover, economic development of world economies has kept pace with globalization of economies. The technology and knowledge diffusion among economies became possible through integration as a result of trade openness. In the last few decades, more economies have opened themselves to trade and FDI. Thus, the role of FDI in economic development has received attention from researchers, but researchers are also interested in the effect of FDI on environmental quality in the host country. The effect of FDI on environmental quality in the host country is not clear in the literature. The economics that are less regulated in terms of environment receive more FDI, and this is referred to as the pollution haven hypothesis [
23,
24,
25,
26,
27]. However, this is not always the case, and FDI may bring improvement in environmental quality in the host country [
28,
29]. When FDI improves environmental quality in the host country, it is referred to as the halo hypothesis.
Acharyya [
30] investigated the impact of FDI on economic growth and environmental degradation in India between 1980 and 2003 in two distinct models. He concluded that FDI has a marginal effect on economic growth, whereas as the FDI effect on environmental degradation is quite large. However, he asserted that the FDI attraction to India cannot be based on the pollution haven hypothesis and pointed out that FDI sharing dirty industries has been decreasing since the mid-1990s. Similarly, in a panel setting for BRIC (Brazil, Russia, India, China), Pao and Tsai [
31] found the effect of FDI and economic growth on environmental degradation. Moreover, their study also confirmed the EKC hypothesis in BRIC countries.
Dinh and Shih-Mo [
9] investigated the EKC hypothesis in the Vietnamese economy along with energy consumption and FDI over the period of 1980 to 2010. Their results showed that the EKC does not hold in Vietnam, as income and its squares term came out insignificant. They also concluded that FDI does not have a significant effect on environmental degradation, and energy is significantly adding to environmental degradation. The granger causality analysis confirmed that the pollution haven hypothesis prevailed in the Vietnamese economy and suggested that steps are to be taken to enhance energy infrastructure and ensure energy conservation policies in order to increase energy efficiency and lessen wastage of energy.
Kivyiro and Arminen [
32] carried out an empirical study for six sub-Saharan African countries to determine the roles of energy and FDI in the EKC hypothesis. The bounds test of the cointegration result assured the existence of the long run relationship between variables of interest. The results of their study supported and confirmed the EKC hypothesis in the Democratic Republic of the Congo, Kenya, and Zimbabwe. They suggested that the EKC hypothesis holds in those countries, which are at low levels of economic development, as the aforementioned countries have low per capita in the sample. Regarding FDI impact on environmental degradation, two distinct outcomes appeared from the study. The pollution haven hypothesis is valid in Kenya and Zimbabwe, as FDI is positively associated with environmental degradation in these countries. They found the opposite case for the Democratic Republic of the Congo and South Africa, where the halo effect hypothesis is present as far as FDI effect is concerned on environmental degradation. They argued that the pollution haven and halo effect hypotheses do not depend on whether a country is a net importer or exporter of oil in their sample.
The globalization of production and trade of manufactured goods is the striking pattern of emissions embodied in international trade [
1]. World trade structure has changed with time, and more goods as well as more variety of goods are traded than decades ago. This is why trade also received attention from researchers as a factor of environmental degradation [
5,
7]. The impact of trade on carbon emissions is dubious, as Nasir and Rehman [
5] concluded that trade accumulates carbon emissions in Pakistan, whereas Ertugrul et al. [
6] found that trade does not have a significant effect on carbon emissions in Brazil, Korea, or Thailand. However, trade has a positive impact on carbon emissions in China, India, Indonesia, and Turkey [
6]. Haq, Zhu, and Shafiq [
7] studied the relationship between carbon emissions, income, energy consumption, and trade openness for the Moroccan economy over the period of 1971 to 2011. Their results affirmed that variables of the study are cointegrated in the long run. Their results did not support the EKC hypothesis for said economy and documented that energy consumption is responsible for environmental degradation, whereas trade had improved the environmental quality over the study period. They suggested that the Moroccan government reduce environmental degradation by insuring more energy production from new and renewable resources. Furthermore, they emphasized that any step in order to combat environmental degradation in the Moroccan economy will not hurt economic pace and that environment awareness is essential to the masses, which can be developed through education and other awareness programs in Morocco.
It can be deduced from the literature on the EKC hypothesis that researchers included other relevant variables to test the EKC hypothesis.
Table 1 summarizes some of the relevant literature on the EKC hypothesis in a single country case. The last column of
Table 1 shows whether the study validated the EKC hypothesis.
Some of the empirical studies were confined to causality analysis. For instance, Zhang and Cheng [
33] conducted a study to find out the effect of income and energy consumption on environmental degradation along with other variables in China. Their analysis covered a period from 1960 to 2007. Results of their study confirmed that long run causality is running from economic growth to energy consumption and from energy consumption to carbon emissions, and they did not find any evidence that either energy consumption or carbon emission is causing economic growth in the long run. They recommended that China curb carbon emissions by adopting efficient energy policies, which would not hurt economic growth in the process. Likewise, Xuemin [
14] conducted a study to figure out the causal relationship between exports and environmental degradation in the Chinese economy. He found a long run relationship between exports and environmental degradation and concluded that there is bidirectional causality between exports and carbon emissions over the period of 1988 to 2007. He also concluded that exports have a positive impact on carbon emissions in short run, and exports are an important factor of environmental degradation in China. Similarly, a study by Michieka, Fletcher, and Burnett [
15] analyzed the causal relationship between coal consumption, exports, trade openness, and carbon emissions in China. Results of their study indicated unidirectional causality from exports to carbon emissions and from coal consumption to exports. They suggested that restriction of coal consumption would hurt exports but it would lessen environmental degradation by decreasing carbon emissions. The studies conducted by Alam et al. [
34] for India and Hwang and Yoo [
35] for Indonesia found that carbon emissions and energy consumption are the causes of each other in the long run. On the bases of the causal relationship between economic growth and carbon emissions, it was suggested that energy conservation and environmentally friendly policies can be initiated and can maintain sound economic growth.
4. Results
Usually, the mean and variance of the time series data are not constant because most of the time, series data carries unit root. Thus, analyzing the time series data without checking for unit root leads to spurious regression. Therefore, to get rid of this problem, the time series data have to be tested for unit root. For this purpose, this study applies augmented Dickey-Fuller (ADF) [
67] and Dickey-Fuller generalized least squares (DF-GLS) [
68].
Table 2 presents the unit root test results. Study variables are trended at their level, as results of unit root confirm that variables are non-stationary. However, these unit root tests show that variables are stationary when they are considered at first difference, thus variables are integrated of order one.
After knowing the order of integration, we employ the JJ cointegration test to examine the long run relationship among study variables. It is necessary to know the lag length for the JJ cointegration test, as it is sensitive to lag selection. Results of the different lag selection criteria are shown in
Table 3. The lag identified is one by criteria, such as Akaike information criterion (AIC), Hannan-Quinn information criteria (HQ), and Schwarz information criterion (SIC). Now, we can proceed to the JJ cointegration. The results of the JJ cointegration test are provided in
Table 4. The trace statistics and maximum eigenvalue statistics confirm the presence of one cointegration vector. Thus, these results assure us that the long run relationship exists between variables of the study. This confirmation of the long run relationship guides us in producing long run estimates based on the JJ cointegration and DOLS.
Table 5 shows the results of the long run estimates. The variables are treated in log form, thus we can interpret coefficients as elasticity of the respective variable. Moreover, these long run results confirm that all the explanatory variables are the determinants of environmental degradation in India, as all of them have significant effects on environmental degradation. The long run results show that the coefficient of income is significant with a positive sign. A 1% increase in income increases carbon emissions by 0.53–0.63%. The coefficient of energy has a positive and significant effect on carbon emissions. Its magnitude ranges from 0.40 to 0.51, suggesting that a 1% increase in energy consumption leads to a 0.40–0.51% increase in carbon emissions. The coefficient of FDI is significantly positive, but its impact on carbon emissions is marginal, as it ranges from 0.04 to 0.06, and a 1% increase in FDI leads to 0.04–0.06% in environmental degradation. The coefficient of export variety is significantly positive, and its magnitude ranges from 0.59 to 0.82. The export variety coefficient can be interpreted as a 1% increase in export variety and enhances carbon emissions by 0.59–0.82%.
Table 6 displays the short run estimates. The short run results show that export variety is the only explanatory variable among the regressors that has a positive impact on environmental degradation. The rest of the explanatory variables do not have significant impact on environmental degradation. The error correction term is significant with an expected negative sign, suggesting the model is in equilibrium. This result also highlights that the model corrects itself from any external shock per annum by 33%. Furthermore, the short run and the long run income coefficients did not prove that the EKC hypothesis exists in India. As pointed out by Narayan and Narayan [
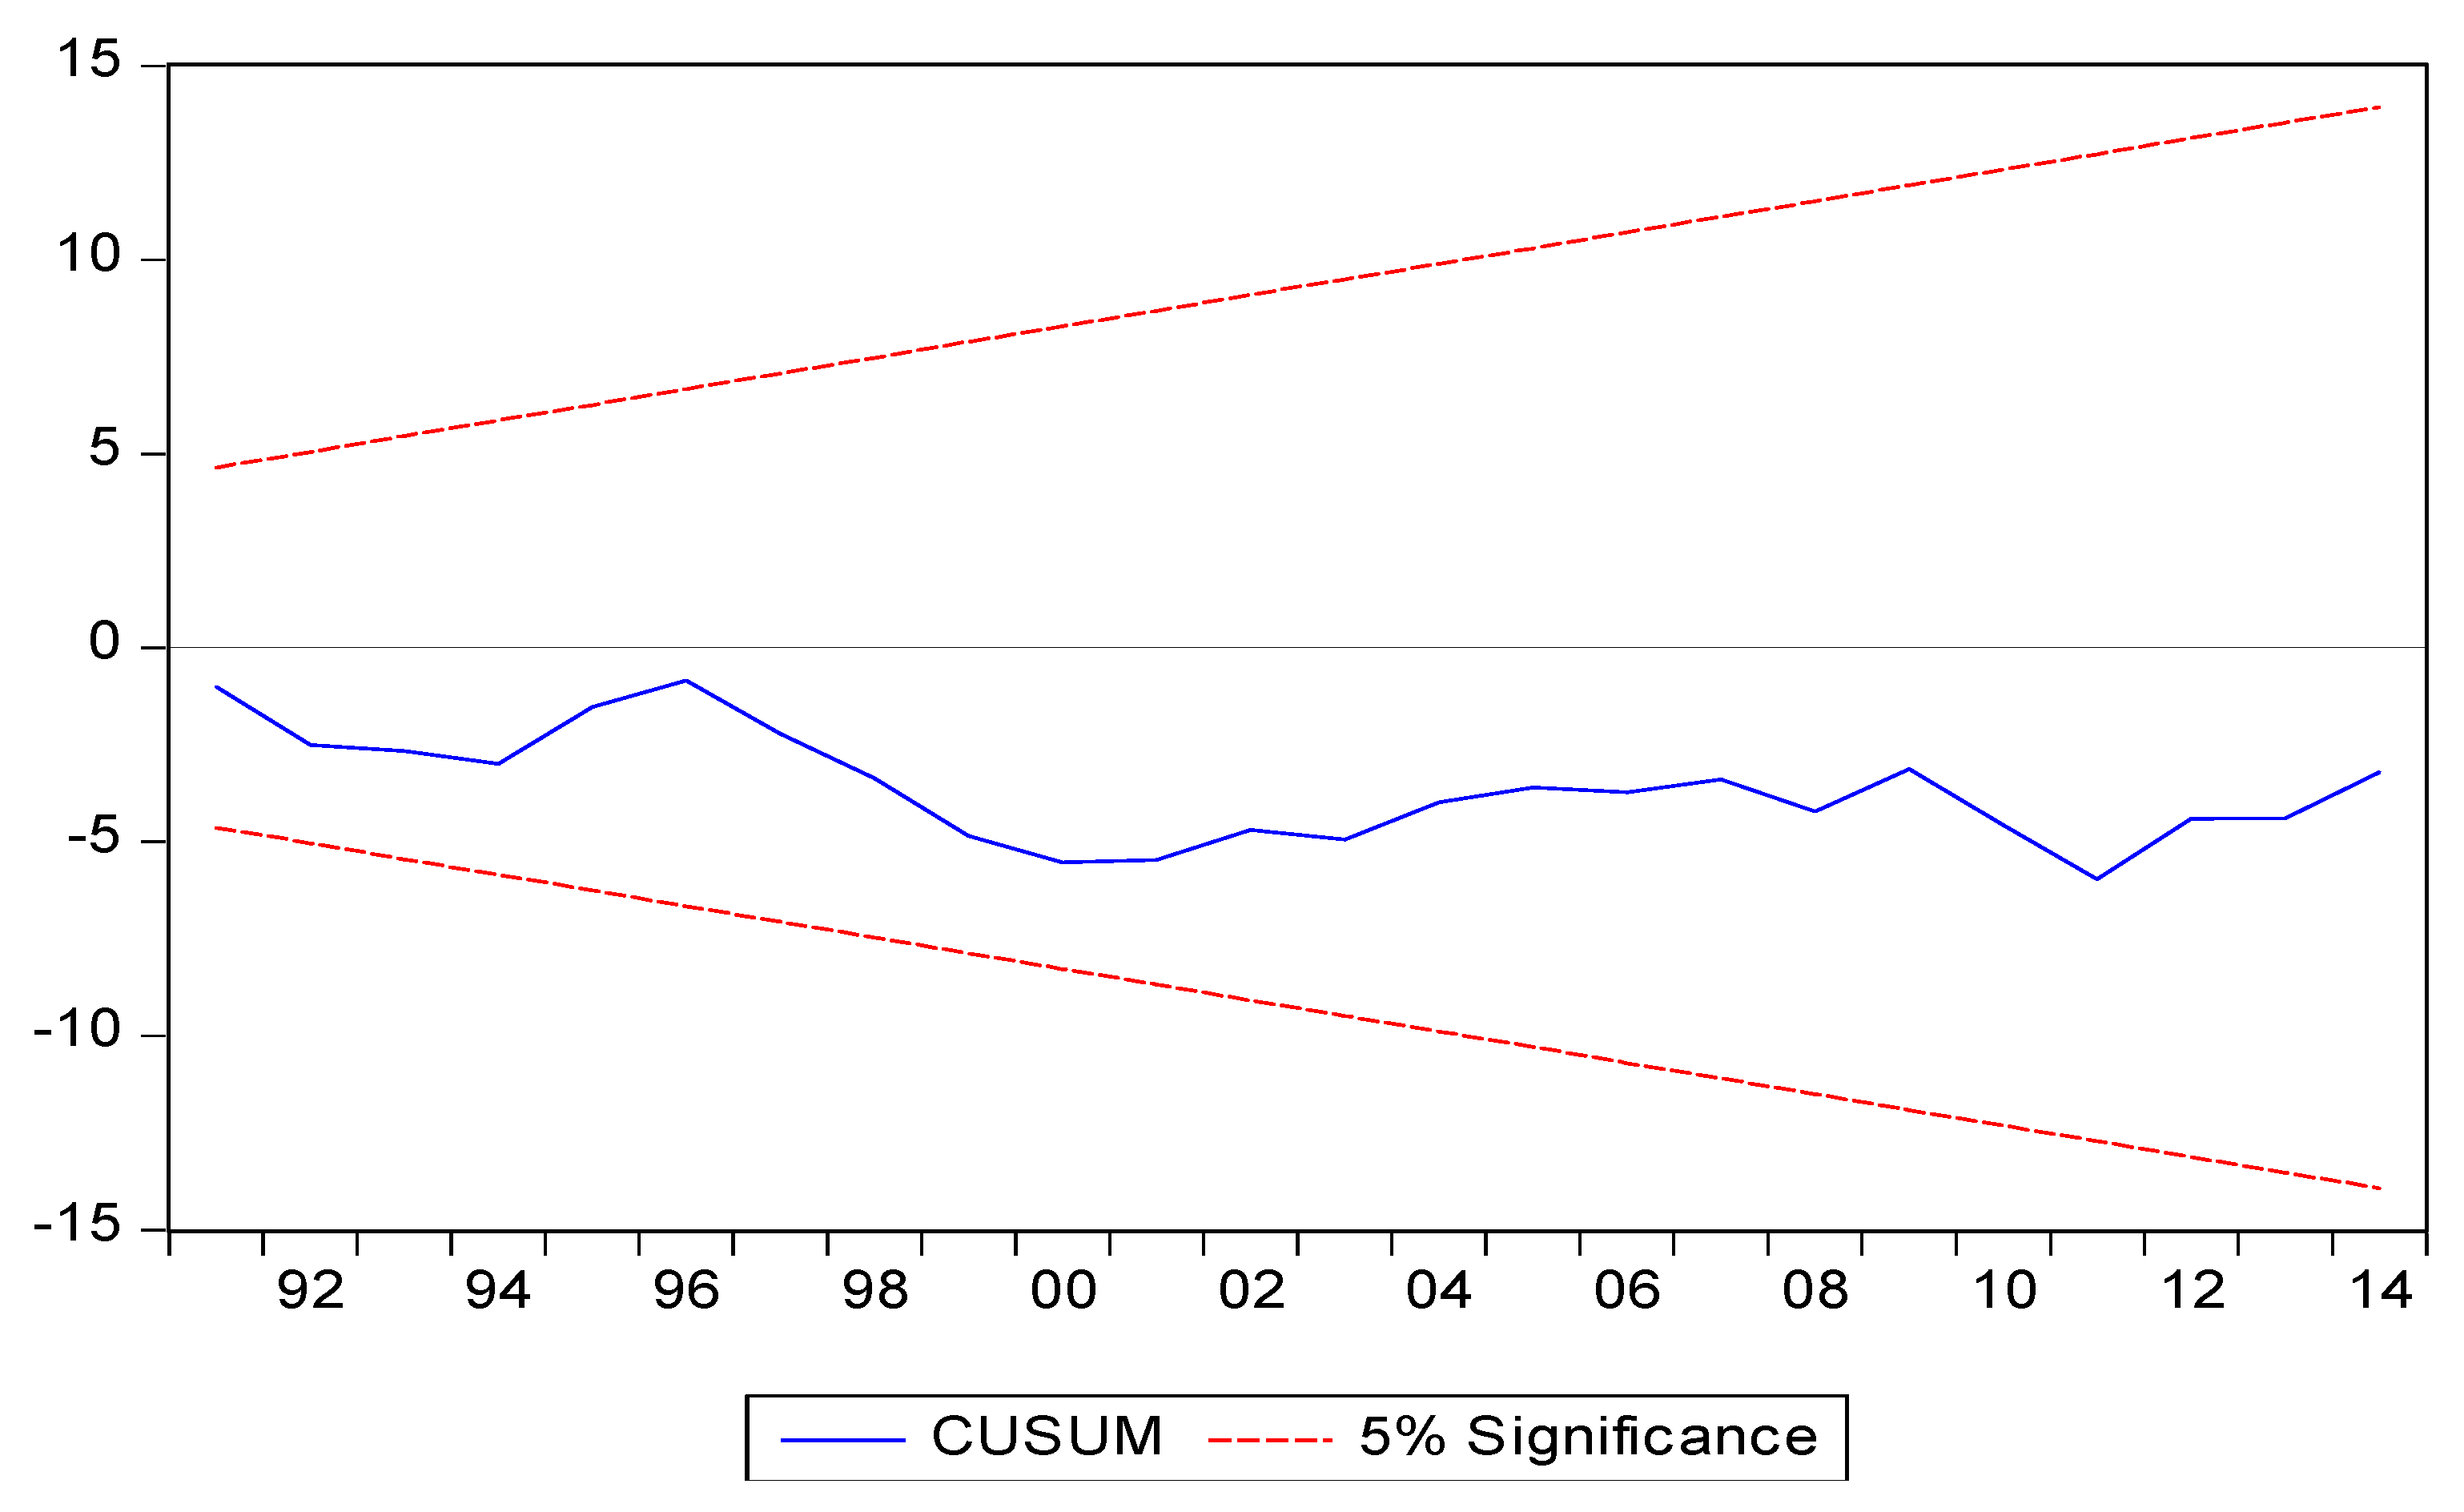
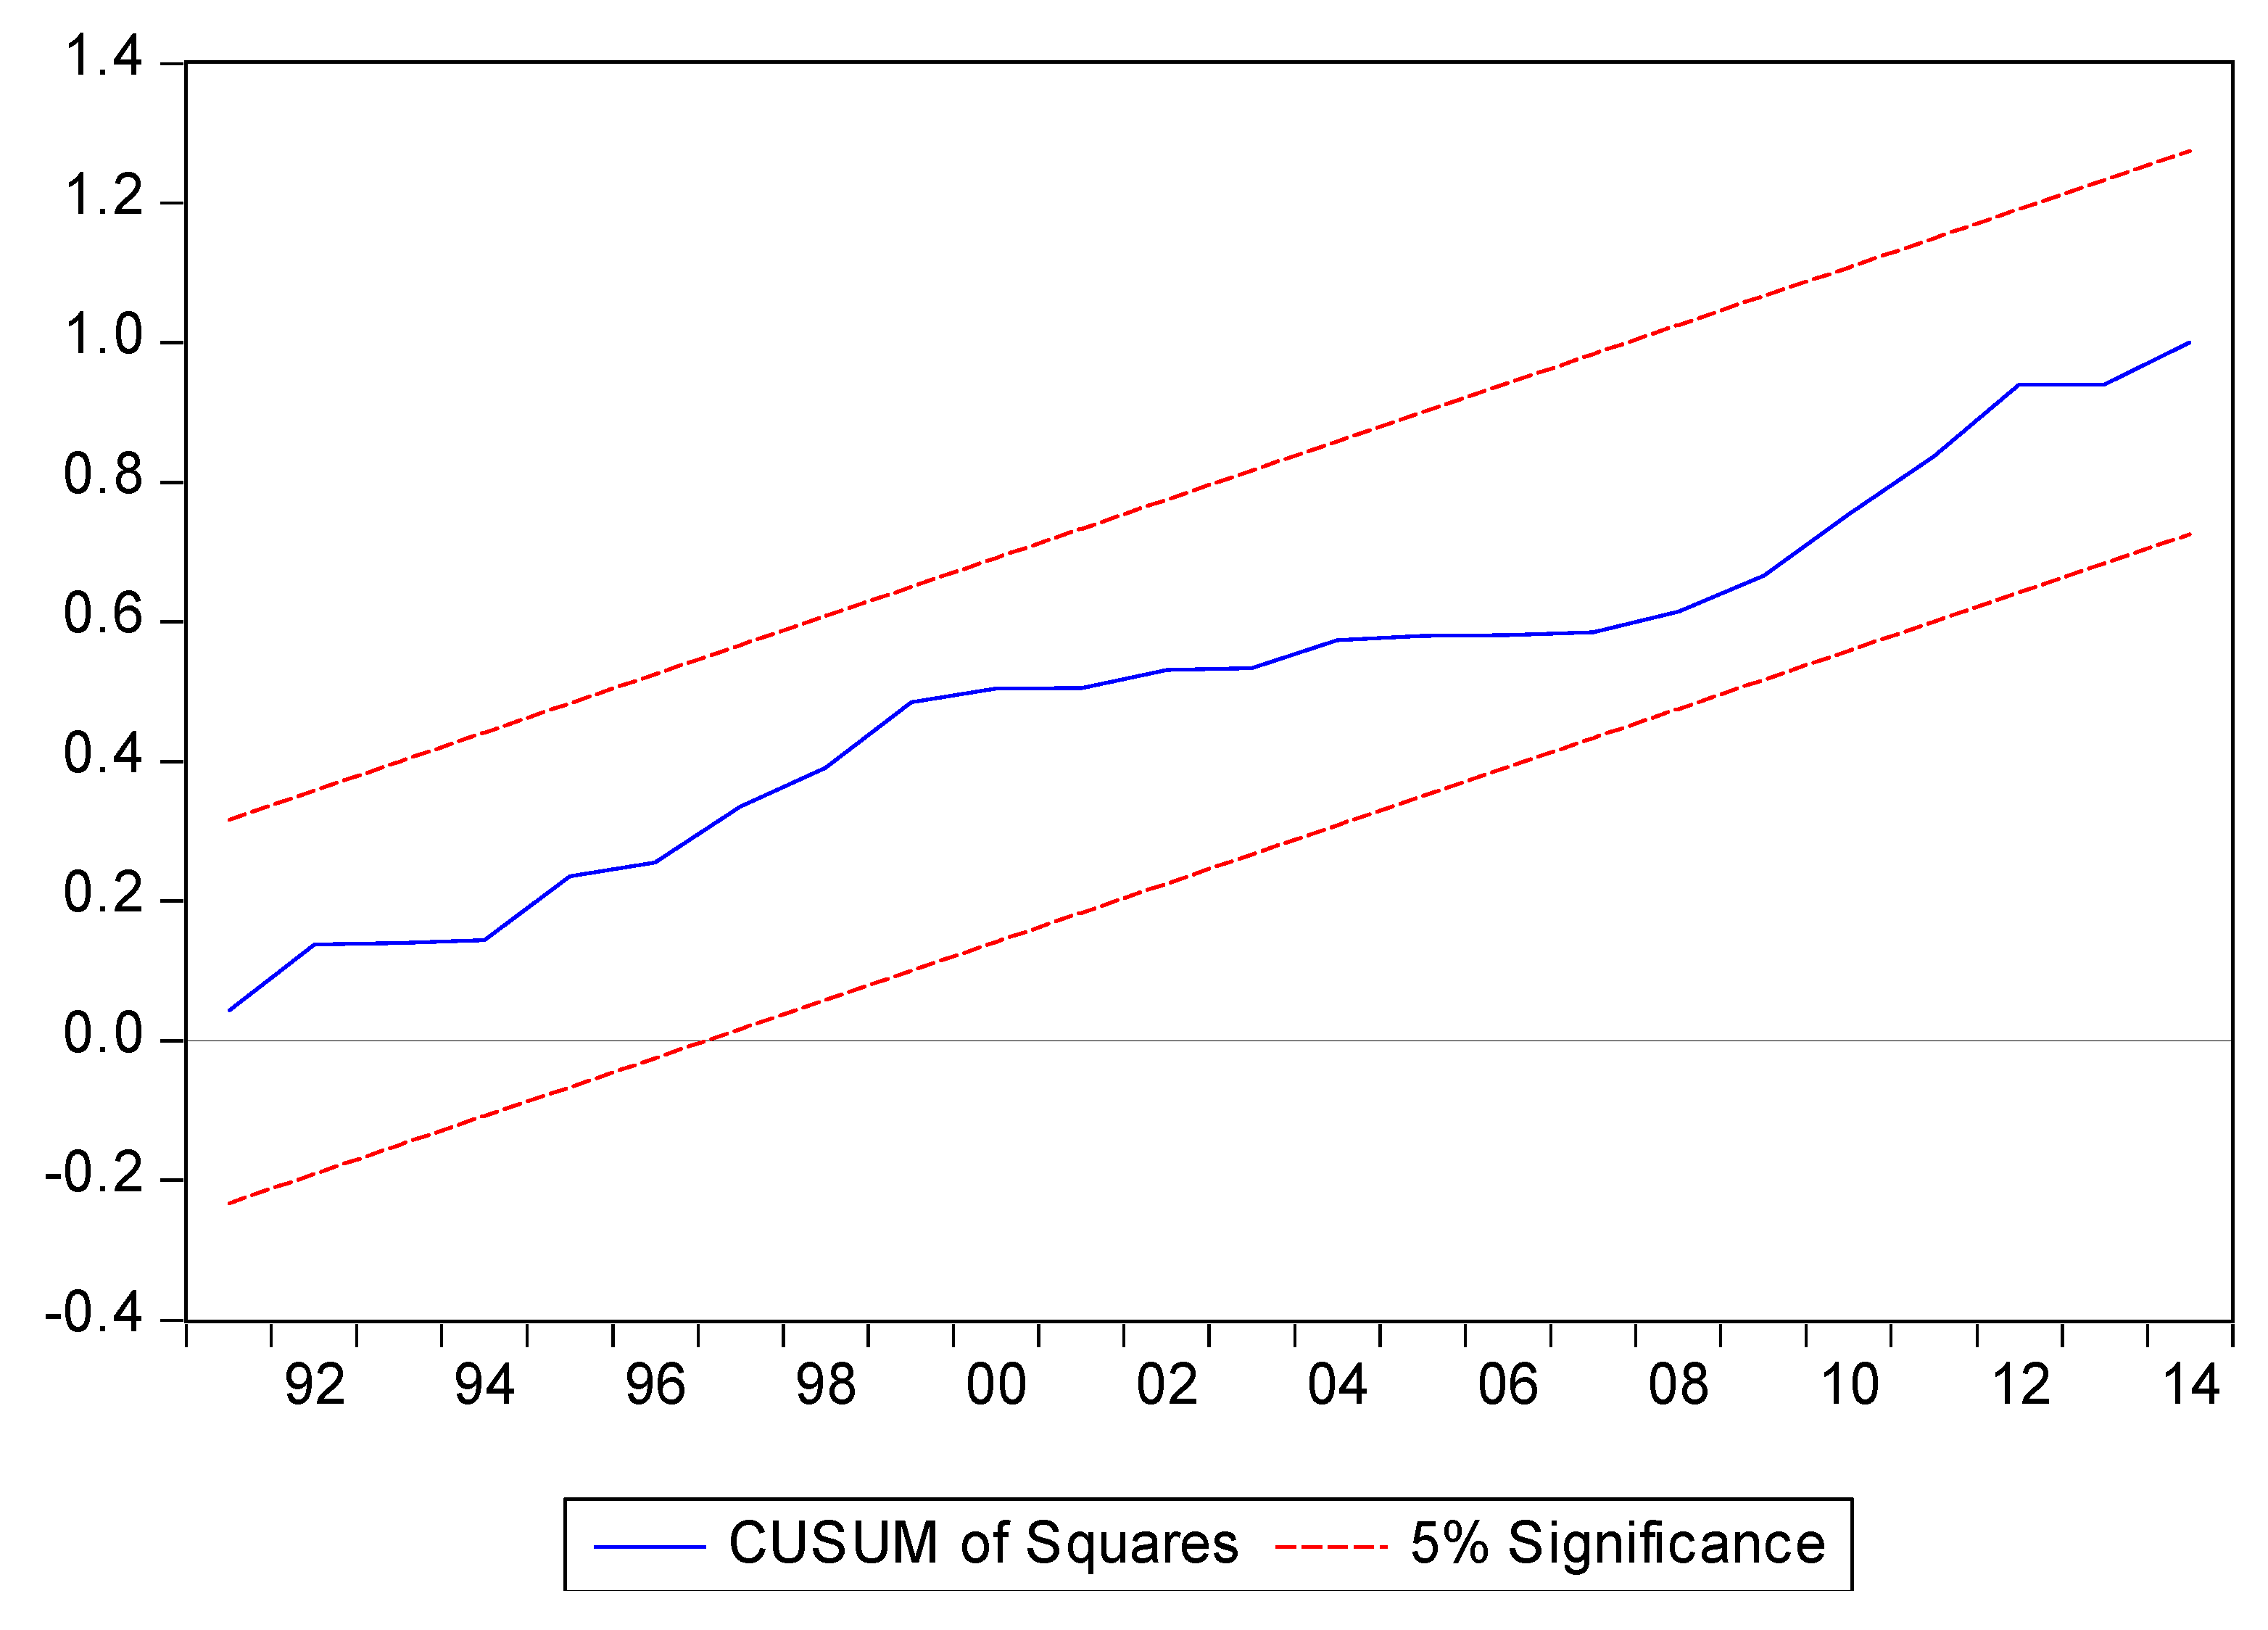
42], if the long run income coefficient is smaller than the short run coefficient, then this phenomenon would indicate the presence of the EKC hypothesis. Furthermore, heteroskedasticity and autocorrelation problems are not witnessed. Also, the model passes the normality diagnostic test. Stability of the model is tested through cumulative sum of recursive residual (CUSUM) and cumulative sum of squares of recursive residual (CUSUMQ), as presented in
Figure 2 and
Figure 3. The plots of both CUSUM and CUSUMQ statistics are well within the critical bounds at 5% level of significance, and thus validate the stability of all coefficients in the ECM model.
Table 7 presents the results of the short run and the long run causality obtained through the VECM. The long run causality is presented in the last column of the table, and the significance of the t-statistic of the ECT suggests a long run causality. These results indicate that there is unidirectional causality running from income and FDI to carbon emissions in the long run. There is two-way causation between carbon emissions and energy consumption and between carbon emissions and export variety in the long run. Short run causality analysis confirms that a feedback effect exists between carbon emissions and income. This causal relationship indicates that if India tries to reduce carbon emissions, it will hinder economic growth in the short run. Like long run causality, a feedback effect is present between carbon emissions and energy consumption in the short run. A unidirectional causality is found from FDI and export variety to carbon emissions. Similarly, a unidirectional causality is found from energy consumption, FDI, and export variety to income in the short run.
5. Discussion
The results of the study show that energy consumption, export variety, FDI, and income are the determinants of environmental degradation in India. Income is found to have a positive and significant effect on environmental degradation, and this finding is consistent with Narayan and Narayan [
42], Ertugrul et al. [
6], and Makarabbi et al. [
69], who also concluded positive and significant effects of income on carbon emissions in the case of India. Regarding income, our study shows that income elasticity is less than unity [
42], whereas Erutgrul et al. [
6] found that income elasticity is greater than unity in the case of India. This finding can refer to the scale and the composition effects of economic growth. More production (scale effect) deteriorates environmental quality, and economic structure of the economy adds to environmental degradation, as the economy is on the move from agricultural based to manufacturing and services based economies (composition effect). The long run results indicate that energy significantly aggravates carbon emissions and is thus responsible for environmental degradation. This finding is similar to the study of Makarabbi et al. [
69], who also found a positive and significant effect of energy on carbon emissions in India. In the last couple of decades, India has achieved tremendous economic progress, and that enhances the demand for energy, which of course is needed for development. However, it seems that India is not using energy efficiently, and the proportion of energy production from renewable resources of energy is not enough to reduce carbon emissions. Instead (and unsurprisingly), energy consumption is worsening the environmental quality in India, as energy consumption from fossil fuels has increased from 45.5% to 73.6% of total energy consumption during the study period. In the last three decades, electricity production from coal sources has increased from 51% to above 71% of the total coal consumption [
3]. India has experienced an increase in conventional energy consumption, as coal consumption increased from 407.04 to 5.71 million tons, lignite consumption increased from 30.23 to 43.90 million tons, crude oil consumption increased from 130.11 to 222.55 million metric tons, natural gas consumption increased from 31.33 to 34.64 billion cubic meters, and electricity increased from 411,887 to 9,671,650 gigawatt (GW) hours between 2005–2006 and 2013–2014. Electricity generation constitutes over 83% of the total lignite consumption and is also the biggest consumer of coal. Similarly, steel and cement industries (dirty industries) are the second and third biggest industries of coal consumption in India.
Regarding the effects of energy consumption, it is alarming that the install capacity of renewable energy—which is approximately 38 GW [
70]—is not enough to reduce carbon emissions. This might be the reason that the government of India has revised their renewable energy target of 175 GW until 2022. Major banks and non-banking financial companies have endorsed an amount of Rs. 712,015.4 million to finance the various renewable energy projects and distributed Rs. 295,295.7 million against the authorized amount since February 2015. Banks (public, private, and foreign banks operating in India) committed to providing loans for the renewable energy projects (78.75 GW) during the span of the next five years [
70]. The Indian government commitment to combat emissions and to get energy from renewable sources shows how much the Indian government is concerned with the environment. These commitments from the Indian government can be attributed to the economic size of the country.
The results show that FDI has a significant impact on environmental degradation, but its impact on carbon emissions is marginal. This finding is consistent with Kivyiro and Arminen [
32], who found a positive impact of FDI on carbon emissions in the cases of Kenya and Zimbabwe, opposite to the findings of Tang and Tan [
10], whose results indicated a negative impact of FDI on carbon emissions in Vietnam. After the early reforms in the 1990s, India attracted a good amount of FDI, and its total outlay stood at
$350 billion USD between 1990 and 2014. Large amounts of FDI inflow in the case of India can be attributed to the scale effect, and also it can be deduced that the pollution haven hypothesis regarding FDI is prevailing in India.
Now, we turn to an explanation of export variety—a variable that this study suggests be included in the energy-emission-growth nexus. This study finds that export variety is depleting the environmental quality. Our finding is different from the study of Shahbaz et al. [
22], who determined the effects of exports on environmental degradation and found that exports hinder environmental degradation. However, our finding can be justified on the ground that firms always try to offer a range of variety of their products (referred to the scale effect of production), but a good amount of resources are devoted by firms to offer this variety. Thus, in order to enhance export variety, firms in the production process are not using resources efficiently, and the depletion of resources for more variety is accumulating carbon emissions in the environment in India. This finding also highlights that technology adopted by firms is not environmentally friendly. The production technical effect would indicate whether or not production techniques and technology improve environmental quality.
The positive impact of FDI and export variety is asking for the check on the private sector. The Indian government has to take steps to make FDI environmentally friendly, and FDI has to be made compelling to follow environmental regulations set by the government and international organizations. Similarly, the government has to encourage FDI in renewable energy projects to achieve the revised renewable energy target of 175 GW by 2022. Firms have to be allowed to import environmental friendly (green) technology with minimum possible tariffs in order to produce goods and services with low emissions. Similarly, firms—especially those with excess pollution—have to be asked to change their production techniques and to use energy efficiently, thus these firms become smaller emitters of GHG. Besides this, special incentives have to be provided for firms and industries to ensure efficient use of energy and to become less polluting. Environmental and growth policies have to be adopted with care to promote the concept of green growth and to alleviate the climate change phenomenon.
Additionally, this study also addresses how the explanatory variables identified in the study affect environmental degradation in the short run in the case of India. The short run results indicate that export variety is the only explanatory variable that has a positive impact on environmental degradation. The rest of the explanatory variables do not have significant impact on environmental degradation. Moreover, the results confirm that the model of the study is in equilibrium and would correct itself from any external shock within four years of span. Furthermore, the results do not indicate the validity of the EKC hypothesis in India. Makarabbi et al. [
69] also did not find the presence of the EKC hypothesis in India. Moreover, the causality analysis postulates that India has to forego economic growth in the short run in order to improve environmental quality, but this will not affect long term growth. Besides, the feedback effect between carbon emissions and energy consumption highlights that India has to increase their share of renewable energy in the energy mix, thus the effect of energy on the environment can be reduced in the future. Similarly, steps are required from the Indian government to encourage bioenergy, as pointed out in study [
71], as bioenergy will ensure the reduction of GHG. Thus, India can mitigate climate change and global warming. This study suggests that in order to get a good picture of the impacts of exports and FDI on environmental degradation in India, a sector level study is needed to identify the sectors that are responsible for environmental issues in India.
6. Conclusions
This study explores the relationship between carbon emissions, energy consumption, export variety, FDI, and income for the Indian economy. The time series data are analyzed over a period from 1983 to 2014. Unit root tests results declare that variables of the study are integrated of order one. The cointegration test confirms the long run relationship between variables of the study, thus income, energy consumption, FDI, and export variety are the determinants of environmental degradation in India. Long run estimates based on the cointegration analysis and DOLS show that income, energy consumption, FDI, and export variety have positive significant impacts on environmental degradation in India. Export variety also positively influences carbon emissions, even in the short run. This finding can be explained on the ground that in order to enhance export variety, firms in the production process are not using resources efficiently, and the depletion of resources for more variety is accumulating carbon emissions in the environment in India. The long run and the short run coefficients of income do not confirm that the EKC hypothesis holds in India. The causality analysis reveals that there is one-way causation from income and FDI to carbon emissions and two-way causation exists between energy consumption and carbon emissions, as well as between export variety and energy consumption in the long run. In the short run, two-way causation is found between energy consumption and carbon emissions, and granger causality is running from FDI and export variety to carbon emissions. Income and carbon emissions are causing each other. It can be deduced from causality analysis that India has to sacrifice short run growth to improve environmental quality and lessen global carbon emissions.
One of the limitations of the study is that this study considers carbon emissions as a proxy for environmental degradation in India. In future studies, it is advised to consider GHG such as Baležentis et al. did [
71]. Another limitation of the study is that this study considers energy consumption, thus future studies can include renewable energy and bioenergy instead of testing the EKC hypothesis in India. This study is restricted to the impact of export variety and FDI on carbon emissions, thus the impact of these determinants can be underestimated as far as environmental degradation is concerned. Because this study did not determine the effects of export variety and FDI on local air pollutants and water pollution, it is recommended that future studies should consider the effects of export variety and FDI on local air pollutants and water pollution.


