Article

Major Barriers to the New Residential Building Energy-Efficiency Promotion in China: Frontlines’ Perceptions

1
School of Environmental Science and Engineering, Tianjin University, Tianjin 300350, China
2
School of Built Environment, University of Reading, Reading RG6 6AW, UK
*
Author to whom correspondence should be addressed.
Energies 2019, 12(6), 1073; https://doi.org/10.3390/en12061073
Submission received: 12 February 2019 / Revised: 16 March 2019 / Accepted: 18 March 2019 / Published: 20 March 2019

Abstract

:
The energy-efficiency promotion of new residential buildings in China has achieved great progress in the past three decades. However, the expected policy outcomes cannot be fully achieved due to the barriers in the policy-making and implementation process. Whereas governments play a critical role in policy formation, perceptions of stakeholders involved in the building life cycle and the industrial value chain (such as developers, design institutes and relevant material manufactures) are fundamental to the successful implementation. To collect and identify the barriers of significant influence on the industry from stakeholders’ perspectives, this paper used a nationwide institutes’ questionnaire to collect stakeholders’ voices regarding the barriers, the corresponding popularity and the severity. All the barriers were categorized according to institutions’ scorings through cluster analysis. The relationships between barriers were also analyzed according to the framework based on policy cycle and policy environment. Results indicated that the core problem is the ineffectiveness translating energy savings into benefits and profits. Accordingly, three major barriers were identified, namely the (1) unsatisfied policy design and implementation; (2) stakeholders’ lack of implementation capacity in developing and constructing high-performance new residential building projects and adopting relevant technologies; and (3) insufficient legalization of relevant market. Other identified barriers either were those not agreed by all institutions, or those could be eliminated easily after the removal of the above three barriers.

1. Introduction

The promotion of new residential building energy efficiency has made great contributions to the reduction of energy consumption intensity in building sector. According to the Ministry of Housing and Urban-Rural Development (MoHURD) in China [1], the area of residential buildings has been increasing at an average rate of 4% per year and reached 5.67 billion square meters in 2016, which is 2.1 times the amount than in 2000 (see Figure 1). In the meantime, the annual construction amount of new residential buildings has also been increasing dramatically. As indicated in Figure 2, the area of new residential buildings under construction and constructed has been increasing on average by 17% and by 13% respectively per year from 2000 to 2014, and has been levelling out around 12.5 billion square meters and 4.2 square meters since 2015 [2]. The fast expansion of residential buildings leads to a substantial increase of total energy consumption in the residential building sector. As illustrated in Figure 3a, the total energy consumed by residential buildings increased to 301 million tons of standard coal in 2014, which is approximately 2.3 times the amount than it was in 2000 [3]. Figure 3b presents the calculated energy consumption intensity in the residential building sector, and indicates that, despite the significant improvement of residents’ living standard, the promotion of new residential building energy efficiency helps the average energy consumption intensity stabilize around 54 kilograms standard coal per year per square meter.
Despite the great contribution, the development of new residential building energy-efficiency promotion in China yet have not achieved the expectations of policy settings [4]. With the rapid increase of annual construction amount and development of social-economy, problems have begun to surface. Currently, the energy-efficiency requirements for new residential building are not tight enough as expected from an international perspective [5]. For example, the on-going standard for energy-efficient design of new residential buildings in Northern China defines an energy consumption intensity of approximately 40 kWh/m2a, whereas in Europe, the Energy Performance of Buildings Directive (Directive 2010/31/EU) stipulates that all new residential buildings should be built as nearly Zero Energy Buildings from 31 December 2020 [6]. What is more, it took China more than three decades to introduce a nationwide energy-efficient design standard system adapting to all the three major climate zones [7]. The first version of the design standard for new residential building energy-efficiency promotion was published in 1986 and limited its application in the Cold and Severe Cold (CSC) climate zone in China. It was not until 2012 that the requirements for energy performance had been introduced for all the new residential buildings nationwide.
Apart from the relatively slow development of these standards, standards’ implementation in practice is low. In 2001, only ten percent of new residential buildings were designed according to the standard and only approximately half of these projects were constructed properly according to the original design [8]. It was not until 2012 that all new residential buildings in limited cities were designed and built strictly following the requirements stipulated in the energy-efficient design standard system. Other problems, such as poor performance of insulations, low comfortable level of indoor environment and rapid increase of building energy consumption, have furthered the urgency for better solutions to the problems in current situation [9]. Other than their existences in one single stage in the life cycle of a building, problems have covered all the phases of the construction process. According to the result of annual inspection dominated by the MoHURD in China, the unsatisfied construction quality and the neglect of surveyor’s duty were the major two problems, accounting for approximately 40% of the projects found to be problematic [10].
Notably, the promotion of new residential building energy efficiency is a complex socio-technical system [11], and it involves a large variety of stakeholders concerned with policy-making, marketing, and technology [12,13,14]. The aforementioned problems are the comprehensive reflections of multiple barriers regarding current policy settings, policy implementation process and the development of relevant markets. These barriers are arguably not fully independent, and they cooperate and interfere with each other as a system [15]. For example, a building design of low energy efficiency may result in a low performance of a building in the operation stage. Besides, the energy efficiency of a building in the design stage is determined not only by the energy-efficiency requirements from governments, but also by the concepts and capabilities of market stakeholders. Despite the great importance of how these barriers interfere with each other, few studies have paid attention to the relations between these identified barriers. Contributing to filling this knowledge gap, this paper aims to build up an analytical framework for organizing all the potential barriers and further identify the barriers of major influence to the energy-efficiency promotion of new residential buildings. Specifically, this paper tries to address the following issues:
(1)
The construction of an analytical framework for organizing all the barriers in one complete system, revealing how the identified barriers would affect each other;
(2)
The identification and evaluation of barriers which are of significant influence empirically and independently based on stakeholders’ perceptions, and
(3)
How the identified barriers will affect each other and what role they play in the building energy-efficiency promotion system.
The rest of this paper is organized as follows: Section 2 structures the analytical framework by introducing the theories of policy cycle and policy environment. Section 3 summarizes the methodology in barriers’ identification and evaluation. Section 4 describes the result of data processing and discussed the relationships of all the identified barriers. The corresponding conclusions are summarized in Section 5.

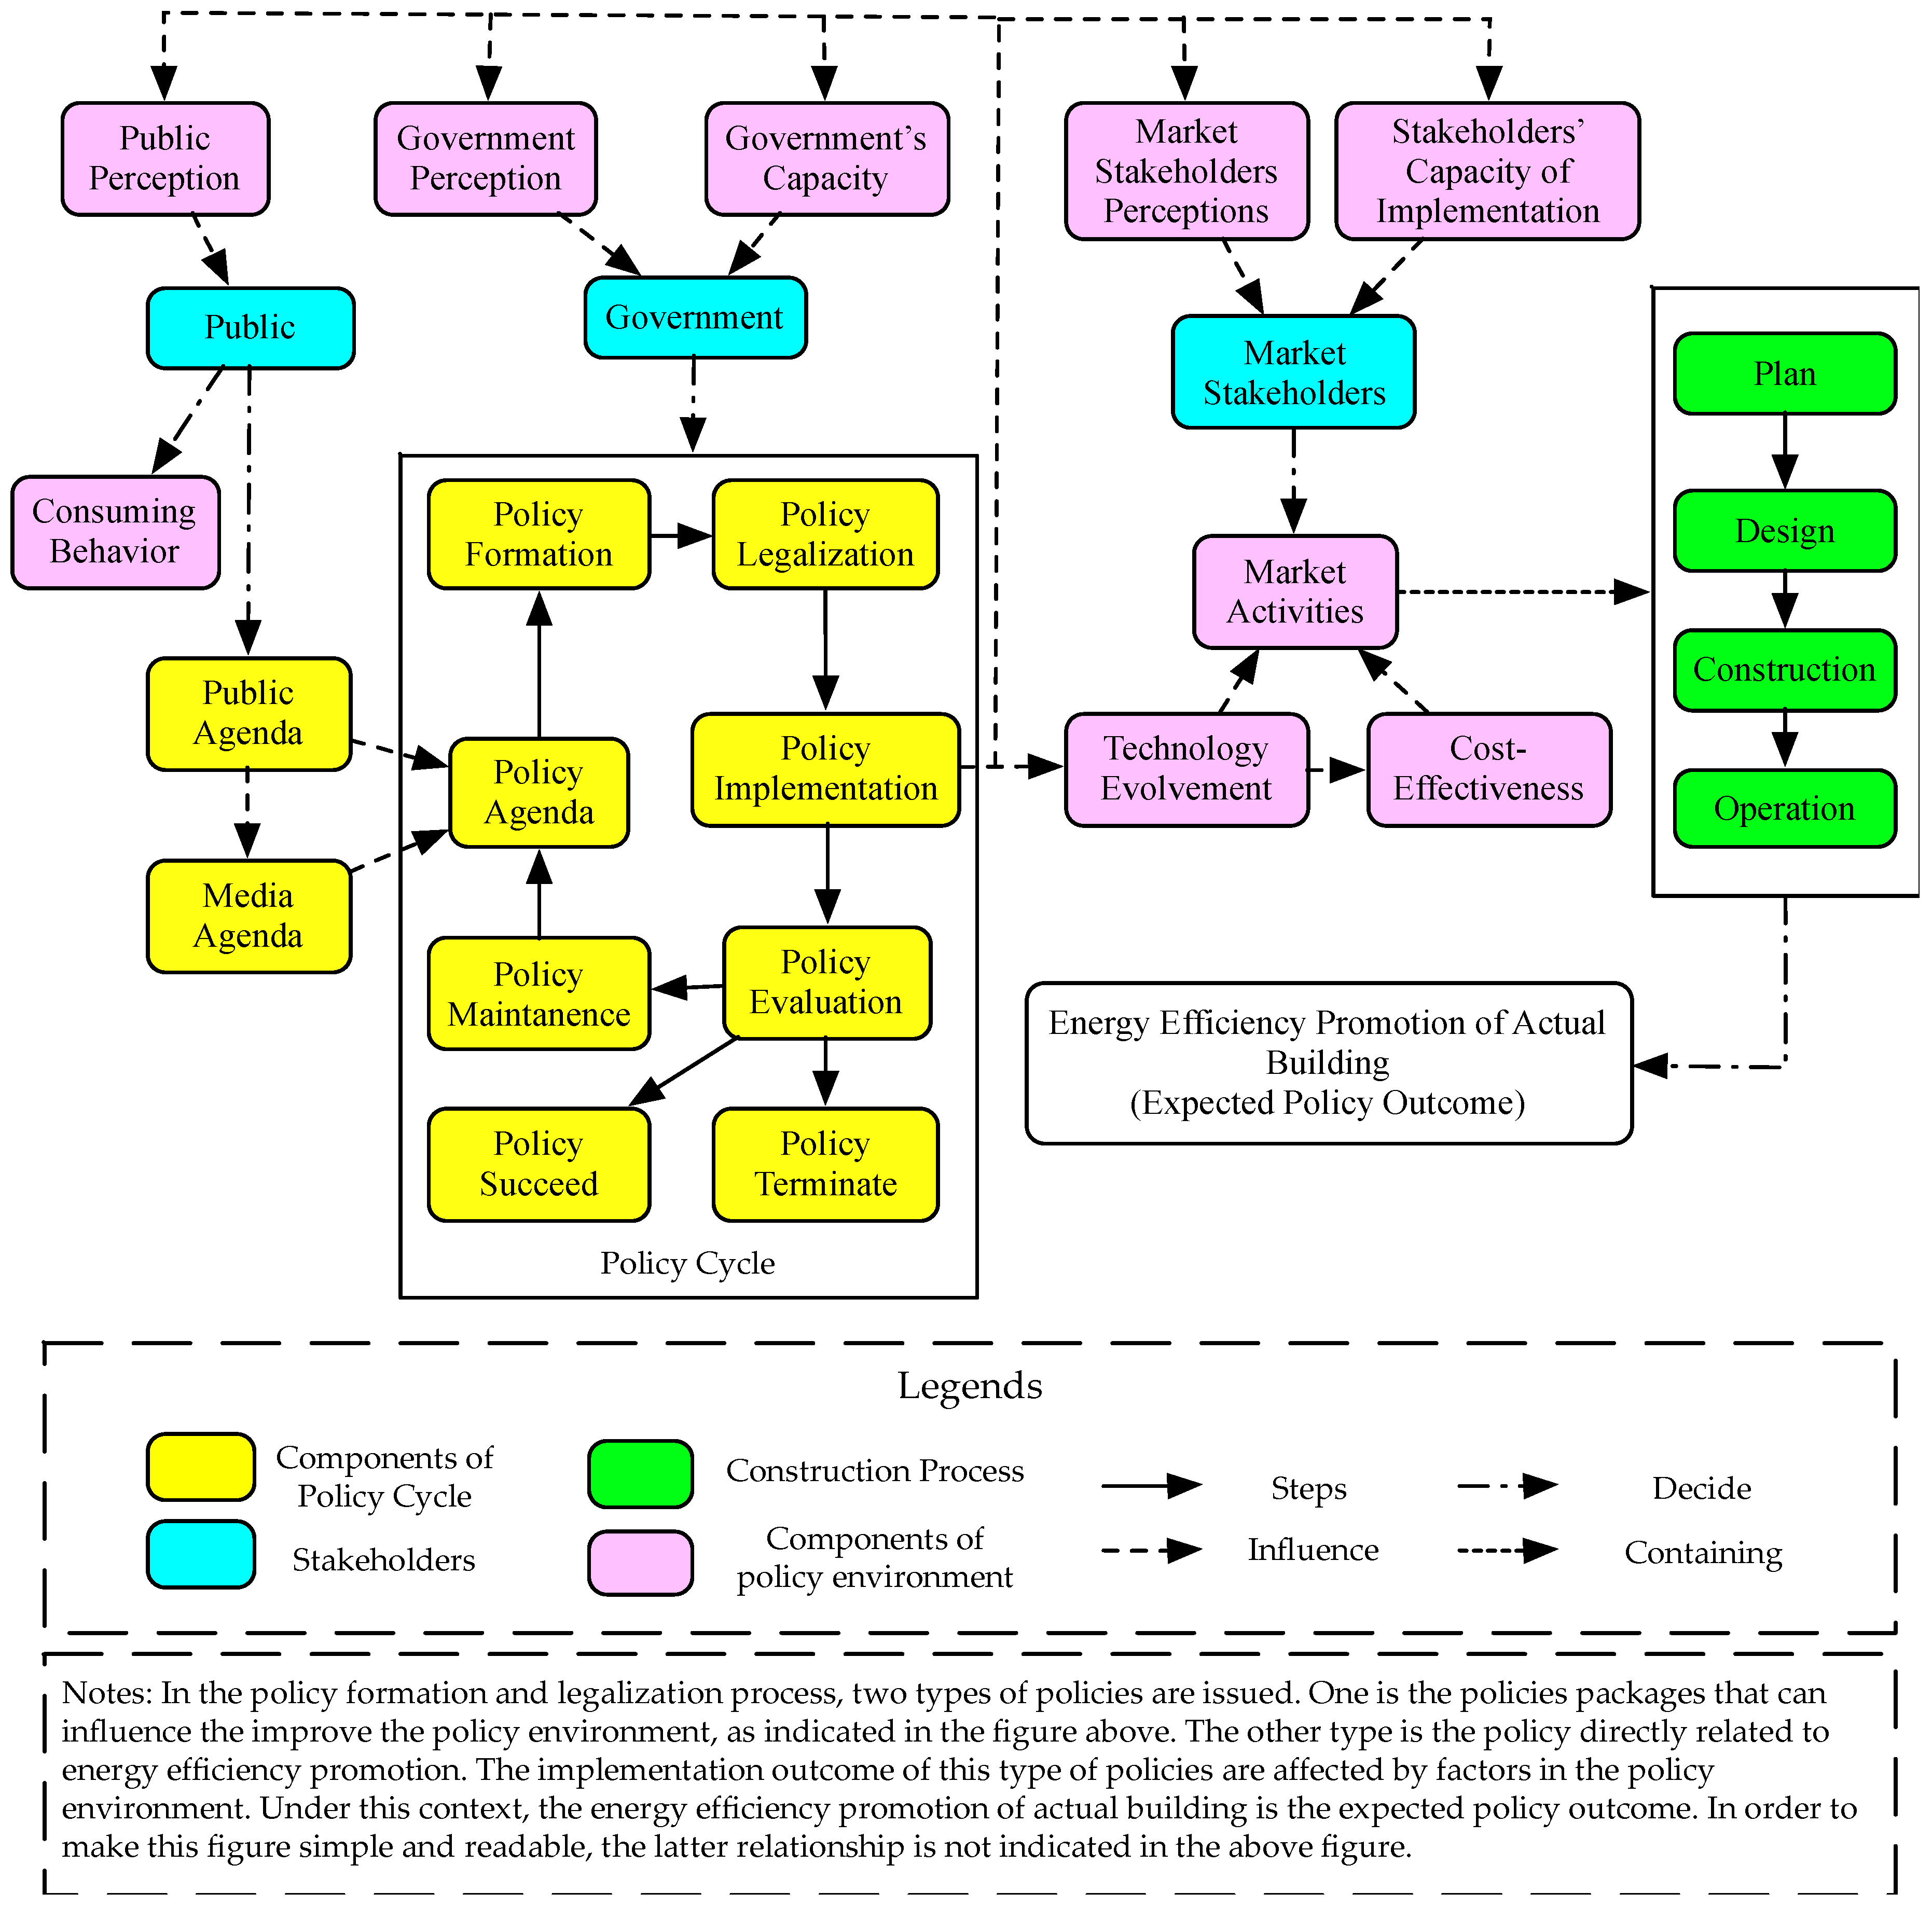
2. Introduction of the Policy Cycle and Policy Environment Theory

Governments in current China own the strongest discourse power and with abundant policy resources, they can regulate market stakeholders’ activities by a variety range of policy instruments in current policy system [16]. For example, current national policy settings in China has introduced mandatory energy performance standard and market access mechanism so that residential buildings can be designed and constructed according to a specific energy-efficiency level, and those housings of a lower energy-efficiency level are not permitted to be traded [10]. Most provincial and municipal governments have also introduced the market access system for building insulation materials to assure their quality and the corresponding performance [5]. In addition to regulations and mandatory requirements, current policy settings in China also introduces financial incentives for the development and construction of green buildings and buildings of higher energy performance, such as the “Passive house” [16,17]. Other policy instruments, such as tax reduction, information campaigns can also be found in current policy system [5,17]. Considering the interplays of energy-efficiency promotion policies, this paper highlighted the policy system on energy-efficiency promotion of new residential buildings as a whole, instead of focusing on one particular policy. This was also to avoid pre-assuming which particular policy is perceived significant by stakeholders. The span of policy system not only covered the policies directly related to the energy performance of a building such as References [10,16,17], but also extended its focus on the policies affecting the popularization of high-performance new residential buildings and the massive adoption of technologies, materials and equipment of higher energy efficiency in the life cycle of a building such as Reference [5]. Both types of policies were equally considered in regard to forming a better policy design whilst the latter type of policies were taken into consideration when analyzing the barriers to the better implementation outcome of the former type of policies.
To better understand how should a policy is designed and how well it can be implemented, this paper introduces the policy cycle theory, proposed by Howlett, to organize the barriers found in the policy-making process, and the policy environment theory, proposed by Bracco, to organize those in the policy implementation process. The theory of policy cycle [18], along with the theory of policy environment [19], provides a panoramic picture of how the stakeholders play the game in the energy-efficiency promotion process in new residential building sector. The former illustrates how a policy is made and the latter provides the theoretical framework of identifying and categorizing factors affecting the outcome of policy implementation.
The policy cycle normally consists steps of agenda setting, policy formulation, legalization, implementation, evaluation and maintenance/succeed/terminate [18]. “Agenda setting” is the first step in the process when a problem is raised by policy actors and solutions put forward. The goal of agenda settings is to transform public needs, political needs, and expectations of policy-makers into policy design, thus realizing the expected policy outcomes [20]. Public agenda, media agenda and policy agenda, as three major types of agenda, often link and interact with each other. The public agenda, the raiser of which is the general public, reflects the direct voices from either residents or home-buyers. The media agenda, raised by the mass media [21], plays multiple roles, such as supervising governments and expressing public opinions [22]. It can help transform public agenda into policy agenda, but, unlike residents/home-buyers, it does not produce real, direct and stable demand. “Policy formulation” means the specific policy package design within the government. The design process mainly focuses on the possible and feasible policy instruments/solutions which are highly favored by various factors. “Legalization” is the third stage of a policy cycle and it means the outcome of policy formulation—a particular course of action—is adopted by formal actors in the government. The fourth stage of a policy cycle is the “Policy implementation”. In this stage, a series of public administration instruments are utilized by governments to alter the allocation of goods and services in society, therefore enabling the governments’ decisions to be put into effect in a way compatible with the preferences of the affected parties. Finally, the “Policy evaluation/maintenance/succeed/terminate” refers to the stage in which the outcome of policy implementation are monitored by both government departments and societal actors. The monitoring results further determine whether the policy should be maintained, succeeded or terminated. If a policy is determined to be maintained or succeeded, a new iteration of policy cycle will start and the problems encountered in the implementation process will be reconceptualized [20].
Whereas the agenda setting focuses on the policy making, the theory of policy environment takes factors beyond the full control of governments into consideration when policies are implemented [23]. According to the current literature [15], this paper defined the complete policy environment in the new residential building energy-efficiency promotion industry by identifying four major parts constituting the policy environment, namely, Market, Economy, Technology, and Capacity Building. Correspondingly in this paper, the Market part focused on potential barriers affecting the penetration of high-performance buildings and green technologies and products, by inspecting stakeholders’ expectations and policy settings since they both affect and are affected by each other dynamically [24]. Barriers in the Economy part centered on the cost-effectiveness of technologies and projects. Except for the macroeconomic factors, such as currency inflation, the cost-effectiveness of a technology is also determined by the implementation cost and actual energy conservation, and that of a project is determined mainly by the selection of different technologies under certain energy-efficiency requirements. Either the former or the latter is further determined by the level of marketization of relevant technologies and products, which refers to the availability of the technology tank that contains both technologies of leading energy efficiency and those that can be applied massively [25]. The Technology part focused on the leading technology evolvement and its application. It referred to the barriers hindering the research and innovation of new technologies of either higher performance or lower difficulty in implementation. Finally, barriers in Capacity Building field referred to the lack of the stakeholder’s ability to accomplish specific goals or missions. Additionally, the lack of capacities comes normally from within the institution itself rather than from boundary conditions. Accordingly, concerning energy-efficiency improvement in the residential building sector, policies stimulating relevant stakeholders should not only increase their willingness to participate in the energy-efficiency promotion process but also improve their abilities to realize the target.
In addition, this paper also tried to identify the barriers in the Concept field as a supplementary to the application of above theory. Concepts, together with other factors such as the capacity, determine the way in which stakeholders make their decisions participating in energy-efficiency promotion projects. Additionally, their voices also play a vital role in the policy-making process [26,27]. The promotion of new residential building energy-efficiency involves a few stakeholders with diverse social, environmental, and economic interests [28]. Li et al. [29] proposed that government departments have the most significant influence. House owners as well as end-users have the second utmost influence. The property management enterprises and non-governmental organizations have the least significant influence. Making decisions without considering stakeholders’ voices may lead to confrontation, dispute, disruption, boycott, distrust, and public dissatisfaction [30]. Careful consideration of voices from frontline stakeholders will, on the one hand, help policy-makers collect more information and resources, thus enhancing the evidence base of policy instrument selection and policy package development, and, on the other hand, increase compliance and, eventually, render the outcome of the policy implementation process more legitimate. However, the “Top-Down” policy-making process dominates in current China. The policy decisions depend significantly on the attitudes of a specific set of political actors when the policy formation and decision-making process take place [31].Their attitudes are further affected by governance arrangement, institutional rules and the ideas that are prevalent in the jurisdiction at the time. Stakeholders neither have sufficient chances to report their voices to the decision-makers nor have the opportunities to participate in the policy-making process.
A complete system of how the stakeholders interacts with other is summarized in Figure 4.

3. Methodology

The survey and data processing method are threefold: (1) data collection and processing by questionnaire distributed to various types of institutes; (2) data processing by cluster analysis; and (3) comprehensive analysis of the identified barriers.
To collect as much existing barriers as possible, open-ended questionnaires were utilized and distributed to the selected thirty-two institutions in China. The selection of institutes took the differences in climate, socio-economic development level, and property of institutes into consideration. New residential buildings constructed in different climate zones achieve the same level of energy efficiency at different rates. Climate differences also lead to different technical strategies and solutions for achieving the same energy-efficiency level. There are three major climate zones in China, namely the Cold and Severe Cold climate zone (CSC), the Summer Hot Winter Warm climate zone (SHWC) and the Summer Hot Winter Warm climate zone (SHWW). The socio-economic development level represented by Gross Domestic Production (GDP) per capita indicates the difficulty in sharing/undertaking the incremental cost caused by energy-efficiency promotion. It further indicates the possibility of massive propagation of residential buildings of higher energy efficiency. The consideration of institutes’ properties was mainly based on the role which various institutes play in the industry. The externality of new residential building energy-efficiency promotion makes it hard for developers to profit from developing new residential buildings of high energy performance. However, it is strongly favored by provincial and municipal authorities due to policy influence and potential benefit, such as increasing job opportunities. Four types of stakeholders were correspondingly selected. Governments referred to relevant departments on national, provincial, and municipal level, as they own the strongest discourse power in current governance arrangement in China and are the decision-makers of policies. Research institutes included universities, colleges and other institutes focusing on the Research and Development (R&D) of high-performance technologies and policy innovation. It was assumed by the author that they are more aware of the leading concepts than the other stakeholders and they can provide responses based on both theoretical and empirical knowledge. Design institutes were those companies in charge of the design of high-performance buildings. They are most familiar with those wide-spread and maturely developed technologies, as well as the barriers to the massive adoption of high-performance technologies. Enterprises, in this paper, refers to the developers and material/equipment manufactures as they are most familiar with the barriers in the market field. Overall, twenty-nine institutes were identified; a detailed description of the institution selection is shown in Figure 5.
The reason why the questionnaire was distributed to institutes rather than experts lay in the governance arrangement of institutes in China. Questionnaire respondes from institutes involve more experts participating in the investigation process. Once the questionnaire is delivered to a certain institute, managers (college deputies and heads of other government departments and public institutions) will break it down and send them to different departments. Experts in each department will first fill in the questionnaire based on their perceived experiences and their research domains. A follow-up workshop, where all the responses from experts and corresponding reasons are stated and discussed, will be conducted to find the most agreed-upon answers to the questions. When approved by the manager of the institute, the most agreed-upon answers will be the formal response. Therefore, a formal response from an institute can be seen as the result of the negotiations among experts of different majors and professional ranks.
In order to further improve the representativeness of the responses and to achieve more reliable feedback from different stakeholders, additional requirements were put up for those selected institutes. These requirements were: For Government Departments—Advices on the response to the questions in the questionnaire, from same-level departments, such as financial departments, industrialization departments, and quality supervision departments, should also be collected when completing the questionnaire. For Other Institutions—Opinions reflected in the questionnaire should be a combination of opinions from high-level decision-makers, frontline workers, and other individuals from the same kind of stakeholder involved in the industry.
As for the data processing of the collected opinions, all the proposed barriers were classified into categories and sub-categories according to the theory of policy making and policy environment. The total frequency of all the barriers in one sub-category represented the corresponding popularity perceived by experts in the institutes. However, the popularity of an identified barrier cannot represent its severity, or to what extent and how will the identified barriers affect the whole industry. Therefore, a second round of questionnaire was distributed to the same institutes to collect their opinions on the severity of all the identified barriers in each sub-category. The Likert 5-Scale was utilized for the evaluation by institutes. The correspondence between the scoring and perceived severity of the barriers (or how much the influence is) is presented in Figure 6.
Four descriptive statistics indexes were utilized to describe the collected data quantitively, namely the Mean value (M), the Variance value (V), the Kurtosis value (K) and the Skewness value (S). The M value represents the experts’ average judgement on the severity of an identified barrier quantitatively, whereas the V value represents the diversity of their judgements. The analysis of K and S values are associated with the distribution of institutes’ scoring distribution. A high K value means a high concentration of institutes’ opinions to a certain evaluation score whereas a high positive S value represents an extreme negative attitude of opinions toward the average judgement. Correspondingly, the following principles were applied for evaluate the robustness of the experts’ judgements:
(1)
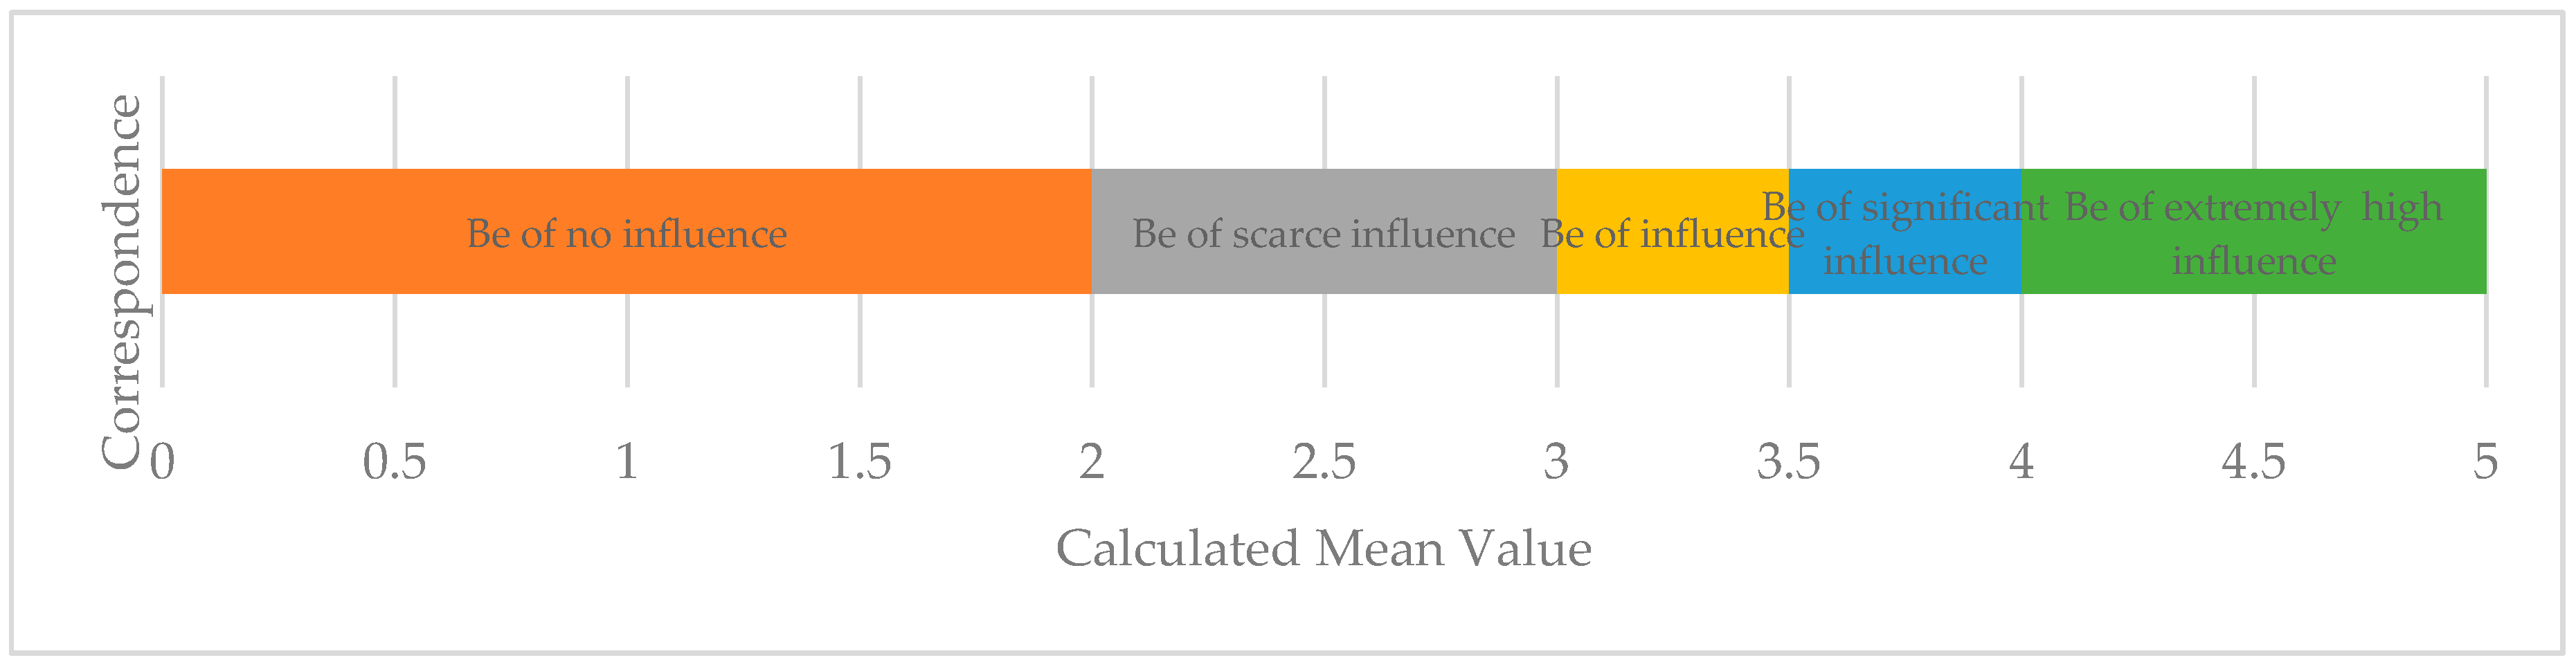
If the M value of an identified barrier exceeded 4.0, it was considered by the author that, according to the Likert 5-Scale, institutes’ evaluation opinions were so concentrated that the agreement could be considered as achieved. The evaluation results of the identified barriers were robust, and the severity of the identified barrier was of extremely high influence. Correspondingly, the judgement “R-0” was given to the identified barrier.
(2)
If the V value was rather small, it meant that agreements among the investigated institutes can still be considered achieved despite the minor judgement difference. Correspondingly, the judgement “R-1” representing “Robust due to small variance” was given to the identified barrier and the severity was determined by the M value of institutes’ scorings.
(3)
If the V was not small enough, the evaluation of institutes’ opinions took the K and S values of scorings into consideration. If an identified barrier had a high V and K simultaneously, it meant that the high V is caused by the appearance of extreme value. When two barriers had the variance values of the same level, a positive K meant the distribution of the scoring was considered acceptable as it compares with the natural distribution. The negative S meant the distribution peak is larger than the average value. Under this circumstance, experts tended to believe that that the actual influence of the identified barrier should be larger than the M value indicated.
However, it was hard to tell whether the V is small enough so that the third principle should be applied. Therefore, this paper adopted the Cluster Analysis for further study. Cluster analysis is a popular statistical data analysis technique that aims to find groups of closely related observations. Under this context, the observations in same cluster are closer than are those of other clusters. For numerical data, the cluster result is determined by the distances of each number in a specific set to the mean value of all the numbers in the group-that is- each number should be closer to the mean value of its cluster than it is to the mean of any other cluster [32,33]. In this case, the hierarchical clustering method was utilized. The “Inter-Group Linkage Method” was chosen, and the “Squared Euclidean Distance” was calculated to measure the distance. The clustering process was based on the calculated V, K and S value of each identified barriers as each of them represents one aspect of experts’ scoring.
The comprehensive analysis took both the frequency of a barrier and its evaluated severity into consideration. After selecting those barriers were perceived to have great influence agreed by most experts, this paper further analyzed their interactions by applying these identified barriers into the system as shown in Figure 4.

4. Results and Discussions

4.1. Results of Barriers’ Identification

The open-ended questionnaires were distributed to thirty-two institutes and twenty-nine of them responded to the research team. The identified barriers were mentioned 108 times in total in all the responses. Table 1 summarized the collected opinions and additional explanations from the investigated institutions and gave a relatively complete overview of the barriers that the energy-efficiency promotion of new residential buildings face. These collected barriers were classified into six categories according to analysis in Section 2. For each identified barrier, sample reference was added to the description to give a further and detailed explanation of the barrier.
As for the barriers in the concept field, the concepts of home-buyers received the most attention (CO3, F = 18). It can be therefore inferred that home-buyers’ perceptions is most widely spread barrier nationwide. Home-buyers are not only the stakeholder who purchases the high-performance buildings but also the one produces the real demand for residential building energy-efficiency promotion. However, at this current stage, they are not fully aware of the benefits of high-performance buildings. In addition, the institution deficiencies, such as the lack of advertisements or cascade energy price system, also prevent home-buyers/residents to directly feel the benefits of high-performance buildings.
As for the concepts of other stakeholders (CO4), the identified barriers lay in a paradox condition. On the one hand, various kinds of new concepts regarding new residential building energy-efficiency promotion, such as Passive house and net Zero Energy Building (nZEB) has been being proposed continuously. Pilot projects are also encouraged by central/local governments via financial subsidy. On the other hand, most enterprises still have a biased understanding of new residential building energy-efficiency promotion. They are aware of the externality, but they believe that developing/constructing high-performance will not produce more benefits than ordinary construction projects. The instability of the incentive policies, the lack of propagation as well as the lack of long-term national/provincial/municipal developing plan has also furthered the situation.
The identified barriers in the market system focused on three major aspects of market development, namely the marketization process (MA1 and MA3), the legalization level (MA2 and MA4) and market-based regulating measures (MA5). In general, the market of energy-efficiency products is adequately developed but the market of high-performance building materials and HVAC (Heating, Ventilation, and Air-Conditioning) equipment is still under development. On the one hand, the production amount of energy-efficient products can basically meet the demand and, on the other hand, there is still room for the further promotion of building energy efficiency. Notably, the market condition is not as healthy as expected. The “Market Access System” as well as other measures regulating stakeholders’ behaviors are not implemented strictly. The lack of specific market credit system has furthered the situation. There are also illicit competitions and the products of poor-quality wins under certain circumstance, especially in the building materials market. Another major barrier in the market system is the “lack of incentives” (MA6). Opinions collected indicated that current incentive polices cannot effectively motivate the market due to some deficiencies in the institution system such as “the Pre-Sale System”. In addition to financial subsidies, stakeholders are expecting incentives of higher effectiveness and easy to implement.
Technology evolvement (TE1 and TE2), as the foundation of the promotion of new residential building energy-efficiency promotion, received fewer mentions according to the results of investigation. It was considered by the author that the existing technologies can still meet the baseline requirements of massive propagation of energy-efficient buildings. However, in association with the barriers identified in the concepts field, the leading technologies, or technologies of high quality, energy efficiency and stability, is still in urgent need.
The cost-effectiveness of technologies and projects also play an important role in promoting new residential building energy efficiency [34]. There were respectively three and four major barriers identified from the cost (see EC1) and benefit perspectives (see EC2). The adoption of high-performance technologies leads not only to the increased technology cost, but to the high labor cost as well. However, the current energy prices system and the poor operation of new residential cannot effectively translate energy savings into real benefits.
The capacity of various stakeholders depicts the possibility of how well a policy, or a project can be conducted [35]. Currently, most of the design institutes lack the capacity to develop design plans of higher energy efficiency (see CB1), from district perspective, by taking surrounding resources and primary energy into consideration. The implementation capacity (CB2) referred not only the enterprises’ capacity in constructing high-performance buildings, but governments’ ability to cooperate with other departments and to achieve a better outcome of policy implementation. However, the identified barriers in this aspect indicated that the results of construction and policy implementation has not got the expected results. Besides, the lack of supervision capacity (CB3) was also identified as a major cause for the unsatisfying building quality and the lack of assessment capacity, to some extent, leads to the low effectiveness translating the energy savings into real benefits for enterprises.
Last but not least, barriers in the current policy setting systems were also identified. Barriers in the aspects of financial support (PS1) and the policy design (PS2) received high attention from the investigated institutes, revealing their great popularity nationwide. The investigated institutes believe that current financial subsidy from governments is not as enough as expected and is hard to achieve due to the over-complicated application process. Barriers identified in the policy design field received the second most attention as presented in Table 1. These barriers were not only concerned with the law and regulation system, the incentive policy system, but the standard system as well. The “Regulation for Energy Conservation in Civil Buildings” was published in 2008 and had not been updated since then. In addition, it is also seven years since the first publication of the energy-efficiency standard of 65% level. The rapid development of the industry has made it rather easy to achieve this energy-efficiency targets nationwide. Government departments, as well as the market stakeholders, are all calling for a standard of higher energy efficiency under the requirements of multiple national plans and programs.
As for policy implementation (PS3), it was pointed out by the investigated institutes that the current jurisdiction of government departments is not as clear as expected. The implementation outcome of the policy is thus affected. In addition, current policy settings cannot motivate the stakeholders effectively and the preference of the whole system also remains unasserted.

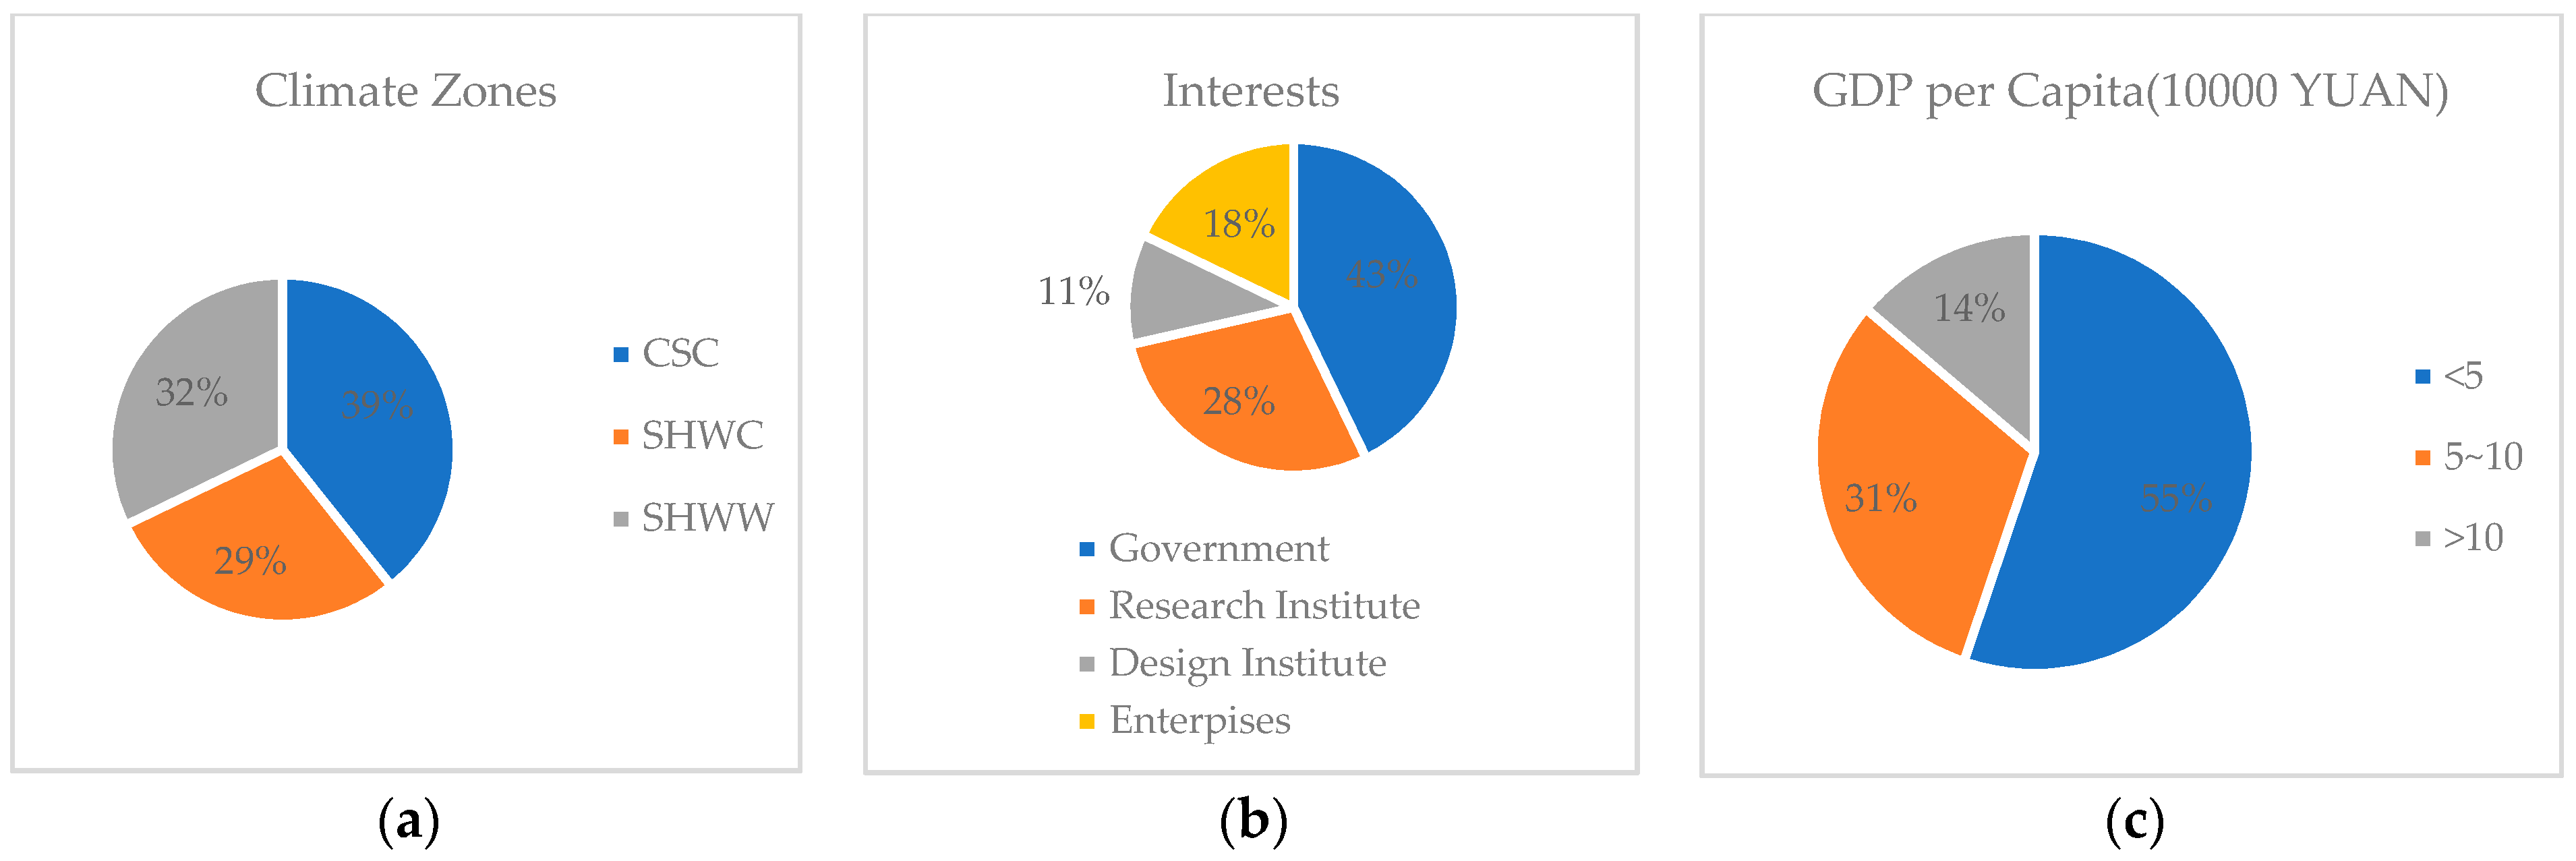
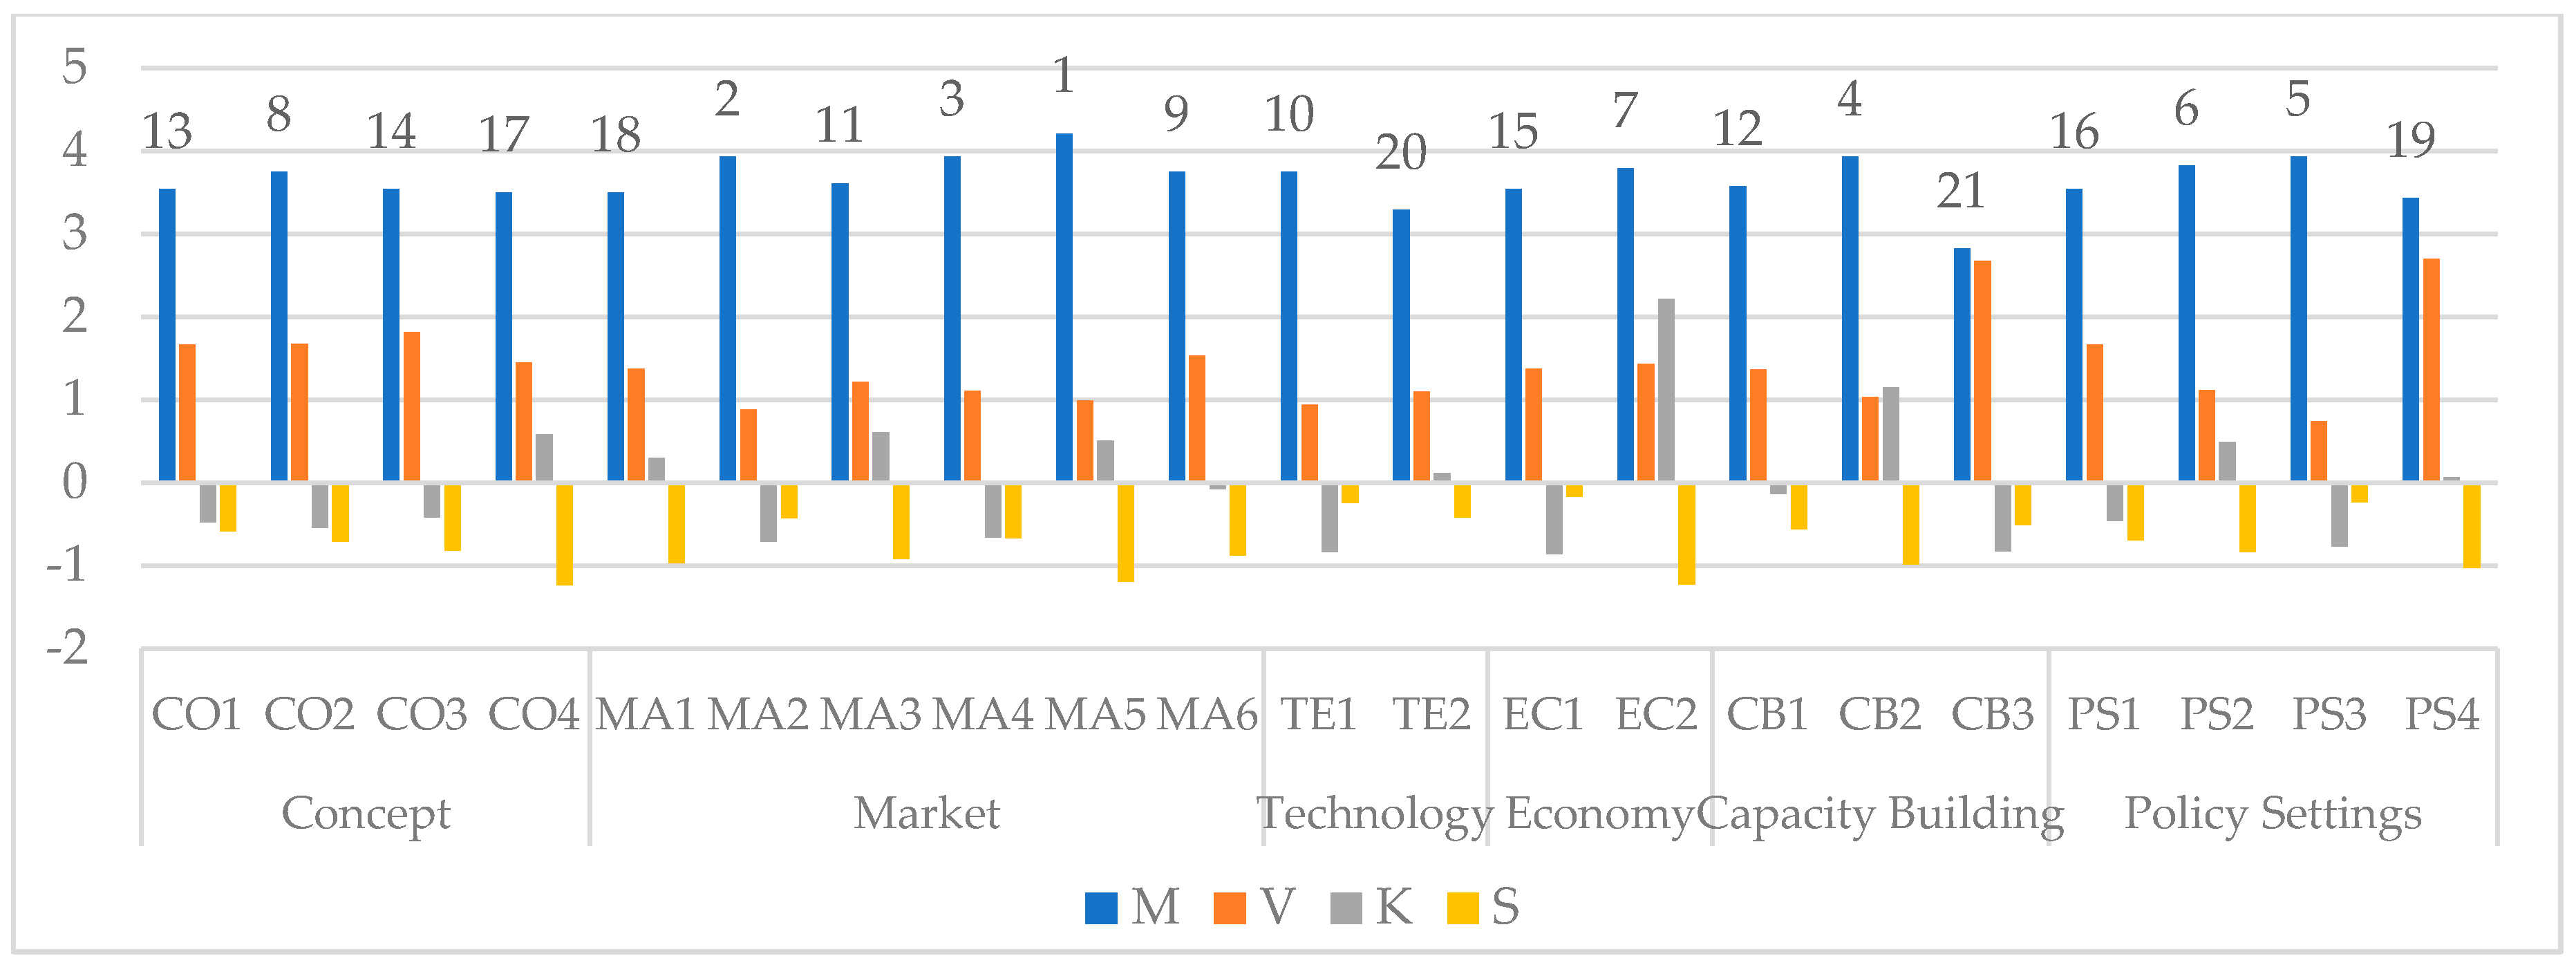
4.2. Profile of Evaluation Opinions from Institutions

The institutes’ opinions on the evaluation of the severity of all the identified barriers were plotted in Figure 7a, by demonstrating the M value and V value of institutes’ scorings. Among the identified barriers, the barriers CB3 and PS4 stood out due to their extremely high variance value (2.671, 2.698, respectively), which revealed that the institutes had not come to an agreement on the severity of the barrier “lack of inspection and supervision capacity”, and the “lack of guiding ability of policies”. The MA5 had an extremely high average value (4.21) of severity indicating the importance of credit system in the future development. The TE2’s low M and V values indicated that, agreed by experts, the lack of construction requirements will not have significant influence. In the meantime, most of the identified barriers were evaluated to have great influence as they had relatively low variance value (smaller than 2) and high mean value (over 3.5 according to Figure 6). In addition, these identified barriers tended to cluster. The M values of these barriers ranged from 3.5 to 3.93 and the V values ranged from 0.73 to 1.83.
Figure 7b presented the K and S of each identified barrier. Approximately half of the barriers had positive K values and all of them had negative S values. This indicated that all the investigated institutes tended to believe that the barriers had a higher severity than the M value indicated, whereas the distribution of the K values indicated that only approximately half of the barriers could be considered as agreed by all institutes, since the positive K indicates a more concentrated distribution of scoring than the natural distribution.
Figure 8 further presented the M, V, K, S and corresponding M ranking of all the identified barriers. On average, the barriers in the Market field were at the top of the average ranking (7.3), followed by those in Economy (11), Policy Settings (11.5), Capacity Building (12.3), Concept (13) and the Technology Evolvement (15) aspects. The average ranking of all the identified barriers indicated the severity of the barriers in different aspects. Perceived by the investigated institutions, barriers in the market system were forecasted to have the greatest influence. The ranking of MA2 and MA4 indicated that the market environment is not as healthy as expected. The lack of laws, standards or the other measures regulating market stakeholders’ behaviors has resulted in unfair competitions, such as the “Bad Money Drives The Good Money Out Of Circulation”. However, institutes also believe that the market credit system can be a solution to these barriers, as indicated by the ranking of M5.
Barriers in the Economy field, the Capacity Building field and the Policy Settings field had similar rankings on average. However, the ranking of the barriers in respective field also indicated the major barrier to the industry. Despite the minor difference of variance value between EC1 and EC2, investigated institutes held the opinion that the barriers from benefit aspects are of greater importance than those in cost field (as indicated by the K and S values). It can be therefore inferred that market stakeholders are willing to increase the cost, only if the energy savings can be effectively translated into real benefits. In the policy settings field, institutes believed that a proper design of policy settings and the corresponding implementation are of more importance than short-term financial support or the guidance from the policy systems. The corresponding conclusion was also proved by the ranking of CB1. Currently, stakeholders are faced not only with the question of how to improve their own ability to conduct projects of high-performance buildings, but also with the unsatisfied effectiveness of governments and the biased implementation of policy incentives.
Barriers in the Concept field ranked the second last on average and they all had similar variance values. Under this circumstance, only the barrier CO4 could be evaluated as agreed by investigated institutes. However, it is of little influence on the industry.
Finally, the barriers in the technology field had the least average severity. Despite the great importance of technology in translating building energy efficiency promotion targets into real projects, the barriers in this field had little M values. It was considered by the author that, at this current stage, the evolvement of technology can meet the basic requirement of building energy efficiency. There is still time for the development and perfection of high-performance technologies.

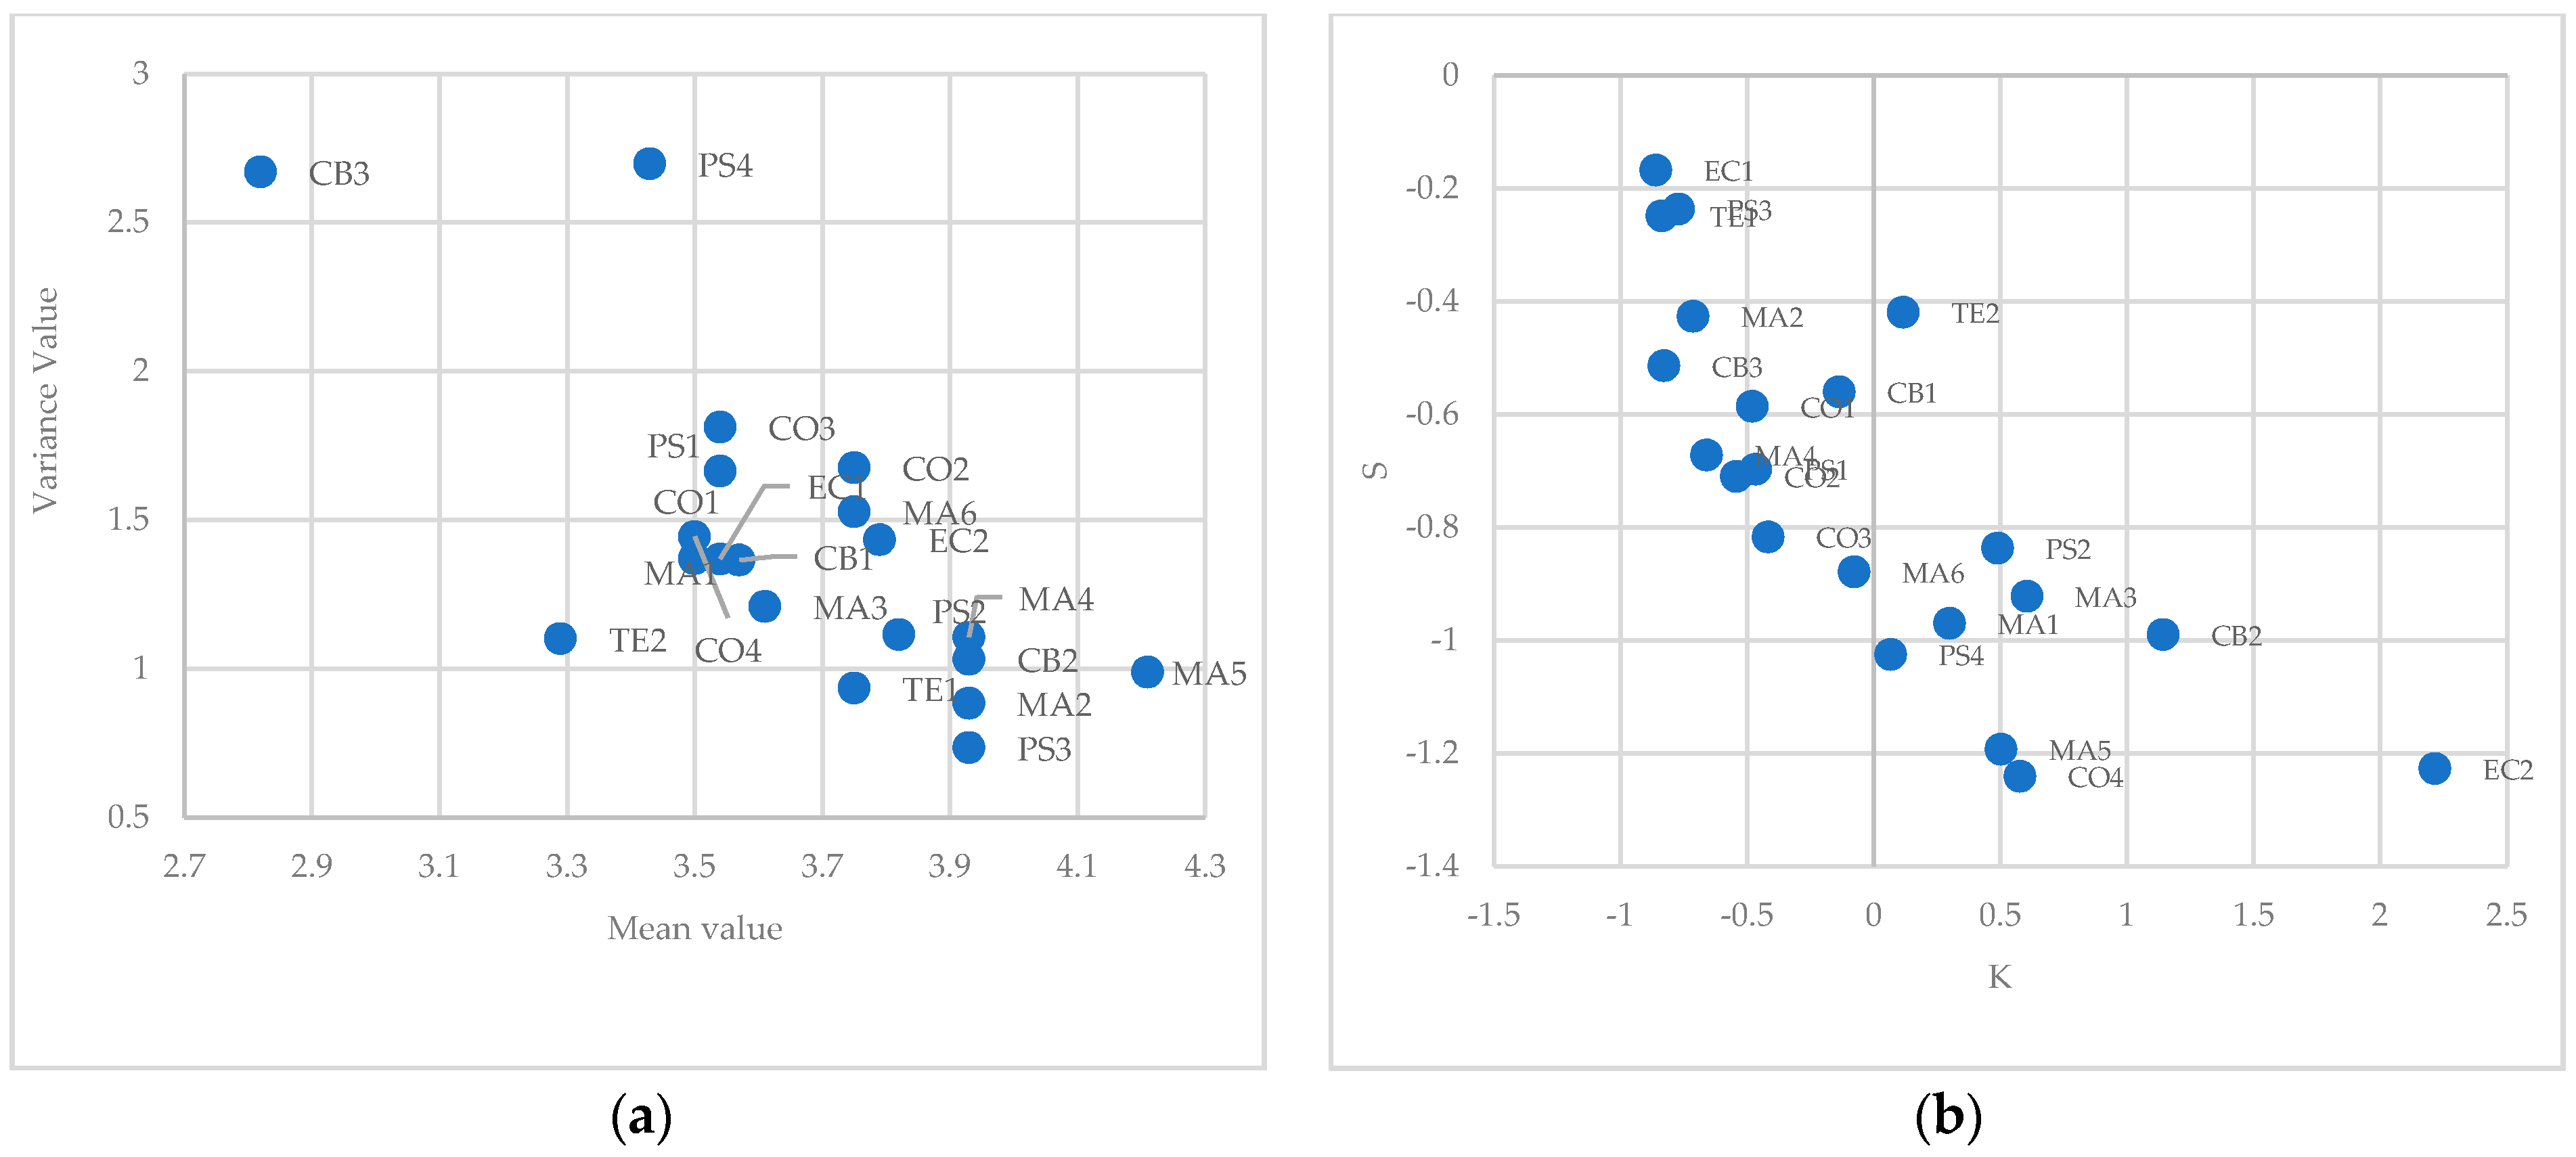
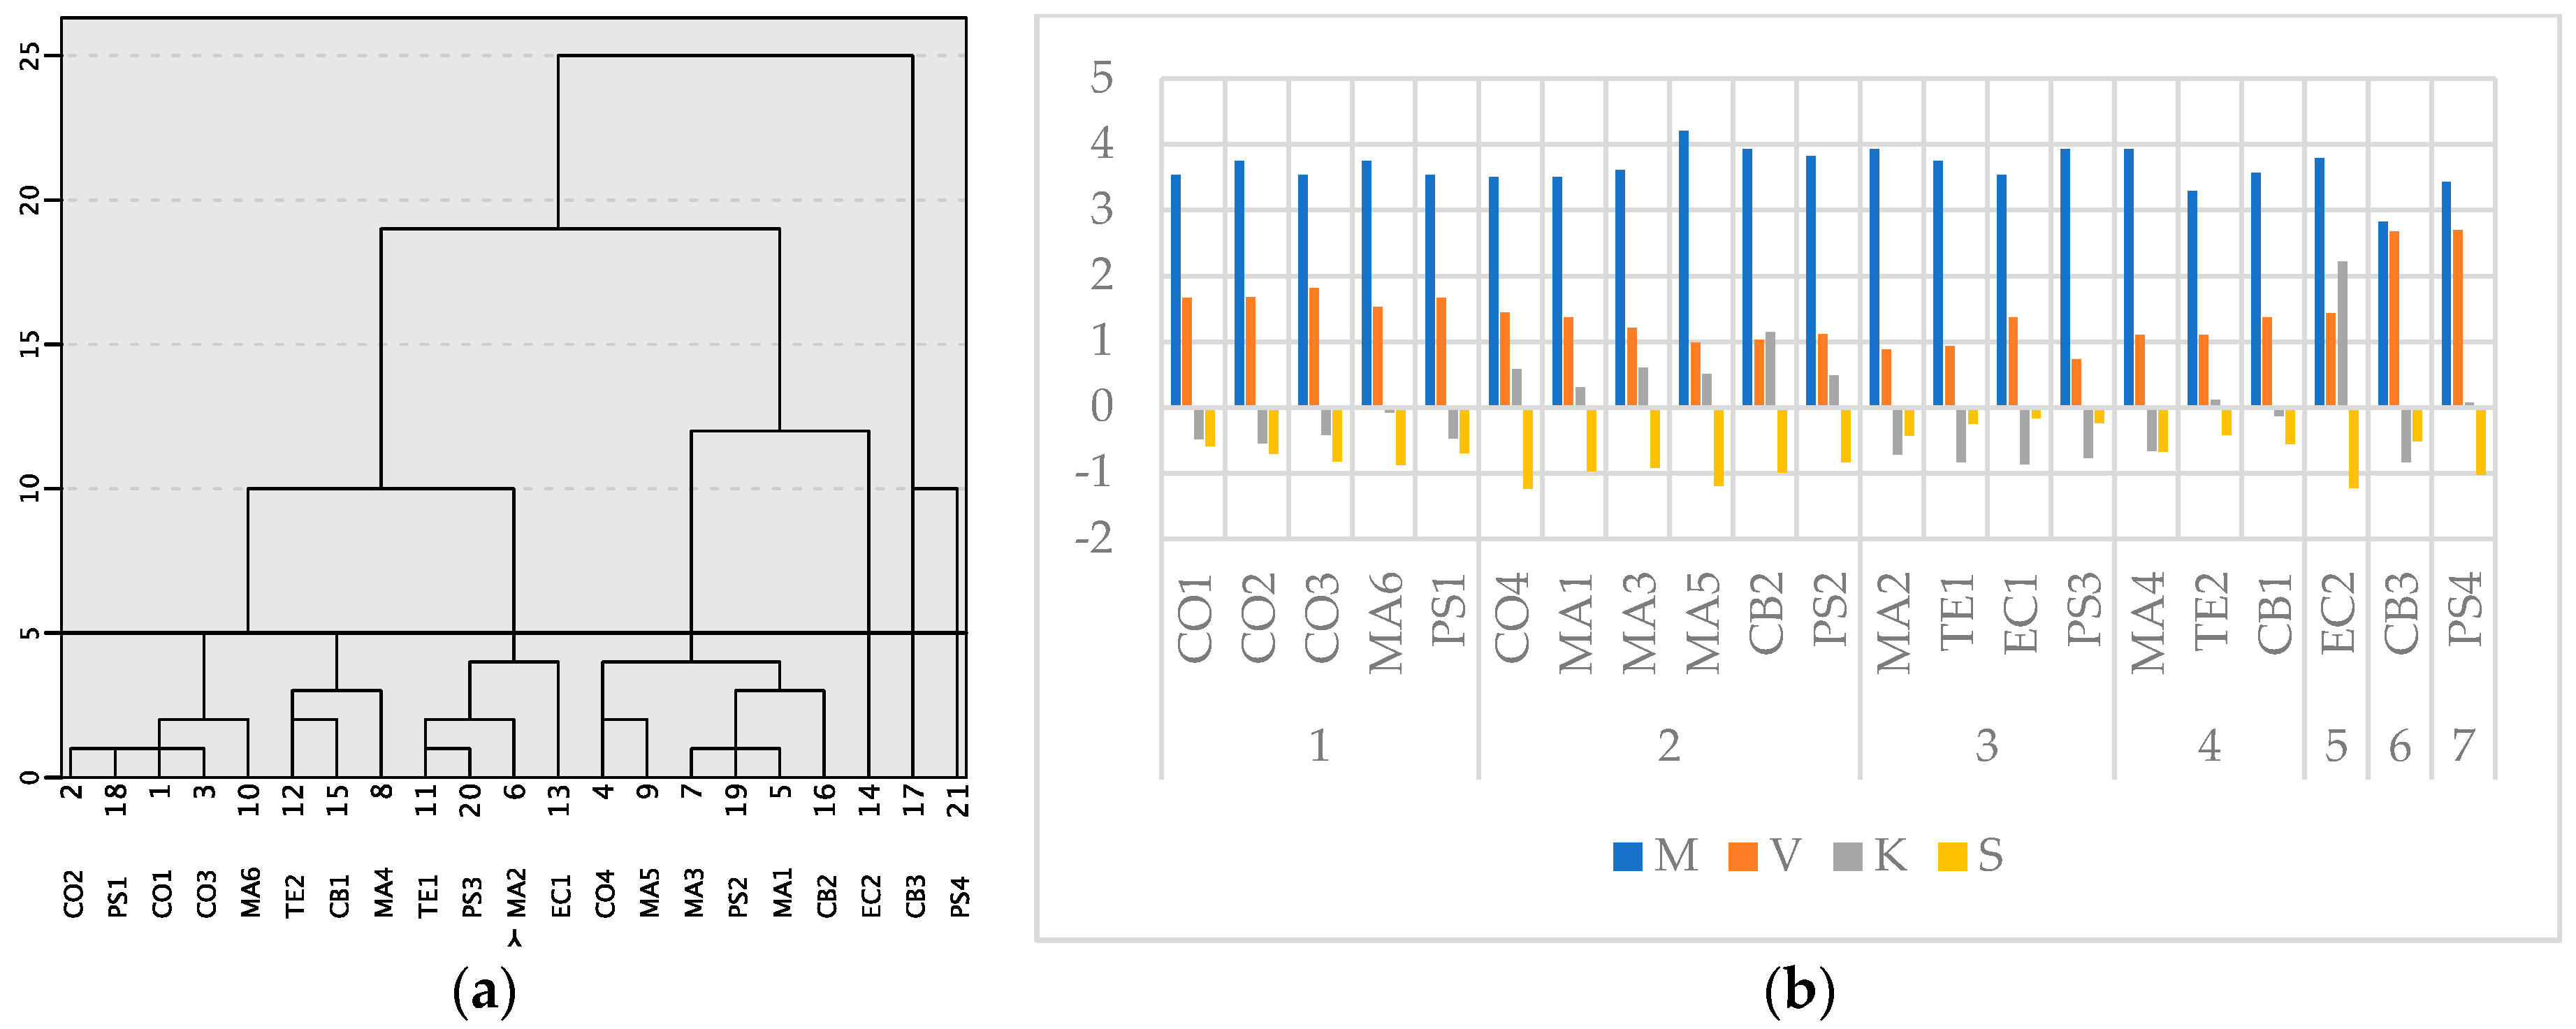
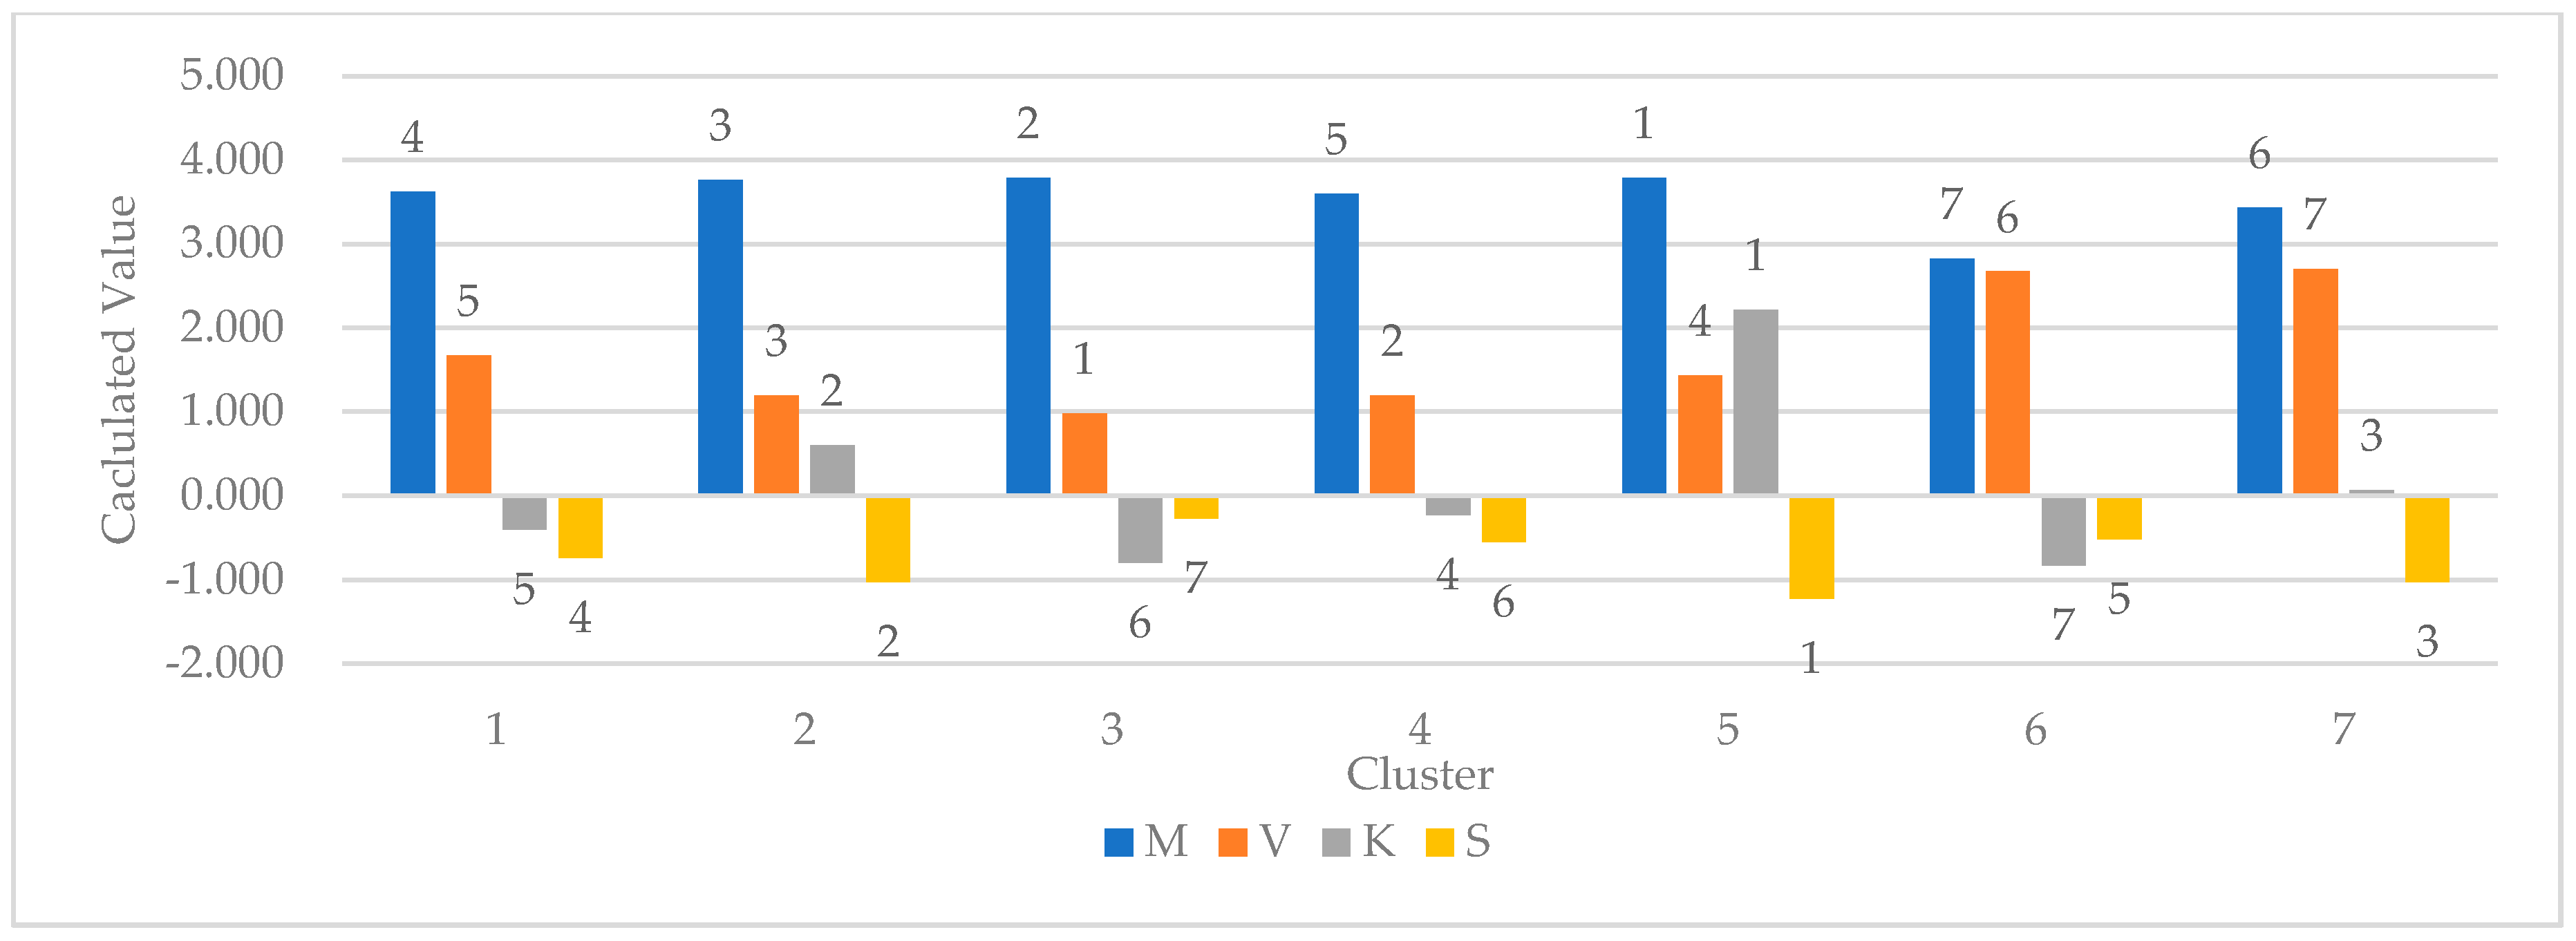
4.3. Results of Cluster Analysis

The result of the clustering process—the dendrogram—is shown in Figure 9a. With the increase of the measured distance, the number of clusters decreased and so did the similarities between elements in the same group. When the distance between clusters was smaller than 5, the number of clusters increased fast and dramatically. Therefore, the distance of 5 was identified as the standard and seven clusters were identified.
Figure 9b depicted the M, V, K, S of all the barriers and classified them according to the results of clustering. In accordance with the analysis in the Section 4.2, the CB3 and PS4 were classified into two different clusters due to their extremely high variances and they had significant different K values. For the remaining identified barriers, they were correspondingly classified into five categories according to their V, K and S. Figure 10 summarizes the average value and the corresponding ranking of M, V, K and S of each cluster. The ranking of M and S values is in descending order whereas the ranking of V and K is in ascending order so that a higher ranking can represent a better result.
Among all the clusters, Cluster 3 had the minimum average variance value (0.981), representing the highest robustness. Therefore, the corresponding barriers were identified as R-1 according to the principles in Section 3. Cluster 2 and Cluster 4 ranked third and second according to the level of variance and they both had similar V values which were only approximately 20% larger than that of Cluster 3. In addition, Cluster 2 also had a positive average K value and a negative S value. The only one barrier evaluated as “R-0”, representing not only the high concentration of opinions from institutes but the expected great severity, lay in Cluster 2. Correspondingly, they were also identified as robust. However, the barriers in Cluster 2 could meet the requirements of both R-1 and R-2 whereas Cluster 4 was only identified as R-2. The barriers in Cluster 5 were also identified as robust despite the great variance (1.434). The average K value of this cluster reached 2.216 and the S value reached −1.227, and both K and S both ranked the first among all the clusters. This means that the investigated institutions’ judgements on the severity of the identified barriers and barriers tended to concentrate and at the same time, could be expected to be of greater influence. Finally, the judgements of all the identified barriers are listed in Table 2.
Among all the identified barriers, seven were evaluated as not-robust (marked as bold and NR in Table 2) due to the extremely high variance value of Cluster 6 and 7, and the simultaneous high V value and the negative S value in Cluster 1 at the same time. Additionally, the barriers in Cluster 1 had M values higher than 3.5, meaning that they are of significant influence as evaluated by investigated experts. However, the high variance values indicated that there were also considerable differences of opinion among institutions.

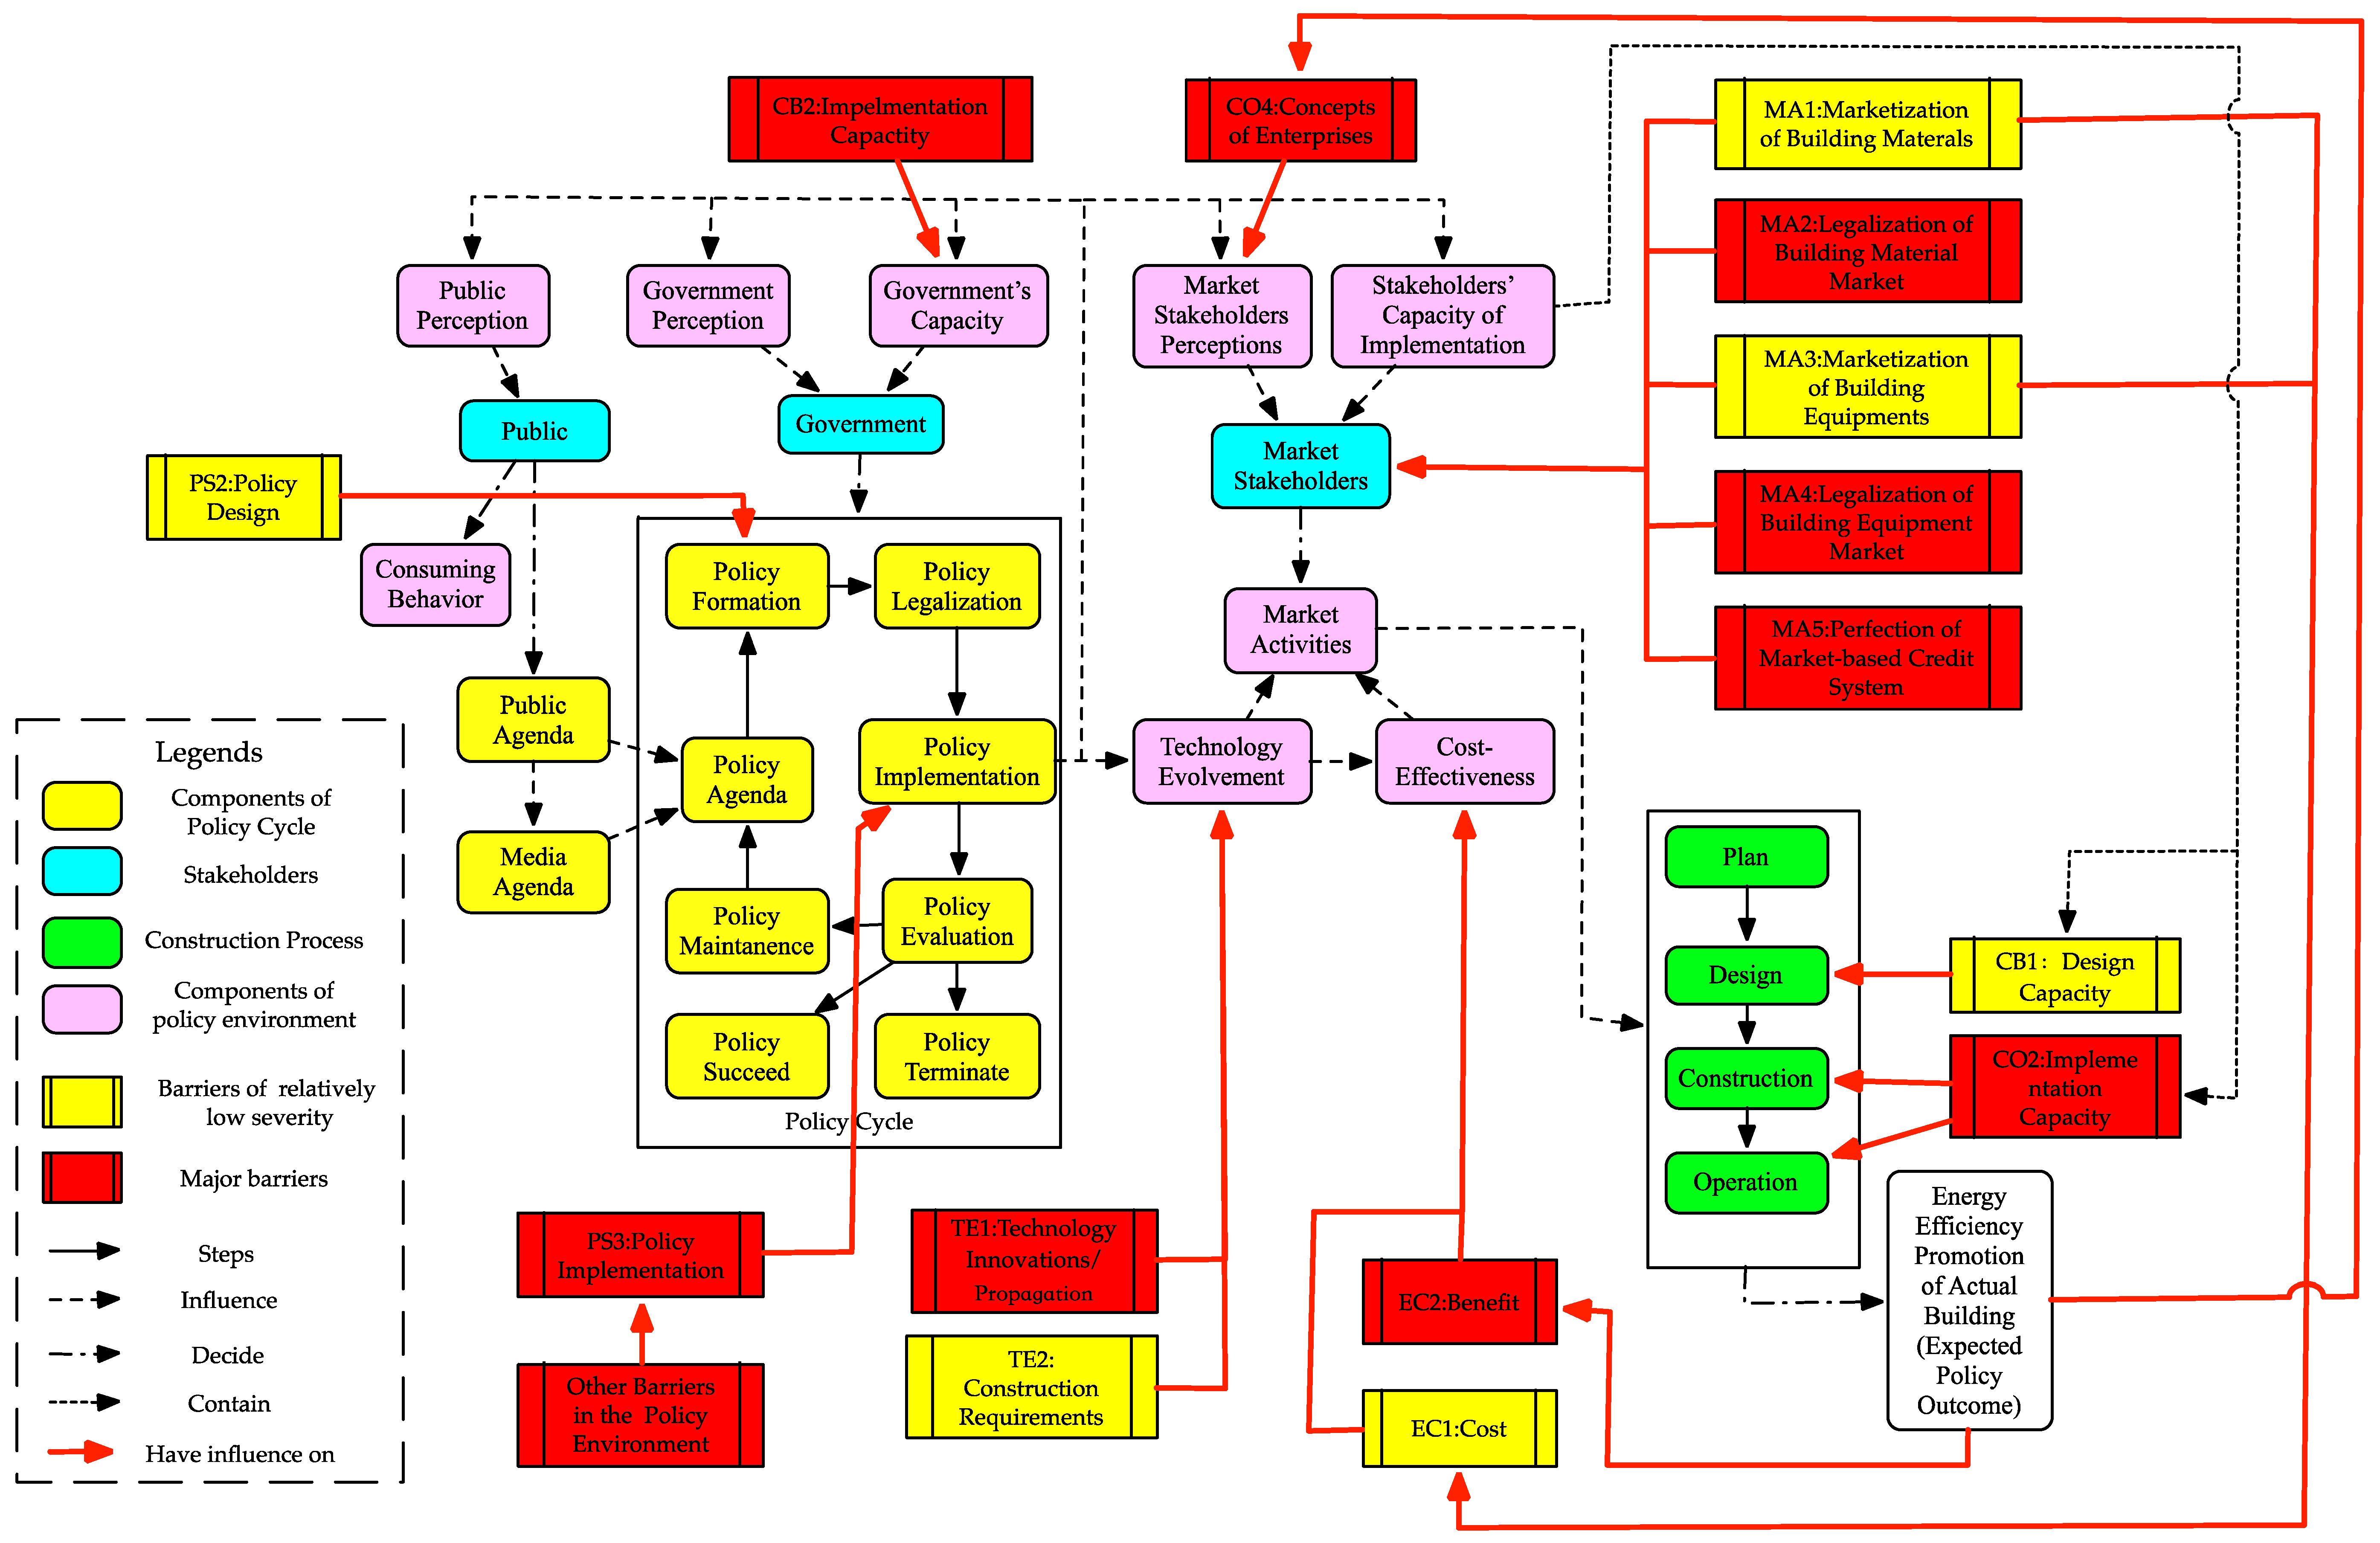
4.4. Comprehensive Evaluation Based on Policy Cycle and Policy Environment
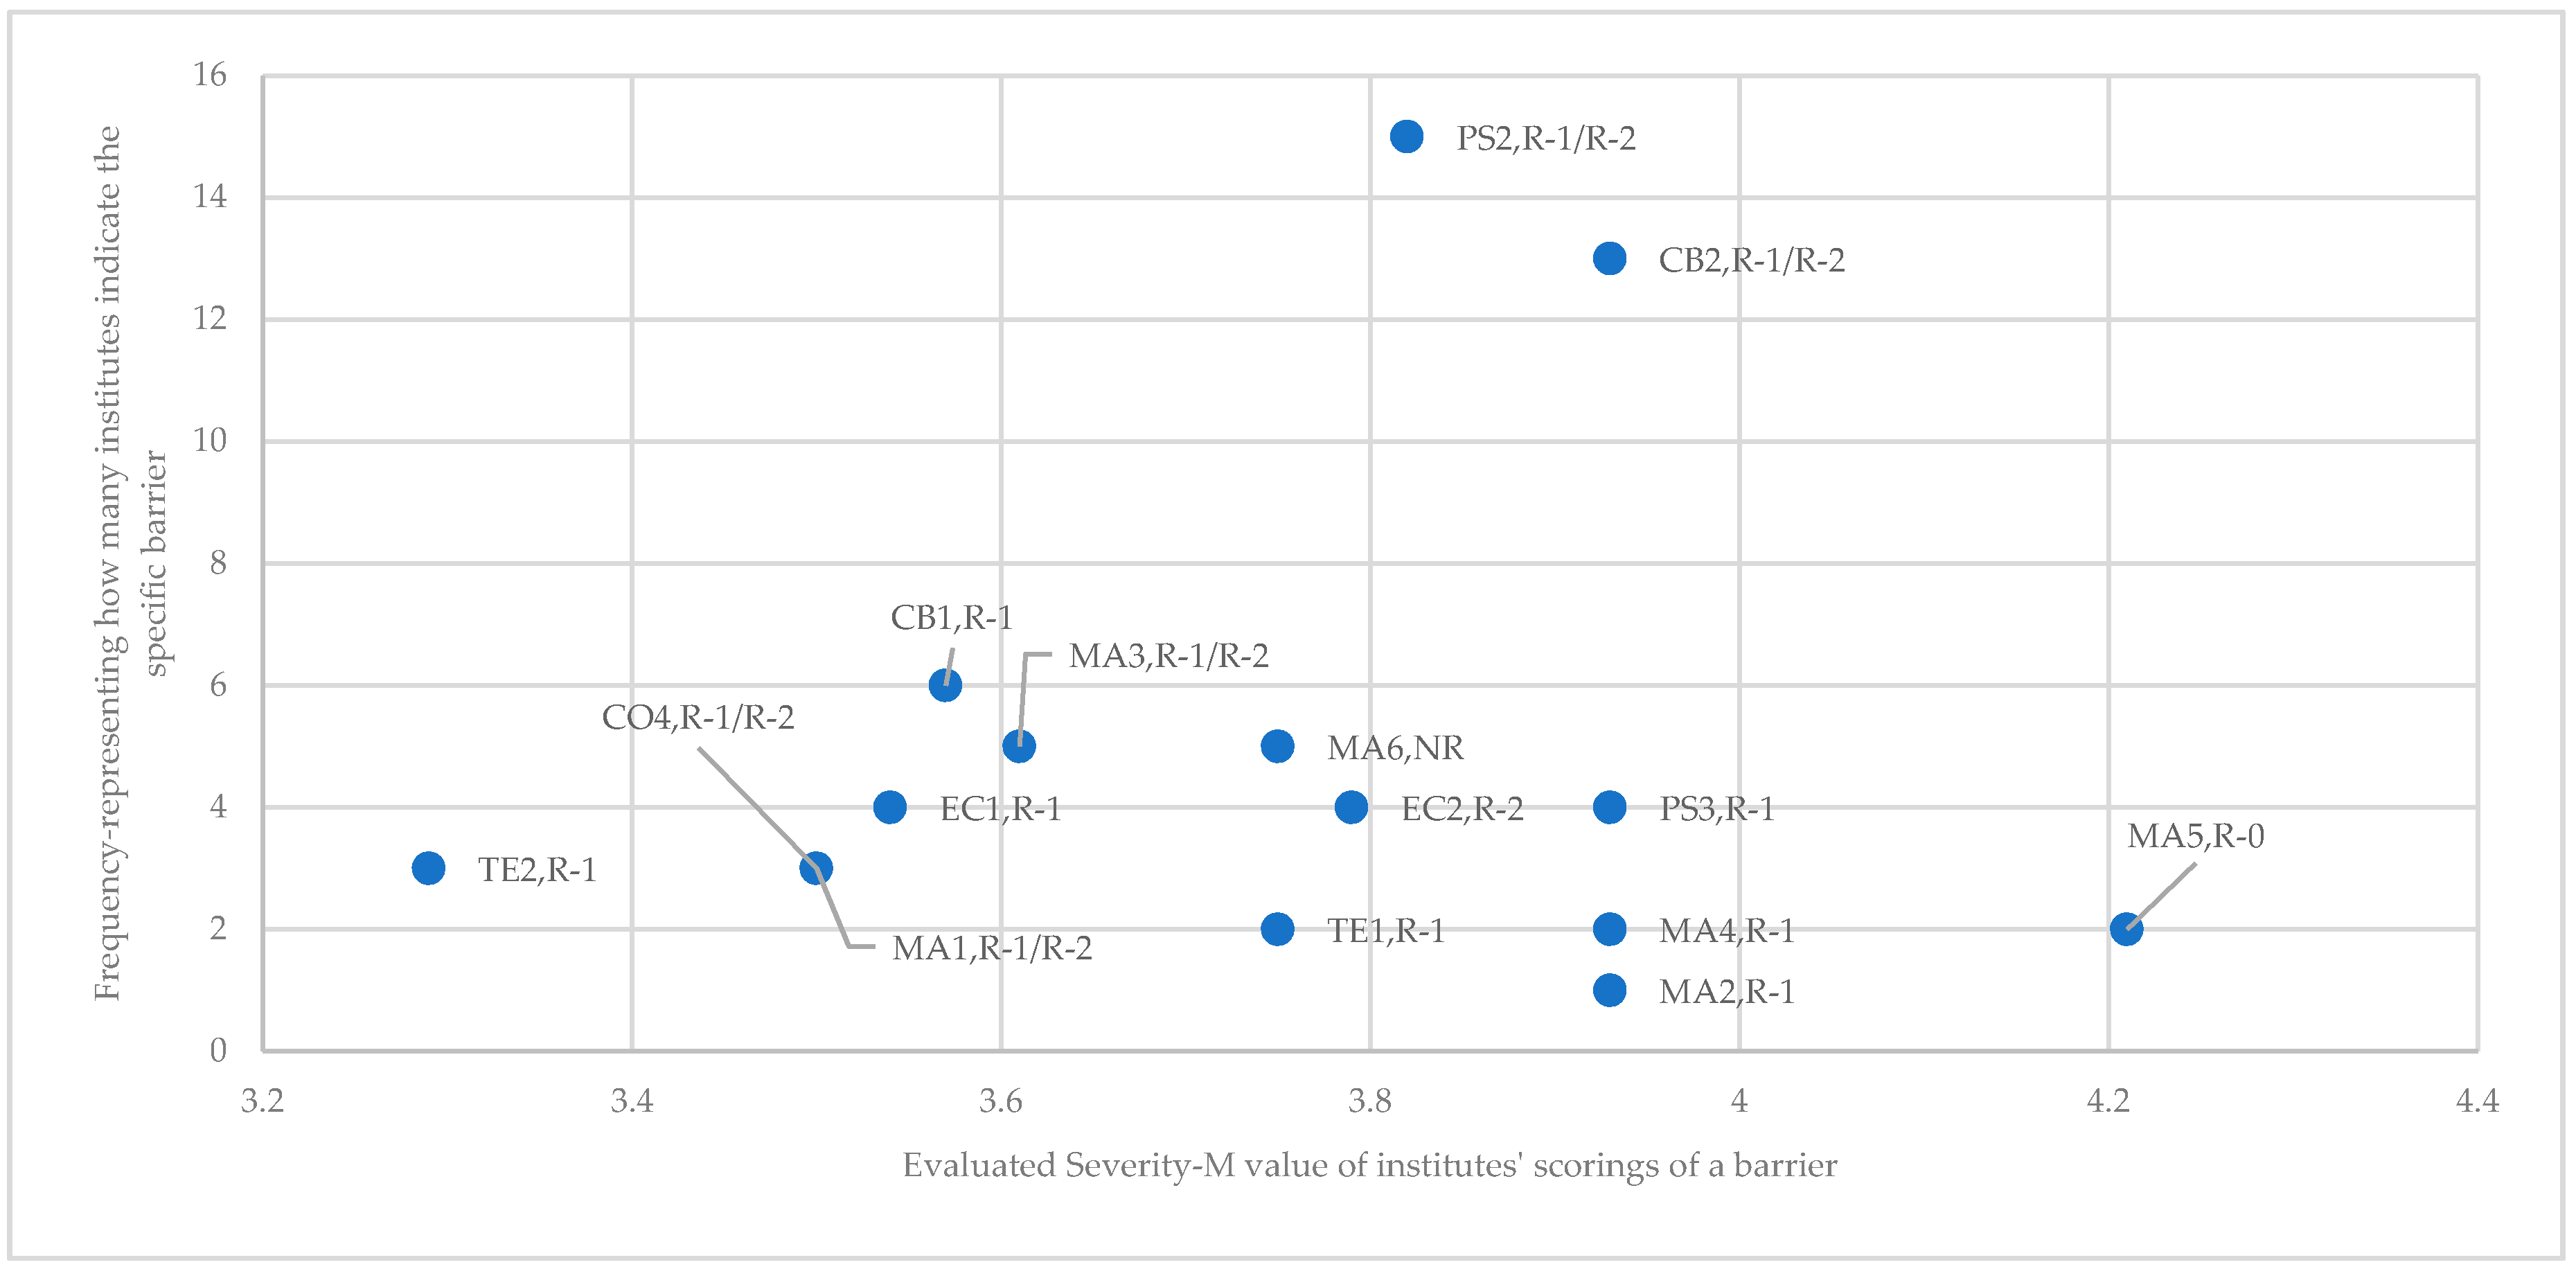
Figure 11 presents the distribution of all the robust barriers according to their frequency and the evaluated severity. The higher frequency an identified barrier had, the more attention it had achieved from experts. At the same time, the quantified evaluation result depicted the expected severity of the barriers. In general, barriers in policy settings field and capacity building field had received more attention from stakeholders whereas most of the barriers in the market system were expected to be of more significant severity. Those barriers in the economy and technology system had neither high frequency nor high evaluation scorings. The distribution meant that these barriers neither received great attention from experts nor were of great influence on the development of the industry.
The barrier PS2 and CB2 had the highest frequency among all the barriers. The high frequency indicated that highest popularity of these two barriers among institutes and the evaluation result—” R-1/R-2”—indicated that experts and institutions had come to a consensus on their severities. The government in China owns the strongest discourse power and the most abundant policy resources. Minor deficiencies in the law systems, the standard systems and policy incentives may lead to a significant influence on the stakeholders’ participation and the development of the industry. The similarities of these two barriers (PS2 and CB2) in frequency and evaluated severity also indicated the tight interaction between these two barriers. On the one hand, the lack of some institutions’ capacity to cooperate with each other affects the expected policy design and, on the other hand, defective policy design further influences the stakeholders’ activeness in improving their capacity, and the corresponding capacities further affect the implementation outcome of policies and projects.
The frequency of the remaining twelve identified barriers ranged from 1 to 6 according to the survey. The M values of four of them were around/over 4, meaning significant expected severity. In addition, the high scorings of these four barriers stressed the urgency for the proper policy implementation (indicated by PS3) and a legalized market environment (indicated by MA2 and MA4). It was considered by the author that, at the current stage, the market of energy-efficient building materials and equipment is adequately developed. The diversity and accessibility of various technologies can basically meet the requirements for energy-efficient buildings. However, as indicated by MA1 and MA3, the marketization process of building material encounters the problems of lacking technology innovations and building equipment requiring products of better quality.
The barriers influencing the technology evolvement (TE1, TE2) and the corresponding cost-effectiveness (EC1, EC2) were neither of great perceived severity nor of great popularity among experts. It was considered by the author that current technology can meet the implementation requirements of energy-efficient buildings; the identified barriers are associated with the further improvement of building energy efficiency, such as the technical solutions for nZEB or Passive House. The evaluation results of barriers in the cost-effectiveness field indicated that stakeholders are not as sensitive to the investment and benefits as the development of the market.
As for the barriers caused by the concepts of various stakeholders, the investigated institutes only agreed that the concept of enterprises in the industry matters. The evaluation results of CO1, CO2, CO3 indicated that the severity of barriers in the “Roadmap”, “the Leading Concept”, and the “Concept of home-buyers” fields are not asserted. Despite the higher M values of these barriers than the CO4—the concept of enterprise—the severity of concepts should be further studied from different perspectives before applying corresponding policy to eliminate these barriers.
In addition to the evaluation results as plotted in Figure 11, Figure 12 depicts how the identified barriers affect the development of the complete industry and how the system conducts the influence of one barrier to the downstream links. The major barriers are marked red and those of relatively low severity are marked yellow. The following analysis is based on the outcome of the system—the actual building energy efficiency promotion of new residential building projects starts from the lower-right-hand corner of Figure 12.
The actual energy efficiency promotion of new residential building projects is the outcome and a comprehensive reflection of good planning, design, implementation and operation. Correspondingly, barriers in these steps have a direct influence on the energy efficiency level of new residential projects. Results in Figure 11 indicate that current enterprises are basically able to propose a good design of ordinary energy-efficient buildings. The relatively low M and frequency of CB1 indicate that current barriers regarding design capacity relate to the design of high-performance buildings, such as the Passive House, or 3-star green buildings. Current popular design strategy can meet the basic energy efficiency requirements stipulated in the design standard. However, the design institutes lack the capacity to propose individualized energy-efficient design plan for residential buildings. Apart from the CB1, another barrier evaluated as “robust” regarding capacity building was that the market stakeholders’ implementation capacity (CB2) is far from satisfied. The M value of CB2 indicated that the lack of implementation capacity should have the greatest significant influence among all the barriers in the capacity building field. Most construction enterprises currently lack the ability to build high-performance buildings as strictly required by the design plan. The unsatisfied construction quality will not realize the expected energy conservation potential of a high-performance building and the unsatisfied property management cannot effectively translate the energy savings into benefits/profits. This conclusion was also proved by the ranking and M value of TE2. The low ranking and M of TE2, together with the evaluation results of CB1 and CB2, indicated that it is not the high construction requirement but the lack of the implementation capacity that hinders the development of new residential building energy efficiency.
The inefficiency in converting energy savings into benefits is also the major barrier (EC2) in the economy field. It was evaluated to have a significant influence not only on the industry but also on the decision-making process of market stakeholders by affecting their perceptions and concepts. The M differences of EC1 and EC2 indicated that all the institutions perceive the investment into high-performance buildings as acceptable only if the calculated energy saving can be effectively translated into benefits, and thus help the enterprise to realize its primary goal for benefits. The corresponding conclusion was also in accordance with the notes and the M value of CO4—the only barrier that experts reached agreement about.
As indicated in Figure 12, the market stakeholders’ activities are affected not only by their concepts and the cost-effectiveness of the projects and technologies, but also by the technology evolvement and the marketization process and the legalization level of corresponding markets. The M value of TE1 indicated that the technology innovations are of significant importance to the future development of building energy efficiency promotion. Whereas the technology innovation represents the most probable energy efficiency level, the marketization process of corresponding market reveals the massive propagation possibility of certain technologies or buildings of certain energy efficiency level. The relatively low M values of MA1 and MA3, in addition to the similar M value of EC1, indicated that the market of building materials and equipment can be considered as adequately developed. The incremental cost of constructing high-performance buildings are reasonable. The major barrier at current stage is the legalization of the corresponding market (see MA2 and M4 in Figure 11, Figure 12 and Table 1). Various kinds of non-compliance competitions are the major force hindering the healthy development of the market. The low ranking of CB3 indicated that this chaotic environment cannot be attributed to the lack of supervision and assessment capacity. The notes and high M values of PS2 and PS3 depicted a solution, that is, a better policy design and faithful implementation of these policies will be of great influence on the improvement of the market environment.
The scorings of PS2 and PS3 further indicated that, in the case of current China, the policy settings are of great importance in influencing stakeholders’ concepts, stimulating technology innovations and regulating the market activities. The similar M values of PS2 an PS3 revealed the similar equal importance of policy settings and the corresponding implementation. As indicated by the notes of PS2, various kinds of barriers exist not only in the law and regulations system, but also in the standard system. The notes for PS3 further gave the reason why these barriers regarding policy cannot be solved in time—the jurisdiction of governments is not clear enough that some of the departments are not willing to take responsibility.
Above all, the core problem hindering the promotion of new residential buildings is the ineffectiveness of translating the energy savings into profits/benefits for enterprises/home-buyers. The major barriers to the promotion of new residential building energy efficiency promotion were identified as follows:
(1)
The market stakeholders’ lack of implementation capacity (CB2, Frequency = 13, Evaluated Severity = 3.93).
(2)
The unsatisfied policy design (PS2, Frequency = 15, Evaluated Severity = 3.82) and policy implementation (PS3, Frequency = 4, Evaluated Severity = 3.93).
(3)
Legalization of relevant markets (MA2, Frequency = 1, Evaluated Severity = 3.93; MA4, Frequency = 2, Evaluated Severity = 3.93; MA5, Frequency = 2, Evaluated Severity = 4.21).
Major barrier No. 2 affects the policy cycle process and barriers No. 1 and No. 3 belong to policy environment and they have significant effects on the implementation of policies to achieve the expected outcome. The neglect of the other identified barriers is not only because of their relatively low expected severity, but also because they may be caused by the above three barriers and they can disappear, or to some extent be solved after the elimination of the three major barriers.

4.5. Discussion and Policy Implications

Table 1 summarized all the barriers collected from frontline institutions and Figure 12 demonstrated how these identified barriers interfere and affect each other. The result indicated that the barrier lying in the core position of new residential building energy efficiency promotion in China is “the ineffectiveness in translating expected energy savings into profits/benefits for home-buyers”. This was also noted as the “energy efficiency gap” or “energy efficiency paradox” in other literature [39,55,56]. It broadly refers to the slower actual diffusion of energy-efficient goods (buildings, technologies and relevant energy-efficient products in new residential building sector) than the socially optimal level [57,58]. As for the barriers resulting in the energy efficiency gap, many papers attributed this inefficiency in translating energy conservation into benefits/profits to the externality of the new residential building energy efficiency promotion industry, the market failures and the behavioral anomalies and failures [56]. Barriers related to these fields, such as “high incremental cost” and “lack of fiscal incentives” may be of great importance from international perspective [59,60,61,62]. It is undeniable that these identified barriers do exist in current China as summarized in Table 1. However, the evaluation results of these barriers indicated that the China situation is different. In addition to the unsatisfied policy design, the stakeholders’ lack of implementation is also one widely-spread and acknowledged barrier of significant influence (severity).
For market stakeholders, the lack of implementation capacity refers to the lack of professional skills for the adoption and maintenance of technologies [38]. In addition, the high-performance buildings in-use call for a series of stakeholders to work together for the intended green performance during the operation and maintenance phase [48]. As indicated by CB2 in Table 1, this lack of implementation capacity focused on construction phase and operation phase of a high-performance building. This was not only proved by papers regarding barrier identification specifically in the China context [38,48], but also indicated by the amount of green building certification in the certification phase in China. According to the data from the MoHURD, among all the green buildings that had been constructed by September 2016, only approximately 6% of them were labelled as “green building” from the operation perspective whilst 94% of these projects were only labelled as “green building” in the design phase [63]. According to the research by Aliagha et al. [35], the shortage of this capacity can be further interpreted as the lack of “Competency of available mechanics/technicians to install, test, adjust and repair HVAC system and corresponding control system, to install light system and corresponding controlling equipment, and to install the renewable-energy-related systems”. The shortage of this capacity is of the second utmost importance in Malaysia and most Asian countries have similar conditions. As for the solution to this barrier, Georgios et al. [64] proposed a novel education framework and some Chinese colleges has introduced practical training into courses [65]. However, it was considered by the author that, in addition to the education and training for students, at least equal effort should be paid attention to the re-education and training of currently occupied professional staff.
The other widely-spread barrier of significant severity is the unsatisfied policy system. It refers to not only the deficiencies in the law and regulation system and the deficiencies in the design and implementation standard system, but also the utilization of mandatory policy instrument. The importance of this barrier was extensively stressed by many literature, noted as “legal barriers ” [4]. As was indicated in Figure 12, the author attributed this barrier to the governments’ lack of implementation capacity to form a better policy design. On the one hand, the “Top-Down” policy-making process dominates in the new residential building energy efficiency promotion in China. The policy decisions depend significantly on the nature of the particular set of political actors, ideas, and institutional rules that are prevalent in the jurisdiction when policy deliberations and decision-making take place [31]. On the other hand, regulatory policy has traditionally been tackled from the top down, that is to say, from the perspective of regulators (bureaucrats, officials, politicians) rather than from the perspective of those regulated (citizens, businesses, consumers) [66]. Under current governance arrangement in China, it is suggested by the author that governments shall pay more attention on the frontline stakeholders’ voices via multiple approaches such as interviews or field offices [67,68].
Another barrier of significant perceived severity associated with government departments is the policy implementation and is noted as “administrative barriers”. In the China context, the new residential building energy efficiency promotion is regulated by at least three ministries: the MoHURD, the Ministry of Finance and the National Development and Reform Commission [15]. As indicated in Table 1, some government departments’ incapability of cooperating with others leads to this barrier and increases the complexity in administration and the difficulty for market stakeholders to access the incentives. In addition, despite the fact that Chinese central government has spared little effort in eliminating the non-compliance of standard via annual inspection [10], challenges still exist in small cities, towns and villages [69], as introduced in Section 1. As the implementation of current building energy efficiency incentives is solely through a problematic top-down target responsibility system [70], researchers have suggested that, under the current governance mode, policy bundling, interest bundling and policy framing could facilitate effective implementation by local governments rather than the central one [71]. To address the coordination issue, it is suggested that these policies should be overseen by high-level city leaders such as mayors [16].
According to the theory raised in Section 2, both implementation capacity of market stakeholders and the insufficient legalization of relevant markets belong to the policy environment field. Results indicate that to form a better competition environment for material and equipment manufacturers is of greater importance than incentives such as fiscal subsidy [72]. It is considered by the author that the market-based credit system, recording and evaluating relevant enterprises’ non-compliance behavior and publishing the corresponding results to the general public, could be effective. However, since the policy implementation is not solely affected by one barrier, it is important to take other factors such as capacity building and economics into consideration.

5. Conclusions

Despite the great progress China has made in promoting the energy efficiency of new residential buildings, barriers still exist and hinder the realization of expected policy outcomes. By introducing the theoretical framework of policy cycle and policy environment, this paper identified the major barriers in the six key aspects affecting the development of the industry, namely the concept, market, economy, capacity building, policy settings and the technology evolvement. By nationwide questionnaire distributed to a variety of types of institutions, the barriers regarding each aspect were identified and the corresponding severity were also evaluated via Likert 5-Scale and Cluster Analysis. Results indicated that the barriers work as a system and the influence will be conducted downstream according to the dynamic of the whole system of new residential building energy efficiency promotion.
In the case of China, the core problem affecting the energy efficiency promotion of new residential buildings is the ineffectiveness in realizing the expected energy savings and further translating the energy savings into benefits/profits for market stakeholders/home-buyers. This problem is caused by three major barriers, namely (1) the unsatisfied policy design and its implementation, (2) the stakeholders’ lack of the capacity to develop, construct or operate high-performance residential building projects (implementation capacity), and (3) the relatively low legalization level of relevant markets. The first major barrier is associated with the policy cycle whereas the last two exist in the policy environment regarding new residential building energy efficiency promotion.
Currently in China, governments own the strongest discourse power and the most abundant policy resource to regulate the market and thus realize its targets. From the perspective of policy cycle, current policy settings and the signing of various international agreements has made the new residential building energy efficiency promotion remain on the policy agenda. However, the unsatisfied policy design (PS2) and corresponding policy implementation process (PS3) cannot 100% percent effectively stimulate and regulate the market. The vague jurisdiction of government departments, in addition to the lack of implementation capacity, results in ineffectiveness not only in carrying out the policy design properly and faithfully, but also in the adjustments and the solving of problems in the current policy system.
In addition to the implementation capacity of governments, the outcome of policies is also affected by the policy environment. At the current stage, the relevant markets regarding energy-efficient buildings are considered to be adequately developed as the energy efficiency of building related products can basically meet the requirements energy-efficient buildings. In addition, the incremental cost of these products is also considered acceptable. The major barrier associated with market development is the relatively low legalization level (MA2, MA4). Some stakeholders’ violation of rules without punishment, or their malicious competition behavior has significantly hindered the healthy development of building energy efficiency market and the promotion of new residential building energy efficiency. A market-based credit system could be a solution (MA5). As for the capacity building field, the dominating barrier is the lack of implementation capacity (CB2). Current capacity of most construction enterprises cannot meet the high requirements by the design of high-performance buildings. The unsatisfied implementation outcome further results in the major barrier in the economy field, that is, the expected energy savings cannot effectively be translated into benefits, thus preventing enterprises from realizing their target of making profits. The barrier of significant influence in the technology aspect is related to the innovation of high-performance technologies (TE1). On the one hand, the evaluated severity of barriers regarding technology innovation was not as high as the major barriers in the other aspects, and on the other hand, this barrier was related to the leading technology solutions. The technology for massive propagation and adoption can be considered mature.
Confronted with multiple barriers of various significance as discussed above, China should first focus on how to improve the implementation capacity of market stakeholders. Engineering education as well as re-education or training for the professional staff can be a solution to this barrier. A better policy design as well as policy implementation can be facilitated by motivating local governments because there is a great difference of conditions among provinces and cities. Under this context, the central government should correspondingly enforce the supervision system for local government in addition to the problematic target responsibility system. Furthermore, the policy implementation is also affected by various kinds of factors in the policy environment field. A policy design from a systematic perspective is of greater effectiveness than single incentives.

Author Contributions

Conceptualization, Y.L. and N.Z.; Data curation, Y.L. and B.Q.; Formal analysis, Y.L., N.Z. and B.Q.; Funding acquisition, N.Z.; Investigation, Y.L. and B.Q.; Methodology, Y.L. and N.Z.; Project administration, N.Z.; Resources, N.Z.; Supervision, N.Z.; Validation, Y.L. and B.Q.; Visualization, Y.L. and B.Q.; Writing–original draft, Y.L.; Writing–review & editing, N.Z. and B.Q.

Funding

This research was funded by Energy Foundation, grant number G-1402-19981.

Conflicts of Interest

The authors declare no conflicts of interest.

References

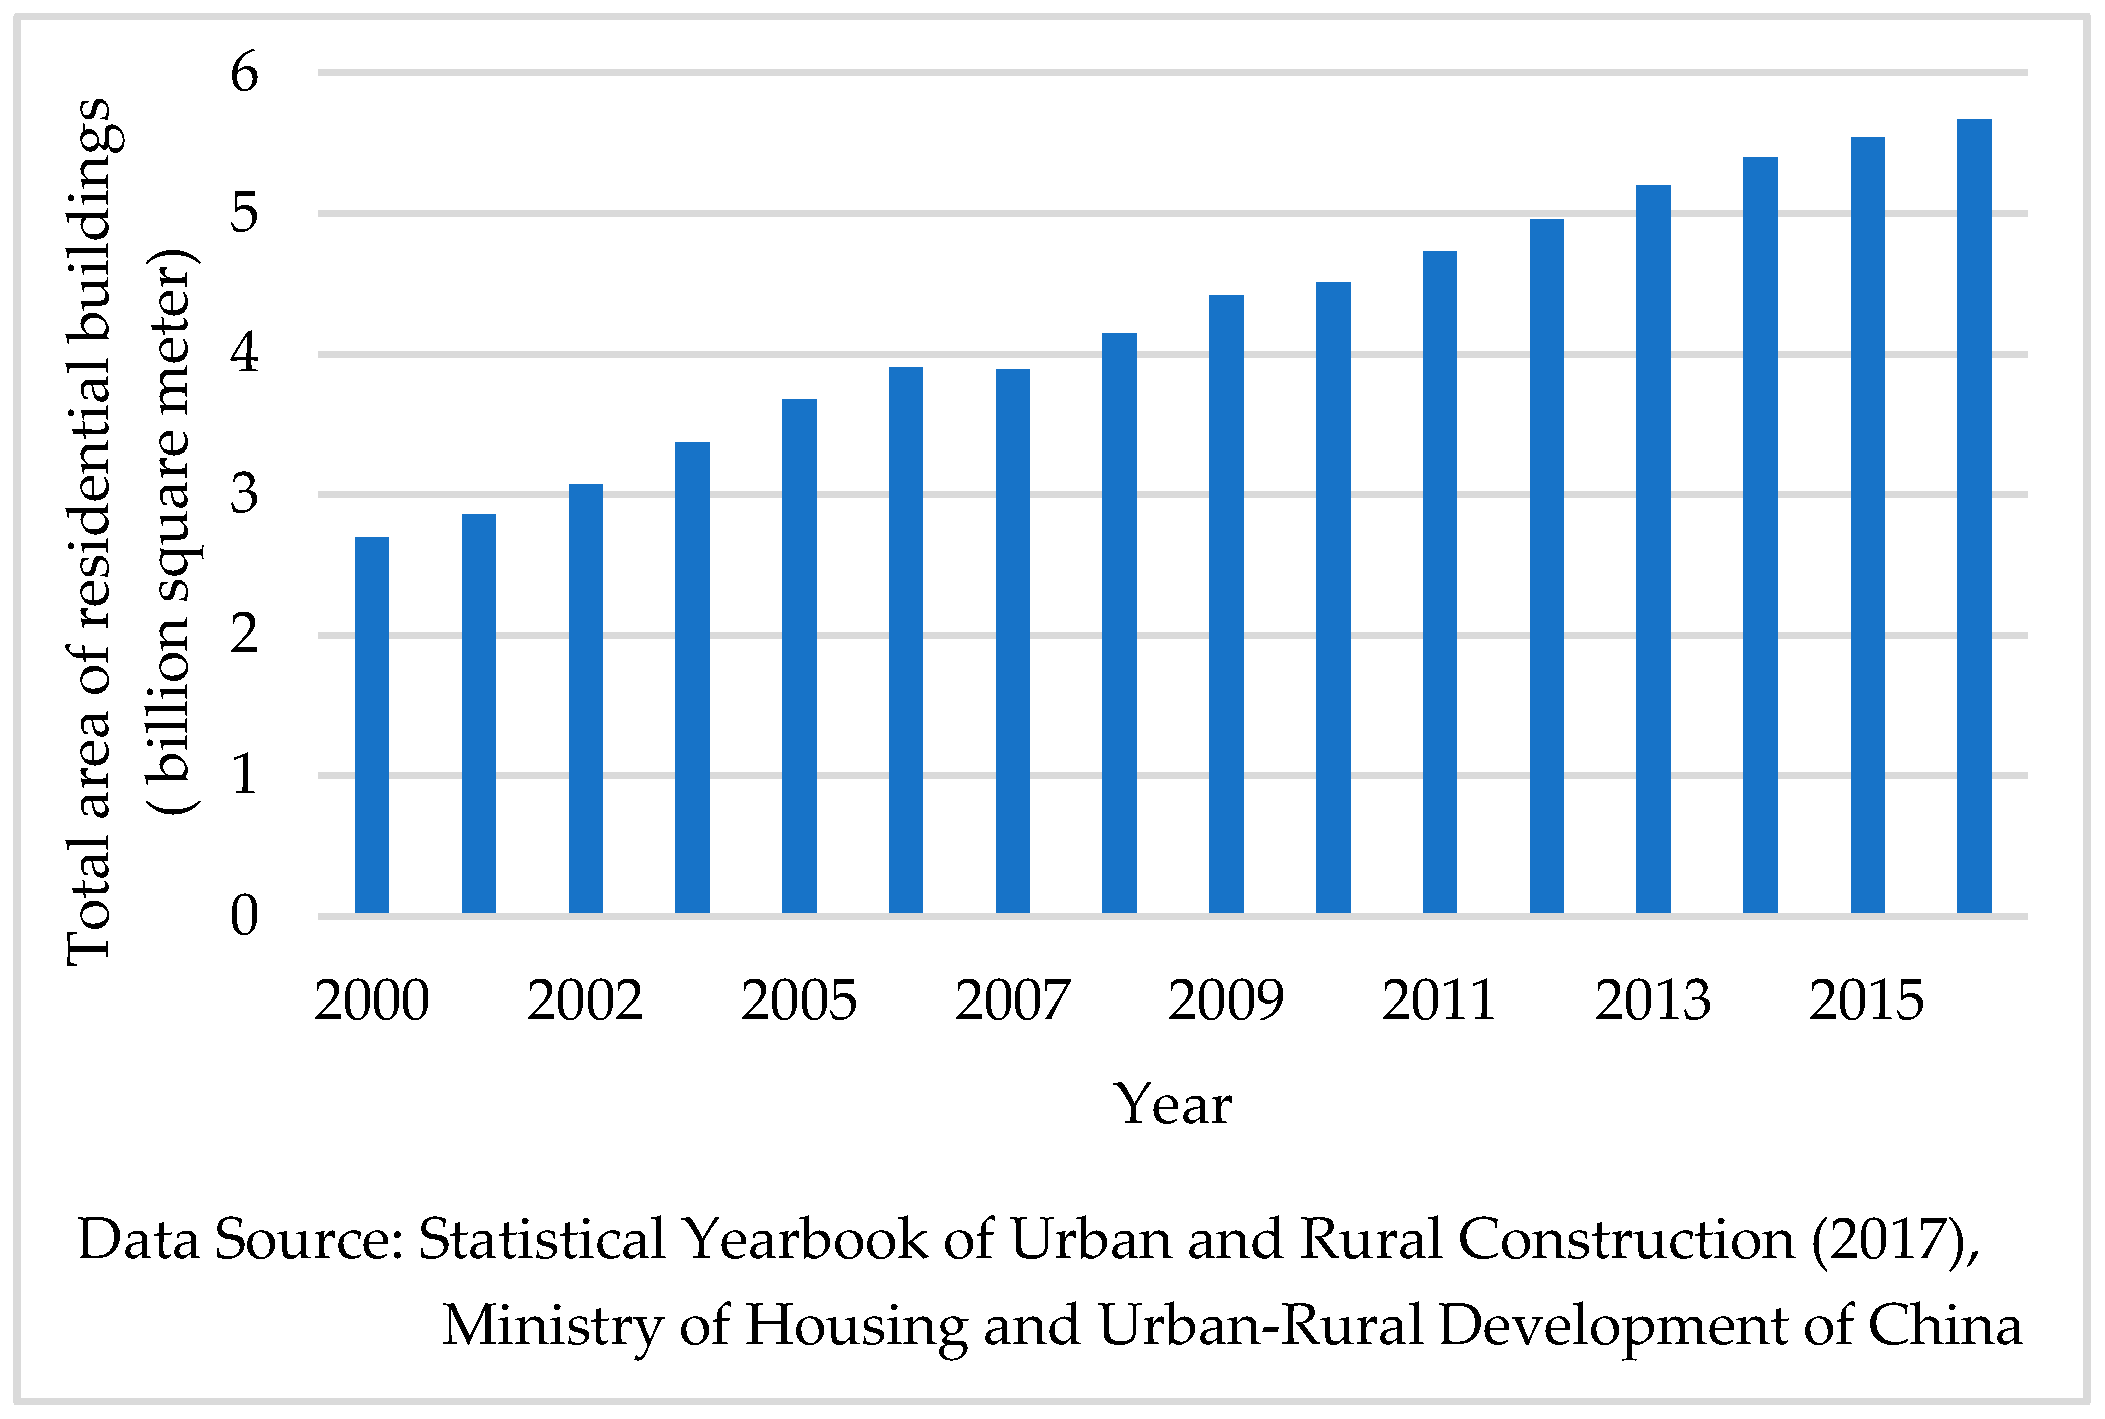
  1. Ministry of Housing and Urban-Rural Development of China. Statistical Yearbook of Urban and Rural Construction (2017); Ministry of Housing and Urban-Rural Development of China: Beijing, China, 2019.
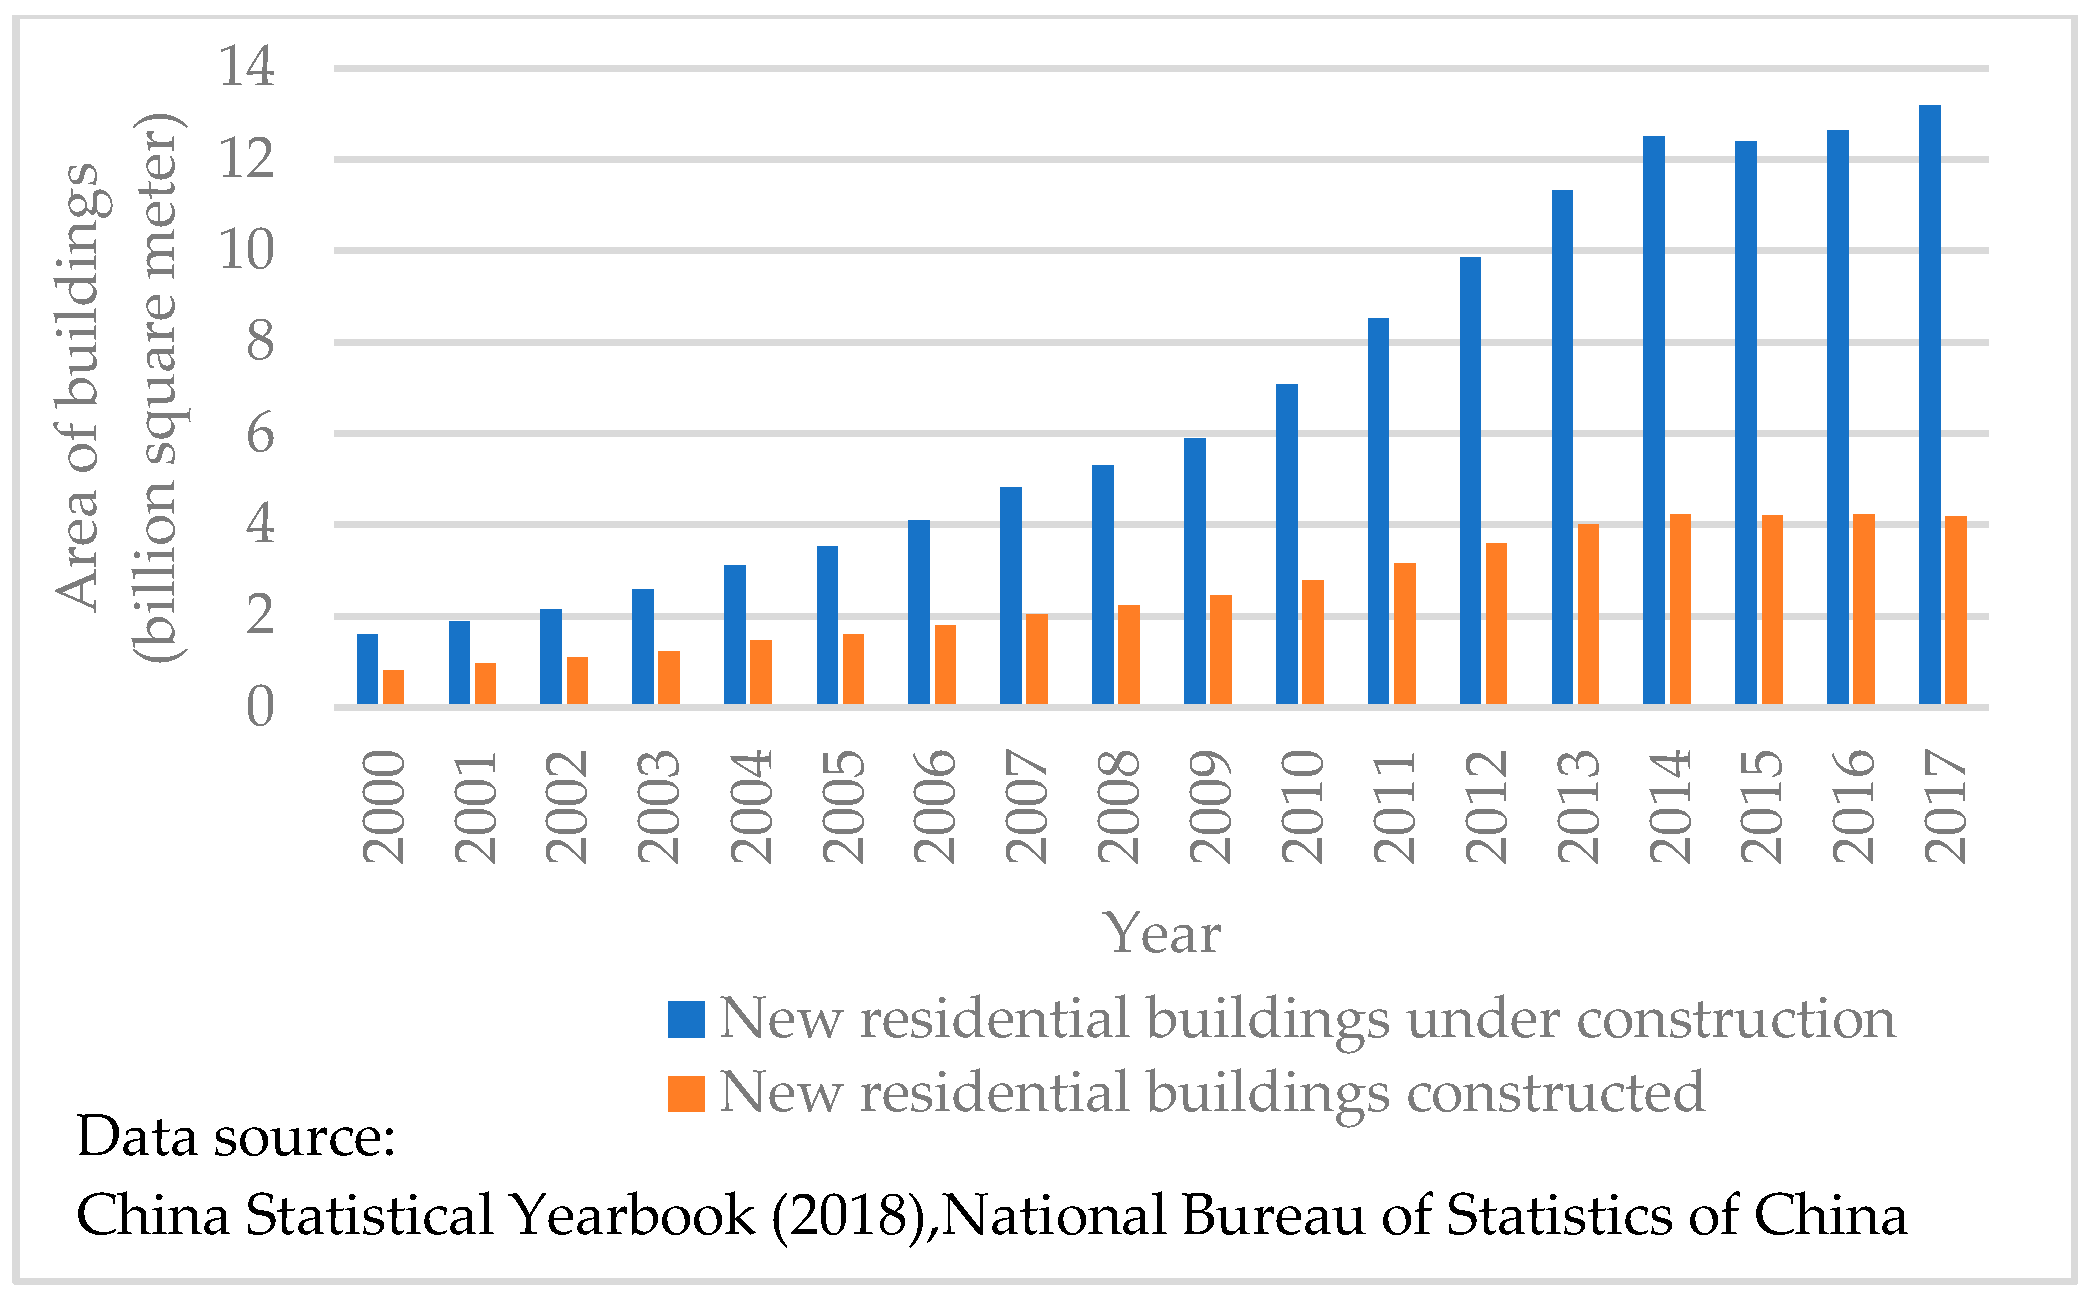
  2. National Bureau of Statistics of China. China Statistical Yearbook; China Statistics Press: Beijing, China, 2018; ISBN 978-7-5037-8587-0.
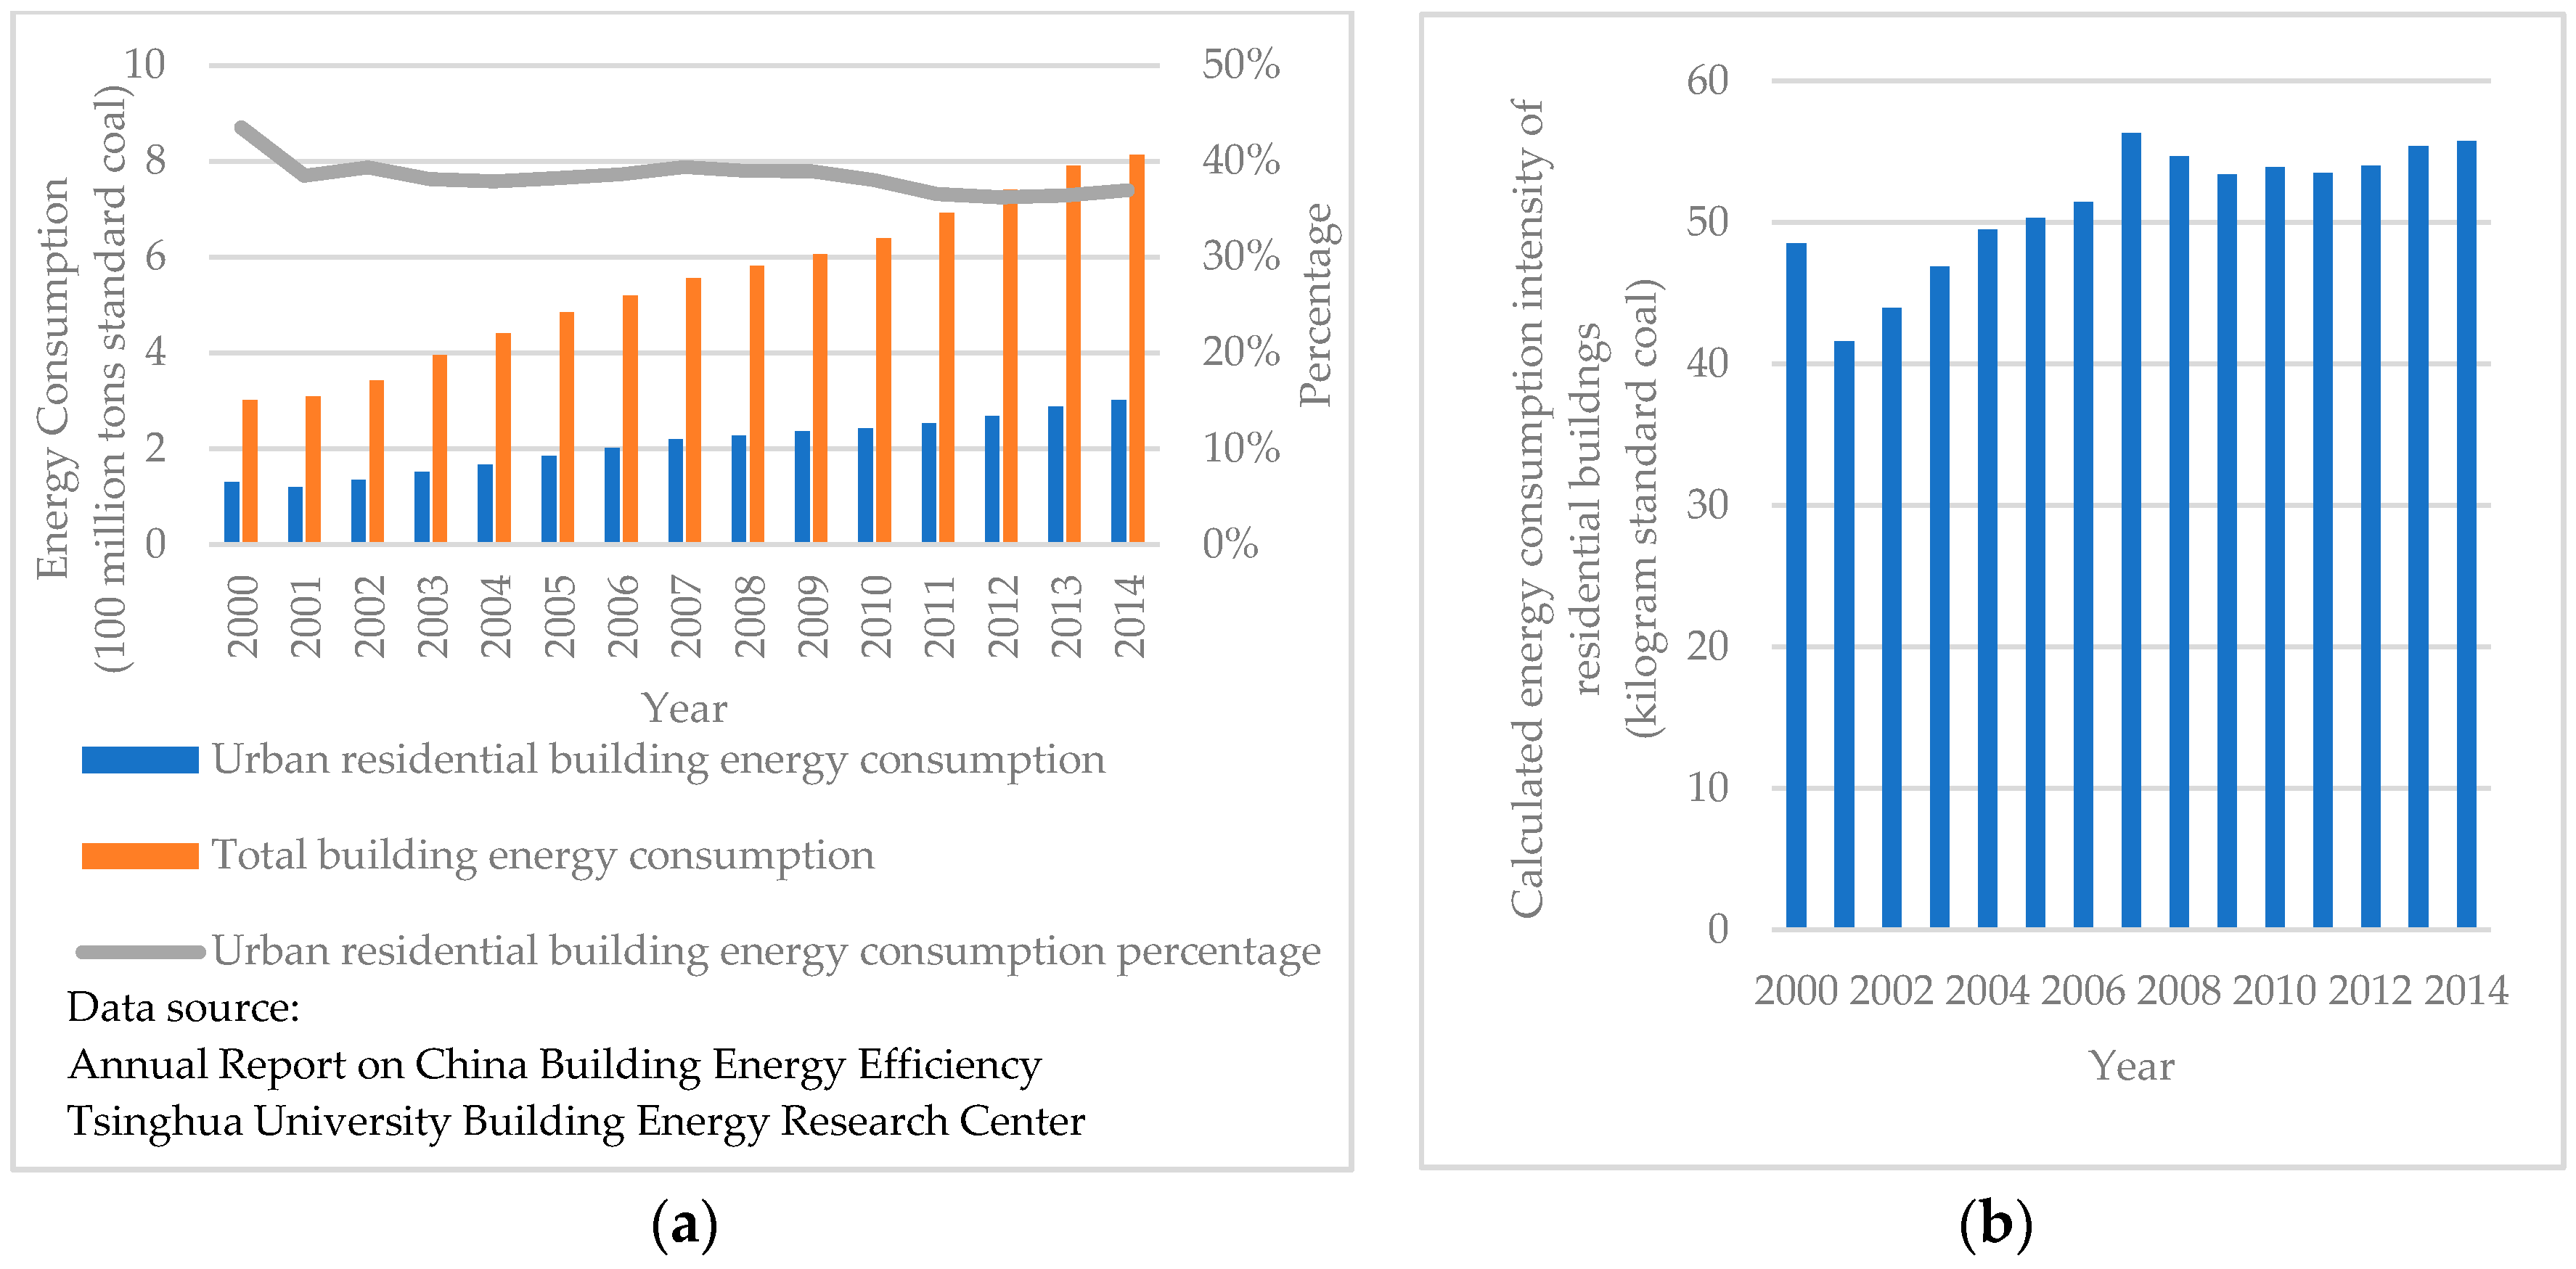
  3. Tsinghua University Building Energy Research Center. 2017 Annual Report on China Building Energy Efficiency; China Architecture and Building Press: Beijing, China, 2017; ISBN 978-7-112-20573-8. (In Chinese) [Google Scholar]
  4. Zhang, Y.; Wang, Y. Barriers’ and policies’ analysis of China’s building energy efficiency. Energy Policy 2013, 62, 768–773. [Google Scholar] [CrossRef]
  5. Xu, X.; Anadon, L.D.; Lee, H. Increasing Residential Building Energy Efficiency in China: An Evaluation of Policy Instruments; Harvard Kennedy School Belfer Center for Science and International Affairs: Cambridge, MA, USA, 2016. [Google Scholar]
  6. European Commission. Directive 2010/31/EU of the European Parliament and of the Council of 19 May 2010 on the Energy Performance of Buildings (Recast); European Commission: Brussels, Belgium, 2010. [Google Scholar]
  7. Qian, Q.K. Government’s Roles and Measures Needed in China for Promoting Building Energy Efficiency (BEE). Int. J. Constr. Manag. 2010, 10, 119–138. [Google Scholar] [CrossRef]
  8. Wu, Y.; Hou, J.; Xu, K.; Li, Y. Study on Improvement System of Building Energy Efficiency of China. Build. Sci. 2015, 31, 1–14. [Google Scholar]
  9. Li, B.; Yao, R. Building energy efficiency for sustainable development in China: Challenges and opportunities. Build. Res. Inf. 2012, 40, 417–431. [Google Scholar] [CrossRef]
  10. Guo, Q.; Wu, Y.; Ding, Y.; Feng, W.; Zhu, N. Measures to enforce mandatory civil building energy efficiency codes in China. J. Clean. Prod. 2016, 119, 152–166. [Google Scholar] [CrossRef]
  11. Annunziata, E. Energy Efficiency Governance in Buildings: A Multi-Level Perspective; Scuola Superiore Sant’Anna: Pisa, Italy, 2013. [Google Scholar]
  12. Ren, S.M.; Guo, H.D.; Zhen-Yan, X.U. Externality Feature Analysis of Building Energy Efficiency Market and Incentive Policies in China. Constr. Conserves Energy 2009, 1, 75–78. [Google Scholar]
  13. Zhan, S.L.; Han, Q.M.; Liu, C.B. Analysis of Demanding Factors about Building Energy-Efficiency Market based on Theory of Behavioral Choice. J. Beijing Jiaotong Univ. 2009, 8, 65–69. (In Chinese) [Google Scholar]
  14. He, Z.K.; She, L.Z. Evaluation research on the influencing factors of building energy efficiency promotion based on AHP. J. Guangzhou Univ. 2013, 12, 76–80. [Google Scholar]
  15. Zou, P.X.W. Risk factor analysis of the Chinese building energy efficiency market using system dynamics methodology. Int. J. Proj. Organ. Manag. 2014, 3, 352–373. [Google Scholar] [CrossRef]
  16. Zhang, J.; Zhou, N.; Hinge, A.; Feng, W.; Zhang, S. Governance strategies to achieve zero-energy buildings in China. Build. Res. Inf. 2016, 44, 1–15. [Google Scholar] [CrossRef]
  17. Li, J.; Shui, B. A comprehensive analysis of building energy efficiency policies in China: Status quo and development perspective. J. Clean. Prod. 2015, 90, 326–344. [Google Scholar] [CrossRef]
  18. Howlett, M.; Giest, S. Policy Cycle. In International Encyclopedia of the Social & Behavioral Sciences, 2nd ed.; Wright, J.D., Ed.; Elsevier: Oxford, UK, 2015; pp. 288–292. ISBN 978-0-08-097087-5. [Google Scholar]
  19. Bracco, K.R.; Richardson, R.C.; Callan, P.M.; Finney, J.E. Policy Environments and System Design: Understanding State Governance Structures. Rev. High. Educ. 1999, 23, 23–44. [Google Scholar] [CrossRef]
  20. Howlett, M.; Ramesh, M. Studying Public Policy: Policy Cycles and Policy Subsystems. Am. Political Sci. Assoc. 2009, 91, 548–580. [Google Scholar]
  21. McQuail, D. McQuail’s Mass Communication Theory; Sage Publications: Thousand Oaks, CA, USA, 2010; ISBN 1-84920-292-3. [Google Scholar]
  22. Caron, A.H.; Caronia, L. Moving Cultures: Mobile Communication in Everyday Life; McGill-Queen’s Press-MQUP: Montreal, QC, Canada, 2007; ISBN 0-7735-7657-6. [Google Scholar]
  23. Strachan, M.; Hardee, K.; Grey, G.-A. The Policy Environment Score Measuring the Degree to Which the Policy Environment in Jamaica Supports Effective Policies and Programs for Reproductive Health: 2000 Follow-up Results. Futures Group Int. 2001. Available online: https://www.researchgate.net/publication/242667416_The_Policy_Environment_Score_Measuring_the_Degree_to_Which_the_Policy_Environment_in_Jamaica_Supports_Effective_Policies_and_Programs_for_Reproductive_Health_2000_Follow-up_Results (accessed on 8 February 2019).
  24. Zhang, L.; Wang, Y. Research on Economic Incentive Policy to Promote Energy-saving Reconstruction of Existing Buildings. Constr. Econ. 2008, 6, 94–95. (In Chinese) [Google Scholar]
  25. Luo, J.; Gong, Y.; Huang, Y. Analysis of Green Building Industry Chain and Its Social and Economic Effects. Eng. Econ. 2017, 7, 63–65. (In Chinese) [Google Scholar]
  26. Adinyira, E.; Kwofie, T.E.; Quarcoo, F. Stakeholder requirements for building energy efficiency in mass housing delivery: The House of Quality approach. Environ. Dev. Sustain. 2018, 20, 1–17. [Google Scholar] [CrossRef]
  27. Mlecnik, E.; Visscher, H.; van Hal, A. Barriers and opportunities for labels for highly energy-efficient houses. Energy Policy 2010, 38, 4592–4603. [Google Scholar] [CrossRef]
  28. Zou, P.X.W.; Xu, X.; Sanjayan, J.; Wang, J. Review of 10 years research on building energy performance gap: Life-cycle and stakeholder perspectives. Energy Build. 2018, 178, 165–181. [Google Scholar] [CrossRef]
  29. Li, H.; Ng, S.T.; Skitmore, M. Stakeholder impact analysis during post-occupancy evaluation of green buildings—A Chinese context. Build. Environ. 2018, 128, 89–95. [Google Scholar] [CrossRef]
  30. Rowe, G.; Frewer, L.J. A Typology of Public Engagement Mechanisms. Sci. Technol. Hum. Values 2005, 30, 251–290. [Google Scholar] [CrossRef] [Green Version]
  31. Sbci, U. Buildings and Climate Change Summary for Decision-Makers; Uinted Nations Environmental Program (UNEP): Paris, France, 2009; pp. 1–62. [Google Scholar]
  32. Petcharat, S.; Chungpaibulpatana, S.; Rakkwamsuk, P. Assessment of potential energy saving using cluster analysis: A case study of lighting systems in buildings. Energy Build. 2012, 52, 145–152. [Google Scholar] [CrossRef]
  33. Gan, G.; Ma, C.; Wu, J. Data Clustering: Theory, Algorithms, and Applications (ASA-SIAM Series on Statistics and Applied Probability); Society for Industrial and Applied Mathematics: Philadelphia, PA, USA, 2013. [Google Scholar]
  34. Darko, A.; Chan, A. Review of Barriers to Green Building Adoption. Sustain. Dev. 2016, 25. [Google Scholar] [CrossRef]
  35. Aliagha, G.U.; Goh, A.P.T.; Abdullah, M.N.; Jaafar, N.M.; Eluwa, S.E. Investigating Skill Gaps in Green Building Skills for Energy Efficiency. Available online: https://www.scientific.net/AMR.1073-1076.1282 (accessed on 8 February 2019).
  36. Vogel, J.A.; Lundqvist, P.; Arias, J. Categorizing Barriers to Energy Efficiency in Buildings. Energy Procedia 2015, 75, 2839–2845. [Google Scholar] [CrossRef] [Green Version]
  37. Hong, H.; Geertman, S.; Hooimeijer, P. Personal values that drive the choice for green apartments in Nanjing China: The limited role of environmental values. J. Hous. Built Environ. 2016, 31, 1–17. [Google Scholar]
  38. Du, P.; Zheng, L.-Q.; Xie, B.-C.; Mahalingam, A. Barriers to the adoption of energy-saving technologies in the building sector: A survey study of Jing-jin-tang, China. Energy Policy 2014, 75, 206–216. [Google Scholar] [CrossRef]
  39. Gupta, P.; Anand, S.; Gupta, H. Developing a roadmap to overcome barriers to energy efficiency in buildings using best worst method. Sustain. Cities Soc. 2017, 31, 244–259. [Google Scholar] [CrossRef]
  40. Lin, B.; Liu, H. China’s building energy efficiency and urbanization. Energy Build. 2015, 86, 356–365. [Google Scholar] [CrossRef]
  41. Yang, L. Study on Fire Safety of Building External Thermal Insulation Materials. Adv. Mater. Res. 2014, 989–994, 5431–5434. [Google Scholar] [CrossRef]
  42. Liu, Y.; Guo, X.; Hu, F. Cost-benefit analysis on green building energy efficiency technology application: A case in China. Energy Build. 2014, 82, 37–46. [Google Scholar] [CrossRef]
  43. Sun, W.H. On China’s Current Obstacles in the Development Process of Green Buildings. Appl. Mech. Mater. 2013, 307, 494–497. [Google Scholar] [CrossRef]
  44. Cagno, E.; Worrell, E.; Trianni, A.; Pugliese, G. A novel approach for barriers to industrial energy efficiency. Renew. Sustain. Energy Rev. 2013, 19, 290–308. [Google Scholar] [CrossRef]
  45. Jin, H. Regulating Market Order by Introducing the Market Credit System. Constr. Mater. Decor. 2016, 2, 190–192. [Google Scholar]
  46. Qian, Q.K.; Chan, E.H.W.; Visscher, H.; Lehmann, S. Modeling the green building (GB) investment decisions of developers and end-users with transaction costs (TCs) considerations. J. Clean. Prod. 2015, 109, 315–325. [Google Scholar] [CrossRef] [Green Version]
  47. Geng, Y.; Dong, H.; Xue, B.; Fu, J. An overview of Chinese green building standards. Sustain. Dev. 2012, 20, 211–221. [Google Scholar] [CrossRef]
  48. Deng, W.; Yang, T.; Tang, L.; Tang, Y.-T. Barriers and policy recommendations for developing green buildings from local government perspective: A case study of Ningbo China. Intell. Build. Int. 2018, 10, 61–77. [Google Scholar] [CrossRef]
  49. Li, J. Analysis on Green Building’s Technological Development and Economic Feasibility in China. In Proceedings of the LTLGB 2012; Chen, F., Liu, Y., Hua, G., Eds.; Springer: Berlin/Heidelberg, Germany, 2013; pp. 855–862. [Google Scholar]
  50. Teng, J.; Zhang, W.; Wu, X.; Zhang, L. Overcoming the barriers for the development of green building certification in China. J. Hous. Built Environ. 2016, 31, 69–92. [Google Scholar] [CrossRef]
  51. Persson, J.; Grönkvist, S. Drivers for and barriers to low-energy buildings in Sweden. J. Clean. Prod. 2015, 109, 296–304. [Google Scholar] [CrossRef]
  52. Yang, Y.H. Green Building Movement Opportunity & Challenge in China. Adv. Mater. Res. 2015, 1065–1069, 2182–2185. [Google Scholar]
  53. Labanca, N.; Suerkemper, F.; Bertoldi, P.; Irrek, W.; Duplessis, B. Energy efficiency services for residential buildings: Market situation and existing potentials in the European Union. J. Clean. Prod. 2015, 109, 284–295. [Google Scholar] [CrossRef]
  54. Chen, Y.; Jiang, P.; Dong, W.; Huang, B. Analysis on the carbon trading approach in promoting sustainable buildings in China. Renew. Energy 2015, 84, 130–137. [Google Scholar] [CrossRef]
  55. Encinas, F.; Marmolejo-Duarte, C.; Sánchez de la Flor, F.; Aguirre, C. Does energy efficiency matter to real estate-consumers? Survey evidence on willingness to pay from a cost-optimal analysis in the context of a developing country. Energy Sustain. Dev. 2018, 45, 110–123. [Google Scholar] [CrossRef]
  56. Gillingham, K.; Palmer, K. Bridging the Energy Efficiency Gap: Policy Insights from Economic Theory and Empirical Evidence. Rev. Environ. Econ. Policy 2013, 8, 18–38. [Google Scholar] [CrossRef]
  57. Jaffe, A.B.; Stavins, R.N. The energy-efficiency gap What does it mean? Energy Policy 1994, 22, 804–810. [Google Scholar] [CrossRef]
  58. Klemick, H.; Wolverton, A. Energy-Efficiency Gap. In Encyclopedia of Energy, Natural Resource, and Environmental Economics; Shogren, J.F., Ed.; Elsevier: Waltham, UK, 2013; pp. 74–81. ISBN 978-0-08-096452-2. [Google Scholar]
  59. Windapo, A.O. Examination of Green Building Drivers in the South African Construction Industry: Economics versus Ecology. Sustainability 2014, 6, 6088–6106. [Google Scholar] [CrossRef] [Green Version]
  60. Chan, E.H.W.; Qian, Q.K.; Lam, P.T.I. The market for green building in developed Asian cities—the perspectives of building designers. Energy Policy 2009, 37, 3061–3070. [Google Scholar] [CrossRef]
  61. Zou, P.; Couani, P. Managing risks in green building supply chain. Arch. Eng. Des. Manag. 2012, 8, 143–158. [Google Scholar] [CrossRef]
  62. Worzala, E.; Bond, S. Barriers and drivers to green buildings in Australia and New Zealand. J. Prop. Investig. Financ. 2011, 29, 494–509. [Google Scholar]
  63. Chinese Green Building Evaluation Label. Available online: http://www.cngb.org.cn/index.action?sid=402888b74f68e52e014f696c7643000c (accessed on 4 March 2019).
  64. Christoforidis, G.; Melandri, D.; Branciforti, V.; Nousdilis, A.; Papagiannis, G.; Peñalvo-López, E. Meeting of Energy Skills: An Educational Framework for Energy Professionals in NZEB. In Proceedings of the 2016 IEEE 16th International Conference on Environment and Electrical Engineering (EEEIC), Florence, Italy, 7–10 June 2016. [Google Scholar]
  65. Zhou, B.; Liu, J.; Zhang, G. Engineering education and practice for sustainable operation concept of green building. J. Arch. Educ. Instit. High. Learn. 2016, 25, 1–4. (In Chinese) [Google Scholar]
  66. Alemanno, A. Stakeholder Engagement in Regulatory Policy. Regulatory Policy Outlook, OECD Publishing. 2015. Available online: https://ssrn.com/abstract=2701675 (accessed on 8 February 2019).
  67. Li, T.H.; Thomas Ng, S.; Skitmore, M. Modeling multi-stakeholder multi-objective decisions during public participation in major infrastructure and construction projects: A decision rule approach. J. Constr. Eng. Manag. 2015, 142, 04015087. [Google Scholar] [CrossRef]
  68. Li, T.H.; Ng, S.T.T.; Skitmore, M.; Li, N. Investigating Stakeholder Concerns during Public Participation; ICE Publishing: London, UK, 2016; Volume 169, pp. 199–219. [Google Scholar]
  69. Andrews-Speed, P.; Zhang, S. Energy Efficiency and Conservation. In China as a Global Clean Energy Champion: Lifting the Veil; Andrews-Speed, P., Zhang, S., Eds.; Palgrave Series in Asia and Pacific Studies; Springer: Singapore, 2019; pp. 193–214. ISBN 9789811334924. [Google Scholar]
  70. Lo, K. China’s low-carbon city initiatives: The implementation gap and the limits of the target responsibility system. Habitat Int. 2014, 42, 236–244. [Google Scholar] [CrossRef]
  71. Kostka, G.; Hobbs, W. Local Energy Efficiency Policy Implementation in China: Bridging the Gap between National Priorities and Local Interests. China Q. 2012, 211, 765–785. [Google Scholar] [CrossRef] [Green Version]
  72. Wenling, Y. Current Situation and Policy Design for the Development of High-Performance Building Material. Build. Mater. Decor. 2018, 2, 43–44. (In Chinese) [Google Scholar]
Figure 1. Total area of residential building from 2001 to 2017 in China.
Energies 12 01073 g001
Figure 2. Area of new residential buildings from 2001 to 2017 in China.
Energies 12 01073 g002
Figure 3. Energy consumption of buildings from 2000 to 2014 in China. (a) depicts the total energy consumption of buildings, residential buildings and the corresponding percentage in the entire country; (b) illustrates the calculated energy intensity based on the area data in Figure 1 and the energy data in Figure 3a.
Energies 12 01073 g003
Figure 4. System of stakeholders’ interactions.
Energies 12 01073 g004
Figure 5. Results of institution selection. (a) depicts the selection result from climate zones perspective, (b) depicts the selection based on different interests that various stakeholders stand for, and (c) depicts the results of selection based on GDP per Capita of the provinces that institutes are located in.
Energies 12 01073 g005
Figure 6. Correspondence between the Likert 5-Scale scoring and the perceived severity of the barriers.
Energies 12 01073 g006
Figure 7. M, V, K, S of all the evaluation opinions for identified barriers; (a) describes the barriers’ distribution according to their Mean Values and Variance Values; (b) describes the barriers’ distribution according to their K and S values.
Energies 12 01073 g007
Figure 8. M, V, K, S and M ranking of all the identified barriers.
Energies 12 01073 g008
Figure 9. Results of Cluster Analysis. (a) presents the Dendrogram of the clustering process and (b) presents calculated M, V, K, S of barriers in different clusters.
Energies 12 01073 g009
Figure 10. Calculated Value and Ranking of M, V, K, S of each cluster.
Energies 12 01073 g010
Figure 11. Frequency and Evaluated Severity of All the Identified Barriers.
Energies 12 01073 g011
Figure 12. Mechanisms of how the identified barriers affect the development of the industry.
Energies 12 01073 g012
Table 1. Profile of first round of questionnaire.
FieldsBarriersCFNotes from InstitutesSample Reference
ConceptRoadmapCO13There is a lack of ultimate energy-efficiency promotion targets, such as issuing nZEB standard at some specific time node. [17]
Current national plan only concerns a period of 5 years. However, a long-term roadmap concerning over ten years is an urgent need.[17]
Leading ConceptCO21Various kinds of concepts regarding energy-efficiency promotion for new residential buildings have occurred and many pilot projects have been constructed. However, the propagation feasibility of these concepts is not adequately studied, taking the current governance arrangement, the market development, and other factors into consideration.[36]
Concept of Home-buyersCO318Most consumers are not fully aware of and sensitive to the benefits of green buildings.[37,38]
The exacerbation of energy is not tightly associated with the daily life quality of residents.[39,40]
The concepts of green lifestyle and green consumption are not fully popularized.[4,40]
There is no strong need for high-performance buildings from home-buyers’ perspectives.[34,37,38]
Concept of EnterprisesCO43Generally, most enterprises have not recognized their social responsibilities and have little willing to overcome the externality of new residential building energy-efficiency promotion. [17]
Most enterprises in the industrial value chain, especially the DEVELOPERS, have not recognized the benefits of high-performance buildings. The concepts of related enterprises shall be updated.[17,34]
There is still a lack of propagation of the concept “new residential building energy-efficiency promotion”.[34]
MarketMarketization of Energy-Saving Building Material MarketMA13The performance of building materials cannot meet the strictest requirement in the market.[39]
The promotion of insulation performance of building materials contradicts its promotion of the fire-preventing performance.[41]
The adoption of high-performance building materials leads to a great incremental cost.[38,42]
Legalization of Energy-Saving Building Material MarketMA21The “Market Access System” does not work as strictly as it is expected. Products of poor quality can still also penetrate the market due to its lower price than the good one. The phenomenon “Bad Money Drives the Good Money out of Circulation” still exists and is of great popularity.[39,43]
Marketization of Energy-Saving Equipment MarketMA35Products of high performance and cost-effectiveness are under development.[39,44]
Massive production of high-quality, high cost-effectiveness and high-performance equipment cannot meet the need from market stakeholders.[39,44]
There is still room for the promotion of the stability of HVAC equipment/controlling systems and the cost-effectiveness of the equipment.[39,44]
Legalization of Energy-Saving Equipment MarketMA42On the one hand, the quality of energy-saving equipment is a major problem. On the other hand, the post-sale services are often of poor quality at current stage.[4]
Perfection of Market Credit SystemMA52Currently there is no special credit system for the enterprises participating in the development and construction of high-performance buildings.[45]
Lack of IncentivesMA65There is still a lack of incentives which can effectively increase the activeness of the developers, such as Volume Ratio Refund, Preferential Tax Rate, etc.[39]
The institution of sharing the benefits of developing and constructing high-performance buildings is not mature. For example, there is still a debate in research field about who should get the subsidy from the government, developers or residents.[46]
The supply and demand of housing can also have great influence on the development of new residential building energy-efficiency promotion. In other words, the propagation of high-performance buildings relies significantly on the development of the real-estate.[39]
Carbon Tax has not been introduced into the new residential building sector nationally.[47]
The “Pre-sale System” for commercial housing prevents home-buyers from feeling the benefits of high-performance buildings directly.[48]
TechnologyTechnology System Innovation/PropagationTE12Lack of complete technical solutions for high-performance technologies.[39,49]
The actual outcome of some technologies is not asserted.[39]
Research outcomes cannot effectively be translated into technology innovations in time.[39]
Current technologies are not 100% feasible taking climate, habits of residents, cost-effectiveness and other factors into consideration.[39]
Construction RequirementsTE23Despite good design of a project, the quality of the construction cannot meet the expected requirements.[35]
The adoption of high-performance technologies requires higher and more strict construction requirements, which is low at current stage.[35]
EconomyCostEC14There is a high incremental cost when adopting high-performance technologies and developing projects of high-performance buildings. Products of high performance are also expensive.[34,50]
There is no specific and feasible energy quota mechanism for regulating the energy consumption.[47]
High labor cost for implementing high-performance technologies.[4,34,50]
BenefitEC24Most projects can realize the target of energy conservation but struggle to profit from energy conservation. [46]
Energy conservation demand cannot be effectively translated into energy savings.[47]
Residents cannot see an obvious benefit from buying high-performance buildings.[37]
Long payback period due to the relatively low energy price.[39,51]
Capacity BuildingDesign CapacityCB16Current popular design strategies mostly focus on a single building, neglecting its interactions with the surroundings.[39,52]
Current popular design strategies pay too much attention on the implementation of those high energy-efficiency products. There is a lack of design capacity from the perspective of “systematic energy efficiency”.[52]
Current design strategy pays too much attention on the energy savings, neglecting the comprehensive application of multiple kinds of resources and primary energy.[52]
There is still a lack of the design capacity regarding distributed energy system.[52]
Implementation CapacityCB213In comparison with the high/strict construction requirements, construction enterprises lack of the capacity to meet the requirements.[35]
Green Property Managements has not acquired enough attention, not only from the governments, but also from the residents. Correspondingly, relevant enterprises lack the capacity to conduct property management in a green way. In addition, the actual outcome of conducting green property management is also far from satisfaction.[4,53]
Some government departments lack the capacity to cooperate with other ones for the better policy settings or policy implementations.[44,39]
There is room for the capacity building of market stakeholders, such as post-occupational education and training. Experts in new residential building energy-efficiency promotion are also urgently needed. In addition, the ability to evaluate the condition of resources accurately is also urgently needed, as is the ability to apply high performance technologies.[4,35,39]
Inspection and Supervision CapacityCB33The supervisory organization cannot fulfill its responsibility to identify all the problems affecting the construction quality of high-performance buildings.[4]
Current Energy-Efficiency Assessment Agencies lack the capacity to evaluate the actual energy savings of the project.[4]
Policy SettingsFinancial SupportPS19There is a lack of financial incentive policy preference for high-performance buildings.[4,39]
From enterprises’ perspectives, it is hard to get financial support from governments due to the complicated requirements.[38,39]
Policy Design/Policy SystemPS215Laws and regulations related to the new residential building energy efficiency should be further improved.[4,34]
Mandatory requirements for the key links/parameters in developing/constructing the high-performance buildings are an urgent need.[4]
Current policy design cannot cover the whole life span/cycle of the high-performance buildings.[51]
Building Carbon Emission Trading Mechanism has not been propagated and popularized nationally.[54]
There is some inconformity in current standard system.[4]
Current evaluation standards of high-performance buildings are so unspecific that results will vary depending on different experts participating in the evaluation process.[38]
Policy ImplementationPS34Jurisdiction of relevant government departments are not only complicated but also so unspecific that the explanation and implementation of the policies are significantly affected.[39]
Policies and standards are often not 100-percent implemented regarding the developing and construction process.[4,39]
Guiding Ability of PoliciesPS42Current policy incentive system cannot effectively motivate the stakeholders.[39]
Lack of detailed/operable standards for implementing the incentive policies.[38]
The guiding ability of policies should be further strengthened by setting up mandatory requirements.[48]
Notes: F—Frequency, stands for how many institutes indicated the specific barrier; C—Code.
Table 2. Evaluation Result of Cluster Analysis.
CodeMVKSClusterRobustness JudgementsM Ranking
CO13.541.665−0.48−0.5861NR13
CO23.751.676−0.543−0.711NR8
CO33.541.813−0.417−0.8171NR14
CO43.51.4440.577−1.2412R-1/R-217
MA13.51.370.3−0.972R-1/R-218
MA23.930.884−0.714−0.4263R-12
MA33.611.210.605−0.9222R-1/R-211
MA43.931.106−0.66−0.6724R-13
MA54.210.9890.503−1.1932R-01
MA63.751.528−0.078−0.8791NR9
TE13.750.935−0.836−0.2483R-110
TE23.291.1010.116−0.4194R-120
EC13.541.369−0.861−0.1673R-115
EC23.791.4342.216−1.2275R-27
CB13.571.365−0.136−0.564R-112
CB23.931.0321.143−0.992R-1/R-24
CB32.822.671−0.828−0.5146NR21
PS13.541.665−0.466−0.6971NR16
PS23.821.1150.489−0.8372R-1/R-26
PS33.930.735−0.771−0.2363R-15
PS43.432.6980.067−1.0257NR19

