A Techno-Economic Analysis of Vehicle-to-Building: Battery Degradation and Efficiency Analysis in the Context of Coordinated Electric Vehicle Charging


Abstract
:
1. Introduction
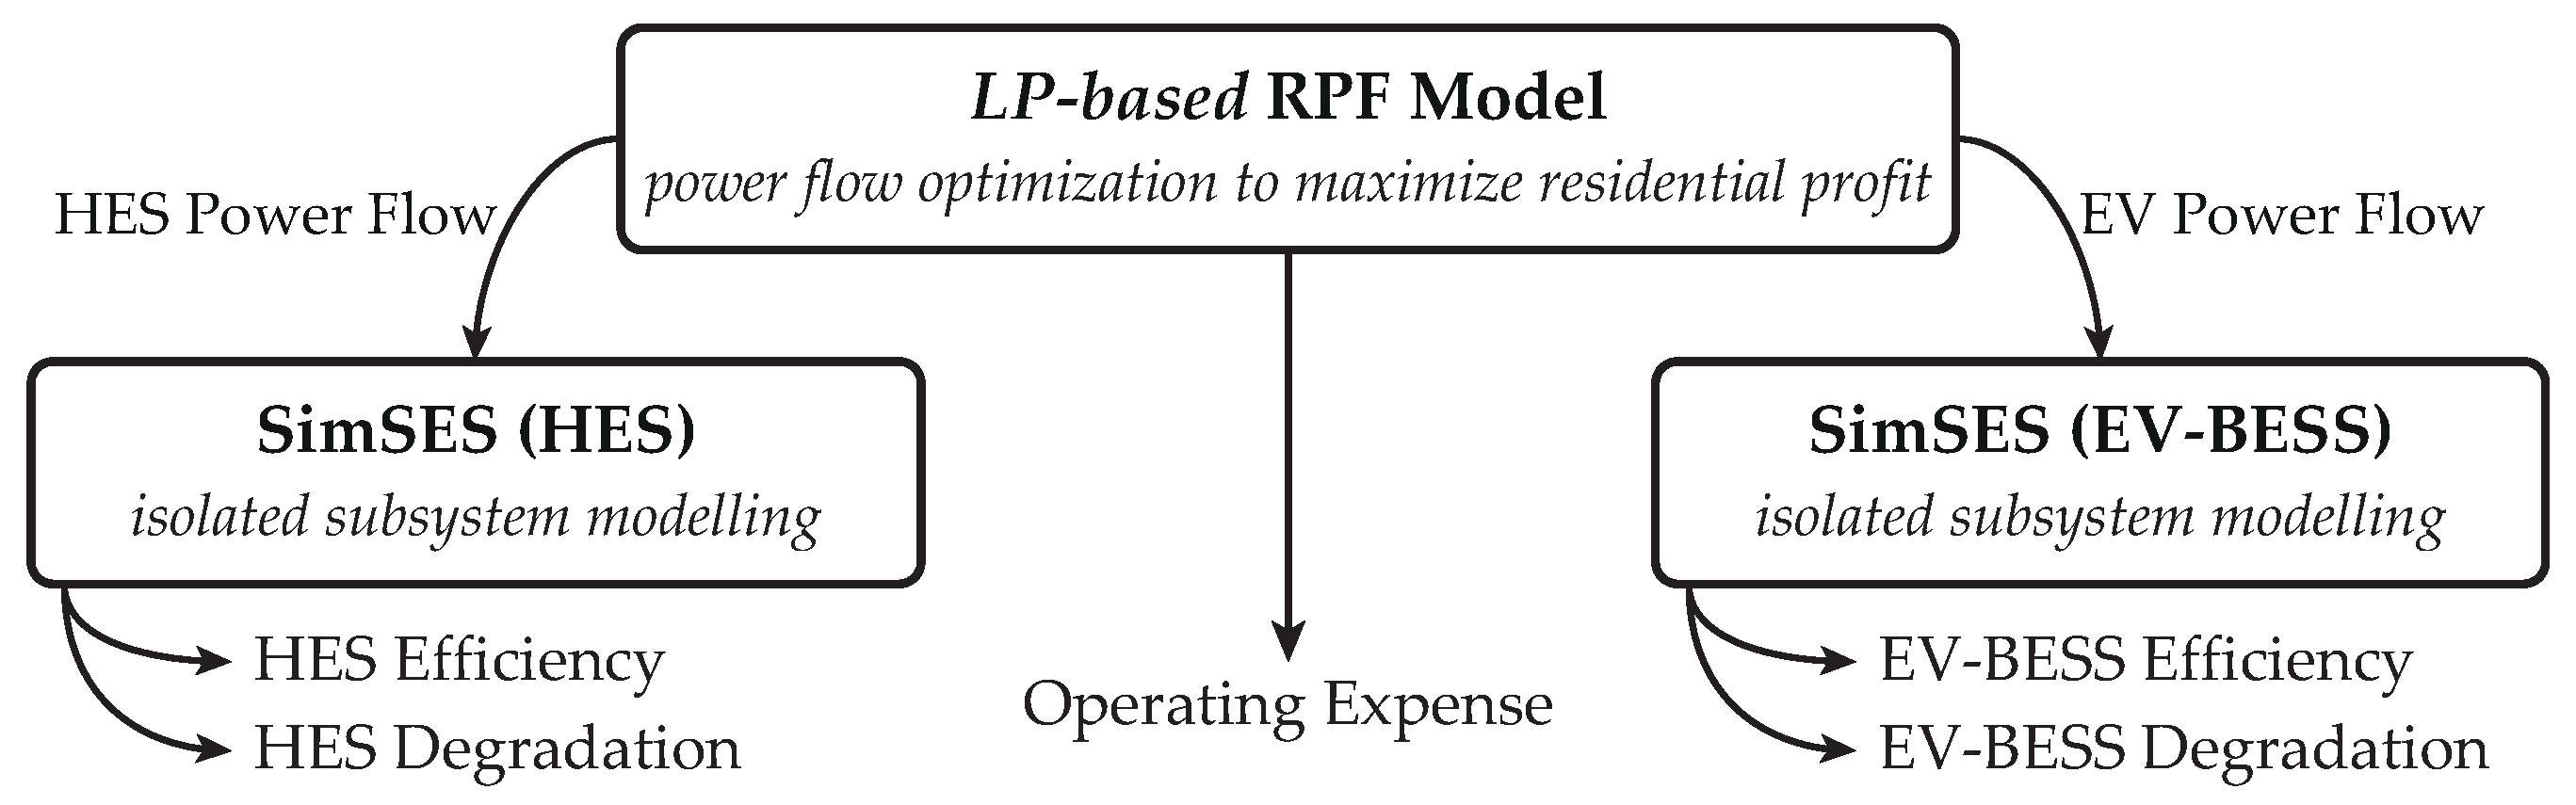
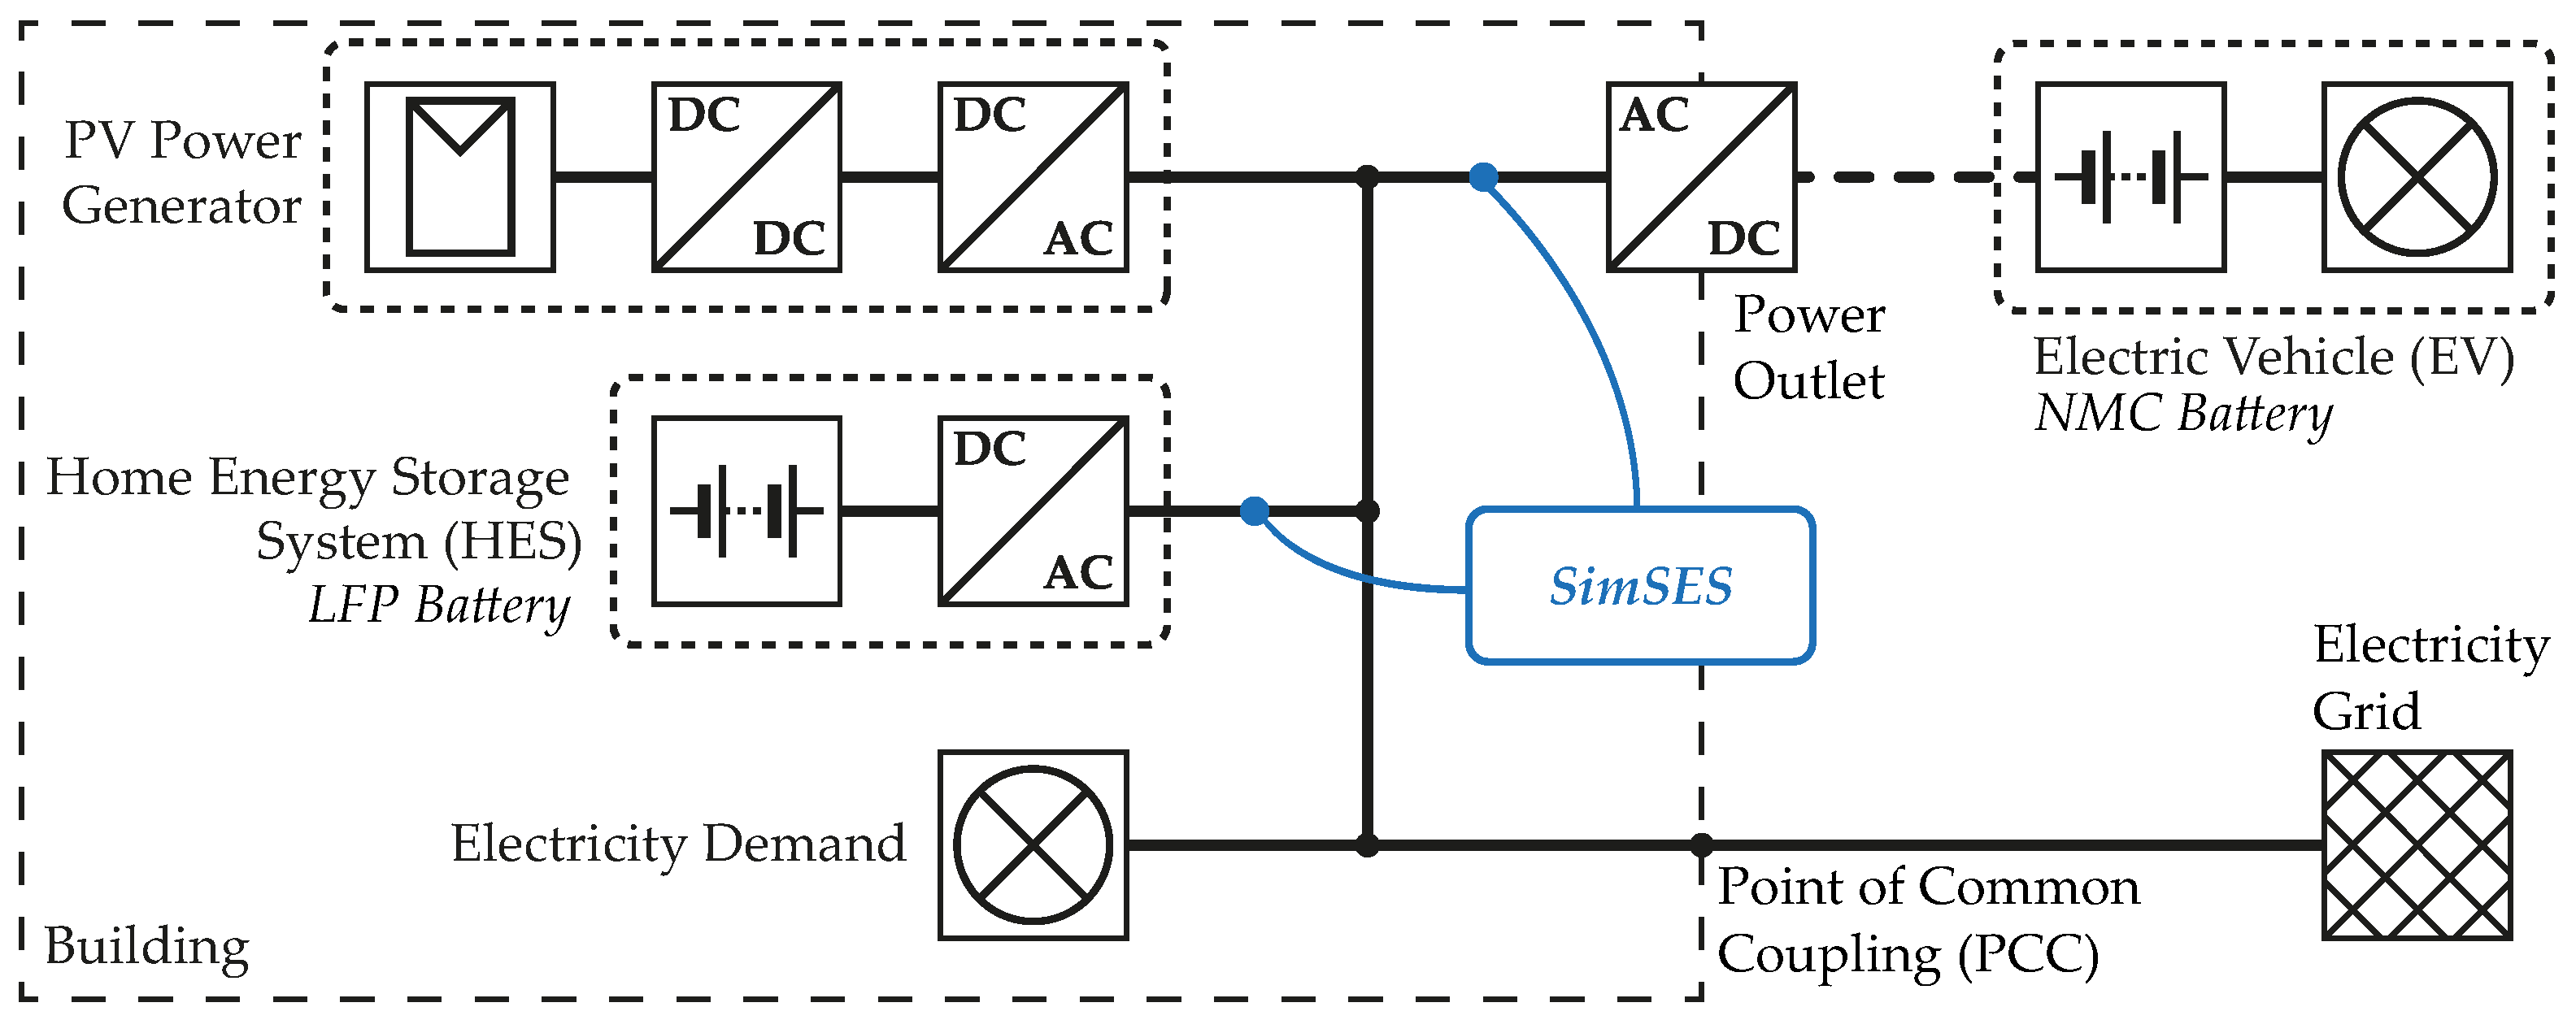
2. Methods
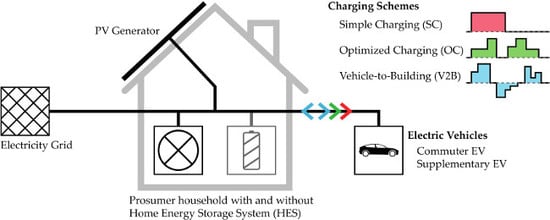
- simple charging (SC): A simple rule-based charging of the EV is applied, where power is delivered unidirectionally from the power outlet of the building to the vehicle. As long as the vehicle is connected to the building and the EV’s battery SOC has not reached the maximum SOC limit, the EV gets charged at the maximum allowed charge rate. The RPF model, as well as the simulation tool SimSES, are considering constraints for the respective SOC and C-Rate boundaries.
- optimized charging (OC): Similar to SC the power outlet is used for unidirectional vehicle charging only. An advanced strategy is used that optimizes and controls the amount of energy and the timing of the EV’s charging. The controller is fed by input values such as power flows within the building and the plug-in times of the EV.
- vehicle-to-building (V2B): As an extension of the OC strategy, V2B enables a bidirectional power flow between the EV and building.
3. Results
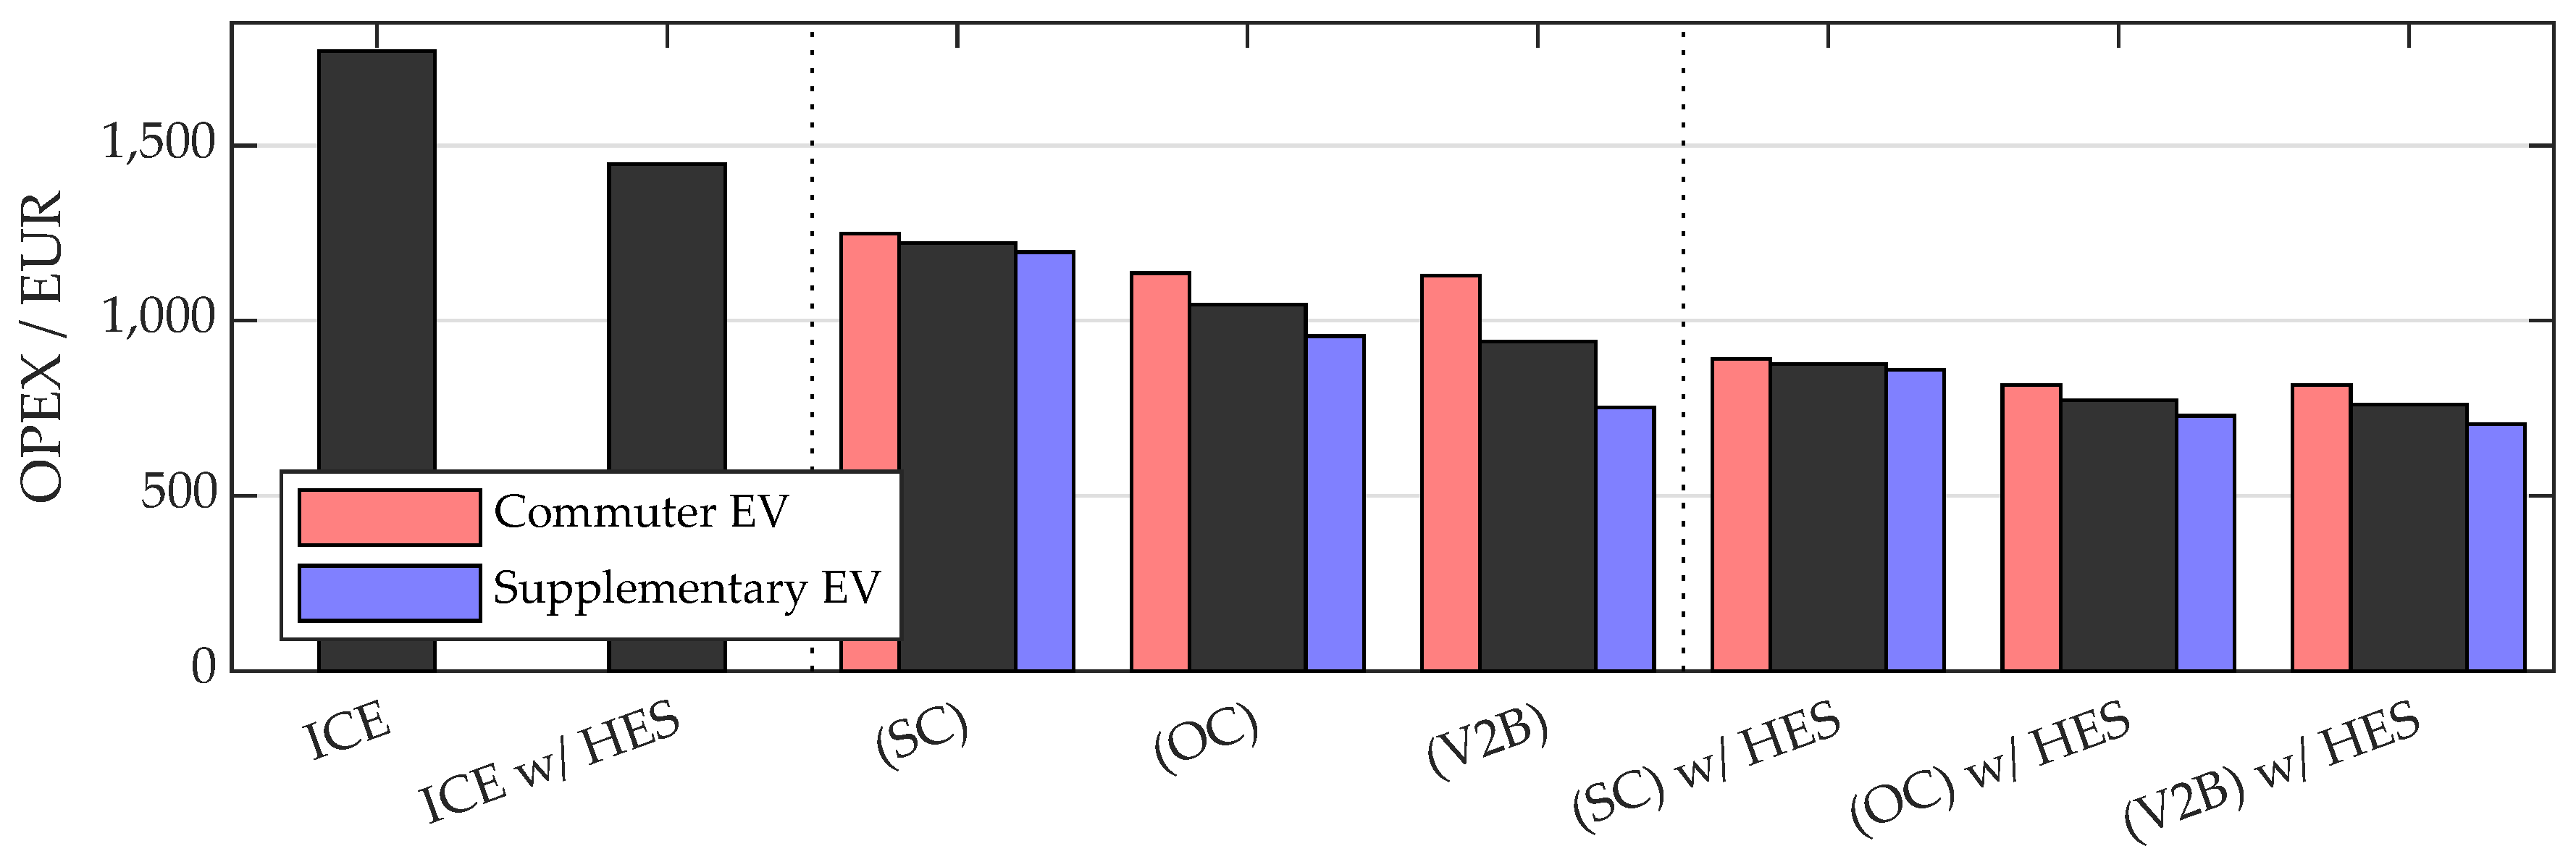
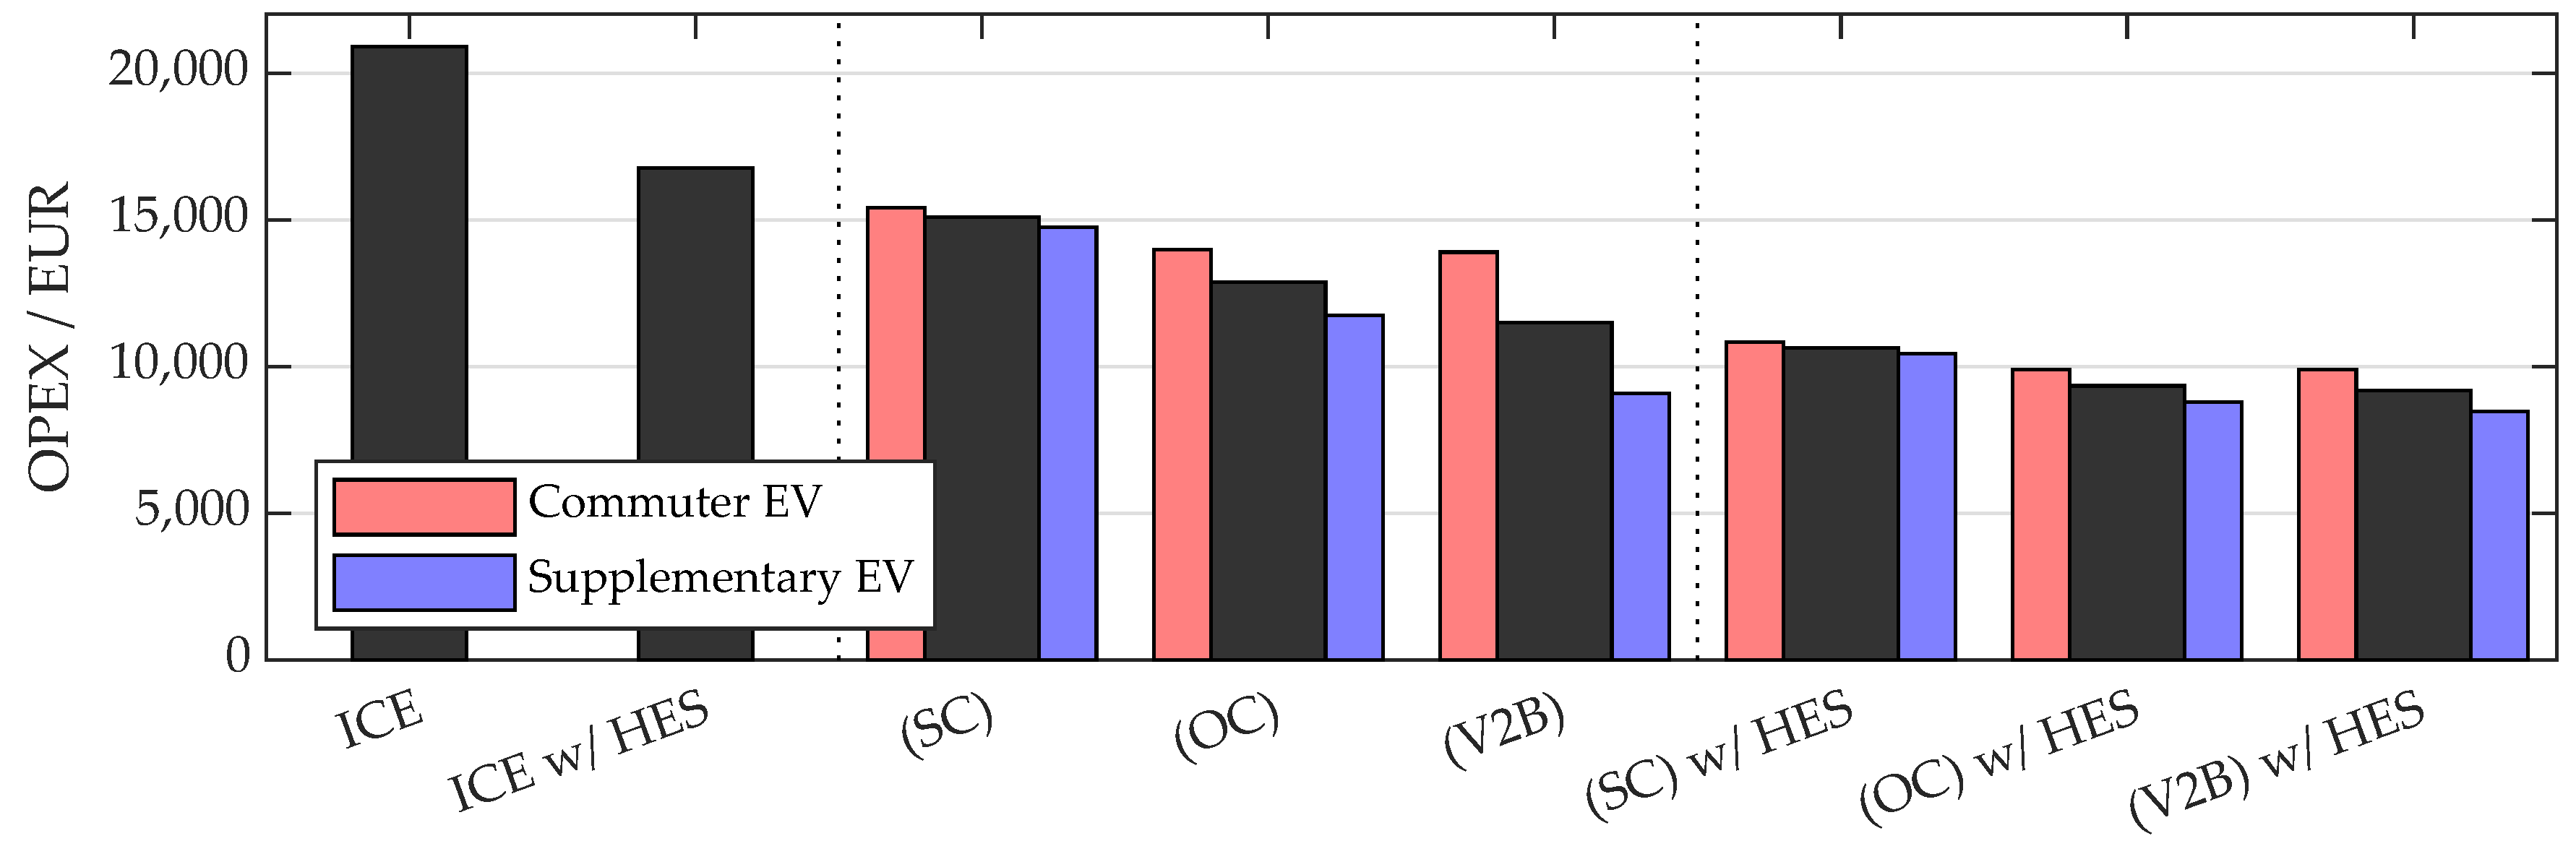
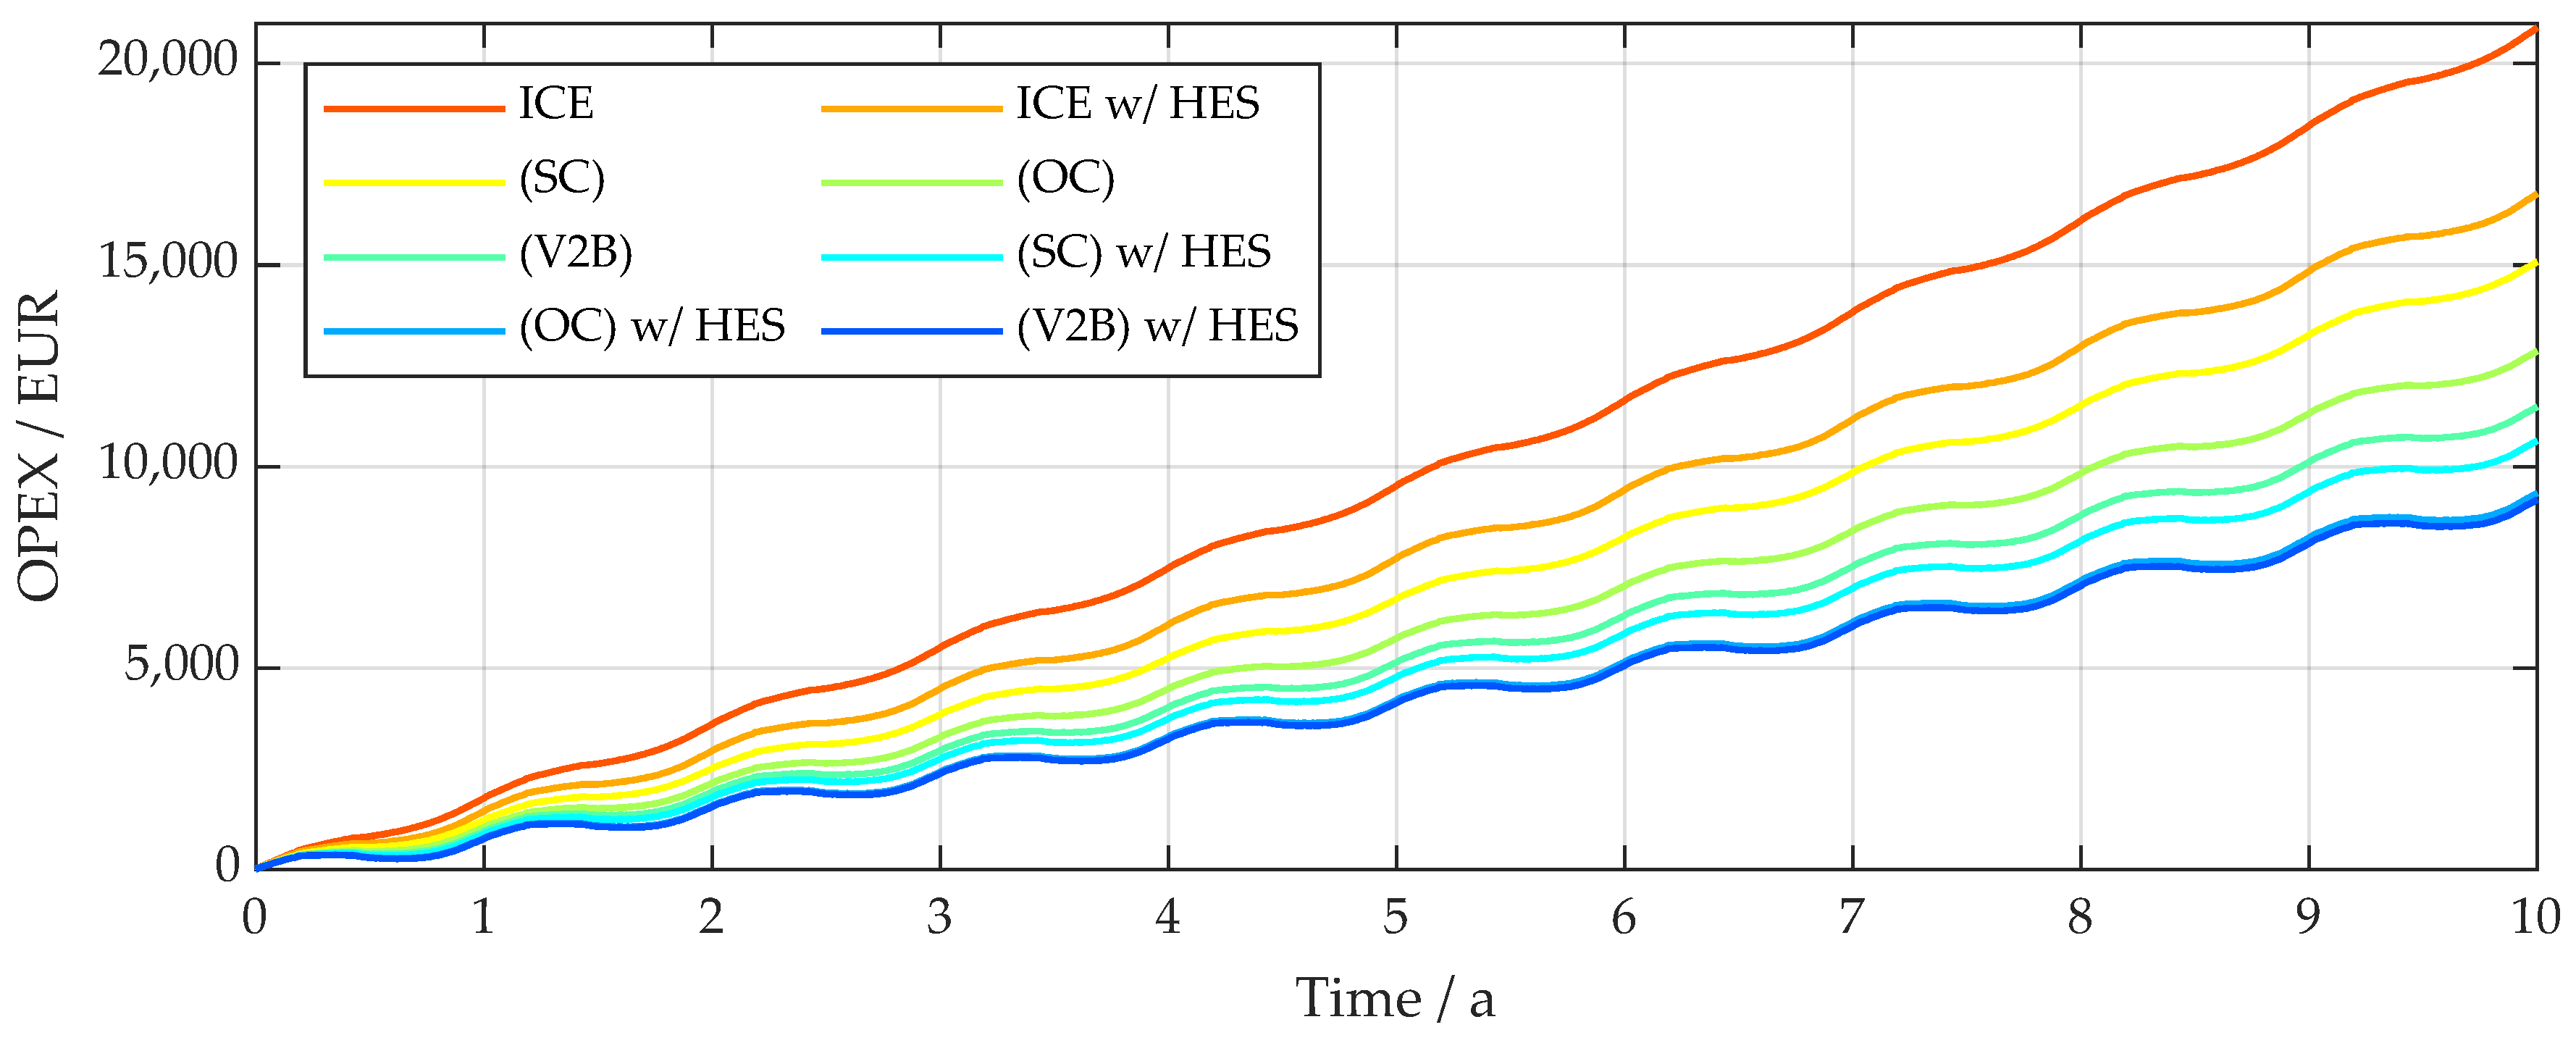
3.1. Economic Assessment of OPEX
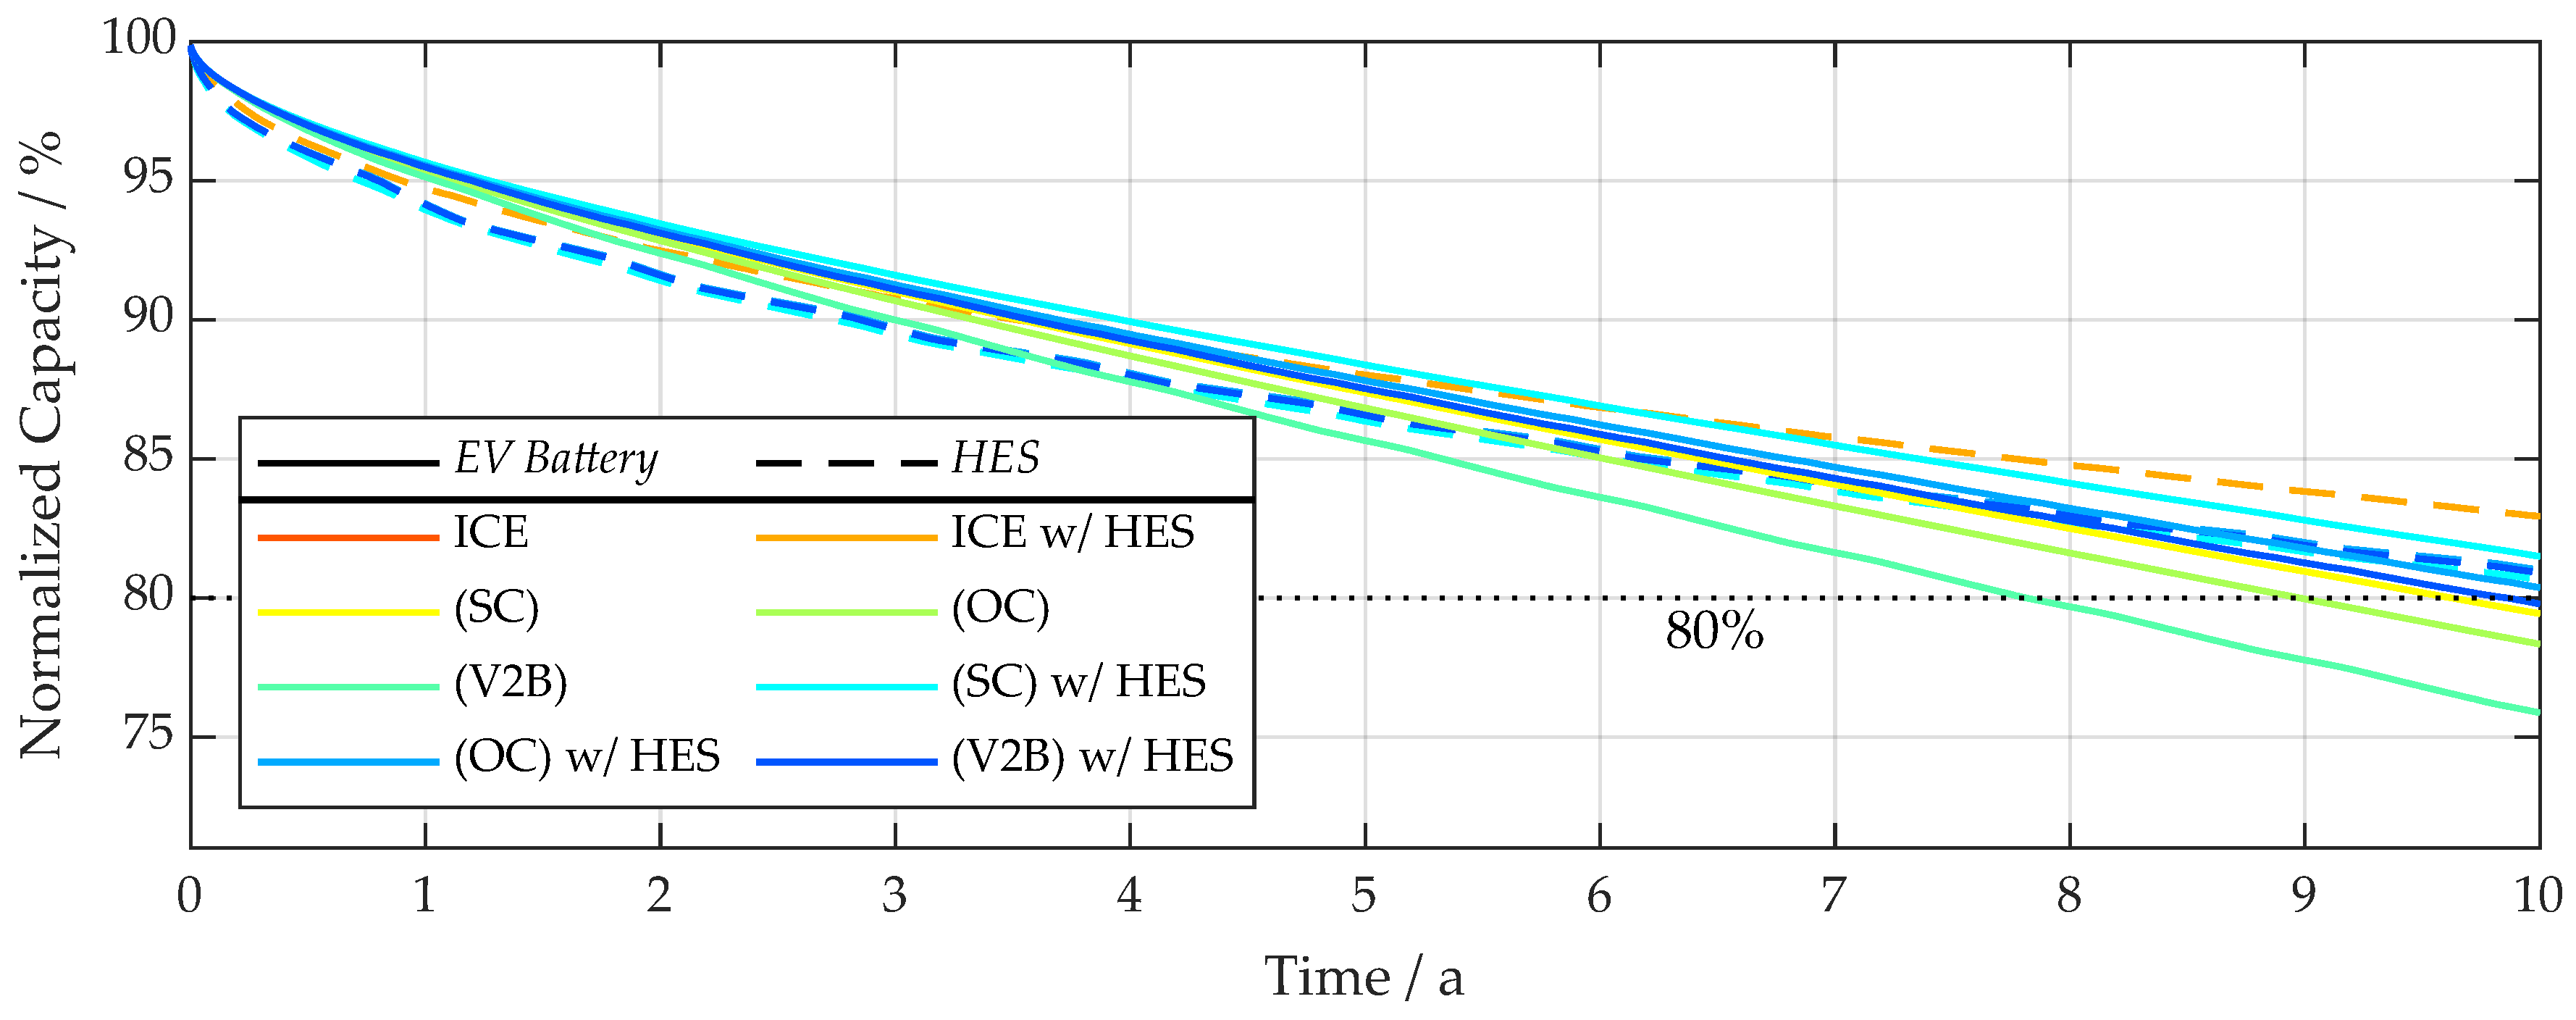
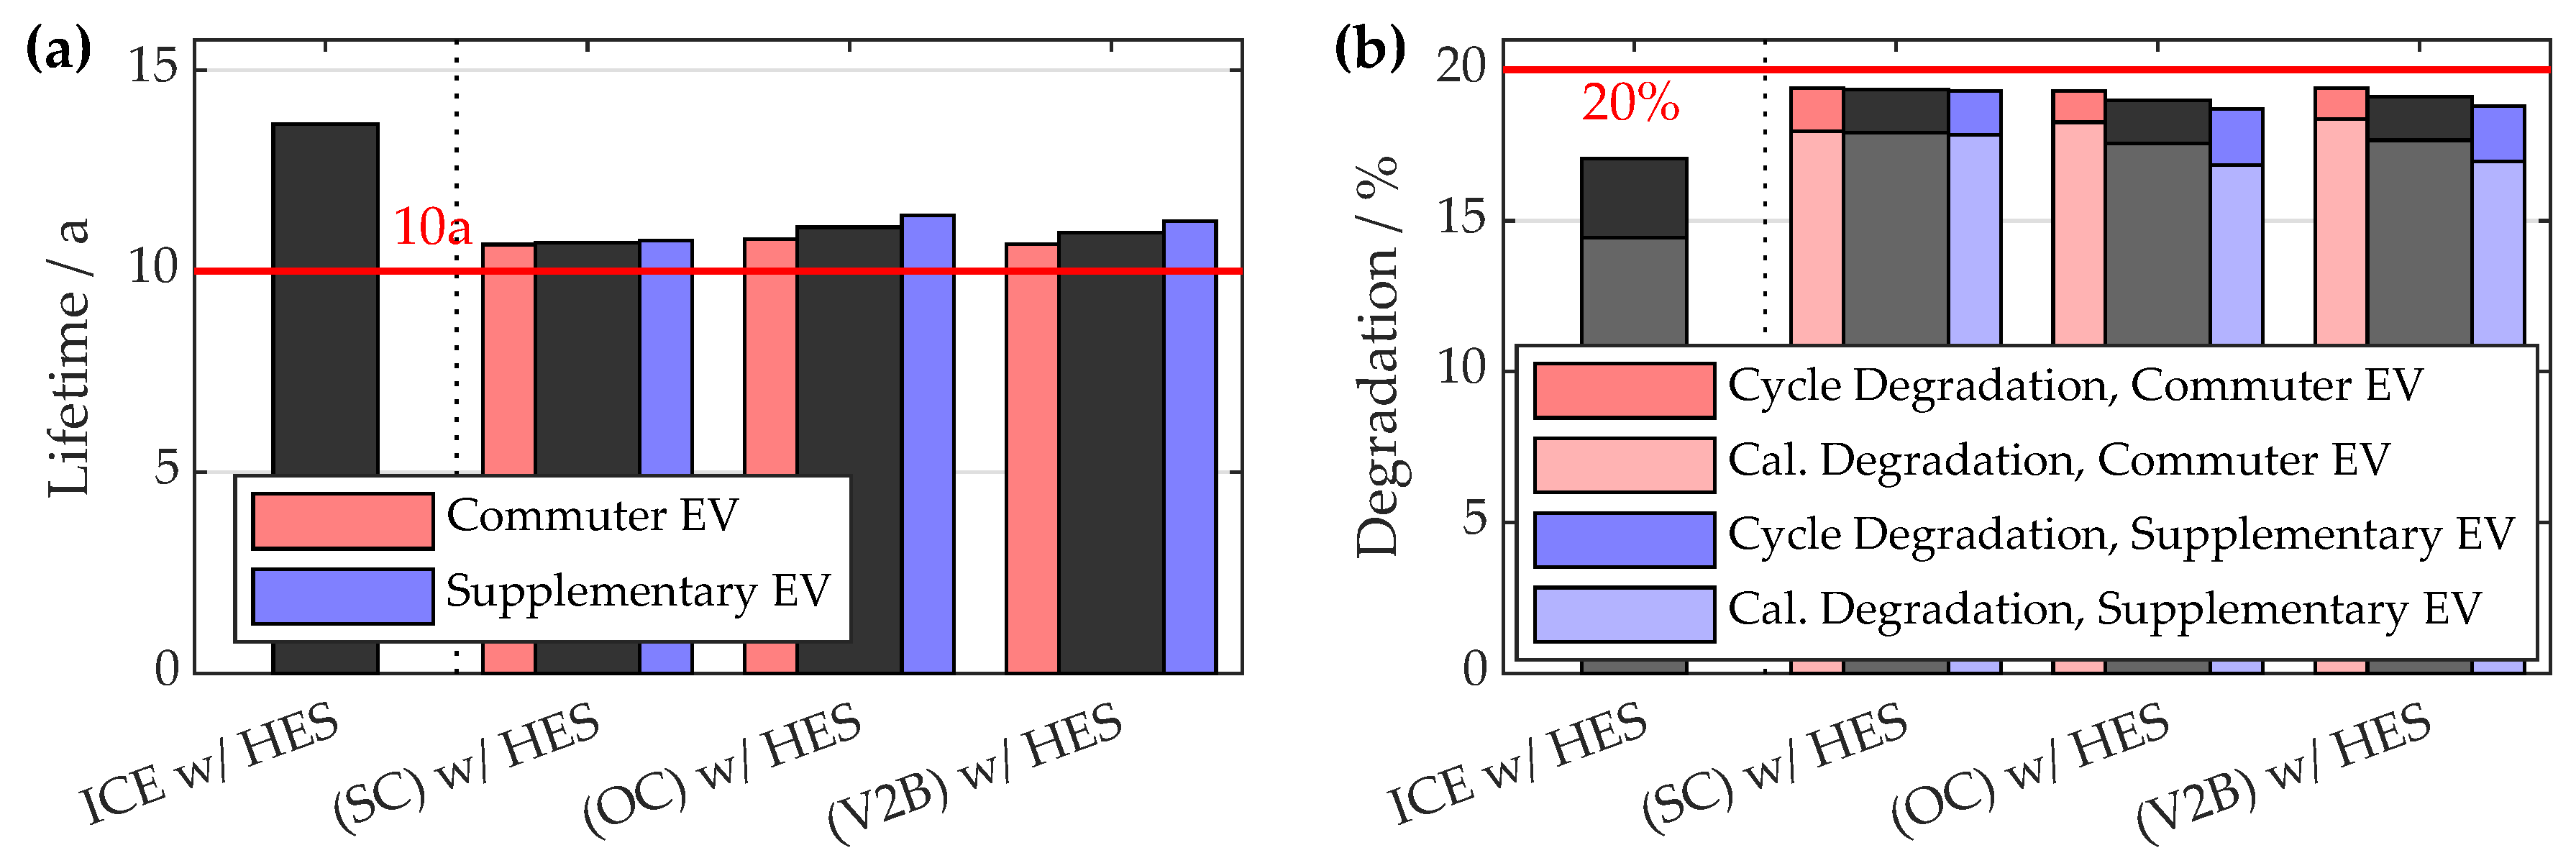
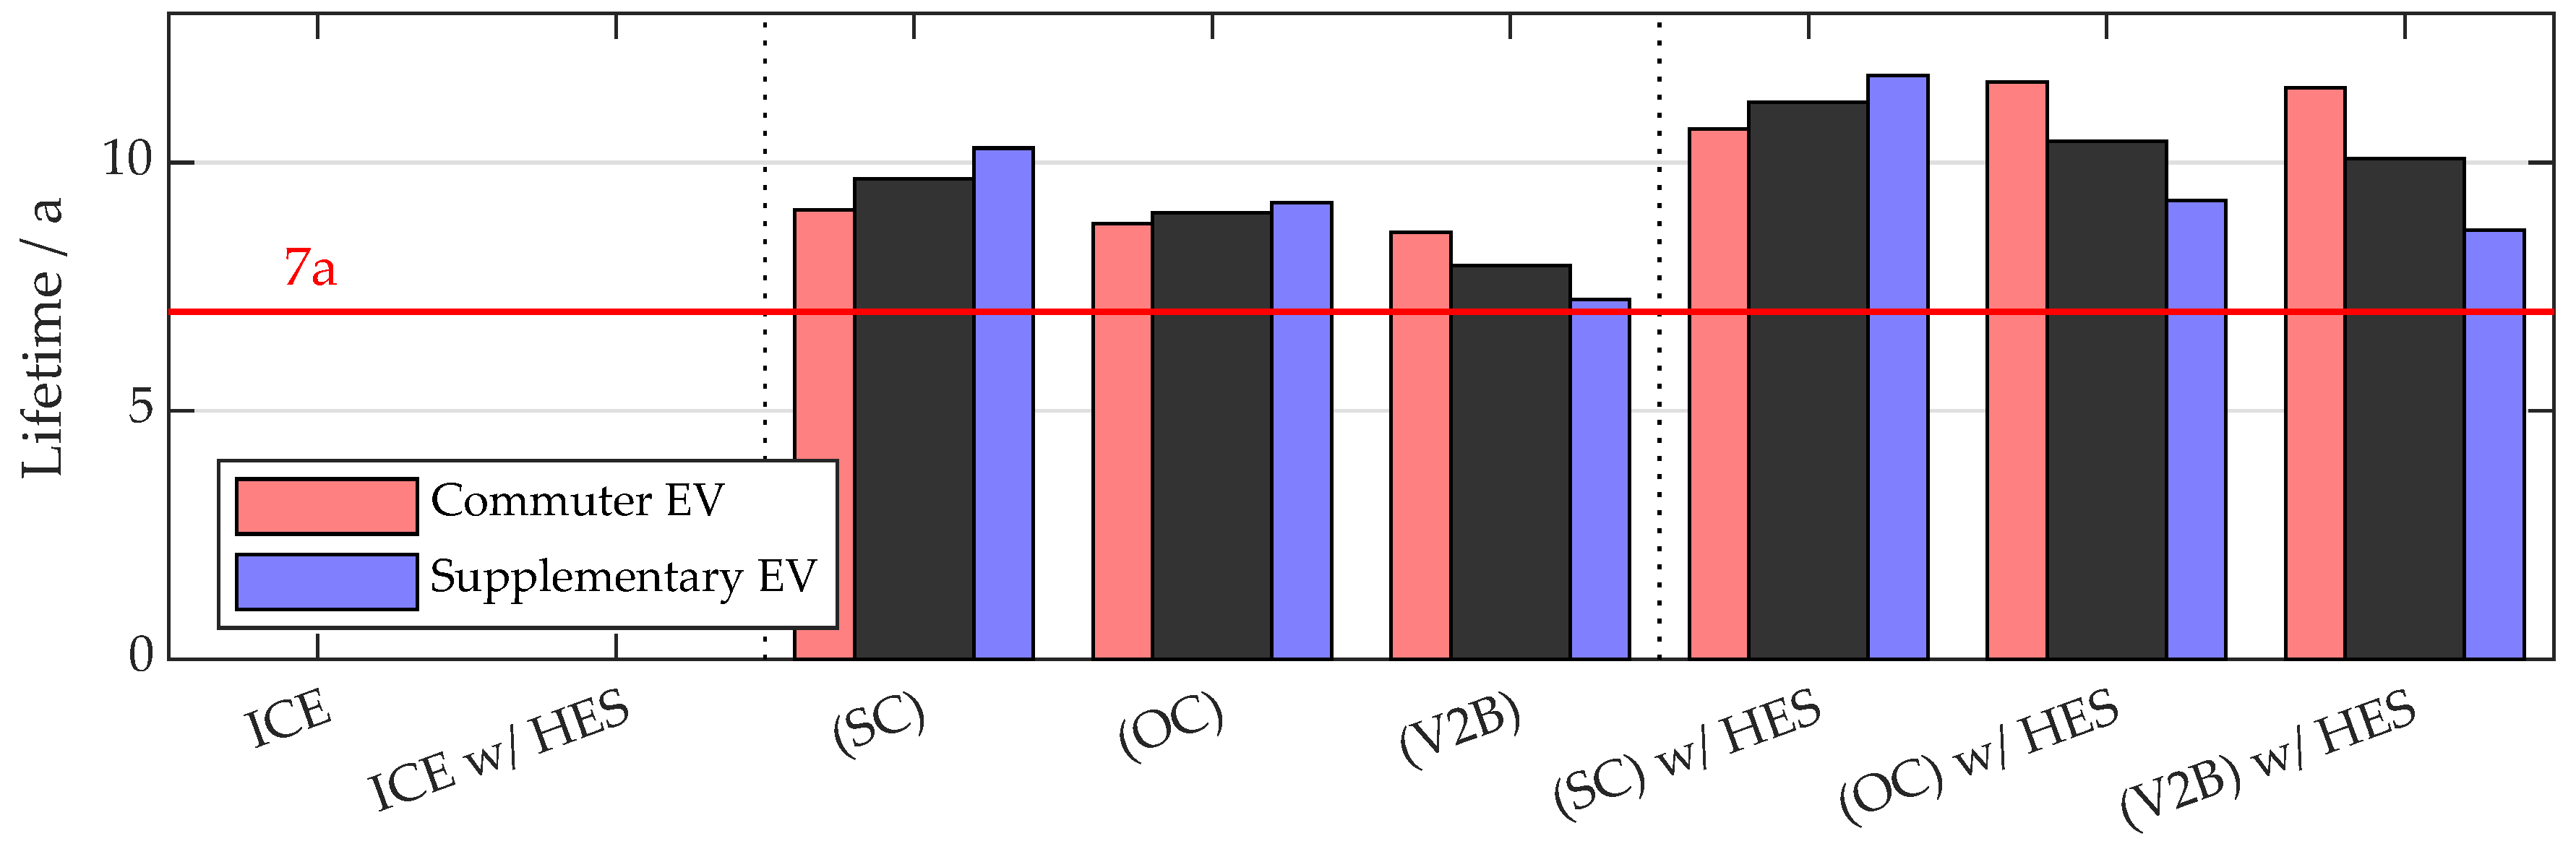
3.2. Battery Lifetime and Degradation
3.2.1. Home Energy Storage System
3.2.2. EV Battery
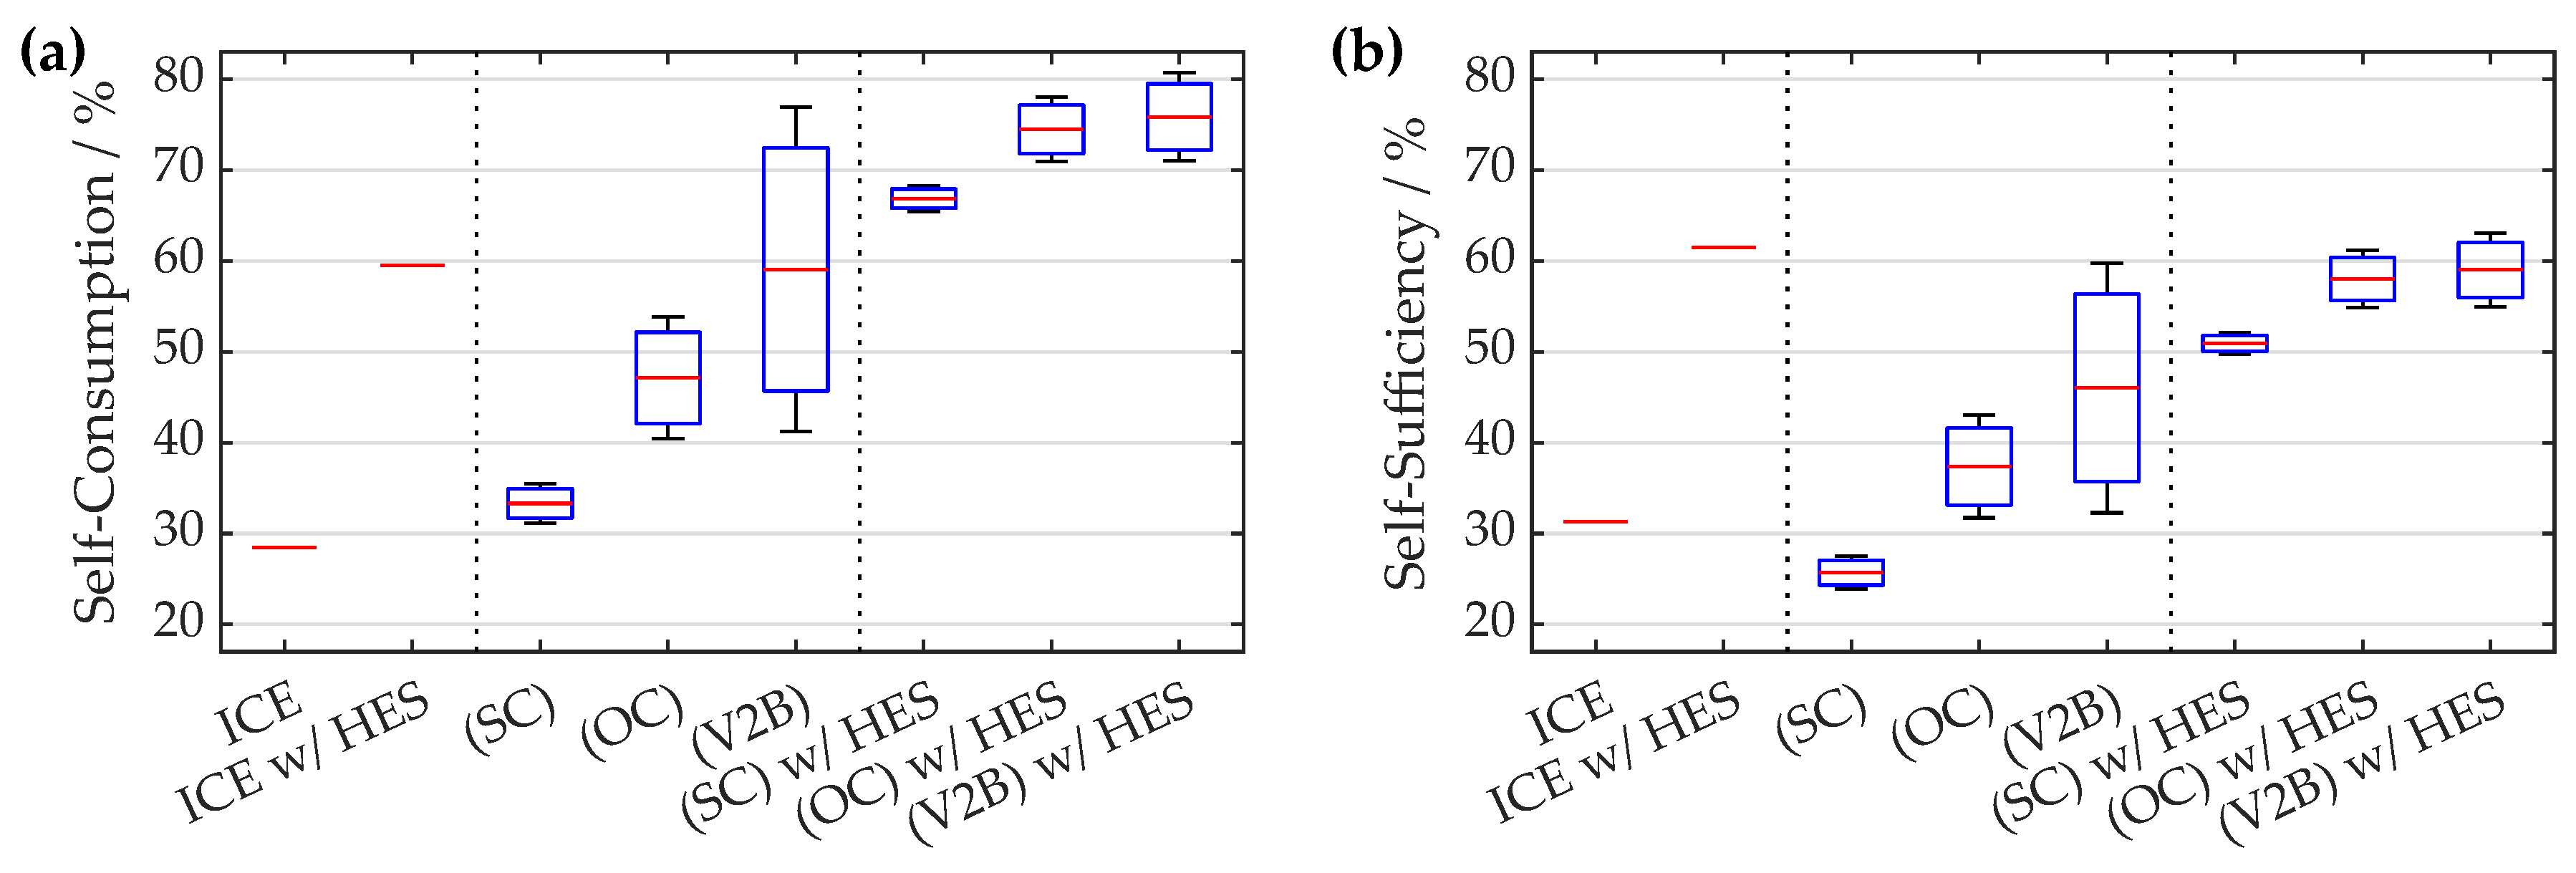
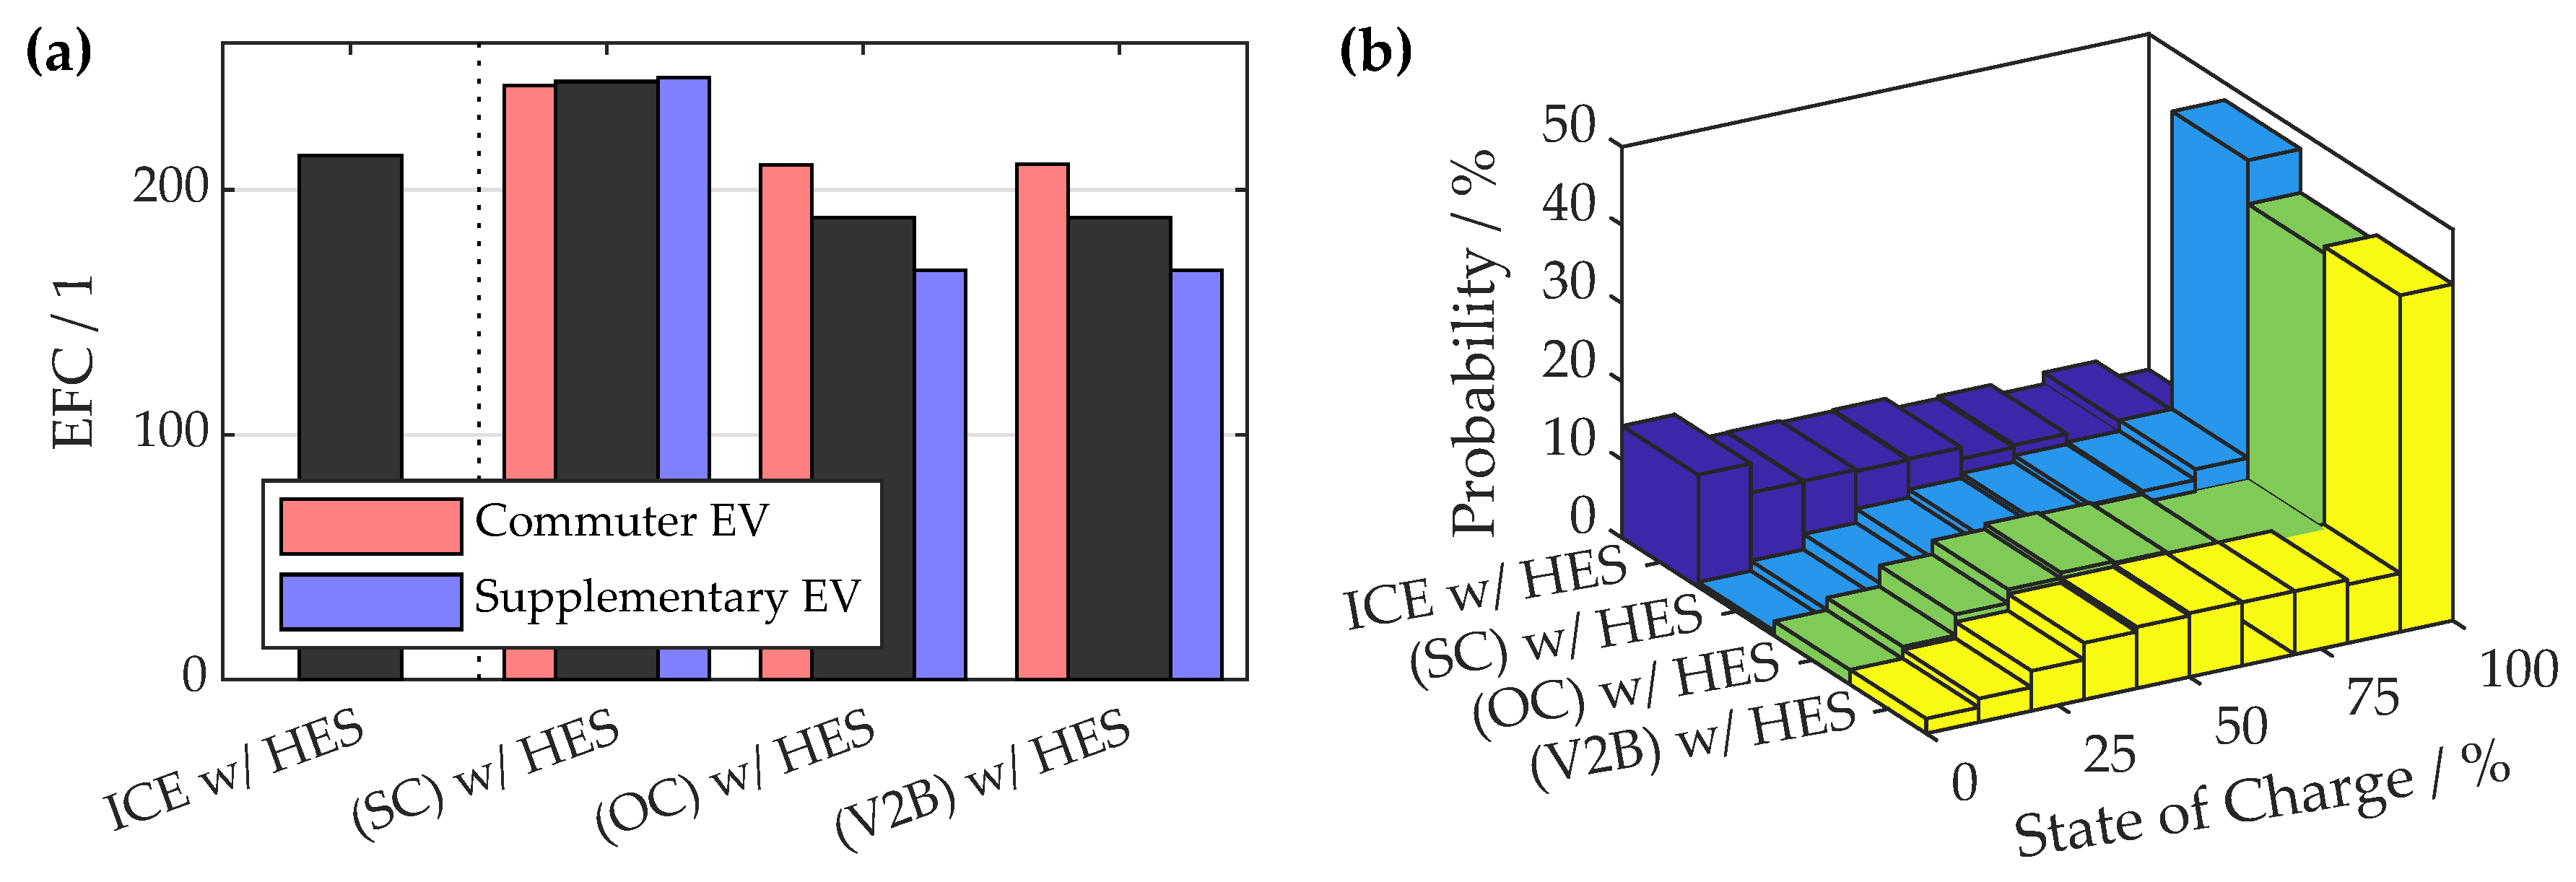
3.3. Storage System Efficiency
4. Discussion and Conclusions
4.1. EV Versus ICE Vehicle
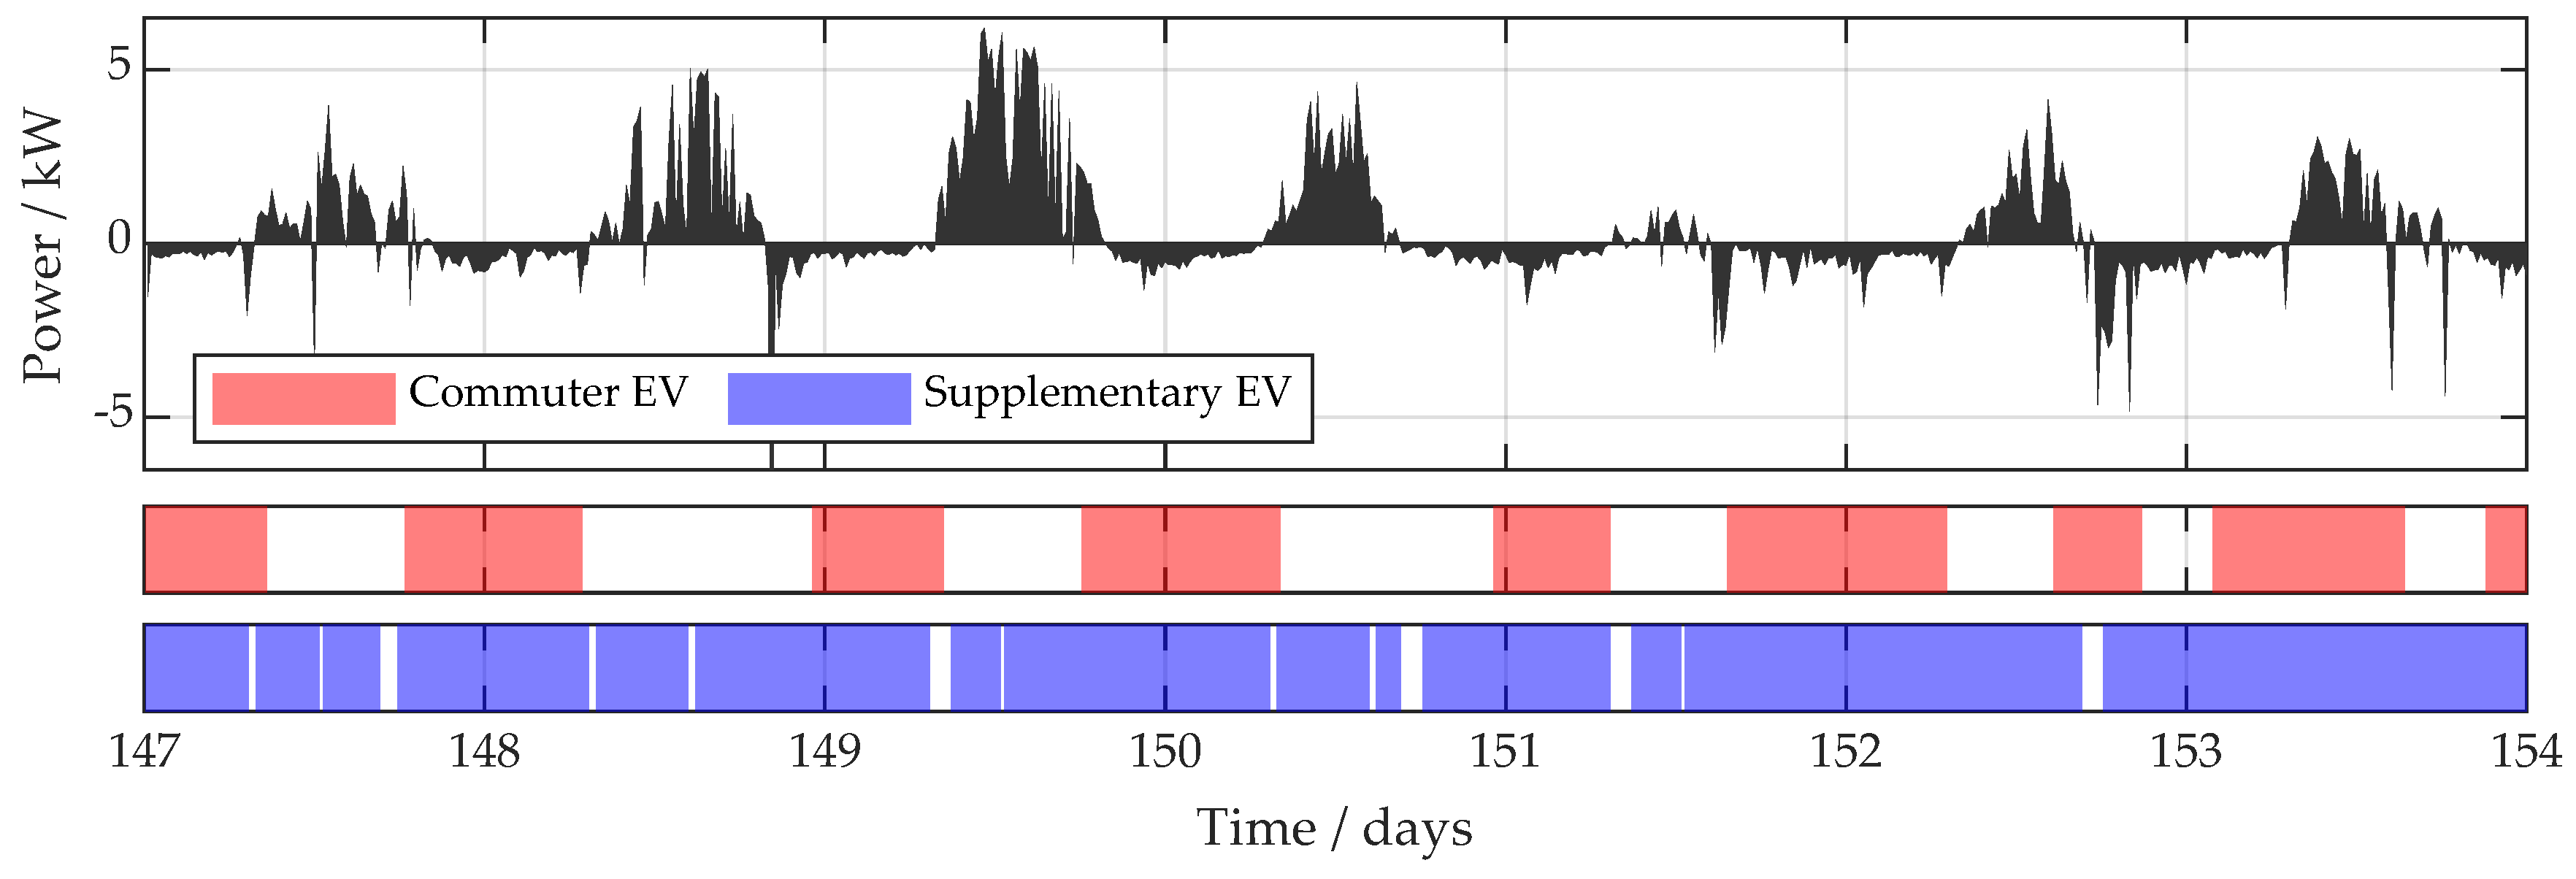
4.2. Impact of Vehicle Utilization Pattern
4.3. Impact of Considering an Additional HES
4.4. Impact of Charging Scheme
4.5. Limitations and Future Research
Author Contributions
Funding
Acknowledgments
Conflicts of Interest
Abbreviations
| AC | Alternating current |
| BESS | Battery energy storage system |
| CAGR | Compound annual growth rate |
| CAPEX | Capital expenditures |
| DC | Direct current |
| DOC | Depth of cycle |
| EFC | Equivalent full cycles |
| EOL | End of life |
| EV | Electric vehicle |
| HES | Home energy storage system |
| ICE | Internal combustion engine |
| LFP | Lithium iron phosphate |
| LIB | Lithium ion battery |
| LP | Linear programming |
| NMC | Nickel manganese cobalt |
| OC | Optimized charging |
| OPEX | Operating expenses |
| PV | Photovoltaic |
| RPF | Residential power flow |
| SC | Simple charging |
| SOC | State of charge |
| V2B | Vehicle-to-building |
Appendix A

References
- Bunsen, T.; Cazzola, P.; Gorner, M.; Paoli, L.; Scheffer, S.; Schuitmaker, R.; Tattini, J.; Teter, J. Global EV Outlook 2018: Towards Cross-Modal Electrification; International Energy Agency: Paris, France, 2018. [Google Scholar]
- Nykvist, B.; Nilsson, M. Rapidly falling costs of battery packs for electric vehicles. Nat. Clim. Chang. 2015, 5, 329–332. [Google Scholar] [CrossRef]
- Kästel, P.; Gilroy-Scott, B. Economics of pooling small local electricity prosumers—LCOE & self-consumption. Renew. Sustain. Energy Rev. 2015, 51, 718–729. [Google Scholar] [CrossRef]
- Truong, C.N.; Naumann, M.; Karl, R.; Müller, M.; Jossen, A.; Hesse, H. Economics of Residential Photovoltaic Battery Systems in Germany: The Case of Tesla’s Powerwall. Batteries 2016, 2, 14. [Google Scholar] [CrossRef]
- Naumann, M.; Karl, R.; Truong, C.N.; Jossen, A.; Hesse, H. Lithium-ion Battery Cost Analysis in PV-household Application. Energy Procedia 2015, 73, 37–47. [Google Scholar] [CrossRef]
- Tan, K.M.; Ramachandaramurthy, V.K.; Yong, J.Y. Integration of electric vehicles in smart grid: A review on vehicle to grid technologies and optimization techniques. Renew. Sustain. Energy Rev. 2016, 53, 720–732. [Google Scholar] [CrossRef]
- Barone, G.; Buonomano, A.; Calise, F.; Forzano, C.; Palombo, A. Building to vehicle to building concept toward a novel zero energy paradigm: Modelling and case studies. Renew. Sustain. Energy Rev. 2019, 101, 625–648. [Google Scholar] [CrossRef]
- Mwasilu, F.; Justo, J.J.; Kim, E.K.; Do, T.D.; Jung, J.W. Electric vehicles and smart grid interaction: A review on vehicle to grid and renewable energy sources integration. Renew. Sustain. Energy Rev. 2014, 34, 501–516. [Google Scholar] [CrossRef]
- Infas Institut für angewandte Sozialwissenschaft GmbH. Mobility in Germany 2017 (German: Mobilität in Deutschland 2017 (MiD 2017)): Federal Ministry of Transport and Digital Infrastructure; Infas Institut für angewandte Sozialwissenschaft GmbH: Bonn, Germany, 2018. [Google Scholar]
- Naumann, M.; Truong, C.N.; Schimpe, M.; Kucevic, D.; Jossen, A.; Hesse, H. (Eds.) SimSES: Software for techno-economic Simulation of Stationary Energy Storage Systems. In Proceedings of the International ETG Congress 2017, Bonn, Germany, 28–29 November 2017. [Google Scholar]
- Gurobi Optimization. Gurobi Optimizer Version 8.1. 2018. Available online: http://www.gurobi.com/ (accessed on 14 December 2018).
- Figgener, J.; Haberschusz, D.; Kairies, K.P.; Wessels, O.; Tepe, B.; Sauer, D.U. Wissenschaftliches Mess- und Evaluierungsprogramm Solarstromspeicher 2.0: Jahresbericht 2018; ISEA Institut für Stromrichtertechnik und Elektrische Antriebe RWTH Aachen: Aachen, Germany, 2018. [Google Scholar]
- Dietrich, A.; Weber, C. What drives profitability of grid-connected residential PV storage systems? A closer look with focus on Germany. Energy Econ. 2018, 74, 399–416. [Google Scholar] [CrossRef]
- Tjaden, T.; Bergner, J.; Weniger, J.; Quaschning, V. Representative Electrical Load Profiles of Residential Buildings in Germany with a Temporal Resolution of One Second; HTW Berlin—University of Applied Sciences: Berlin, Germany, 2015. [Google Scholar]
- KFW. KfW-Programm Erneuerbare Energien: Speicher. 2018. Available online: https://www.kfw.de (accessed on 15 October 2018).
- Prognos, EWI, GWS. Entwicklung der Energiemärkte—Energiereferenzprognose. 2014. Available online: https://www.bmwi.de/Redaktion/DE/Publikationen/Studien/entwicklung-der-energiemaerkte-energiereferenzprognose-endbericht.pdf?__blob=publicationFile&v=7 (accessed on 15 October 2018).
- Hesse, H.; Martins, R.; Musilek, P.; Naumann, M.; Truong, C.N.; Jossen, A. Economic Optimization of Component Sizing for Residential Battery Storage Systems. Energies 2017, 10, 835. [Google Scholar] [CrossRef]
- Stan, A.I.; Swierczynski, M.; Stroe, D.I.; Teodorescu, R.; Andreasen, S.J. Lithium ion battery chemistries from renewable energy storage to automotive and back-up power applications—An overview. In Proceedings of the 2014 International Conference on Optimization of Electrical and Electronic Equipment (OPTIM), Bran, Romania, 22–24 May 2014; IEEE: Piscataway, NJ, USA, 2014; pp. 713–720. [Google Scholar] [CrossRef]
- Vetter, J.; Novák, P.; Wagner, M.R.; Veit, C.; Möller, K.C.; Besenhard, J.O.; Winter, M.; Wohlfahrt-Mehrens, M.; Vogler, C.; Hammouche, A. Ageing mechanisms in lithium-ion batteries. J. Power Sources 2005, 147, 269–281. [Google Scholar] [CrossRef]
- Naumann, M. Techno-Economic Evaluation of Stationary Battery Energy Storage Systems with Special Consideration of Aging. Ph.D. Thesis, Technical University of Munich, Munich, Germany, 2018. [Google Scholar]
- Hesse, H.; Schimpe, M.; Kucevic, D.; Jossen, A. Lithium-Ion Battery Storage for the Grid—A Review of Stationary Battery Storage System Design Tailored for Applications in Modern Power Grids. Energies 2017, 10, 2107. [Google Scholar] [CrossRef]
- Notton, G.; Lazarov, V.; Stoyanov, L. Optimal sizing of a grid-connected PV system for various PV module technologies and inclinations, inverter efficiency characteristics and locations. Renew. Energy 2010, 35, 541–554. [Google Scholar] [CrossRef]
- Thiel, C.; Schmidt, J.; van Zyl, A.; Schmid, E. Cost and well-to-wheel implications of the vehicle fleet CO2 emission regulation in the European Union. Transp. Res. Part A Policy Pract. 2014, 63, 25–42. [Google Scholar] [CrossRef]
- European Commission. Merger Procedure Article 6(1)(b) of Council Regulation (EEC) No 4064/89—Decision on Case No IV/M.1406. HYUNDAI/KIA; European Commission: Luxembourg, 1999. [Google Scholar]
- Letmathe, P.; Suares, M. A consumer-oriented total cost of ownership model for different vehicle types in Germany. Transp. Res. Part D Transp. Environ. 2017, 57, 314–335. [Google Scholar] [CrossRef]
- Jossen, A.; Weydanz, W. Moderne Akkumulatoren Richtig Einsetzen; Reichardt Verlag: Wiesbaden, Germany, 2006. [Google Scholar]
- Rosenkranz, C.; Köhler, U.; Liska, J.L. Modern Battery Systems for Plug-In Hybrid Electric Vehicles. In Proceedings of the 23rd International Battery, Hybrid and Fuel Cell Electric Vehicle Symposium and Exhibition, Anaheim, CA, USA, 2–5 December 2007. [Google Scholar]
- BMW Group. Der BMW i3. 2015. Available online: https://www.press.bmwgroup.com/austria/article/attachment/T0150664DE/299524 (accessed on 15 Dcember 2018).
- Kraftfahrt-Bundesamt. Erneut mehr Gesamtkilometer bei Geringerer Jahresfahrleistung je Fahrzeug. 2018. Available online: https://www.kba.de/DE/Statistik/Kraftverkehr/VerkehrKilometer/verkehr_in_kilometern_node.html (accessed on 15 October 2018).
- Tietge, U.; Mock, P.; Franco, V.; Zacharof, N. From laboratory to road: Modeling the divergence between official and real-world fuel consumption and CO2 emission values in the German passenger car market for the years 2001–2014. Energy Policy 2017, 103, 212–222. [Google Scholar] [CrossRef]
- Emission Test Cycle. US06 Supplemental Federal Test Procedure (SFTP). Available online: https://www.dieselnet.com/standards/cycles/ftp_us06.php (accessed on 7 December 2018).
- Keil, P.; Schuster, S.F.; Wilhelm, J.; Travi, J.; Hauser, A.; Karl, R.; Jossen, A. Calendar Aging of Lithium-Ion Batteries: I. Impact of the Graphite Anode on Capacity Fade. J. Electrochem. Soc. 2016, 163, A1872–A1880. [Google Scholar] [CrossRef]
- Englberger, S.; Hesse, H.; Truong, C.N.; Jossen, A. (Eds.) Autonomous Versus Coordinated Control of Residential Energy Storage Systems Monitoring Profit, Battery Aging, and System Efficiency: NEIS 2018. In Proceedings of the Conference on Sustainable Energy Supply and Energy Storage Systems, Hamburg, Germany, 20–21 September 2018. [Google Scholar]
- Lunz, B.; Yan, Z.; Gerschler, J.B.; Sauer, D.U. Influence of plug-in hybrid electric vehicle charging strategies on charging and battery degradation costs. Energy Policy 2012, 46, 511–519. [Google Scholar] [CrossRef]
- Pistoia, G.; Liaw, B.Y. Behaviour of Lithium-Ion Batteries in Electric Vehicles: Battery Health, Performance, Safety, and Cost/Gianfranco Pistoia, Boryann Liaw; Green Energy and Technology; Springer: Cham, Switzerland, 2018. [Google Scholar]
- Fischhaber, S.; Regett, A.; Schuster, S.F.; Hesse, H. Studie: Second-Life-Konzepte für Lithium-Ionen-Batterien aus Elektrofahrzeugen: Analyse von Nachnutzungsanwendungen, ökonomischen und ökologischen Potenzialen; Begleit- und Wirkungsforschung Schaufenster Elektromobilität (BuW): Frankfurt, Germany, 2016. [Google Scholar]
- Schimpe, M.; Naumann, M.; Truong, C.N.; Hesse, H.; Santhanagopalan, S.; Saxon, A.; Jossen, A. Energy efficiency evaluation of a stationary lithium-ion battery container storage system via electro-thermal modeling and detailed component analysis. Appl. Energy 2018, 210, 211–229. [Google Scholar] [CrossRef]
- Massiani, J. Cost-Benefit Analysis of policies for the development of electric vehicles in Germany: Methods and results. Transp. Policy 2015, 38, 19–26. [Google Scholar] [CrossRef]
- Neubauer, J.; Simpson, M. Deployment of Behind-the-Meter Energy Storage for Demand Charge Reduction; Tech. Rep. NREL/TP-5400-63162; National Renewable Energy Laboratory: Golden, CO, USA, 2015.
- Heymans, C.; Walker, S.B.; Young, S.B.; Fowler, M. Economic analysis of second use electric vehicle batteries for residential energy storage and load-levelling. Energy Policy 2014, 71, 22–30. [Google Scholar] [CrossRef]
- Tsiropoulos, I.; Tarvydas, D.; Lebedeva, N. Li-ion Batteries for Mobility and Stationary Storage Applications Scenarios for Costs and Market Growth; Publications Office of the European Union: Luxembourg, 2018. [Google Scholar]
- Metz, D.; Saraiva, J.T. Simultaneous co-integration of multiple electrical storage applications in a consumer setting. Energy 2018, 143, 202–211. [Google Scholar] [CrossRef]
- Singh, M.; Kumar, P.; Kar, I. Implementation of Vehicle to Grid Infrastructure Using Fuzzy Logic Controller. IEEE Trans. Smart Grid 2012, 3, 565–577. [Google Scholar] [CrossRef]
- Koller, M.; Borsche, T.; Ulbig, A.; Andersson, G. Defining a degradation cost function for optimal control of a battery energy storage system. In Proceedings of the 2013 IEEE Grenoble Conference, Grenoble, France, 16–20 June 2013; IEEE: Piscataway, NJ, USA, 2013; pp. 1–6. [Google Scholar] [CrossRef]


| Parameter | Value |
|---|---|
| Annual electricity demand | 6000 kWh [12] |
| PV peak power | 8 kWp [12] |
| Feed-in limitation | 50% [15] |
| Feed-in remuneration | EUR/kWh [13] |
| Initial electricity price | EUR/kWh [16] |
| Electricity price CAGR | 3.35% [16] |
| Battery chemistry | lithium iron phosphate (LFP) |
| Nominal energy content | 9 kWh [12,17] |
| SOC limitation | 5%, 95% [12,17] |
| Parameter | Value |
|---|---|
| Vehicle class | B-segment small car [23,24,25] |
| Battery chemistry | nickel manganese cobalt (NMC) |
| Nominal energy content | kWh [28] |
| Useable energy content | kWh [28] |
| Battery round-trip efficiency | 95% [17] |
| Annually driven distance | 13,922 km [29] |
| Electricity consumption | kWh/100 km [28] |
| Fuel consumption | L/100 km [30] |
| Initial fuel price | EUR/L [16] |
| Fuel price CAGR | 2.25% [16] |
| Vehicle Usage Pattern | ICE | ICE w/HES | SC | OC | V2B | SC w/HES | OC w/HES | V2B w/HES |
|---|---|---|---|---|---|---|---|---|
| Commuter | yes (ICE) | yes (ICE) | yes | yes | yes | yes | yes | yes |
| Supplementary | yes | yes | yes | yes | yes | yes |
| ICE | ICE w/HES | SC | OC | V2B | SC w/HES | OC w/HES | V2B w/HES | |
|---|---|---|---|---|---|---|---|---|
| n/a | n/a | 85.5 | 85.5 | 119.3 | 85.5 | 85.5 | 89.5 | |
| n/a | n/a | 1.00 | 0.98 | 0.98 | 0.58 | 0.76 | 0.76 |
© 2019 by the authors. Licensee MDPI, Basel, Switzerland. This article is an open access article distributed under the terms and conditions of the Creative Commons Attribution (CC BY) license (http://creativecommons.org/licenses/by/4.0/).
Share and Cite
Englberger, S.; Hesse, H.; Kucevic, D.; Jossen, A. A Techno-Economic Analysis of Vehicle-to-Building: Battery Degradation and Efficiency Analysis in the Context of Coordinated Electric Vehicle Charging. Energies 2019, 12, 955. https://doi.org/10.3390/en12050955
Englberger S, Hesse H, Kucevic D, Jossen A. A Techno-Economic Analysis of Vehicle-to-Building: Battery Degradation and Efficiency Analysis in the Context of Coordinated Electric Vehicle Charging. Energies. 2019; 12(5):955. https://doi.org/10.3390/en12050955
Chicago/Turabian StyleEnglberger, Stefan, Holger Hesse, Daniel Kucevic, and Andreas Jossen. 2019. "A Techno-Economic Analysis of Vehicle-to-Building: Battery Degradation and Efficiency Analysis in the Context of Coordinated Electric Vehicle Charging" Energies 12, no. 5: 955. https://doi.org/10.3390/en12050955