Article

Monitoring the Bioactive Compounds Status in Olea europaea According to Collecting Period and Drying Conditions

1
Laboratoire de Biotechnologie de l’Olivier, Centre de Biotechnologie de Borj-Cedria, B/P 901 Hammam-Lif 2050, Tunisia
2
Department of Food Science and Nutrition, University of Granada, Campus Universitario s/n, 18071 Granada, Spain
3
Center of Research and Development of Functional Food, Health Science Technological Park, Avda. del Conocimiento s/n, 18100 Granada, Spain
4
Department of Analytical Chemistry, Faculty of Sciences, University of Granada, Granada 18071, Spain
5
Department of Integrative Biotechnology, Sungkyunkwan University, 2066 Seobu-ro, Suwon 16419, Korea
*
Author to whom correspondence should be addressed.
Energies 2019, 12(5), 947; https://doi.org/10.3390/en12050947
Submission received: 4 January 2019 / Revised: 4 March 2019 / Accepted: 6 March 2019 / Published: 12 March 2019
(This article belongs to the Special Issue Biorefinery Based on Olive Biomass)

Abstract

:
Polyphenols and triterpenoids in olive have relevant importance both in the physiology of the plant and the nutritional and biological value of its products. Olive leaf extracts are of special interest for their numerous health-promoting properties. The present research is investigating the occurrence of phytochemicals in supercritical fluid extracts from leaves with regard to collection time and drying temperature. The phytochemical profiles of the olive leaf extracts were determined by reversed-phase high-performance liquid chromatography (HPLC) coupled to electrospray ionization time-of-flight mass spectrometry (ESI-TOF-MS) detection. The main extracted phytochemicals were phenols and terpenoids. A significant variation in the amounts of the different components was observed as a function of the different drying temperature and collecting time (p < 0.05). Among samples, the maximal contents of polyphenols and secoiridoid derivatives were found in the extracts from olive leaves collected in November and dried at 120 °C, whereas triterpenoids showed the highest content in fresh leaves collected in August.

1. Introduction

The incidence of many chronic disorders, such as cardiovascular diseases and certain types of cancers, could be attenuated by an improved diet, particularly through increased consumption of diets rich in fruits and vegetables. Such health-promoting properties of edible plants are related mainly to the presence of secondary metabolites, known as phytochemicals [1]. In contrast to traditional pharmaceutical drugs based on single defined substances, herbal preparations have been characterized by a multi-ingredient nature. However, recently this strategy has been introduced in modern medicine with the use of multi-ingredient pharmaceutical cocktails, now prevalent in the treatment of some diseases [2].
The exploitation of olive leaves as a natural resource rich in bioactive compounds would involve the valorization of this byproduct [3]. In addition, olive leaves have a high potential for exploitation in the food industry. Properties of olive leaves are generally attributed to the presence of a range of triterpenes and phenolic compounds such as secoiridoids, lignans, flavonoids, etc. [4].
Fresh olive leaves generally need drying and milling before any purpose. As a preservation method, drying is carried out to remove the water from the leaves to protect the leaves against spoilage and degradation of oleuropein by enzyme action. It also improves extraction efficiency or extractability [5]. Thus, it is considered as the main process in olive leaf treatment. Olive leaves have to be dried for use as an ingredient in dry mixes, extracting phenolic compounds having antioxidant properties, and use in olive leaf tea [6]. In fact, the immediate drying of olive leaves is the most important operation in post-harvest processing in order to avoid quality losses and prevent possible degradation during storage [7], since drying might affect the product quality and is an energy-intensive process [8].
Thus, this work has focused on the determination of phenolic compounds and triterpenoids from fresh and dried olive leaves from El Hor cultivar, cultivated in the center of Tunisia at four sampling dates (January, April, August, and November) using an HPLC-ESI-TOF MS platform. The choice of this olive cultivar was based on our previous findings demonstrating that El Hor olive leaves extracted by supercritical fluid extraction showed the best anticancer activity among other cultivars and extraction techniques [9,10]. Thus, for in-depth study, the aim of this work was to study how the drying process and collecting period of olive leaves affect the phenolic composition of extracts in order to obtain extracts rich in bioactive compounds.

2. Results and Discussion

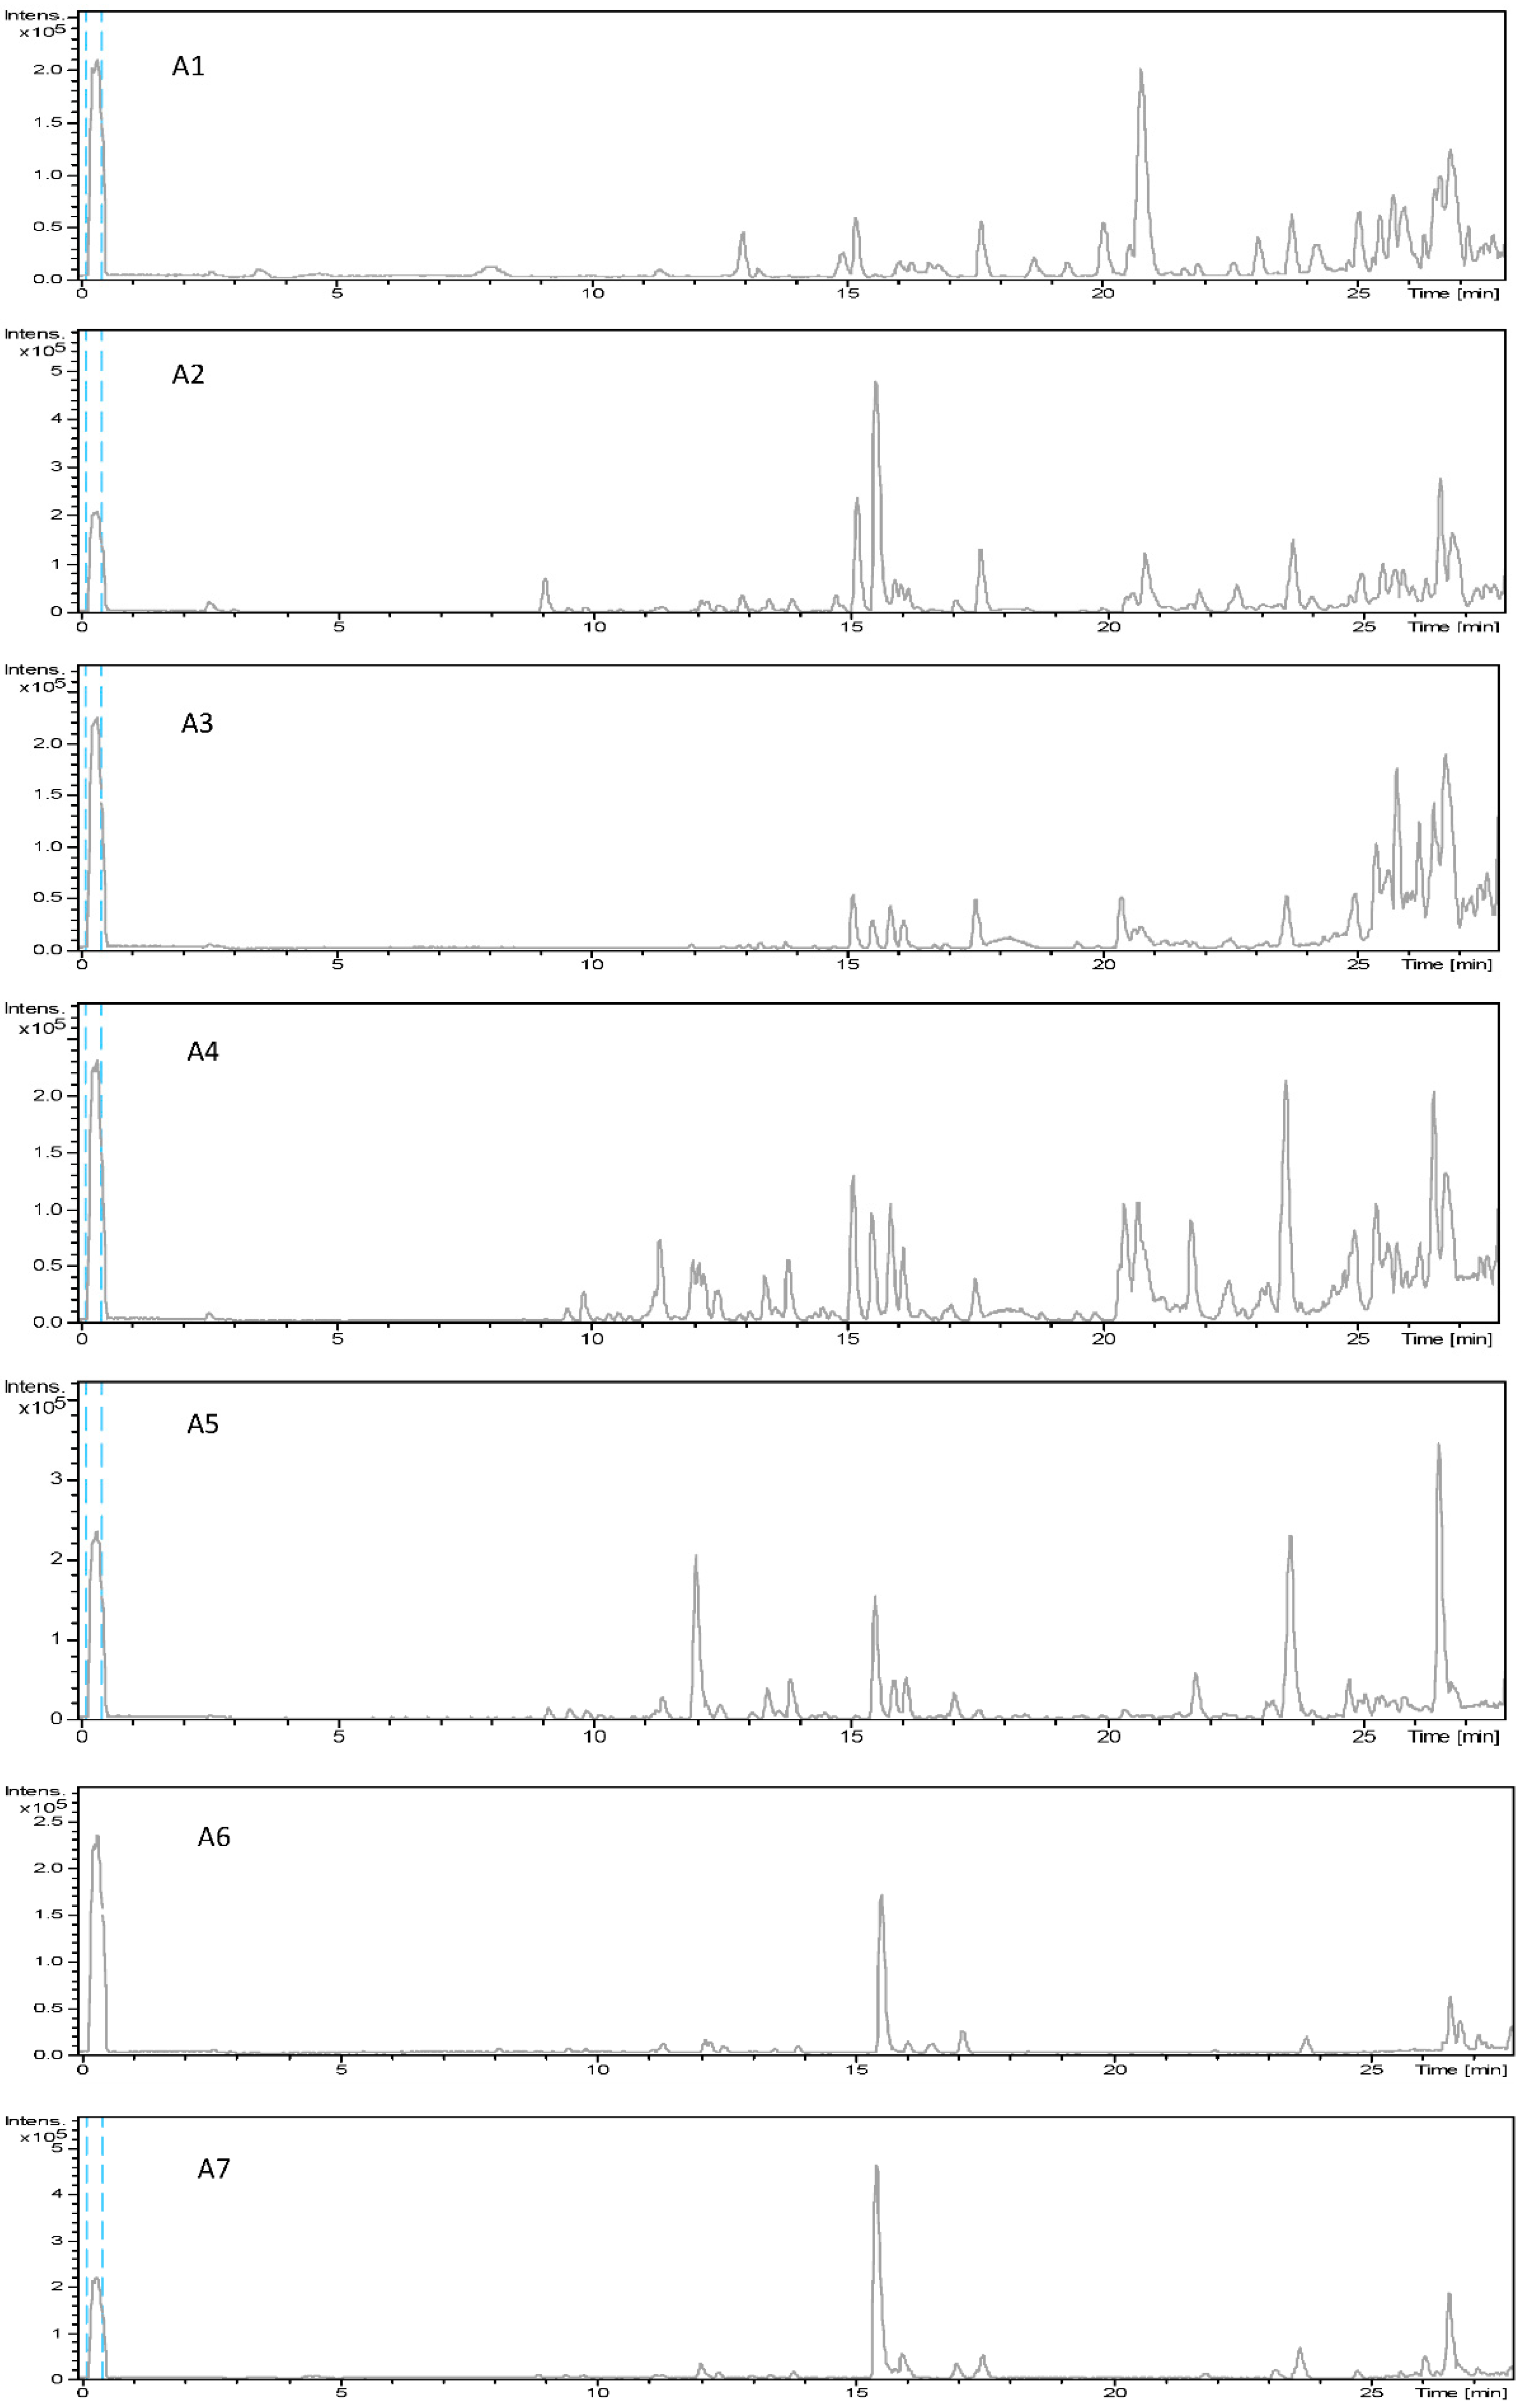
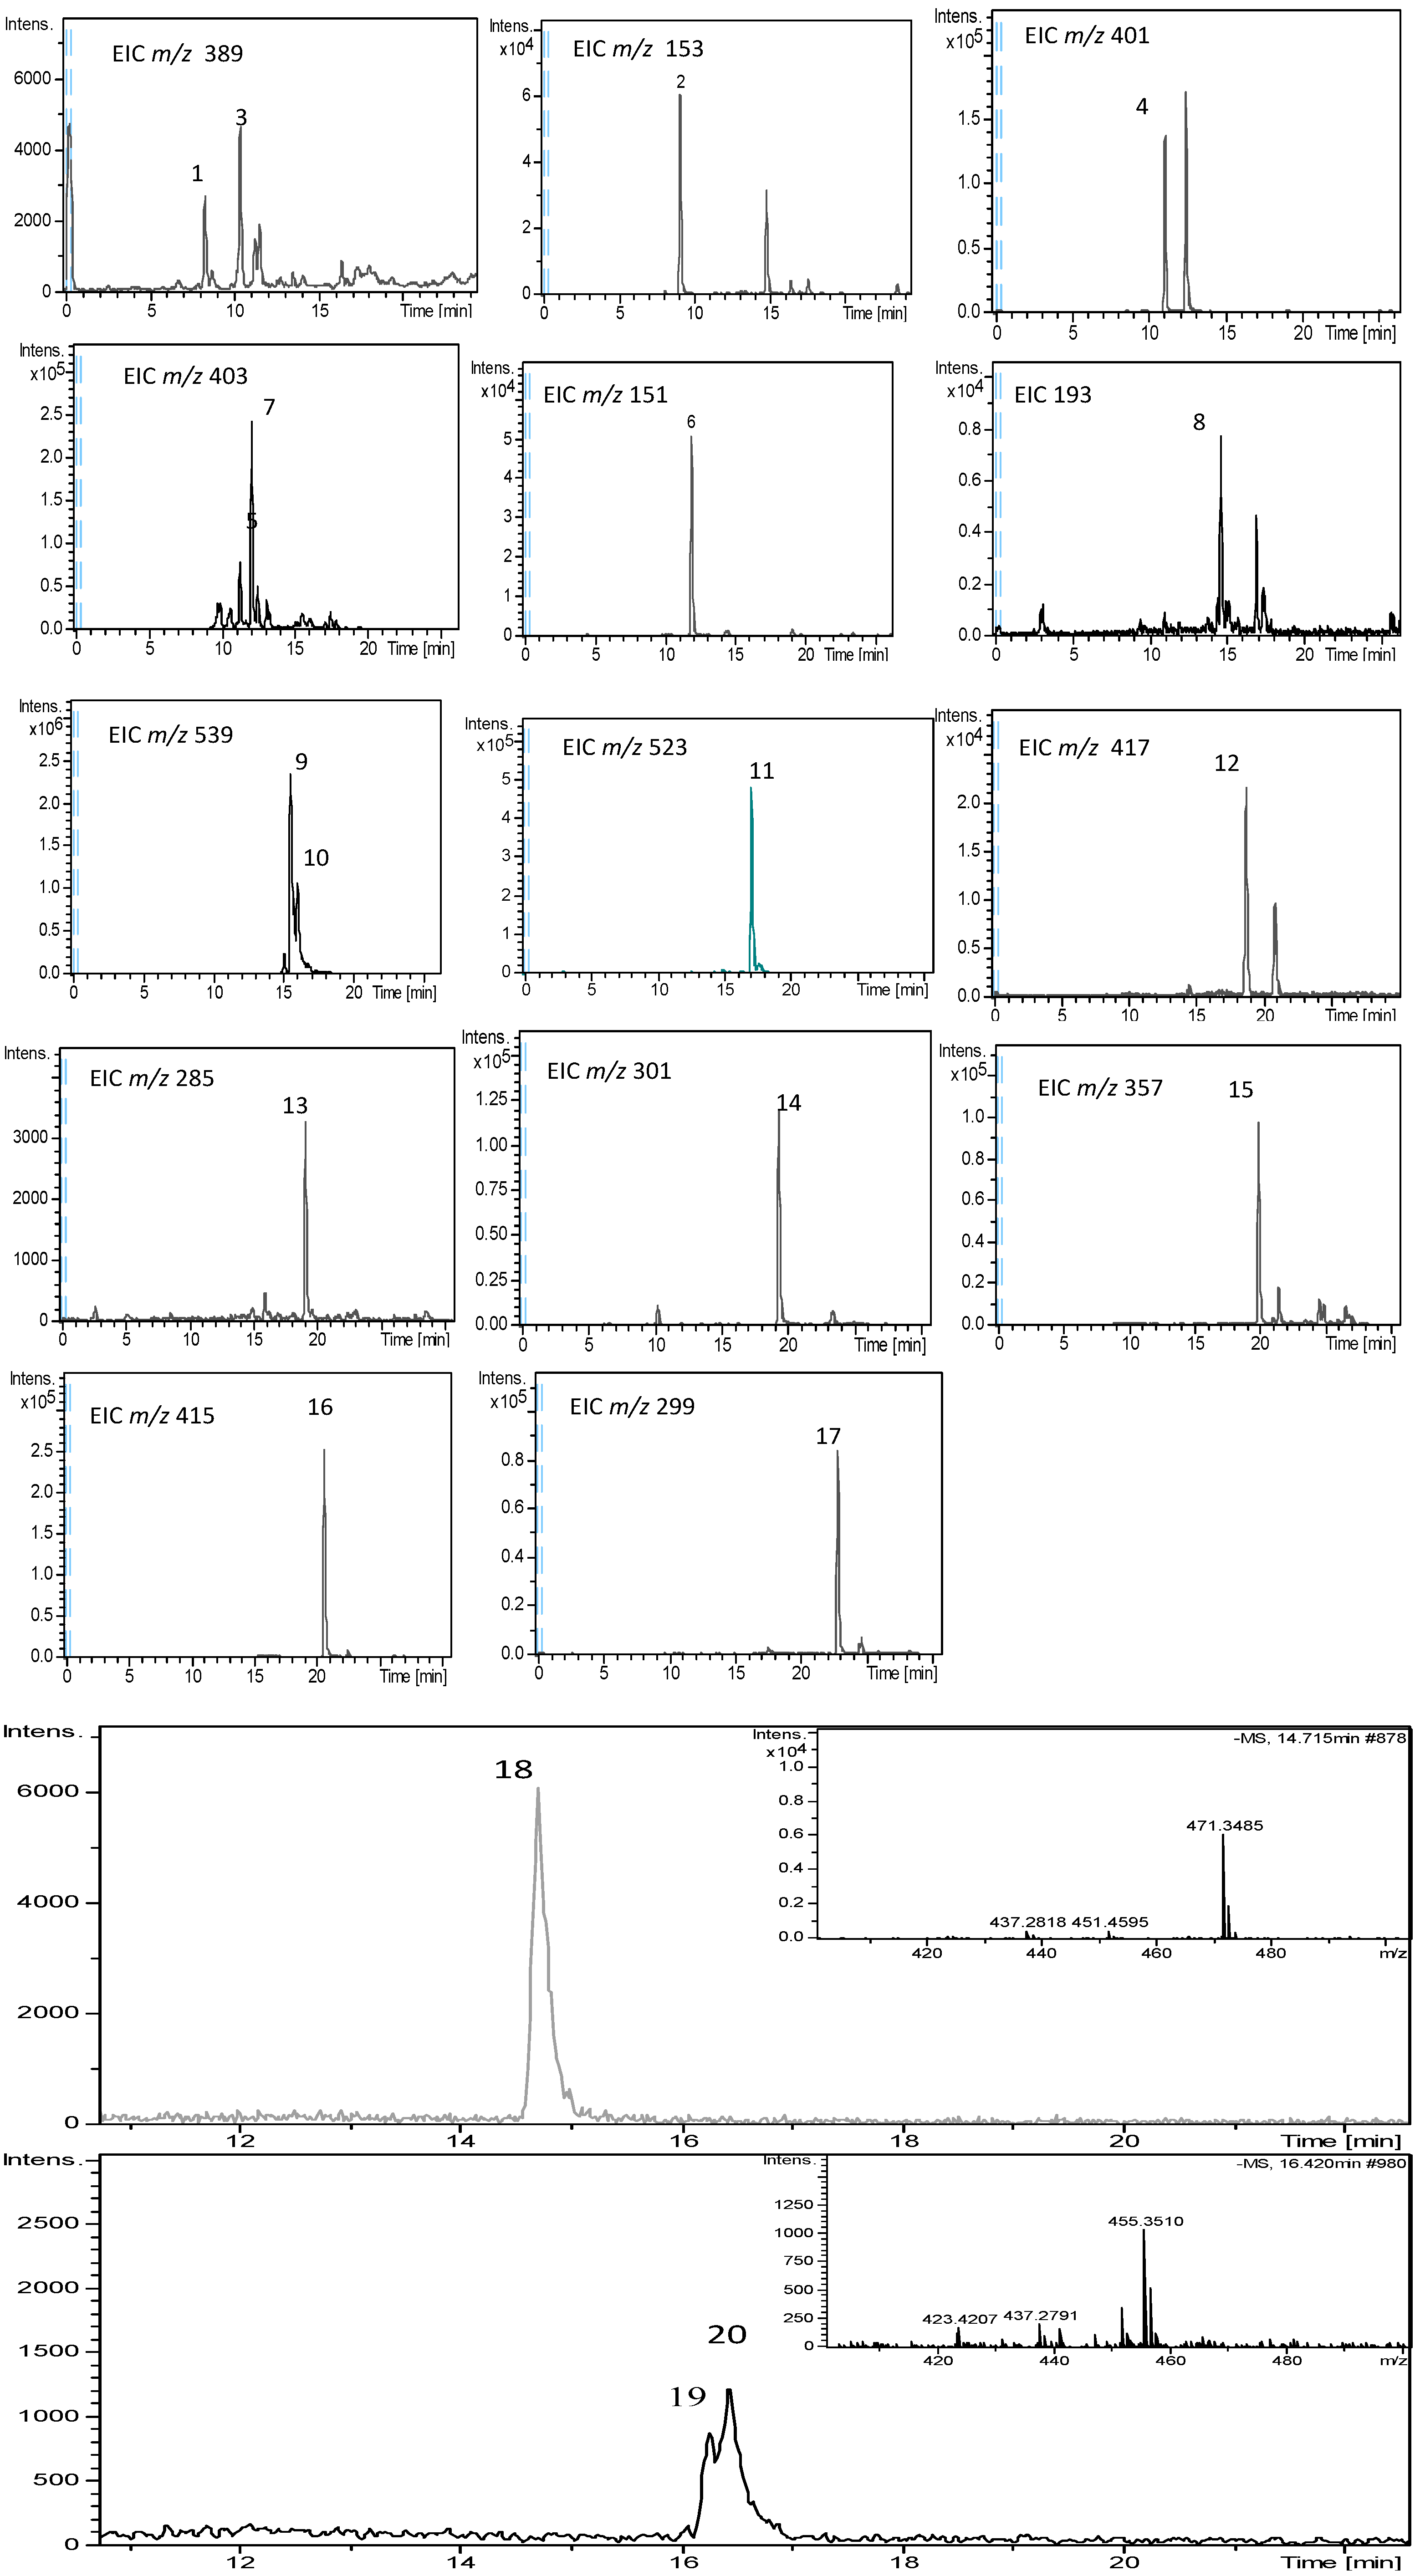
2.1. Identification of Phytochemicals in Olive Leaf Extracts

Natural antioxidants are mainly secondary metabolites such as phenolic acids, flavonoids, and terpenoids, which are produced by plants for sustaining growth under adverse environment [11]. Polyphenols are among the most widespread class of secondary metabolites in nature, which possess an aromatic ring with one or more hydroxyl substituents.
In the present study, olive leaf extracts were analyzed by HPLC with TOF/MS detection. The characterization process was conducted using the elution order, the interpretation of their mass spectrum provided by the TOF–MS, commercial standards when available, and the data previously reported in the literature. Table 1 includes the compounds, which were identified in olive leaves’ SFE extracts, and the information generated by the TOF analyzer—retention time, experimental and calculated m/z, molecular formula, and error and milliSigma value. A total of 20 compounds were characterized in SFE extracts by the HPLC-ESI-TOF/MS analytical methods described above. Among them, 17 compounds were from different polar compound classes and polyphenolic families. We classify them into groups such as secoiridoids and related derivatives, simple phenolic compounds, flavonoids (flavonols, flavones, and O-methylated flavones), and lignans. In addition, three were characterized as triterpenoids.
Figure 1 shows the resulting base peak chromatograms (BPCs) of fresh and dried olive leaf samples collected in January from A1 to A7 according to drying temperature. The main phytochemicals identified are included in Table 1, and their corresponding extracted ion chromatograms (EICs) are shown in Figure 2.

2.1.1. Simple Phenolic Compounds
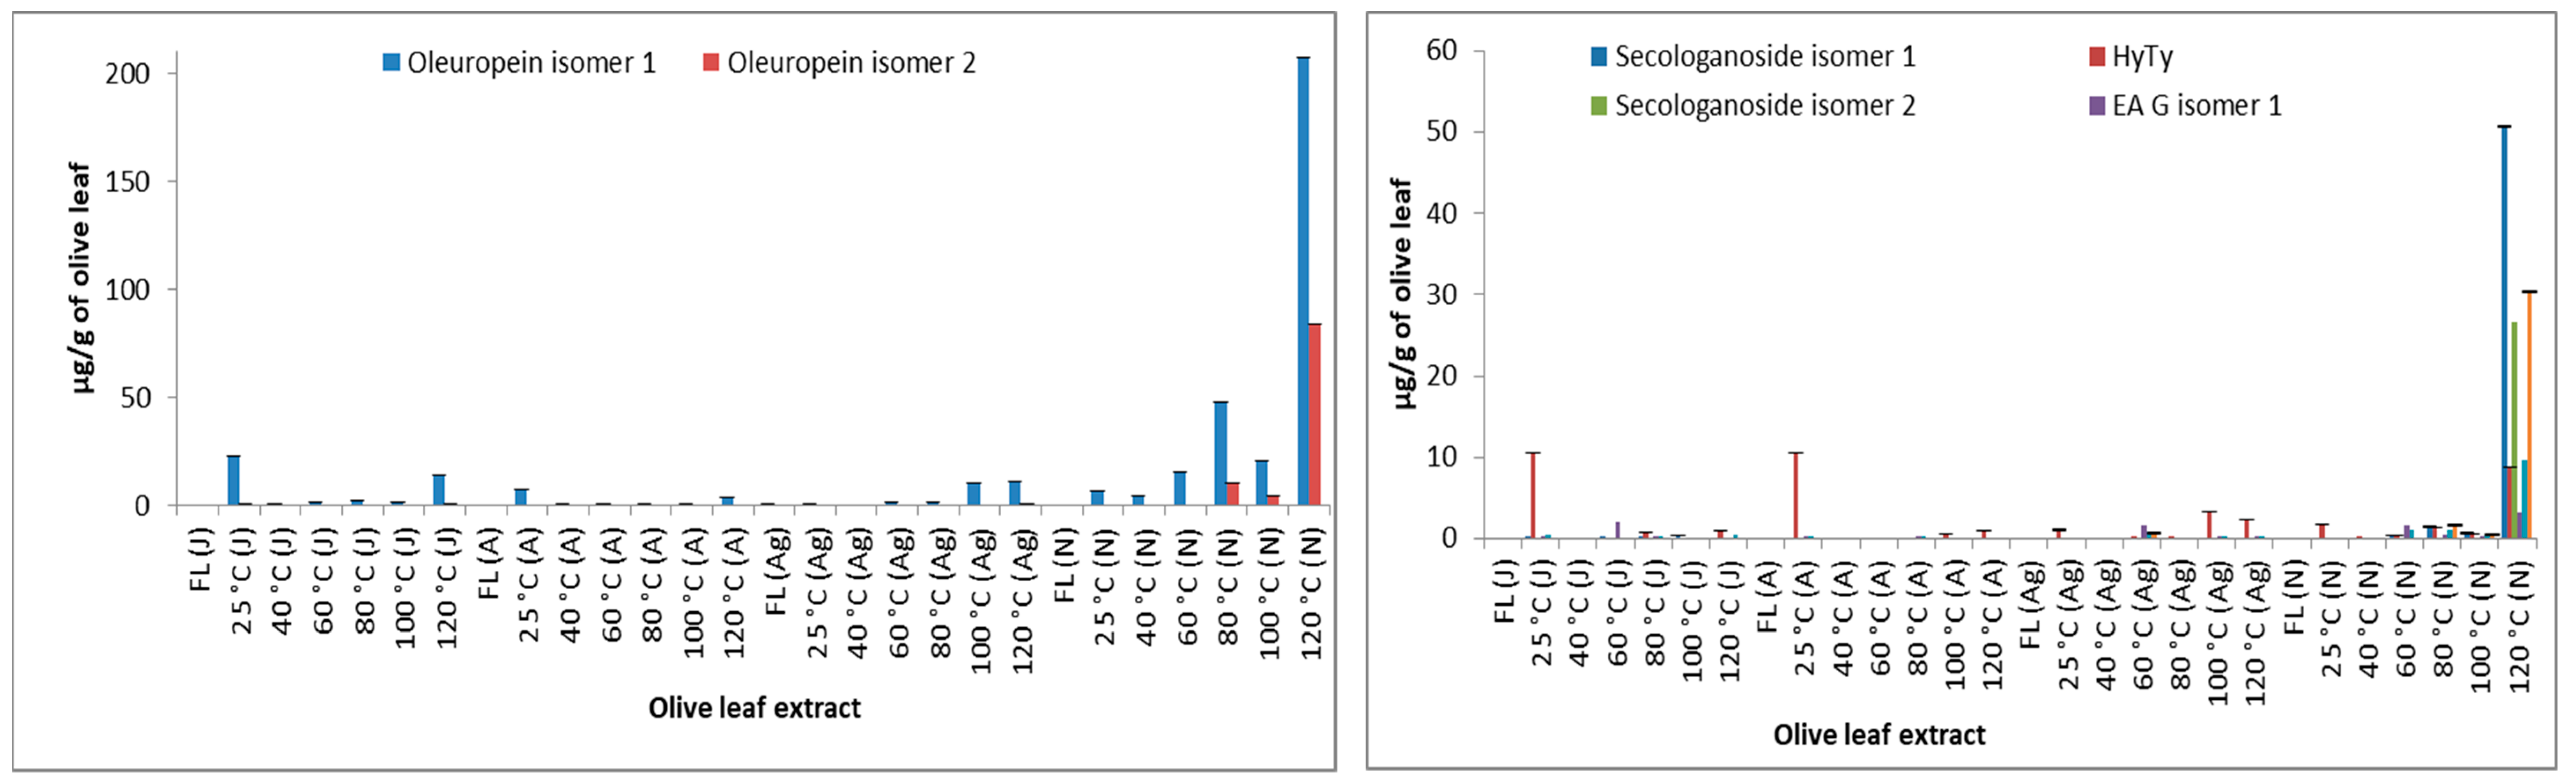
One phenyl alcohol (peak 2 eluted at 8.9 min), aldehyde (peak 6 eluted at 11.7 min), and hydroxycinnamic acid (peak 8 eluted at 14.63 min) were identified in our extracts as hydroxytyrosol, vanillin, and ferulic acid, respectively. The identification of these compounds was confirmed with their corresponding analytical standards.

2.1.2. Secoiridoids

Secoiridoids are produced from the secondary metabolism of terpenes. These compounds are characterized by the presence of elenolic acid or its derivates in its glycosidic or aglyconic form in their molecular structure [12]. As reported in Table 1, secoiridoids that could be identified in the different extracts included free forms such as secologanoside (peak 1, m/z 389.1089) and loganoside (peak 1, m/z 389.1447), as well as phenol-conjugated secoiridoids in glycosidic form such as oleuropein (peaks 9 and 10, m/z 539.177) and ligstroside (peak 11, m/z 523.1821). Such compounds have been reported in olive leaves and other organs of the olive tree in previous literature [13,14,15,16].

2.1.3. Flavonoids

Flavones, flavonols, and O-methylated flavones were the main flavonoids identified in the olive leaf extracts according to sampling time and drying. These were luteolin with an ion at m/z 285.0405 (peak 13), quercetin with an ion at m/z 301.0354 (peak 14), and diosmetin with an ion at m/z 299.0561 (peak 17). The identification of these flavonoids was based on their analytical standards together with their MS spectra. They have also been reported in previous literature [13].

2.1.4. Lignans

Three lignans compounds could be identified in the different olive leaf extracts under study. Peaks 12, 15, and 16 showed ions at m/z 417.1555, 357.1344, and 415.1398, respectively, that were determined as syringaresinol, pinoresinol, and acetoxypinoresinol, respectively. These lignans were also reported in our previous work on fresh leaves [13].

2.1.5. Other Polar Compounds

Peak 4 with an ion at m/z 401.1453 eluted at 11.10 min and was identified as benzyl alcohol pentose. This polar compound was reported in olive leaves in previous literature [17] as well as in other plant extracts [18,19].

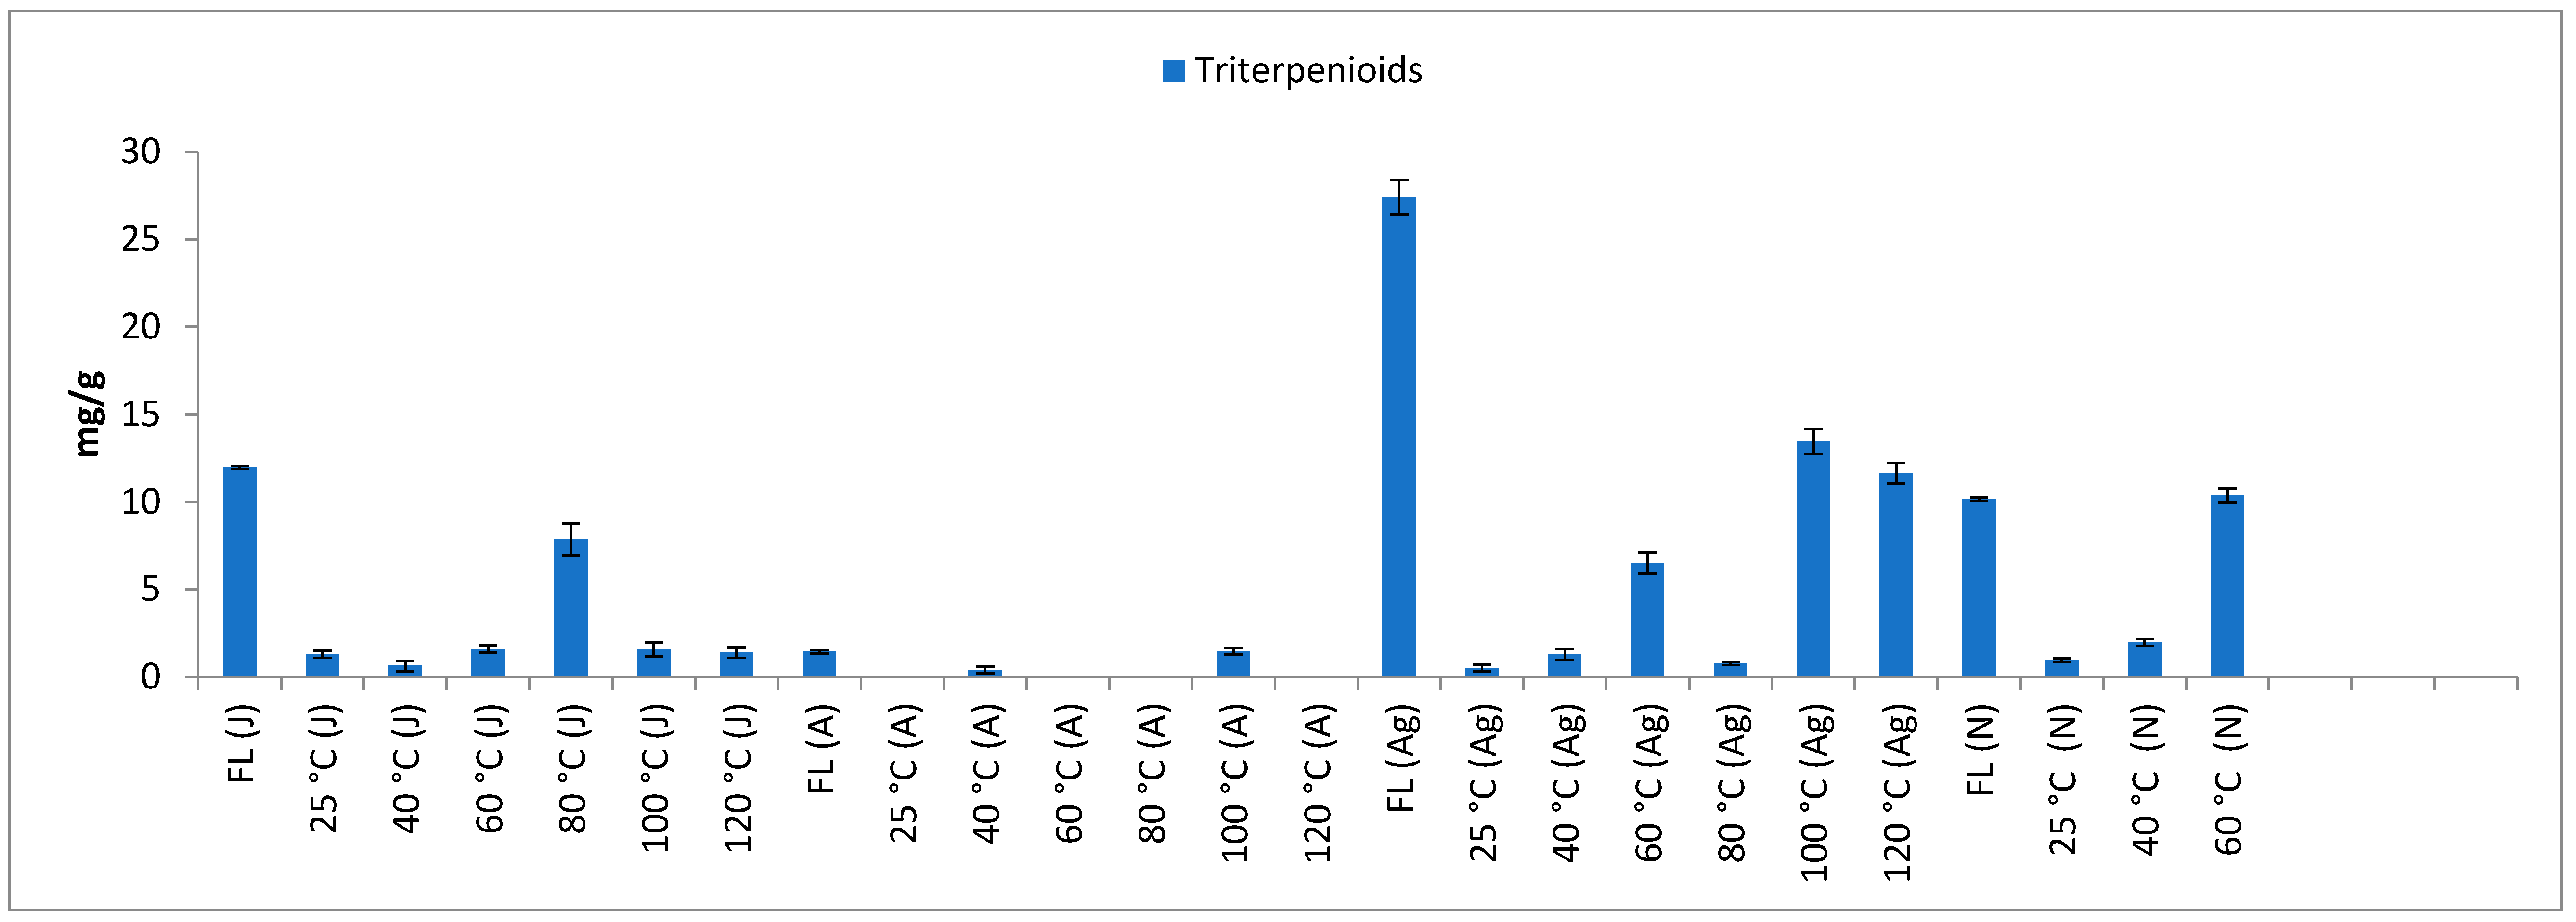
2.1.6. Triterpenoids

Triterpenic compounds are common constituents of plants, occurring in the form of free acids or aglycones of triterpenoid saponins [20] offering a wide range of health-promoting activities, both as pure substances or as blends [21]. Despite their beneficial properties, there is relatively little information available on their distribution in olive leaves. To our knowledge, this is the first report on their concentration in olive leaves in response to drying and season. In this work, three triterpenic acids could be identified in the different olive leaf extracts. As demonstrated in Figure 2, peak 18 showed an ion at m/z 471.3480 eluting at 14.71 min which was identified as maslinic acid. Peaks that eluted at 16.30 and 16.45 min gave ions at m/z 455.3531 and were identified as oleanolic acid and ursolic acid, respectively (Figure 2).

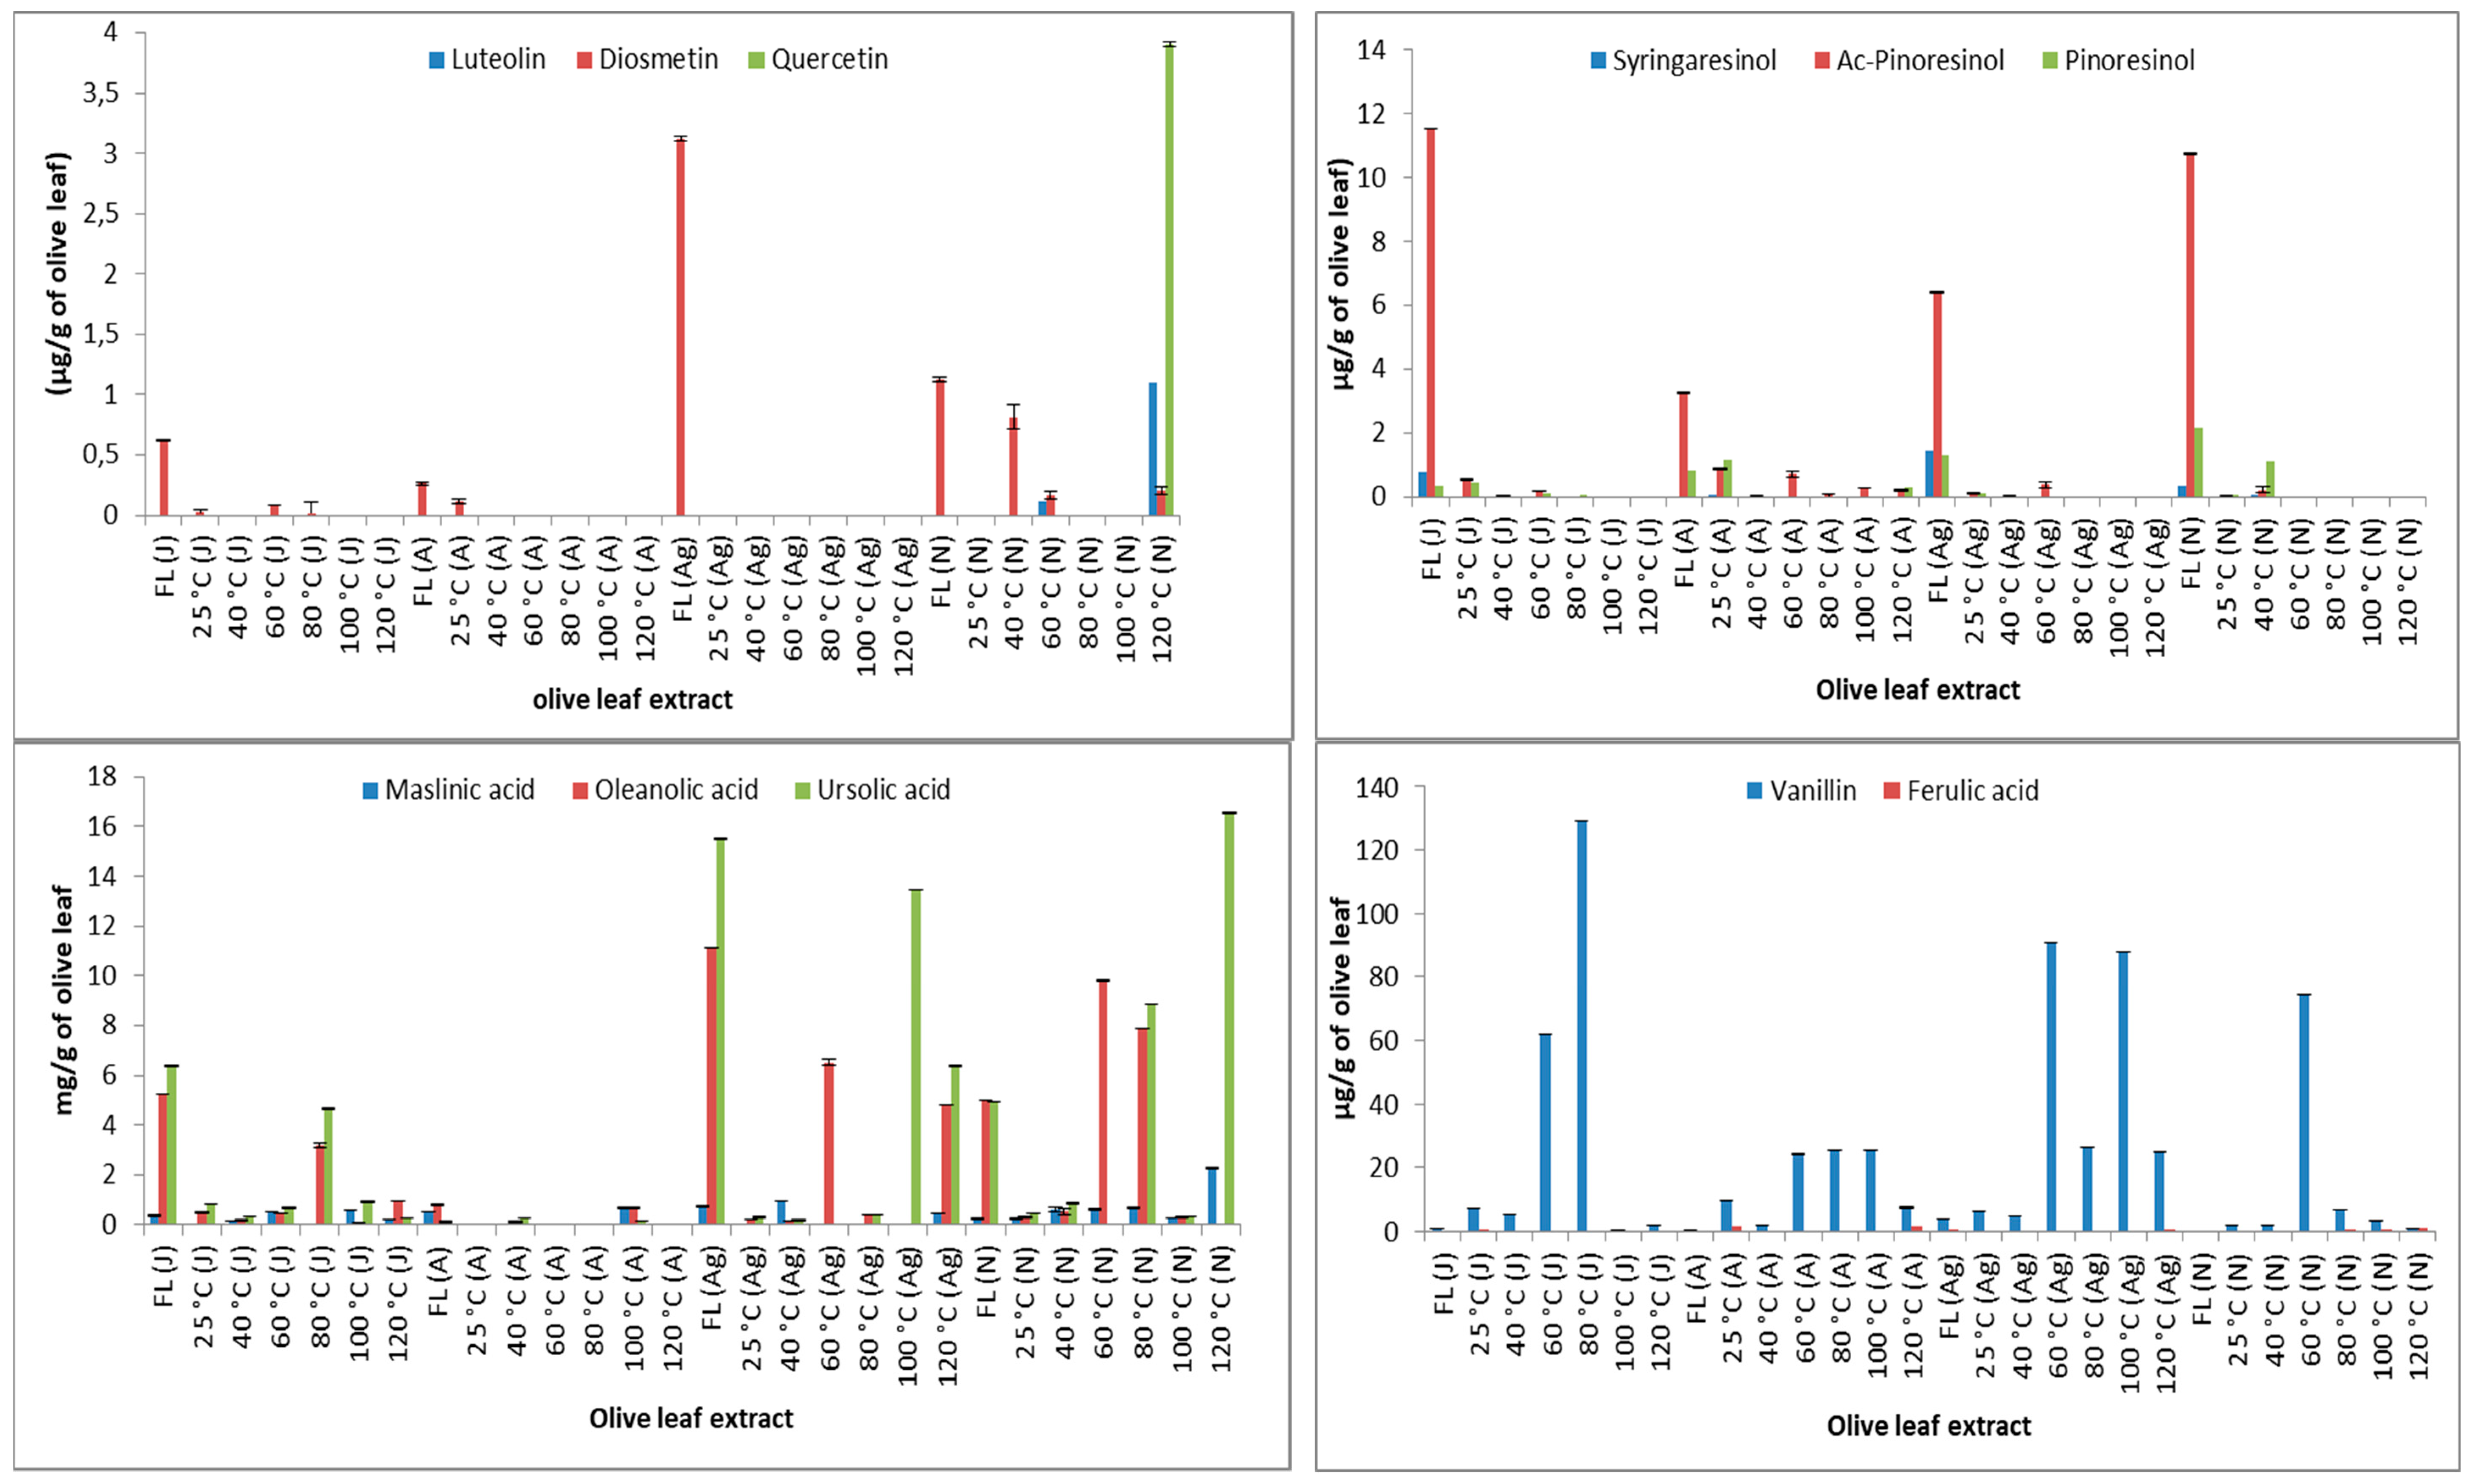
2.2. Quantification of Phytochemicals in Olive Leaf Extracts

The phytochemicals were quantified in the different olive leaf extracts using the analytical standard calibration curves. Figure 3 shows the variation of the determined amounts of the identified phytochemicals. For phenolic compounds, oleuropein and derivatives were quantified using the calibration curve of the external standard oleuropein. Hydroxytyrosol, ferulic acid, pinoresinol, luteolin, apigenin, diosmetin, and quercetin were quantified using their corresponding standard calibration curves. Acetoxypinoresinol and syringaresinol were quantified using the calibration curve of pinoresinol. For triterpenoids, oleanolic acid and ursolic acid were quantified with the calibration curve of oleanolic acid, whereas maslinic acid was quantified with the calibration curve of maslinic acid. Finally, benzyl alcohol pentose was quantified using the calibration curve of hydroxytyrosol.

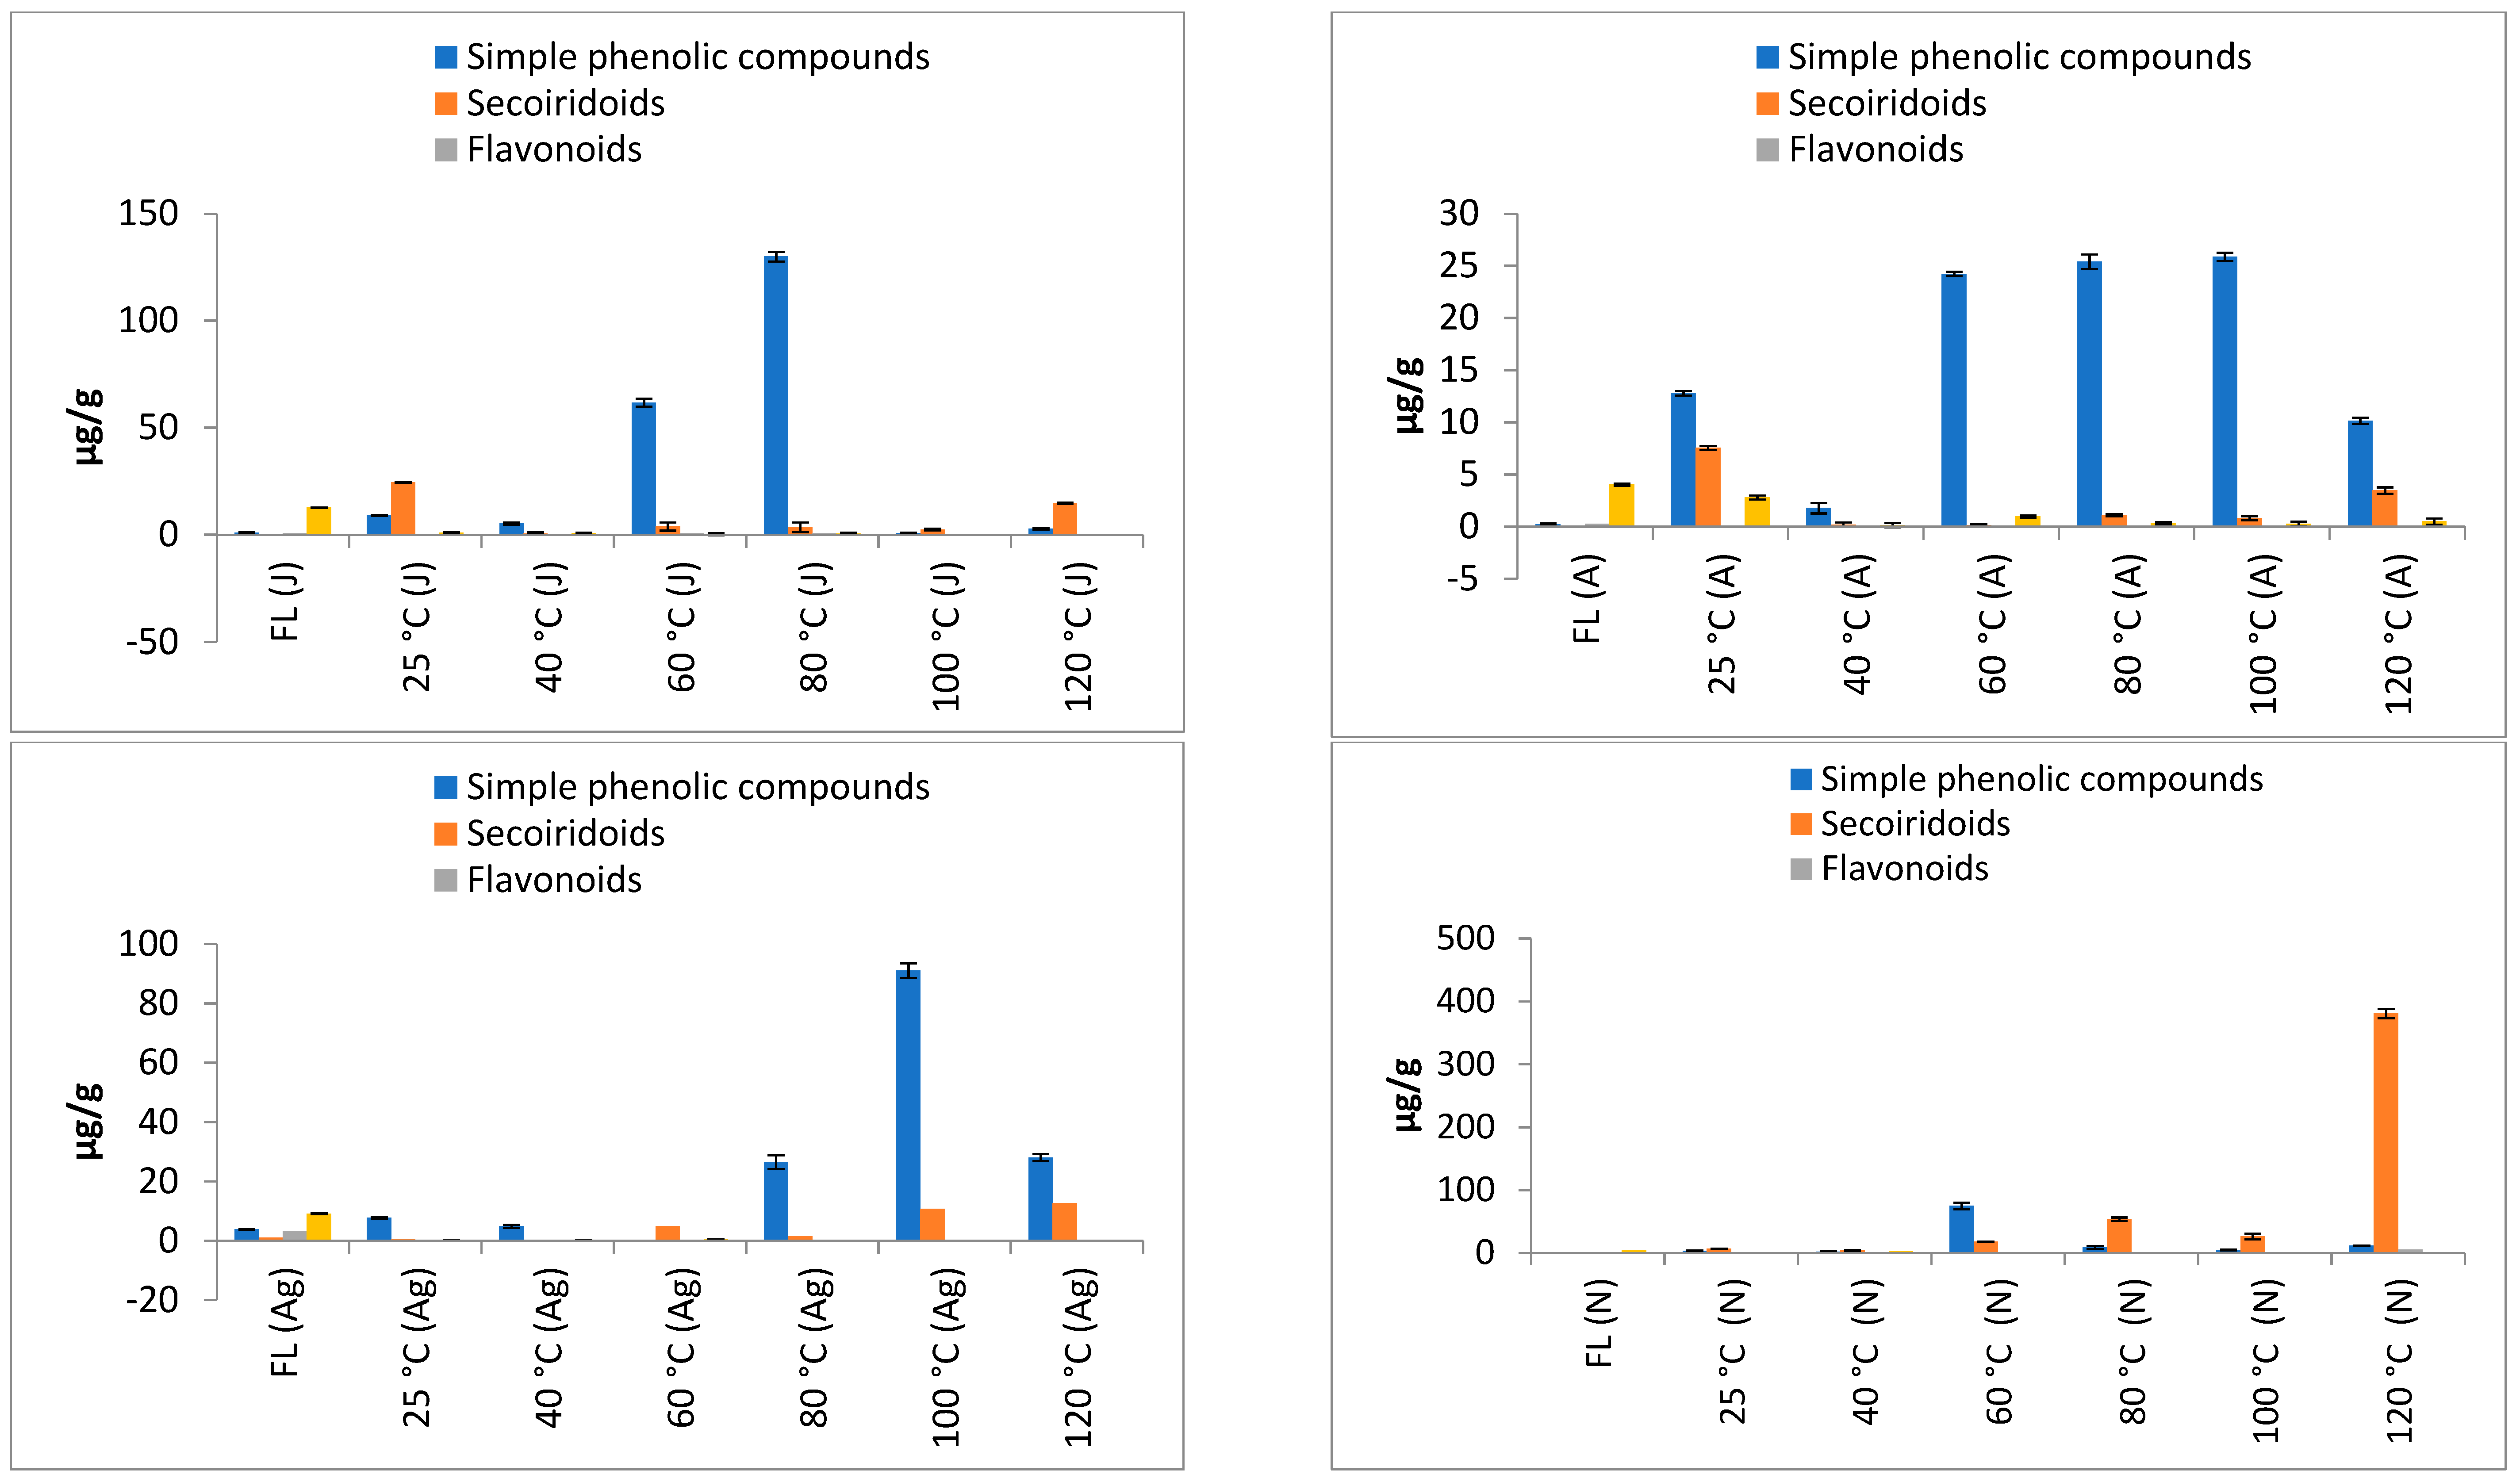
2.2.1. Variation of Phenolic and Triterpenoid Compounds Depending on Sampling Time and Drying Temperature

Phenolic and triterpenic compounds were determined, and their amounts expressed as µg/g of olive leaf are summarized in Figure 3. Significant variation (p < 0.05, Supplementary Materials) was observed among samples according to the drying temperature and sampling season.

Effect of Sampling Time

The seasonal changes in the composition of the leaves of the El Hor olive cultivar have been investigated with respect to sampling time: January, April, August, and November. The quantity and distribution of phenolic and triterpenic compounds in the leaves showed significant differences among samples of different seasons (p < 0.05).
As shown in Figure 4, contents in secoiridoids varied significantly among sampling time (p < 0.05). In fresh leaves, the highest amount was observed in leaves collected in summer and did not exceed 1 µg/g. However, for dried leaves, the highest amounts were registered for leaves collected in November (338.8 µg/g) except for leaves dried at 25 °C. In the latter, the January sampling time presented the highest amounts (24.5 µg/g) which decreased to 0.6 µg/g in August to slightly increase in November to reach 6.52 µg/g. As reported by other researchers, the contents of oleuropein in olive leaves were in general barely influenced by the collecting period factor [22].
It was reported that December was the sampling time during which oleuropein presented the maximum amount for ‘Leccino’ cultivar [4]. In another work, the samples of leaves collected in October seemed to contain slightly lower amounts of oleuropein than those collected in March, likely due to a higher degradation rate of this glycoside in autumn and in addition to lower production of green young leaves (leaf renovation) during this season with respect to the spring period [22].
The variations in lignans amounts observed in olive leaves according to sampling time were affected by the drying temperature. In fact, fresh leaves did not show the same behavior as observed in dried leaves. As shown in Figure 4, lignans in fresh leaves decreased from January (12.6 µg/g) to April (4.0 µg/g) and re-increased in August (9.1 µg/g) and decreased in November, to reach values similar to those observed in April (4.2 µg/g). However, in leaves dried at 25 and 60 °C, a slight increase was observed from January to April in contrast to leaves dried at 40 °C, where lignans amounts, after a decrease from January to April, increased in August and November to reach 2.41 µg/g. As far as we know, this is the first time the behavior of lignans has been studied according to drying.
Luteolin and quercetin were detected only in the November sampling time, whereas diosmetin was detected in samples from each period. Flavonoids amounts showed significant variations (p < 0.05) among samples, however, they did not exceed 3.1 µg/g according to the sampling time. The highest values were observed in August and November for fresh leaves and when leaves were dried at 120 °C (Figure 4).
Total triterpenoids showed a significant variation (p < 0.05) between olive leaf samples according to sampling time. These metabolites were almost absent in April (Figure 3). The highest value of total triterpenoids was registered for extracts of the November and August sampling times, in which it reached 18.8 and 27.4 mg/g, respectively. The amounts in January varied between 0.1 and 11.9 mg/g. Regardless of the season, generally, ursolic and oleanolic acid presented the major fraction of triterpenoids, whereas maslinic acid presented the lowest amounts.

Effect of Drying

The contents of phenolic compounds in the leaves showed different fluctuations according to the drying temperature.
Secoiridoids showed a significant variation (p < 0.05) among samples from the same season and dried at different temperatures. Values varied from 0.6 to 24.5 µg/g, 0.1 to 7.5 µg/g, 0.6 to 4.9 µg/g, and 4.1 to 380.0 µg/g for olive leaf samples collected in January, April, August, and November, respectively. The highest amounts were registered for leaves dried at 120 °C followed by those dried at 80 °C collected in autumn, with values reaching 380 and 53 µg/g, respectively.
Oleuropein contents varied between 0.5 and 23.2 µg/g, 0.1 and 6.9 µg/g, 0.6 and 2.1 µg/g, and between 4.1 and 290.0 µg/g for olive leaf samples of January, April, August, and November, respectively. As can be seen, the highest value was registered at a drying temperature of 120 °C for the samples collected in November. For the two collecting times of January and April, it seems that 25 and 120 °C were the appropriate drying temperatures to obtain the highest secoiridoid content, while 60 and 120 °C leaf drying provided the highest amounts of secoiridoids in August. Finally, when collected in November, leaves dried at 80 and 120 °C gave the highest amounts of secoiridoids. Accordingly, we can consider a temperature of 120 °C as convenient to obtain higher secoiridoid contents in olive leaves.
Oleuropein content of fresh olive leaves was very low as compared to its content in dried leaves, which might be due to the cell structure destruction of drying that allows any solvent to penetrate more easily. In a previous study, it was claimed that the low area of the surface facilitates the penetration of solvents into cells [5]. On the other side, it seems that supercritical fluid extraction does not permit the extraction of oleuropein when fresh leaves are used. This is in agreement with the results reported in our previous work [9]. Depending on the collecting season, the appropriate drying temperature for obtaining the highest amounts of oleuropein was as follows—25 °C when collected in January and April, and 120 °C when collected in August and November, reaching 290 µg/g in the latter. Previous studies reported that the composition of olive leaf extracts is greatly influenced by the drying technique [3,7]. In other work, oleuropein content of fresh green olive leaves was very low as compared to its content in dried leaves, explained by the fact that the surface area was too low to facilitate the penetration of solvents into cells so that oleuropein stayed protected in leaves cell [5].
In the same context, secologanoside contents showed remarkable fluctuations among olive leaf samples dried at different temperatures, with the leaves dried at 120 °C being those that gave the highest contents in secologanoside among all samples. Its value reached 32.4 µg/g.
Elenolic acid glucoside was not detected in fresh olive leaves regardless of the sampling time. The most remarkable variation is registered for the sample dried at 120 °C and collected in November in which its amount reached 12.8 µg/g.
The major compound in lignans that was determined in the majority of the analyzed extracts was acetoxypinoresinol, of which amounts presented a mean value of more than 77% of determined lignans, followed by pinoresinol and syringaresinol. The highest amounts of lignans were found in fresh leaves independently of the sampling time and reached 12.6 µg/g. Their levels showed a remarkable decrease with the increase in drying temperature.
Flavonoids amounts tended to decrease when increasing the drying temperature independently of the sampling time. For samples collected in November, when increasing drying temperature, flavonoids decreased gradually but increased then at 120 °C. The registered values of total flavonoids ranged from 0.2 to 0.8, 0.1 to 0.3, and 0.2 to 5.3 µg/g for samples collected in January, April, and November, respectively.
Triterpenoids showed a significant variation (p < 0.05) among fresh and dried olive leaf samples at different temperatures, with the highest values registered in fresh leaves of the August sampling. The contents of determined triterpenoids varied from 0.2 to 11.9 mg/g in January, between 0.2 and 0.4 mg/g in April, 0.3 and 27.4 mg/g in August, and finally from 0.7 to 18.8 mg/g in November.

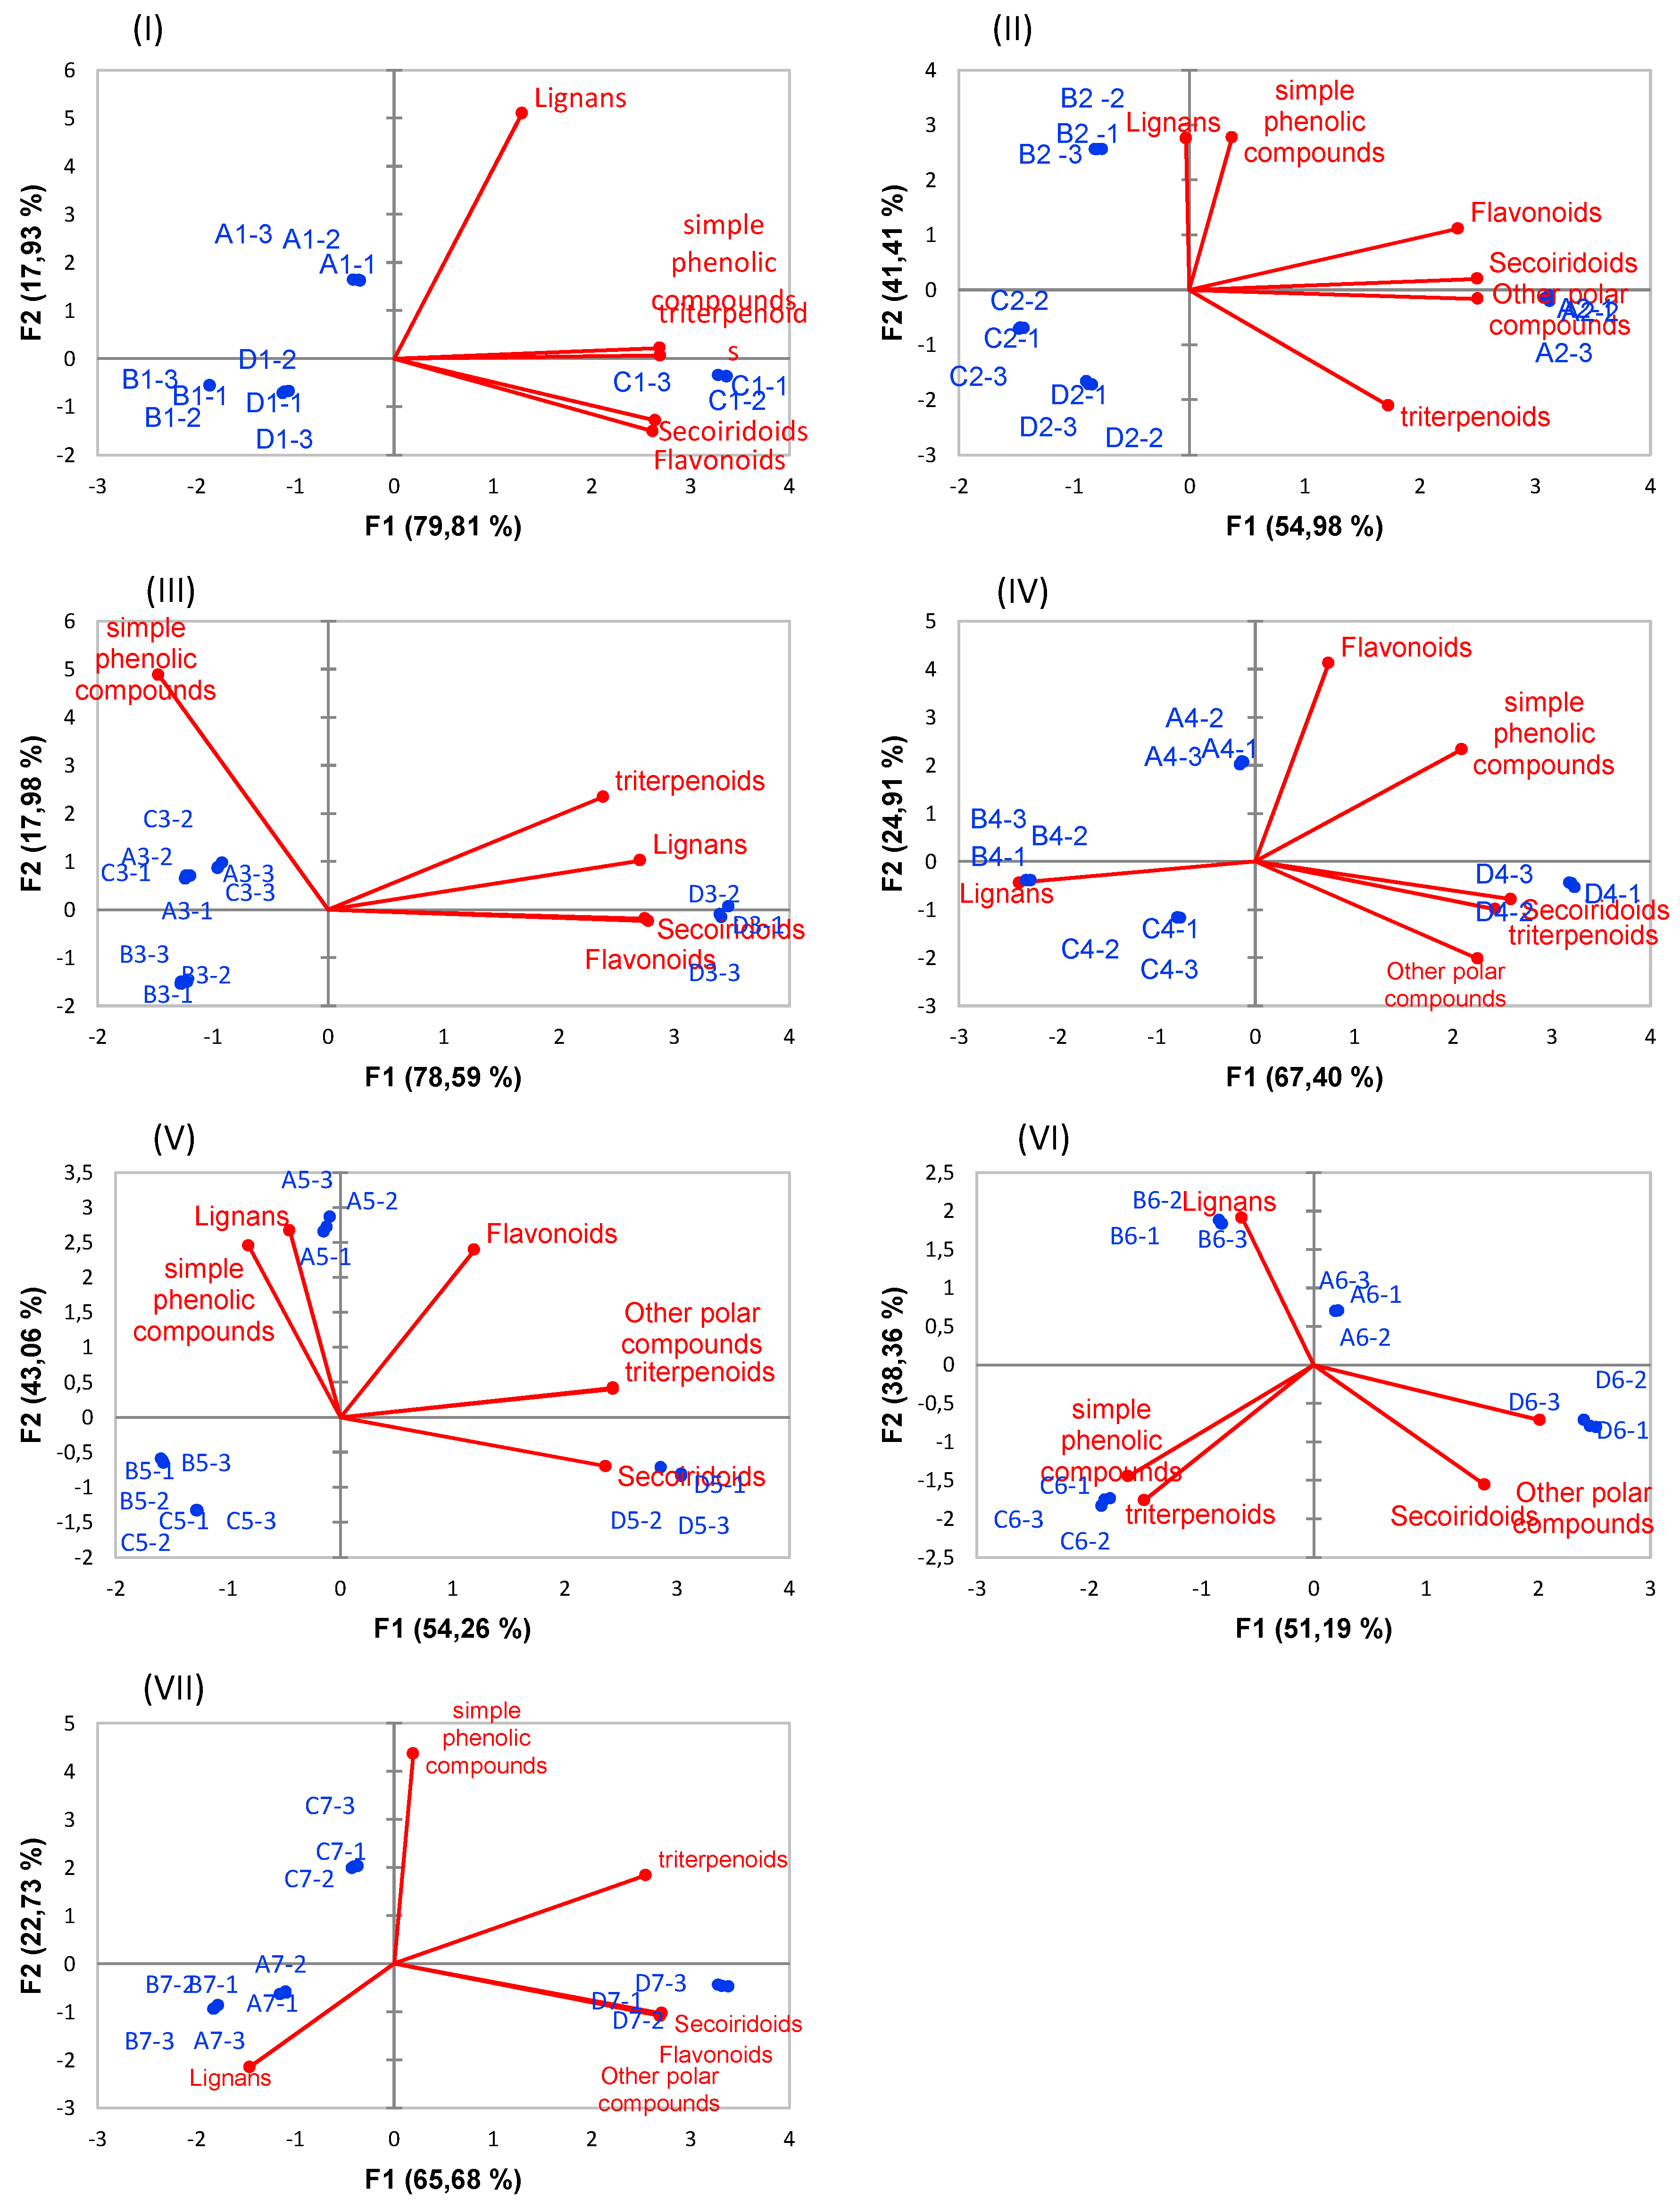
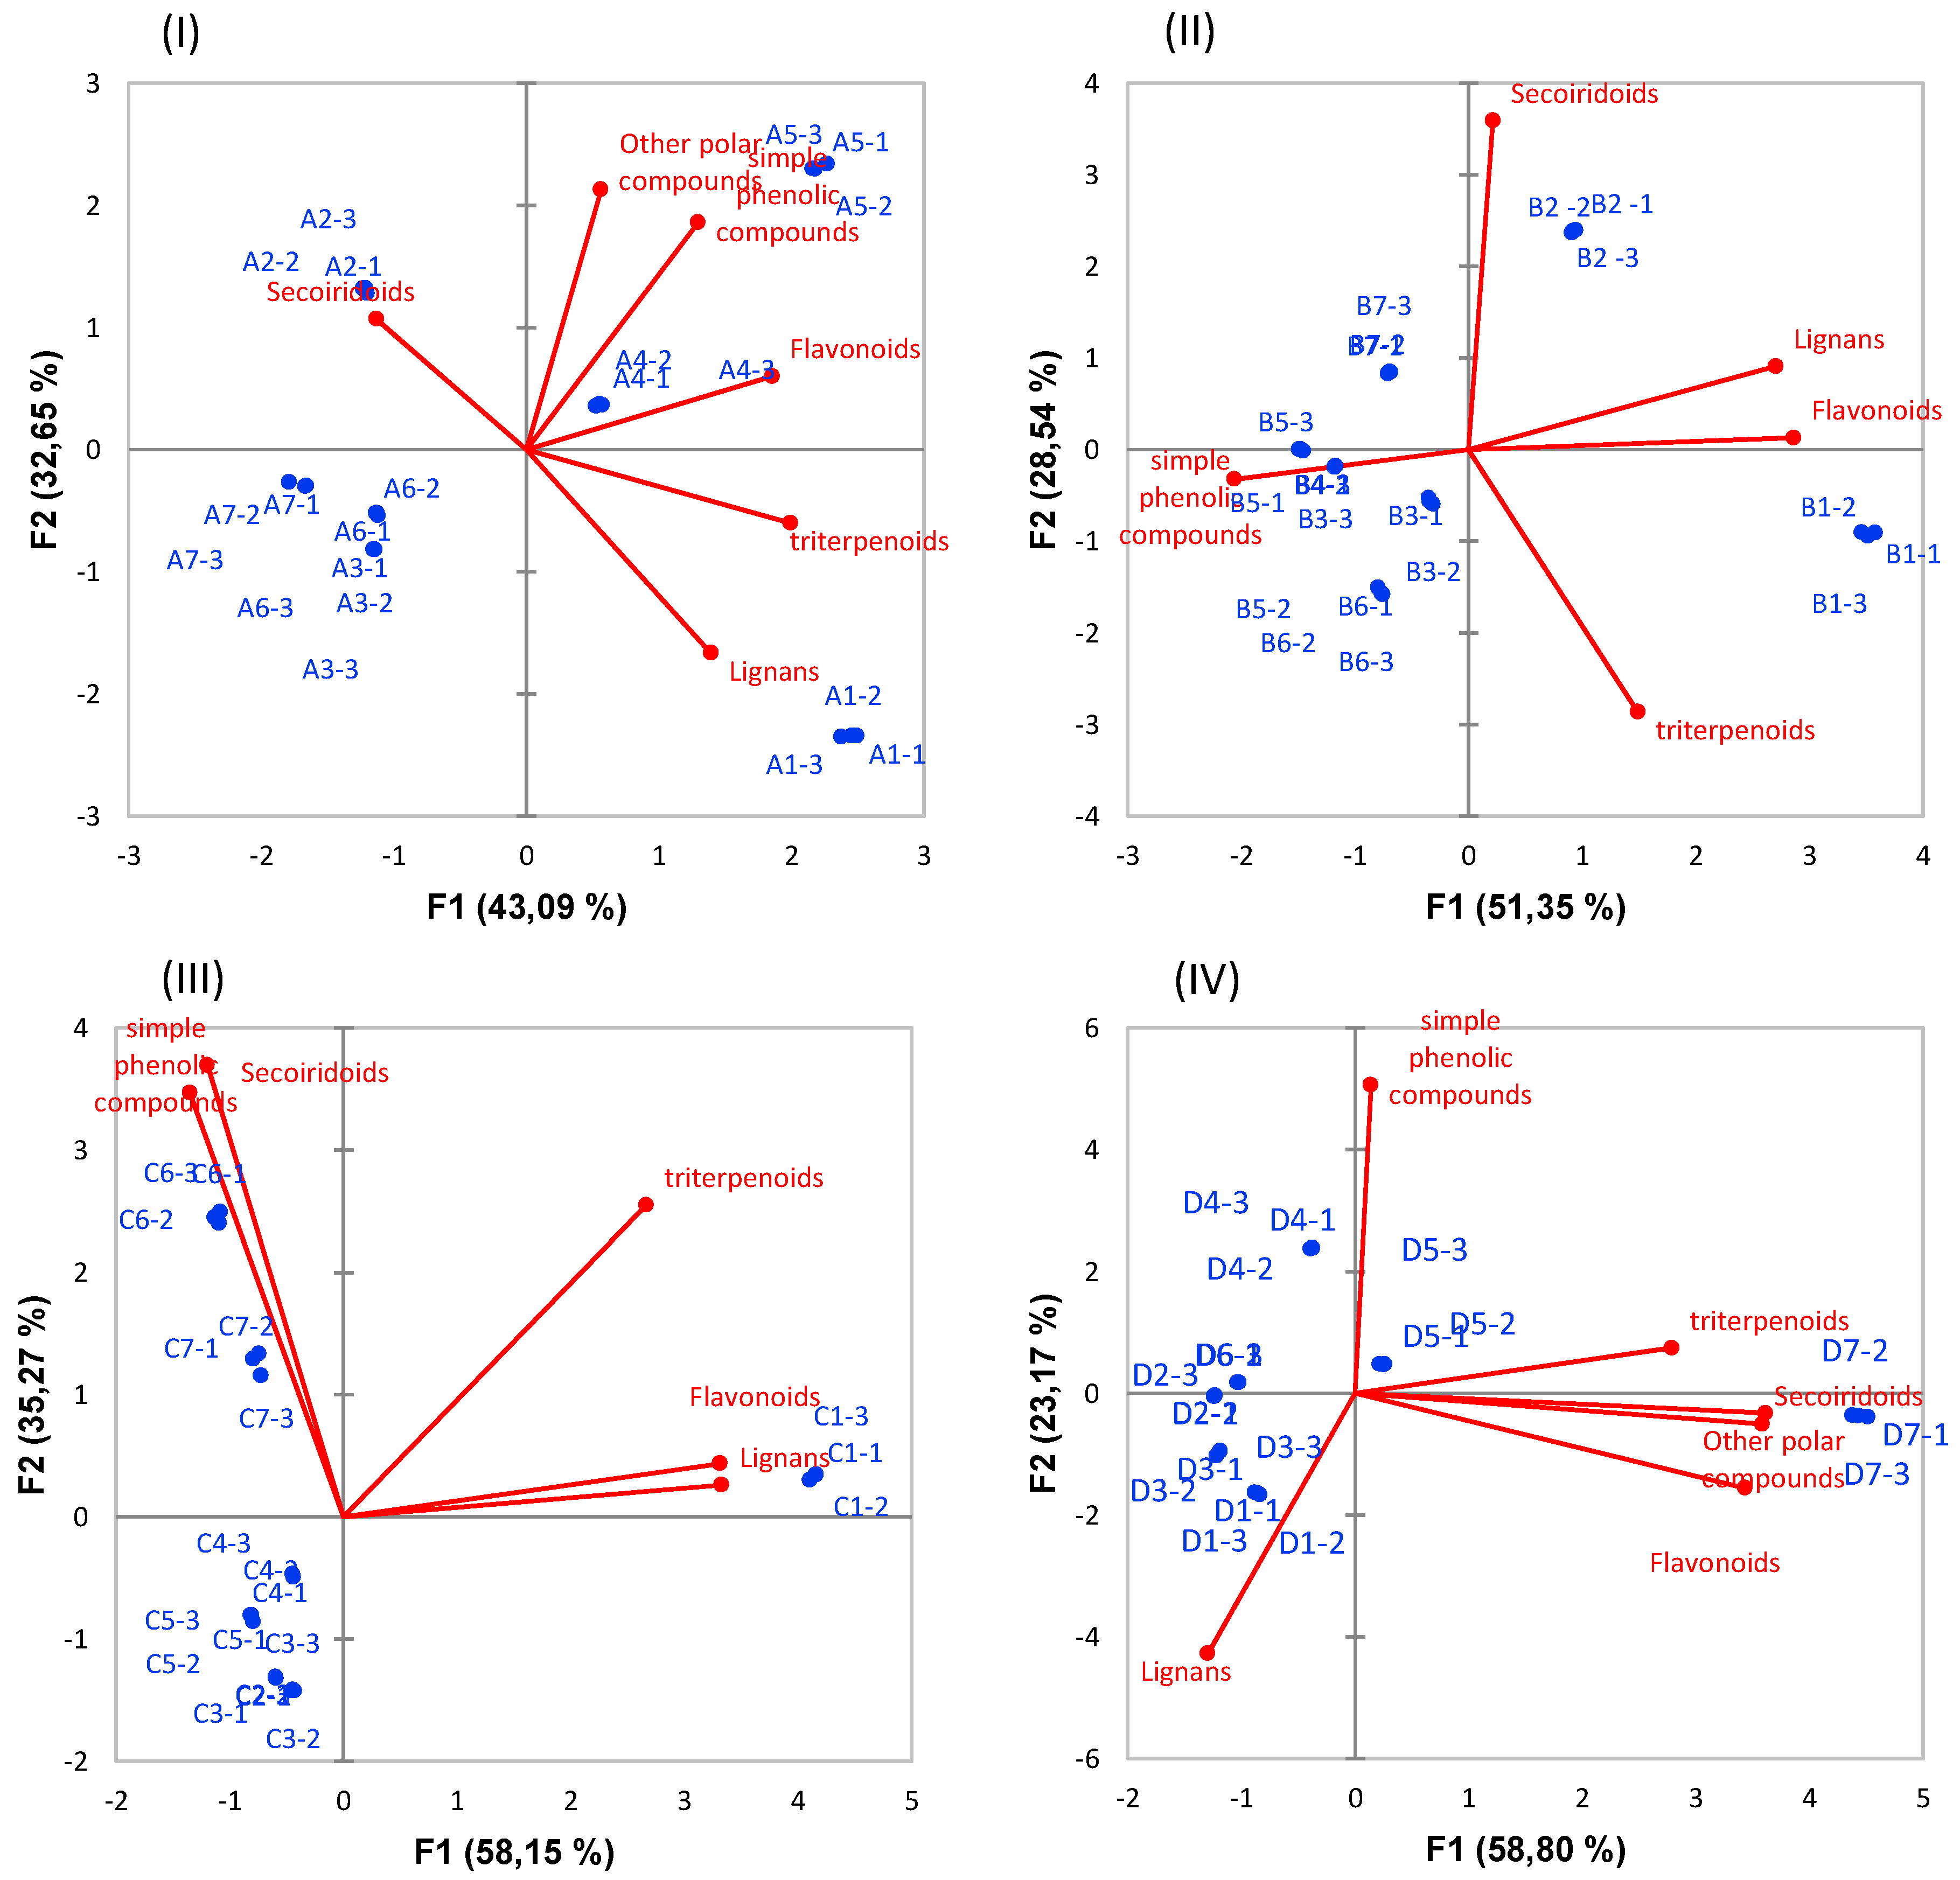
2.3. Principal Component Analysis

The principal component analysis permits us to better visualize the classification of the olive leaf samples under study according to the sampling time. Thus, PCA was applied to the data of the samples under study on the basis of classes of the identified phytochemicals.
As shown in Figure 5, for fresh leaves, the first two principal components (F1 and F2) explained 97.74%, 96.36%, 96.57%, 92.32%, 97.32%, 89.55% and 88.40% of the variance for fresh leaves, and leaves dried at 25, 40, 60, 80, 100, and 120 °C, respectively. For fresh leaves, a positive correlation was observed between the axis F1 and secoiridoids, triterpenoids, flavonoids, and simple phenolic compounds (cos2 > 0.9) whereas lignans showed a positive correlation with the F2 axis. Good separation was observed between samples collected in August and the rest of the samples according to the F1 axis. Regarding the leaves dried at 25 °C, a positive correlation was registered between the F1 axis and secoiridoids, flavonoids, and other polar compounds (cos2 > 0.85), whereas a positive correlation was observed between the F2 axis and lignans and simple phenolic compounds (cos2 > 0.89). A clear separation was observed between the three main groups of samples (samples collected in January, samples collected in April, and samples collected in August and November). At a drying temperature of 40 °C, the PCAin Figure 5 showed a clear separation between samples collected in November and the rest of the samples. A positive correlation was registered between the F1 axis and secoiridoids, lignans, and flavonoids (cos2 > 0.95). At 60 °C, secoiridoids, other polar compounds and lignans which correlated highly to the F1 (cos2 > 0.81) axis permitted the separation between samples collected in November and the rest of samples. Three main groups of samples could be classified in the PCA applied at the data registered at 80 °C. Indeed, a clear separation could be visualized between samples collected in January, samples collected in November, and samples collected in April and August. When dried at 100 °C, lignans and triterpenoids permitted a clear separation between samples collected in April and samples collected in August, while other polar compounds correlated to the F1 axis (cos2 = 0.882) and contributed to the separation of samples collected in November from the rest of samples. At 120 °C, secoiridoids were the most contributing variable in the classification of samples according to the F1 axis (cos2 = 0.947) while simple phenolic compounds were the most contributing variable in the classification of samples according to the F2 axis (cos2 = 0.851).
In Figure 6, the plotting of olive leaf samples is presented according to drying temperatures. As can be observed, the most remarkable classification of samples was registered for the August and November samplings. In August, a clear separation was observed between fresh and dried leaves, regardless of the drying temperature. A high correlation was registered between the F1 axis and lignans and flavonoids (cos2 > 0.98). In November, a good separation was observed between the leaves dried at 120 °C and the rest of the samples. Secoiridoids and other polar compounds correlated highly to the F1 axis (cos2 > 0.96).
For the majority of cases, flavonoids contents decreased with the increase of drying temperature except for November sampling time when the highest amount was registered at 120 °C.

3. Materials and Methods

3.1. Chemicals

All chemicals were of analytical reagent grade and used as received. HPLC-grade acetonitrile and methanol were purchased from Labscan (Dublin, Ireland). Acetic acid of analytical grade (assay >99.5%) was purchased from Fluka (Buchs, Switzerland). Double-deionized water with a conductivity of <18.2 MΩ was obtained with a Milli-Q system (Millipore, Bedford, MA). Standard compounds such as hydroxytyrosol, vanillin, luteolin, apigenin, ferulic acid, oleanolic, and maslinic acids were purchased from Sigma–Aldrich (St. Louis, MO, USA,) (+)-pinoresinol was acquired from Arbo Nova (Turku, Finland), and oleuropein from Extrasynthèse (Lyon, France).

3.2. Sampling and Drying

Olive leaves were collected from the olive cultivar ‘El Hor’ from the Center of Tunisia. The collection of the leaf samples began from January 2017 and continued until November 2017. The collected olive leaves were directly transferred to the laboratory, washed with distilled water. Portions of leaves were immediately stored at −80 °C and other portions were dried either at room temperature (25 °C) in a programmable mechanical convection oven (Binder Gmbh) or various temperatures of 40, 60, 80, 100, and 120 °C. Leaves were ground using an Ultra Centrifugal Mill ZM 200 (Retsch Gmbh, Germany). As a means of gaining representative results and eliminating factors which could affect the monitoring of the phenolic compounds, this fraction was isolated by supercritical CO2 extraction without storage of dried samples.

3.3. Supercritical CO2 Extraction

Supercritical CO2 extraction was carried out with a Waters Prep Supercritical Fluid Extraction system (SFE-100) equipped with a high-pressure CO2 P-50 pump, a high-pressure co-solvent P-50 pump, an automated back pressure regulator, a low-pressure heating exchange, a high-pressure heating exchange, a high-pressure extraction, and a high-pressure collection vessel. Prior to the extraction process, 10 g of ground olive leaves were homogenized with 15 g of sea sand, that was selected as inert material to hold the sample inside the extraction cell and to improve extraction efficiency. This mixture was introduced into the extraction cell and packed with glass wool. Extractions were carried out at 150 bar and 40 °C, once experimental conditions had been reached, the extraction solvent (consisting of a mixture of CO2 plus 6.6% of ethanol as a modifier) passed through the extraction cell for one hour at 23 g/min. The obtained extract was collected, and the solvent was evaporated under vacuum at 38 °C [9]. A minimum of three replicate extractions was performed for each plant sample, and each extract was analyzed at least three times by HPLC analysis.

3.4. RP-HPLC-TOF MS Analysis of Phenolic and Terpenoid Compounds

Analytical methods to characterize the phenolic and terpenoid compounds in olive leaf SFE extracts were performed in an Agilent 1200 series Rapid Resolution LC (Agilent Technologies, CA, USA) equipped with a vacuum degasser, autosampler, a binary pump, and a diode array detector (DAD). The HPLC system was coupled to a micrOTOF (BrukerDaltonics, Bremen, Germany), and an orthogonal-accelerated TOF mass spectrometer using an electrospray interface (model G1607A from Agilent Technologies, Palo Alto, CA, USA). The chromatographic separation of these compounds was carried out on a C18 Zorbax Eclipse Plus analytical column (4.6 × 150 mm, 1.8 μm) from Agilent Technologies.
Regarding phenolic compounds, the mobile phases used were water with acetic acid (0.5%) (mobile phase A), and acetonitrile (mobile phase B) and the solvent gradient changed according to the following conditions (Table 2):
The injection volume in the HPLC was 10 μL. The flow rate used was set at 0.80 mL/min throughout the gradient and, consequently, the use of a splitter was required for the coupling with the MS detector, as the flow that arrived at the TOF detector had to be 0.2 mL/min in order to obtain reproducible results and stable spray. Source and transfer parameters for MS analysis were set using the negative ion mode with spectra acquired over a mass range from m/z 50 to 1000 [9]. External mass spectrometer calibration was performed with sodium acetate clusters (5 mM sodium hydroxide in water/2-propanol 1/1 (v/v), with 0.2% of acetic acid) in quadratic high-precision calibration (HPC) regression mode. The calibration solution was injected at the beginning of the run, and all the spectra were calibrated prior to polyphenols identification.
Separation of triterpenic compounds from olive leaf extracts was performed on the same 1200 series Rapid Resolution LC (Agilent Technologies, CA, USA) described above. The mobile phases used were acidified water with 0.1% formic acid as mobile phase A and methanol with 0.1% formic acid as mobile phase B (Table 3). The gradient was as follows:
The injection volume in the HPLC was 10 μL. The flow rate was at 0.8 mL/min. The same MS conditions as described above were used, using sodium formate clusters for external mass spectrometer calibration.
Quantitation was carried out by HPLC-ESI-TOF-MS. Nine standard calibration curves of the main compounds found in samples were prepared using nine commercial standards. The stock solutions containing these analytes were prepared in methanol/water (50/50, v/v). All calibration curves showed good linearity over the range of study with a minimum value of R2 = 0.992. Results are given in mg of analyte per g of olive leaf for triterpenoids and in µg of analyte per g of olive leaf for the rest of compounds.

3.5. Statistical Analysis

An analysis of variance (ANOVA) and a Tukey posthoc test were carried out using IBM SPSS statistics 2017 version 25. Principal component analysis (PCA) was carried out using XLSTAT version 2018. 5.03. Values are expressed as mean value ± SD of three replicates for each sample.

4. Conclusions

In conclusion, for fresh leaves, November was the best time to obtain extracts richer in simple phenolic compounds, secoiridoids, flavonoids, and triterpenoids as compared to the other sampling times. However, after drying, the behavior of the phenolic compounds and triterpenoids varied according to the drying temperature. In fact, at 25 °C, January sampling demonstrated the highest contents of secoiridoids and flavonoids, whereas April showed the highest simple phenolic compounds amounts. On the other hand, when dried at 40 °C, leaves collected in November showed the highest amounts in secoiridoids, flavonoids, lignans, and triterpenoids, whereas leaves collected in January and August showed the highest amounts in simple phenolic compounds. The same was observed for secoiridoids and triterpenoids for leaves collected in November at drying temperatures of 60 °C and higher. Accordingly, April seemed to be the best sampling time for better recovery of lignans, and August seemed to be the best time for recovering higher simple phenolic compounds at elevated drying temperature.
Among analyzed samples, fresh leaves were generally characterized by higher amounts of flavonoids, lignans, and triterpenoids, whereas secoiridoids were generally found at higher amounts in samples dried at 120 °C. It is noteworthy that samples dried at 120 °C and collected in November presented among analyzed samples with the highest amounts in secoiridoids, flavonoids, triterpenoids, and other polar compounds. Since knowing the qualitative and quantitative composition as well as the occurrence of the phytochemicals in a given plant species is a crucial step for investigating the bioavailability and biochemical effect of any dietary phytochemical, and such results would be very useful in the study of the implication of olive leaf phytochemicals in biological activities. In addition, such findings would be helpful in terms of industrial valorization of El Hor olive leaves since it is important to know the best sampling time and drying temperature to obtain the highest yield of compounds of interest. Olive leaf bioactive compounds can be used as an important source to produce nutraceuticals or to be included in functional food thanks to their potential health benefits.

Supplementary Materials

The following are available online at https://www.mdpi.com/1996-1073/12/5/947/s1. Statistical data on phenolic and triterpenoid compounds determined according to the drying temperature and sampling season.

Author Contributions

Investigation, A.T., J.L.Z. and H.J.; Methodology, A.T. and J.L.Z.; Supervision, J.L.Z., L.A., A.S.C., D.A.R. and J.Y.C.; Validation, A.T. and; Writing—Original Draft, A.T., J.L.Z. and N.T.; Writing—Review & Editing; L.A., A.S.C., J.Y.C. and D.A.R.

Acknowledgments

This work was supported by the Tunisian Ministry of Higher Education under the Tunisian-Korean project “Development of Anti-arthritic remedy with Olive by-products”.

Conflicts of Interest

The authors declare no conflict of interest.

Abbreviations

HPLCHigh-Performance Liquid Chromatography
ESIElectrospray Ionization
TOFTime of Flight
MSMass Spectrometry
BPCBase Peak Chromatogram
EICExtracted Ion Chromatogram
SFESupercritical Fluid Extraction
FLFresh olive leaves

References

  1. Segasothy, M.; Phillips, P.A. Vegetarian diet: panacea for modern lifestyle diseases? QJM 1999, 92, 531–544. [Google Scholar] [CrossRef] [PubMed] [Green Version]
  2. Nicoletti, M. Advances in Production of Functional Foods and Nutraceuticals; Nova Science Publishers, Inc.: New York, NY, USA, 2014; ISBN 9781631172557. [Google Scholar]
  3. Ahmad-Qasem, M.H.; Cánovas, J.; Barrajón-Catalán, E.; Carreres, J.E.; Micol, V.; García-Pérez, J.V. Influence of Olive Leaf Processing on the Bioaccessibility of Bioactive Polyphenols. J. Agric. Food Chem. 2014, 62, 6190–6198. [Google Scholar] [CrossRef] [PubMed]
  4. Fabbri, A.; Galaverna, G.; Ganino, T. Polyphenol composition of olive leaves with regard to cultivar, time of collection and shoot type. Acta Hortic. 2008, 791 Pt 2, 459–464. [Google Scholar] [CrossRef]
  5. Afaneh, I.; Yateem, H.; Al-Rimawi, F. Effect of Olive Leaves Drying on the Content of Oleuropein. Am. J. Anal. Chem. 2015, 6, 246–252. [Google Scholar] [CrossRef]
  6. Erbay, Z.; Icier, F. Thin-Layer Drying Behaviors of Olive Leaves (Olea europaea L.). J. Food Process Eng. 2010, 33, 287–308. [Google Scholar] [CrossRef]
  7. Ahmad-Qasem, M.H.; Barrajón-Catalán, E.; Micol, V.; Mulet, A.; García-Pérez, J.V. Influence of freezing and dehydration of olive leaves (var. Serrana) on extract composition and antioxidant potential. Food Res. Int. 2013, 50, 189–196. [Google Scholar] [CrossRef]
  8. Erbay, Z.; Icier, F. Optimization of Drying of Olive Leaves in a Pilot-Scale Heat Pump Dryer. Dry. Technol. 2009, 27, 416–427. [Google Scholar] [CrossRef]
  9. Taamalli, A.; Arráez-Román, D.; Barrajón-Catalán, E.; Ruiz-Torres, V.; Pérez-Sánchez, A.; Herrero, M.; Ibañez, E.; Micol, V.; Zarrouk, M.; Segura-Carretero, A.; et al. Use of advanced techniques for the extraction of phenolic compounds from Tunisian olive leaves: Phenolic composition and cytotoxicity against human breast cancer cells. Food Chem. Toxicol. 2012, 50, 1817–1825. [Google Scholar] [CrossRef] [PubMed] [Green Version]
  10. Barrajón-Catalán, E.; Taamalli, A.; Quirantes-Piné, R.; Roldan-Segura, C.; Arráez-Román, D.; Segura-Carretero, A.; Micol, V.; Zarrouk, M. Differential metabolomic analysis of the potential antiproliferative mechanism of olive leaf extract on the JIMT-1 breast cancer cell line. J. Pharm. Biomed. Anal. 2015, 105, 156–162. [Google Scholar] [CrossRef] [PubMed]
  11. Ksouri, W.M.; Medini, F.; Mkadmini, K.; Legault, J.; Magné, C.; Abdelly, C.; Ksouri, R. LC–ESI-TOF–MS identification of bioactive secondary metabolites involved in the antioxidant, anti-inflammatory and anticancer activities of the edible halophyte Zygophyllum album Desf. Food Chem. 2013, 139, 1073–1080. [Google Scholar] [CrossRef] [PubMed]
  12. Segura-Carretero, A.; Menéndez-Menéndez, J.; Fernández-Gutiérrez, A. Polyphenols in Olive Oil: The Importance of Phenolic Compounds in the Chemical Composition of Olive Oil. In Olives and Olive Oil in Health and Disease Prevention; Elsevier Inc.: Amsterdam, The Netherlands, 2010; pp. 167–175. ISBN 9780123744203. [Google Scholar]
  13. Taamalli, A.; Arráez-Román, D.; Ibañez, E.; Zarrouk, M.; Segura-Carretero, A.; Fernández-Gutiérrez, A. Optimization of microwave-assisted extraction for the characterization of olive leaf phenolic compounds by using HPLC-ESI-TOF-MS/IT-MS2. J. Agric. Food Chem. 2012, 60, 791–798. [Google Scholar]
  14. Taamalli, A.; Abaza, L.; Arráez Román, D.; Segura Carretero, A.; Fernández Gutiérrez, A.; Zarrouk, M.; Ben Youssef, N. Characterisation of phenolic compounds by HPLC-TOF/IT/MS in buds and open flowers of “chemlali” olive cultivar. Phytochem. Anal. 2013, 24, 504–512. [Google Scholar] [CrossRef] [PubMed]
  15. Abaza, L.; Taamalli, A.; Arráez-Román, D.; Segura-Carretero, A.; Fernández-Gutierrérez, A.; Zarrouk, M.; Youssef, N. Ben Changes in phenolic composition in olive tree parts according to development stage. Food Res. Int. 2017, 100, 454–461. [Google Scholar] [CrossRef] [PubMed]
  16. Ammar, S.; del Mar Contreras, M.; Gargouri, B.; Segura-Carretero, A.; Bouaziz, M. RP-HPLC-DAD-ESI-QTOF-MS based metabolic profiling of the potential Olea europaea by-product “wood” and its comparison with leaf counterpart. Phytochem. Anal. 2017, 28, 217–229. [Google Scholar] [CrossRef] [PubMed]
  17. Taamalli, A.; Arráez Román, D.; Gómez Caravaca, A.M.; Zarrouk, M.; Segura Carretero, A. Geographical Characterization of Tunisian Olive Tree Leaves (cv. Chemlali) Using HPLC-ESI-TOF and IT/MS Fingerprinting with Hierarchical Cluster Analysis. J. Anal. Methods Chem. 2018, 2018, 6789704. [Google Scholar] [CrossRef] [PubMed]
  18. Taamalli, A.; Arráez-Román, D.; Abaza, L.; Iswaldi, I.; Fernández-Gutiérrez, A.; Zarrouk, M.; Segura-Carretero, A. LC-MS-based Metabolite Profiling of Methanolic Extracts from the Medicinal and Aromatic Species Mentha pulegium and Origanum majorana. Phytochem. Anal. 2015, 26, 320–330. [Google Scholar] [CrossRef] [PubMed]
  19. Rodríguez-Pérez, C.; Quirantes-Piné, R.; Fernández-Gutiérrez, A.; Segura-Carretero, A.; Rodriguez-Perez, C.; Quirantes-Pine, R.; Fernandez-Gutierrez, A. Comparative characterization of phenolic and other polar compounds in Spanish melon cultivars by using high-performance liquid chromatography coupled to electrospray ionization quadrupole-time of flight mass spectrometry. Food Res. Int. 2013, 54, 1519–1527. [Google Scholar] [CrossRef] [Green Version]
  20. Kalogeropoulos, N.; Chiou, A.; Ioannou, M.; Karathanos, V.T.; Hassapidou, M.; Andrikopoulos, N.K. Nutritional evaluation and bioactive microconstituents (phytosterols, tocopherols, polyphenols, triterpenic acids) in cooked dry legumes usually consumed in the Mediterranean countries. Food Chem. 2010, 121, 682–690. [Google Scholar] [CrossRef]
  21. Caligiani, A.; Malavasi, G.; Palla, G.; Marseglia, A.; Tognolini, M.; Bruni, R. A simple GC-MS method for the screening of betulinic, corosolic, maslinic, oleanolic and ursolic acid contents in commercial botanicals used as food supplement ingredients. Food Chem. 2013, 136, 735–741. [Google Scholar] [CrossRef] [PubMed]
  22. Ranalli, A.; Contento, S.; Lucera, L.; Di Febo, M.; Marchegiani, D.; Di Fonzo, V. Factors affecting the contents of iridoid oleuropein in olive leaves (Olea europaea L.). J. Agric. Food Chem. 2006, 54, 434–440. [Google Scholar] [CrossRef] [PubMed]
Figure 1. Base peak chromatograms (BPCs) of fresh and dried olive leaf samples collected in January from A1 to A7 according to drying temperature. A1: Fresh leaves, A2: leaves dried at 25 °C, A3: leaves dried at 40 °C, A4: leaves dried at 60 °C, A5: leaves dried at 80 °C, A6: leaves dried at 100 °C, A7: leaves dried at 120 °C.
Energies 12 00947 g001
Figure 2. Extracted ion chromatograms (EICs) of identified compounds in olive leaf samples.
Energies 12 00947 g002
Figure 3. Variation of phytochemicals identified in olive leaf extracts. (J) January, (A) April, (Ag) August, (N) November, FL: Fresh leaves. Triterpenoids are expressed as mg/g, the rest of the phytochemicals are expressed as µg/g.
Energies 12 00947 g003aEnergies 12 00947 g003b
Figure 4. Variation of phytochemical classes according to sampling time and drying. (J) January, (A) April, (Ag) August and (N) November, FL: fresh leaves.
Energies 12 00947 g004aEnergies 12 00947 g004b
Figure 5. Principal Component Analysis of olive leaf samples according to sampling time: (I): Fresh leaves, (II): Leaves dried at 25°C, (III): Leaves dried at 40 °C, (IV): Leaves dried at 60 °C, (V): Leaves dried at 80 °C, (VI): Leaves dried at 100 °C, and (VII): Leaves dried at 120 °C. A: January, B: April, C: August, and D: November, FL: fresh leaves.
Energies 12 00947 g005
Figure 6. Principal Component Analysis of olive leaf samples according to drying temperature. (I) January, (II) April, (III) August, and (IV) November. 1: fresh leaves, 2: 25 °C, 3: 40 °C, 4: 60 °C, 5: 80 °C, 6: 100 °C, and 7: 120 °C.
Energies 12 00947 g006
Table 1. Mass spectral data of the phytochemicals identified in the olive leaf extracts.
Peakm/zR.T. (min)Molecular FormulaError (ppm)mSigmaCompound NameGroup
1389.10898.25C16H22O113.11Secologanoside *Secoiridoids and related derivatives
2153.05578.90C8H10O3−0.52Hydroxytyrosol #Simple phenols: Phenyl alcohols
3389.144710.33C16H22O11−0.54.4Loganoside *Secoiridoids
4401.145311.10C 18H26O103.82.7benzyl alcohol pentose *Other polar compounds
5403.124611.30C17H24O112.86.9Elenolic acid glucoside isomer 1 *Secoiridoids and related derivatives
6151.040111.70C8H8O3−4.86.4vanillin #Simple phenols: Aldehydes
7403.124612.09C17H24O11−0.513.8Elenolic acid glucoside isomer 2 *Secoiridoids and related derivatives
8193.050614.63C10H10O43.39.4Ferulic acid #Simple phenols: Hydroxycinnamic acids
9539.177015.46C25H32O135.23.8Oleuropein isomer 1 #Secoiridoids and related derivatives
10539.177015.96C25H32O134.72.4Oleuropein isomer 2 #Secoiridoids and related derivatives
11523.182123.92C25H31O124.04.8Ligstroside *Secoiridoids and related derivatives
12417.155518.59C22H26O8−2.035.6Syringaresinol #Lignans
13285.040519.00C15H10O6 Luteolin #Flavonoids: Flavones
14301.035419.20C15H10O71.911.24Quercetin #Flavonoids: Flavonols
15357.134419.9C20H22O61.214.9pinoresinol #Lignans
16415.139820.56C22H24O8−2.69.6acetoxypinoresinol #Lignans
17299.056122.97C16H12O69.314.2diosmetin #Flavonoids: O-methylated flavones
Peakm/zR.T. (min)Molecular FormulaError (ppm)mSigmaCompound NameClass
18471.348014.71C30H48O414.35.8Maslinic acid #triterpenoids
19455.353116.30C30H48O311.33.4Oleanolic acid #triterpenoids
20455.353116.41C30H48O312.18.8Ursolic acid *triterpenoids
* Identified on the basis of mass spectra. Comparison with the literature, # Identified on the basis of external pure standard.
Table 2. Solvent gradient conditions for the analysis of phenolic compounds.
Time Water + 0.5% Acetic Acid Acetonitrile
0–10 min95%–70%5%–30%
10–12 min70%–67%30%–33%
12–17 min67%–62%33%–38%
17–20 min62%–50%38%–50%
20–23 min50%–5%50%–95%
23–25 min5%–95%95%–5%
25–35 min95%5%
Table 3. Solvent gradient conditions for the analysis of triterpenoids.
Time Water + 0.1% Formic AcidMethanol + 0.1% Formic Acid
5 min25%75%
10 min0%100%
20 min0%100%
28 min95%5%
35 min95%5%

