Article

Is It Possible to Supply Norwegian Apartment Blocks with 4th Generation District Heating?

by
Øystein Rønneseth
1,*,
Nina Holck Sandberg
2 and
Igor Sartori
3
1
SINTEF Building and Infrastructure, Høgskoleringen 7B, 7034 Trondheim, Norway
2
Norwegian University of Science and Technology (NTNU), Department of Energy and Process Engineering, Kolbjørn Hejes vei 1B, 7034 Trondheim, Norway
3
SINTEF Building and Infrastructure, Forskningsveien 3B, 0373 Oslo, Norway
*
Author to whom correspondence should be addressed.
Energies 2019, 12(5), 941; https://doi.org/10.3390/en12050941
Submission received: 15 January 2019 / Revised: 8 March 2019 / Accepted: 11 March 2019 / Published: 12 March 2019

Abstract

:
Direct electricity is widely used for heating purposes in Norway, leading to significant strain on the electricity grid during the heating season. Conversion to 4th generation district heating (4GDH) is an effective method for reducing the need for large investments in the electricity grid, while simultaneously improving the energy efficiency of district heating systems. This article evaluates the possibility of reducing the supply temperature in existing Norwegian apartment blocks by improving the thermal envelope and reducing the temperature levels for the heating system. The analysis is based on simulations in IDA ICE (IDA Indoor Climate and Energy) focusing on whether the reduced supply temperature guarantees thermal comfort in the building, considering the coldest room with a heating setpoint of 22 °C. Based on a recommended minimum acceptable indoor temperature of 19 °C from the Norwegian building regulations (TEK), it should be possible to lower the radiator supply temperature from 80 to 60 °C for apartment blocks newer than 1971. For older buildings, an “intermediate” renovation is necessary to maintain temperatures above 19 °C, however, a “standard” renovation is recommended to ensure thermal comfort and improve the energy efficiency of the building stock.

1. Introduction

Buildings account for 40% of the energy use in the European Union (EU) [1] and Norway [2]. Direct electricity is widely used for heating purposes in Norway, leading to significant strain on the electricity grid during the heating season. Investments of 140,000 MNOK (14 320 MEUR) is planned for the electricity grid during the period 2015–2025 [3]. Conversion to 4th generation district heating (4GDH) is an effective method for reducing the need for large investments in the electricity grid and freeing electricity for other purposes such as transport or industry, which will lead to a reduction of greenhouse gas emissions. The current district heating grid in Norway can be classified as 3rd generation district heating (3GDH), i.e., with water temperatures of 80–100 °C [4]. Reducing the temperature levels to 4GDH will lead to reduced heat loss from the grid and higher potential for utilizing renewable energy sources and surplus energy. Implementing 4GDH will however introduce some challenges. One of them is the ability to supply low temperature district heating to existing buildings, renovated existing buildings and new low-energy buildings.
Buildings and district heating systems are both becoming more energy efficient. Space heating needs have been steadily reduced for new buildings in Norway during the past decades due to stricter building regulations [5]. This leads to lower temperature requirements in hydronic heating systems, which is beneficial to improve energy efficiency, to better regulate the heating system and to increase the utilization of renewable energy sources. At the same time, there has been a reduction of temperature levels in district heating grids, and we are now in the transitioning phase between 3GDH and 4GDH. Most of the existing buildings have been designed for high temperature levels for their radiator systems, while new buildings are designed for lower temperature levels. This raises the question of how district heating systems can be designed to most efficiently deliver heat to both new and existing buildings. Existing buildings are expected to represent the largest challenge in the transition to 4GDH due to high space heating demands and high temperature requirements [6].
4GDH can be defined as a coherent technological and institutional concept, which by means of smart thermal grids assists the appropriate development of sustainable energy systems. 4GDH systems provide the heat supply of low-energy buildings with low grid losses in a way in which the use of low-temperature heat sources is integrated with the operation of smart energy systems [7]. The concept of 4GDH is thoroughly defined in [7], including a number of relevant studies on the topic. Multiple studies conclude that district heating will play an essential role in the implementation of future sustainable energy systems [7,8,9]. They also emphasise the importance of converting existing district heating systems to low-temperature networks. The significance of existing buildings is also underlined, as they are expected to constitute the major part of the heat demand for many decades, due to their long lifetime. In fact, 80% of today’s building mass in Norway is expected to still be in use in 2050 [10]. In addition, 55% of Norway’s residential buildings were built before 1980 [11]. Energy savings and conservation measures are considered important for the development of future district heating systems and technologies. Existing buildings must therefore be included in the planning of future 4GDH networks [7].
The Research Centre on Zero Emission Neighbourhoods in Smart Cities (https://fmezen.no/) is working on how to cover the thermal energy demand for both new and existing buildings in a smart, energy efficient and flexible way. Thermal networks, such as 4GDH is considered a sustainable solution for the pilot projects in the research centre [12]. As the planned zero emission neighbourhoods will consist of both new and existing buildings, there will be different temperature requirements in the hydronic heating systems. The temperature levels should be as low as possible, and so it is necessary to investigate which temperature levels may be utilized. The goal of this study is to investigate whether it is possible to reduce the radiator supply temperature in existing Norwegian apartment blocks and still maintain thermal comfort. How low the supply temperature could be in different building types, will again determine the minimum district heating supply temperature. The article is building on results presented in [13]. The focus is on space heating in buildings and domestic hot water (DHW) has not been evaluated. The district heating side of the connection and consumer substations is not within the scope of this article.

2. Methods

2.1. Methodology

This article evaluates the possibility of reducing the supply temperature in existing Norwegian apartment blocks by improving the thermal envelope and reducing the temperature levels for the heating system. The analysis is based on building simulations in IDA ICE (IDA Indoor Climate and Energy) version 4.7.1 (EQUA, Stockholm, Sweden), focusing on whether the reduced supply temperature guarantees thermal comfort in the building, considering the coldest room with a heating setpoint of 22 °C. The minimum acceptable indoor temperature is set to 19 °C, according to the recommendation in the Norwegian building regulation (TEK) [5]. Multiple models representative for Norwegian apartment blocks are developed based on the Intelligent Energy Europe projects TABULA (Typology Approach for Building Stock Energy Assessment) and EPISCOPE (Energy Performance Indicator Tracking Schemes for the Continuous Optimisation of Refurbishment Processes in European Housing Stocks), including multiple building periods and energy standards. Simulations are performed with two different dimensioning temperature levels for the radiators which are typical for Norway: 80/60 °C and 60/40 °C. The purpose of the simulations is to investigate whether thermal comfort is maintained if the radiator supply temperature is reduced from 80 to 60 °C without resizing the radiator system. If it is not possible for the as-built model, then whether it is possible for the intermediate or standard renovated buildings. Calculated heating demands from the simulations are also compared to the values from the TABULA project.

2.2. Modelling Procedure, Input Data and Assumptions

2.2.1. Input Data and Classification of Models

The IEE projects TABULA and EPISCOPE defines a building stock divided into 21 segments, consisting of:
  • Three types of buildings: single-family house (SFH), terraced house (TH) and apartment blocks (AB)
  • Seven age classes: Prior to 1956, from 1956–1970, 1971–1980, 1981–1990, 1991–2000, 2001–2010, 2011–afterwards
A synthetic average building is defined for each segment, whose characteristics are representative of the most common features found in the segment based on the best available knowledge. Each synthetic average building is described in three levels of energy performance (original, standard renovation and advanced renovation) for a total of 63 archetypes. The data from the TABULA project have been used in many other studies, including scenario analysis, and is among the best available data for studying the building stock. Based on these typologies, IDA ICE models representative for Norwegian apartment blocks are developed. The advanced renovation is not modelled, as the results are expected to be similar as for the newest age class. Instead, an intermediate level between the original building and standard renovation is included, where only the windows and infiltration numbers are improved. To simplify the presentation of results, a clustering of the age classes is made. The apartment blocks from 1971–1980 are considered representative for the apartment blocks from 1981–1990 and 1991–2000 as well, due to similar construction methods, U-values and calculated heating needs. The input data and results from the apartment blocks from 1971–1980 will receive the main focus in this article, while input data and results from the other age classes can be found in Supplementary materials (Tables S1–S7 and Figures S1–S24).

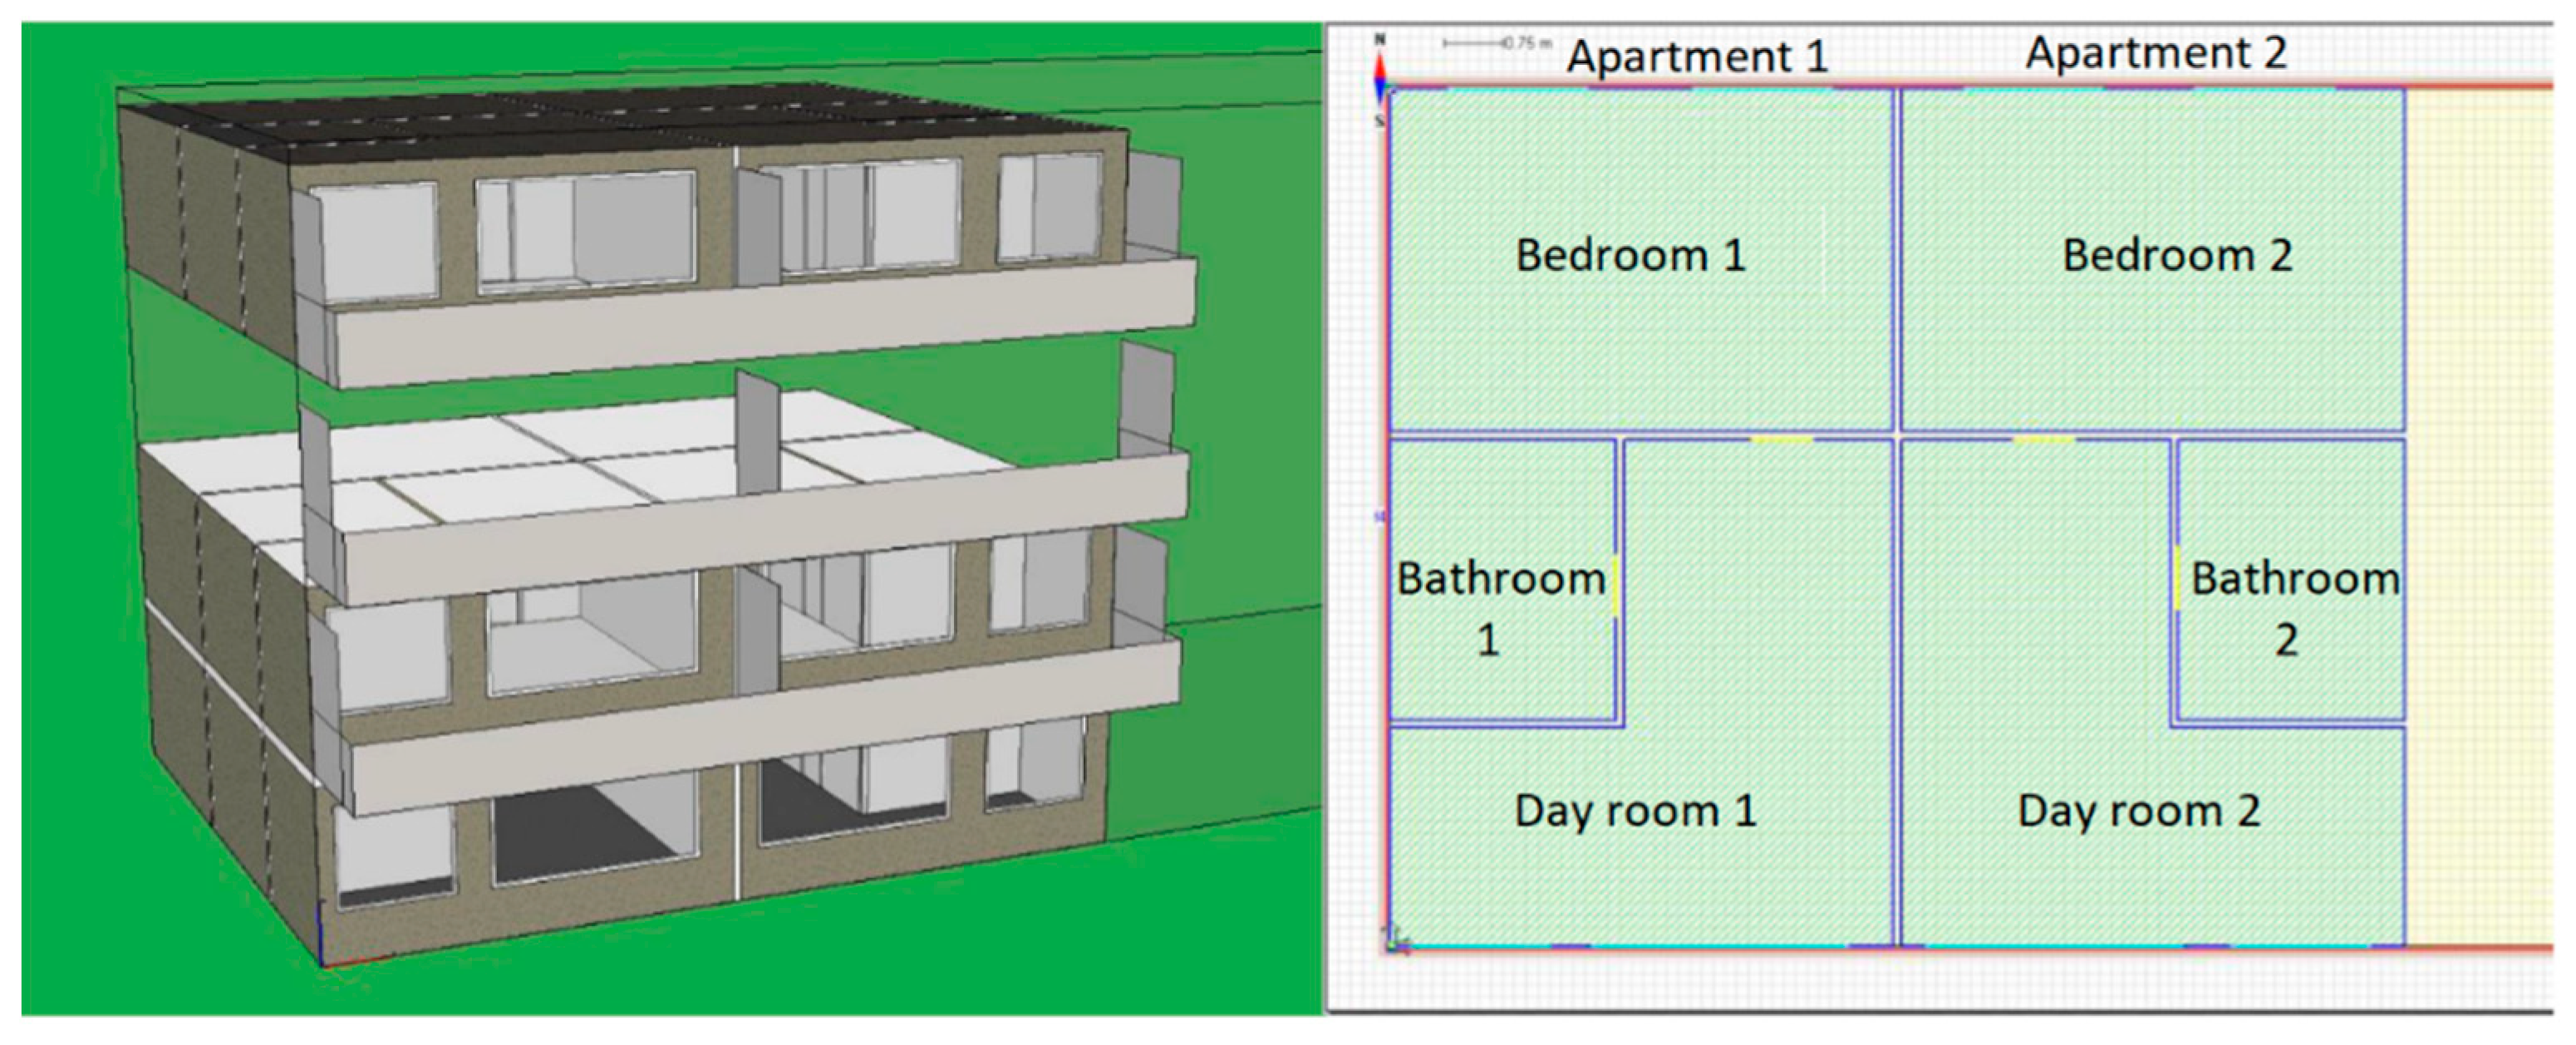
2.2.2. Building Geometry

The models are developed in IDA ICE, focusing on the thermal properties of the building envelope and the heat emission system. U-values and other input data for the models are collected from TABULA [14]. Table 1 provides an overview of the modelled age classes and their geometrical input data. The standard renovation of AB_07 (building year 2010–2020) to the Norwegian passive house level is considered representative for buildings built after 2020 and will hereby be referred to as AB_08. Due to lower number of apartments, AB_01 and AB_02 are smaller than AB_03–08. The same geometry is used for all age classes, with a 70 m2 floor area per apartment and room height of 2.7 m.
The common simulation procedure of using multipliers for similar zones is used for the models, as this reduces both the modelling and simulation time without compromising the results. The building geometry and floor plan for two apartments can be seen in Figure 1. Each apartment has three zones: a bedroom, bathroom and day room, where the latter is a combined zone for living room, kitchen and entrance. The heating setpoints are 18, 22 and 24 °C for the bedroom, day room and bathroom respectively.

2.2.3. Thermal Properties of the Building Envelope

Table 2 provides materials and U-values for the building components used in AB_03 for the initial built and standard renovated building. Similar tables for the other age classes can be found in Supplementary materials (Tables S1–S7). The following information is identical for all age classes. Internal floors are concrete slabs of 200 mm with floor coating, while internal walls are frame walls with 73 mm insulation and gypsum boards. The vertical apartment divider consists of 100 mm concrete. Balconies fare included on the southern façade as this will affect the solar heat gain. Solar shading is modelled as “Integrated window shading” with “External blinds (BRIS)” which are activated if the indoor air temperature exceeds 23 °C. Thermal bridge values are not provided in TABULA, and so normalized thermal bridge values are chosen from [15] based on the construction materials for each building period, ranging from 0.03 to 0.08 W/(K·m2 floor area). This value would in reality differ for the different apartments, based on their position in the block (top, middle or bottom floor, gable wall or middle apartment).

2.2.4. Infiltration and Ventilation

Procedures and materials used when replacing windows have been improved during the last decades. This means the infiltration rate will decrease for the intermediate renovation. The same is the case for the standard renovation, with improvements of roof, floor and external walls. Table 3 presents the chosen infiltration rates for the different age classes and energy standards. The infiltration rates for the as-built versions are based on Table B4 in SN TS 3031:2016 Energy performance of buildings—Calculation of energy needs and energy supply [16], with minor modifications to get a gradual improvement for newer buildings. Exceptions are made for AB_07 and AB_08, which are set according to TEK 10 [17] and the Norwegian passive house standard (NS 3700) [18]. Improved infiltration numbers after renovation are based on technical assessments and discussion with building physicists. Infiltration rates for buildings are associated with large uncertainties, as the numbers are dependent on many parameters, such as building method and materials, as well as the craftsmanship. Despite large uncertainty, the numbers provided here are however considered more accurate than not improving the infiltration rates at all.
One of the main challenges creating a set of models representative for Norwegian apartment blocks is how to model the ventilation system, as not all age classes have balanced mechanical ventilation. In order to achieve sufficient air change and good air quality in the buildings, and thus have a good reference for comparison, the ventilation system in IDA ICE is used for all models, with airflow rates based on the Norwegian building regulations TEK 17 [5]. This simplified method includes air change caused by window opening and vents in the building envelope, common for naturally ventilated buildings. According to TEK 17, bedrooms should have 26 m³/h supply air per sleeping accommodation. Two people (or two bedrooms) is assumed per apartment, leading to a supply airflow rate of 52 m³/h for the bedrooms. Exhaust airflow rates for the bathroom and kitchen (i.e., day room) of 54 and 36 m³/h respectively, led to 38 m³/h supply air in the day room to balance the airflows. AB_01–05 have no heat recovery or heat gains from fans and the specific fan power (SFP) is set to 0, as to not include energy use for fans. The heat recovery efficiencies are 50%, 70% and 85% for AB_06, AB_07 and AB_08 respectively. Furthermore, the SFP is set to 2.5 for AB_06 and 1.5 for AB_07–08.

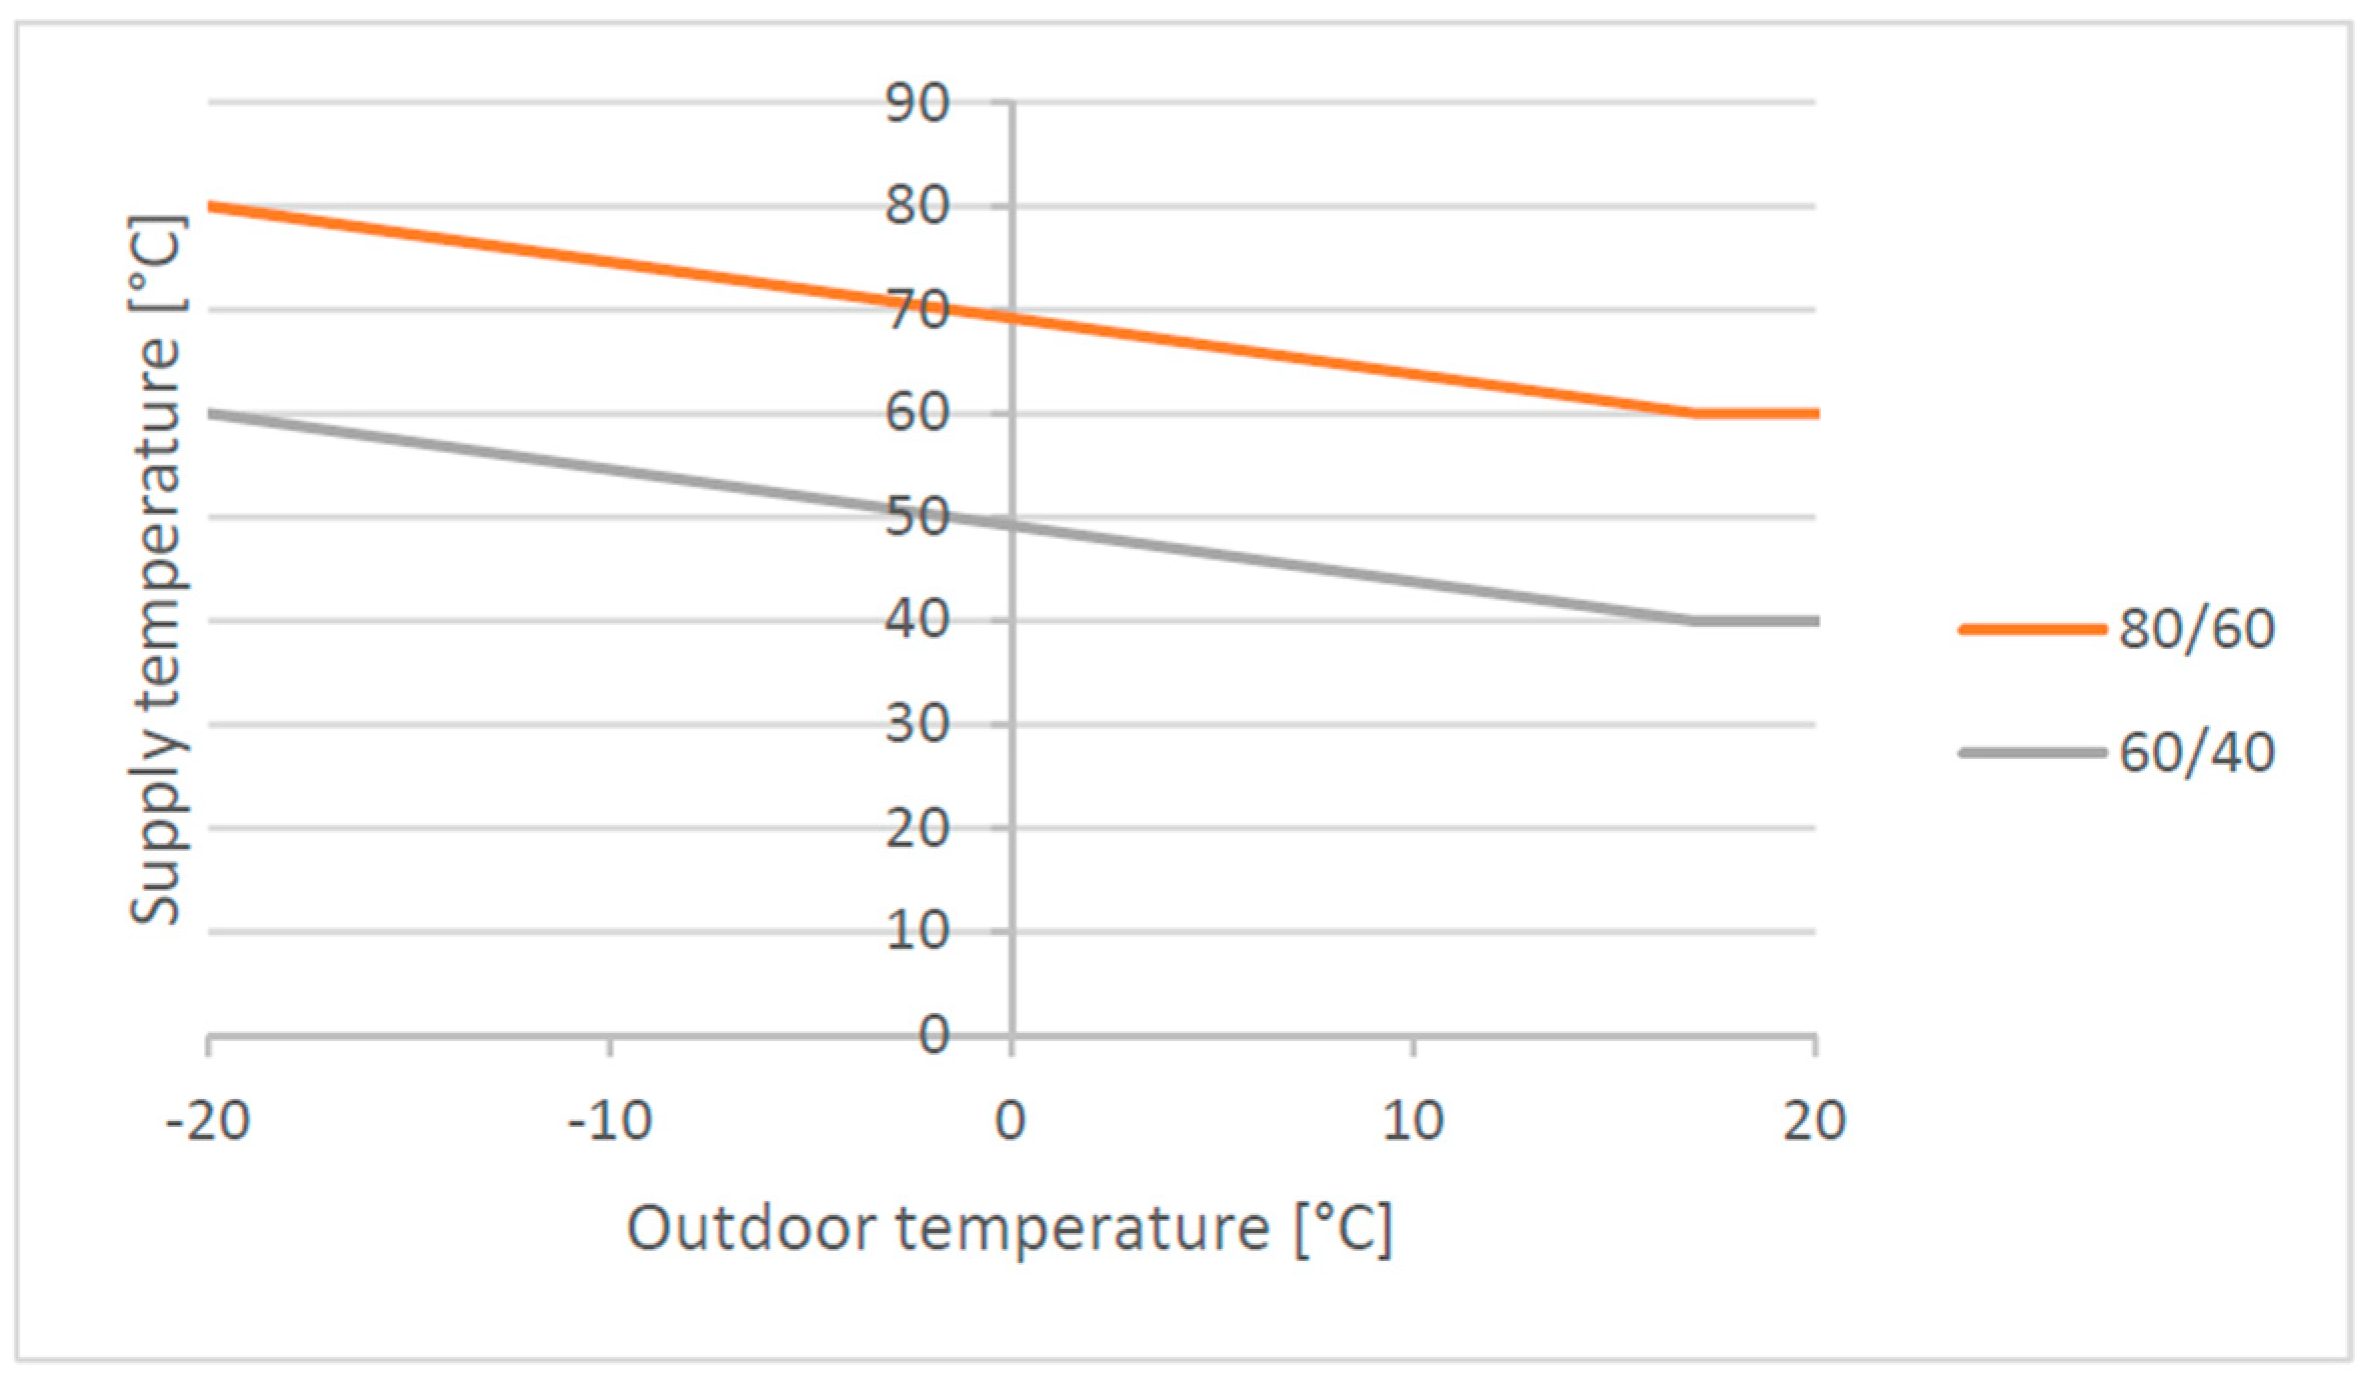
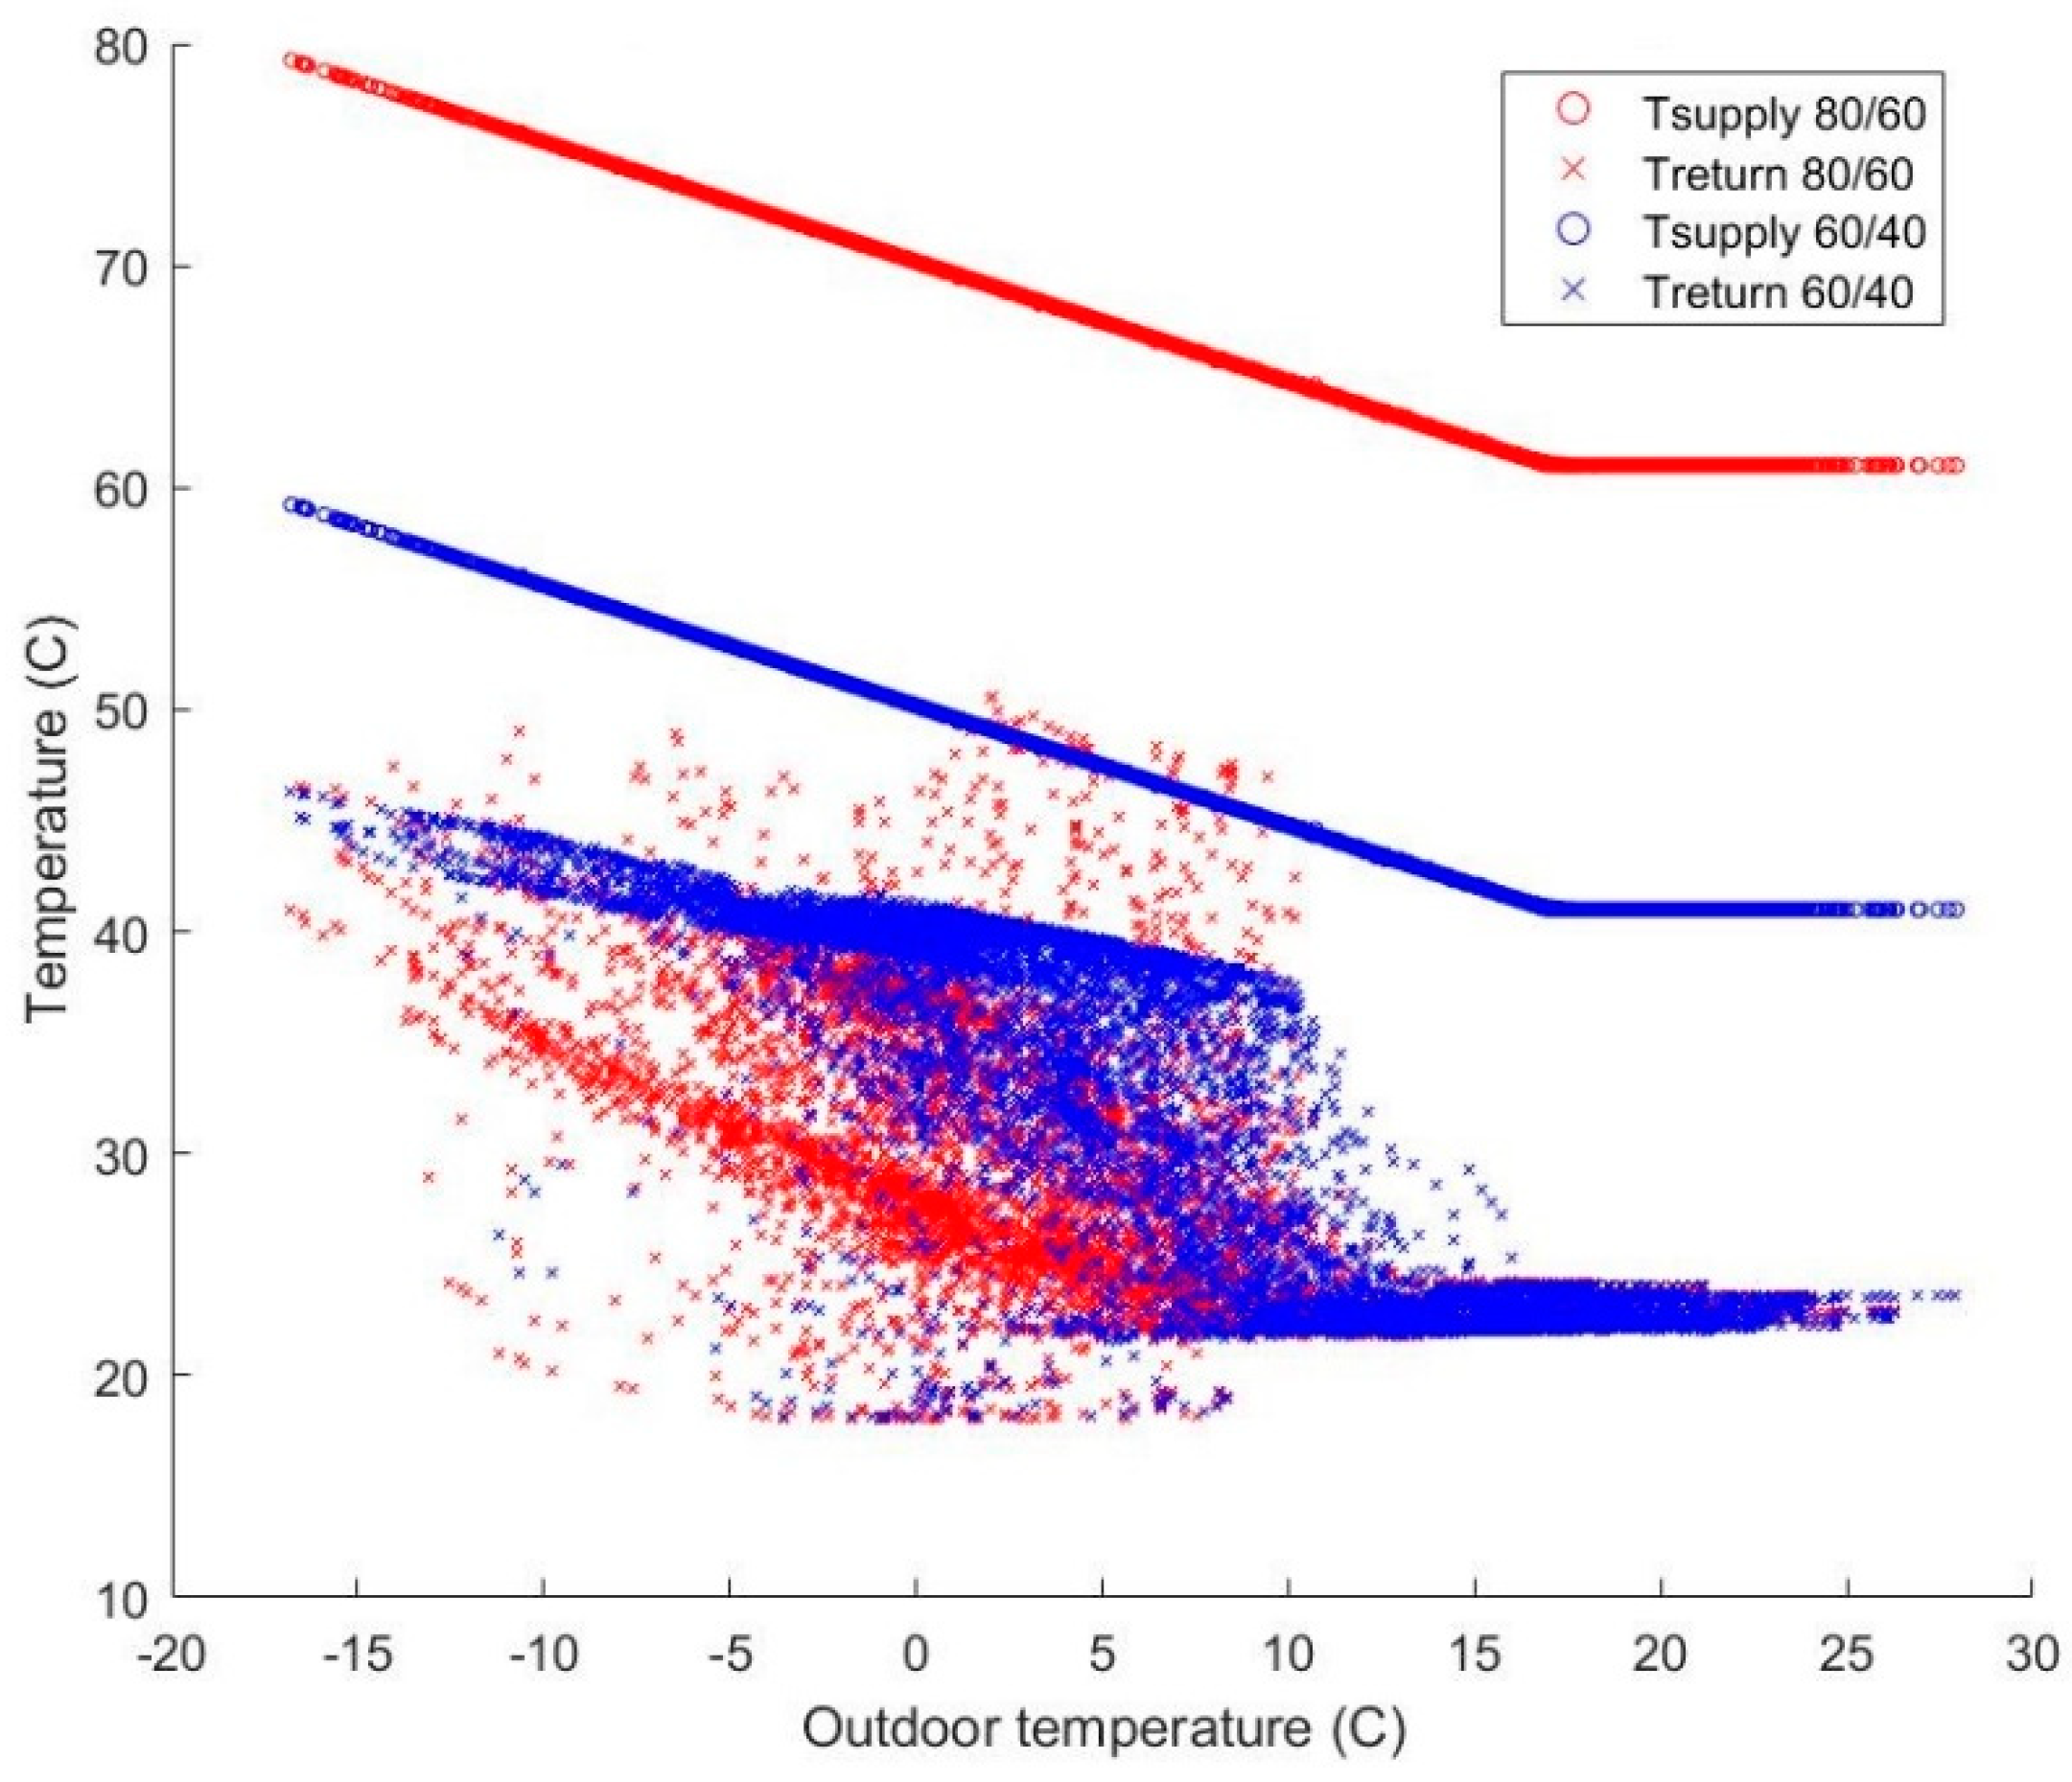
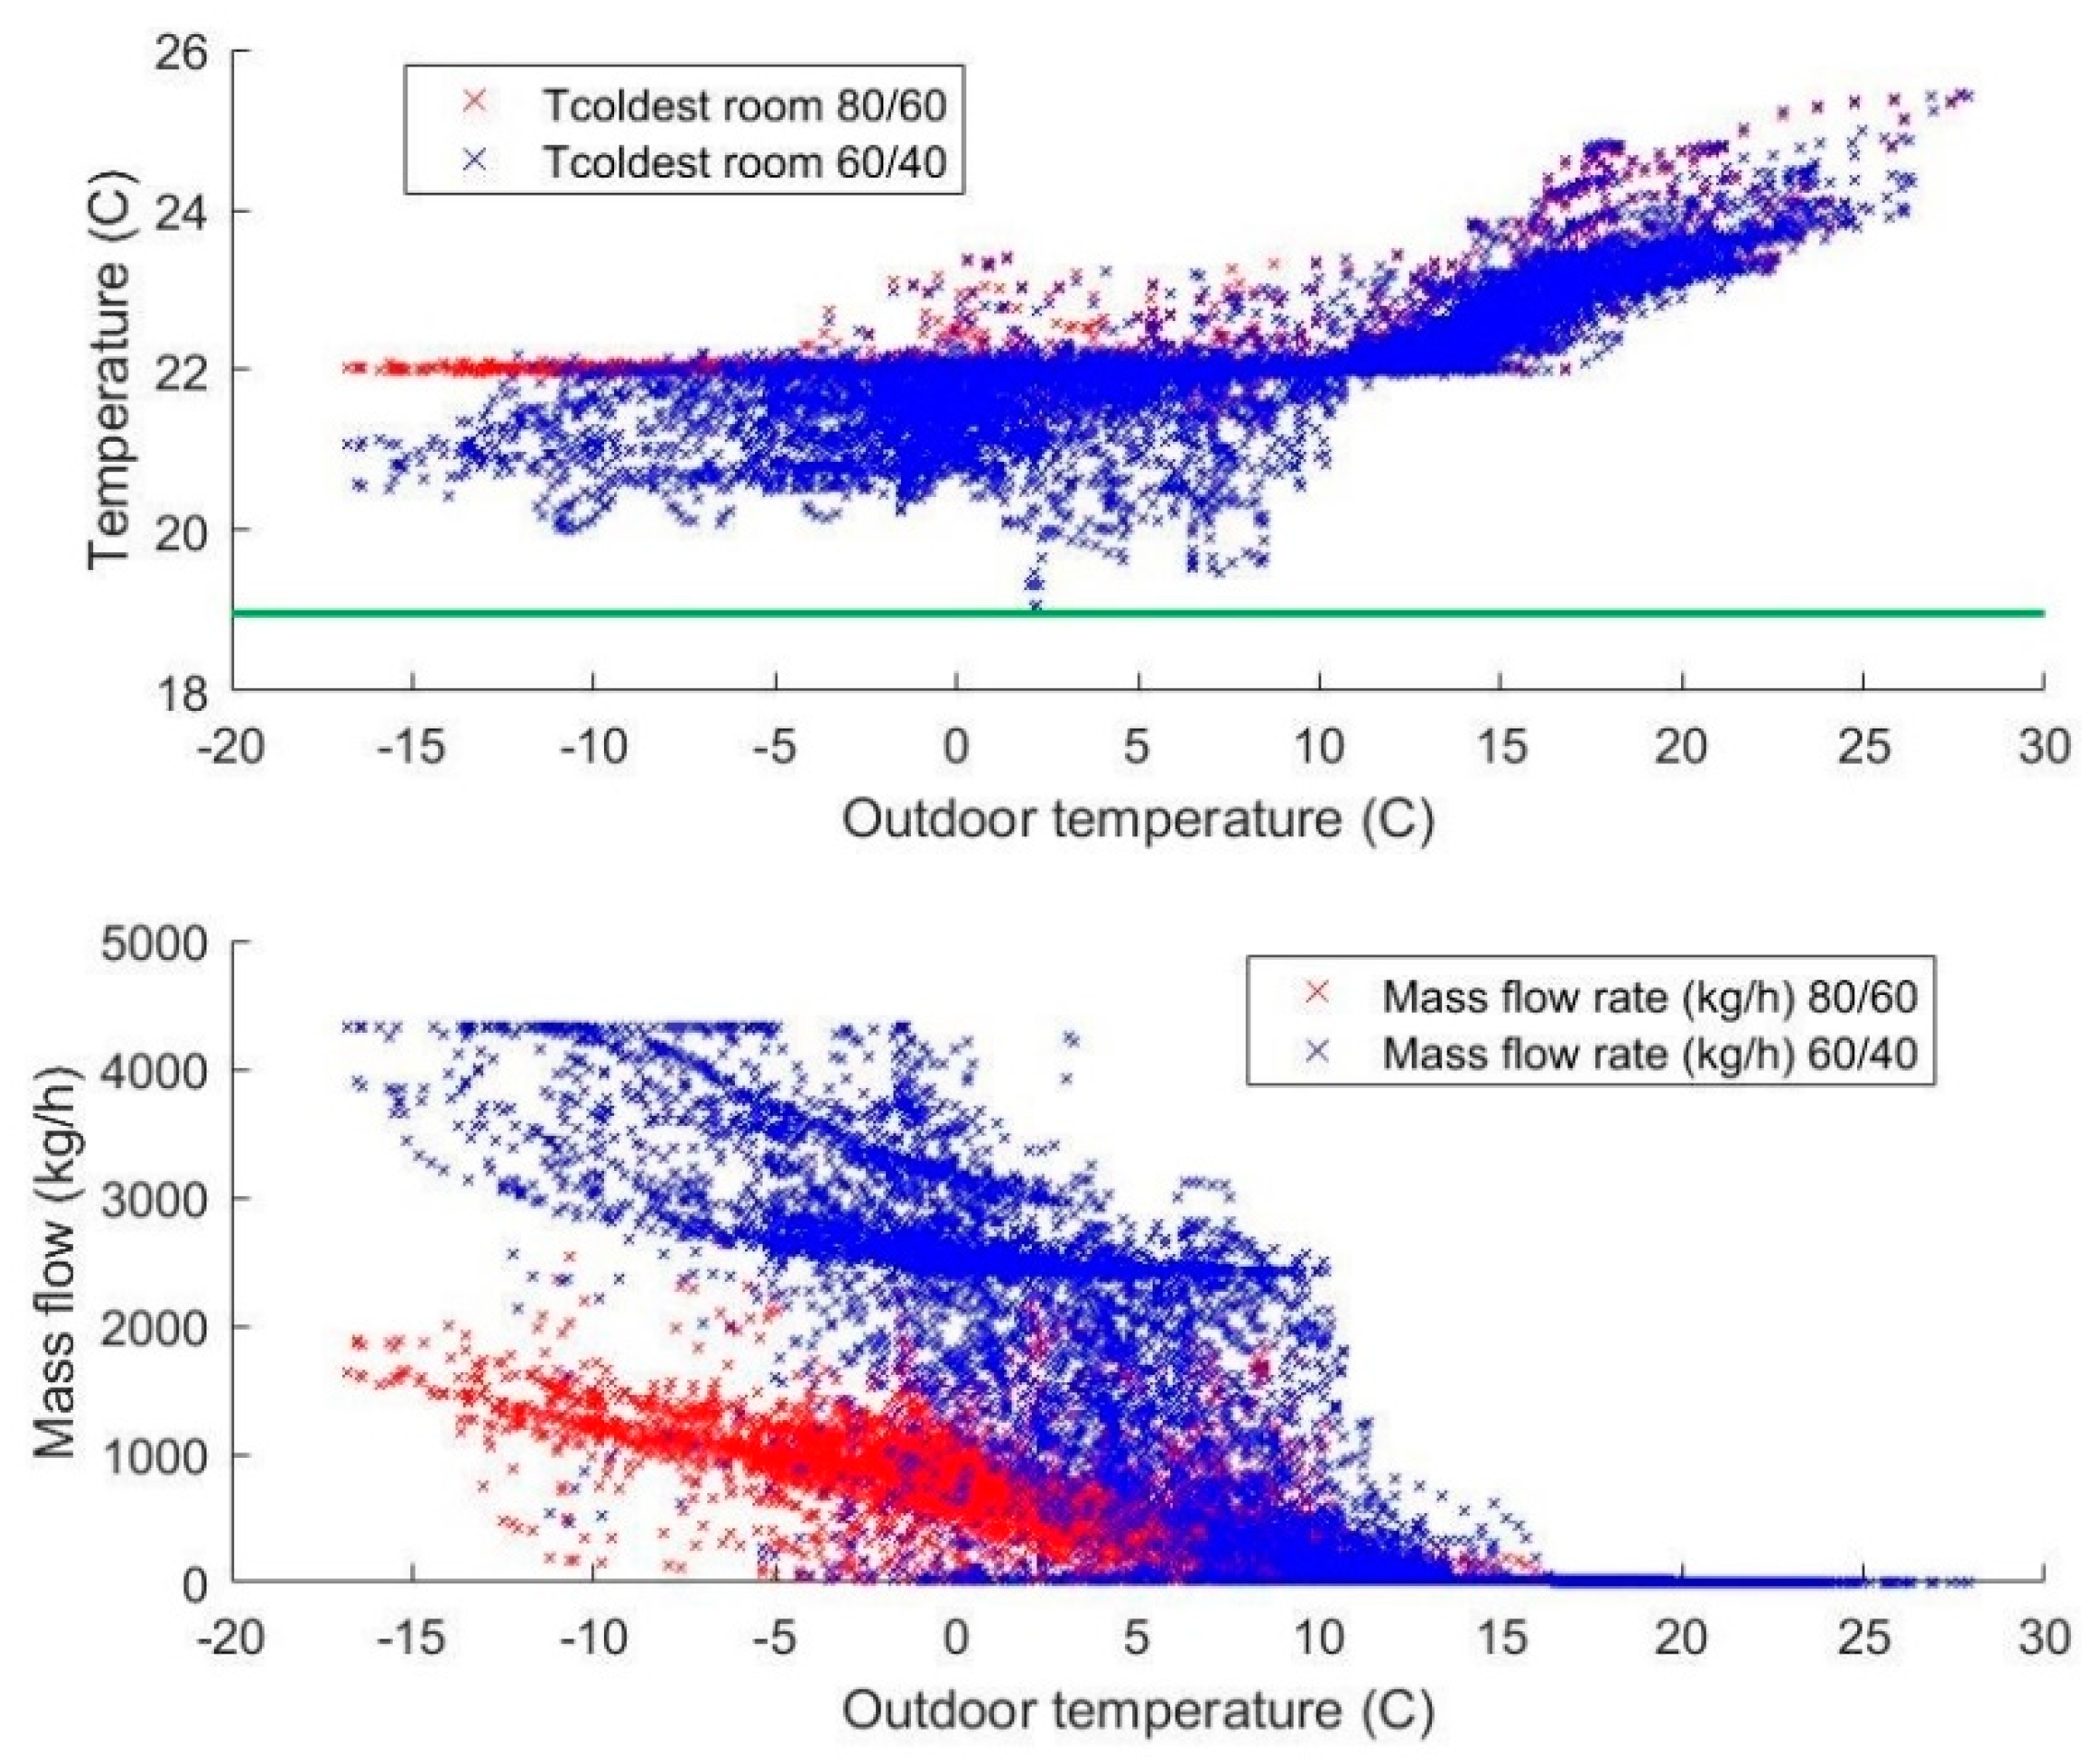
2.2.5. Heating System

Water radiators are heating the day room and bedroom, while electric floor heating is used in the bathroom as this is most common in Norway. The as-built versions of the models are based on a heating simulation with dimensioning outdoor temperature of −20 °C (Oslo-climate) and no internal heat gains. This simulation with “ideal heaters” is used to dimension the radiators and the floor heating systems, which size is kept for the other simulations. The initial system has dimensioning supply and return temperatures of 80/60 °C. All models are simulated with two different dimensioning temperature levels for the radiators typical for Norwegian buildings: 80/60 and 60/40 °C. PI-control is used for both the radiators and the floor heating system, and weather compensation curves (see Figure 2) are controlling the supply temperatures. The efficiency of the heating plant is set to 1 and water tank losses are neglected in the simulation. Distribution losses are included, whereas 10% of delivered heat to zones is considered lost. Internal loads and schedules are set according to SN TS 3031:2016 [16], aside from domestic hot water, which is not included in the models. Simulations are made according to Oslo climate (Fornebu), with EnergyPlus’ IWEC (International Weather for Energy Calculation) file.

3. Results

To assess the performance of the heating system and its ability to cover the heating demand of the building at reduced supply temperatures, dynamic simulations for an entire year were performed. The results are mainly presented for the apartment blocks from 1971–1980, as these are considered representative for the building stock between 1971–2000, which is likely to be considered for renovation at this time [19]. AB_03 also represents the worst case of the period 1971–1980 when evaluating the indoor temperature levels. Even though the bedroom has a lower setpoint temperature (18 °C) than the day room (22 °C), the day room has been chosen as “the coldest room” and constraint for comfort temperature, as people usually prefer lower temperatures in the bedroom [20]. The day room evaluated in the analysis is from the apartment at the ground floor gable wall, which has the highest heat loss and thus the lowest temperatures. Results from the other models can be found in Supplementary materials (Figures S1–S24). The results also include a comparison of the calculated space heating needs from IDA ICE and from TABULA.

3.1. Summary of Indoor Temperatures for All Age Classes

This section presents simulation results with regards to indoor thermal conditions, to see if thermal comfort is maintained when reducing the dimensioning radiator temperature level to 60/40 °C. Table 4 provides an overview of the minimum indoor air temperature and number of hours with temperatures below 19 and 20 °C in each of the models. The table shows that the indoor temperatures are only below 19 °C for the as-built version of AB_01 and AB_02. If a stricter requirement of minimum 20 °C is used, the as-built versions of AB_01–03 as well as the intermediate renovated versions of AB_01–02 are not good enough. AB_02 is clearly the worst-case, even though the buildings are newer than AB_01 and the calculated heating demand lower (see Table 5). This might be caused by higher heat loss through the windows and external walls, as the U-values for AB_02 are worse than for AB_01 for windows and walls, while better for roof and floor. For AB_01, the intermediate renovation is sufficient to ensure temperatures above 19 °C. There are also only 6 h with temperatures below 20 °C. The intermediate renovation is sufficient for AB_02 as well to surpass 19 °C, however, for this case, there are 199 h with temperatures below 20 °C.

3.2. Evaluation of AB_03 (1971–1980)

3.2.1. AB_03 As-Built

Figure 3 shows the radiator supply and return temperatures for the as-built versions of AB_03 for the two different dimensioning temperature levels: 80/60 °C (red) and 60/40 °C (blue) relative to the outdoor temperature. The supply temperatures are following the weather compensation curves, while return temperatures are calculated based on the heating demand necessary to maintain the setpoint temperature of 22 °C, the supplied water flow rate and internal heat gains. For the 80/60 °C system, the return temperatures are scattered, but a linear trend can be seen from 40 °C to 25 °C at outdoor temperatures between −15 °C and +5 °C. The 60/40 °C system shows more distinct trends, and also higher return temperatures due to increased mass flow rates. A higher return temperature could be a problem for existing district heating systems, but for new 4GDH system, this can be outweighed by the benefit of a lower supply temperature. Existing district heating systems can also solve the problem by connecting such buildings on the return pipe [21].
The top graph in Figure 4 shows the indoor temperature in the day room relative to the outdoor temperature for the two different dimensioning temperature levels. For the simulations with dimensioning temperature level 80/60 °C, the indoor temperature is maintained close to 22 °C, with 21.1 °C as the lowest value. When the radiator temperature is reduced to 60/40 °C, the indoor temperature is reduced, mostly ranging between 20–22 °C during the heating season. The lowest temperature is 19.0 °C, just inside the minimum acceptable temperature of 19 °C indicated by the green line. It is thus ok to reduce the radiator temperature level for this cohort. Whether thermal comfort is achieved will however vary from user to user, and according to their clothing and activity level. This should still be acceptable for most people, although a reduction of the indoor temperature should be avoided if possible. A peculiar result is that the lowest indoor temperature is not found at the lowest outdoor temperature (−16.8 °C), but rather between 0 and +5 °C. This is caused by large infiltration rates due to poor airtightness of the building envelope and strong winds in the climate file. As there is no active cooling system, the indoor temperatures exceed the heating setpoint at high outdoor temperatures (above 10 °C). There is also a scatter of temperatures above the heating setpoint at lower outdoor temperatures due to solar heat gain. As the indoor temperature does not exceed 26 °C, the maximum recommended indoor temperature from the Norwegian building regulations [5], this is however acceptable.
The bottom graph in Figure 4 shows the mass flow rates relative to the outdoor temperature for the two dimensioning temperature levels. The mass flow rates are fluctuating for both cases. This is due to variations in outdoor temperature, solar heat gain, schedules for internal heat gains and wind-driven infiltration. For 80/60 °C, a linear trend can be seen from around 2000 kg/h towards 0 kg/h between −15 and +15 °C. For 60/40 °C, the mass flow rates are in general higher and more scattered. For some of the coldest periods of the year, the maximum flow rate of the system is reached (around 4300 kg/h). This happens during 90 h of the year. The indoor temperature decreases whenever the heat loss from the building is higher than the supplied heat by the heating system, which is a factor of the mass flow rate, the specific heat capacity of water and the temperature difference between the water temperature in the radiators and room air temperature.

3.2.2. AB_03 Intermediate Renovated

Figure 5 and Figure 6 shows corresponding graphs as in Section 3.2.1 for the intermediate renovated versions of AB_03, where only the windows and infiltration numbers have been changed. The supply temperatures are still following the weather compensation curves, while the return temperatures are now more stable as the influence of infiltration and heat loss through windows has been reduced. Compared to the as-built version, the average return temperatures have been reduced from 27.7 to 26.4 °C for the 80/60 °C model and from 31.2 to 30.3 °C for the 60/40 °C model. For the 80/60 °C model, the indoor air temperature is maintained closer to the heating setpoint, with 21.9 °C as the lowest temperature. For the 60/40 °C model, the indoor temperatures during the heating season have increased to be scattered between 21–22 °C, and the hour with the lowest temperature has increased from 19.0 to 20.4 °C. This is a significant improvement from just upgrading the window and infiltration rates, which may already be done for this age group, as windows normally have an expected lifetime of 20–40 years [22]. The number of hours where the mass flow rate reaches the maximum limitation is now reduced from 90 to 12 h. The average mass flow rate has also been reduced from 433 kg/h to 339 kg/h for the 80/60 °C model and from 1339 kg/h to 1073 kg/h for the 60/40 °C model.

3.2.3. AB_03 Standard Renovated

Figure 7 and Figure 8 shows the graphs for the standard renovated versions of AB_03, where the entire building envelope has been improved, including a further improvement of the infiltration number. The average return temperatures are further reduced to 26.2 °C and 30.0 °C for the 80/60 °C and 60/40 °C model respectively. Reduced return temperature is important for district heating companies, as it increases the grid capacity, reduces mass flow rates and thus pumping power, reduces heat loss from the grid and enable more use of low-temperature heating sources. The lowest indoor temperature for the 60/40 °C model is now 20.9 °C, well above the recommended minimum value of 19 °C and close to the setpoint of 22 °C. The mass flow rates have been further reduced and now the maximum mass flow rate (4288 kg/h) for the 60/40 °C model has not reached the maximum limit (4309 kg/h). The average mass flow rates have also been further reduced to 320 kg/h for the 80/60 °C model and 1007 kg/h for the 60/40 °C model. The most significant reduction was however from the as-built models to the intermediate models. Reduced mass flow rates are also important for the energy efficiency of buildings and district heating grids, as it reduces the energy used for pumps.

3.3. Comparison to TABULA

It is interesting to compare the heating needs found in IDA ICE to TABULA, as TABULA is an acknowledged project in the field. The calculation methods are however considered to be more accurate with IDA ICE, and some of the input data is better adapted to Norwegian conditions. Due to these differences, the results for heating needs are not expected to be the same. The most relevant differences between IDA ICE and TABULA are summarized in Table A1 in Appendix A. Table 5 presents the calculated heating needs for the 80/60 °C models in IDA ICE and for TABULA, as well as the percentage deviation between them. For IDA ICE, “Heat from generator” includes heat to radiators with a 10% distribution loss, electric floor heating and heating battery in the air handling unit. The deviations are in general higher for the standard renovation but seem to be within an acceptable range. AB_08 is the exception, where due to low absolute values, the deviation is very high in percentages (53%). TABULA’s reduction in energy need from the AB_07 as-built version (41 kWh/(m2·year)) to the standard renovation (i.e., AB_08 of 9 kWh/(m2·year)) is however not realistic, based on the improvement measures. Another difference can be seen for the as-built versions of AB_01 and AB_02, whereas the heating need is reduced for IDA ICE (196 to 175 kWh/(m2·year)) and increases for TABULA (172 to 180 kWh/(m2·year)). As previously mentioned, the U-values for AB_02 are worse than for AB_01 for windows and walls, while better for roof and floor. Differences in the calculation methods for IDA ICE and TABULA may thus render different results.
Table 6 provides an overview of recovered heat by the air handling unit for the different age classes for both IDA ICE and TABULA. This is only relevant for AB_06–08, which have balanced ventilation systems with heat recovery (i.e., recovered heat is 0 kWh/(m2·year) for AB_01–05). The largest difference in calculated recovered heat in TABULA compared to the IDA ICE models is −77% for AB_06 as-built, corresponding to a difference of 20 kWh/(m2∙year). For the standard renovation of AB_06, the deviation is −40% corresponding to 10 kWh/(m2∙year). The as-built version of AB_07 is very close with 12% deviation, corresponding to a difference of only 4 kWh/(m2∙year). For AB_08, the significance is higher, with 44% deviation, and 12 kWh/(m2∙year) difference. For TABULA, the recovered heat is only slightly reduced from 34 to 27 kWh/(m2·year) from AB_07 to AB_08, while for IDA ICE, it is reduced from 30 to 15 kWh/(m2·year).
Although DHW is not included in the IDA ICE models, 25 kWh/(m2·year) have been added in excel files with exported results from IDA ICE to get an overview of total energy consumption (see Table 7). Hourly values are inserted according to daily schedules for DHW from SN TS 3031:2016. The energy need for DHW in TABULA including losses is 25 kWh/(m2·year) for the as-built versions, 27 kWh/(m2·year) for the standard renovated versions of AB_01–06 and 22 kWh/(m2·year) for AB_07–08. The net energy need is 15 kWh/(m2·year) for all age classes. Even though Table 5 does not compare DHW, the results for TABULA may be influenced by DHW, as TABULA considers some of the DHW heat losses being recoverable into the heated space, thereby reducing the demand on the heat generator.

4. Discussion

4.1. Domestic Hot Water

DHW has not been evaluated in the simulations. However, as district heating usually covers the heat demand of both space heating and DHW, it is considered a critical barrier for introducing 4GDH. For new buildings with low temperature heating systems such as floor heating, the minimum district heating supply temperature is not determined by the space heating demand, but rather set in order to prevent Legionella growth in the DHW systems. The Legionella bacteria naturally exist in freshwater, seawater and soils, and thrives at 32–42 °C, stagnant water and presence of biofilm and protozoa [23]. Exposure to Legionella can cause both Legionnaires’ disease and Pontiac fever, of which Legionnaires’ disease is the most serious condition.
For the purpose of introducing 4GDH, [23] investigated solutions and regulations to deal with legionella problems in six countries: Sweden, Denmark, Norway, Finland, France and Germany. As the European Union have no specific law concerning legionella, legislations in the different countries vary with regards to temperature requirements to prevent Legionella growth. In Norway, DHW has traditionally been prepared at higher temperatures than in other European countries, with a minimum system temperature of 65 °C. The other countries rather have 50 or 55 °C as minimum system temperature and 55 or 60 °C for minimum tank temperature [23]. In the period 2009–2014, incidences of legionellosis occurred most frequently (per 100,000 inhabitants) in Denmark and France, while Finland had the least incidences [24]. Fewer cases of Legionella occurred in countries with higher temperature requirements. Causal relationship between temperature and incidents was however not possible to establish in the study, as other factors such as climate, number of detected cases, ageing population and pattern of smoking and drinking could also play a role [23].
Several techniques can be utilized in DHW systems to prevent Legionella growth. These can be categorised as mechanical treatment, sterilization and alternative system design. The use of filters is an example of mechanical treatment, which is effective, but has a short lifetime and requires frequent maintenance. Examples of sterilization are chlorination, UV-light, Ozone, ionization and photocatalysis, but neither these nor filters meet the temperature requirements in regulations. Alternative system designs that fulfil the temperature requirements are based on the use of auxiliary heating devices: electric heat tracing, micro heat pump and instantaneous water heater. According to [23], there are no commercialized methods for killing legionella that are reliable, cost-efficient and long-acting, that do not require high temperature levels or short-term heating to higher temperatures. The above-mentioned solutions are also evaluated and compared in [25]. A reduction of DHW volume at the building side is also suggested as a possible measure to supply DHW in 4GDH systems [26]. Substations without storage of DHW and pipes with small volumes between the heat exchanger and taps will minimise the potential problem with Legionella bacteria. Thus, supply temperatures of 40–50 °C may be utilised for DHW, and district heating supply temperatures to buildings may be as low as 45–55 °C [7].
Although Norwegian building regulations (TEK) [5] does not provide concrete regulations on temperatures in DHW systems, the recommendation of minimum 65 °C in circulation systems is usually followed. There are however examples of installations where alternative solutions have been used to avoid Legionella. In 2015, a 4GDH system was designed and implemented in Stavanger, the first in Norway, supplying 66 residential units and 6800 m2 with heating and cooling [27]. It is based on shallow geothermal energy, solar energy and recovered waste heat, and includes energy storage for peak demand shaving. The legionella issue was solved by circulating water at 55 °C and less than three litre volume between the heat exchanger and tap on the consumer side. In Trondheim, an innovative solution using copper and silver ions was used for Legionella prevention in a large building (62,000 m2) [28]. This made it possible to reduce the temperature level from 70 to 50 °C. While the temperature reduction led to large energy savings in itself, it also made it possible to replace the electric heating system with a heat pump utilizing low temperature waste heat from a supercomputer. As a result of the two measures, the energy consumption for DHW was reduced from 188,000 kWh/year to 64,000 kWh/year, a reduction of 66%.

4.2. Acceptable Indoor Temperature

What can be defined as the acceptable indoor temperature is an issue open for discussion. The chosen evaluation method is also essential for the conclusion. If the introduction of 4GDH leads to reduced indoor temperatures, what would be deemed as “acceptable” by the users? Is there a minimum temperature that should never be surpassed, or should it be defined similarly as to TEK’s requirement for overheating? TEK allows maximum 50 h/year to be above 26 °C [5], and similar requirements could be introduced for lower temperatures during the coldest days of the year. For “light work” TEK recommends an operative temperature between 19–26 °C, whereas the minimum temperature of 19 °C should always be maintained except if there are special problems with the operation. Based on the current regulation, the indoor temperature should always be above 19 °C, and this is the chosen evaluation method for this article. Other thermal comfort parameters such as humidity or local thermal discomfort, due to vertical temperature gradient, warm/cold floor, radiation asymmetry or draft, has not been evaluated.
The current Norwegian energy calculation standard for validation of energy need for new buildings, NS 3031:2014 [29], use 21 °C as heating setpoint. For our simulations, 22 °C was chosen, as numerous studies show that users want higher temperatures. The supplementary standard SN TS 3031:2016 [16] also uses 22 °C (for residential buildings). NS-EN 15251:2007+NA 2014 (Indoor environmental input parameters for design and assessment of energy performance of buildings addressing indoor air quality, thermal environment, lighting and acoustics) [30] state that category II buildings (i.e., “Normal expectation level. Should be used in new and refurbished buildings”) should be dimensioned for 20–24 °C during wintertime. The minimum recommended temperature level (during wintertime with clothing level 1.0 clo and activity level 1.2 met in living rooms) is 20.0 °C for category II, while category I and III are 21.0 and 18.0 °C respectively. One large study [20] found that users preferred indoor temperatures between 22–24 °C in day rooms, while for bedrooms they wanted lower temperatures, preferably 15–19 °C. Based on this result, it is most important to maintain the temperature in the day rooms, as the users actually want lower temperatures than the regulation requires for the bedrooms. Multiple other studies [31,32,33] identifies 22–24 °C as the desired indoor temperature in living rooms, while inhabitants in another Norwegian project [34] chose indoor temperatures between 22–25 °C. Thus, the standard renovation is still recommended for all age classes to ensure thermal comfort for the occupants, and to improve the energy efficiency of the building stock.

4.3. Dimensioning of Heating Systems in Buildings

It has been common practice that designers oversize space heating systems to feel confident that the solutions will be reliable. Radiator sizes are also standardized, meaning calculated values could be between two standardized values, and thus rounded up. This oversizing is estimated to be around 20–25% [35], providing an opportunity to reduce the temperature levels for most parts of the year without making changes to the heating system.
Similar work was performed by [6] through IDA ICE simulations of a 122.2 m2 typical Norwegian single-family house in a terraced building built before 1980. The space heating system consisted of high temperature radiators of 80/60 °C, operated by a setpoint temperature of 21 °C, with night setback of 2 °C between 23:00 and 07:00 with a two-hour pre-heating period. The simulation procedure was similar as for this article, with improved windows and infiltration numbers as one of the renovation measures. It also included simulations with TEK 10 and passive house standard with 60/40 °C for the radiator system. Three different levels of oversizing (30%, 50% and 100%) were tested, along with different supply temperature levels (60 °C, 55 °C and 50 °C). It was found that the night setback led to an oversizing of the radiators by 5.5%, 3% and 1% for the reference building, TEK 10 building and passive house building, respectively. Further, the oversizing of 30% significantly reduced the number of hours with temperatures below the setpoint of 21 °C. The supply temperature could thus be reduced to 60 °C in the reference building, and 55 °C with improved windows and infiltration number.
Another study found that the detail level and assumptions included in a simulation model have a large impact on simulation results of studies on low-temperature heating in existing buildings [36]. It included a case study of an existing single-family house in Denmark. Different methods for simulation of the heating system temperatures were tested in IDA ICE. The simulated temperatures differed greatly from the measured temperatures when the radiator sizes were estimated based on calculations of design heat loss. Thus, it was found necessary to include actual radiator sizes in the simulations to obtain accurate results. Reasonable indoor temperature setpoints are also required to provide reasonable estimations of the heating system temperature with simulation models. Simplified standard calculation methods for heat emission from the radiators was not found to cause significant differences in the calculated heating system temperatures. Further, as the procedures for calculation of heat loss has changed many times during the 1900s, radiators in small houses may have been dimensioned by a blacksmith using a rule-of-thumb approach resulting in general oversizing.
A study on heating power and necessary supply temperatures in typical Danish single-family houses from the 1900s found that there is considerable potential for using low-temperature space heating in existing single-family houses in typical operation conditions [37]. Although radiators should not necessarily be expected to be oversized, older houses were not always found to require higher temperatures levels than newer houses. When undergone reasonable energy renovations, most of the investigated houses could be heated with a supply temperature below 50 °C for more than 97% of the year.
In cases where the heat load remains unchanged, a reduced supply temperature will lead to reduced temperature difference in the district heating grid and thereby reduced capacity due to limitations of the mass flow. For such cases, measures in substations and buildings are necessary before the supply temperature can be reduced [12]. With efficiency measures that reduce heat loss from buildings, however, the temperature levels of supplied heat to buildings can be reduced. According to [38], it is uncertain how buildings will need to be upgraded to receive lower temperature district heating, but consider it likely that most radiators installed today will be sufficient in the future.
Another factor is the dimensioning outdoor temperature (DOT), (i.e., the lowest outdoor temperature for three consecutive days) which is usually the basis for the dimensioning. For Oslo, the location used for the simulations, DOT is set to −20 °C. Due to global warming, these DOTs may no longer be representative for dimensioning of heating systems, and the temperatures are expected to continue to rise [39]. Elevated outdoor temperatures during the heating season will thus also contribute to that space heating systems are oversized. The practice of using DOT and excluding internal heat gains when dimensioning heating systems has been debated by the Norwegian HVAC industry [40]. Note that the lowest outdoor temperature for the climate file used in the simulations is −16.8 °C, so the radiators in this model are thus also oversized relative to the climate file.

5. Conclusions

Based on a heating setpoint of 22 °C and minimum acceptable indoor temperature of 19 °C from the Norwegian building regulations (TEK), it should be possible to lower the radiator supply temperature from 80 to 60 °C for apartment blocks newer than 1970. For the older age classes, simulations showed that an energy efficiency improvement corresponding to the intermediate renovation is necessary before reducing the supply temperature, in order to maintain the indoor temperature above 19 °C. However, as 19 °C is likely to be experienced slightly cold for the occupants, the standard renovation is still recommended to ensure user satisfaction and to improve the energy efficiency of the building stock. The simulations also showed a trend of reduced return temperature with increasing renovation, which is beneficial for the district heating companies.
The results also included a comparison of the calculated space heating needs in IDA ICE and from TABULA. Deviations in space heating needs are within −15 to +18%, aside from AB_08 with 53%, where the absolute values are relatively low. In general, the space heating needs from IDA ICE are higher than from TABULA, especially for the standard renovated versions. As there are several differences between the calculation methods and other input data, a deviation is expected.
It is mainly a challenge to supply 4GDH to existing apartment blocks, not new buildings. Based on the simulations of indoor air temperatures, it should be possible to introduce 4GDH in most Norwegian apartment blocks. However, there may still be unresolved issues on the district heating side, which has not been evaluated in this report. There is also the case of how DHW heating should be supplied. Before implementing 4GDH in existing buildings, reduction of the supply temperature should be tested in real systems, in order to verify the simulation results through field measurements.

Supplementary Materials

The following are available online at https://www.mdpi.com/1996-1073/12/5/941/s1, Table S1. AB_01 (before 1956): Construction and respective U-values for the different components of the initial building and for the standard renovation, Table S2. AB_02 (1956–1970): Construction and respective U-values for the different components of the initial building and for the standard renovation, Table S3. AB_03 (1971–1980): Construction and respective U-values for the different components of the initial building and for the standard renovation, Table S4. AB_04 (1981–1990): Construction and respective U-values for the different components of the initial building and for the standard renovation, Table S5. AB_05 (1991–2000): Construction and respective U-values for the different components of the initial building and for the standard renovation, Table S6. AB_06 (2001–2010): Construction and respective U-values for the different components of the initial building and for the standard renovation, Table S7. AB_07 (2010–2020): Construction and respective U-values for the different components of the initial building, Table S8. AB_08 (after 2020): Construction and respective U-values for the different components of the initial building, Figure S1. Radiator supply and return temperatures relative to outdoor temperature for AB_01 as-built, Figure S2. Temperature in the coldest room (top) and mass flow rates (bottom) relative to the outdoor temperature for AB_01 as-built, Figure S3. Radiator supply and return temperatures relative to outdoor temperature for AB_01 intermediate renovated, Figure S4. Temperature in the coldest room (top) and mass flow rates (bottom) relative to the outdoor temperature for AB_01 intermediate renovated, Figure S5. Radiator supply and return temperatures relative to outdoor temperature for AB_01 standard renovated, Figure S6. Temperature in the coldest room (top) and mass flow rates (bottom) relative to the outdoor temperature for AB_01 standard renovated, Figure S7. Radiator supply and return temperatures relative to outdoor temperature for AB_02 as-built, Figure S8. Temperature in the coldest room (top) and mass flow rates (bottom) relative to the outdoor temperature for AB_02 as-built, Figure S9. Radiator supply and return temperatures relative to outdoor temperature for AB_02 intermediate renovated, Figure S10. Temperature in the coldest room (top) and mass flow rates (bottom) relative to the outdoor temperature for AB_02 intermediate renovated, Figure S11. Radiator supply and return temperatures relative to outdoor temperature for AB_02 standard renovated, Figure S12. Temperature in the coldest room (top) and mass flow rates (bottom) relative to the outdoor temperature for AB_02 standard renovated, Figure S13. Radiator supply and return temperatures relative to outdoor temperature for AB_06 as-built, Figure S14. Temperature in the coldest room (top) and mass flow rates (bottom) relative to the outdoor temperature for AB_06 as-built, Figure S15. Radiator supply and return temperatures relative to outdoor temperature for AB_06 intermediate renovated, Figure S16. Temperature in the coldest room (top) and mass flow rates (bottom) relative to the outdoor temperature for AB_06 intermediate renovated, Figure S17. Radiator supply and return temperatures relative to outdoor temperature for AB_06 standard renovated, Figure S18. Temperature in the coldest room (top) and mass flow rates (bottom) relative to the outdoor temperature for AB_06 standard renovated, Figure S19. Radiator supply and return temperatures relative to outdoor temperature for AB_07 as-built, Figure S20. Temperature in the coldest room (top) and mass flow rates (bottom) relative to the outdoor temperature for AB_07 as-built, Figure S21. Radiator supply and return temperatures relative to outdoor temperature for AB_07 intermediate renovated, Figure S22. Temperature in the coldest room (top) and mass flow rates (bottom) relative to the outdoor temperature for AB_07 intermediate renovated, Figure S23. Radiator supply and return temperatures relative to outdoor temperature for AB_08 as-built, Figure S24. Temperature in the coldest room (top) and mass flow rates (bottom) relative to the outdoor temperature for AB_08 as-built.

Author Contributions

Conceptualization, I.S.; Formal analysis, Ø.R.; Funding acquisition, I.S.; Investigation, Ø.R.; Methodology, Ø.R., N.H.S. and I.S.; Project administration, I.S.; Supervision, I.S.; Validation, Ø.R., N.H.S. and I.S.; Visualization, Ø.R.; Writing—original draft, Ø.R.; Writing—review & editing, Ø.R., N.H.S. and I.S.

Funding

The authors gratefully acknowledge the support from the Research Council of Norway (project code: 257660) and several partners through the Research Centre on Zero Emission Neighbourhoods in Smart Cities (FME ZEN).

Acknowledgments

This paper has been written within the Research Centre on Zero Emission Neighbourhoods in Smart Cities (FME ZEN). The authors gratefully acknowledge the support from the ZEN partners and the Research Council of Norway.

Conflicts of Interest

The authors declare no conflict of interest. The funders had no role in the design of the study; in the collection, analyses, or interpretation of data; in the writing of the manuscript, or in the decision to publish the results.

Appendix A

Table A1. Differences between methods and input data for IDA ICE and TABULA.
ParameterIDA ICETABULA [14,41]
Calculation methodHourly dynamicMonthly stationary (heating degree days)
Climatic dataIWEC file with hourly records for an artificial year created from twelve representative months from the period 1982–1999. Reference to NS 3031:2007 (Calculation of energy performance of buildings—Method and data), where Appendix M has monthly climatic data.
Floor areaAB_01: 557 m2
AB_02: 1115 m2
AB_03–08: 1672 m2
AB_01: 568 m2
AB_02: 1056 m2
AB_03–07: 1608–1824 m2
Room height2.7 m2.5 m
Internal heat gainsLighting 11.4 kWh/(m2∙year)
Equipment 10.5 kWh/(m2 year) *
Persons 13.1 kWh/(m2∙year)
DHW 0.0 kWh/(m2∙year)
Total: 35 kWh/(m2∙year)
Hourly schedules.
Equation for internal heat gains based on 3 W/m2 for internal heat sources, the length of the heating season (days), reference area for the building and a factor of 0.024. Total: 17 kWh/(m2∙year) Some heat from distribution and storage systems for space heating and DHW is also considered recovered.
Ventilation ratesBedroom 0.68 ACH supply
Bathroom 1.9 ACH extract
Day room 0.46 ACH supply, 0.43 ACH extract
Average air change rate during heating season, ηair,use = 0.4 h−1
Infiltration rates (at 50 Pa)Ranging from 0.6 to 6 ACH according to Table 33 ACH for all versions
Heating setpointArea-weighted average: 20.7 °C (bedroom 18 °C, day room 22 °C, bathroom 24 °C)20 °C
Thermal bridgesNormalized thermal bridge value ranging from 0.03–0.08 W/(m2∙K).0.05 or 0.1 W/(m2∙K) added to the heat transfer coefficient by transmission. (Exceptions: AB_01 var1 and AB_07 var2 = 0 W/(m2∙K) and AB_01 var2 = 0.15 W/(m2∙K))
* Note that the electricity need for equipment is 17.5 kWh/(m2∙year), and lost heat through drains and outlets from washing machines, dishwashers and dryers leads to the lower internal heat gain.

References

  1. Directive 2010/31/EU of the European Parliament and of the Council of 19 May 2010 on the Energy Performance of Building (Recast). Available online: https://eur-lex.europa.eu/LexUriServ/LexUriServ.do?uri=OJ:L:2010:153:0013:0035:EN:PDF (accessed on 3 December 2018).
  2. Slik Kutter vi Energibruken i Bygg—Virkemidler for Energieffektivisering Som tar oss til 10 TWh. Available online: https://nelfo.no/Documents/NELFO/Bibliotek/Rapporter/Energisparing%20i%20bygg.pdf (accessed on 3 December 2018).
  3. Investeringer i Strømnettet 2015–2025. Available online: https://www.energinorge.no/contentassets/fbffb0222cb14261a02ea1310e6eb710/investeringer-i-stromnettet-2015-2025.pdf (accessed on 3 December 2018).
  4. Nord, N.; Løve Nielsen, E.K.; Kauko, H.; Tereshchenko, T. Challenges and potentials for low-temperature district heating implementation in Norway. Energy 2018, 151, 889–902. [Google Scholar] [CrossRef]
  5. Byggteknisk Forskrift (TEK 17). Available online: https://dibk.no/byggereglene/byggteknisk-forskrift-tek17/ (accessed on 3 December 2018).
  6. Nord, N.; Ingebretsen, M.E.; Tryggestad, I.S. Possibilities for Transition of Existing Residential Buildings to Low Temperature District Heating System in Norway. In Proceedings of the 12th REHVA World Congress, Aalborg, Denmark, 22–25 May 2016. [Google Scholar]
  7. Lund, H.; Werner, S.; Wiltshire, R.; Svendsen, S.; Thorsen, J.E.; Hvelplund, F.; Vad Mathiesen, B. 4th Generation District Heating (4GDH): Integrating smart thermal grids into future sustainable energy systems. Energy 2014, 68, 1–11. [Google Scholar] [CrossRef]
  8. Connolly, D.; Lund, H.; Mathiesen, B.V.; Werner, S.; Möller, B.; Persson, U.; Boermans, T.; Trier, D.; Østergaard, P.A.; Nielsen, S. Heat Roadmap Europe: Combining district heating with heat savings to decarbonise the EU energy system. Energy Policy 2014, 65, 475–489. [Google Scholar] [CrossRef]
  9. Brand, M.; Svendsen, S. Renewable-based low-temperature district heating for existing buildings in various stages of refurbishment. Energy 2013, 62, 311–319. [Google Scholar] [CrossRef]
  10. Bygg for Framtida. Miljøhandlingsplan for Bolig- og Byggsektoren 2009–2012. Available online: https://www.regjeringen.no/globalassets/upload/krd/vedlegg/boby/handlingsplaner/h-2237_web.pdf (accessed on 3 December 2018).
  11. SSB, Boliger Etter Bygningstype, Bygningsår og år. Available online: https://www.ssb.no/statbank/table/06266/ (accessed on 3 December 2018).
  12. Walnum, H.T.; Fredriksen, E. Thermal Energy Systems in ZEN: Review of Technologies Relevant for ZEN Pilots; ZEN Report No. 3; ZEN Research Centre: Trondheim, Norway, 2018. [Google Scholar]
  13. Rønneseth, Ø; Sartori, I. Possibilities for Supplying Norwegian Apartment Blocks with 4th Generation District Heating; ZEN Report No. 8; ZEN Research Centre: Trondheim, Norway, 2018. [Google Scholar]
  14. TABULA Master File. Available online: http://episcope.eu/communication/download/ (accessed on 3 December 2018).
  15. Praktisk Veileder for Energimerking. Available online: https://www.energimerking.no/download?objectPath=/upload_images%2FE87FEE3272F4450AA49D6E6C10CBF472.pdf (accessed on 03 December 2018).
  16. SN/TS 3031:2016 Energy Performance of Buildings—Calculation of Energy Needs and Energy Supply. Available online: https://www.standard.no/no/Nettbutikk/produktkatalogen/Produktpresentasjon/?ProductID=859500 (accessed on 3 December 2018).
  17. Byggteknisk Forskrift (TEK10). Available online: https://dibk.no/byggeregler/tek/ (accessed on 3 December 2018).
  18. NS 3700:2013 Criteria for Passive Houses and Low Energy Buildings—Residential Buildings. Available online: https://www.standard.no/nettbutikk/produktkatalogen/produktpresentasjon/?ProductID=636902 (accessed on 3 December 2018).
  19. Sandberg, N.; Sartori, I.; Brattebø, H. Using a dynamic segmented model to examine future renovation activities in the Norwegian dwelling stock. Energy Build. 2014, 82, 287–295. [Google Scholar] [CrossRef]
  20. Evaluering av Boliger Med Lavt Energibehov (EBLE)—Samlerapport, in SINTEF Fag 43. Available online: https://www.sintefbok.no/book/index/1126/evaluering_av_boliger_med_lavt_energibehov_eble_samlerapport (accessed on 3 December 2018).
  21. Ianakiev, A.; Cui, J.M.; Garbett, S.; Filer, A. Innovative System for Delivery of Low Temperature District Heating. Int. J. Sustain. Energy Plann. Manag. 2017, 12, 19–28. [Google Scholar]
  22. Intervaller for Vedlikehold og Utskifting av Bygningsdeler. Available online: https://www.byggforsk.no/dokument/3312/intervaller_for_vedlikehold_og_utskifting_av_bygningsdeler (accessed on 3 December 2018).
  23. Sernhed, K.; Johansson Kallioniemi, P.O.; Ottosson, K.; Carlsson, L.; Wollerstrand, J. Solutions and regulations to deal with legionella problems in district heating systems. In Proceedings of the 4th International Conference on Smart Energy Systems and 4th Generation District Heating, Aalborg, Denmark, 13–14 November 2018. [Google Scholar]
  24. Overcoming Issues with Legionella in DHW in LTDH Systems. Available online: http://lup.lub.lu.se/luur/download?func=downloadFile&recordOId=8945437&fileOId=8952668 (accessed on 3 December 2018).
  25. Yang, X.; Li, H.; Svendsen, S. Alternative solutions for inhibiting Legionella in domestic hot water systems based on low-temperature district heating. Build. Serv. Eng. Res. Technol. 2015, 37, 468–478. [Google Scholar] [CrossRef] [Green Version]
  26. Recommendations for Prevention of Legionella Growth in Installations Inside Buildings Conveying Water for Human Consumption. Available online: https://infostore.saiglobal.com/preview/is/en/2012/srcen-tr16355-2012.pdf?sku=1537147 (accessed on 3 December 2018).
  27. 4th Generation Heating System Using Geothermal Energy as the Main Source. Available online: http://www.zenergi.no/images/ultra_lavtemperert/4_gen_DH_Paper_draft_V4.pdf (accessed on 3 December 2018).
  28. Behovsstyrt Sanitæranlegg Kombinert Med Energieffektiv Drift. Available online: https://www.enova.no/download/?objectPath=upload_images/9FC727088C9E403BA1F223DDE9C9873A.pdf&filename=9_%20Apurgo%20og%20NTNU%20180504.pdf (accessed on 3 December 2018).
  29. NS 3031:2014 Calculation of Energy Performance of Buildings—Method and Data. Available online: https://www.standard.no/no/Nettbutikk/produktkatalogen/Produktpresentasjon/?ProductID=702386 (accessed on 3 December 2018).
  30. NS-EN 15251:2007+NA:2014. Indoor Environmental Input Parameters for Design and Assessment of Energy Performance of Buildings Addressing Indoor Air Quality, Thermal Environment, Lighting and Acoustics. Available online: https://www.standard.no/nettbutikk/produktkatalogen/produktpresentasjon/?ProductID=703200 (accessed on 3 December 2018).
  31. Berge, M.; Mathisen, H.M. Perceived and measured indoor climate conditions in high-performance residential buildings. Energy Build. 2016, 127, 1057–1073. [Google Scholar] [CrossRef]
  32. Berge, M. Indoor Climate Quality in High-Performance Dwellings: An Exploration of Measured, Perceived, and Desired Conditions; NTNU Grafisk senter: Trondheim, Norway, 2016. [Google Scholar]
  33. Georges, L.; Alonso, M.J.; Woods, R.; Wen, K.; Håheim, F.; Liu, P.; Berge, M.; Thalfeldt, M. Evaluation of Simplified Space-Heating Hydronic Distribution for Norwegian Passive Houses; SINTEF Akademisk Forlag: Oslo, Norway, 2017. [Google Scholar]
  34. Halvorsen, B.; Dalen, H.M. Ta Hjemmetempen; Statistisk Sentralbyrå: Oslo-Kongsvinger, Norway, 2013. [Google Scholar]
  35. Grindal, A.; Børresen, B.A. Vannbåren Energi, Vannfordeling—Regulering; Statsbygg: Oslo, Norway, 1998. [Google Scholar]
  36. Østergaard, D.S.; Svendsen, S. Case study of low-temperature heating in an existing single-family house—A test of methods for simulation of heating system temperatures. Energy Build. 2016, 126, 535–544. [Google Scholar] [CrossRef] [Green Version]
  37. Østergaard, D.S.; Svendsen, S. Theoretical overview of heating power and necessary heating supply temperatures in typical Danish single-family houses from the 1900s. Energy Build. 2016, 126, 375–383. [Google Scholar] [CrossRef] [Green Version]
  38. Future Green Buildings—A Key to Cost-Effective Sustainable Energy Systems. Available online: http://vbn.aau.dk/files/234005850/Future_Green_Buildings_A_key_to_cost_effective_sustainable_energy_systems_ENGLISH.pdf (accessed on 3 December 2018).
  39. Tajet, H.T.T.; Hygen, H.O.; Kvande, T. Providing climate indices for construction industry. In Proceedings of the 18th EMS Annual Meeting: European Conference for Applied Meteorology and Climatology, Budapest, Hungary, 3–7 September 2018. [Google Scholar]
  40. Prosjektveileder Forenklet Anlegg for Vannbåren Oppvarming av Boliger. DiBK—Direktoratet for Byggkvalitet. 2009. Available online: https://www.husbanken.no/bolig-og-byggkvalitet/forenklet-anlegg-for-vannbaren-oppvarming/ (accessed on 3 December 2018).
  41. TABULA Calculation Method—Energy Use for Heating and Domestic Hot Water. Available online: http://episcope.eu/fileadmin/tabula/public/docs/report/TABULA_CommonCalculationMethod.pdf (accessed on 3 December 2018).
Figure 1. Left: Model from 3D-view IDA ICE and right: floor plan for two apartments, each with three zones.
Energies 12 00941 g001
Figure 2. Weather compensation curves for the supply temperature of the two radiator systems with dimensioning temperature levels 80/60 and 60/40 °C.
Energies 12 00941 g002
Figure 3. Radiator supply and return temperatures relative to outdoor temperature for AB_03 as-built.
Energies 12 00941 g003
Figure 4. Temperature in the coldest room (top) and mass flow rates (bottom) relative to the outdoor temperature for AB_03 as-built.
Energies 12 00941 g004
Figure 5. Radiator supply and return temperatures relative to outdoor temperature for AB_03 intermediate renovated.
Energies 12 00941 g005
Figure 6. Temperature in the coldest room (top) and mass flow rates (bottom) relative to the outdoor temperature for AB_03 intermediate renovated.
Energies 12 00941 g006
Figure 7. Radiator supply and return temperatures relative to outdoor temperature for AB_03 standard renovated.
Energies 12 00941 g007
Figure 8. Temperature in the coldest room (top) and mass flow rates (bottom) relative to the outdoor temperature for AB_03 standard renovated.
Energies 12 00941 g008
Table 1. Overview of the modelled age classes and their geometrical properties.
CohortConstruction PeriodNumber of Floors/ApartmentsFloor Area (m2)Window/Envelope
AB_01Before 19564/855714.1%
AB_021956–19704/16111516.5%
AB_031971–19804/24167217.5%
AB_041981–19904/24167217.5%
AB_051991–20004/24167217.5%
AB_062001–20104/24167217.5%
AB_072010–20204/24167217.5%
AB_08After 20204/24167217.5%
Table 2. Construction and respective U-values for the building components of the initial building and standard renovation for AB_03 (1971–1980).
ComponentDescription Initial BuiltU-Value Initial Built (W/(m2∙K))Description Standard RenovationU-Value Standard Renovation (W/(m2∙K))
RoofConcrete slab, 180 mm mineral wool, compact roof.0.2170 mm additional mineral wool (250 mm total)0.14
External wallFrame-built timber wall, 100 mm mineral wool, 50 mm thermal bridge barrier0.3450 mm additional mineral wool on the outside + brick veneer0.18
WindowsDouble-glazed window, regular glass, air-filled2.60Double-glazed window, one LE-coating, air-filled1.90
FloorConcrete floor, 100 mm mineral wool, unheated basement0.3150 mm additional min wool in cold basement0.26
Table 3. Chosen infiltration rates in air changes per hour (ACH) at 50 Pa for the different age classes and energy standards.
CohortConstruction PeriodAs-BuiltIntermediate RenovationStandard Renovation
AB_01Before 1956643
AB_021956–1970643
AB_031971–1980532
AB_041981–199044 12
AB_051991–2000321.5
AB_062001–2010321.5
AB_072010–20201 20.8-
AB_08After 20200.6--
1 The windows are not changed during the standard renovation for AB_04. 2 Chosen as an intermediate value between the minimum demand (1.5) and energy measure value (0.6).
Table 4. Minimum indoor air temperature and number of hours with temperatures below 19 and 20 °C for the different models with temperature level 60/40 °C, collected from day room at ground floor gable wall.
CohortConstruction PeriodEnergy StandardTin,min (°C)#h < 19 °C#h < 20 °C
AB_01Before 1956As-built18.67337
Intermediate renovation19.706
Std. renovation20.700
AB_021956–1970As-built18.0197867
Intermediate renovation19.20199
Std. renovation20.600
AB_031971–1980As-built19.0036
Intermediate renovation20.400
Std. renovation20.900
AB_062001–2010As-built20.400
Intermediate renovation21.100
Std. renovation21.500
AB_072010–2020As-built21.200
Intermediate renovation21.700
AB_08After 2020As-built21.900
#h is number of hours.
Table 5. Heating needs for radiators, electric floor heating and heating battery in kWh/(m2·year) for IDA ICE and TABULA, and relative deviation between the calculated heating needs.
CohortAs-BuiltStandard Renovation
IDA ICE, Heat from GeneratorTABULA, Generated Heat Heating SystemDeviationIDA ICE, Heat from GeneratorTABULA, Generated Heat Heating SystemDeviation
AB_0119617212%12911213%
AB_02175180−3%1129416%
AB_031081017%897318%
AB_0495905%897417%
AB_051049311%887416%
AB_065256−9%4043−7%
AB_073641−15%---
AB_0819953%---
Table 6. Comparison of recovered heat from air handling unit (kWh/(m2∙year)) for AB_06–08. AB_01–05 does not have heat recovery.
CohortAs-BuiltStandard Renovation
IDA ICETABULADeviationIDA ICETABULADeviation
AB_064626−77%3525−40%
AB_07303412%---
AB_08152744%---
Table 7. Total energy need from 80/60 °C models in IDA ICE, including electricity and 25 kWh/(m2·year) DHW added after the simulations.
CohortBuilding YearAs-Built (kWh/(m2·year))Standard Renovation (kWh/(m2·year))
AB_01Before 1956250183
AB_021956–1970230166
AB_031971–1980162143
AB_041981–1990149144
AB_051991–2000158142
AB_062001–2010113102
AB_072010–202094-
AB_08After 202078-

