Article

Numerical Analysis of the Influence of Design Parameters on the Efficiency of an OWC Axial Impulse Turbine for Wave Energy Conversion

Department of Energy and Power Engineering, Tsinghua University, Beijing 100084, China
*
Author to whom correspondence should be addressed.
Energies 2019, 12(5), 939; https://doi.org/10.3390/en12050939
Submission received: 22 January 2019 / Revised: 1 March 2019 / Accepted: 7 March 2019 / Published: 12 March 2019
(This article belongs to the Section A3: Wind, Wave and Tidal Energy)

Abstract

:
Oscillating water column (OWC) axial impulse turbines permit the conversion of wave energy into electrical power. Unlike other hydropower units with a mature and well established technology, such turbines have been recently developed, there are still few prototypes operating and therefore there is a large space for optimizing its design. Many recent studies focus on the improvement of the efficiency and transient characteristics by means of experimentation and also simulation techniques. In the present paper we use a 3D numerical simulation model (computational fluid dynamics model with ANSYS-Fluent 18) to analyze the influence of different geometrical parameters on the efficiency of the turbine, which have been less discussed yet. A reference configuration case has been used to validate our simulation model by comparing it with previous experimental results. Then, parametric variations in the guide vane number and type, gaps between the rotating and stationary part and hub to tip ratio have been introduced in the model to discuss the influence of these effects. It is found that some of these parameters have an important influence on the efficiency of the turbine and therefore, the results presented in this paper can help to optimize future designs of OWC impulse turbines.

1. Introduction

Oscillating water column (OWC) is a method to transform wave energy of the seas and oceans [1,2] into useful energy, such as electricity. Due to wave motion, a water column oscillates driving an oscillating air column. Such a column is used as pneumatic energy (bi-directional flow), which is transformed in mechanical energy by means of an air turbine rotating in a single direction. The mechanical energy can be used then to drive a generator that will produce electricity. One of the first prototype turbines operating based on the abovementioned principle is the Wells turbine [3,4]. More recently Setoguchi et al. [5] developed an axial impulse turbine with self-pitch controlled guide vanes [6] and with fixed guide vanes [7]. Together with the Wells and axial impulse turbines, the bi-radial turbines have been also recently used to transform OWC energy [8], which seem to be more efficient than the two previous ones. Advantages and disadvantages of the Wells and axial impulse turbines have been discussed by Falcao [9]. Further devices using the energy of the waves have been recently discussed [10,11].
In this paper we will analyze the axial flow impulse turbines with fixed guide vanes, which seems to be more convenient with respect to the self-pitch controlled guide vanes due to the reduced maintenance costs in real prototypes [12,13]. Such turbines are self-rectifying as the torque and rotating direction have the same direction regardless of the air flow direction. A view of this turbine can be seen in Figure 1. The turbine consists of a rotor with several blades. Before and after the rotor there are a set of guide vanes, which act as a distributor and diffuser (this role is interchangeable depending on the flow direction). The working flow of such turbines is the air driven by the OWC and therefore, the air flow passing through these turbines is highly stochastic. Nevertheless, in reduced scale model testing typical flows imposed for evaluating the efficiency and the transient characteristics of such turbine are steady flow, sinusoidal flow and irregular flow, which can be reproduced according to different reference norms and conventions (see for example [7]). In the recent years, the influence of many geometrical and flow parameters on the efficiency and transient characteristics of the turbine have been analyzed. In order to briefly explain the main parameters investigated, let us reference Figure 1.
Regarding the guide vane design, different geometrical parameters have been investigated, namely the length of the guide vane l g , the curvature radius R a , the camber angle δ and the guide vane angle θ . In the work of Maeda et al. [7] and Setoguchi et al. [5] the effect of the guide vane angle θ on the efficiency of the turbine is discussed, showing that this parameter that greatly affects the performance. The results are obtained with a test rig and steady flow. It is also interesting to notice the effect of this angle on the transient characteristics under sinusoidal flow conditions. For smaller angles, the turbine accelerates faster. Effects of the ratio S g / l g ,   δ on the efficiency of the turbine are also discussed in [5]. Also in the same study a comparison of a plate guide vane and an airfoil guide vane is performed, obtaining more efficiency in the case of the plate guide vane. It has to be noticed that this relative early studies are mainly experimental. With the development of the computational fluid dynamics (CFD) new and more complex geometries have been investigated. For example, Thakker and Dhanasekaran [12] investigate the losses on the guide vanes. They tested several 2D and 3D CFD models concluding that 21% of the pressure losses occur on the downstream guide vanes. The same authors in [14] experimentally demonstrate that three dimensional guide vane shapes are superior in terms of efficiency than the classical two dimensional guide vane shapes, which have a recirculation zone. Finally, the gap between the guide vanes and the rotor G , which can be expressed as the ratio G / l r has been also analyzed in [5]. According to that study (reference to Figure 26 in [5]), there is not a clear relationship between such ratio and the efficiency (at least for G / l r < 0.8 ).
When analyzing the rotor design one of the most important parameters analyzed is the tip clearance [15,16]. In Figure 1, the yellow cover represents the stator with diameter D s and the radial gap of the stator to the tip diameter of the rotor D t is T. Liu et al. [15] used the RNG model to validate reference experimental results and perform further simulations to analyze the tip clearance effect (expressed as 2 T D t ). They concluded that the smaller this ratio is, the higher the efficiency is for all flow coefficients. In the work of Thakker and Dhanasekaran [16] the turbulence model k ε is used to analyze the same effect. In this case they also found that for smaller tip clearances the efficiency is also higher although for values of T / l r smaller than 0.25% no improvement of the performance is observed. The hub to tip ratio ( ν = D h / D t ) plays also an important role in the efficiency and transient characteristics of the unit as reported in previous studies [5,17]. According to the experimental results of [5], a turbine with a design value of ν = 0.7 shows a better performance than turbines with higher ratios. The work of Setoguchi et al. [17] extends the results presented in [5] related to the tip-hub ratio, showing that ν = 0.7 is also better than lower values. Therefore, from both studies it can be concluded that ν 0.7 seems to be the optimum ratio for the efficiency. Nevertheless, in this last study the number of blades is changed simultaneously with v and therefore it may be difficult to evaluate the single influence of this parameter. From the same study, it seems that there is no influence of v in the starting characteristics. Further parameters of the rotor design such as the profile of the blades (elliptic vs simple), inlet & outlet blade angles β, rotor space for the flow passage ( t a / S r ), rotor space ( S r / l r ) are also discussed in [5]. Finally effects of the Reynolds number on the efficiency and transient characteristics of the turbine have been determined in [17,18]. The work in [17] found that for Reynolds number higher than 4 × 10 4 there is no improvement on the efficiency although Liu et al. [18] found that the efficiency still increase until values close to 6 × 10 4 .
Most of the abovementioned studies have been experimentally performed. Nevertheless, in the last years due to the increase of computational capabilities some effects have been analyzed also numerical with CFD techniques. For example, CFD techniques combined with hybrid genetic algorithms methods have been recently used to optimized the design of the runner in an automatic way (see the work of Badhurshah et al. [19,20]). Liu et al. [21] validates the capabilities of CFD techniques to predict the transient response of the turbine by comparing its results with the experimental results of Setoguchi [5]. Generally, CFD models are validated with an experimental reference case and then can be used for further parameter analyses in a much cheaper way and less time that would be used performing experimentation.
In this paper we determine the influence of relevant design parameters on the steady flow efficiency of an impulse turbine for OWC, whose performance has been experimentally analyzed in the past. A numerical CFD model based on the geometrical characteristics of the turbine has been generated. The model is validated by comparing numerical and previous experimental results obtained for one configuration with reference design parameters. Then, in order to determine the influence of several design parameters, we compare the present numerical results with those ones obtained with experimentation and discuss possible discrepancy sources. Furthermore, we evaluate the influence of the guide vane number, which has not been previously discussed.

2. Numerical Setup

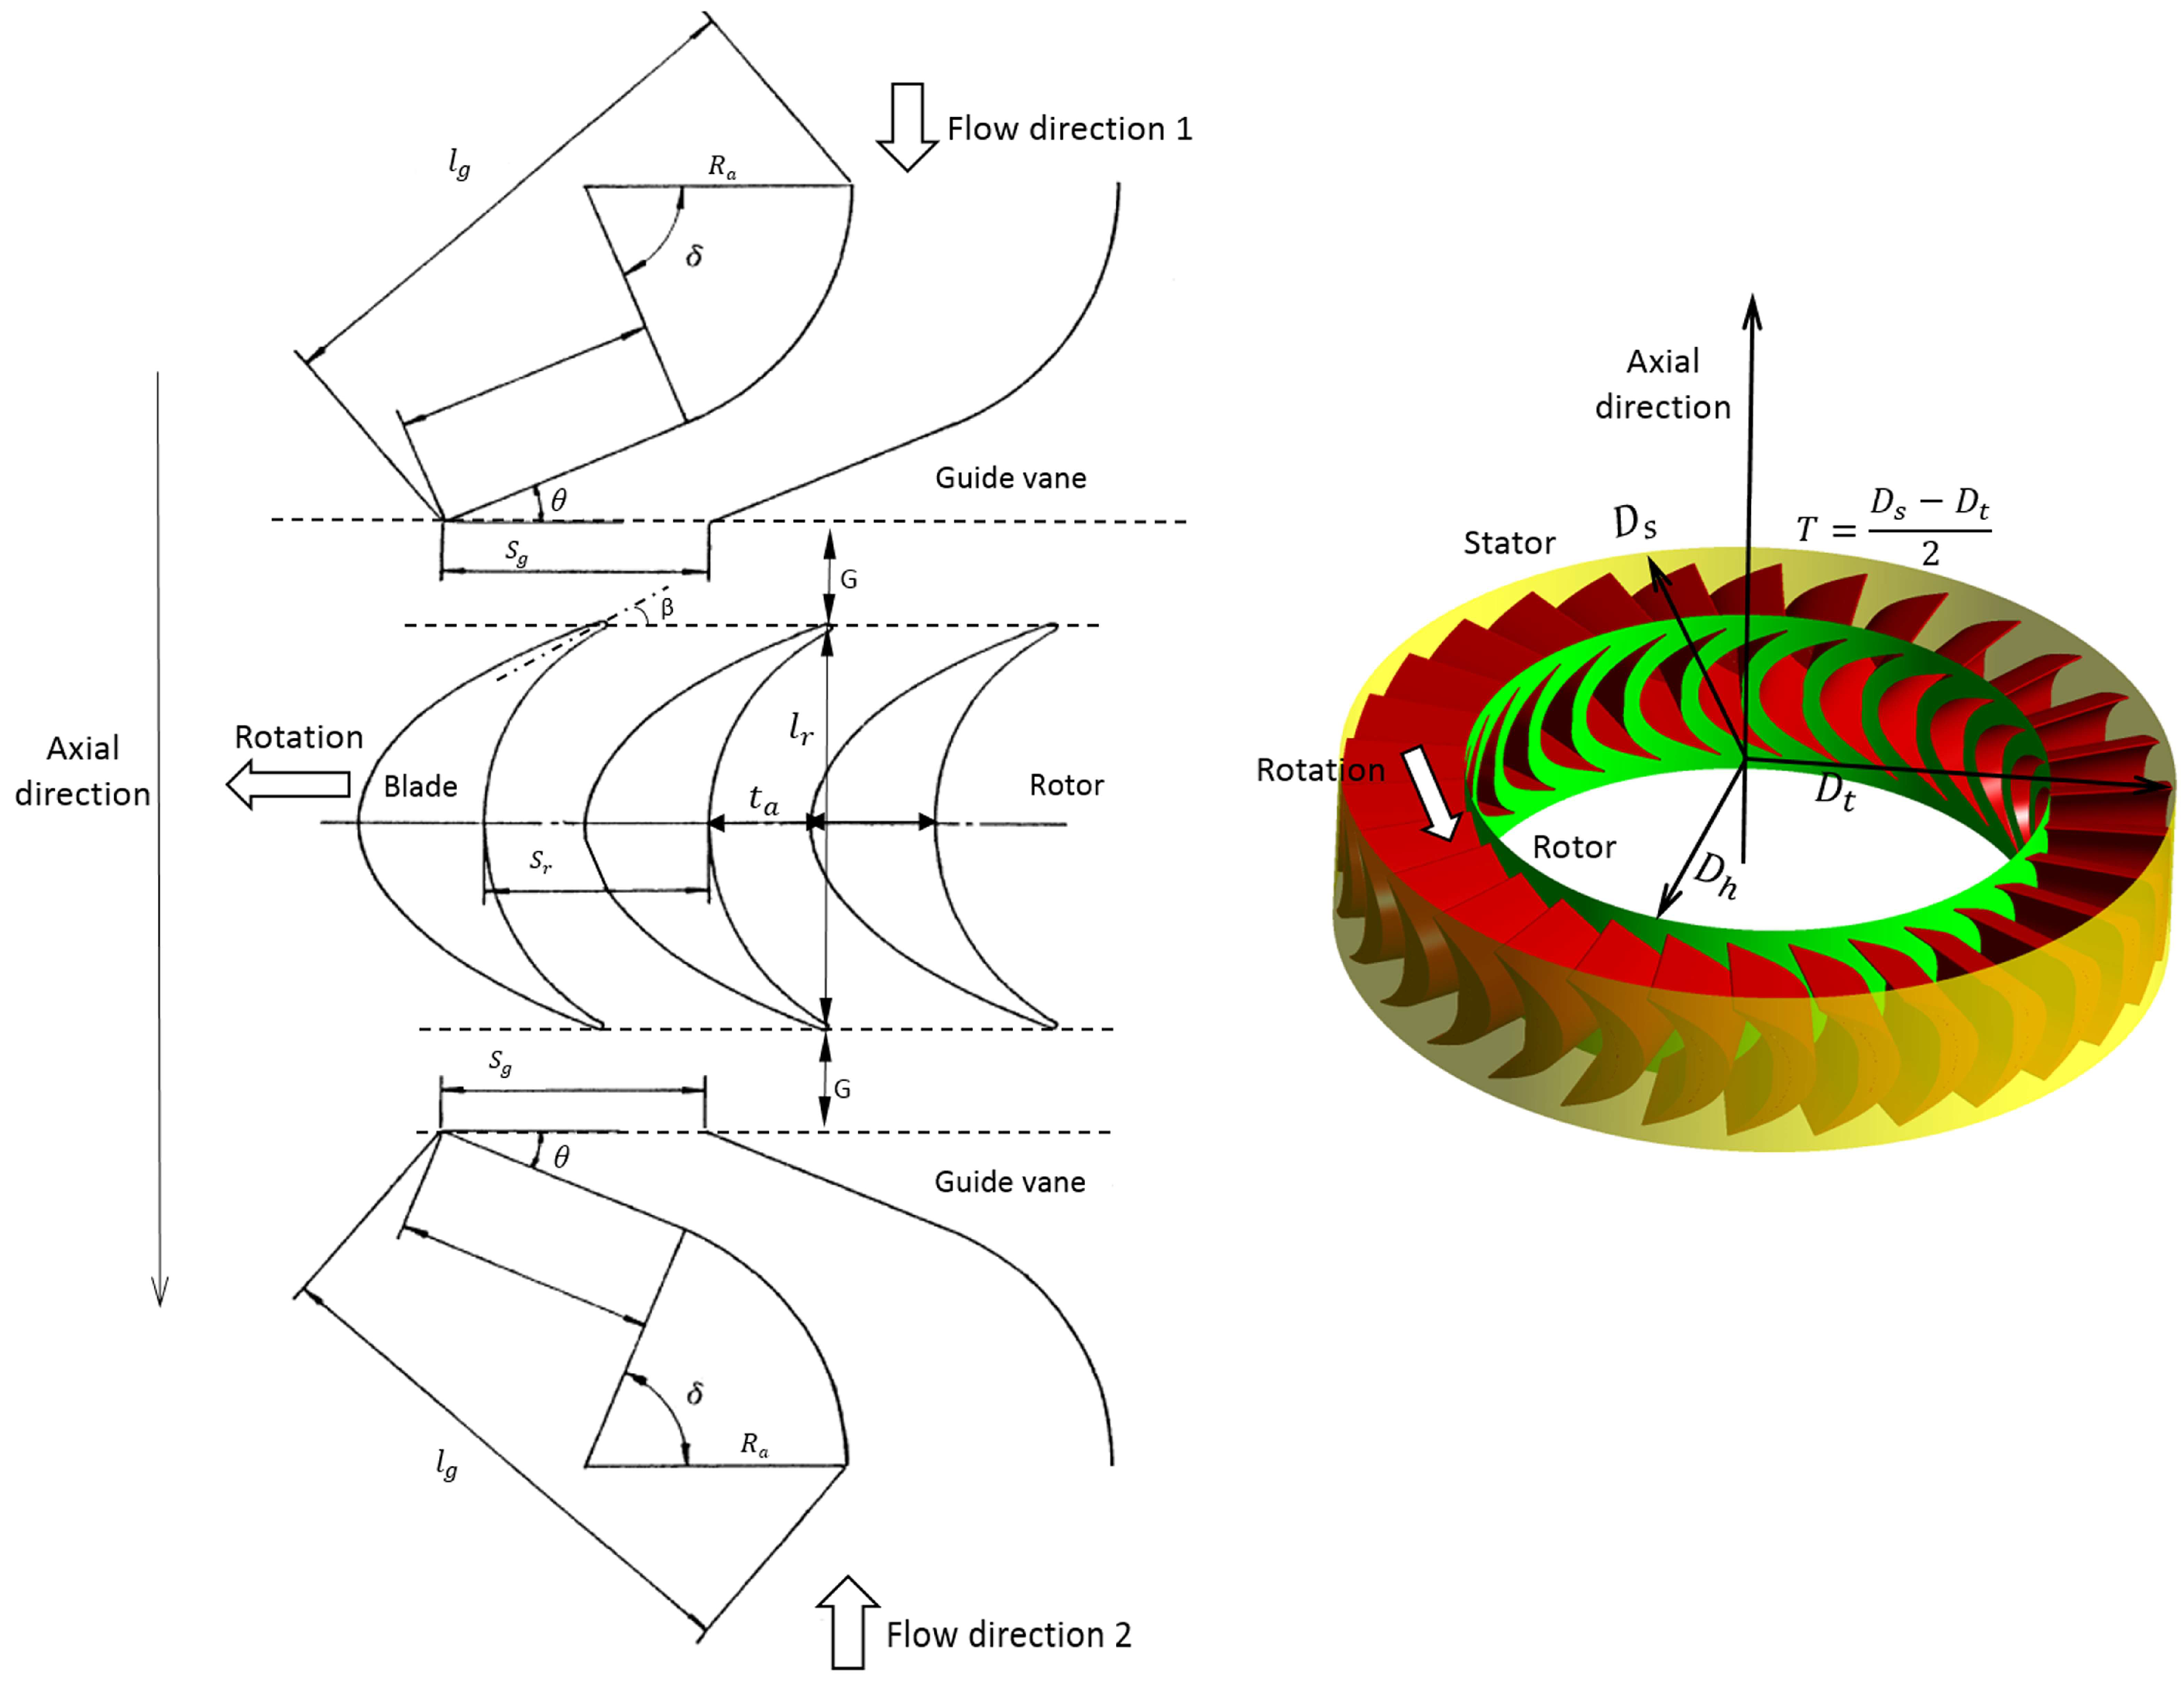
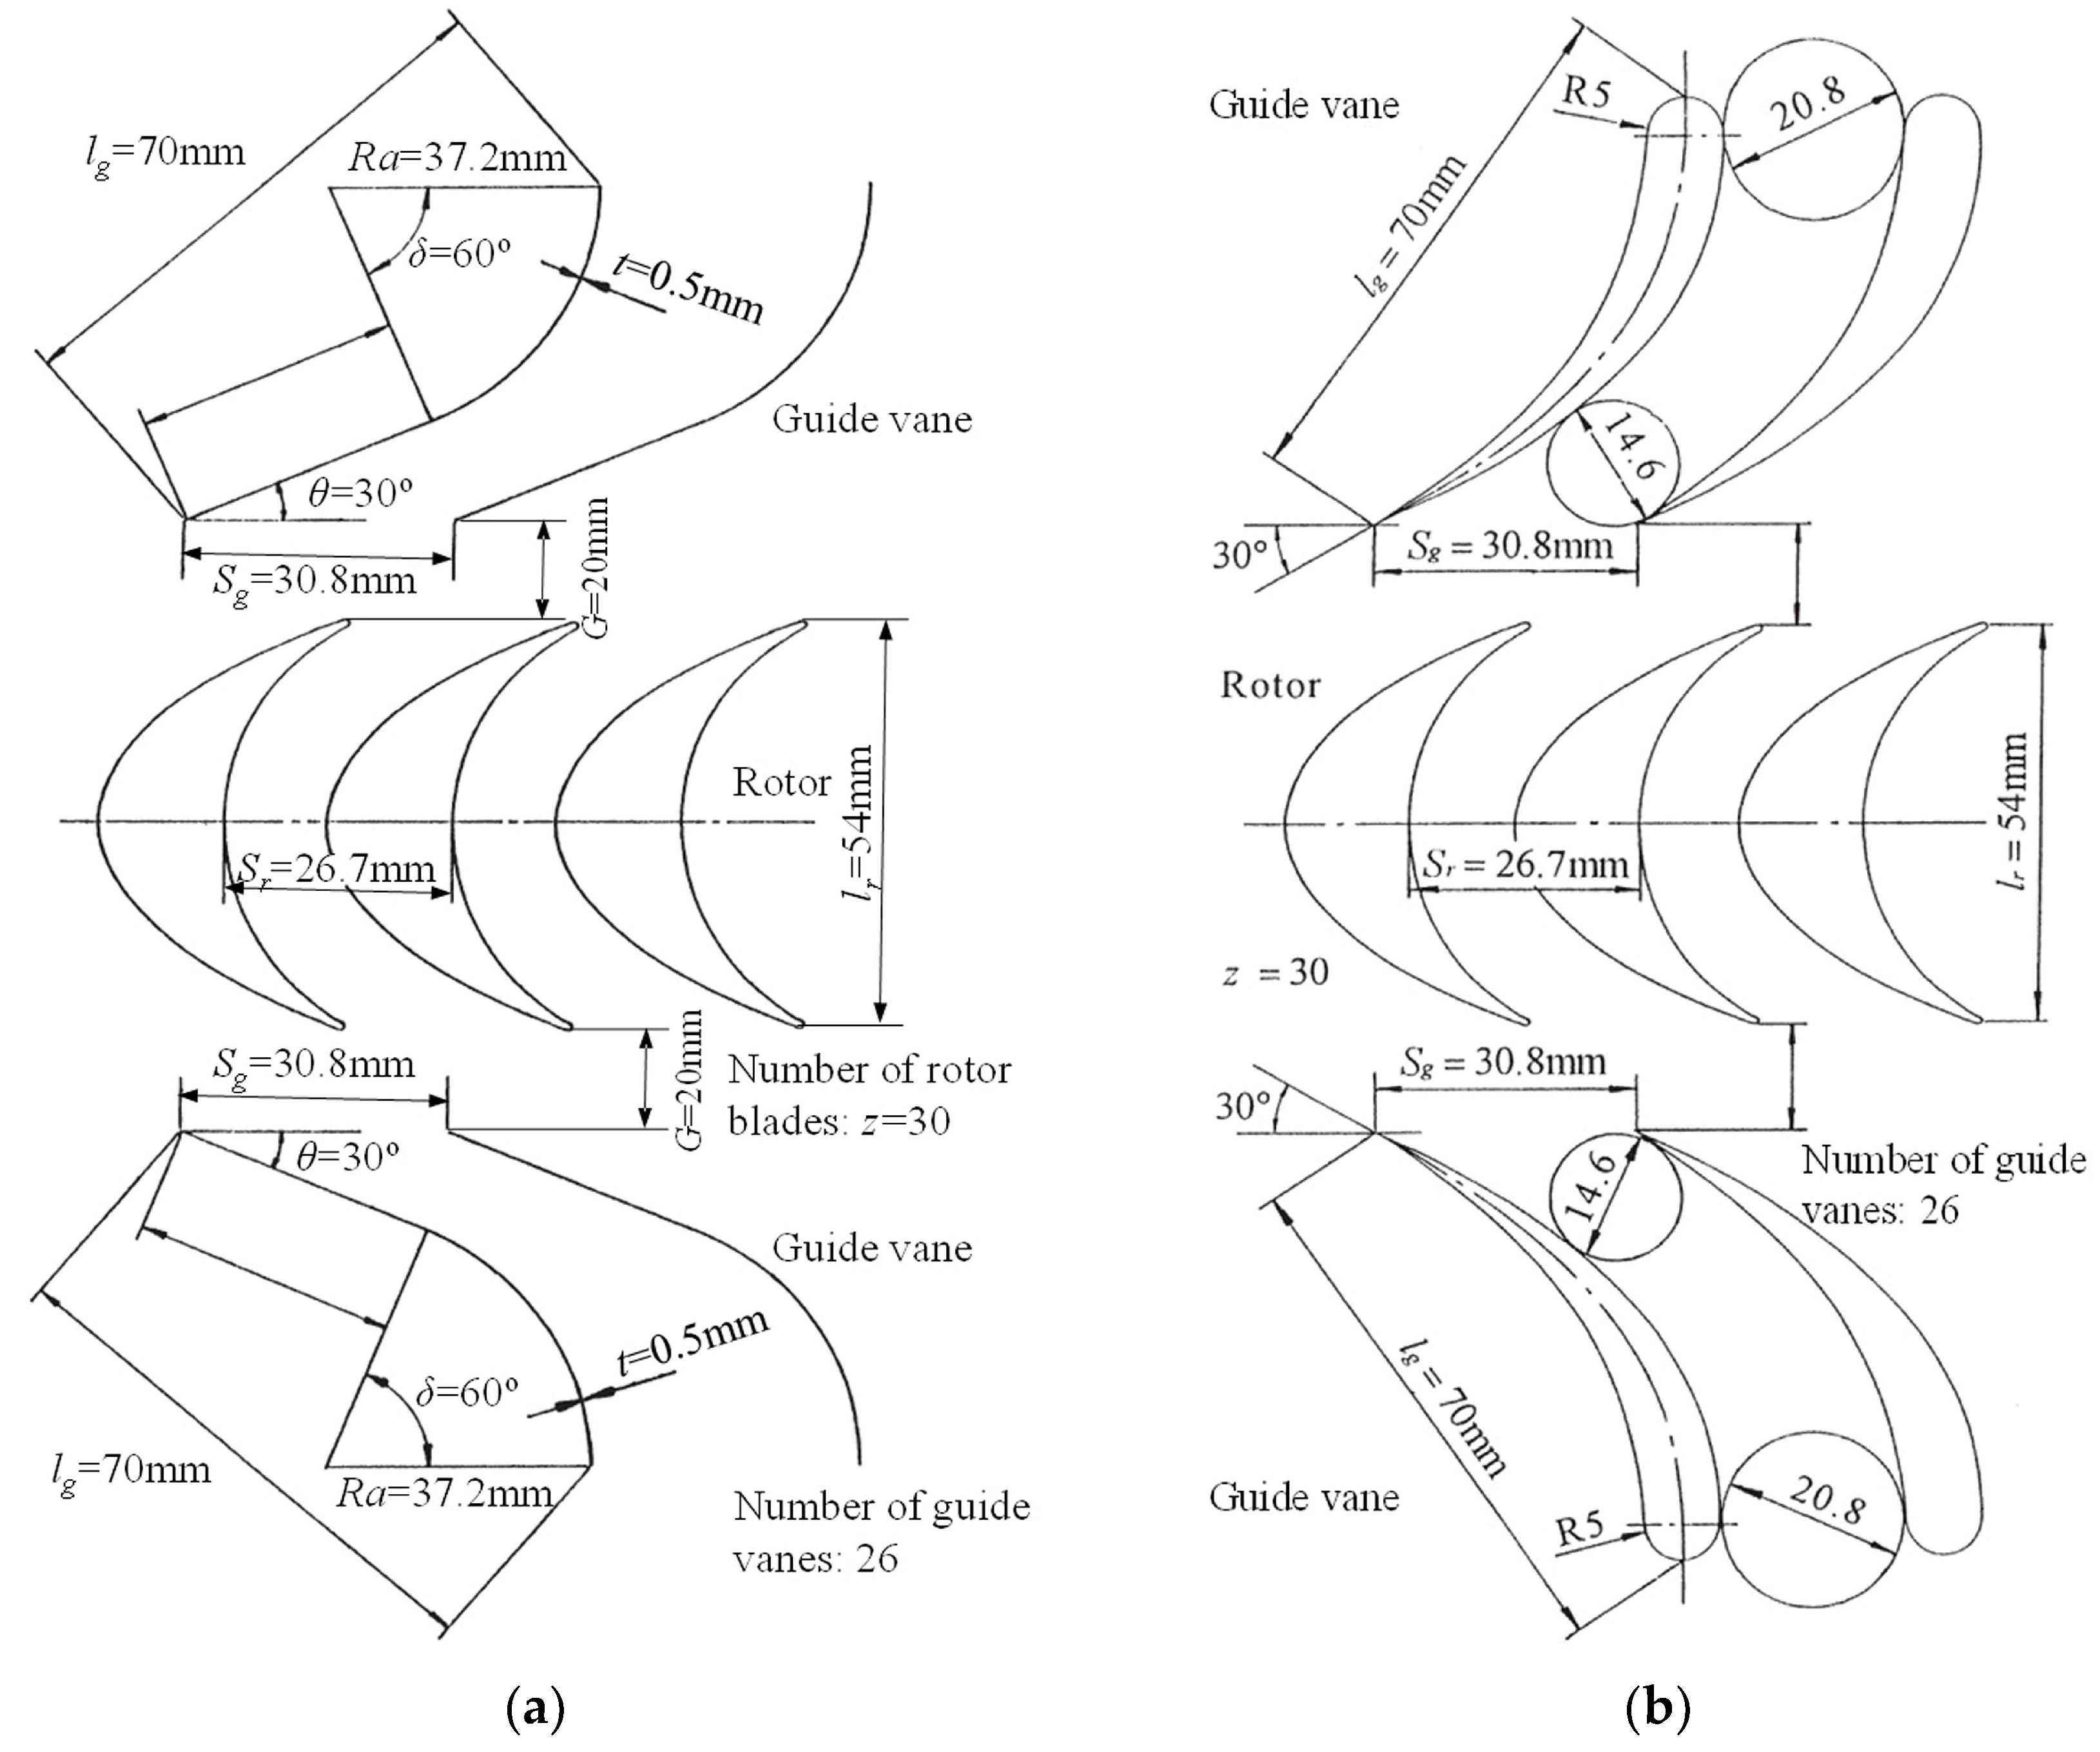
2.1. Geometrical Model and Parameter Variation

For this study, the reference geometry considered is shown in Figure 2a. The guide vane angle θ is fixed at 30° for all the setups as well as the angle of the blades (60°). The number of guide vanes and blades in the reference case is 26 and 30 respectively. Different rotating speeds have been tested in order to analyze a full range of operating conditions defined by the flow rate coefficient (see Equation (1)). The rest of the geometrical parameters are sketched in the same figure.
Two type of guide vanes have been tested, a plate type as described in Figure 2a and an airfoil type as shown in Figure 2b. In the reference case the number of guide vanes is set to 26 although a configuration with 24 and 22 guide vanes has been also tested. Several configurations with different gaps between guide vane and rotor blade ( G / l r ) have been also tested varying the reference case. Finally, the hub to tip ratio ( D h D t in Figure 1) has been also analyzed in this paper. All these variations and different configurations tested are summarized in Table 1. It has to be mention that for such variations only one parameter was changed at the same time, keeping the rest of the parameters at the reference value described in Figure 2a.

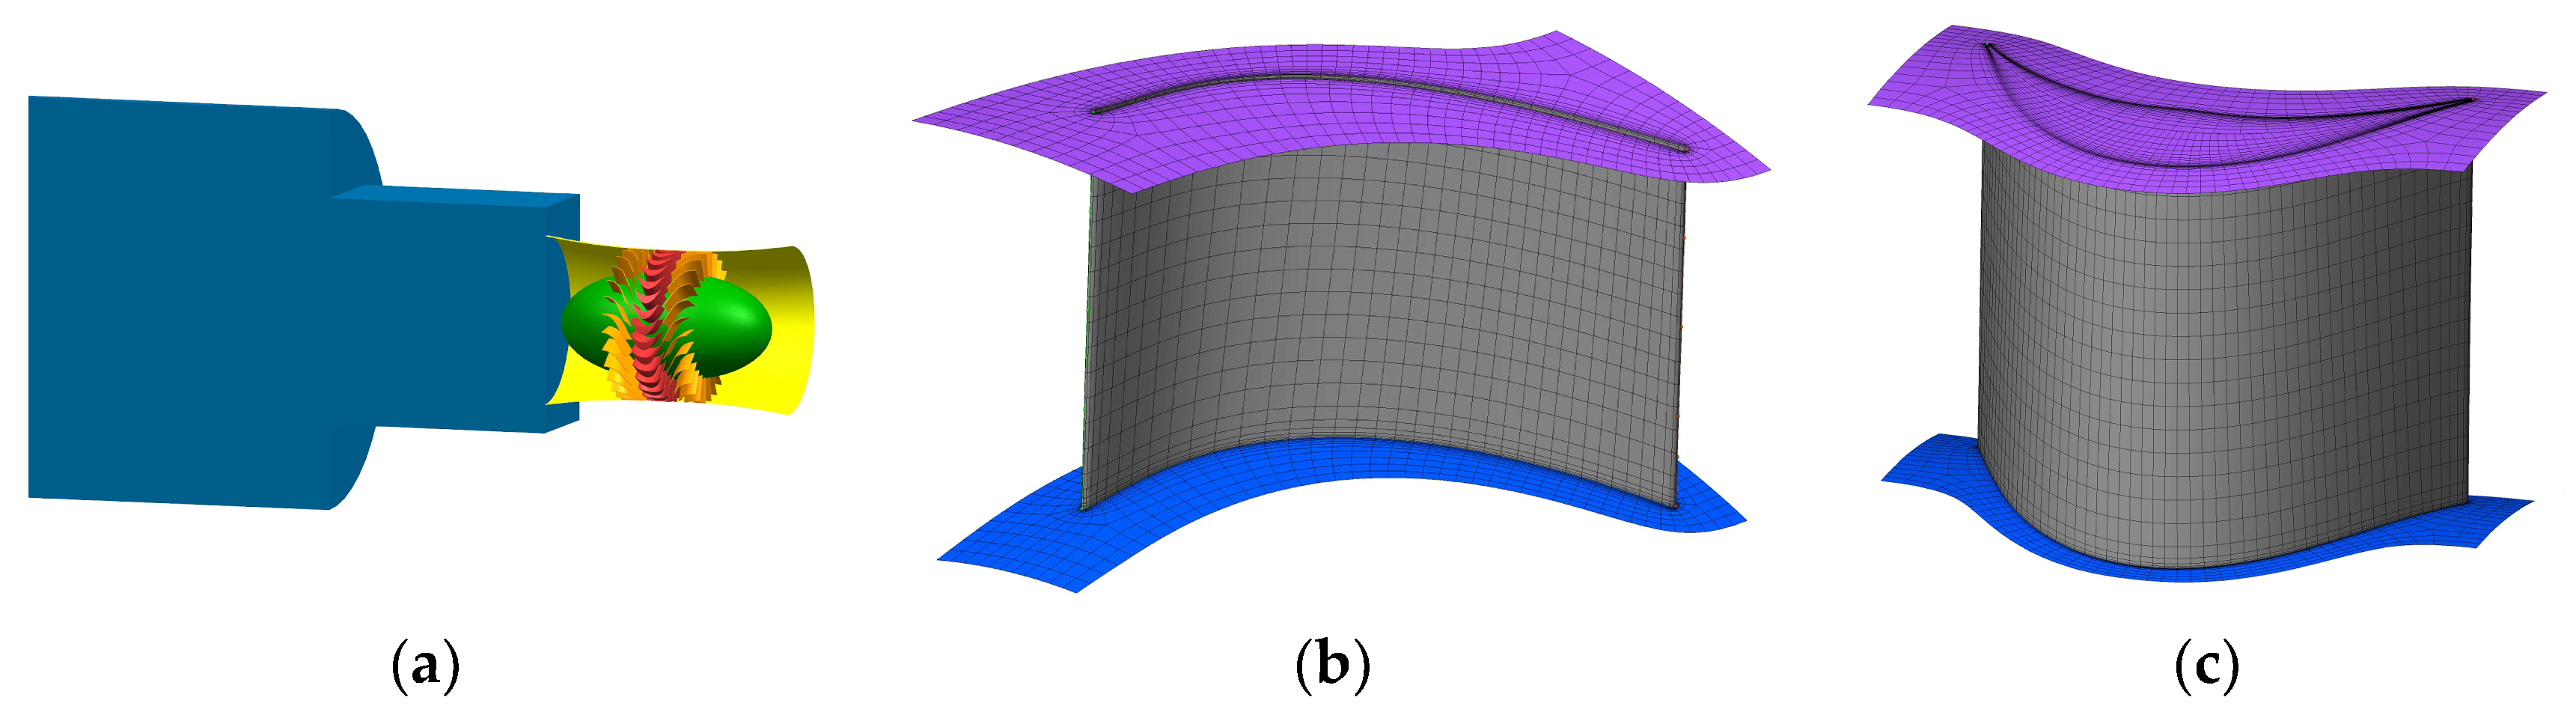
2.2. Numerical Model

The above referenced conditions have been modeled using ANSYS-Fluent 18 (ANSYS Inc, Pittsburgh, PA, USA). The part of the flow passage considered is shown in Figure 3a. Detail of the mesh used for the guide vane (Figure 3b) and for the blade (Figure 3c) can be seen in the same figure.
The RNG k ε model has been used to model the flow passing through the turbine. A stationary flow, constant for all the experiments, has been imposed. In order to test a wide range of operating conditions, defined by the flow rate coefficient of Equation (1), the rotating speed has been adjusted. For every configuration analyzed in Table 1, 25 operating conditions or 25 different rotating speeds have been tested. In this way, the efficiency curves have been obtained for the entire operating range.
To carry on the sensitivity of the mesh, the torque on the shaft has been selected as reference variable. As seen in Figure 4, for sizes larger than 2.45 million elements the torque remains nearby constant and therefore this mesh size is selected for the rest of the simulations.

3. Results

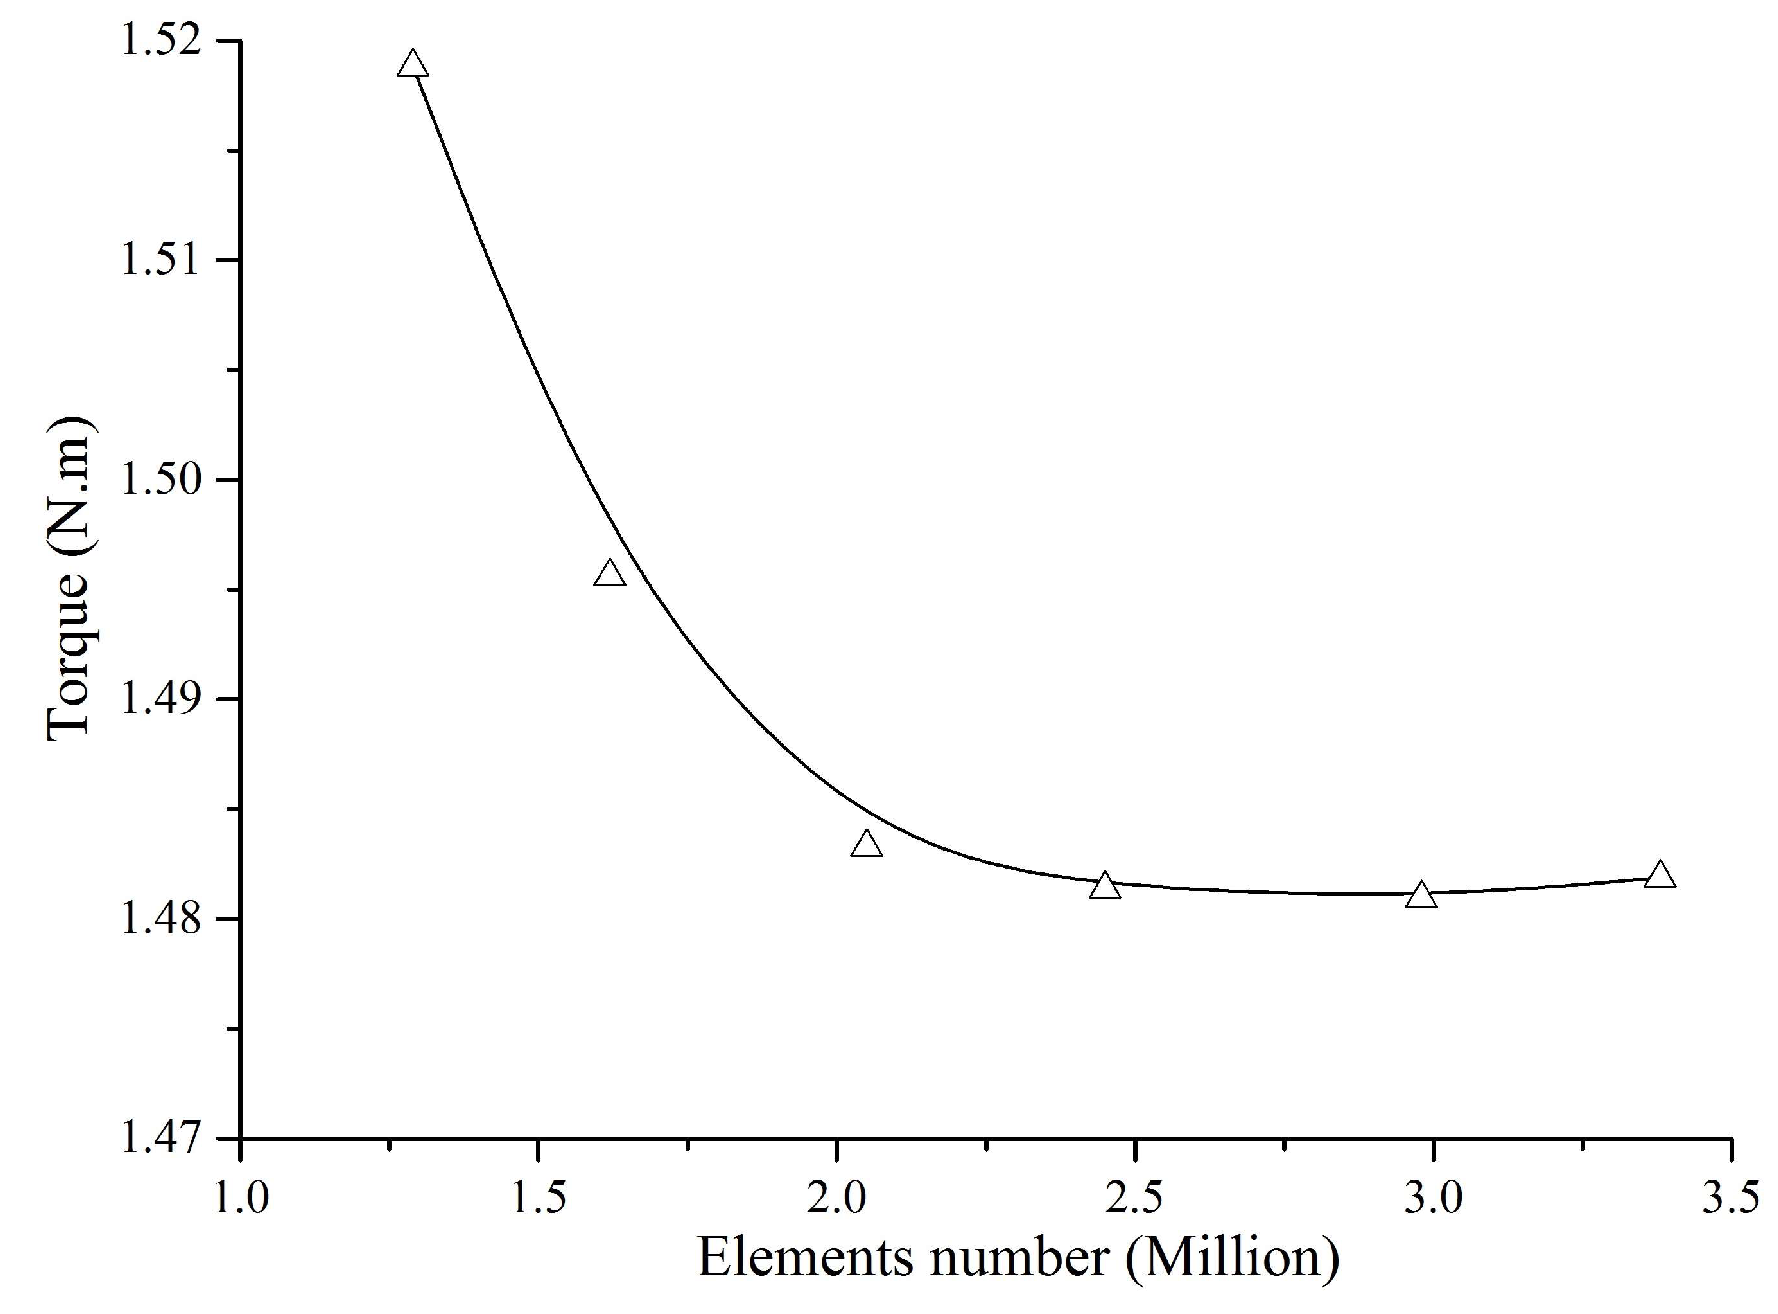
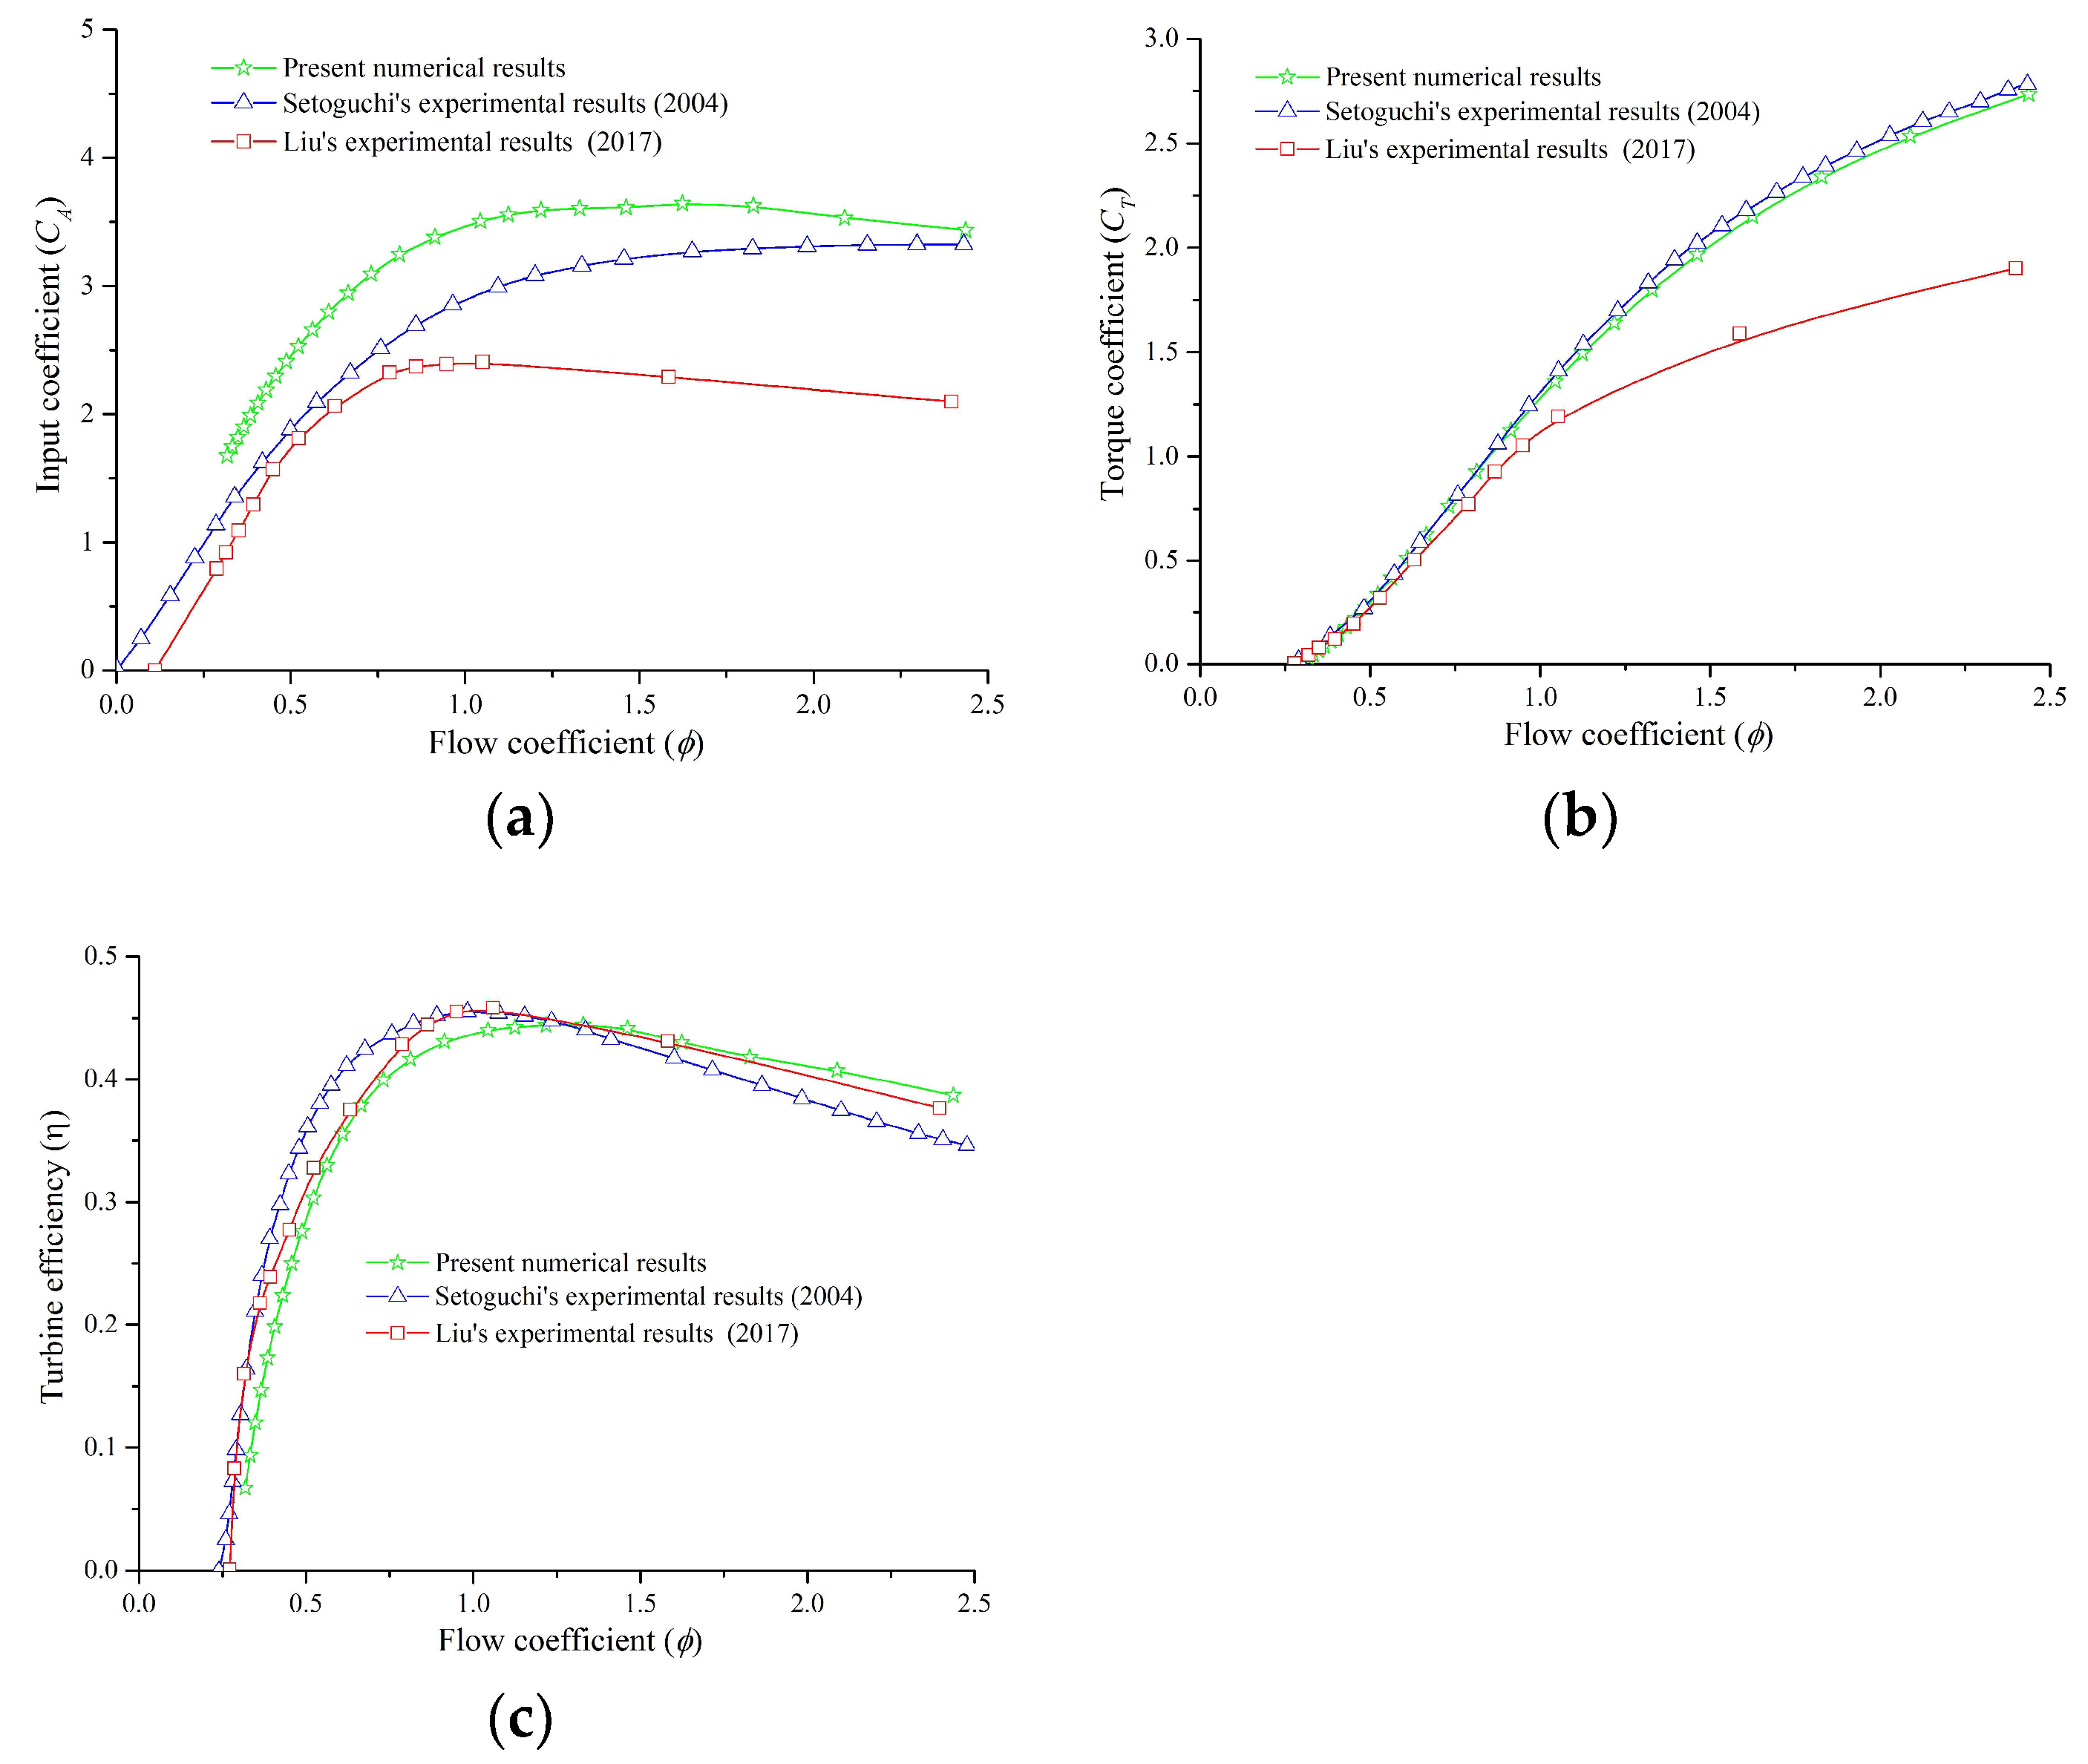
3.1. Validation of the Numerical Model

Firstly, we validate our numerical model with the previous experimental results of Setoguchi et al. [5,7]. The reference geometry used for the simulation (Figure 2a) coincides with that one experimentally used in Setoguchi’s work. Furthermore, we compare both numerical and experimental results with the recent experimental results presented by Liu [18]. In this case he uses the same turbine geometry as in the work of Setoguchi.
The flowing definitions adopted also in previous works [7] have been used in the present paper. The flow coefficient ϕ is defined as:
ϕ = V A U r
where V A = Q A r e f is the mean axial velocity related to the flow rate Q in a reference section. U r is the circumferential velocity in the mean radius r m e a n . The pressure drop p on the turbine is dimensionless defined by means of the input coefficient ( C A ):
C A = p Q ( 1 2 ρ ( V A 2 + U r 2 ) b l r z V A )
In this equation ρ is the density of the flow, b the height of the blades, l r the chord length of the blades (see Figure 2) and z the number of blades. The torque τ is dimensionless defined with the torque coefficient ( C T ):
C T = τ ( 1 2 ρ ( V A 2 + U r 2 ) b l r z r m e a n )
where r m e a n is the mean radius or D t + D h 4 . Finally, the turbine efficiency can be calculated as in Equation (4). More details of these definitions and parameters can be found in the aforementioned references.
η = T ω p Q = C T C A ϕ
In Figure 5a,b we compare the input coefficient C A and torque coefficient C T obtained in the present simulation with previous experimental results. For the input coefficient C A the present simulation results are closer to Setoguchi’s experimental results than to Liu’s results. It is observed that the values are always higher than in both previous studies. These differences maybe caused due to different sections when measuring the pressure difference. For the torque coefficient C T , the present numerical results well approximate the results presented by Setoguchi, which differ from the results presented by Liu. Although in Liu’s paper it is not explicitly stated, one possible reason for such a discrepancy is the way on which the flow rate is measured. In the work of Setoguchi the flow rate is determined by the displacement of a piston, whose motion is controlled by a servomotor. In the work of Liu, the flow rate is measured with pitot sensor and therefore the flow rate has to be calculated with an averaged velocity and the measuring section. These two different methods may lead to different results in the flow coefficient estimation. For the efficiency of the turbine the present numerical results and the previous experimental results are quite similar as observed in Figure 5c.
The flow patterns shown in Figure 6 for different flow coefficients explain the behavior of the turbine efficiency. For ϕ = 0.38 the flow enters the turbine with a high deviation angle, which in turn causes a high recirculation and blocking zone in the inlet. For ϕ = 1.33 (maximum efficiency according to the present numerical results) the flow enters with almost no deviation angle and therefore inside the turbine a smooth flow can be observed. For ϕ = 2.44 , the flow enters with a small deviation with respect to the blades. In the blade passage the flow is still smooth, although a small separation can be seen on the suction side. Nevertheless, the efficiency is still relatively high as seen in Figure 5c. For all the operating conditions and configurations tested in this paper the Reynolds number is higher than 4 × 10 4 . Therefore, according to Setoguchi et al. [17] a higher Reynolds number would not improve the efficiency of the machine.

3.2. Analysis of Design Parameters

By means of the validated CFD model, we discuss the effect of several parameters on the efficiency of the turbine. Some of these parameters are firstly analyzed in this paper and some of them, whose influence has been determined in previous studies, are compared and contrasted with the present numerical results. While CFD simulation models combined with the genetic algorithm have been recently used for a multiple optimization of several parameters at the same time [20], the analysis of every single parameter separately gives another perspective to the optimization problem, closer to the physical point of view. With similar methods, Liu et al. [15] determined the influence of the guide vane angle and the tip clearance, therefore we discuss here other relevant design parameters.

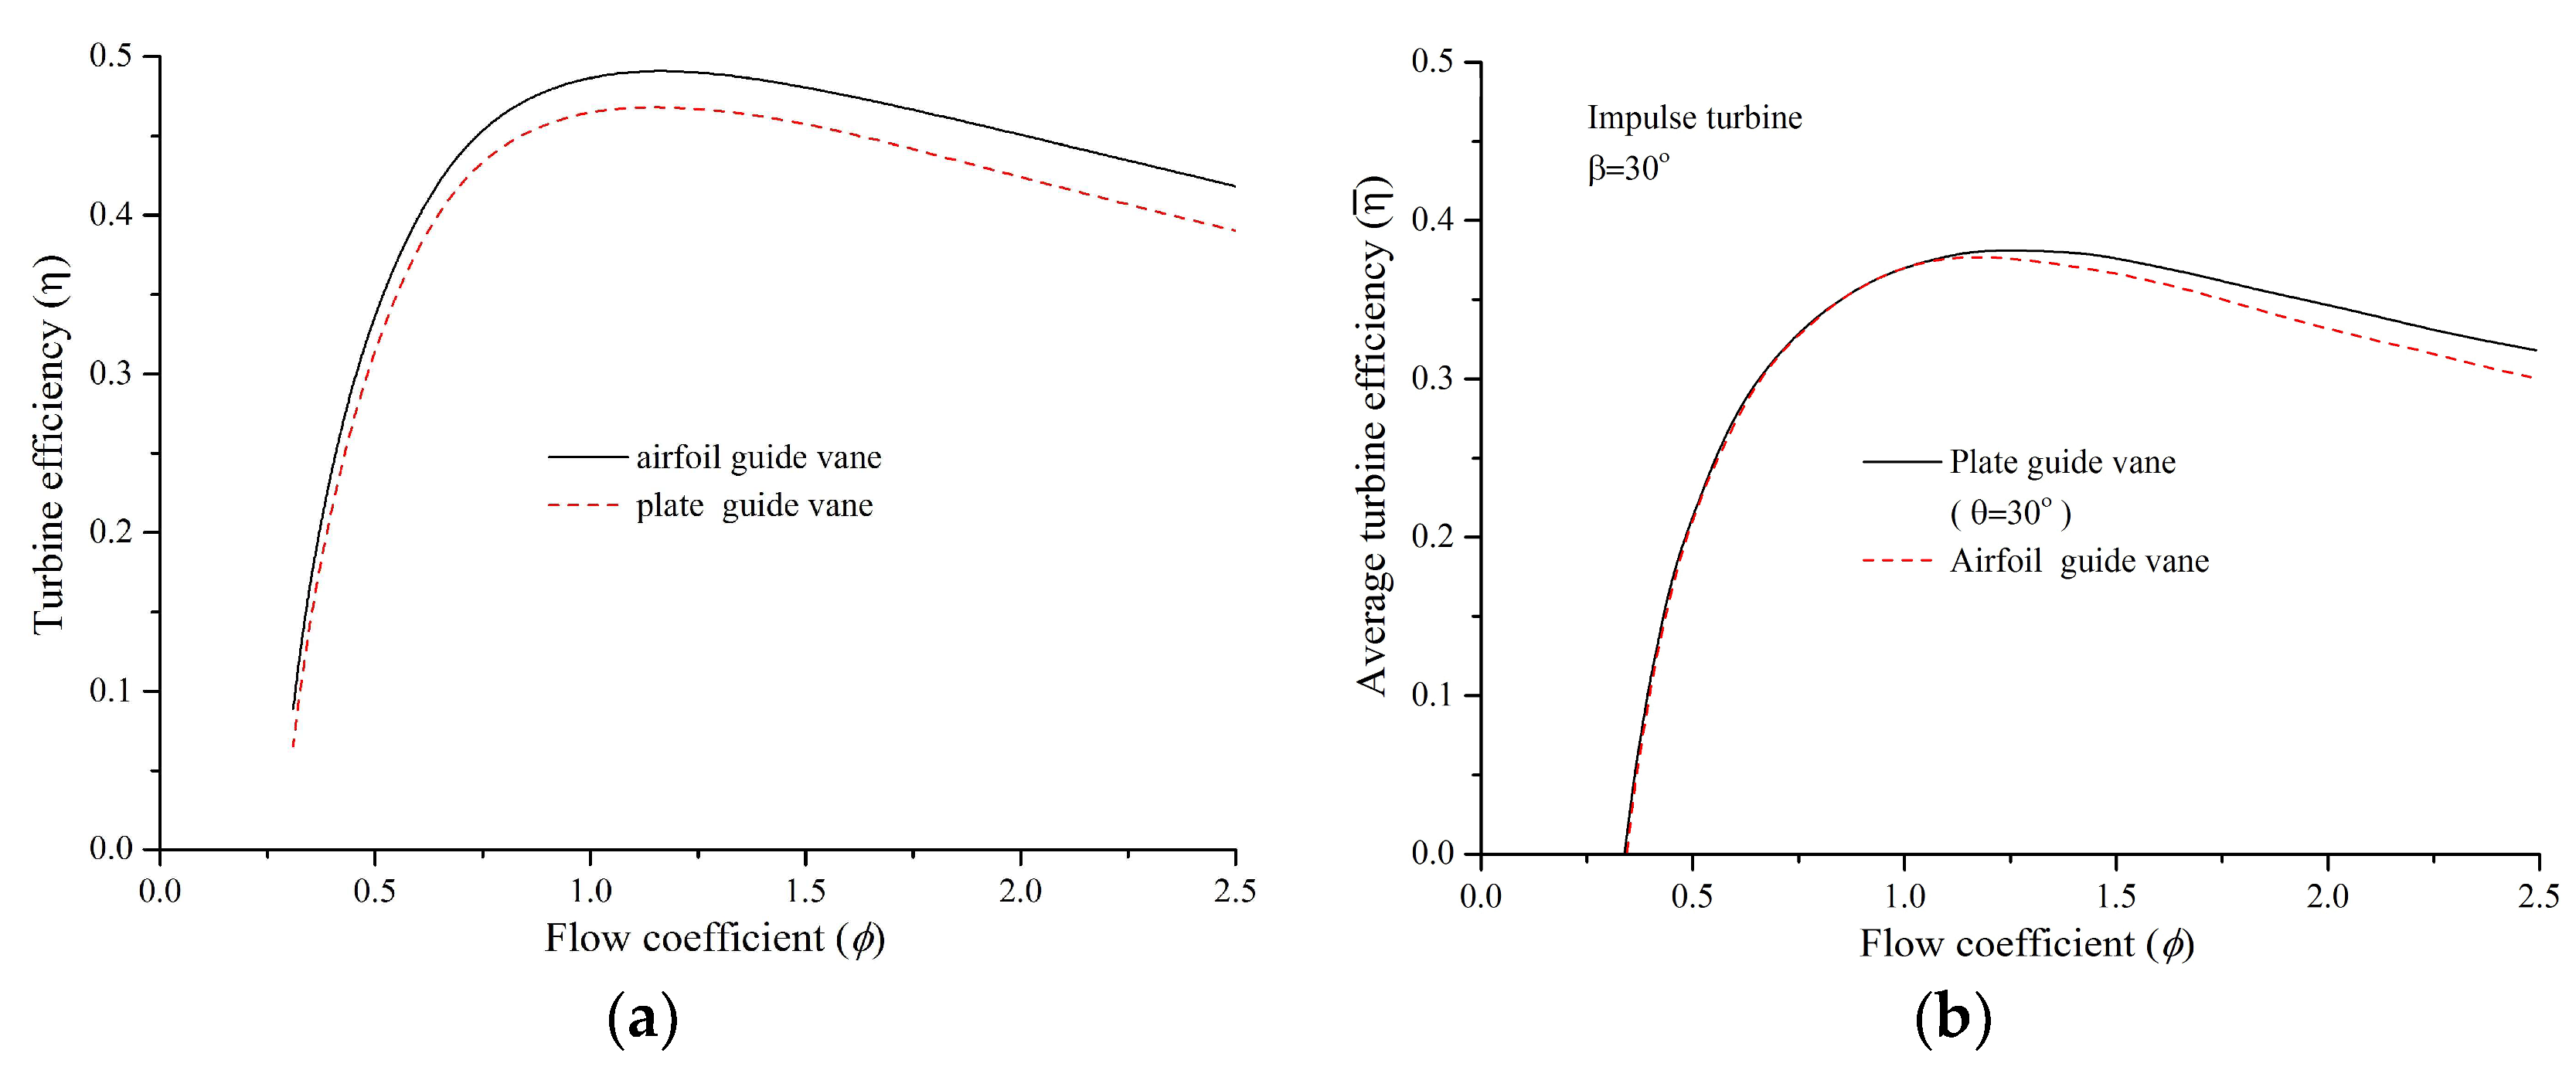
3.2.1. Guide Vane Type

The influence of the guide vane type on the efficiency of the turbine is discussed in this section. As seen in Figure 7a, for the present numerical simulation the airfoil guide vane has a better performance than the plate guide vane, especially for high flow coefficients. The experimental results obtained by Setoguchi [5] show a little better performance of the plate guide vane for high flow coefficients. That results were obtained with a slightly different conditions as the flow was sinusoidal and the efficiency calculated is the average efficiency. For low flow coefficients both numerical and experimental results show almost no difference between plate and airfoil guide vane.
Figure 8 shows the flow pattern around the blades for both airfoil and plate guide vane profiles. The flow coefficient is ϕ = 1.24 in both cases, where the efficiency of the turbine for the airfoil type configuration is substantially higher than for the plate type (Figure 7a). As seen in the stream lines characteristics, the configuration with the plate type shows higher turbulence intensity around the inlet area (pressure side) of the blades (Figure 8b), which in turn causes a slight decrease in the efficiency when comparing with the airfoil configuration (Figure 8a).

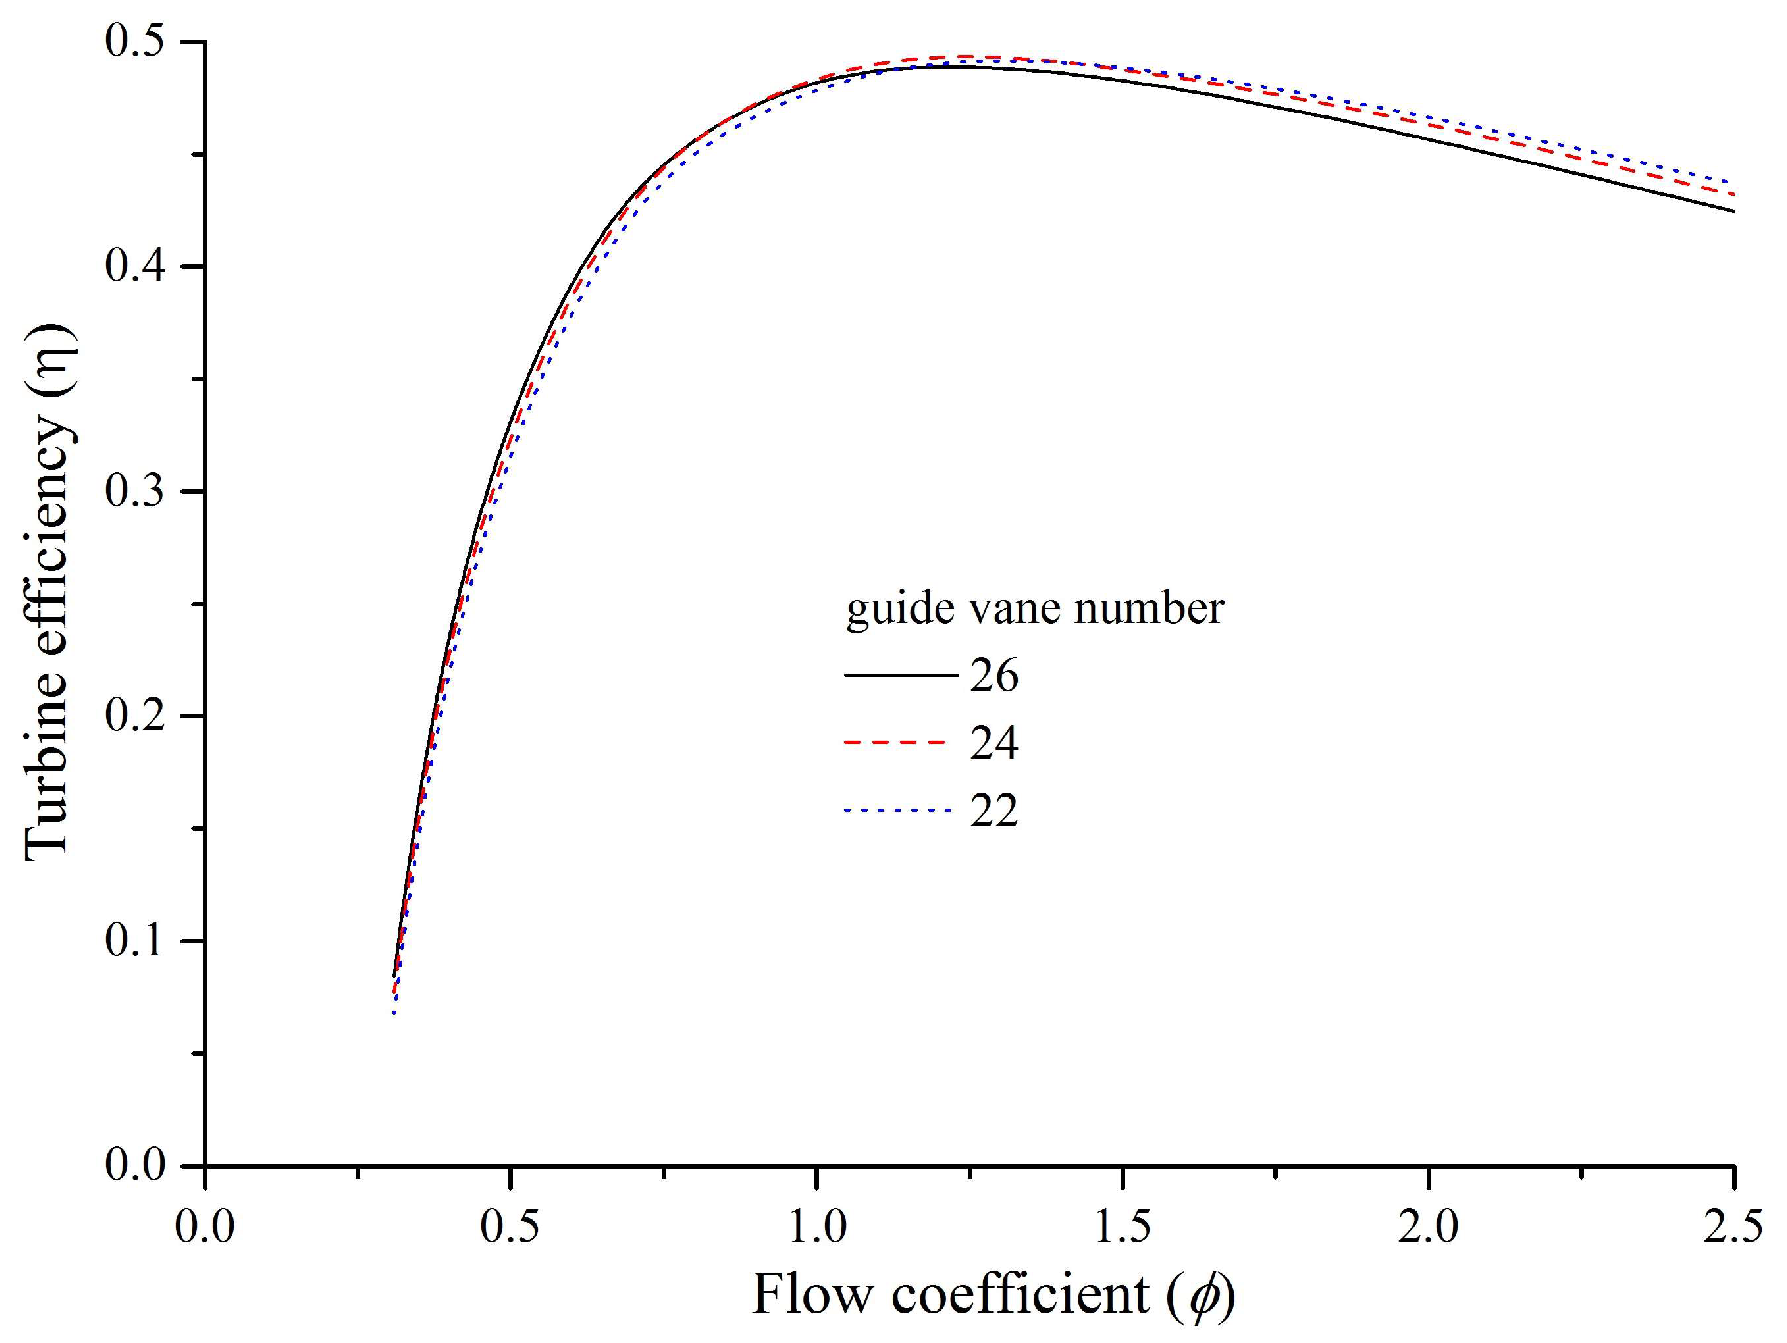
3.2.2. Guide Vane Number

The guide vane number is newly analyzed in the present study. As such parameter is difficult to modify in a test rig, to analyze it with a CFD model is very advantageous in this case. The reference case is 26 guide vanes. Configurations with 24 and 22 guide vanes maintaining the rest of the design parameters unchanged have been also tested. It is found, that there is almost no difference in the efficiency of the turbine with less guide vanes, although a slightly increase may be observed for high flow coefficients when the number of guide vanes is lower (Figure 9).

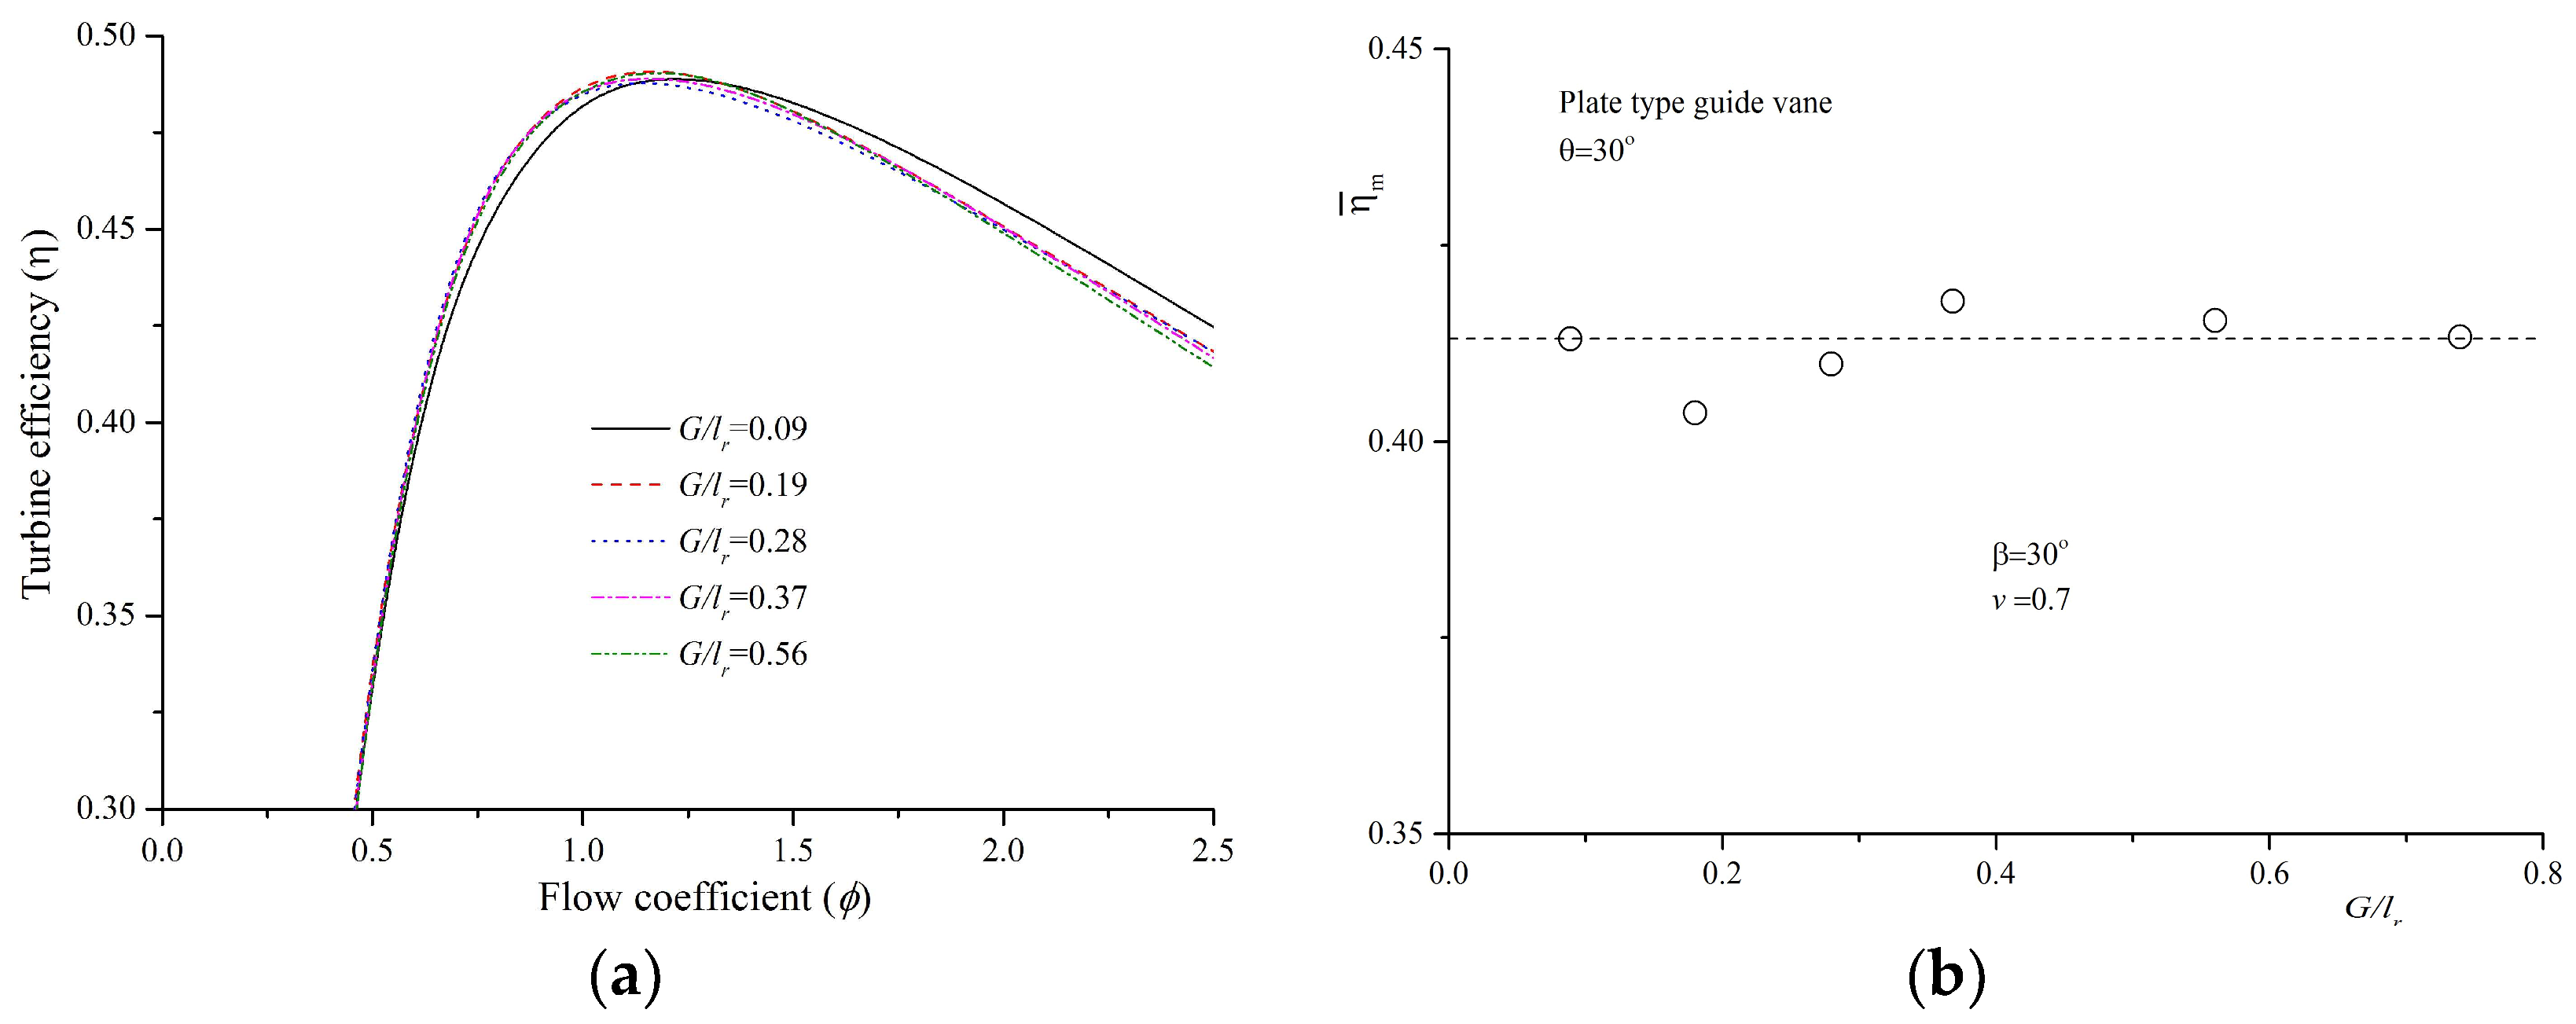
3.2.3. Gap between Guide Vane and Blade

The influence of the rotor-stator gap normalized to the chord length G l r is shown in Figure 10. The present results do not show a clear influence of this parameter on the efficiency of the turbine. For higher flow coefficients, the configuration with a very small gap has a better performance but for lower ϕ , this configuration seems to be a little bit less efficient. Therefore, the averaged efficiency has not significant changes when varying this parameter. These results confirm the experimental results of Setoguchi [5] (Figure 10b), where the mean efficiency does not show a clear trend across this parameter.

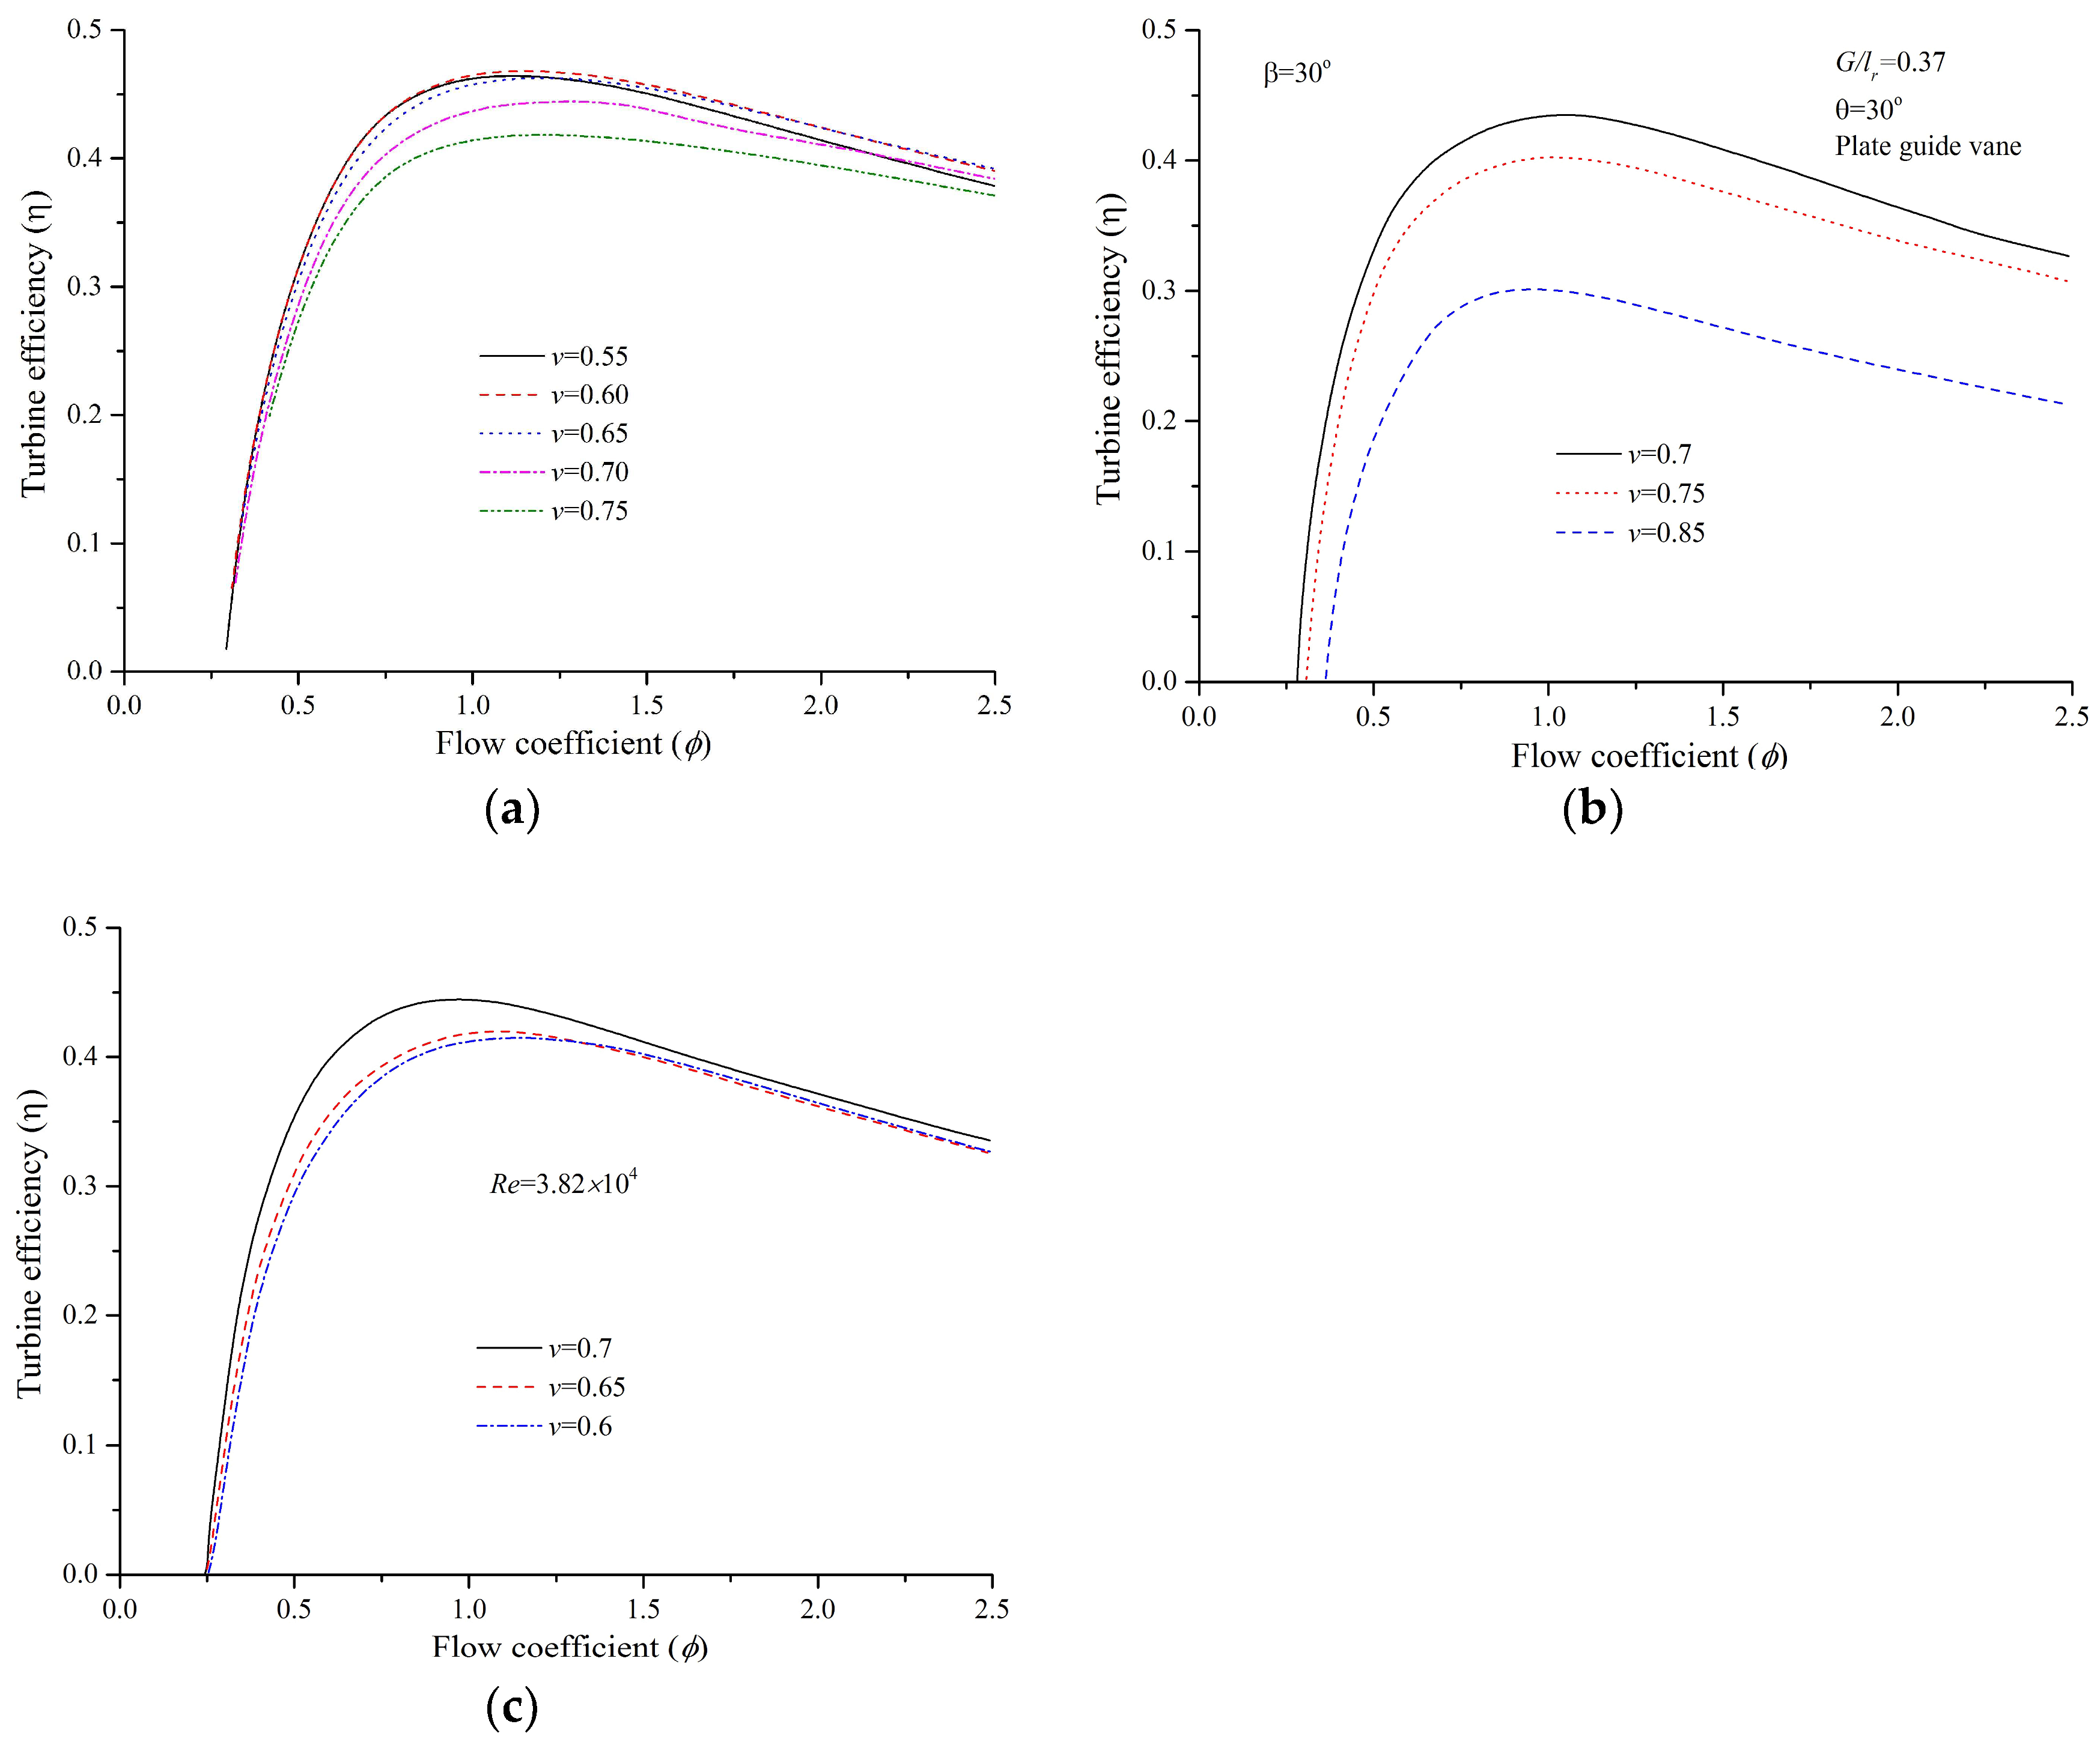
3.2.4. Hub to Tip Ratio

Previously, it has been experimentally demonstrated that the hub to tip ratio is an important parameter for the turbine efficiency. In fact, this parameter has been previously analyzed in the extensive work of Setoguchi et al. [5] and also in a specific research dedicated to the hub to tip ratio and Reynolds number [17]. Therefore, in the present paper this effect has been also considered. The case of hub to tip ratios larger than 0.7 is experimentally discussed in [5] (Figure 11b), while the case of a hub to tip ratio smaller than 0.7 is shown in [17] (Figure 11c). Taking into account both experimental results, it can be concluded that the optimal hub to tip ratio is ν 0.7 . Nevertheless, in the experimentation related to ν < 0.7 (Figure 11c), in order to keep the rigidity of the rotor, the hub to tip ratio is simultaneously varied with the number of guide vanes and blades and therefore the analysis of the separate effect of ν may be more confusing. According to the numerical results presented in this paper, where only ν has been modified (maintaining the number of guide vanes and blades), the optimal hub to tip ratio is closer to ν 0.6 .
Figure 12 shows the stream lines for ϕ = 1.03 and three different hub to tip ratios. Note that around this flow coefficient the highest effect of ν on the efficency can be observed (Figure 11). For higher hub to tip ratios ( ν = 0.75 , Figure 12c) the module of the velocity is higher as the cross section of the flow is smaller. At the same time, higher turbulence is observed around the inlet of the turbine on the pressure side. Decreasing the hub to tip ratio to ν = 0.6 has the effect of increasing the cross section, reducing the velocity module and the turbulence intensity (Figure 12a). This could explain that according to the present study the efficiency for ν = 0.6 is higher than for higher values of ν (Figure 11a).

4. Conclusions

Axial impulse turbines are one of the most used machines to convert energy from waves of the sea and ocean into useful energy. In order to improve the performance of such turbine, the influence of the geometrical design parameters on the turbine efficiency has to be considered. With the increase of computational capabilities, it may be advantageous to analyze such influence with CFD simulations, which are nowadays reliable and generally less expensive and time consuming than the experimentation.
In the present paper, the influence of several design parameters on the efficiency has been obtained by means of a numerical CFD model. For the type of guide vanes, gap between guide vane and rotating blade and hub to tip ratio the present numerical results have been compared with previous experimental ones. Possible discrepancy between results have been analyzed and discussed. The effect of the number of guide vanes has been firstly analyzed in this paper.
Concluding remarks regarding the influence of the analyzed design parameters are as follows:
  • Type of guide vane: Airfoil guide vane does not show a clear improvement on the efficiency with respect to the plate guide vane for low flow rate coefficients. Experimental and numerical results have a slight discrepancy for high flow rate coefficients, which may be attributed to the type of flow tested (sinusoidal and uniform).
  • Number of guide vanes: Reducing the number of guide vanes does not substantially improve the efficiency, although for higher flow rate coefficients a slightly improvement may be observed
  • Gap between guide vane and rotating blade: The present numerical study confirms previous experimental works. For a wide range of gaps guide vane-rotating blade, the average efficiency remains nearby constant
  • Hub to tip ratio: Hub to tip ratio has an important influence on the efficiency of the turbine. Experimental results shows an optimum value for ν 0.7 while the present numerical results indicate an optimum around ν 0.6 . It has to be noticed that in the experimentation, ν was simultaneously modified with the number of guide vanes and blades and therefore it is more difficult to analyze the single influence of ν .

Author Contributions

Y.L. developed the numerical model and performed the numerical analysis. A.P. contribute to the analysis and prepare the manuscript. Z.W. revise the manuscript.

Funding

This work has been funded by Tsinghua University Initiative Scientific Research Program (No. 20151080459) and the National Natural Science Foundation of China under Contract (Nos. 51779122 and 51439002) and the China Postdoctoral Science Foundation (No. 2018M631466).

Conflicts of Interest

The authors declare no conflict of interest. The funders had no role in the design of the study; in the collection, analyses, or interpretation of data; in the writing of the manuscript, or in the decision to publish the results.

References

  1. Cornett, A. A Global Wave Energy Resource Assessment. In Proceedings of the 18th International Offshore and Polar Engineering Conference, Vancouver, BC, Canada, 6–11 July 2008; pp. 318–326. [Google Scholar]
  2. Guillou, N.; Chapalain, G. Numerical modelling of nearshore wave energy resource in the Sea of Iroise. Renew. Energy 2015, 83, 942–953. [Google Scholar] [CrossRef] [Green Version]
  3. Gato, L.M.C.; Warfield, V.; Thakker, A. Performance of a High-Solidity Wells Turbine for an OWC Wave Power Plant. J. Energy Resour. Technol. 1996, 118, 263–268. [Google Scholar] [CrossRef]
  4. Inoue, M.; Kaneko, K.; Setoguchi, T.; Saruwatari, T. Studies on the Wells Turbine for Wave Power Generator (Turbine Characteristics and Design Parameter for Irregular Wave). JSME Int. J. Ser. 2 Fluids Eng. Heat Transf. Power Combust. Thermophys. Prop. 1988, 31, 676–682. [Google Scholar] [CrossRef] [Green Version]
  5. Setoguchi, T.; Santhakumar, S.; Maeda, H.; Takao, M.; Kaneko, K. A review of impulse turbines for wave energy conversion. Renew. Energy 2001, 23, 261–292. [Google Scholar] [CrossRef]
  6. Setoguchi, T.; Kaneko, K.; Taniyama, H.; Maeda, H.; Inoue, M. Impulse turbine with self-pitch-controlled guide vanes for wave power conversion: Guide vanes connected by links. Int. J. Offshore Polar Eng. 1996, 6, 76–80. [Google Scholar]
  7. Maeda, H.; Santhakumar, S.; Setoguchi, T.; Takao, M.; Kinoue, Y.; Kaneko, K. Performance of an impulse turbine with fixed guide vanes for wave power conversion. Renew. Energy 1999, 17, 533–547. [Google Scholar] [CrossRef]
  8. Henriques, J.C.C.; Sheng, W.; Falcão, A.F.O.; Gato, L.M.C. A Comparison of Biradial and Wells Air Turbines on the Mutriku Breakwater OWC Wave Power Plant. In Proceedings of the ASME 2017 36th International Conference on Ocean, Offshore and Arctic Engineering, Trondheim, Norway, 25–30 June 2017. [Google Scholar]
  9. Falcão, A.F.D.O. Wave energy utilization: A review of the technologies. Renew. Sustain. Energy Rev. 2010, 14, 899–918. [Google Scholar] [CrossRef]
  10. Viola, A.; Franzitta, V.; Trapanese, M.; Curto, D. Nexus Water & Energy: A Case Study of Wave Energy Converters (WECs) to Desalination Applications in Sicily. Int. J. Head Technol. 2016, 34, S379–S386. [Google Scholar]
  11. Franzitta, V.; Curto, D.; Rao, D. Energetic Sustainability Using Renewable Energies in the Mediterranean Sea. Sustainability 2016, 8, 1164. [Google Scholar] [CrossRef]
  12. Thakker, A.; Dhanasekaran, T.S. Experimental and computational analysis on guide vane losses of impulse turbine for wave energy conversion. Renew. Energy 2005, 30, 1359–1372. [Google Scholar] [CrossRef]
  13. Setoguchi, T.; Takao, M.; Kinoue, Y.; Kaneko, K.; Santhakumar, S.; Inoue, M. Study on an Impulse Turbine for Wave Energy Conversion. Int. J. Offshore Polar Eng. 2000, 10, 8. [Google Scholar]
  14. Thakker, A.; Dhanasekaran, T.S.; Ryan, J. Experimental studies on effect of guide vane shape on performance of impulse turbine for wave energy conversion. Renew. Energy 2005, 30, 2203–2219. [Google Scholar] [CrossRef]
  15. Liu, Z.; Jin, J.; Cui, Y.; Fan, H. Numerical Analysis of Impulse Turbine for Isolated Pilot OWC System. Adv. Mech. Eng. 2013, 5, 416109. [Google Scholar] [CrossRef]
  16. Thakker, A.; Dhanasekaran, T.S. Computed effects of tip clearance on performance of impulse turbine for wave energy conversion. Renew. Energy 2004, 29, 529–547. [Google Scholar] [CrossRef]
  17. Setoguchi, T.; Takao, M.; Santhakumar, S.; Kaneko, K. Study of an Impulse Turbine for Wave Power Conversion: Effects of Reynolds Number and Hub-to-Tip Ratio on Performance. J. Offshore Mech. Arct. Eng. 2004, 126, 137–140. [Google Scholar] [CrossRef]
  18. Liu, Z.; Cui, Y.; Li, M.; Shi, H. Steady state performance of an axial impulse turbine for oscillating water column wave energy converters. Energy 2017, 141, 1–10. [Google Scholar] [CrossRef]
  19. Badhurshah, R.; Dudhgaonkar, P.; Jalihal, P.; Samad, A. High efficiency design of an impulse turbine used in oscillating water column to harvest wave energy. Renew. Energy 2018, 121, 344–354. [Google Scholar] [CrossRef]
  20. Badhurshah, R.; Samad, A. Multiple surrogate based optimization of a bidirectional impulse turbine for wave energy conversion. Renew. Energy 2015, 74, 749–760. [Google Scholar] [CrossRef]
  21. Liu, Z.; Cui, Y.; Xu, C.; Shi, H.; Kim, K. Transient simulation of OWC impulse turbine based on fully passive flow-driving model. Renew. Energy 2018, 117, 459–473. [Google Scholar] [CrossRef]
Figure 1. View of the impulse turbine. (Figure adapted from [7]).
Energies 12 00939 g001
Figure 2. Reference geometry with plate guide vane (a) and airfoil guide vane (b) (figures adapted from [5]).
Energies 12 00939 g002
Figure 3. (a) Detail of the flow passage with guide vanes and rotating blades. (b) Detail of the guide vane. (c) Detail of the blade.
Energies 12 00939 g003
Figure 4. Reference variable (torque on the shaft) as function of the number of mesh elements.
Energies 12 00939 g004
Figure 5. (a) Input coefficient (b) Torque coefficient and (c) Turbine efficiency for different flow coefficient.
Energies 12 00939 g005
Figure 6. Flow pattern for different flow coefficients ϕ . (a) φ = 0.38; (b) φ = 1.33; (c) φ = 2.44.
Energies 12 00939 g006
Figure 7. Influence of the guide vane type on the efficiency. (a) Present numerical study and (b) previous experimental results [5].
Energies 12 00939 g007
Figure 8. Flow pattern for (a) airfoil type vane and (b) plate type vane. ϕ = 1.24 .
Energies 12 00939 g008
Figure 9. Influence of the number of guide vanes on the efficiency.
Energies 12 00939 g009
Figure 10. (a) Present numerical results. Efficiency vs Flow coefficient for different rotor-stator gap G l r . (b) Experimental results [5]. Mean efficiency for different rotor-stator gap G l r .
Energies 12 00939 g010
Figure 11. Influence of the hub to tip ratio ν on the efficiency of the turbine. (a) Present numerical study. (b) Setoguchi’s results for ν 0.7 [5]. (c) Setoguchi’s results for ν 0.7 [17].
Energies 12 00939 g011
Figure 12. Streamlines for different hub to tip ratio ν and φ = 1.03. (a) ν = 0.6, (b) ν = 0.7, (c) ν = 0.75.
Energies 12 00939 g012
Table 1. Variations of the parameters with respect to Figure 2a.
Parameter ChangedReference ValueVariations
Guide vane typePlate typeAirfoil type (Figure 2b)
Guide vane number2624, 22
Stator-Rotor gap ( G l r ) 0.370.09, 0.19, 0.28, 0.56
Hub to tip Ratio ( ν = D h / D t ) 0.70.55, 0.6, 0.65, 0.75

