Article

Intelligent Control of Wind-Assisted PHEVs Smart Charging Station

by
Syed Zulqadar Hassan
1,*,
Tariq Kamal
2,
Muhammad Hussnain Riaz
3,
Syed Aamir Hussain Shah
4,
Hina Gohar Ali
5,6,
Muhammad Tanveer Riaz
7,
Muhammad Sarmad
8,
Amir Zahoor
1,
Muhammad Abbas Khan
9 and
Julio Pascual Miqueleiz
10
1
Department of Electrical Engineering, National Univeristy of Computer and Emerging Sciences, Chiniot–Faisalabad Campus, 35400 Chiniot, Pakistan
2
Department of Electrical and Electronics Engineering, Sakarya University, Faculty of Engineering, 54050 Serdivan/Sakarya, Turkey
3
Department of Electrical Engineering, Lahore University of Management Sciences (LUMS), 54792 Lahore, Pakistan
4
Ministry of Planning, Development and Reform, 44000 Islamabad, Pakistan
5
Department of Telecommunications and Systems Engineering, Autonomous University of Barcelona (UAB), 08193 Bellaterra, Barcelona, Spain
6
School of Electrical Engineering and Computer Science, National University of Science and Technology (NUST), 44000 Islamabad, Pakistan
7
School of Electrical Engineering, The University of Faisalabad, 38000 Faisalabad, Pakistan
8
Department of Electrical Engineering, University of Engineering and Technology Lahore, 54890 Punjab, Pakistan
9
Department of Electrical Engineering, Balochistan University of Information Technology Engineering and Management Sciences, Airport Road Baleli, 87650 Quetta, Balochistan, Pakistan
10
Department of Electrical, Electronic and Comunications Engineering, Institute of Smart Cities (ISC), Public University of Navarre (UPNA), Campus Arrosadia s/n, Edificio de los Pinos, 3100 Pamplona6, Spain
*
Author to whom correspondence should be addressed.
Energies 2019, 12(5), 909; https://doi.org/10.3390/en12050909
Submission received: 24 January 2019 / Revised: 26 February 2019 / Accepted: 4 March 2019 / Published: 8 March 2019
(This article belongs to the Collection Wind Turbines)

Abstract

:
Two technology opportunities, integration of renewable energy sources and the electrification of vehicles are being encouraged to reduce dependency on fossil fuels and pollution problems. Nevertheless, the huge increase of plug-in hybrid electric vehicles (PHEVs) on roads will cause an additional load in demand, especially at rush hours, and therefore, threatens the stability of existing power grids. Considering PHEV stay for several hours in the workplace, (i.e., university), this may provide an inimitable framework to charge PHEV from wind in the workplace. This paper introduces the possibility of introducing intelligent control of wind power and battery storage units as supplementary power sources for future PHEV charging demands during rush hours. The operation of the proposed algorithm is based on the priority levels of PHEVs charging, and fluctuations in DC link voltage levels due to the variation in wind speed. The priorities of PHEVs charging are developed according to their power requirements, maximum rating of distribution transformer and park duration of PHEVs in the workplace during wind speed. Various non-isolated proportional–integral controllers and improved intelligent fuzzy control are used to keep a minimum critical DC link voltage to permit the power conditioning system to operate a charging station uninterruptedly, even at low wind speed. The improved intelligent fuzzy controller also contributes to minimizing the stress on the DC bus and ensures quality output power. The performance of the proposed charging station is verified for the real PHEV under real-world record of wind speed. All the energy sources, electric charging station and their controllers are designed in MATLAB/Simulink. Finally, the feasibility of proposed charging station is checked experimentally in the laboratory.

1. Introduction

PHEVs have received a significant interest in the transport sector due to the advances in battery storage system and grid plugging capability, coupled with the rising oil prices and high environmental issues [1]. Therefore, each year the purchase of plug-in hybrid electric vehicles (PHEVs) increases worldwide [2]. The commercialization of PHEVs could overload the existing power systems, which may result in variations in frequency, upgradation of distribution transformer (DT), and eventually network losses at the customer side [3,4]. Specifically, uncontrolled charging can cause grid stability problems on the local scale. This cannot be ignored and there is a need for some possible solution. Some researchers suggest night charging of PHEVs, but the possible challenge of night-charging is the use of the time-of-use (TOU) pricing which is planned to oppose charging during the daytime. Normally, people park their vehicles in workplaces for at least five hours in a day. Therefore, to develop an electric charging station in these places is quite the best option, but this would introduce high critical overloading issues. However, while this problem can be solved by installation of higher power rating transformers, it is rather an expensive option.
Since the best approach is to utilize the power of renewable energy sources such as photovoltaic (PV) and wind to design a smart PHEVs charging station. However, the unfortunate fact regarding PV and wind is that they do not generate power around the clock. PV-based charging station hascommonly being suggested for charging low to mid-range PHEVs. For instance, several authors have suggested such kinds of PHEV charging stations in the literature [5,6]. In these papers, all the authors have suggested PHEV charging from PV power based on sensing of DC link voltage. The purpose of all these studies is to decrease the burden on the DT. However, the shortcoming of such charging stations is that, they are only suitable for small to medium range PHEVs. Similarly, some studies have reported considering PHEVs charging from PV system, but they did not emphasize on the loading of DT [7,8].
Many researchers have concluded the effect of PHEV charging on the DT as reported in [9,10,11]. In [9], the authors have reviewed the impact of PHEVs on distribution networks. In [10], the authors have studied the concerns due to the adding of PHEV on the residential distribution network, however, the number of PHEVs per DT was assumed at two. The authors have discussed in [11], that the life of the DT can be lengthen through power management of EV battery charge profile. However, the literature is still limited regarding PHEV charging from renewable energy under real data via intelligent control. Similarly, in [12,13], the authors have concluded in their studies that the peak demand appears due to the charging of EVs, and they have proposed that proper load management and scheduling are needed.
Modern research in power electronics technology for the control of small wind turbines has confirmed that wind is a viable option for charging PHEVs. For example, several authors have suggested the integration of wind and PHEVs in the literature [14,15,16,17,18,19]. In [14], the authors have proposed wind energy for designing PHEVs charging station in the future. The power management for charging high penetration of PHEVs from the wind farm is developed in [15]. The authors have described PHEV as an energy storage system (ESS) which supplies power to grid during rush hours. The author did not provide a clear and well-defined structure for PHEV charging stations (CS) and their proposed work is possible using only a battery storage system. The positive outcomes of large-scale implementation of PHEVs CS due to wind energy are suggested in [16]. Similarly, a small scale PHEVs CS powered from wind is proposed in [17]. In [18], the authors described that PHEVs have the potential to expand the capacity of wind energy regionally as well as nationally. PHEVs can utilize excess wind energy production that would otherwise be wasted which increases the economics of wind energy generation. The same concept is also supported in [20]. Furthermore, the intermittent nature of wind is balanced through the PHEV smart charging algorithm in discussed in [21]. Since keeping the above-mentioned studies, no one considers the real weather pattern but bases results on virtual generated weather characteristics. In addition, the intelligent control of wind is essential for a regulated and stable DC bus voltage. For example, fluctuations in bus voltage cause power imbalance that originate from different sources of disturbances such as sudden change in wind speed, and abrupt change in PHEV’s demand. Such a power imbalance results in extra energy. The above-mentioned papers do not discuss the control of wind in their charging station which is essential for maximum efficiency.
This paper provides a smart CS for PHEVs in a grid-connected wind intelligent system where the required power for PHEVcharging is effectively managed from wind and/or grid integrated wind generation. The operation of the charging algorithm is working on power sensing due to the variation in wind speed. The output of wind is controlled via conventional proportional-integral-derivative (PID), and improved fuzzy PID controllers. The proposed control law protects the system from possible harms in high wind speed regions and maintained variations of nominal output power which provides efficient power for CS. All the power converters in the proposed CS shared a common minimum DC bus voltage level which is critical to determine the power flow direction. The priorities of PHEV charging are set based on their power demand, maximum rating of DT and stay duration of PHEV in parking lots. The proposed charging algorithm allows maximum power from wind to charge the PHEVs. In addition, the proposed CS also comprises of an ESS as supplementary power sources to store power in off peak hours, which can be used in rush hours to charge the PHEVs or provide to the grid. In the proposed system, each wind turbine is equipped with a transformer stepping up from the generator voltage—typically low voltage. If there is a fault at any wind turbine (WT), the power conditioning system which is developed in the target study will isolate (transformer isolation) that portion from the rest of the system to keep continuity of system. Further, the intelligent control of wind ensures quality power with minimum total harmonic distortion (THD) before the DC conversion phase and presents less energy loss. MATLAB/Simulink modeling, simulation and then experimental work confirms the effectiveness of the proposed CS. Further, it is important to state that this work is the extension of work originally presented in Proceedings of the Frontiers of Information Technology Conference 2015 [19]. The paper has been revised and improved in terms of results and discussion.
This paper is divided as follows. First, the proposed CS system architecture is scrutinized in Section 2. Section 3 provides the control of system components. Section 4 explains the energy management system and its operation. Section 5 describes results. Finally, conclusions are provided provided in Section 6.

2. Proposed Charging Station Description

The detailed structure of proposed CS is shown is Figure 1. The main components of the proposed CS were the medium scale wind turbine (MSWT), an ESS as a backup system, three charging docks (CDs) to charge PHEV batteries, domestic load (DL), national grid (NG), power electronics interfacing (PEI), DT and the main controller. The PEI contained all the electronics components, i.e., controlled rectifier for WT, buck converters for CDs, buck/boost converter for ESS and a three-phase bi-directional converter. The MSWT was coupled with permanent magnet synchronous generator (PMSG) to generate power (AC) from the available wind energy which was later converted into DC through an uncontrolled rectifier. To extract the maximum power from the available wind speed, the maximum power point tracking (MPPT)-based controlled DC/DC boost converter was connected with a rectifier. The ESS was connected with DC bus using DC/DC bust/boost converter which is used for charging and discharging. In the proposed CS, there were three charging docks (CD1, CD2 and CD3). These three CDs were connected to a DC bus via a buck converter. The ESS will absorb excess power or provide power when there is a deficiency of power from the grid and WT. The NG was coupled with proposed CS to ensure uninterruptable supply of power. The proposed CS was designed in various configurations to effectively use the locally available renewable energy source to meet the demand. The proposed CS was based on the concept of sensing variation in DC-link voltage. Whenever the change in wind speed or RL occurred, the DC-link voltage changed. Based on change in DC-Link voltage, the loading condition of DT was scheduled for PHEVs charging/discharging. Therefore, various configurations of proposed CS depended on a common DC bus voltage level which was critical to determine the power flow direction and thus the operations of proposed CS is divided in several modes.

DC-Link Voltage Sensing

The proposed CS can also be presented as in Figure 2. The DC half structures wind, CDs and ESS while the AC half structures DL, NG and DT. PDCL and PC represent the total output power from the DC half and AC half (equivalent to three-phase converter power), respectively. From the figure, the power balance equation can be written as:
P D C P = P D C L P C .
The power stored in capacitor is given as:
P D C P = d d t 1 2 C V D C L 2 .
Putting (2) into (1) and values of P D C L and P C
C V D C L d V D C L d t = P W T + P E S P C D i + P N G P D L .
Equation (3) is very important, and it shows that P W T , P C D i and P D L are the main factors causing variation in DC-link voltage. This variation in the DC link voltage level was used to either initiate or terminate the charging of PHEVs.

3. Control of System Components

3.1. DC/AC Bi-Directional Converter

The proposed charging setup was synchronized with a national grid through a bidirectional converter as shown in Figure 3. As domestic load was also the part of the proposed setup, therefore, different linear and non-linear disrupt the quality of power in terms of voltage and frequency. To control it, first two proportional-integral (PI) controllers and then improved fuzzy controllers wereembedded along with hysteresis current control strategy and RL first order filter. The PI controllers calculate power errors to generate Id-, Iq-, and zero-axes components. Through dq/abc conversion, the respective abc reference currents were established. Then, both the actual and reference currents were matched. Moreover, the error signal was passed to a hysteresis current control scheme which send some appropriate signals to the PWM. The PI controllers tried to minimize the error in order to adjust the desired powers. Moreover, it is needed that grid current must be in phase with the grid voltage and have a unity power factor. For this purpose, the phase angle of the grid voltage was calculated using a phase locked loop. The gird current was adjusted using an outer current control loop with PI voltage controller while the unity power factor was adjusted using an inner current control loop through PI current controller as explained in (4) and (5).
I L _ r e f = k p v V d c _ r e f V d c + k i v V d c _ r e f V d c d t
I L _ r e f = k p i I r e f I L + k i i I r e f I L d t ,
where I L r e f represents reference current of grid. The values k p v , k i v , k p i and k i i are the gains of the PI voltage and PI current controllers. V d c , I L , V d c r e f and I r e f are the DC bus actual voltage DC bus actual current, DC bus reference voltage and DC bus reference current, respectively.

3.2. PMSG and MSWT (MPPT) Boost Converter Control

The MSWT generates mechanical energy from wind speed which is then converted into electrical energy. The output of MSWT in terms of mechanical power is written as:
P m = 1 2 ρ π R 2 V 3 C p ( η , α )
The MSWT was synchronized with PMSG. The PMSG was represented by the following equations in terms of corresponding flux linkages;
1 ω b d ψ d s d t = v d 1 + R s i d s + ω e ψ q s
1 ω b d ψ q s d t = v q 1 + R s i q s + ω e ψ d s
where
ψ d s = L d s i d s ψ m , ψ q s = L q s i q s
To control the boost converter, control of optimal torque for maximum power extraction was necessary. In case of MSWT, it was required for the system to operate at an optimal tip speed to generate maximum mechanical power from wind speed. In this scheme, the controller attempts to fix the PMSG torque to maximum torque reference for a given wind speed. The relation between optimal torque and mechanical angular velocity of the PMSG rotor is specified as:
τ m o p t = α o p t ω m 2
where α o p t stands for optimal constant in-terms of optimal tip speed ratio. The control of optimal torque controller is shown in Figure 4.
Further, to get maximum benefits from wind turbine in the CS, an improved fuzzy logic was designed. In this work, the Mamdani rules base system was adopted and the defuzzification process was performed using the centroid method. The fuzzy logic operates on two variables; error (e) and change in error ( Δ e ). The servo motor (as an actuator) is placed among fuzzy controller and WT system to provide the desired pitch angle ( α ) as illustrated in Figure 4. Figure 5 and Figure 6 provides the input fuzzy sets in terms of (e) and ( Δ e ), and the output fuzzy in term of change in α is depicted in Figure 7. Seven linguistic variables were taken during the implementation of fuzzy logic for each input. Table 1 shows the fuzzy proposed rule matrix and its surface graph is shown in Figure 8.

4. Energy Management System (EMS)

The proposed CS has been supervised by EMS, which regulated and controlled the power flow from different energy sources to PHEVs. It handled all the power regulation, energy management, and switching sequences of the entire CS. Basically, the EMS operates on several inputs. The control input for EMS is WT output power ( P W T ). Based on available wind power, the EMS decides the power flow strategy to organize them in different operating states/modes. From the Figure 1, P C P 1 , P C P 2 and P C P 3 have been highlighted as power consuming units of charging points one, two, and three. P E S , P N G , P D L and P C which represents ESS output power, national grid output power, domestic load and converter power flow, respectively. T v j represents the state of charge (SOC) of j-th PHEV. The proposed EMS consists of a battery protection system (BPS), which prevents the PHEV batteries from overcharging, which was made responsible for providing charge with a pre-defined charging rate. The output of EMS contains switches for driving sequences, and power references to correspond with converters. The output power of a MSWT is highly dependent upon the wind speed. The metrological data used in this research has been recorded at Sakarya University, Turkey, located at latitude 40.7833 North and longitude of 30.400 East on 10th June 2018.

4.1. Operations of EMS

The operation of EMS is to properly manage and regulate power sharing. The operation of EMS is based on the power balance equation and an algorithm. For proposed CS, the power balance equation can be written as:
P W T = P D L + P C D i ± P N G P E S .
Using (11), the excess power generated by WT system can be expressed as:
P E X = P D L + P C D i P W T = ( P E S + P N G ) .
The excess power was consumed by the national grid. Similarly, the deficiency of power can also be expressed as:
P D F = P D L + P C D i P W T = P N G .

4.1.1. Generalized Algorithm

  • Read the target values of P W T , P C D i , P N G , P D L , P C , P E S and T V i .
  • Check whether the car is present, or, if not present, then go to the next step, otherwise move to step number 13.
  • Once it has been confirmed that the car is present, then get the status of the WT output power. If power is available from the WT system, then it moves to the next step; otherwise go to step 10.
  • Check the power of the WT output. If it is greater than the charging point demanded (i.e., P W T > P D L ), then go to the next step, otherwise go to step 7.
  • All the WT generated power is being supplied to the corresponding charging point. Here, it will be tested if either the battery is fully charged or not (i.e., T V i < T V i m a x ). If, yes, then moveto the next step, otherwise keep this condition ‘on’ until the battery has been fully charged.
  • Once the battery has been fully charged, then pay attention to the power balance equation and check any excess power in the system. If the condition is true, then the excess power will be delivered to NG, else go to step 1.
  • Now, check the status of NG power; if it is less than the maximum power rating of NG, then move to the next step, otherwise go to step 9.
  • Deliver the required power to the CD. The CD demand is shared between the WT and NG. Check whether the battery is fully charged or not. If, yes, then go to step 1, otherwise follow the target mechanism until the battery has been fully charged. Then go to step 1.
  • As CP demand is not satisfied by the WT and NG, so, the remaining power is fulfilled by the ESS. It will charge the battery until it has been fully charged.
  • As WT power is not available, here, the status of power demand left for NG will determine whether it is greater than its highest rating of power or not. If yes, then move to next step, else go to step 12.
  • The acquired power for CDs is delivered under the sharing of NG and WT. So, charge the battery until its maximum SOC, then move to 1.
  • The required power of CDs has been fulfilled by the contribution of NG, WT and ESS. So, charge the battery until its SOC reaches its maximum value, then go to step 1.
  • As PHEV is not present, the WT output power will be checked. If PWT is greater than zero, it means that all the WT power is being delivered to DL and ESS charging. Go to step 1, else go to the next step.
  • The DL demand is satisfied by the contribution of NG and ESS without incorporating WT. Go to step 1.
The complete flow pattern of the above stated algorithm is presented in Figure 9. Based on the above algorithm, the EMS characterizes the power flow in proposed CS into several operating states.

4.1.2. Operating States

The system power flow is divided into seven operating states; state I: NG rectification WT/ESS disconnected PHEVs charging (NRWEDPC), state II: NG rectification WT disconnected ESS connected PHEVs charging (NRWDECPC), state III: NG rectification WT connected ESS disconnected PHEVs charging (NRWCEDPC), state IV: NG rectification WT/ESS connected PHEVs charging (NRWECPC), state V: NG inversion WT connected ESS disconnected PHEVs charging (NIWCEDPC), state VI: NG disconnected WT disconnected ESS disconnected PHEVs not-charging (NDWDEDPN), and state VII: NG inversion WT connected ESS connected PHEVs not-charging (NIWCECPN).
State I: NRWEDPC
Condition: P W T = 0 and P N G < P N G M .
In this operating state, the WT system does not generate any power, because of unavailability of wind. So, the whole charging facility has to rely on NG power. The total power demand for CS is less than the maximum power rating of NG that provides all the power to DL and CDs. The power provided to CDs is P C D i * = P N G P D L . The power flow for the current operating state is illustrated in Figure 10a.
State II: NRWDECPC
Condition: P W T = 0 and P N G > P N G M .
The second operating state highlights the scenario in which WT system has been disconnected while NG and ESS have been connected. Consequently, in the absence of acquired wind speed, the WT system is unable to generate any power. Therefore, the main DC/AC converter operates in a rectification mode to provide power from NG to CDs. But, in these circumstances, the demanded power ( P D L + P C D i ) is greater than the rating of the maximum power of NG. Therefore, the EMS decided to turn ‘on’ the ESS and fulfil the remaining power demand from it. The power provided to CDs is P C D i * = P N G P D L + P E S . The power flow pattern for present state is shown in Figure 10b.
State III: NRWCEDPC
Condition: 0 < P W T < P C D i and P N G < P N G M .
This state of operation occurs when the WT system starts generating power. The WT output power is less than the total demand of CDs due to low wind speed. So, in this case, NG supports the WT system to overfill the power deficiency for CDs created by WT. The NG not only fulfilled the demand of DL, but also provided the acquired power to the CDs. In this case, the load on NG is less than its maximum power rating. So, NG easily provided all the power, keeping ESS un-operational. The power delivered to CDs is P C D i * = P W T + P N G . The entire power flow scheme for this state has been illustrated in Figure 10c.
State IV: NRWECPC
Condition: 0 < P W T < P C D i and P N G > P N G M .
In this state WT system generates power, but it is not sufficient to fulfill the demand of CDs power. So, NG added itself to WT to further overcome the power deficiency. NG provides its maximum power, but the power deficiency has been found greater than the maximum power rating of NG. The combined powers of WT and NG not fulfill the power shortage. So, the final energy source i.e., ESS supply all deficient power. The power supplied to the CDs is P C D i * = P W T + P N G + P E S . The power flow for the current state has been shown in Figure 10d.
State V: NIWCEDPC
Condition: P W T > P C D i .
In this state, the WT system generates sufficient power to fulfill the CDs demand. Consequently, ‘excess’ power generated by the WT system has been provided to DL. Once the DL has been satisfied, if the system still has ‘excess’ power, it will be given to NG (converter operates in inversion mode). The power delivered to NG is P N G * = P W T P C D i P D L . The power flow of all energy sources has been depicted in Figure 10e.
State VI: NDWDEDPN
Condition: P W T < 0 and no car is present.
The WT system does not generate any power due to no wind, and no car is present in CDs. Thus, in this state, the NG only fulfils the DL demand (converter discounted in this state). The power delivered to DL is P D L * = P N G . The power flow of all energy sources has been depicted in Figure 10f.
State VII: NIWCECPN
Condition: P W T > 0 and no car is present.
In this state, the WT system generates power from available wind speed. There is no car present in any of the charging docks. Therefore, the overall WT output power is shared between DL and ESS (for the charging purposes). The power delivered to DL is P D L * = P W D P E S + P N G . The power flow of all energy sources has been depicted in Figure 10g.

5. Results and Discussion

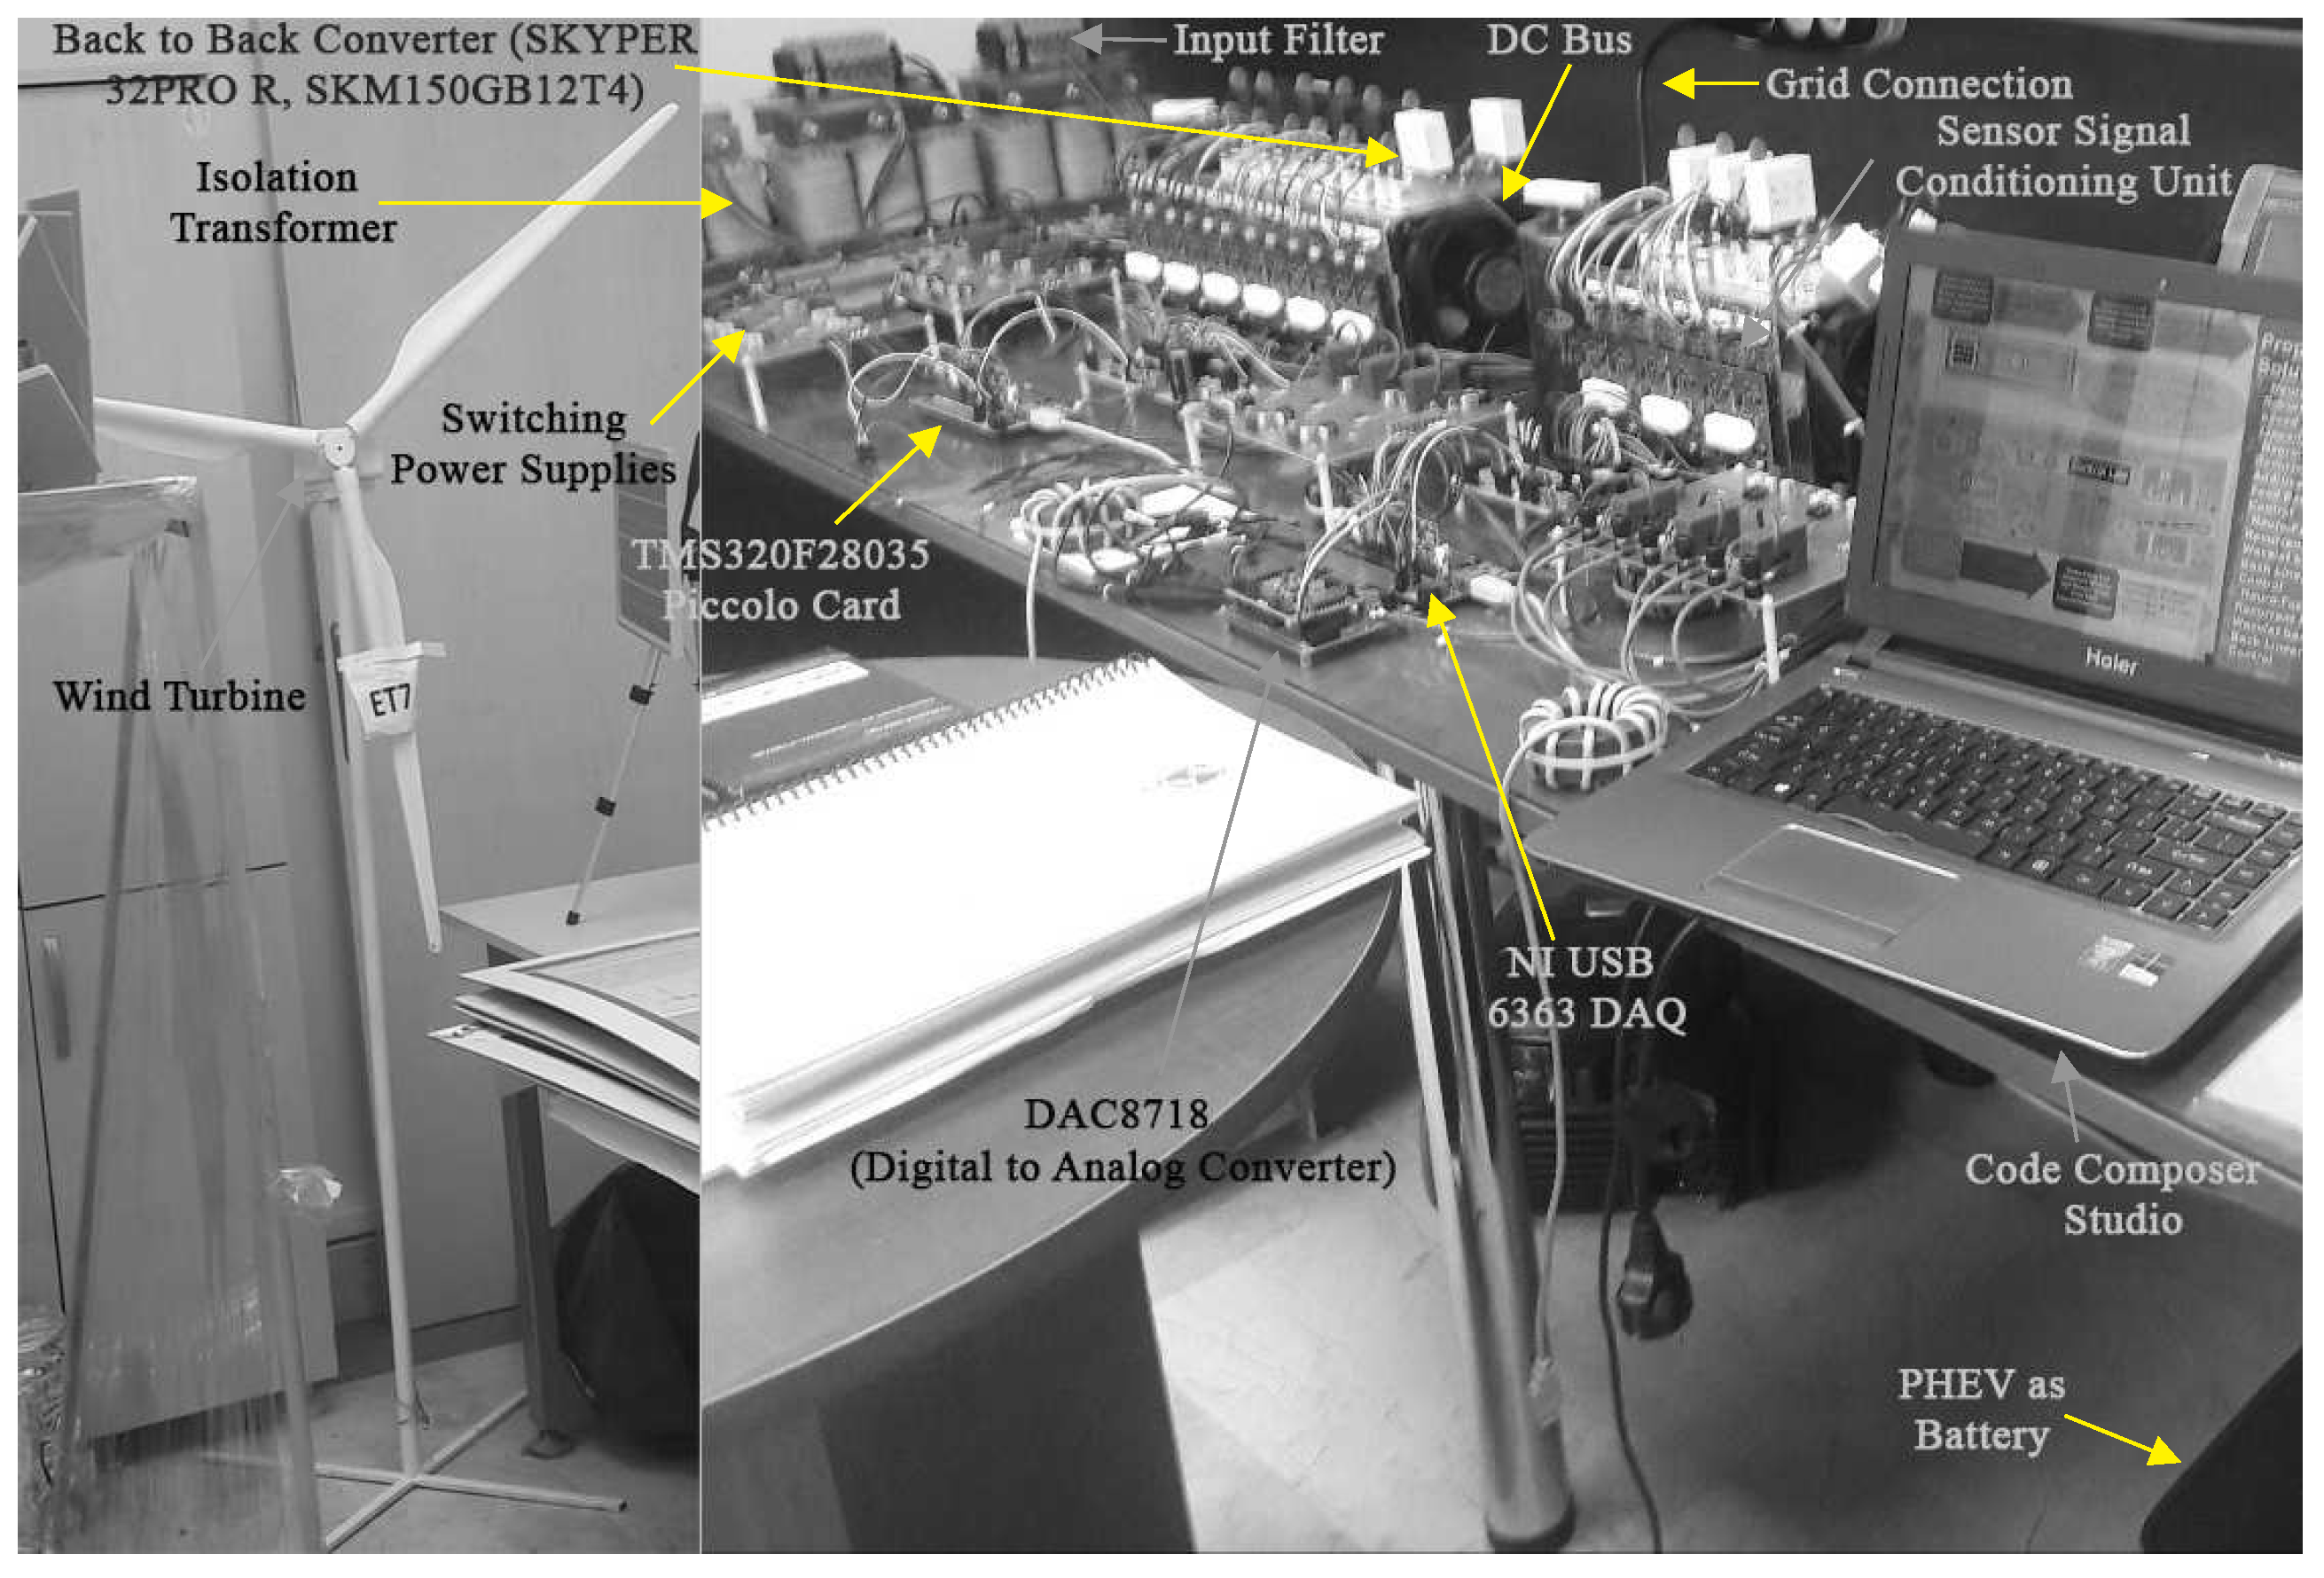
5.1. MATLAB Simulation

The proposed algorithm for the CS was set up in MATLAB/Simulink. All the energy sources are first modeled individually and then integrated with each other to foam a CS. Three charging points are considered in the proposed CS. The range of PHEV battery capacity is from 4.4 kWh to 24 kW [22], whereas in this research work the battery capacity is taken as 6.6 kWh, which is the standard rating of Honda Accord plug-in car [23]. Thirteen PHEVs are selected for the charging purpose at different timings. Their minimum and maximum SOCs are defined by the car owners. Once the battery reaches its maximum SOC, the BPS prevents it from further charging. The time schedule of charging, SOCs, CDs and car number (CN) are presented in Table 2. The technical parameters of WT, ESS, NG, DC/AC converter, DL, DC/DC converters and gains of all the controllers are enlisted in Table 3 and 
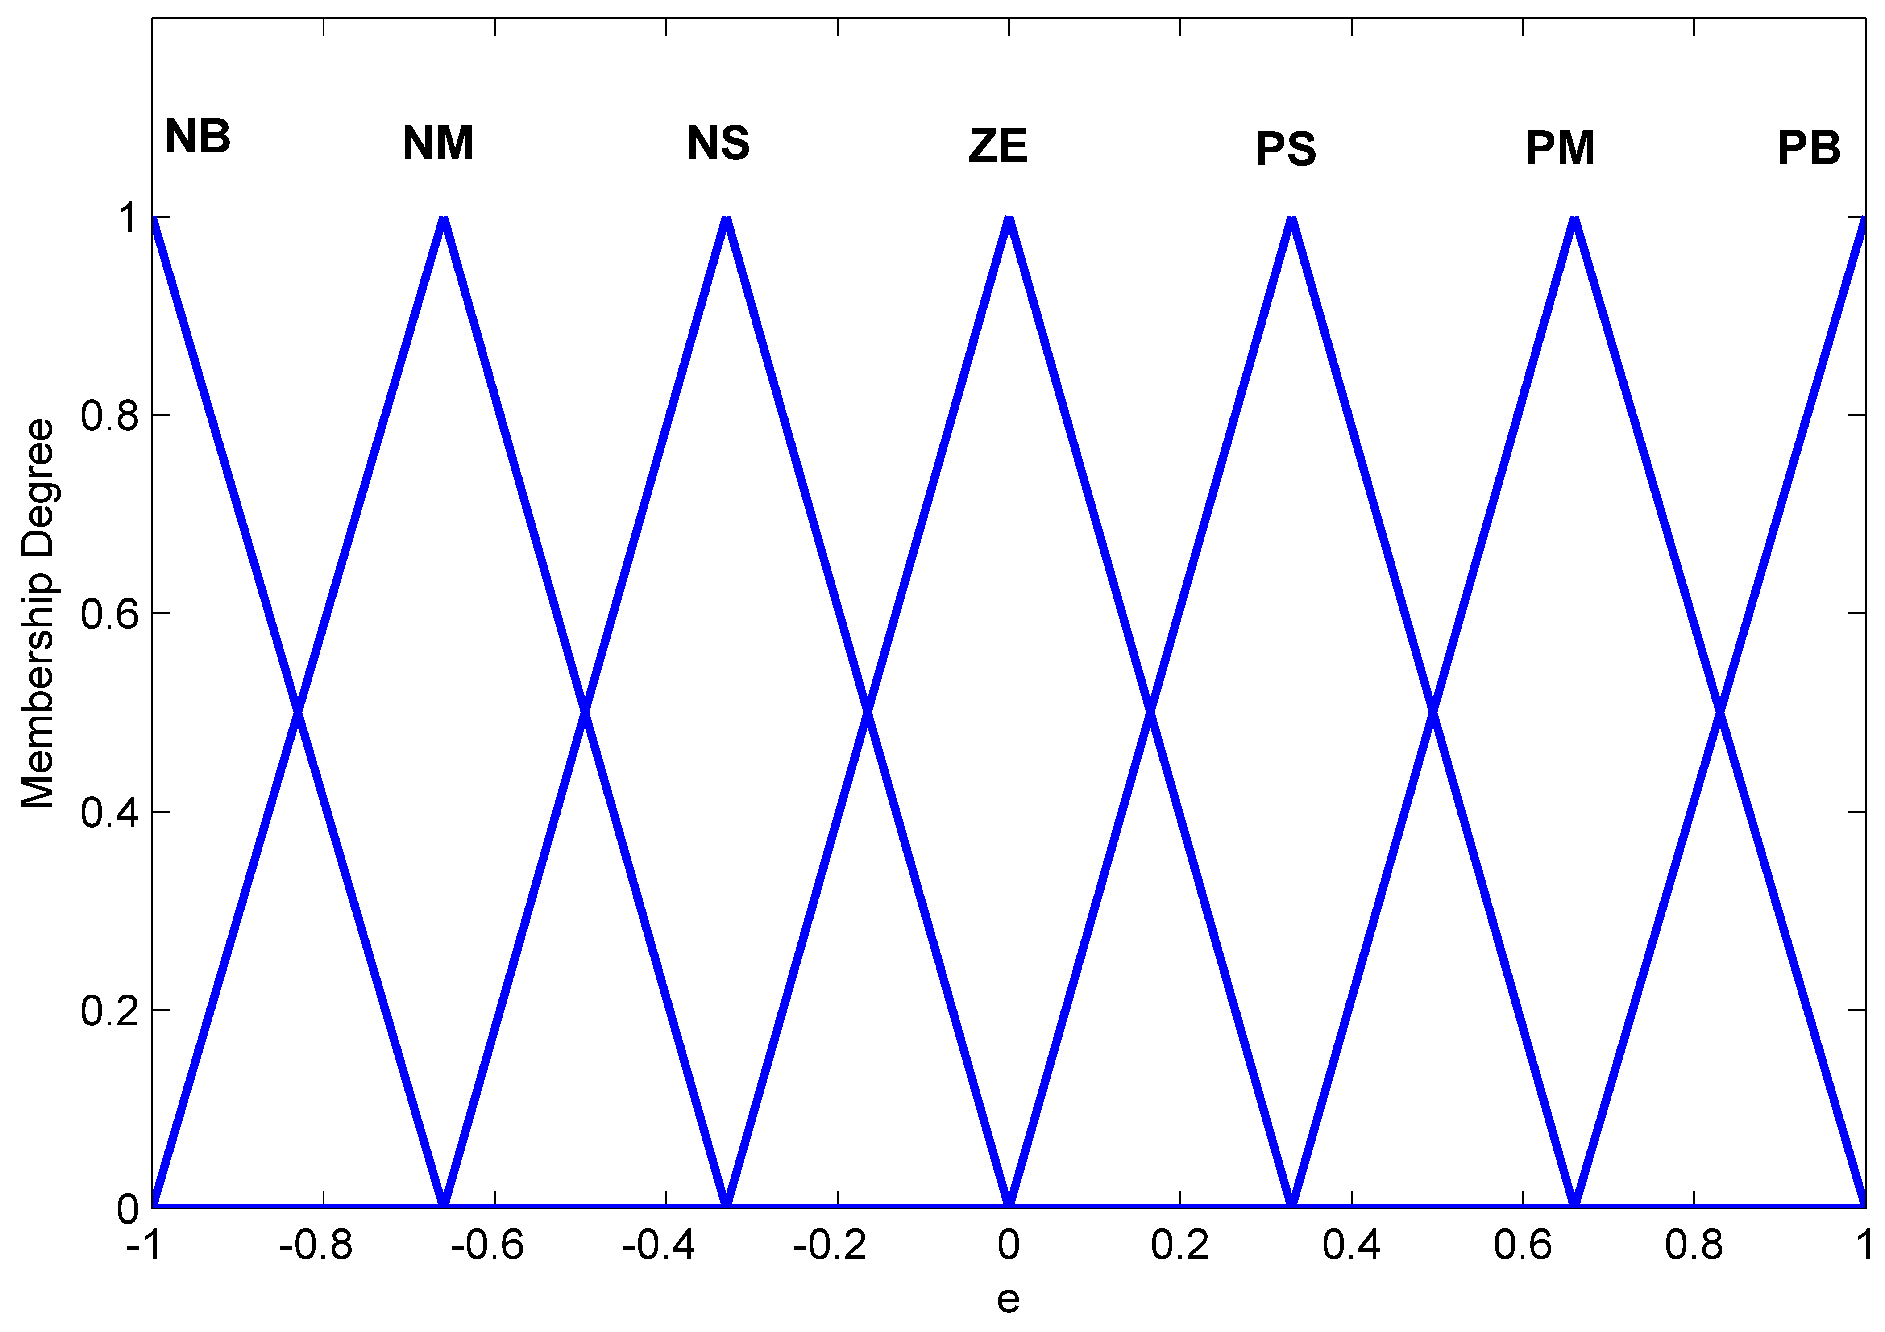
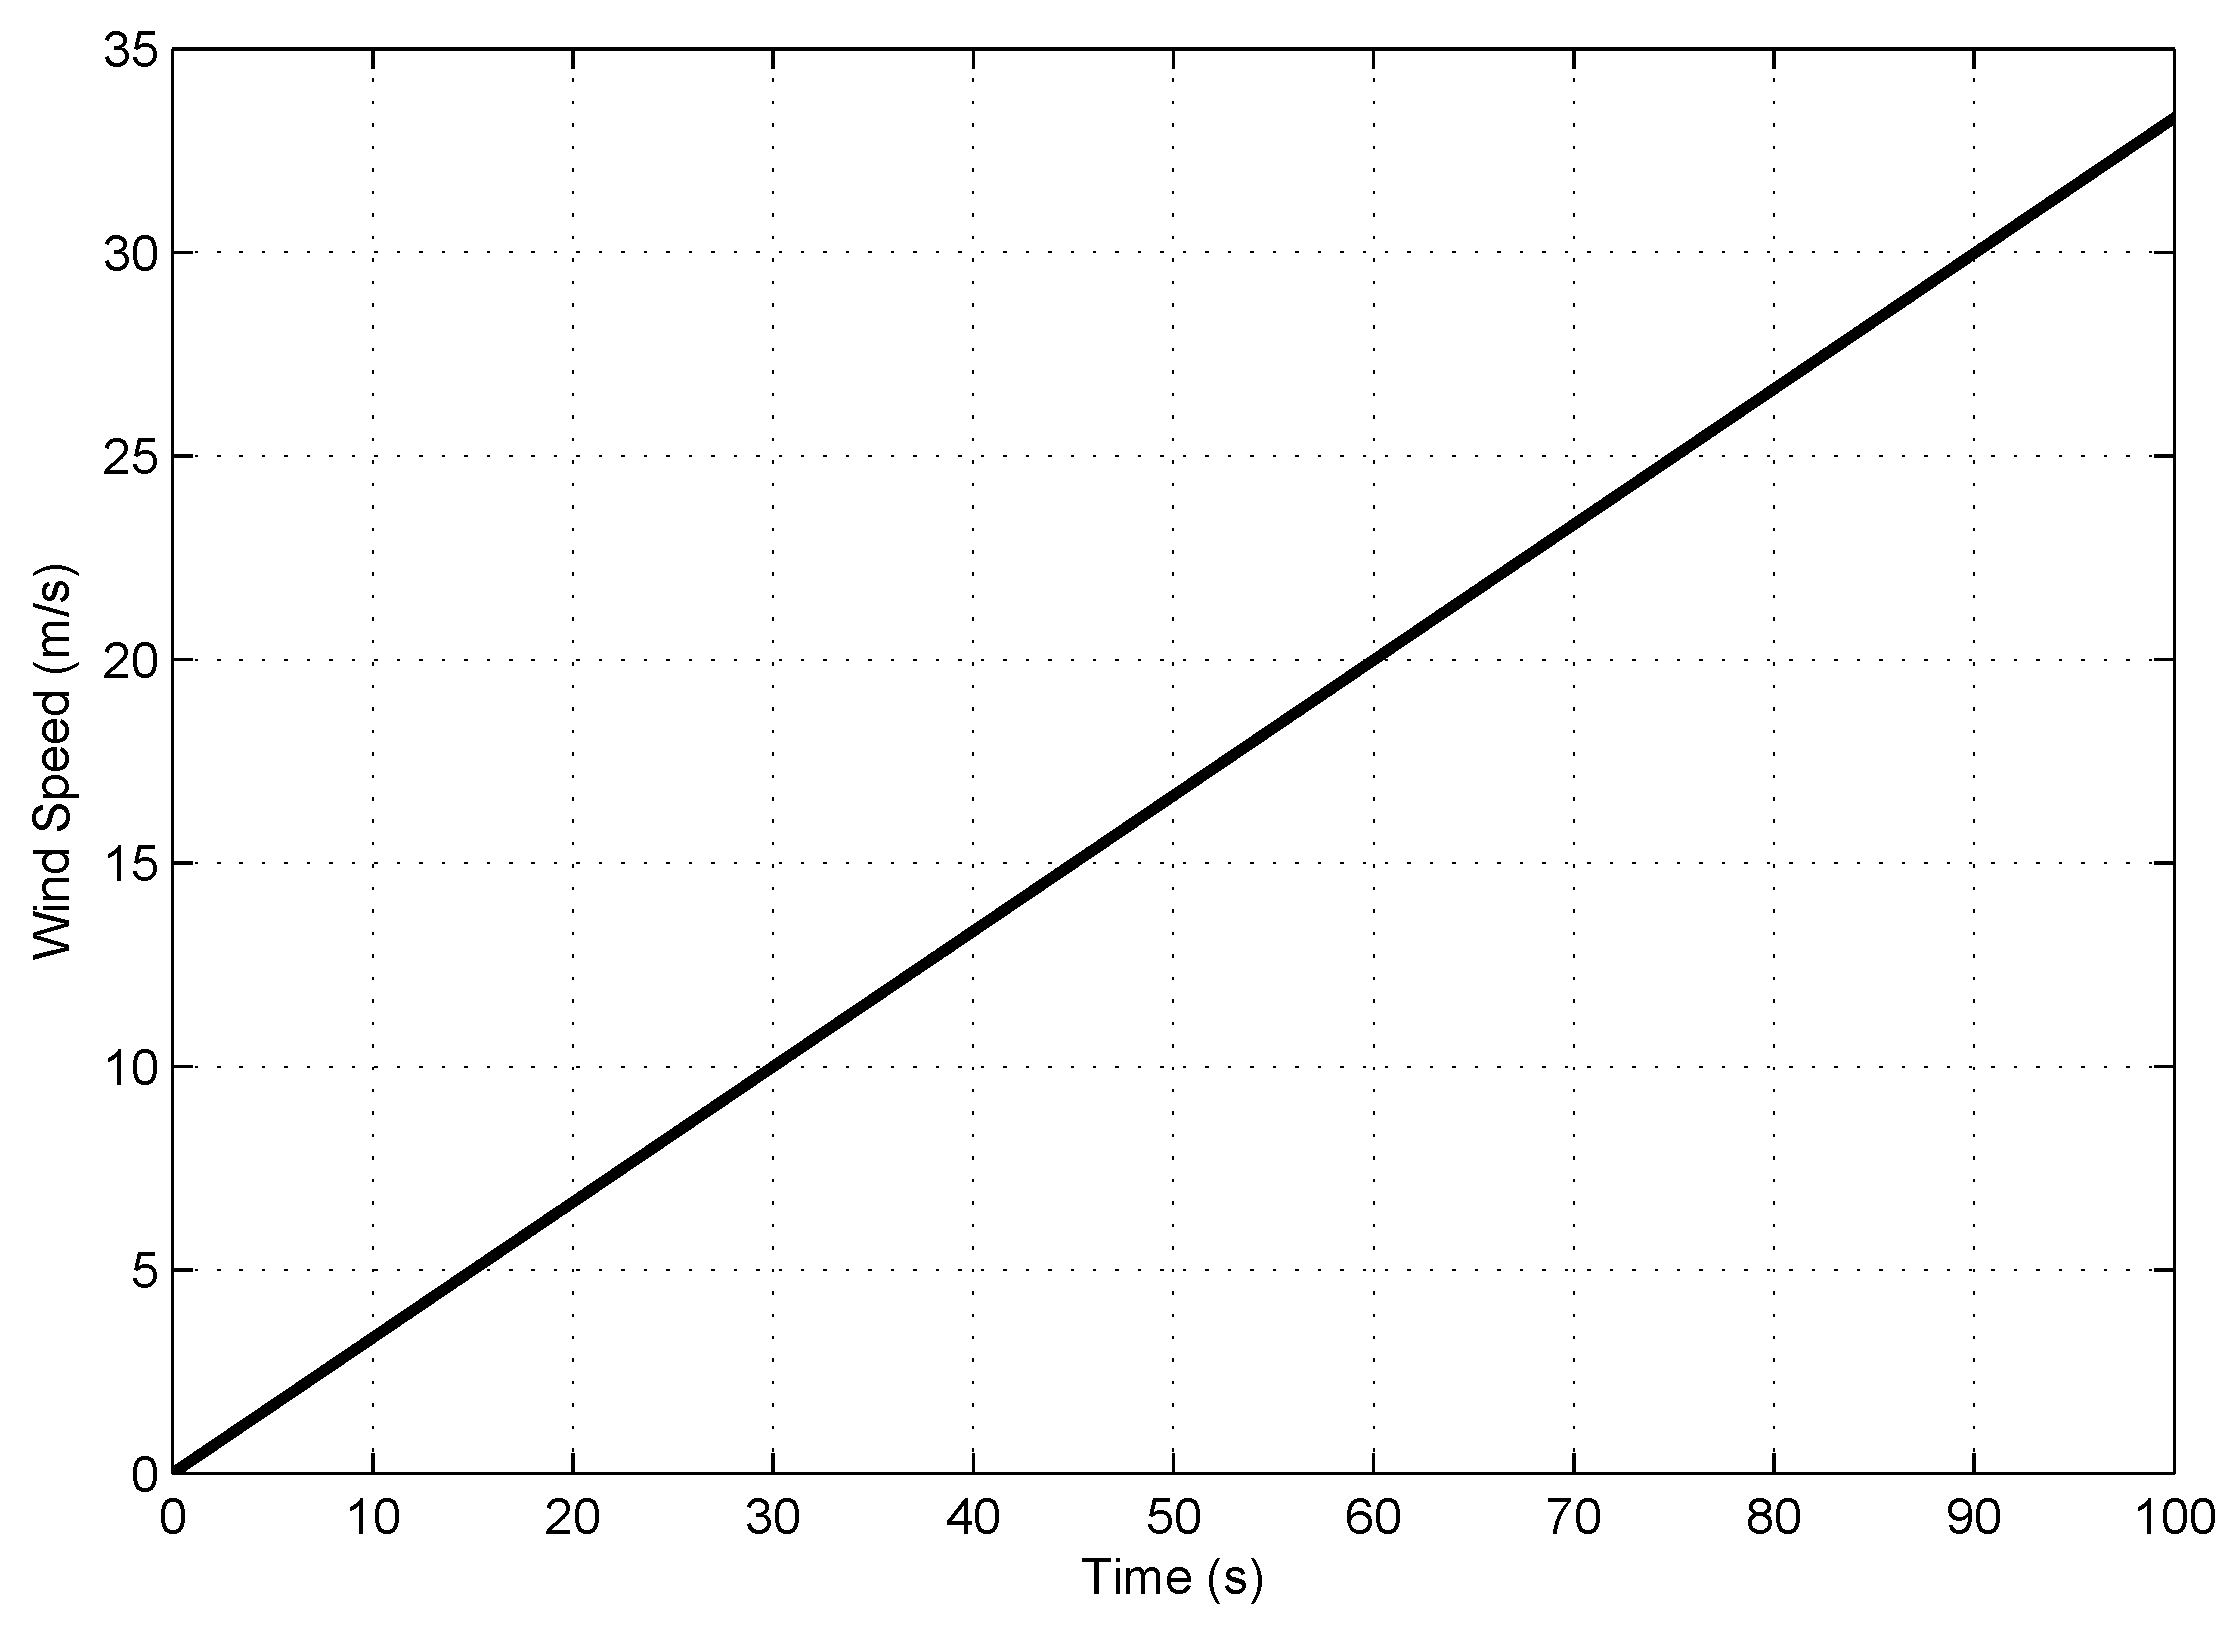
Table 4. Initially, the WT system is controlled with an improved fuzzy controller. The ramp function of wind speed is provided to the WT system as shown in Figure 11. As the wind speed and output power have a cubic relationship, therefore, output power is increased to 59.5 kW. At t = 39 s, the output power reaches its maximum limit. At this stage, the controller holds the output power to 59.5 kW as shown in Figure 12. Finally, once the wind speed reaches the cut-out speed, the output power drops to zero.
The improved fuzzy controller adjusts the pitch angle in order to obtain the maximum output power from the wind system. The variation in pitch angle versus time is shown in Figure 13. The comparison between the traditional PI controller and improved fuzzy controller is shown in Figure 14. The PI controller takes more than 1 s to stabilize the system, while an improved fuzzy controller stabilizes the system in 0.1 s.
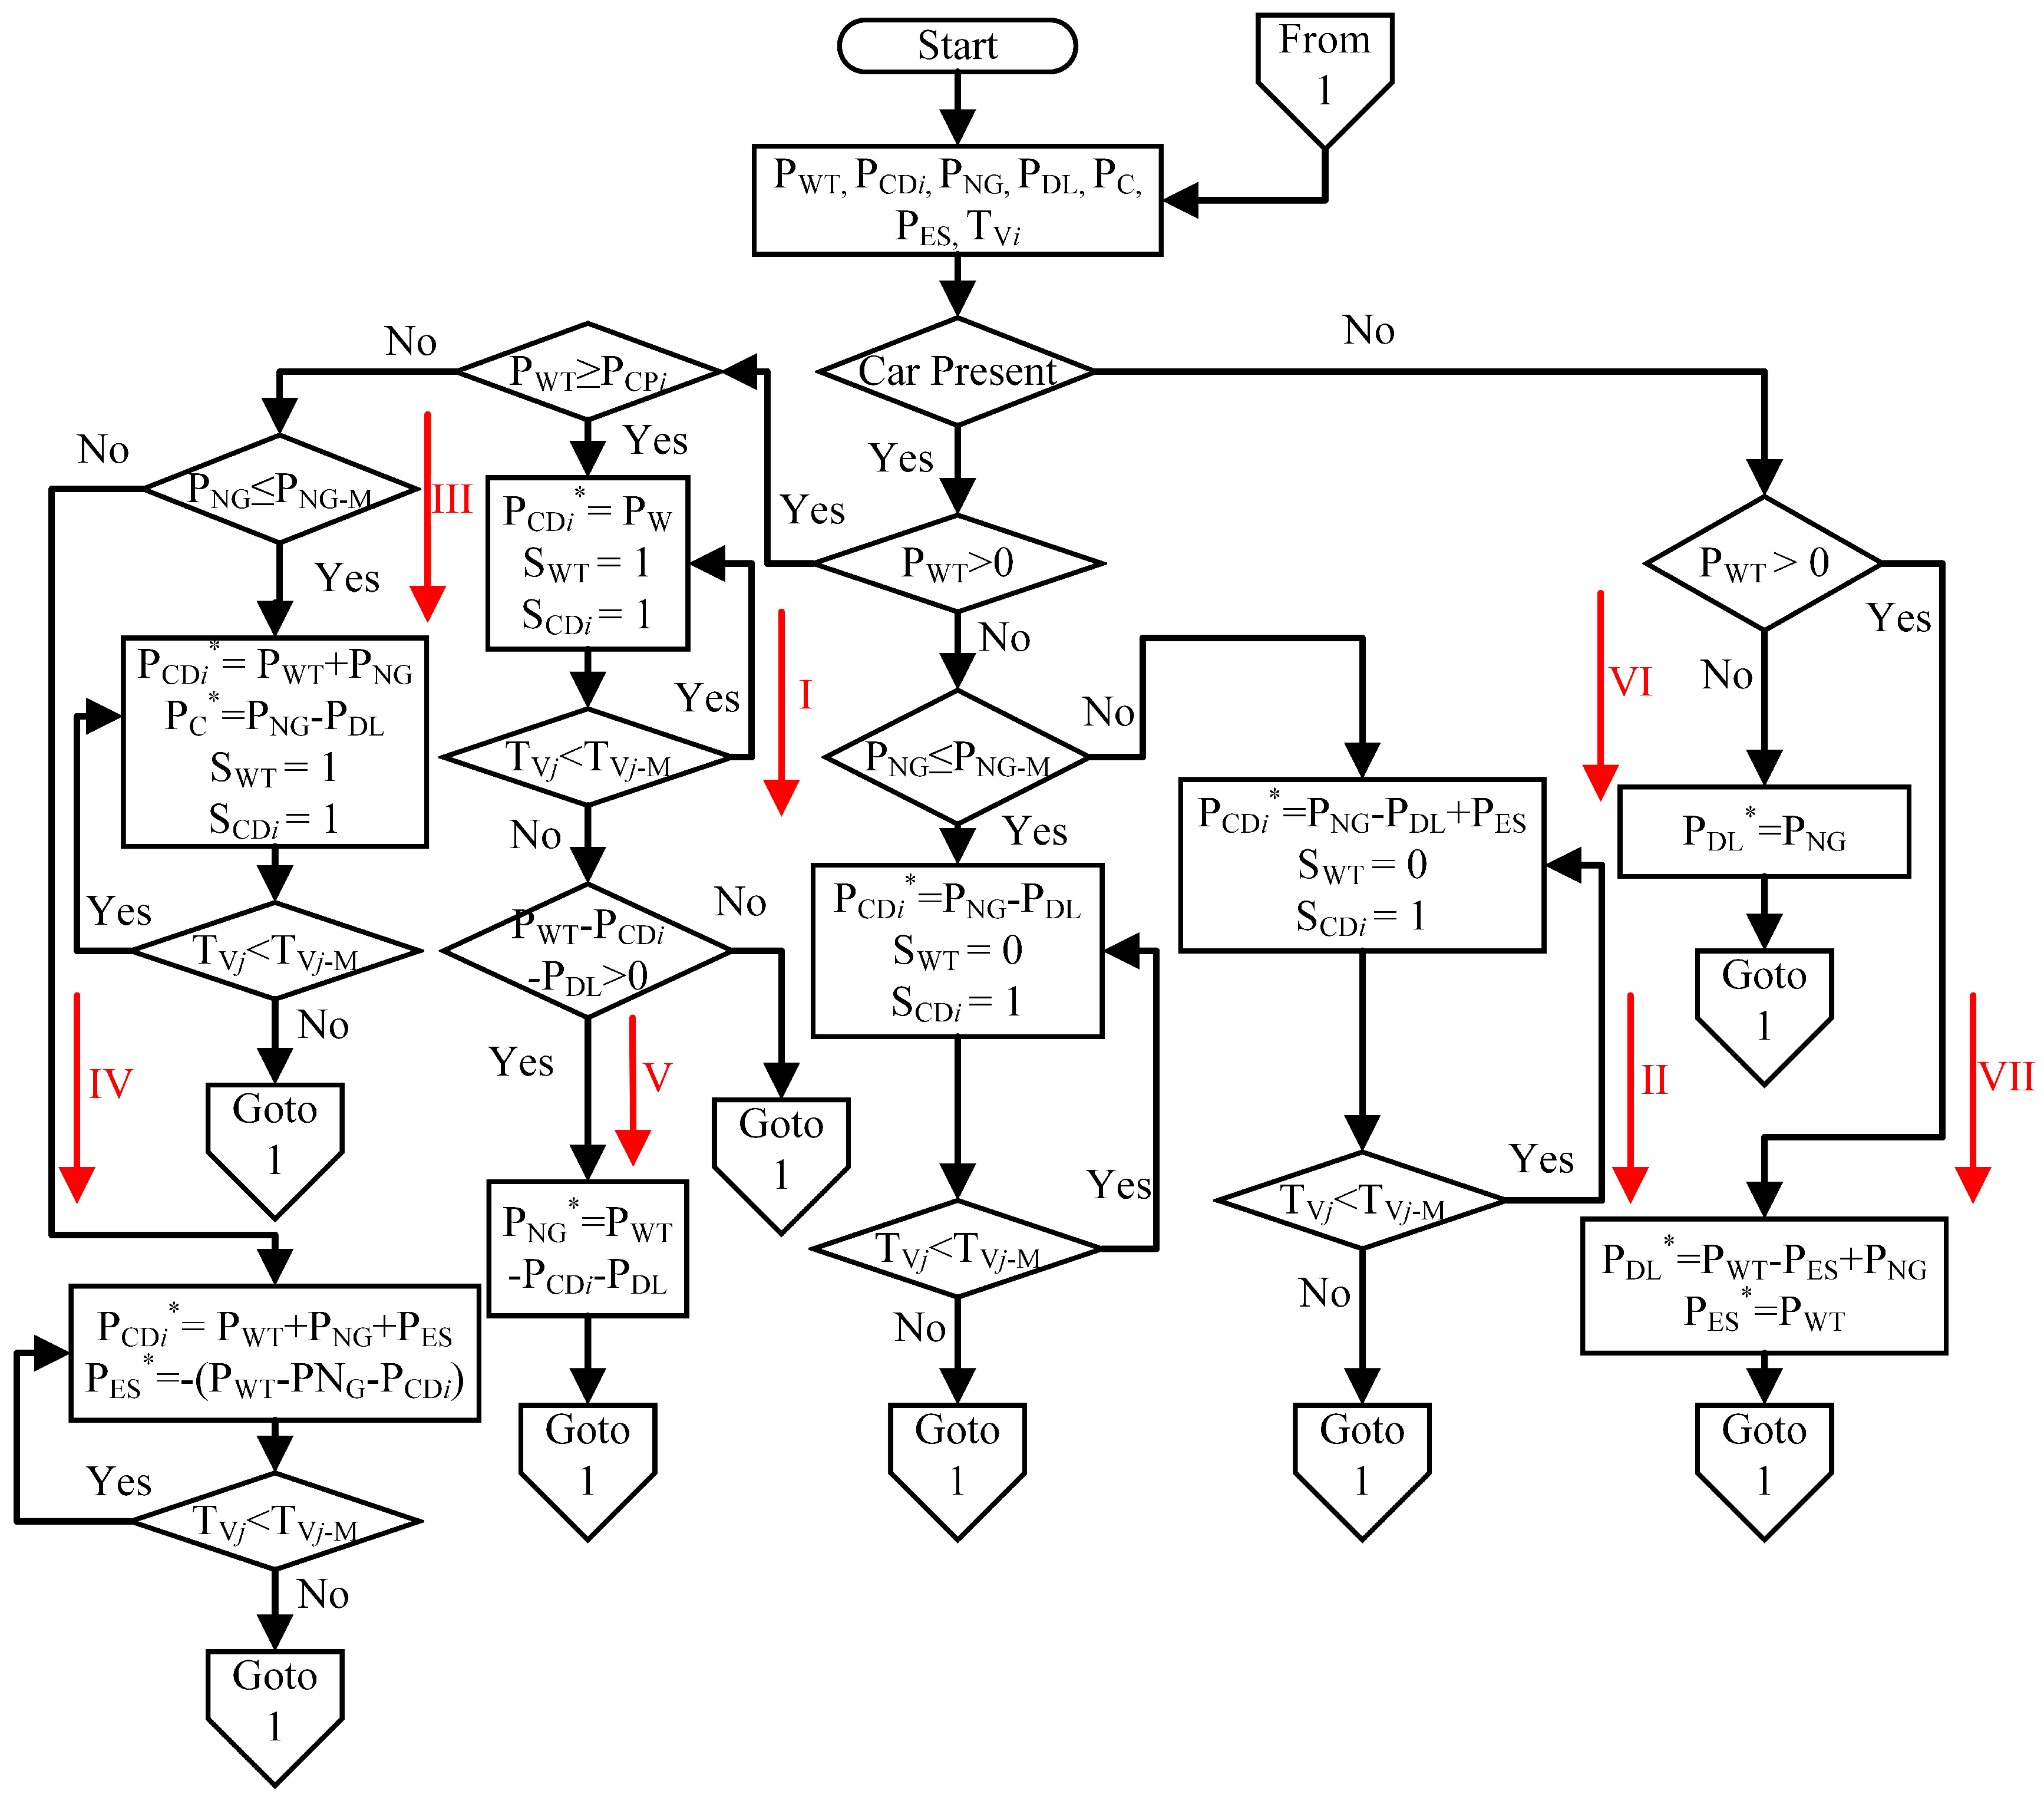
The EMS generates the operating state sequence based on generalized algorithm. The sequence is shown in Figure 15.
Figure 16, Figure 17, Figure 18, Figure 19, Figure 20 and Figure 21 illustrate the output powers of WT, NG, DL, CDs, and ESS along with operating state at different time intervals. For t = 0–4 h, the power of different sources/load is presented in 
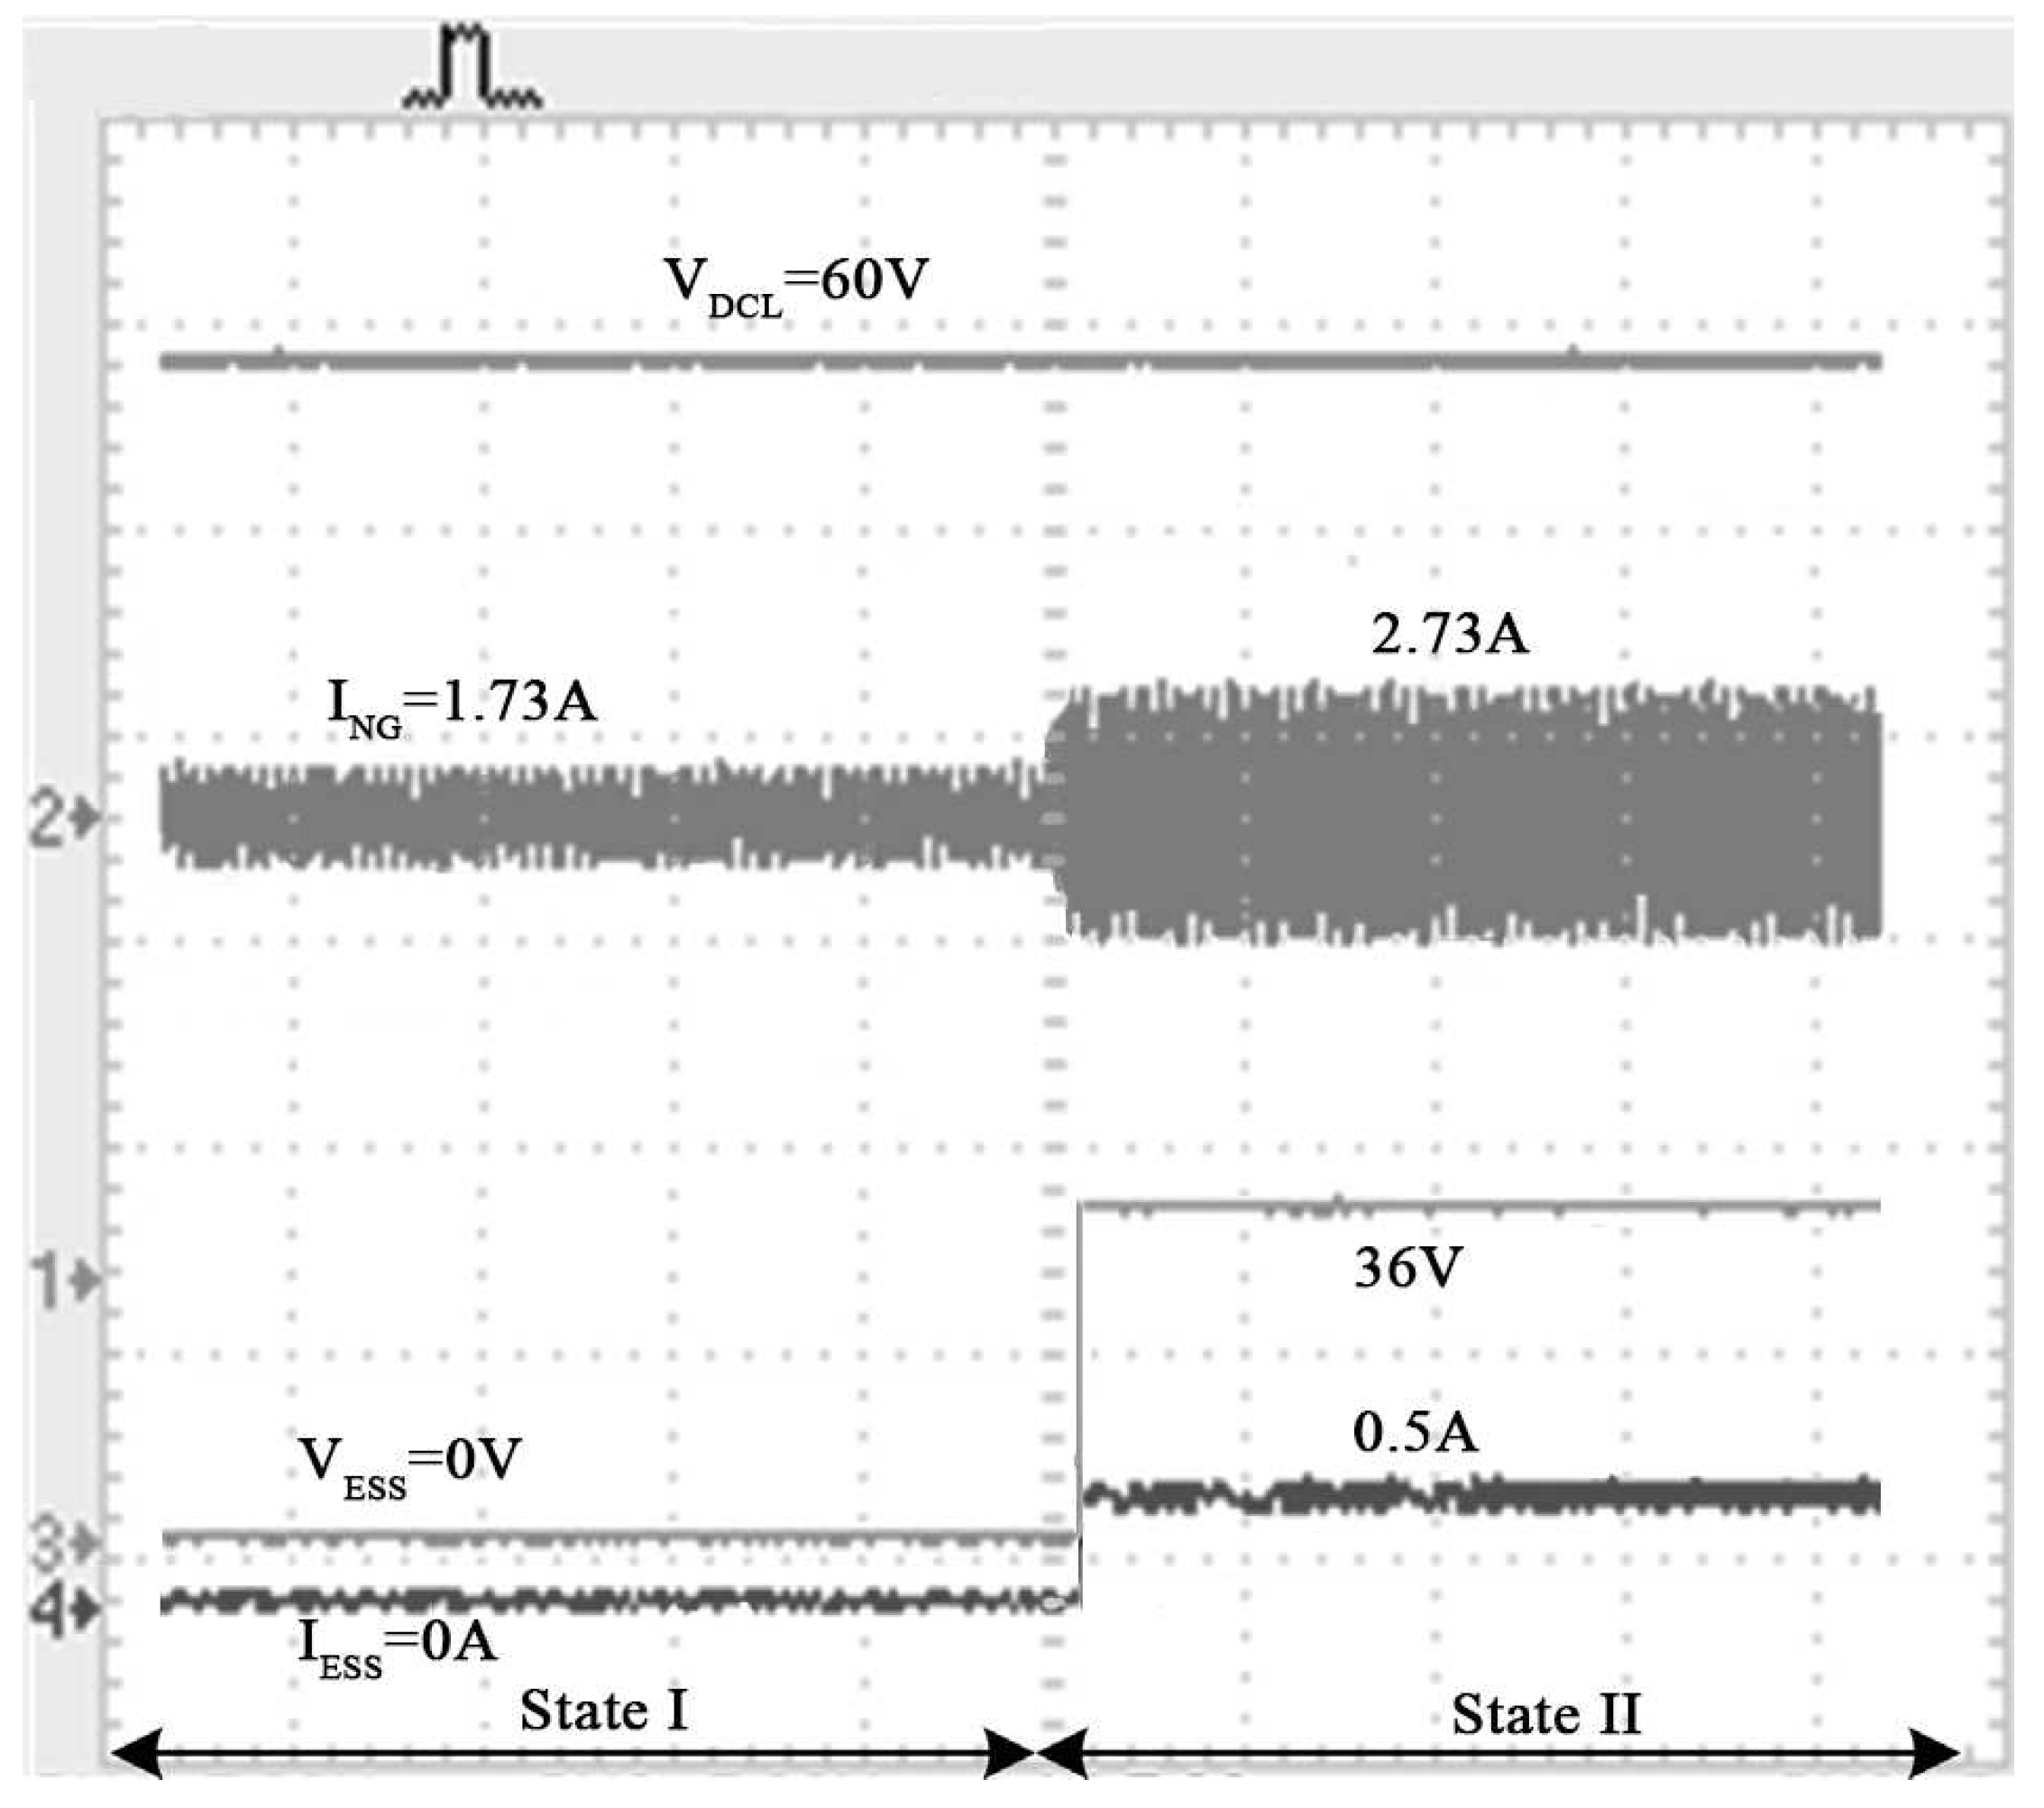
Figure 8. In this interval, from 0–1 H, the DL is 10.2 kW (Figure 16a) while WT output power is zero. So, the system only relies on NG. NG provides the power of 16.2 kW (10.2 kW for DL and 6.6 kW of CD1) as shown in Figure 16d. Therefore, the total power of NG is less than 18 kW ( P N G M ), there is no need to activate the ESS as shown in Figure 16e. In this state, the EMS operates in state I. Similarly, for t = 1–3 h, there is no car present in any of the CD, and DL varies from 11 kW to 11.5 kW. The WT generates some power, which is directly given to DL and NG. Hence, the EMS operates in state VII as illustrated in 
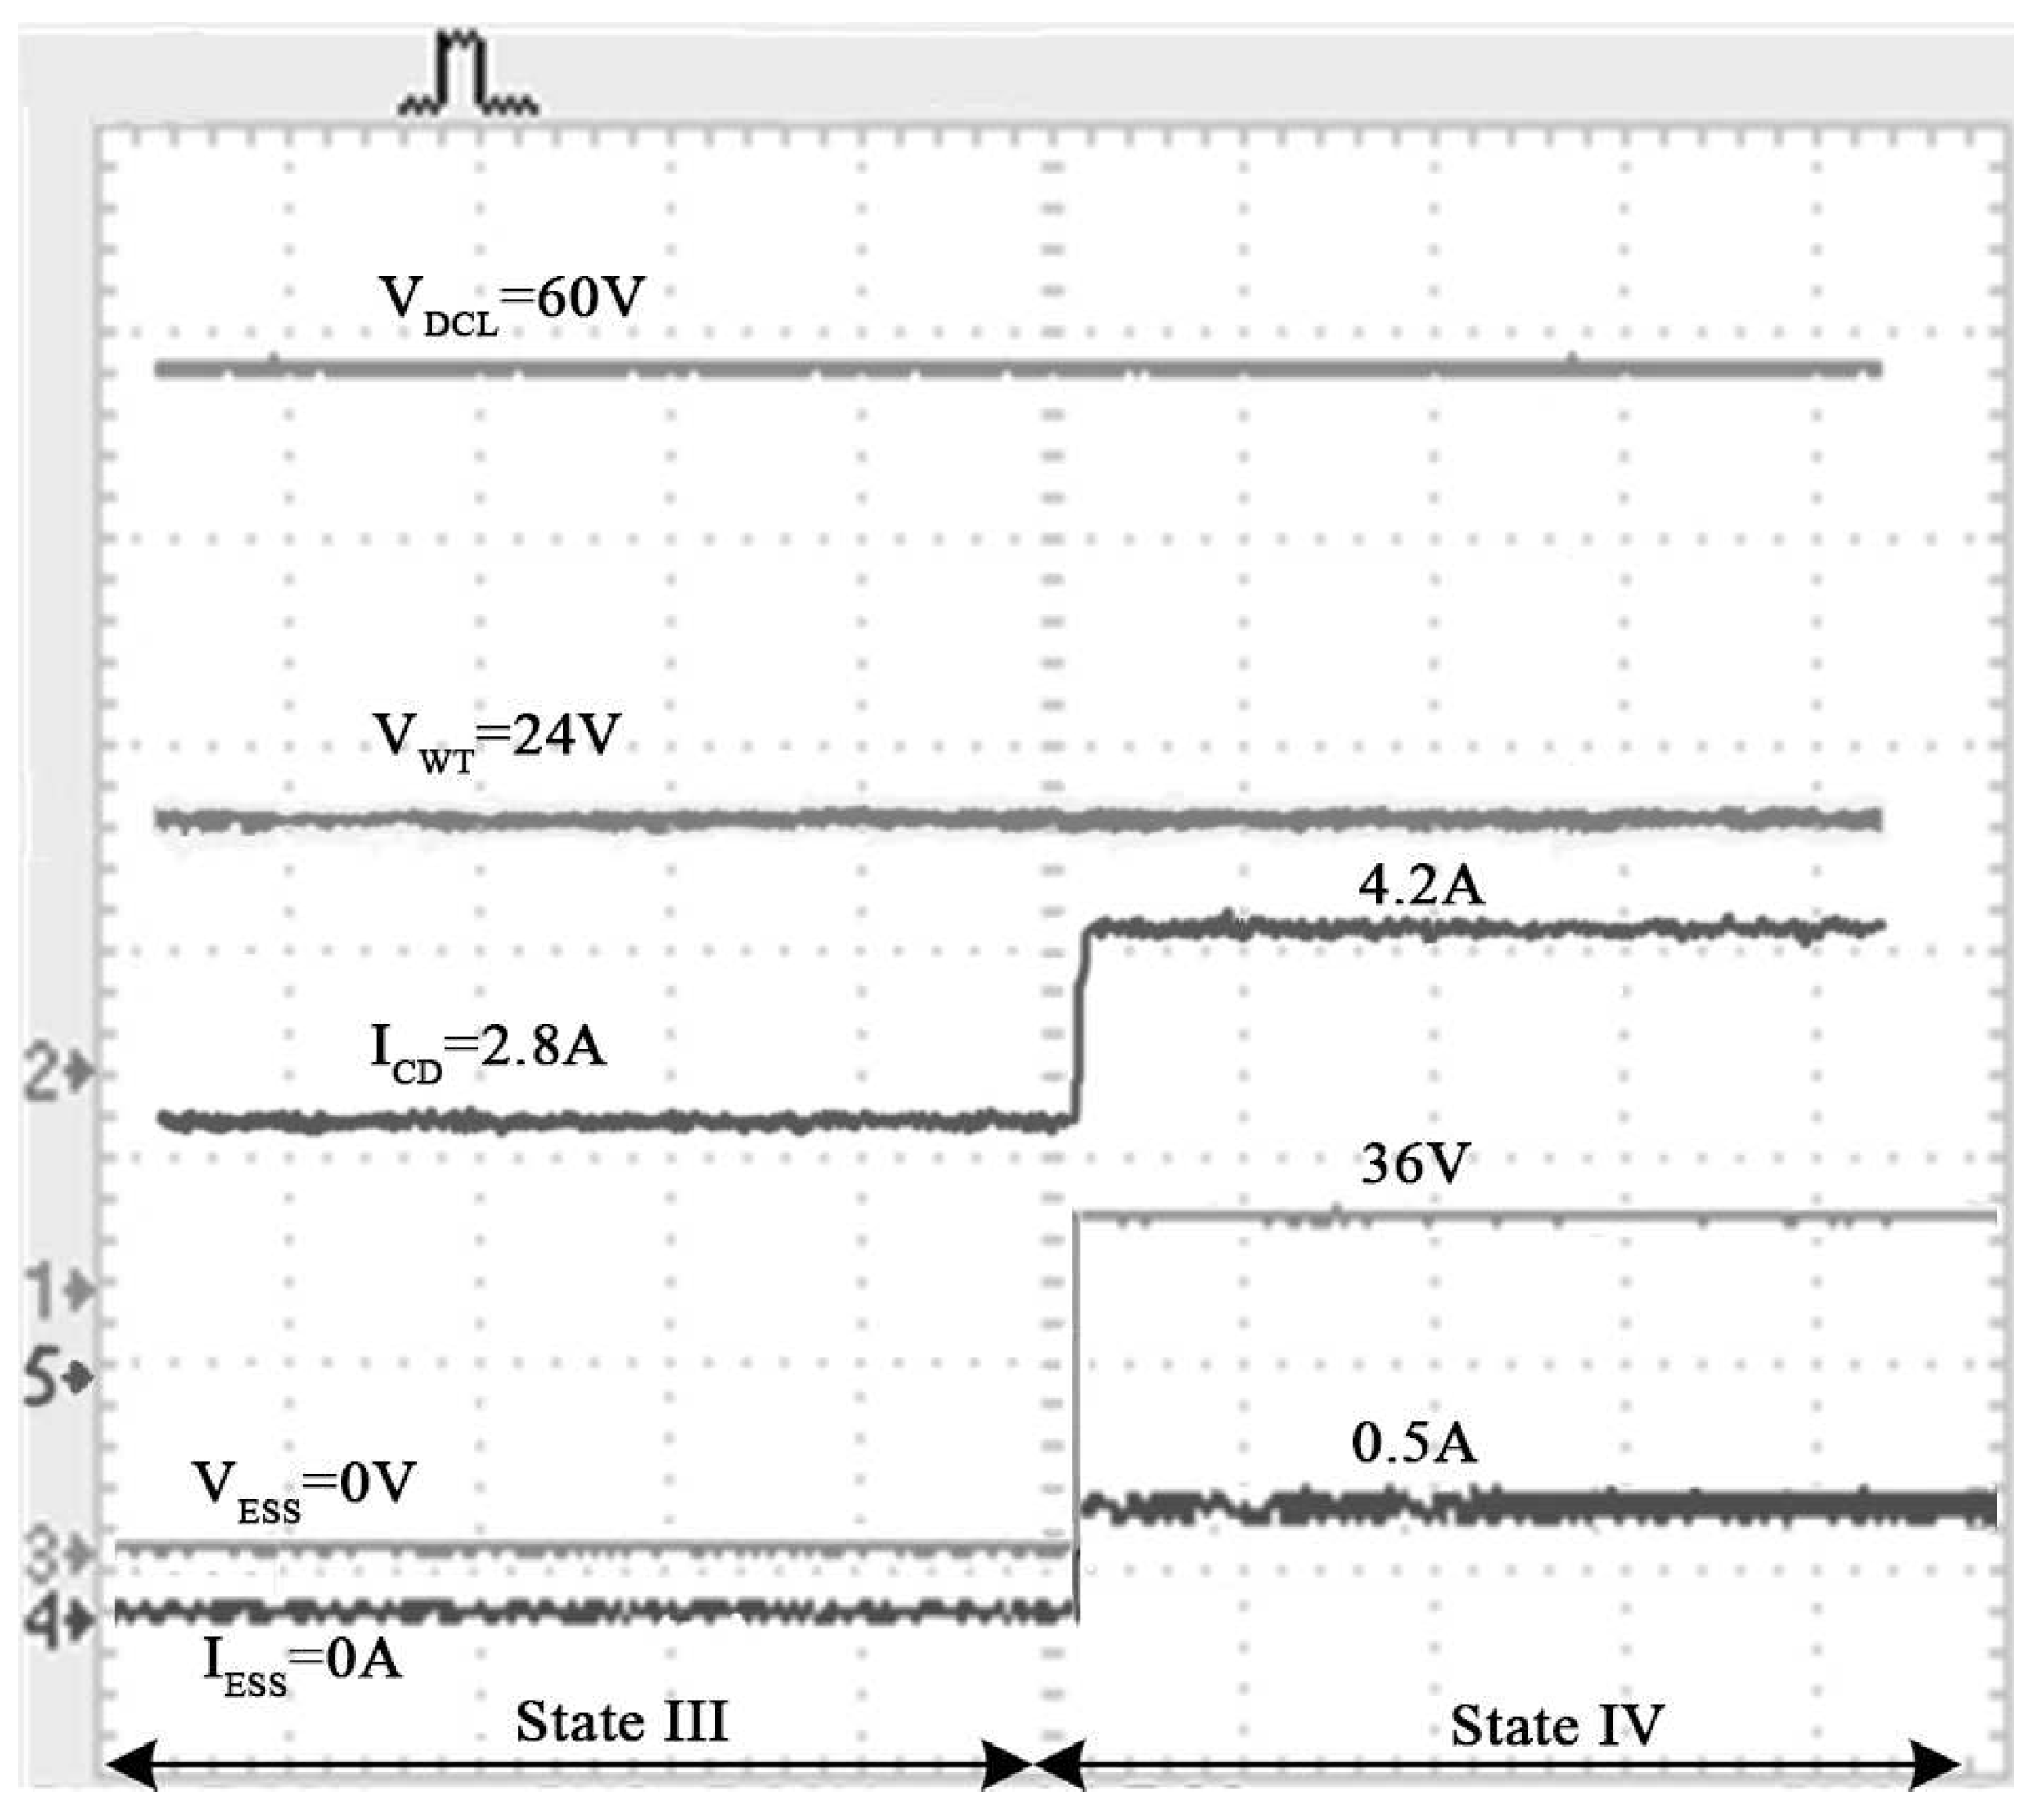
Figure 16f. From 3–4 h, the WT generates power of 17 kW, while the CD’s demand is 19.8 kW, so the WT does not completely satisfy the CDs. In this case, the NG helps the WT fulfilthe deficient power of CDs along with DL. The overall load demand for NG is less than its maximum rating, so there was no need for ESS is this interval. The EMS shifts to state III in this interval.
Figure 17 shows the output power/power consumption of different sources/loads for the interval 4–8 h. Throughout the period, there is no car present for charging. From 4–5.2 h and 7.8–8 h, the WT generates output power of 18 kW as shown in Figure 17b. Due to there being no car, the EMS either directly sends all the WT power to the ESS or to the NG. During these intervals, EMS sent WT power to charge ESS as shown in Figure 17e and the system operates in state VII. Whereas for the remainder of the time, the EMS helps the NG to satisfy the DL demand and the system operates in state VI.
Figure 18 shows the output power/power consumption of different sources/loads for the interval 8–12 h. At t = 8–9 h, there is no car present in any CD, and the WT is generating power of 25 kW. So, the overall WT output power is fed to ESS for charging and also given to DL. There is no need of NG is this state, keeping the system in the VII operating state as shown in Figure 18d,f. Similarly, for t = 9–10 h and 11–12 h, the CDs load demand is 12.2 kW and 6.6 kW as depicted in Figure 18c. But, due to the extensive amount of wind flow, the WT generates sufficient power to fulfil not only the CDs demand, but also provide excess power to the DL and NG and the system moves to state V. For the remaining time, i.e., t = 10–11 h due to non-presence of any car, all the WT is power is directly fed to DL and NG keeping ESS disconnected and shifting the operating system in state VI.
Figure 19 shows the output power/power consumption of different sources/loads for the interval 12–16 h. From t = 12–13 h and 14–15 h, the CDs demand is 6.6 kW, while the WT output power is more than 10 kW. Therefore, WT output power is sufficient to satisfy the CDs demand. On the other side, the DL demand lies between 16–20 kW, the WT power left after satisfying the CDs demand is not sufficient to meet the DL demand. Thus, the remaining DL demand is fulfilled by NG keeping the system in state V. As in these intervals the overall load demand for NG is less than its maximum rating, so there was no need of ESS as shown in Figure 19e. Similarly, for t = 13–14 h, no PHEV present for charging, providing all the WT power to the NG and DL and moving system to state VI. Finally, between 15–16 h, the EMS changes its state very rapidly from V to III to IV to II as illustrated in Figure 19f. At state III, the WT power becomes less than CD’s demand, the NG starts providing power to the CDs and DL but its total demand is less than PNG-M, and EMS operates the system in state III. After some time, the total demand on NG exceeds its maximum rating and ESS is turned on by EMS to fulfil the power deficiency. Hence, in this situation the EMS shifts from state III to IV. In the same way, after some time the WT output power becomes zero and the DL and CD relies on NG and ESS while EMS jumps to state II from IV.
Figure 20 shows the output power/power consumption of different sources/loads for the interval 16–20 h. From t = 16–18 h, the WT output power is zero and also no car is present in any of the CD. So, the NG simply satisfies the DL demand and EMS operates in state VI. For t = 17–18 h, the WT starts generating power, reducing burden on NG, and no car is present. Hence the WT directly fed the DL and NG is this interval as shown in Figure 20b,d and EMS keeps the system in state VI. In the final hour (19–20 h), the CDs load demand is 6.6 kW, while the WT output power is above 20 kW. WT not only satisfies the CDs demand, it also provides power to the DL and NG while the EMS moves to state V.
Figure 21 shows the output power/power consumption of different sources/loads for the final four hours of a day. For majority of the time (i.e., t = 20–21 h and 22–24 h), there is no car present. The WT is generating power (It directly fed power to DL and sometimes it fed power to the both DL and NG) as shown in the Figure 21a,b,d. The EMS keeps the system in state VI. For the remaining time when there is any car/s present in the CD for charging, the WT fulfils its complete power demand and share excess of its power to the DL and NG, shifting the state to V.
For proposed CS, each car is charged once a day. As per the charging schedule given in Table 2, one car per CD is charged during 0–1, 11–12, 12–13, 14–15, 15–16 and 19–20 h, two cars per two CDs at a time are charged during 9–10 and 21–22 h, respectively and three cars with one car per CD at a time are charged at 3–4 h. Corresponding SOCs of cars throughout a day is shown in Figure 22.
The load voltage (L-L) and frequency are 440 V and 50 Hz, respectively. According to IEEE 1547 Standards [24], the maximum allowable deviation in load L-L voltage, frequency, voltage THD and current THD are ±6%, ±0.8%, 5% and 5%, respectively. It is clearly revealed from the Figure 23 that the designed EMS for proposed CS kept the load parameters in allowable limits. Hence, the system is called as stable one. Similarly, the variation in DC bus voltage using improved fuzzy controller and PID controller is shown in the Figure 24. The improved fuzzy controller shows better performance keeping the voltage in standard allowable limits. Figure 25 exhibits the dynamic performance of grid connected inverter at AC bus in which the current is decreased while voltages are altered somewhere, but kept constant very quickly.

5.2. Experimental Verification

The objective of the experimental verification is to support further the feasibility of the proposed controller. For this purpose, different experimental tests have been performed in the laboratory. The TMS320F28035 piccolo card was used to generate all the required control signals. Figure 26 illustrates the hardware setup of the system which includes the DSP TMS320f28335 control kit, an isolation transformer, battery, L filter circuitry, SKM150GB12T4—IGBT module (used for fast switching), SKYPER 32PRO R (acts as an interface between IGBT modules and the controller), DAC8718 digital to analog converter, a computer with Code Composer Studio, and a grid connection.
Instead of PHEV, a battery was used during the experiment. By changing the value of the speed of wind, different modes of operation were emulated, and subsequently, the proposed controller was down-scaled and applied to a single phase system. The experiment is carried out in steady state and transient state covering different states/power rating of different component used in experimental setup is shown in Table 5.
The results of various operating states are showed in Figure 27, Figure 28, Figure 29, Figure 30, Figure 31 and Figure 32.

5.2.1. Experimental Results for States I–II

In state I, the output power of WT was zero and one PHEV was charging (50.4 W/1.4 A). The domestic load demand current was 0.8 A. The CD load demand was fulfilled by taking power from NG only. The NG delivered a 1.73 A current (0.8 A ( I D L ) + 0.93 A ( I C )). Figure 27 shows the experimental results for state I and II. As the CD demand increased to 151.2 W (3 PHEVs/4.2 A and state II), the NG load demand reached its critical value of 2.73 A (0.27 A ( I D L ) + 2.46 A ( I C )). Accordingly, the EMS turned on the ESS which provided a power of 18 W (0.5 A). The V D C L was kept constant at 60 V.

5.2.2. Experimental Results for State II–III

In state II, the WT power is zero, whereas the CD demand is fulfilled by NG and ESS. Figure 28 shows the transitions from State II to III. The wind turbine is generating power of 76.8 W (3.2 A) as illustrated in Figure 28. During transition, the DC link voltage increases to 67 V for a very short time. The CD load demand is 100.8 W (2 PHEVs) which is greater than WT output power. Hence, the remaining power demand of 24 W is obtained from NG. The overall power demand from NG is less than P N G M . In this state, I N G is reduced to 1.6 A (1.2 A ( I D L ) + 0.44 A ( I C )).

5.2.3. Experimental Results for State III–IV

In state III, CD load demand was 2.8 A, whereas ESS was in the ‘off’ state ( I E S S = 0 A, V E S S = 0 V). To further investigate the proposed system, a full load of PHEVs was applied, which is 151.2 W/4.2 A (all the CDs were occupied for charging). The scenario led the system to state IV. The switching of states (III to IV) is illustrated in Figure 29. In this state (IV), the wind turbine was providing power of 76.8 W (3.2 A/24 V), creating the power deficiency of 74.4 W. EMS turned on the ESS by generating an appropriate duty cycle for the boost converter switch proving 18 W power. The remaining 58.8 W power gap was applied to NG with total output current of 1.55 A (0.5 A ( I D L ) + 1.05 A ( I C )).

5.2.4. Experimental Results for State IV–V

In state IV, the WT and ESS provided its power directly to CDs while deficient power was taken from NG. The converter current was measured as 0.94 A (DC Current). The experimental results for state IV–V is shown in Figure 30. In the fifth state, the CD load demand was reduced to 2.8 A (two PHEVs). The WT output current was 4.5 A (108 W) which was sufficient to fulfil CD’s load demand. The surplus power generated by the WT (7.2 W) was transferred to an AC bus via a converter. However, the DL was much higher (1.83 A) resulting in the total power demand of NG of 1.7 A (1.83 A ( I D L )-0.13 A ( I C )).

5.2.5. Experimental Results for State V–VI

In state V, two PHEVs were charged with WT and the surplus power was sent to the AC bus. The experimental result for transitions of state V to VI is depicted in Figure 31. In the sixth state, there was no PHEV present in any of the charging docks and WT was also offline due to low wind speed. Therefore, I C D and I W T were reduced to zero. The NG only delivered power to DL. NG output current was 2.2 A (RMS) or 6.2 A (peak-peak).

5.2.6. Experimental Results for State VI–VII

In state VI, NG provided power to DL while rest of the system was on standby. The experimental results of transfer of operating state from VI to VII are shown in Figure 32. In the final state, there was no PHEV present in CDs while the wind system produced 26.4 W (1.1 A) power. Due to absence of PHEVs loads, the WT output power was delivered to ESS for charging purpose (18 W) while the remainder of the power was delivered to the AC bus via a converter (0.14 A). The whole DL demand (1.1 A) cannot be fulfilled from excess power of WT system which causes a current demand of 0.94 A on NG.

6. Conclusions

Various studies have concluded that the integration of EVs into the power system would be profitable in terms of pollution concerns and financial concerns; however, whether the current framework could adopt the increased load that the EVs would necessitate, remains as an impact. Therefore, without proper management and integration, a high introduction of EVs in the transportation sector can cause burden in the residential distribution systems, especially when several EVs are connected to the grid at peak-hours. To face this challenge, the distribution system requires adaptation to carry the new loads. The enhancement of conventional electricity grids to smart grids will create an implementation of management systems that control PEVs charging in order to avoid the distribution transformer from being overloaded. To further increase the benefits of PHEVs/EVs, it is essential to take power from renewable energy resources for PHEVs/EVs charging.
A smart charging station facility for PHEVs was designed in this paper. The control and charging of PHEVs were managed from wind and/or grid connected wind generation through smart charging switching algorithm. The proposed algorithm is unique, simple and novel, and it works on the sensing of wind output power due to the variation in wind speed. The proposed algorithm allows the charging of the PHEVs using maximum energy from wind with a special battery management system. The fuzzy inference system in the proposed charging station contributes to minimizing the stress on the DC bus, ensures quality and regulates output power to CS. The proposed charging station facility establishes several advantages such as low pollution and low maintenance cost. Therefore, charging a PHEV using wind power is one of the smartest choice. A wind-based PHEV charging facility developed in this paper also delays the upgrade of DT with the increase in PHEV loads. The effectiveness of the proposed charging station facility was confirmed via simulations and experimental work.

Author Contributions

S.Z.H. has performed the simulations. T.K. has designed the algorithm and arranged most sections of the manuscript. M.H.R., S.A.H.S. and M.S. worked on load data collection. H.G.A., M.T.R. and M.A.K. worked on weather data. A.Z. helped in experimental work, and J.P.M. worked as a technical advisor for the manuscript.

Funding

This research and APC was funded by National University of Computer and Emerging Sciences, Chiniot-Faisalabad Campus.

Acknowledgments

The authors give thanks to COMSATS University, Islamabad and IEEE for permission to extend the original work into this paper. The authors also thanks to National Univeristy of Computer and Emerging Sciences, Chiniot–Faisalabad Campus for providing the platform to complete this project and financial assistance.

Conflicts of Interest

The authors declare no conflict of interest.

Abbreviations

The following abbreviations are used in this manuscript:
ρ Air density
VWind speed
RRotor radius
C p Power coefficient
C q ( η , α ) Torque coefficient
β Pitch angle
α o p t Tip-speed ratio
P r Rotor power
ω r Rotor speed
ψ d s , ψ q s Stator flux
ψ d r , ψ q r Rotor flux
U d , q s Stator winding voltage
U d , q r Rotor winding voltage
i d s , i q s Stator winding currents
i d r , i q r Rotor winding currents
L d s , L q s , L d r , L q r Self-inductance of the stator and rotor
L m Mutual inductance between windings
R s , R r Resistance of the stator and rotor
f s Frequency of the grid
pNumber of pole pairs
V c u t i n Cut-in wind speed
V c u t o f f Cut-off wind speed
V r a t e d Rated wind speed
P W T Wind turbine output power
P C D i Output power of i-th charging dock
P D L Domestic load power consumption

References

  1. Das, T.; Aliprantis, D.C. Small-signal stability analysis of power system integrated with PHEVs. In Proceedings of the IEEEEnergy 2030 Conference, Atlanta, GA, USA, 17–18 November 2008; pp. 1–4. [Google Scholar]
  2. Duvall, M.; Knipping, E.; Alexander, M.; Tonachel, L.; Clark, C. Environmental assessment of plug-in hybrid electric vehicles. EPRI July 2007, 1, 1–56. [Google Scholar]
  3. Adams, R.B. Analysis of Spread Moorings By Dimensionless Functions. In Proceedings of the Offshore Technology Conference, Houston, TX, USA, 18–21 May 1969; Volume 2, pp. 77–88. [Google Scholar] [CrossRef]
  4. Saberbari, E.; Saboori, H. Evaluating PHEV impacts on domestic distribution grid in terms of power losses and voltage drop. In Proceedings of the 2014 19th Conference on Electrical Power Distribution Networks (EPDC), Tehran, Iran, 6–7 May 2014; pp. 52–58. [Google Scholar]
  5. Goli, P.; Shireen, W. PV Integrated Smart Charging of PHEVs Based on DC Link Voltage Sensing. IEEE Trans. Smart Grid 2014, 5, 1421–1428. [Google Scholar] [CrossRef]
  6. Preetham, G.; Shireen, W. Photovoltaic charging station for plug-in hybrid electric vehicles in a smart grid environment. In Proceedings of the 2012 IEEE PES Innovative Smart Grid Technologies (ISGT), Washington, DC, USA, 16–20 January 2012; pp. 1–8. [Google Scholar]
  7. Zhao, J.; Kucuksari, S.; Mazhari, E.; Son, Y.J. Integrated analysis of high-penetration PV and PHEV with energy storage and demand response. Appl. Energy 2013, 112, 35–51. [Google Scholar] [CrossRef]
  8. Nagarajan, A.; Shireen, W. Grid connected residential photovoltaic energy systems with Plug-In Hybrid electric Vehicles (PHEV) as energy storage. In Proceedings of the IEEE PES General Meeting, Providence, RI, USA, 25–29 July 2010; pp. 1–5. [Google Scholar]
  9. Green, R.C.; Wang, L.; Alam, M. The impact of plug-in hybrid electric vehicles on distribution networks: A review and outlook. Renew. Sustain. Energy Rev. 2011, 15, 544–553. [Google Scholar] [CrossRef]
  10. Shao, S.; Pipattanasomporn, M.; Rahman, S. Challenges of PHEV penetration to the residential distribution network. In Proceedings of the 2009 IEEE Power & Energy Society General Meeting, Calgary, AB, Canada, 26–30 July 2009; pp. 1–8. [Google Scholar]
  11. Rutherford, M.J.; Yousefzadeh, V. The impact of electric vehicle battery charging on distribution transformers. In Proceedings of the 2011 Twenty-Sixth Annual IEEE, Applied Power Electronics Conference and Exposition (APEC), Fort Worth, TX, USA, 6–11 March 2011; pp. 396–400. [Google Scholar]
  12. Erol-Kantarci, M.; Mouftah, H.T. Management of PHEV batteries in the smart grid: Towards a cyber-physical power infrastructure. In Proceedings of the 2011 IEEE 7th International Wireless Communications and Mobile Computing Conference (IWCMC), Istanbul, Turkey, 4–8 July 2011; pp. 795–800. [Google Scholar]
  13. Heydt, G. The Impact of Electric Vehicle Deployment on Load Management Straregies. IEEE Trans. Power Appar. Syst. 1983, PAS-102, 1253–1259. [Google Scholar] [CrossRef]
  14. Giges, N.S. Wind-Powered Charging Stations Coming Soon. Available online: https://www.asme.org/engineering-topics/articles/renewable-energy/wind-powered-charging-stations-coming-soon (accessed on 3 March 2019).
  15. Ghanbarzadeh, T.; Baboli, P.T.; Rostami, M.; Moghaddam, M.P.; Sheikh-El-Eslami, M.K. Wind farm power management by high penetration of PHEV. In Proceedings of the 2011 IEEE Power and Energy Society General Meeting, Detroit, MI, USA, USA, 24–29 July 2011; pp. 1–5. [Google Scholar]
  16. Short, W.; Denholm, P. A Preliminary Assessment of Plug-in Hybrid Electric Vehicles on Wind Energy Markets; National Renewable Energy Laboratory: Lakewood, CO, USA, 2006.
  17. Goli, P.; Shireen, W. Wind powered smart charging facility for PHEVs. In Proceedings of the 2014 IEEE Energy Conversion Congress and Exposition (ECCE), Pittsburgh, PA, USA, 14–18 September 2014; pp. 1986–1991. [Google Scholar]
  18. Dallinger, D.; Gerda, S.; Wietschel, M. Integration of intermittent renewable power supply using grid-connected vehicles—A 2030 case study for California and Germany. Appl. Energy 2013, 104, 666–682. [Google Scholar] [CrossRef]
  19. Hassan, S.Z.; Kamal, T.; Mumtaz, S.; Khan, L. A Road to Wind Based PHEVs Smart Charging Station. In Proceedings of the 2015 13th International Conference on Frontiers of Information Technology (FIT), Islamabad, Pakistan, 14–16 December 2015; pp. 41–46. [Google Scholar] [CrossRef]
  20. Sagosen, Ø.; Molinas, M. Large scale regional adoption of electric vehicles in Norway and the potential for using wind power as source. In Proceedings of the 2013 International Conference on Clean Electrical Power (ICCEP), Alghero, Italy, 11–13 June 2013; pp. 189–196. [Google Scholar]
  21. Mets, K.; De Turck, F.; Develder, C. Distributed smart charging of electric vehicles for balancing wind energy. In Proceedings of the 2012 IEEE Third International Conference on Smart Grid Communications (SmartGridComm), Tainan, Taiwan, 5–8 November 2012; pp. 133–138. [Google Scholar]
  22. Kamal, T. Adaptive Control of Fuel Cell and Design of Power Management System (PMS) for PHEVs/EVs Charging Station in a Hybrid Power System. Ph.D. Thesis, COMSATS Institute of Information Technology Abbottabad-Pakistan, Abbottabad, Pakistan, 2014. [Google Scholar]
  23. The 2014 Accord Plug-In. 2014. Available online: https://www.cnet.com/roadshow/reviews/2014-honda-accord-plug-in-hybrid-review/ (accessed on 3 March 2019).
  24. IEEE Standard for Interconnecting Distributed Resources with Electric Power Systems. Available online: https://ieeexplore.ieee.org/document/1225051 (accessed on 3 March 2019).
Figure 1. Detailed structure of proposed charging station [19].
Energies 12 00909 g001
Figure 2. Equivalent structure of the proposed charging station.
Energies 12 00909 g002
Figure 3. Control system of grid connected inverter [19].
Energies 12 00909 g003
Figure 4. Fuzzy-based control system of a wind turbine.
Energies 12 00909 g004
Figure 5. Input variable of fuzzy controller-error (e).
Energies 12 00909 g005
Figure 6. Input variable of fuzzy controller-change in error ( Δ e ).
Energies 12 00909 g006
Figure 7. Output variable of fuzzy controller-change in pitch angle ( Δ e b ).
Energies 12 00909 g007
Figure 8. Input-output surface graph.
Energies 12 00909 g008
Figure 9. Flow chart of the proposed algorithm.
Energies 12 00909 g009
Figure 10. Power flow in proposed charging stations (CS) in (a) state I, (b) state II, (c) state III, (d) state IV, (e) state V, (f) state VI, and (g) state VII.
Energies 12 00909 g010
Figure 11. Ramp wind speed input.
Energies 12 00909 g011
Figure 12. Comparison of output power generated by proportional-integral (PI) and the fuzzy controller.
Energies 12 00909 g012
Figure 13. Pitch angle variation.
Energies 12 00909 g013
Figure 14. Comparison between the improved fuzzy and PI controller output powers.
Energies 12 00909 g014
Figure 15. Operating states generated by the energy management system (EMS).
Energies 12 00909 g015
Figure 16. Simulation results for t = 0–4 h; (a) P D L , (b) P W T , (c) P C D i , (d) P N G , (e) P E S , (f) operating state.
Energies 12 00909 g016
Figure 17. Simulation results for t = 4–8 h; (a) P D L , (b) P W T , (c) P C D i , (d) P N G , (e) P E S , (f) operating state.
Energies 12 00909 g017
Figure 18. Simulation results for t = 8–12 h; (a) P D L , (b) P W T , (c) P C D i , (d) P N G , (e) P E S , (f) operating state.
Energies 12 00909 g018
Figure 19. Simulation results for t = 12–16 h; (a) P D L , (b) P W T , (c) P C D i , (d) P N G , (e) P E S , (f) operating state.
Energies 12 00909 g019
Figure 20. Simulation results for t = 16–20 h; (a) P D L , (b) P W T , (c) P C D i , (d) P N G , (e) P E S , (f) operating state.
Energies 12 00909 g020
Figure 21. Simulation results for t = 20–24 h; (a) P D L , (b) P W T , (c) P C D i , (d) P N G , (e) P E S , (f) operating state.
Energies 12 00909 g021
Figure 22. States of charge (SOCs) of different cars at different charging docks (CDs).
Energies 12 00909 g022
Figure 23. System stability parameters.
Energies 12 00909 g023
Figure 24. DC bus voltage deviation: EMS based on fuzzy logic controller versus EMS based on PID controllers.
Energies 12 00909 g024
Figure 25. Domestic load changes from 20 kW to 18 kW.
Energies 12 00909 g025
Figure 26. Experimental test-bed.
Energies 12 00909 g026
Figure 27. Experimental result for state I and II.
Energies 12 00909 g027
Figure 28. Experimental result for states II and III.
Energies 12 00909 g028
Figure 29. Experimental result for states III and IV.
Energies 12 00909 g029
Figure 30. Experimental result for states IV and V.
Energies 12 00909 g030
Figure 31. Experimental result for states V and VI.
Energies 12 00909 g031
Figure 32. Experimental result for states VI and VII.
Energies 12 00909 g032
Table 1. Fuzzy proposed rule matrix.
e Δ e
NBNMNSZEPSPMPB
NBPBPMPSZEPBPBPB
NMPMPMPSZEPMPMPM
NSPSPSPSZEPSPSPS
ZEZEZEZEZENSNSZE
PSNSNSNBNBNSNSNS
PMNMNBNBNBNMNMNM
PBNBNBNBNBNBNBNB
Table 2. Charging dock (CD) car’s schedule and their states of charge (SOCs).
CD NoCar NoMin SOCMax SOCCharging Time (H)
(% age)(% age)StartEnd
11258501
12208034
133090910
1425851415
1520801920
26258534
2730901112
2820801516
2925852122
310309034
3112585910
31220801213
31330902122
Table 3. Technical data of energy sources.
Wind Turbine
Type300STK2M
Rated speed800 rpm
Output voltage at rated speed258 V
Cut-off wind speed12 m/s
Rated power8.5 kW
National Grid/RL
Phase voltage11 kV
Operating frequency50 Hz
Rated power10 MVA
X/R ration5
RL power factor0.8
ESS
TypeCINCO FM/BB12100T
Capacity50 Ah
Single module voltage12 V
Series connected modules34
Rated voltage12 × 34 ≈ 400 V
PHEV Battery
Company nameHonda
Vehicle nameAccord
Battery capacity6.6 kWh
Rated voltage300 V
Fast charging time1 H
Table 4. Technical data of converters.
DC/DC Buck Boost Converter (ESS)
ModelNCP1136
ParameterRepresentationValues
V r a t e d Rated voltage10/700 V
K p , K i , K d PID gains ( T 1 )1.3, 1.2, 1.1
K p , K i , K d Proportional gain ( T 2 )1.5, 1.2, 1.3
C 1 Converter capacitance2200 μ F
L 1 Converter inductance1 mH
fRated switching frequency10 kHz
DC/DC Boost Converter
ModelMC33363ADWG
ParameterRepresentationValues
V r a t e d Rated voltage10/700 V
K p Proportional gain0.0006
K i integral gain0.12
fRated switching frequency10 kHz
C 2 Converter capacitance4700 μ F
L 2 Converter inductance0.6 mH
DC/DC Buck Converter (CDs)
ModelNCP1142
ParameterRepresentationValues
V r a t e d Rated voltage10/700 V
K p , K i , K d PID gains ( T 3 )1.22, 1.12, 1.31
K p , K i , K d Proportional gain ( T 4 )1.52, 1.2, 1.32
C 3 Converter capacitance3000 μ F
L 4 Converter inductance0.8 mH
fRated switching frequency10 kHz
DC/AC Main Converter
ModelCHZIRI-2VF
ParameterRepresentationValues
P r a t e d Rated power100 kW
V r a t e d Rated voltage220/440 V
f c Carrier frequency10 kHz
C s Snubber capacitance10 μ F
R s Snubber resistance10 k Ω
LInductance L-filter2.6 μ H
Table 5. Technical data for experimental setup.
ComponentRated VoltageMaximum Current
PHEVs (each)9 V1.2 A
Wind System24 V4.5 A
ESS36 V0.5 A
DC Link60 V2.2 A
Domestic Load220 V (AC)1.8 A (RMS)
National Grid220 V (AC)2.73 A (RMS)

