Article

Kinetics and Reactor Design Aspects of Selective Methanation of CO over a Ru/γ-Al2O3 Catalyst in CO2/H2 Rich Gases †

Chair of Chemical Engineering, Center of Energy Technology, University Bayreuth, 95440 Bayreuth, Germany
*
Author to whom correspondence should be addressed.
The original paper was presented in: Garbis, P., Kern, C., Jess, A. Selective CO methanation for PEMFC applications. Riehl, R., Preißinger, M., Eames, I., Tierney, M., Eds. In Proceedings of the Heat Powered Cycles Conference 2018, Bayreuth, Germany, 16–19 September 2018. ISBN: 978-0-9563329-6-7.
Energies 2019, 12(3), 469; https://doi.org/10.3390/en12030469
Submission received: 11 January 2019 / Revised: 29 January 2019 / Accepted: 30 January 2019 / Published: 1 February 2019
(This article belongs to the Special Issue Selected Papers from Heat Power Cycles Conference 2018)

Abstract

:
Polymer electrolyte membrane fuel cells (PEMFCs) for household applications utilize H2 produced from natural gas via steam reforming followed by a water gas shift (WGS) unit. The H2-rich gas contains CO2 and small amounts of CO, which is a poison for PEMFCs. Today, CO is mostly converted by addition of O2 and preferential oxidation, but H2 is then also partly oxidized. An alternative is selective CO methanation, studied in this work. CO2 methanation is then a highly unwanted reaction, consuming additional H2. The kinetics of CO methanation in CO2/H2 rich gases were studied with a home-made Ru catalyst in a fixed bed reactor at 1 bar and 160–240 °C. Both CO and CO2 methanation can be well described by a Langmuir Hinshelwood approach. The rate of CO2 methanation is slow compared to CO. CO2 is directly converted to methane, i.e., the indirect route via reverse water gas shift (WGS) and subsequent CO methanation could be excluded by the experimental data and in combination with kinetic considerations. Pore diffusion may affect the CO conversion (>200 °C). The kinetic equations were applied to model an adiabatic fixed bed methanation reactor of a fuel cell appliance.

1. Introduction

In recent years, the interest in proton-exchange membrane fuel cells (PEMFCs), also known as polymer electrolyte membrane fuel cells, for stationary applications such as households or office buildings has increased [1]. PEMFCs cogenerate electrical power and heat (heated water) from hydrogen (and O2/air) and reach about 80% overall efficiency. Home fuel cells cannot generate at all times exactly the needed amount of both heat and electricity, and are typically combined with a traditional furnace (e.g., with natural gas as fuel) and households are also connected to the electrical grid to cover the need of heat and electricity not produced by the fuel cell.
Today, pure H2 is rarely directly available. Hence, home fuel cells currently use H2 produced from natural gas from the gas grid. Natural gas is firstly converted by steam reforming (CH4 + H2O ↔ CO + 3H2) followed by a water gas shift (WGS) reactor (CO + H2O ↔ CO2 + H2) to decrease the concentration of CO (and to increase the output of H2). However, the WGS is limited by thermodynamic constraints, and the H2 rich gas still contains small amounts of CO at the outlet of the WGS, typically 0.5–1 vol% CO [2,3]. Unfortunately, even traces of CO deactivate the anode electro-catalyst of the PEMFC. Therefore, the CO content must not exceed 10 ppm for Pt-anodes and 100 ppm for PtRu-anodes [4,5]. Hence, the CO content in the operating gas has to be further reduced below these threshold values, preventing a degradation of the fuel cell catalyst.
CO preferential oxidation (CO-PROX) has so far been a reliable technique as a fine purification step of the feed gas downstream the WGS unit [2,6,7,8,9,10]. In order to achieve the required low CO concentration permanently, a two-step system is usually needed [4]. In addition, this process requires an additional, closely controlled, low rate O2 supply to keep the unwanted oxidation of hydrogen as low as possible [2,10].
Selective CO methanation is considered an attractive alternative to preferential CO oxidation for the removal of CO from H2 rich gases for PEMFC applications [11,12]. Here, no additional reactant is needed such as air for CO-PROX, but the risk of undesired CO2 methanation, which also consumes additional H2, is likely to occur.
In the course of selective CO methanation of a reformate gas, three main reactions can take place, CO methanation, Equation (1), CO2 methanation, Equation (2), and the reverse-water-gas-shift (RWGS) reaction, Equation (3).
CO + 3 H 2 CH 4 + H 2 O      Δ H 298 0 = 206   kJ · mol 1
CO 2 + 4 H 2 CH 4 + 2 H 2 O      Δ H 298 0 = 165   kJ · mol 1
CO 2 + H 2 CO + H 2 O      Δ H 298 0 = 41   kJ · mol 1
Both CO2 methanation and reverse water gas shift (RWGS) are unwanted and have to be suppressed, as valuable H2 is consumed and CO is even produced, respectively. The development of a catalyst with high activity and selectivity for CO methanation at low temperatures, optimally at temperatures of the off-gas of the WGS unit of around 200 °C, is therefore important. Ruthenium catalysts show these characteristics for selective CO methanation [13,14,15,16,17,18].
Based on own screening experiments with a variety of Co and Ru catalysts with regard to activity and selectivity for selective CO methanation [19], a 2 wt% Ru/γ-Al2O3 catalyst was selected as most suitable for this application. This Ru catalyst was prepared and applied for the investigation of the CO methanation reaction under varying reaction conditions, starting from gas mixtures containing only CO and H2 as well as CO2 and H2, respectively, to gas mixtures including H2O and both CO and CO2, representing a more realistic reformate gas comparable to practical applications [20]. In addition to 0.5–1 vol% CO, gas streams leaving the RWGS unit typically contain 10–25 vol% CO2 and 5–20% H2O (rest H2) [12,21,22]. Kinetic studies were conducted to investigate the influence of temperature and concentration of each gas component on the reaction rate. Based on the respective results, a kinetic model was developed to predict the conversions of CO and CO2. Finally, an adiabatic fixed reactor was simulated to determine the amount of a methanation catalyst needed for a typical household fuel cell system.

2. Experimental

2.1. Catalyst Preparation and Characterization

The 2 wt% Ru/γ-Al2O3 catalyst was prepared by incipient wetness impregnation (Table 1). Al2O3 spheres with a diameter of 2.5 mm (Sasol Germany GmbH) were impregnated with the respective amount of Ru(NO)(NO3)3 solution in dilute nitric acid. The catalyst was dried under vacuum in a rotary evaporator (60 °C, 8 h). After reduction with H2 (10% in N2, 350 °C, 4 h), the catalyst was utilized in the methanation of CO or CO2. The catalyst was characterized by energy dispersive X-ray spectroscopy (EDX), indicating that a core shell catalyst with a thickness of the Ru containing shell of 0.35 mm was obtained. The shell represents 62% of the particle volume, and the Ru content in this shell is therefore about 3 wt% compared to the average content of 2%. H2 pulse chemisorption experiments were performed after reduction in H2 (350 °C, 30 min). The Ru particle size of 6 nm was calculated on the basis of a 1:1 stoichiometry for the number of Ru atoms exposed on the catalyst surface to the number of chemisorbed H atoms at 110 °C.

2.2. Experimental Set-up

The experimental set-up consists of a fixed-bed reactor made of steel with an internal diameter of 1.4 cm and a length of 80 cm. The catalyst was positioned in the middle of the tube and diluted with (inactive) quartz sand in a ratio of 1:2 by mass in order to keep the catalyst temperature constant and to prevent hot spots. The reactor was thermostated by an oil heating system, guaranteeing isothermal conditions. Two thermocouples in a guide tube were positioned in the catalyst bed to monitor the temperature. Feed gases relevant to those of a reformate gas containing CO, CO2, H2, and H2O were used. The concentrations of all these reactants were varied by substituting the reactant of interest by N2, typically 40%, to study the kinetics of each gas; thereby, the inlet concentrations of the other reactants and the total pressure were kept. Experiments took place at atmospheric pressure at temperatures of 160–250 °C. The gas composition leaving the reactor (CO, CO2, H2, and CH4) was analyzed with a gas analyzer (X-STREAM Enhanced Process Gas Analyzer, Emerson) and by gas chromatography, although higher hydrocarbons were only formed to a very small extent. The flow rates of the feed gases were adjusted by mass flow controllers and for steam addition by a water saturator. The feed gas could be analyzed by using a bypass. During the kinetic experiments, the gas was directed first to the saturator (in case of steam addition) and then to the reactor and gas analyzer.

2.3. Kinetic Measurements

The reactor was charged with 2 g of the catalyst diluted with 4 g of quartz sand. The catalyst bed length was 5 cm. Hence, the pressure drop was considered to be negligible. The measurements were carried out at atmospheric pressure using mixtures of CO, CO2, H2, H2O, and N2. First, the influence of each gas on the reaction rates was examined. Both for CO and for CO2 methanation, a kinetic expression based on a Langmuir–Hinshelwood approach turned out to be suitable. The temperature was then varied from 160–190 °C for CO and 190–235 °C for CO2. Initially, the residence time was small to keep conversion of CO and CO2 low (<10%) and ensure differential conditions for a direct determination of the rates (ri = − dci/dτci,in Xi/τ). The CO content was varied from 0.4–1.4 vol%, CO2 from 0–20%, H2 from 50–90%, and H2O from 0–20%. Integral kinetic measurements were also conducted to prove the kinetic expressions for a wide range of CO conversion up to almost 100%.

3. Results

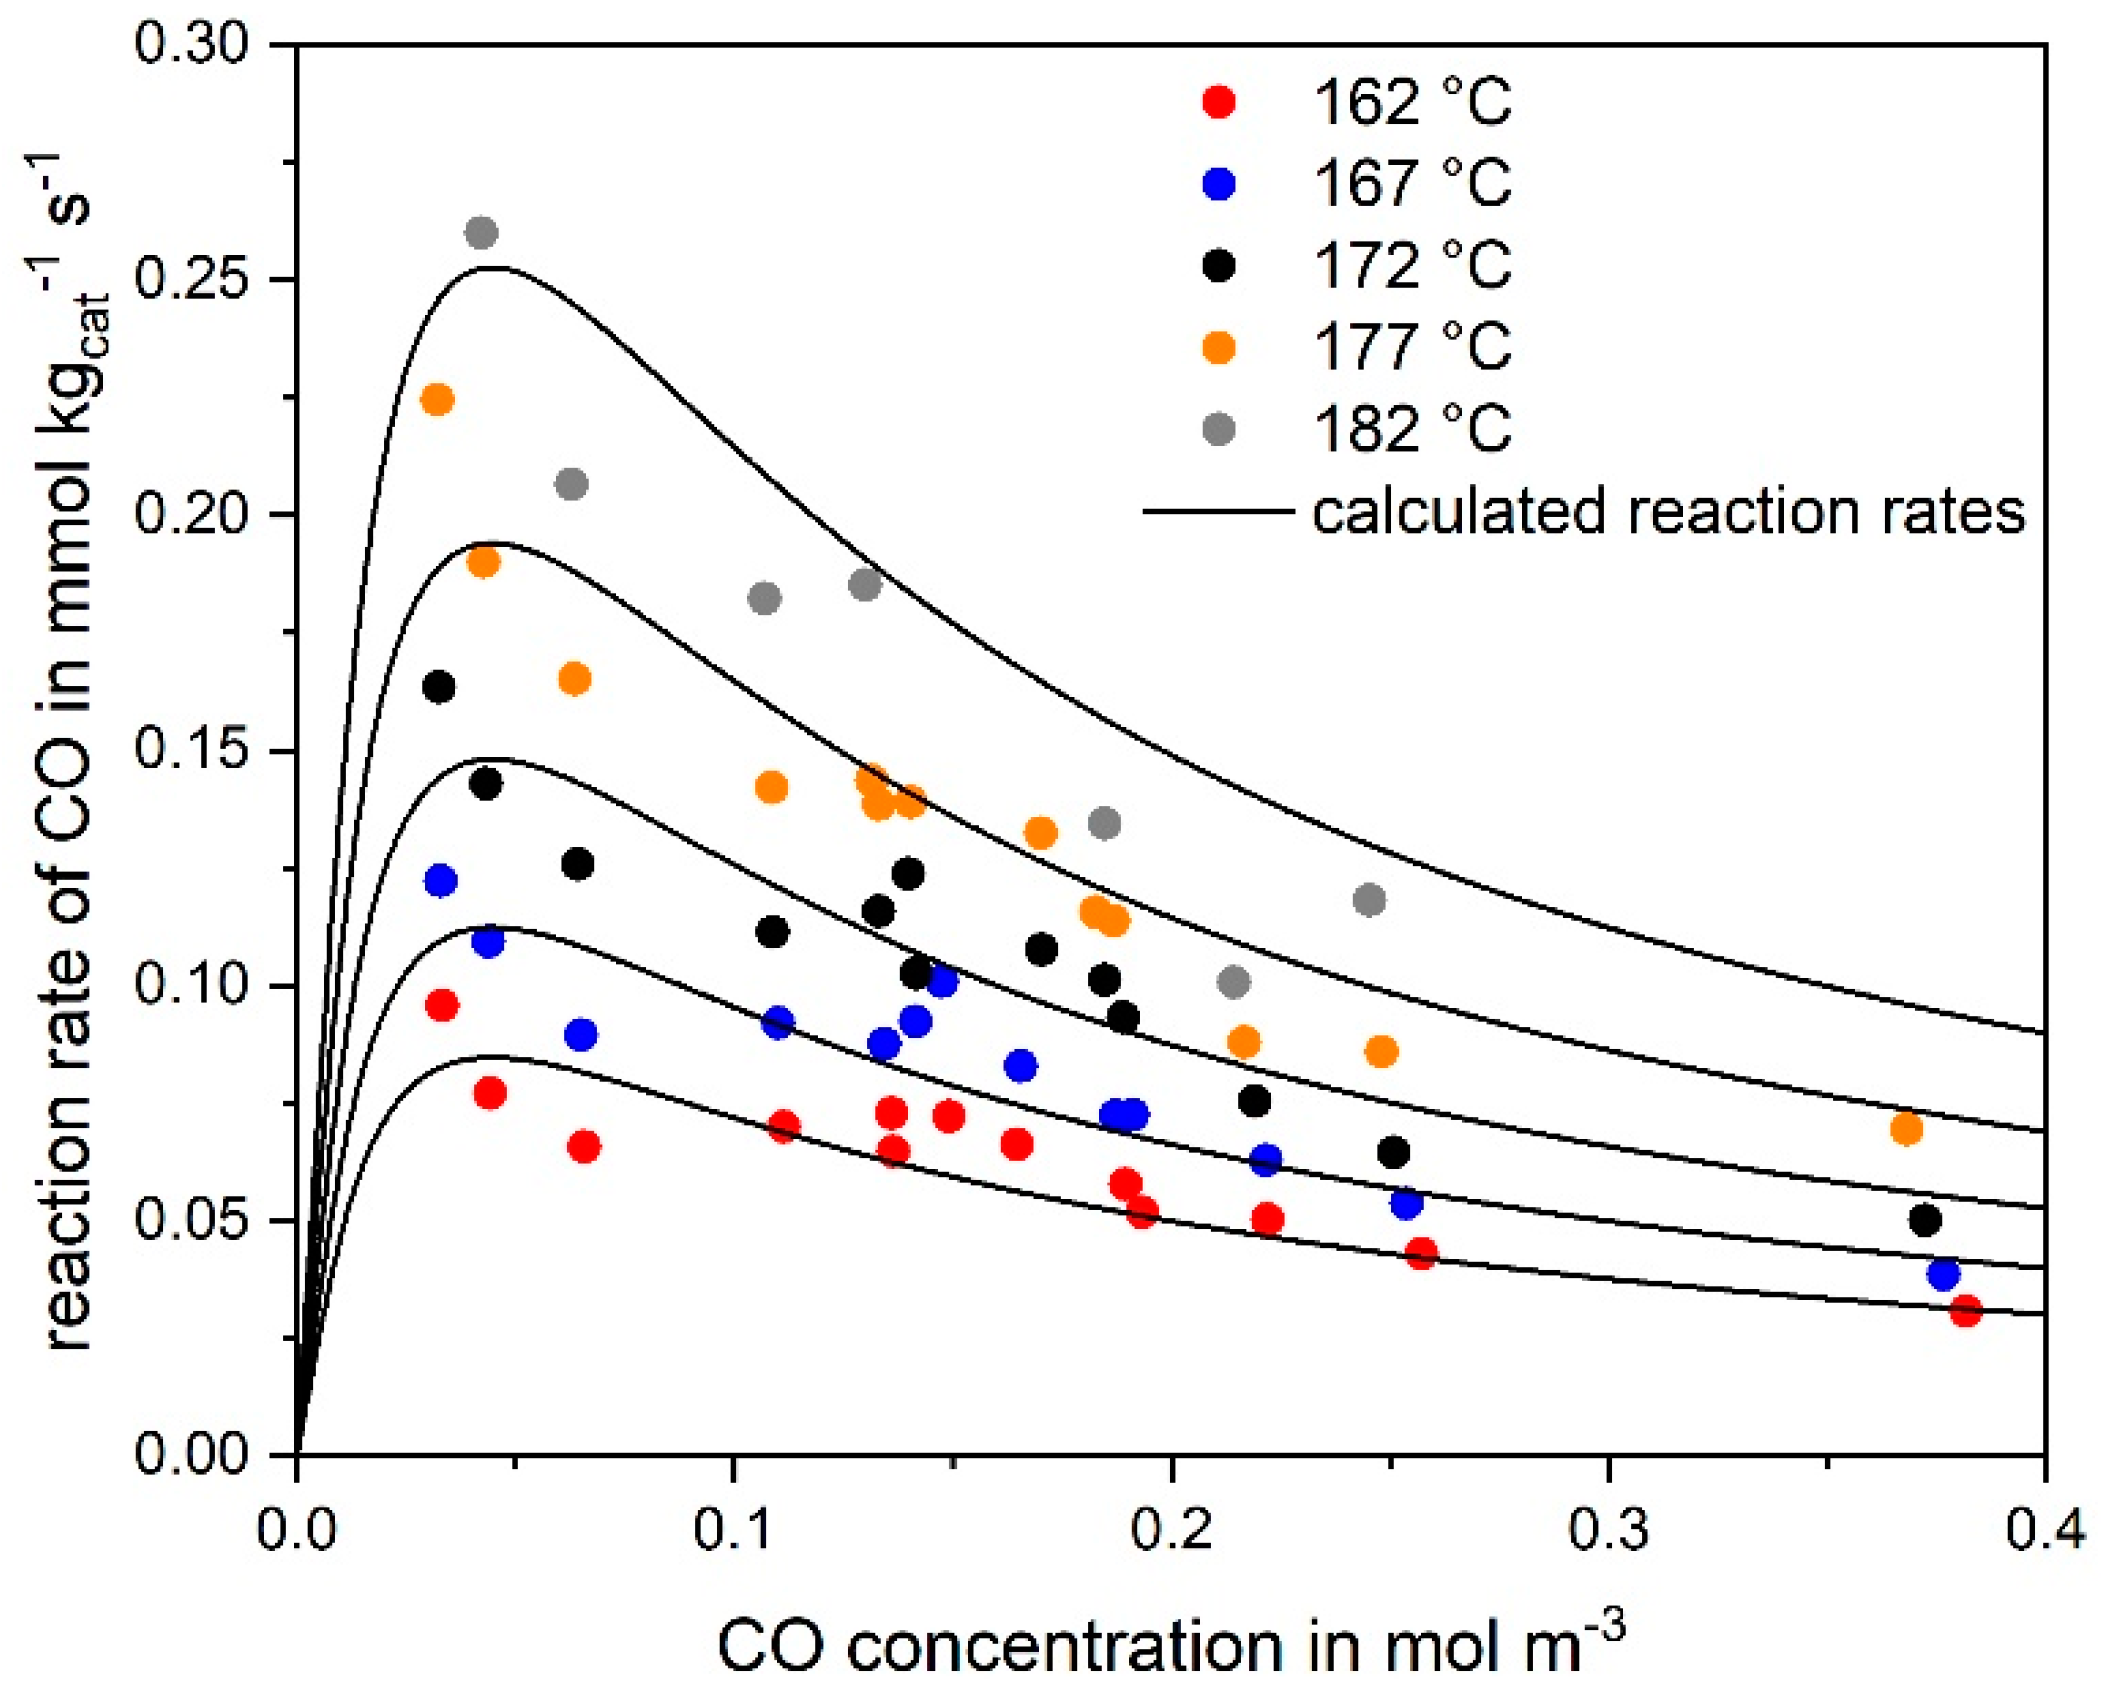
3.1. CO Methanation Kinetics

As already mentioned, the kinetics of CO methanation follow a Langmuir–Hinshelwood approach:
d C CO d τ = r CO = k CO ( T )   c CO   c H 2 ( 1 + K 1   c CO + K 2   c H 2 O ) 2
where Ci (i = CO, H2, H2O) is the gas concentration, τ is the (modified) residence time defined as the ratio of catalyst mass to volumetric gas flow at reaction conditions (p, T), K1 and K2 are adsorption constants for CO and H2O, respectively, and kCO(T) represents the reaction rate constant according to the Arrhenius law:
k CO ( T ) = k 0 , CO   e E A , CO R   T
k0 is the pre-exponential factor, and EA,i the activation energy. The influence of temperature on the adsorption constants (K1, K2) turned out to be negligible. The parameters of the reaction rate of CO methanation finally obtained based on experiments at varied temperatures and gas concentrations are listed in Table 2.
Figure 1 exemplarily shows the influence of the CO concentration on the rate of CO methanation at different temperatures, whereby the CO conversion was kept low (<10%) by adjusting short residence times and high (standard) volume rates of 12.5 l h−1 to 43.5 l h−1 (STP), respectively, to ensure differential conditions. Higher hydrocarbons (HCs) from ethane to pentane, with a maximum for C3 and declining values for higher C-numbers, were also detected at low temperatures; so, the Ru catalyst also has a certain Fischer–Tropsch activity. The selectivity to higher HCs was 30 C% at 162 °C, but as the temperature rises this selectivity decreases strongly, until at about 220 °C no higher HCs and only methane are formed. Formation of CO2 was never observed, indicating that the WGS reaction (reverse of Equation (3)) does not take place. Figure 1 shows that the reaction rate of CO passes through a maximum and decreases with higher CO concentrations as expected for a Langmuir–Hinshelwood rate expression. The agreement of the experimental data at higher temperatures of up to about 220 °C, where almost complete CO conversion is reached, and of the calculations based on numerical integration of Equation (4) utilizing the kinetic parameters (Table 2) is quite satisfactory (Figure 2).
The addition of CO2 to a feed gas consisting of 1.13 vol% CO, 10% H2O, and 55% H2 (rest N2) showed no influence on the CO conversion, even if 16% CO2 were added (Figure 2). The conversion of CO2 was less than 2% even for the highest temperature of 220 °C, where 90% conversion of CO (to methane) was already reached.

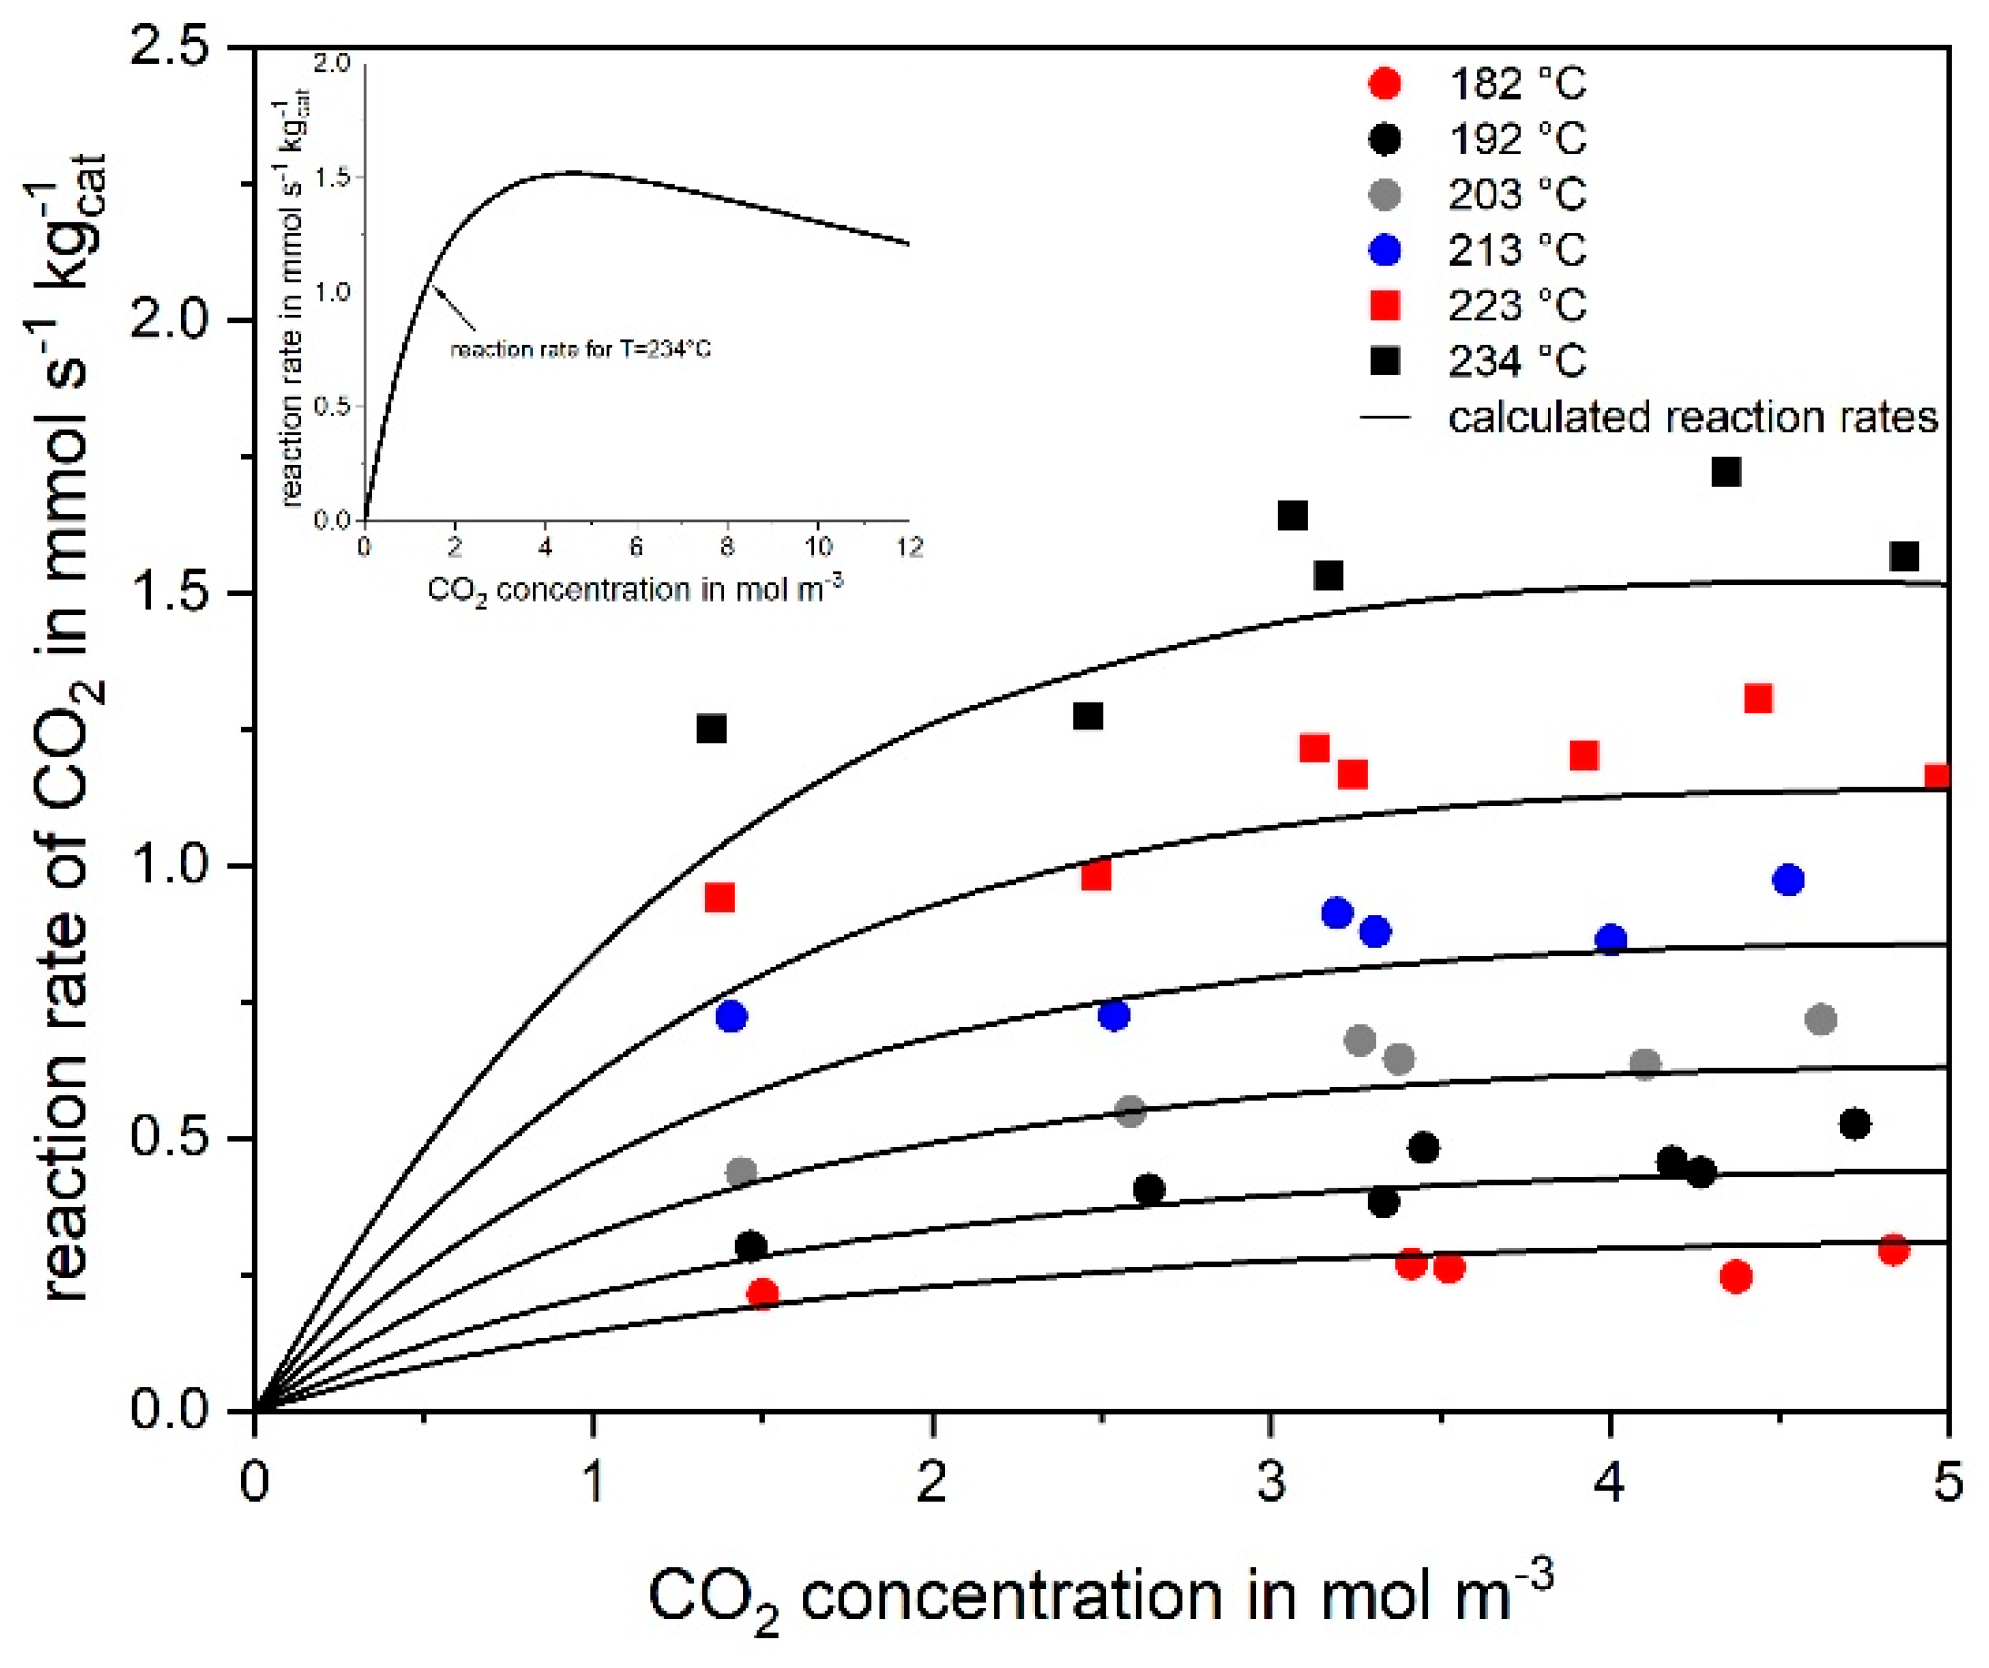
3.2. Kinetics of CO2 Methanation

CO2 is also subject to methanation, although to a lower extent compared to CO. So, the reaction of CO2 with H2 was also studied, at first without CO in the feed. Thereby, CO was not detected for T < 200 °C, and even for T > 200 °C the content was less than 25 ppm. The possible role of the RWGS and the question whether CO2 is directly converted to methane or via RWGS and subsequent CO methanation is discussed in detail in Section 3.3. For CO2 methanation, a Langmuir–Hinshelwood approach was also used to fit the experimental data:
d C CO 2 d τ = r CO 2 = k CO 2 ( T )   c CO 2 c H 2 ( 1 + K 3 ( T )   c CO 2 + K 4 ( T )   c CO + K 5   c H 2 O ) 2 ,
ci (i = CO, CO2, H2, H2O) is the gas concentration, τ is the residence time defined as the ratio of catalyst mass to the volume flow at reactor temperature and atmospheric pressure, K3(T), K4(T) and K5 are the adsorption constants for CO2, CO and H2O, respectively, and ki(T) is the reaction rate constant according to the Arrhenius law (Equation (5)). The influence of temperature on the adsorptions Ki is given by:
K i ( T ) = K 0 , i   e Δ H i R   T
CO, CO2, and H2O have an influence on the reaction rate of CO2, but the CO concentration has the highest impact. For instance, at 190 °C, the adsorption constant for CO (K4) is 14.6 m3·mol−1, and thus much higher than the value for CO2 (K3) with 0.17 m3·mol−1 or for H2O (K5) with 1.1 m3·mol−1. The adsorption constant for H2O turned out to be independent of temperature. Most probably, the active catalyst surface (Ru) is blocked by adsorbed CO due to strong adsorption of CO compared to CO2 and H2O [23]. This leads to a low activity for (dissociative) adsorption of CO2. The kinetic parameters of Equation (6) are presented in Table 3.
Note that formally the adsorption of CO2 turned out to be surprisingly endothermic (Table 3). It should be also emphasized that, although unsurprisingly the constant K4 for CO “adsorption” in case of CO2 methanation is at 190 °C similar to the respective parameter K1 for CO methanation, 15 m3 mol−1 compared to 23 m3·mol−1, (see Equation (4) and Table 2 and Table 3), but K1 turned out to be independent of temperature, whereas the rate of CO2 methanation could only be described accurately in the whole range of the investigated temperature by assuming a strong influence of temperature on K4. Hence, the physical meaning of the constants Ki, although denoted here as adsorption constants, is highly questionable, but at least they formally describe the reaction rate(s) quite well.
Figure 3 shows the influence of the CO2 concentration on the reaction rate. The degree of CO2 conversion was kept below 10 % to realize differential conditions (rCO2 = − dcCO2/dτcCO2,in XCO2/τ). The volume rate was 16 to 22 l h−1 (STP). The agreement of the experimental data and the rates calculated by Equation (6) is satisfactory. The rate of CO2 methanation increases with increasing CO2 concentration to a maximum and then decreases for high CO2 concentrations (>5 mol·m−3 = 18 vol-%), as shown in Figure 3 by the calculation for 234 °C and high values of cCO2. The only product found for CO2 conversion is methane, which is a first indication of a negligible activity of the catalyst for the RWGS, Equation (3), an aspect discussed below in more detail.
If CO is added to the feed gas containing CO2, the CO2 reaction is strongly suppressed. Figure 4a compares the calculated initial reaction rates of CO and CO2 at different CO concentrations for 190 °C and 230 °C. For clarity, the ratio of both rates is also shown (Figure 4b).
At a relative high temperature (230 °C), the reaction rate of CO2 is in the same order of magnitude than the rate for CO (Figure 4b). So, about the same amount of H2 is consumed by both reactions. To the contrary, the rCO2-to-rCO ratio is lower than one (for cCO > 0.03 mol m−3 = 0.1 vol%) at 190 °C and strongly declines with increasing cCO. The reason is (formally) the much lower adsorption constant for CO (K4), 15 m3·mol−1 at 190 °C and only 1.1 m3·mol−1 at 230 °C.
It must be emphasized that the rates and the rate ratios given in Figure 4 were calculated for a content of CO and of CO2 relevant for selective methanation, i.e., the CO2 content is about an order of magnitude higher compared to CO. For example, at 230 °C and a CO content of 1% (0.3 mol m−3), the ratio of the rates (rCO2/rCO) is about one (Figure 4b), but the ratio of the concentrations (cCO,in/cCO2,in) is only 0.05. The change of conversion X with residence time, dXi/dτ, equals the term ri/ci,in, and the ratio of the (differential change) of the conversion of CO and CO2, dXCO2/dXCO, is given by the term rCO2/cCO2,in × cCO,in/rCO = 0.05 rCO2/rCO. Hence, the (initial) change of XCO2 with residence time τ is 20 times smaller compared to CO, even if both rates are equal.

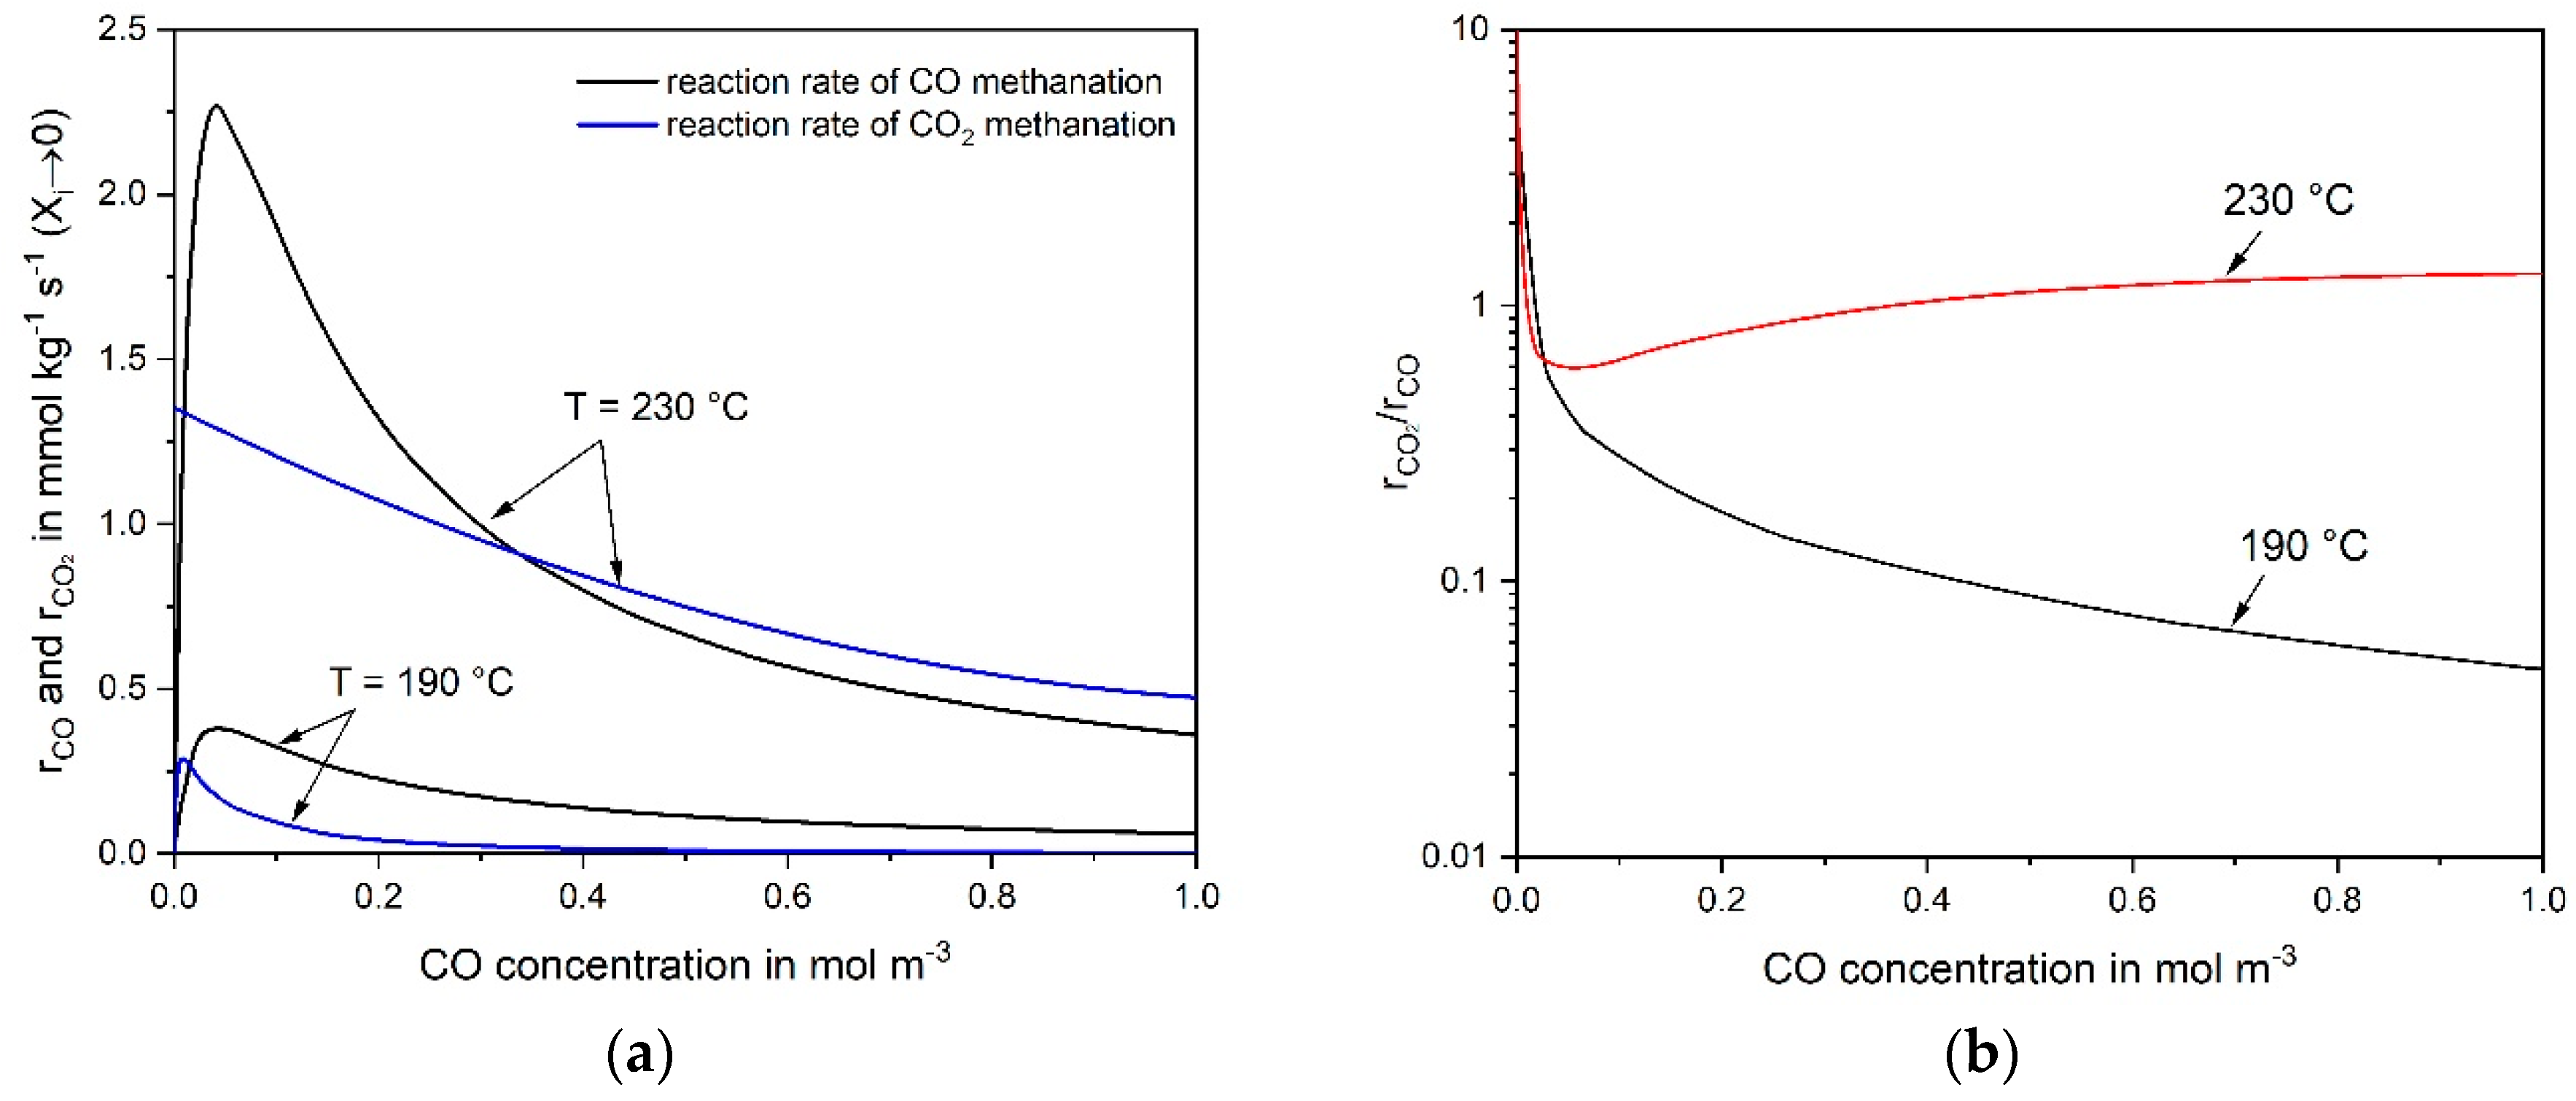
3.3. Reaction Mechanism of CO and CO2 Methanation

The mechanism of CO and CO2 methanation have been the subject of several studies. It is generally agreed that hydrogenation of CO proceeds via dissociation of CO into C and O atoms followed by hydrogenation to CH4 and H2O [16,24,25]. For CO2 methanation, there are two different opinions on the nature of the mechanism:
  • CO2 is converted into CO prior to methanation, and direct methanation of CO2 does not take place [26,27,28,29].
  • CO2 is directly converted into methane without CO as intermediate [1,30].
For the Ru catalyst used here, the rate of CO conversion is high. So, even if only CO2 (and H2) are used as reactants, it is hard to distinguish which of the two proposed mechanisms is true. If, for example, the first mechanism with CO as intermediate is true, the concentration of CO may be nevertheless small and hard to detect. Here, two approaches were used to estimate the role of direct and indirect CO2 methanation, respectively:
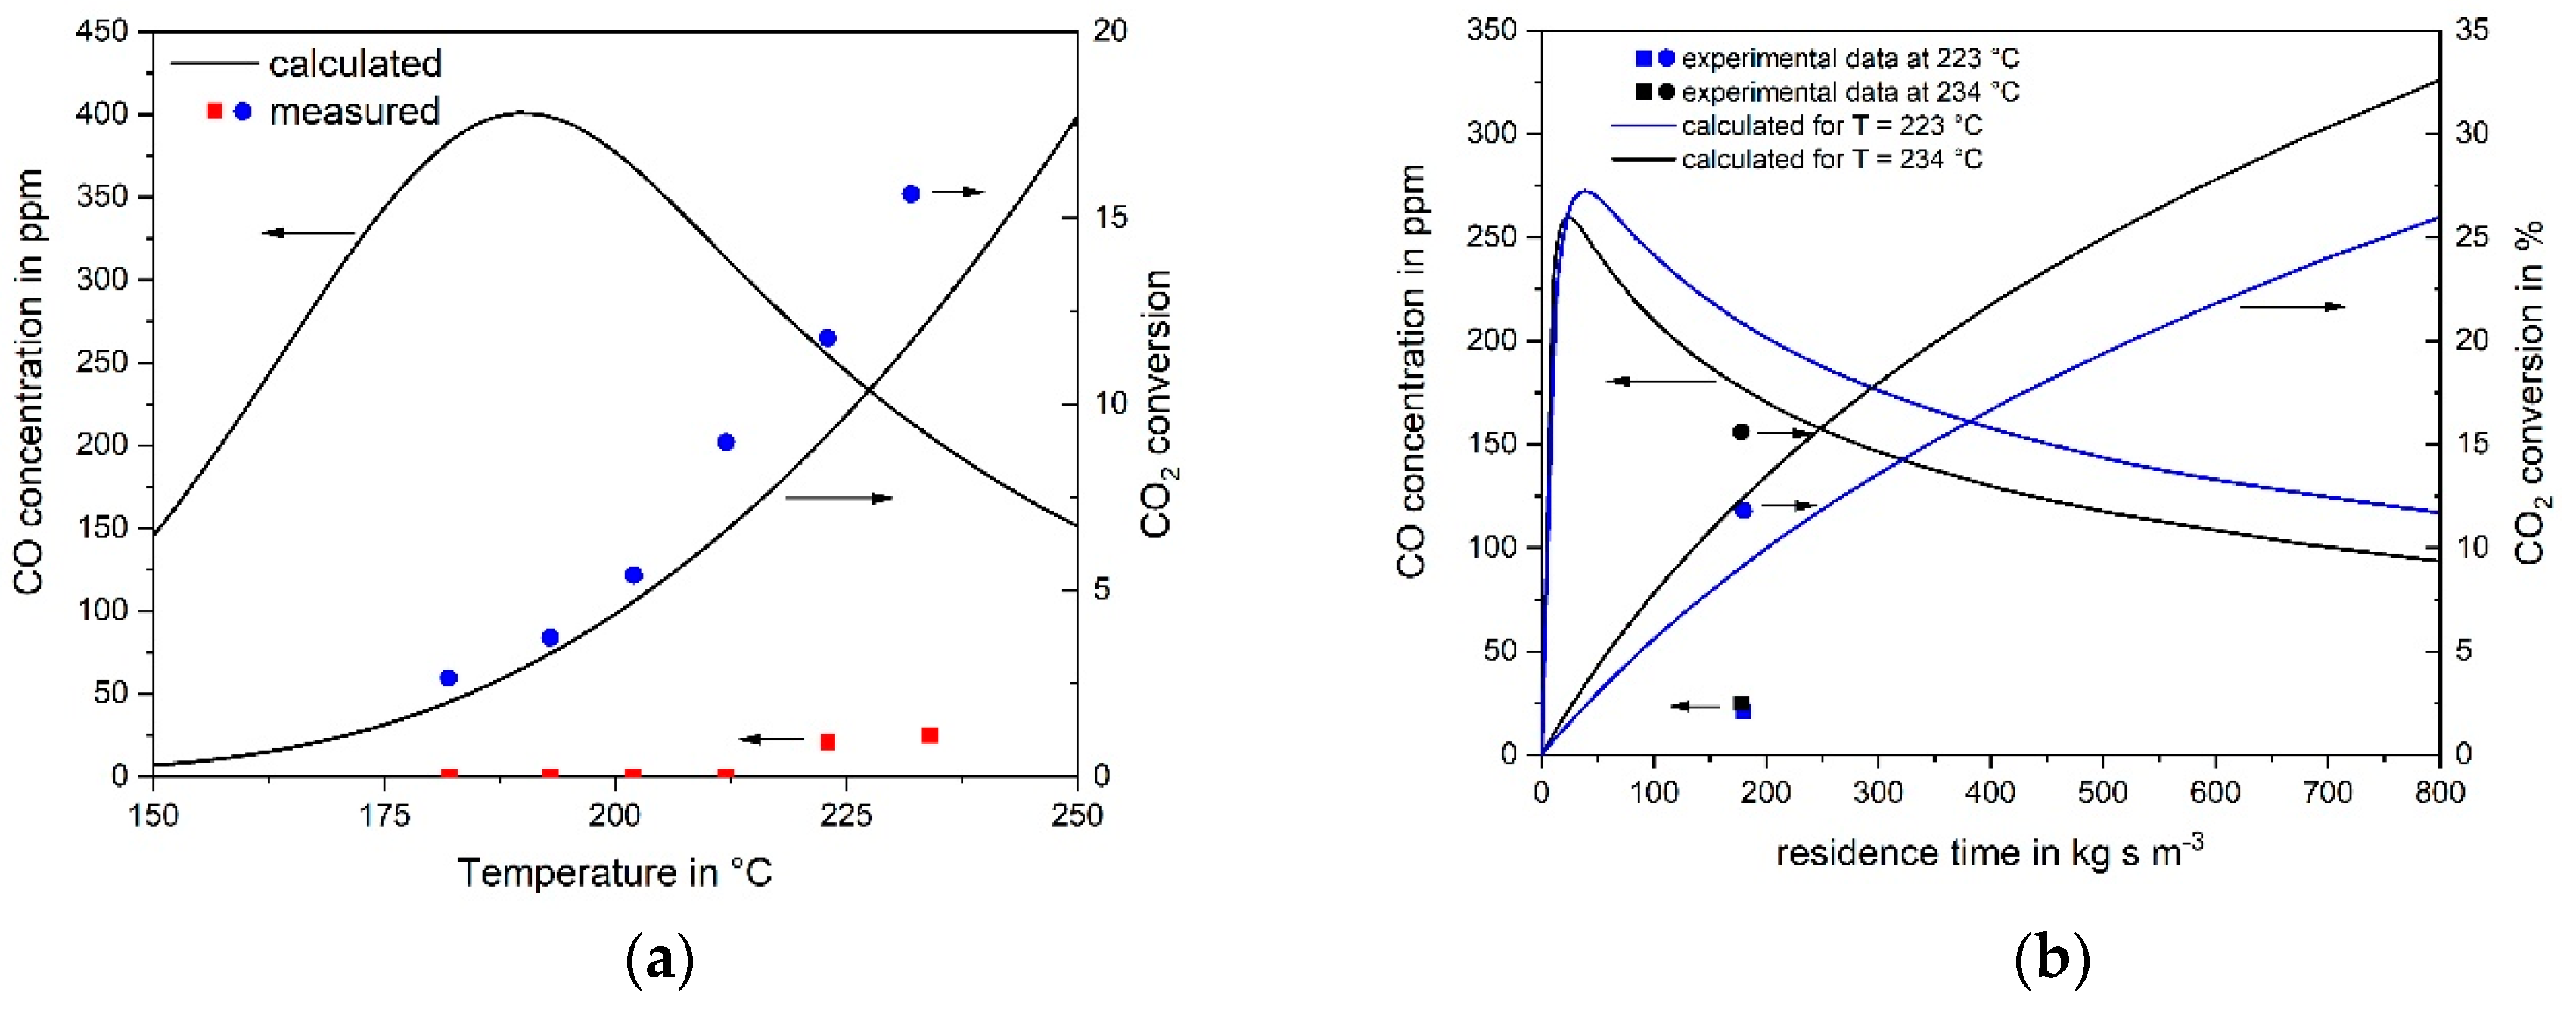
  • The rate of RWGS can be estimated and compared with the measured CO2 rate based on the (easily) measurable rate of the reverse WGS reaction and some thermodynamic considerations.
  • The rate of CO2 conversion must equal the rate of RWGS, if (hypothetically) only indirect CO2 methanation via CO takes place. The RWGS is then the rate determining step followed by fast CO methanation. A calculation based on the CO and CO2 rate equations (as determined in this work) lead to the concentration of the intermediate CO, which should correspond to the observed values. If the calculated CO yield is much higher than the one observed, this is an indication of the dominance of direct CO2 methanation and vice versa.
Approach 1: Unfortunately, the rate of the RWGS could not be directly measured here, because methanation of CO is fast hindering the decision whether direct CO2 methanation or the RWGS followed by CO methanation takes place. However, the rate of RWGS can at least be estimated based on the measurable rate of the WGS, Equation (8), and the equilibrium constant Kc. The rate of the WGS was investigated with 20% CO and 20% H2O in N2 (mcat = 2 g, VSTP = 8 l h−1, 200–260 °C). The conversion of CO was less than 4%. (Remark: The equilibrium CO conversion of the WGS for these conditions is higher than 90%; hence, only the WGS without any influence of the RWGS was measured.) The simplifying assumption used here is that the WGS is first order both with respect to CO and H2O. It has to be noted that this assumption was not experimentally proved and verified. Nevertheless, the rate of the WGS obtained by this assumption is still a rough but good estimation to show (see below) whether CO2 is most probably directly converted (hydrogenated) to methane or indirectly via CO. Using this assumption, the rate constant kWGS was determined, yielding a pre-exponential factor, kWGS,0, of 5.18×10⁴ m3 mol−1·kg−1·s−1 and an activation energy, EA,WGS, of 97 kJ/mol.
The equilibrium constant KC of the WGS is approximately the ratio of the rate constants of WGS and RWGS, and thus the rate constant of the RWGS was calculated (kRWGS = kWGS/KC).
CO + H 2 O CO 2 + H 2      Δ H 298 0 = 41   kJ   mol 1
According to [31], the equilibrium constant KC of the WGS can be determined by:
K c ( T ) = c CO 2 c H 2 c CO   c H 2 O = 0.0147   e 4577.8 T
So finally, the rate of the RWGS is given by rRWGS = kWGS/KC·cCO2·cH2. For 190 °C and a feed gas containing 20% CO2, 55% H2, and 25 vol% N2, and the conditions used here (mcat = 2 g, VSTP = 8 l h−1), rRWGS is only 0.0005 mmol CO2 kg−1·s−1 compared to the much higher measured reaction rate of CO2, rCO2, of 0.29 mmol CO2 kg−1·s−1. Hence, CO2 is most probably not consumed by the RWGS followed by CO methanation, but only by direct methanation.
Approach 2: If the hypothesis would be correct that CO2 methanation is just an indirect reaction and only occurs via RWGS and subsequent CO methanation, then the measured reaction rate of CO2 should only reflect the rate of RWGS. The concentration of the intermediate CO during the conversion of CO2 with H2 can then be calculated based on the CO and CO2 reaction rates as determined in this work, Equation (4) and Equation (6). Figure 5a,b show the results both of the calculation and of two experiments for a feed gas with 6 vol% CO2 and 55% H2 (rest N2), if either the temperature (140–252 °C) or the residence time (for 223 °C and 234 °C) is increased. The calculated volumetric content of the “intermediate” CO can now be compared with experimental data: The calculation leads to relative high values of the CO content of up to 400 ppm, although no CO was experimentally detected for T < 200 °C. Even for 223 °C and 9% CO2 conversion (12% measured), the simulation leads to 240 ppm CO, whereas the experimental value is only 20 ppm. For 234 °C, XCO2,calculated is 12% (still in acceptable agreement with 16% measured) and 190 ppm CO are calculated compared to the experimental value of 25 ppm CO. These results again lead to the conclusion that the indirect pathway of CO2 methanation is not or only to a very low extent taking place, and that CO2 is directly hydrogenated to CH4 on the used Ru catalyst.

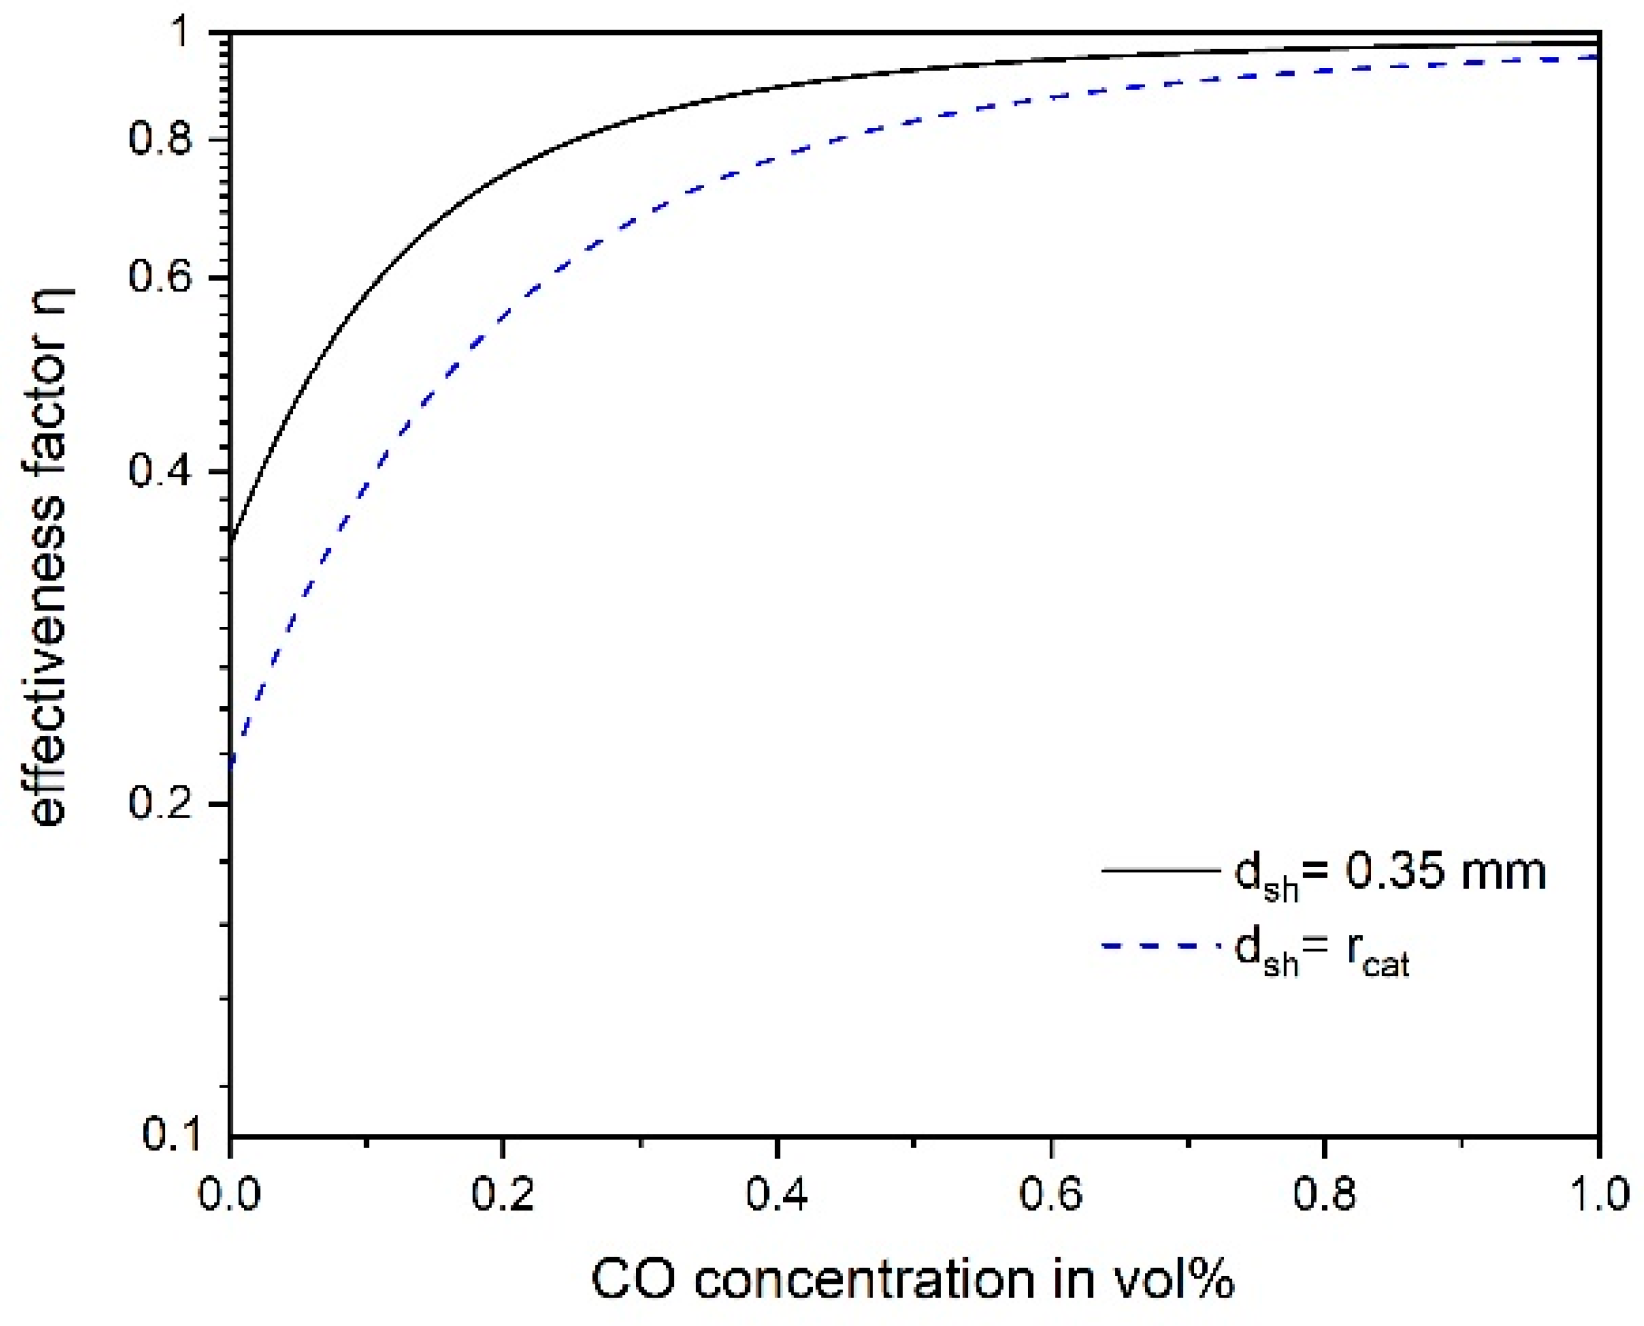
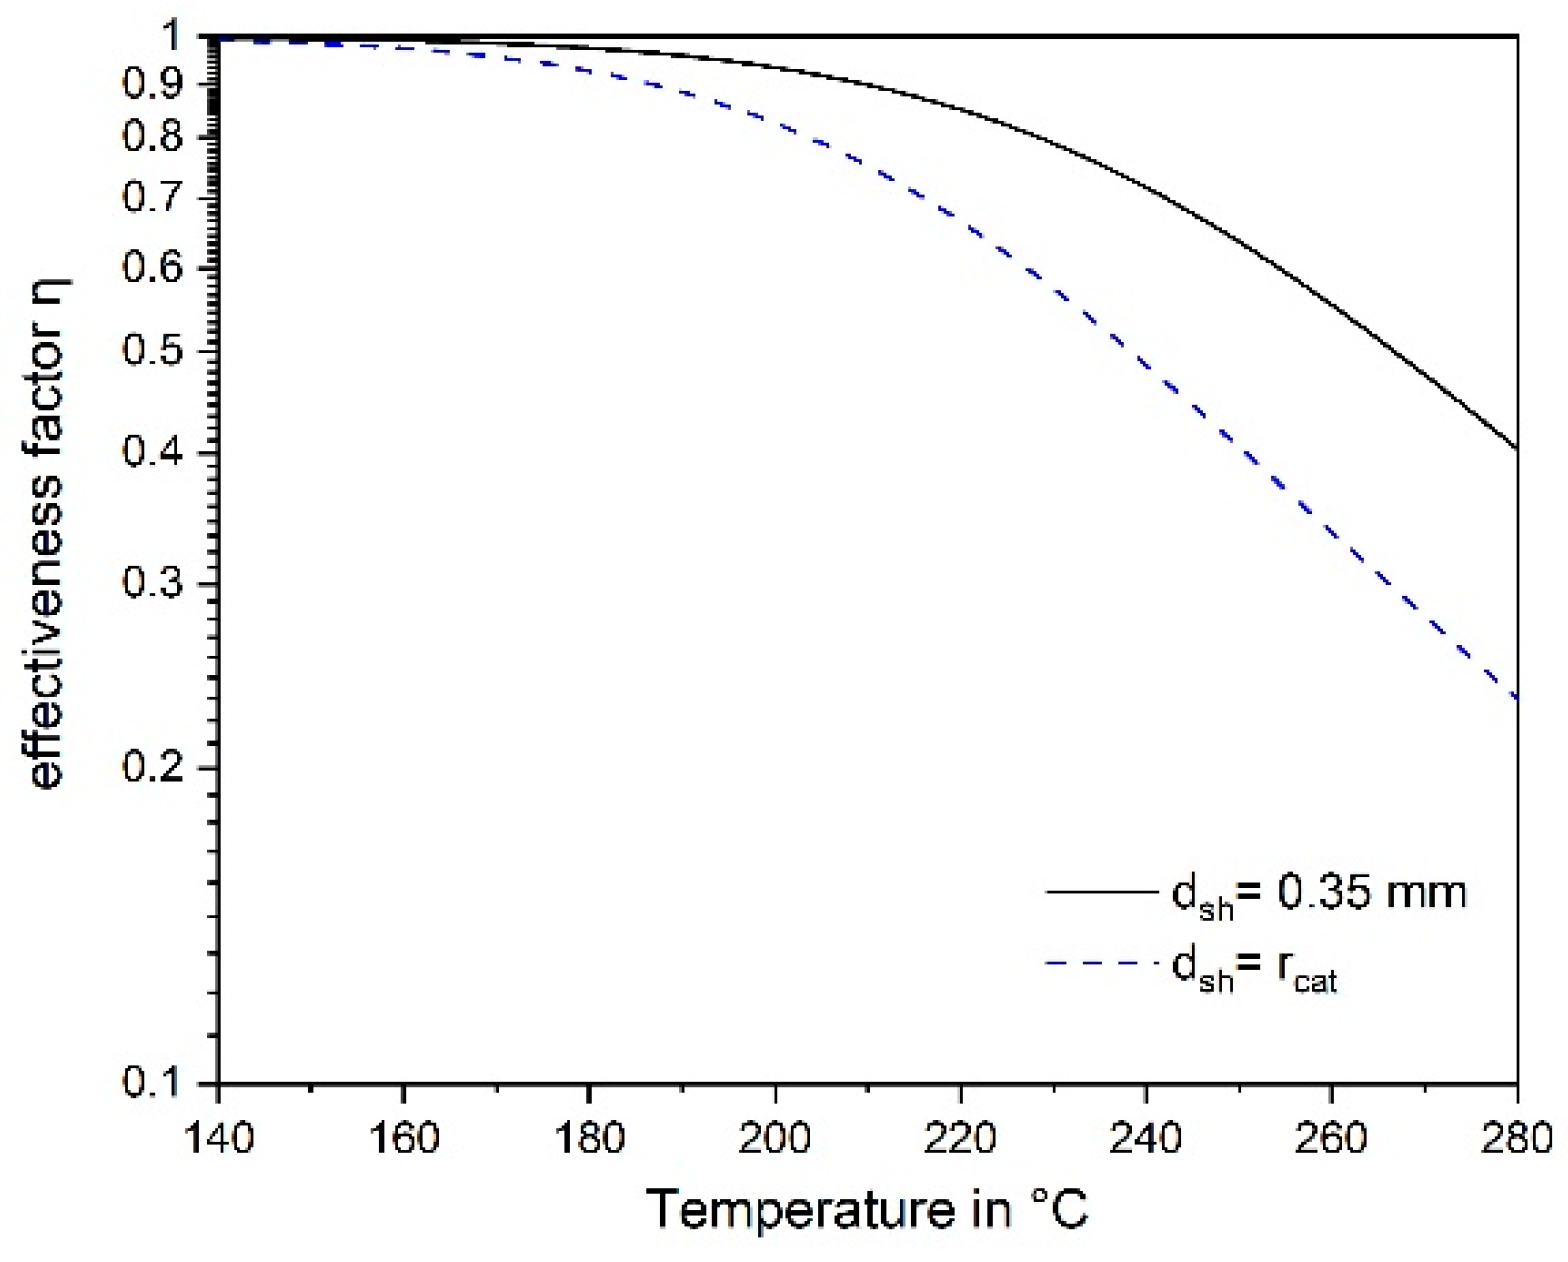
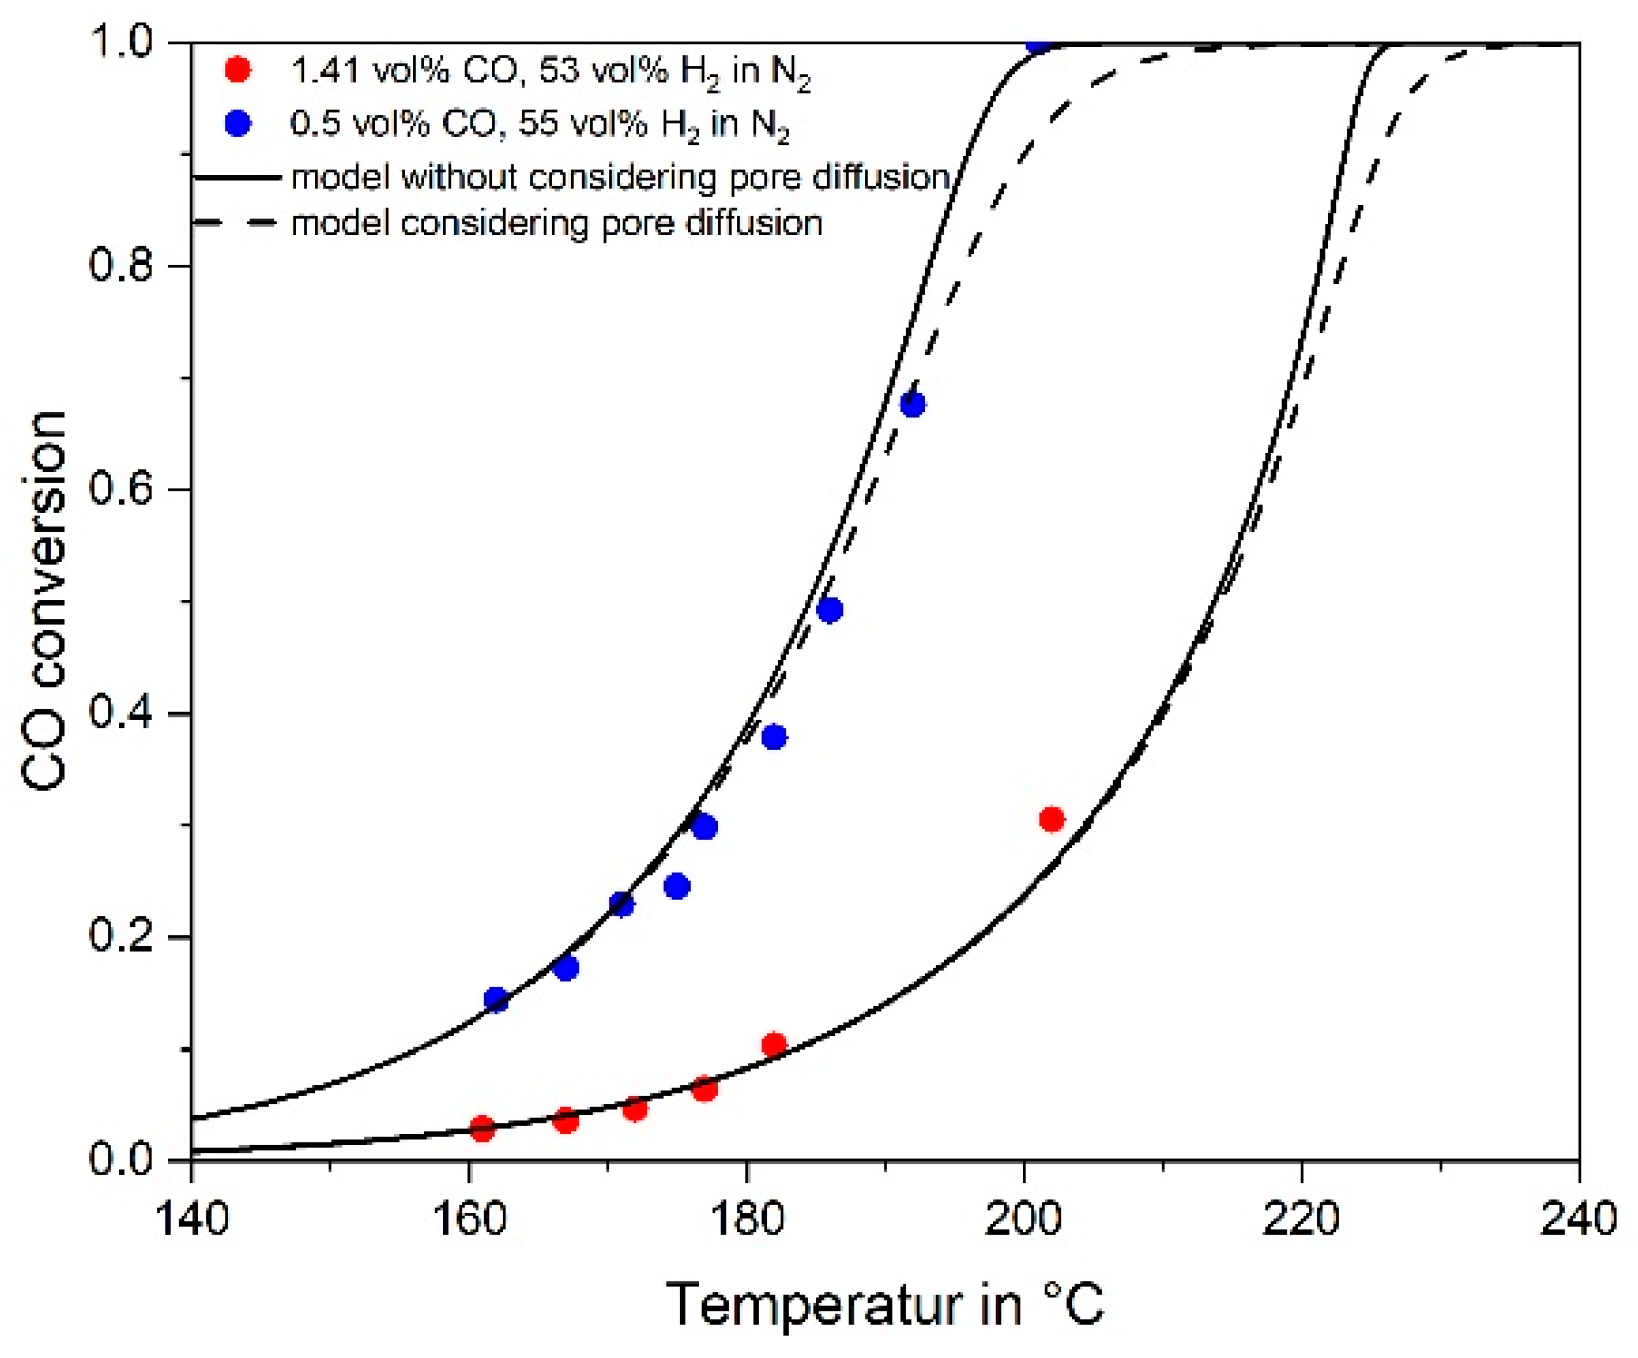
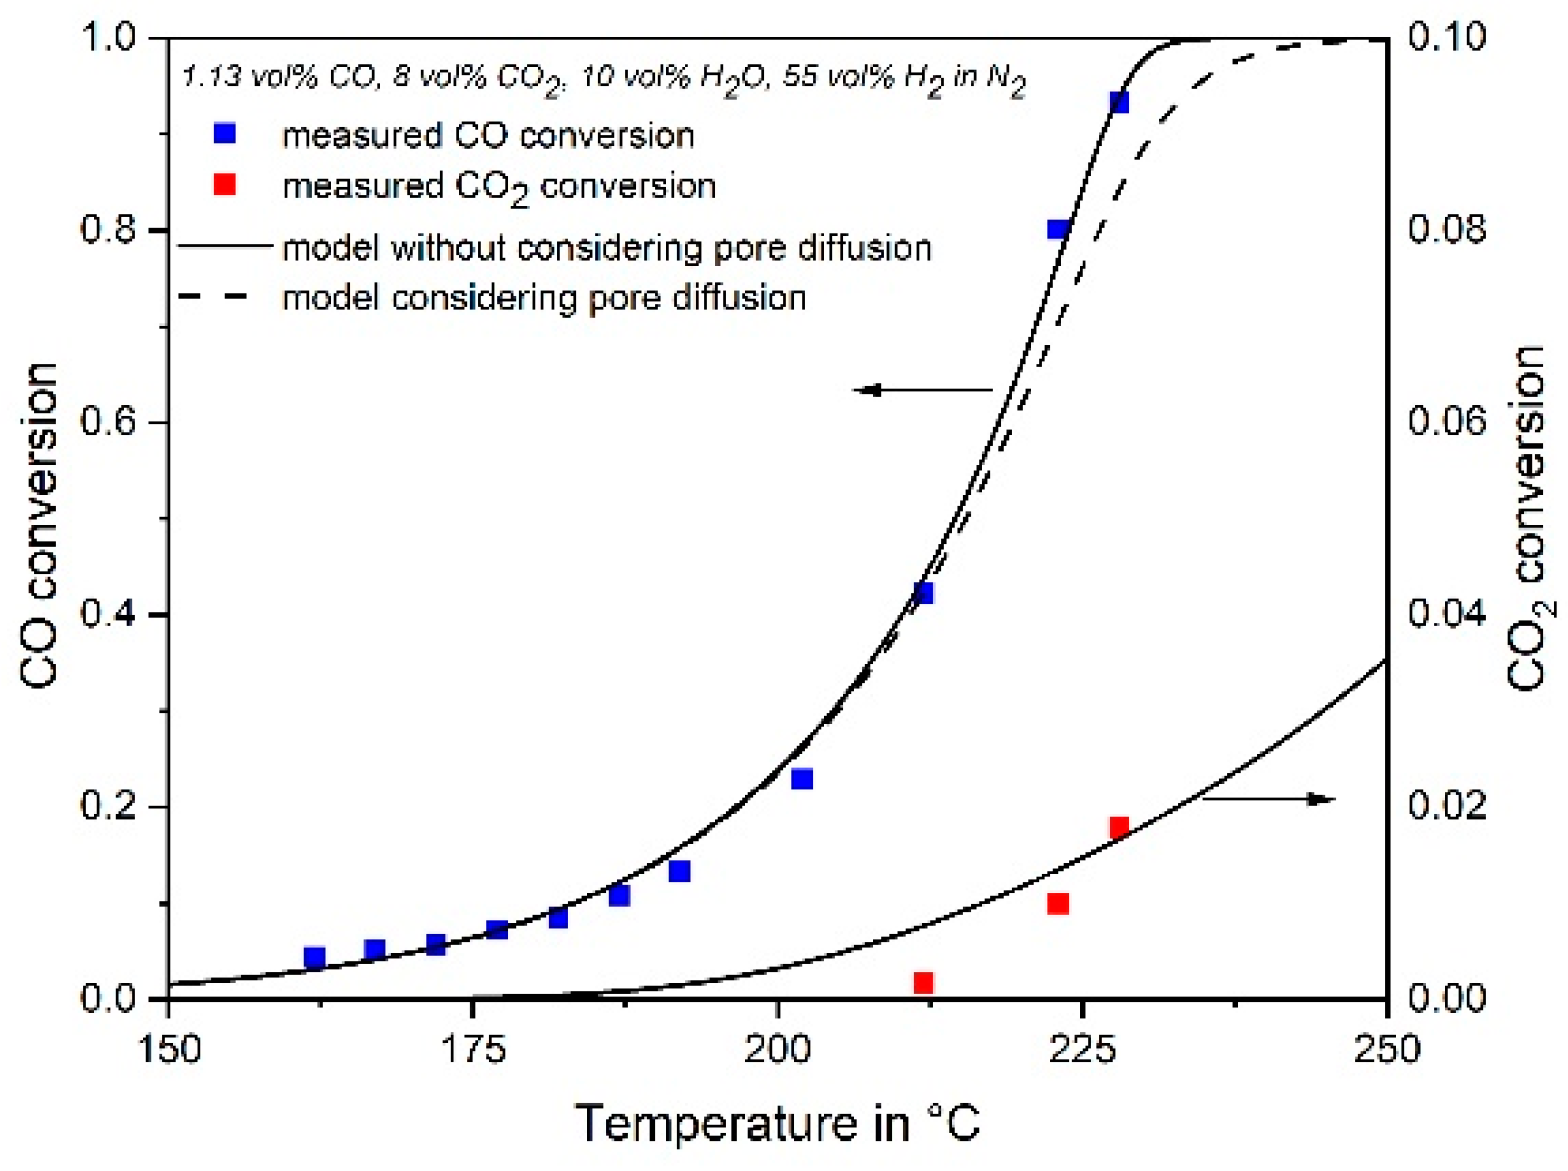
3.4. Influence of Pore Diffusion on the Rate of CO Methanation

A pore diffusion resistance lead to internal concentration gradients and a lower effective rate compared to the intrinsic chemical rate; this has to be considered in the rate equation [32]. For this purpose, the generalized Thiele modulus Φgen for an irreversible reaction with arbitrary kinetics (here Langmuir–Hinshelwood approach, Equation (4)), was used [33]:
Φ gen = V p A p   r CO   ρ p 2   D CO , eff   ( T )   ρ p 0 c CO r CO   d c CO
Vp is the particle volume, Ap the outer surface, rco the reaction rate of CO, ρp the particle density, and DCO,eff the effective diffusion coefficient, DCO,eff = εp/τp [1/Dmol + 1/DKn]−1, which also considers the particle porosity (εp) and tortuosity (τp). The binary diffusion coefficient for CO in H2 is calculated based on D0 for T0 = 273 K and 1 bar (0.65 cm2·s−1), Dmol = D0 (T/T0)1.75, and the Knudsen diffusivity is given by DKn = (dpore/3) [8RT/(π MCO)]0.5.
It had to be considered here that the active component (Ru) is concentrated in an outer shell with a thickness dshell of 0.35 mm. In this case, Vp has to be replaced by the volume of the shell, Vshell = 4/3 π [rp3 − (rpdsh)3]. Hence, the rate constant kshell is higher than the measured average value k, and the ratio can be calculated by:
k shell k = m p m shell = V p V shell = ( 1 ( 1 d sh r p ) 3 ) 1
mp and mshell is the mass of the catalyst and catalyst shell, respectively. The solution of Equation (10) finally leads to:
Φ gen = ( 1 ( 1 d sh r p ) 3 ) r p 3 k shell   ρ p 2   D CO , eff   ρ p k shell   C H 2 K 1 2 ( b K 1   C CO + b + ln ( K 1   C CO + b ) 1 ln b )
The factor b is defined as b = 1 + K2 CH2O. The effectiveness factor with regard to pore diffusion is [32]:
η = r CO , eff r CO = tanh Φ gen Φ gen
The parameters used for the calculation of the effectiveness factor are listed in Table 1.
Figure 6 shows that at high CO concentrations the effectiveness factor is close to 1, i.e., pore diffusion has almost no influence on the effective rate. For lower CO concentrations (<0.5%), important for selective CO methanation, the factor is less than one and the influence of pore diffusion has to be considered, e.g., for the design of a technical reactor.
Figure 6 also shows the advantage of the shell catalyst compared to a catalyst with uniform Ru distribution (denoted as “full” catalyst); for the slow CO2 methanation, pore diffusion does not play a role for the conditions relevant here. Figure 7 depicts the influence of temperature on the effectiveness factor. At low temperatures, the factor approaches a value of one, but at temperatures above about 200 °C, the internal mass transport is not negligible and was therefore considered in the modelling of a technical methanation reactor (see below).
Hence in the following, the effect of pore diffusion was considered. Figure 8 shows measured and modelled values of the conversion of CO (numerical integration of Equation (4)) including influence of pore diffusion) for two different feed gases with 1.41 and 0.5 vol% CO and 55 vol% H2 in N2. For the given temperatures of below 200 °C, the conversion and reaction rates are almost unaffected by pore diffusion (see also Figure 7), and therefore not really reflected by the experimental data.

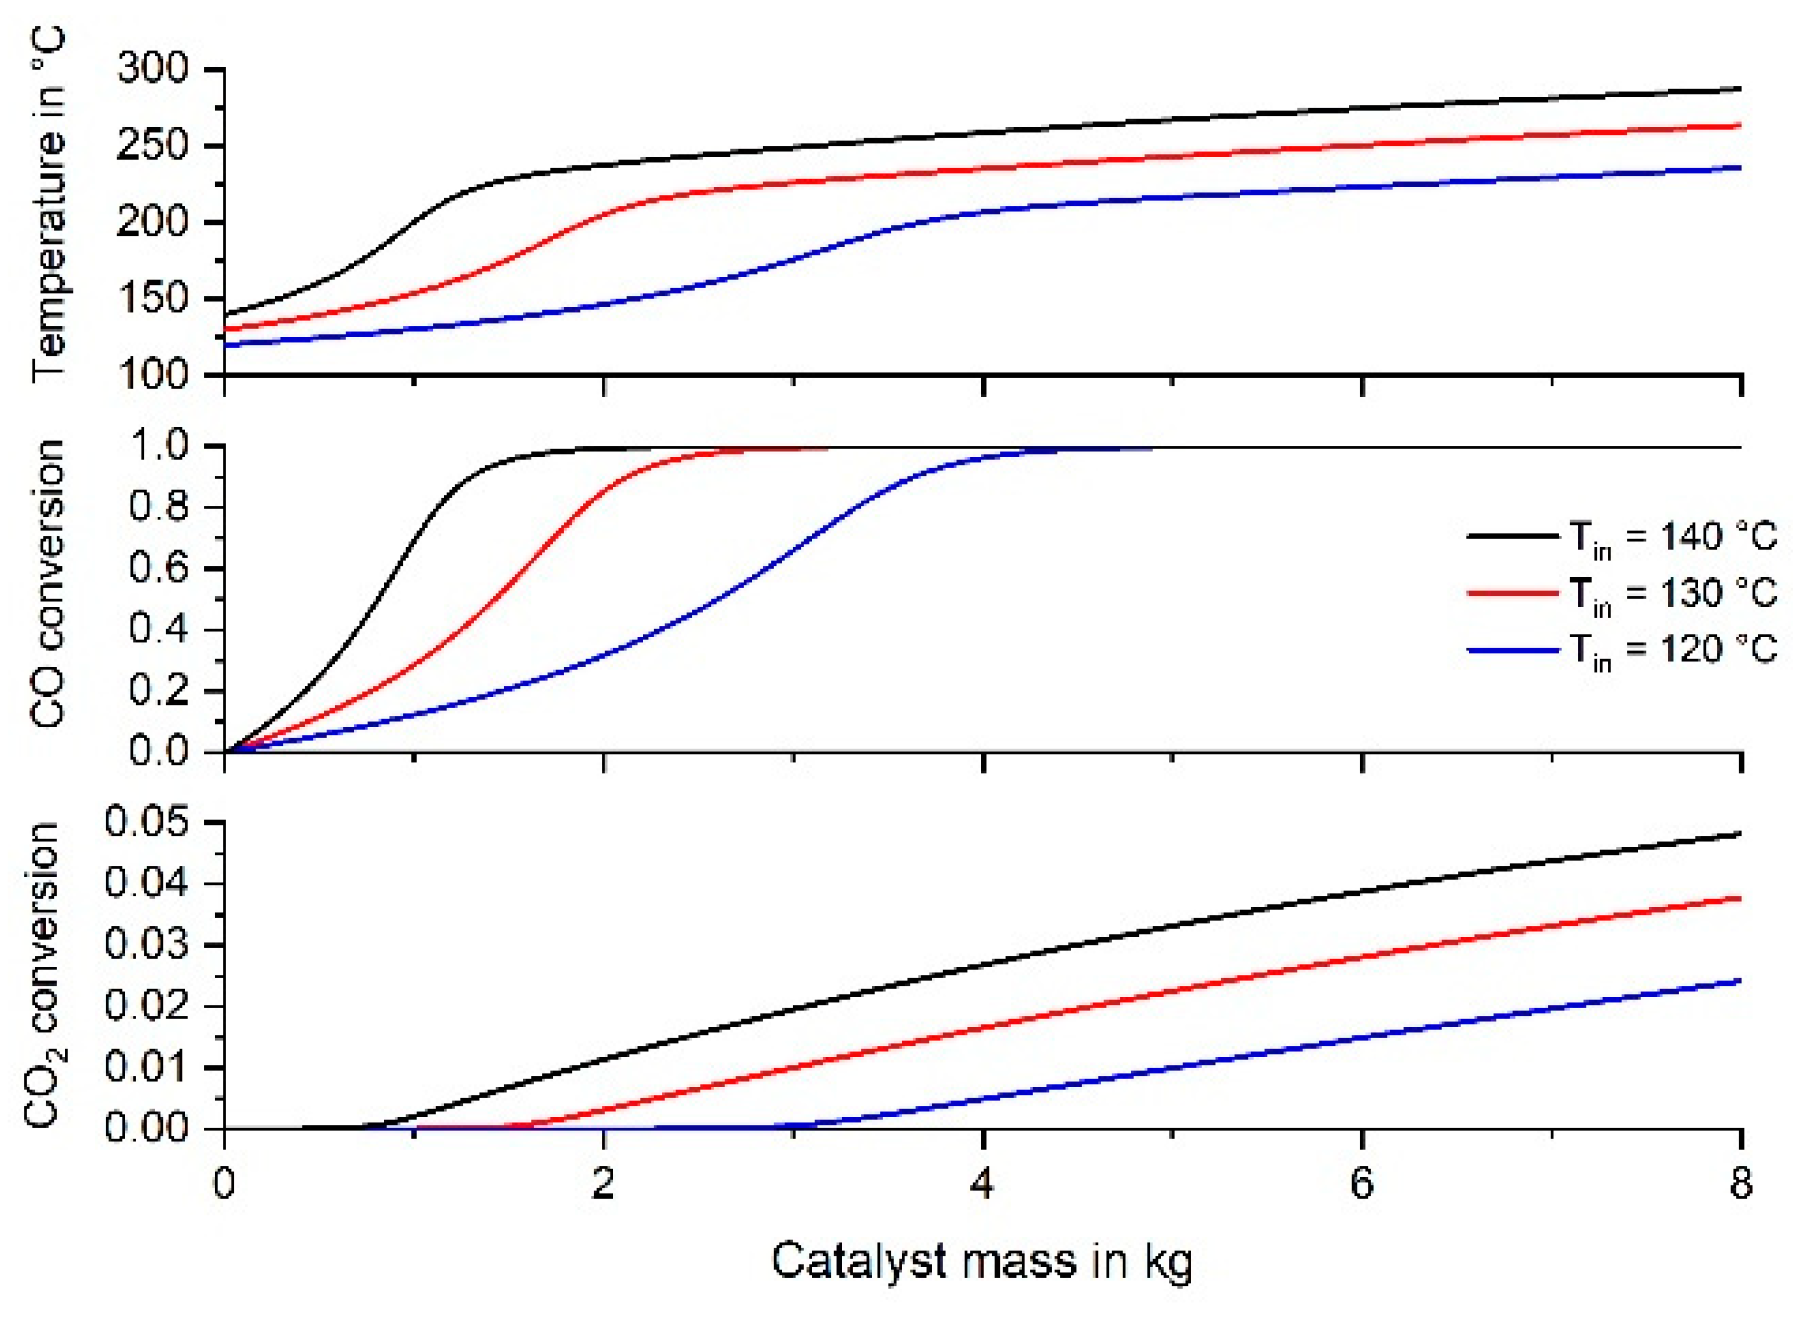
3.5. Simulation of CO Methanation in an Adiabatic Fixed Bed Reactor Suitable for a Household PEMFC

The kinetic equations for CO and CO2 methanation were now used to model the selective methanation of CO in a CO2/H2 rich gas stream also containing steam, where both methanation reactions take place simultaneously. The simulation was performed using Matlab and then compared with the respective experimental values.
The mass balance of a fixed bed reactor and steady state conditions is as follows:
u s   d C i d z = r i , eff   ρ b
us is the superficial gas velocity, and pb the bulk density (500 kg·m−3) of the catalyst (bed porosity is 49%). The effective rate ri,eff (= η ri) considers the influence of pore diffusion for CO methanation; for CO2 methanation, η is almost one even for temperatures up to 250 °C.
In Figure 9, the measured degrees of conversion of CO and CO2 in the isothermal lab-scale reactor are compared with the simulation for a gas containing CO, CO2, H2O, and H2, both with and without considering the influence of pore diffusion, which lead to similar results as the influence of pore diffusion is small. The agreement is quite well, and the simultaneous methanation of CO and CO2 are satisfactory described by the kinetic equations.
In case of a household application, the exothermic methanation could be conducted in a simple adiabatic fixed bed reactor without the need of a cooling system. For the simulation of the reactor, not only the mass balance, but also the temperature change in axial direction has to be considered by a respective heat balance (i = CO, CO2; n = all components of the gas):
d T d z = r i , eff ( Δ R H i ) ρ b c n c p , n   u s
The dimensioning of fuel-cell appliances is usually orientated to the average load demand of a household. In Germany, a four-person household consumes, on average, 5000 kWh electrical energy per year [34]. This is equivalent to 0.6 kW average power. Unfortunately, the load profiles of demand and production of electricity by the fuel-cell system are different. So, in times when the fuel-cell does not cover the demand, the additional need is covered by the power grid. If the fuel-cell produces more electricity than needed, the excess power is fed into the grid. The same happens with the heat demand. In times where heat production of the fuel-cell is not sufficient a peak boiler will ensure the domestic comfort.
The Viessmann company (Germany) sales fuel cell appliances for one- or two-family households for production of electrical power and heat. For example, the model “Vitovalor PT2” has a fuel cell with an electric power of 0.75 kWel and a heat power of 1.1 kWth [35]. The corresponding H2 flow rate for a typical overall efficiency of 80% can then be estimated based on the lower heating value of H2 (10.78 MJ·m−3). The resulting flow rate is 772 L H2 h−1, which corresponds to a total flow rate of 971 l h−1 for a reformate consisting of 0.5% CO, 10% CO2, 10% H2O, and 79.5% H2. In Figure 10 and Table 4, the results of the simulations are given for different gas inlet temperatures. The RWGS reaction, which may play a role at temperatures above 240 °C, was not taken into consideration.
Considering the target value of 10 ppm CO (XCO = 99.8%) in the product gas of the methanation reactor for an inlet temperature of 120 °C, 5.1 kg catalyst are needed, 1.05% CO2 are simultaneously converted and the gas outlet temperature is 217 °C.
Taking into consideration that the target value of 100 ppm CO in the product gas of the methanation reactor has to be achieved, this corresponds to 98% CO conversion and 1.85% H2 conversion. The further rise in temperature and H2 consumption is caused by the unwanted CO2 methanation. The excess of H2 conversion is here characterized by the factor EH2 = XH2/0.0185, which is the ratio of the actual H2 conversion to the minimum conversion of 1.85%, if only CO methanation takes place and the residual CO content of 100 ppm needed for PtRu-anodes is just reached. Table 4 indicates that an inlet temperature of 130 °C is an appropriate value to avoid very high outlet temperatures (>240 °C). In this case, 2.6 kg of catalyst (52 g Ru) would be needed. The outlet temperature is then 221 °C, which is a reasonable value to limit the RWGS and CO2 methanation. EH2 would then be 1.2, i.e., 20% more hydrogen (H2 conversion of 2.22% compared to 1.85%) is consumed compared to the ideal case without CO2 conversion instead of here 0.7%. In order to be on the safe side, a certain surplus of the reactor size is advisable. Therefore, Table 4 also shows the reactor parameters, if the reactor length and mass of catalyst would be by a factor 1.5 or 2 larger compared to 100 ppm residual CO content. For a factor of 1.5 (mcat = 3.9 kg) and Tin = 130 °C, the resulting values are XCO = 99.95% (residual CO content of 3 ppm), XCO2 = 1.6%, and EH2 = 1.45. The feed gas of the fuel cell would then consist of 77.2% H2, 9.8% CO2, 10.8% H2O, and 2.1% CH4. The reactor size is then 7.8 L, e.g., a cylinder with a length of 44 cm and diameter of 15 cm. An option is also an increase of the Ru content (here 2 wt-%), which would decrease the size and mass of the reactor further.

4. Conclusions

The activity and selectivity of a 2 wt% Ru supported on γ-Al2O3 egg-shell catalyst for CO methanation in CO2/H2 rich gases was investigated. A kinetic model based on a Langmuir-Hinshelwood approach for both reactions was determined. The agreement with measurements in a fixed bed reactor is very satisfactory. CO2 methanation is slow compared to CO methanation, at least at temperatures below 200 °C. CO2 is directly converted to methane; the indirect route via RWGS and CO methanation could be excluded by respective measurements and kinetic considerations. Pore diffusion may affect the CO conversion at high temperatures (>200 °C). The kinetic equations were applied to model an adiabatic fixed bed methanation reactor suitable for a fuel cell for household appliances. The catalyst mass needed to reach a residual CO content of 100 ppm for feed gas with 0.5% CO, 10% CO2, 10% H2O, and 79.5% H2 is about 3 kg, which seems to a reasonable value. The H2 consumption is 20% higher compared to the ideal case without any conversion of CO2.

Author Contributions

C.K. conceived the present idea and methodology and was involved in planning providing critical feedback. P.G. planned and carried out the experiments, the simulation and the validation of the experimental data and data curation. A.J. was the project administrator, supervised the project and was in charge of the overall direction, planning and data curation. C.K. acquired the project funding and P.G. the publication funding. A.J. and P.G. wrote, reviewed and edited the manuscript.

Funding

This work was funded by the Bavarian State Ministry of Education, Science and the Arts within the framework of the TechnologieAllianzOberfranken (TAO). This publication was funded by the German Research Foundation (DFG) and the University of Bayreuth in the funding programme Open Access Publishing.

Acknowledgments

The authors gratefully acknowledge the support of TechnolgieAllianzOberfranken and Center for Energy and Technology and thank the German Research Foundation (DFG) and the University of Bayreuth in the funding programme Open Access Publishing for funding this publication.

Conflicts of Interest

The authors declare no conflict of interest.

References

  1. Eckle, S. Investigations of the Kinetics and Mechanism of the Selective Methanation of CO in CO2 and H2-Rich Reformates over Ru Supported Catalysts. Ph.D. Thesis, Verlag nicht Ermittelbar, Berlin, Germany, 2012. [Google Scholar]
  2. Djinović, P.; Galletti, C.; Specchia, S.; Specchia, V. Ru-based catalysts for CO selective methanation reaction in H2-rich gases. Catal. Today 2011, 164, 282–287. [Google Scholar] [CrossRef]
  3. Oh, S.H.; Sinkevitch, R.M. Carbon Monoxide Removal from Hydrogen-Rich Fuel Cell Feedstreams by Selective Catalytic Oxidation. J. Catal. 1993, 142, 254–262. [Google Scholar] [CrossRef]
  4. Peters, R.; Meißner, J. Gasaufbereitung für Brennstoffzellen. Chemie Ingenieur Technik 2004, 76, 1555–1558. [Google Scholar] [CrossRef]
  5. Hoogers, G. Fuel Cell Technology Handbook; CRC Press: Boca Raton, FL, USA, 2003. [Google Scholar]
  6. Laguna, O.H.; Hernández, W.Y.; Arzamendi, G.; Gandía, L.M.; Centeno, M.A.; Odriozola, J.A. Gold supported on CuOx/CeO2 catalyst for the purification of hydrogen by the CO preferential oxidation reaction (PROX). Fuel 2014, 118, 176–185. [Google Scholar] [CrossRef]
  7. Mariño, F.; Baronetti, G.; Laborde, M.; Bion, N.; Le Valant, A.; Epron, F.; Duprez, D. Optimized CuO–CeO2 catalysts for COPROX reaction. Int. J. Hydrog. Energy 2008, 33, 1345–1353. [Google Scholar] [CrossRef]
  8. Reiche, A.; Haufe, S. Brennstoffzellen: Entwicklungsstand und Anwendungen. Chemie in Unserer Zeit 2004, 38, 400–411. [Google Scholar] [CrossRef]
  9. Galletti, C.; Specchia, S.; Saracco, G.; Specchia, V. CO-selective methanation over Ru–γAl2O3 catalysts in H2-rich gas for PEM FC applications. Chem. Eng. Sci. 2010, 65, 590–596. [Google Scholar] [CrossRef]
  10. Galletti, C.; Specchia, S.; Saracco, G.; Specchia, V. CO Methanation as Alternative Refinement Process for CO Abatement in H2-Rich Gas for PEM Applications. Int. J. Chem. React. Eng. 2007, 5. [Google Scholar] [CrossRef]
  11. Abdel-Mageed, A.M.; Widmann, D.; Olesen, S.E.; Chorkendorff, I.; Biskupek, J.; Behm, R.J. Selective CO Methanation on Ru/TiO2 Catalysts: Role and Influence of Metal–Support Interactions. ACS Catal. 2015, 5, 6753–6763. [Google Scholar] [CrossRef]
  12. Dagle, R.A.; Wang, Y.; Xia, G.-G.; Strohm, J.J.; Holladay, J.; Palo, D.R. Selective CO methanation catalysts for fuel processing applications. Appl. Catal. A Gener. 2007, 326, 213–218. [Google Scholar] [CrossRef]
  13. Urasaki, K.; Endo, K.-I.; Takahiro, T.; Kikuchi, R.; Kojima, T.; Satokawa, S. Effect of Support Materials on the Selective Methanation of CO over Ru Catalysts. Top. Catal. 2010, 53, 707–711. [Google Scholar] [CrossRef]
  14. Panagiotopoulou, P.; Kondarides, D.I.; Verykios, X.E. Selective methanation of CO over supported noble metal catalysts: Effects of the nature of the metallic phase on catalytic performance. Appl. Catal. A Gener. 2008, 344, 45–54. [Google Scholar] [CrossRef]
  15. Panagiotopoulou, P.; Kondarides, D.I.; Verykios, X.E. Selective methanation of CO over supported Ru catalysts. Appl. Catal. B Environ. 2009, 88, 470–478. [Google Scholar] [CrossRef]
  16. Panagiotopoulou, P.; Kondarides, D.I.; Verykios, X.E. Mechanistic Study of the Selective Methanation of CO over Ru/TiO2 Catalyst: Identification of Active Surface Species and Reaction Pathways. J. Phys. Chem. C 2011, 115, 1220–1230. [Google Scholar] [CrossRef]
  17. Muñoz-Murillo, A.; Martínez, T.L.M.; Domínguez, M.I.; Odriozola, J.A.; Centeno, M.A. Selective CO methanation with structured RuO2/Al2O3 catalysts. Appl. Catal. B Environ. 2018, 236, 420–427. [Google Scholar] [CrossRef]
  18. Kowalczyk, Z.; Stołecki, K.; Raróg-Pilecka, W.; Miśkiewicz, E.; Wilczkowska, E.; Karpiński, Z. Supported ruthenium catalysts for selective methanation of carbon oxides at very low COx/H2 ratios. Appl. Catal. A Gener. 2008, 342, 35–39. [Google Scholar] [CrossRef]
  19. Garbis, P. Selective CO Methanation for PEMFC Applications. PhD Thesis, University of Bayreuth, Bayreuth, Germany, 2019. [Google Scholar]
  20. Kahlich, M.J.; Gasteiger, H.A.; Behm, R.J. Kinetics of the Selective Low-Temperature Oxidation of CO in H2-Rich Gas over Au/α-Fe2O3. J. Catal. 1999, 182, 430–440. [Google Scholar] [CrossRef]
  21. Goerke, O.; Pfeifer, P.; Schubert, K. Water gas shift reaction and selective oxidation of CO in microreactors. Appl. Catal. A Gener. 2004, 263, 11–18. [Google Scholar] [CrossRef]
  22. Echigo, M. A study of CO removal on an activated Ru catalyst for polymer electrolyte fuel cell applications. Appl. Catal. A Gener. 2003, 251, 157–166. [Google Scholar] [CrossRef]
  23. Choudhury, M.B.I.; Ahmed, S.; Shalabi, M.A.; Inui, T. Preferential methanation of CO in a syngas involving CO2 at lower temperature range. Appl. Catal. A 2006, 314, 47–53. [Google Scholar] [CrossRef]
  24. Ekerdt, J. Synthesis of hydrocarbons from CO and H2 over silica-supported Ru: Reaction rate measurements and infrared spectra of adsorbed species. J. Catal. 1979, 58, 170–187. [Google Scholar] [CrossRef]
  25. Underwood, R. The CO/H2 reaction over nickel-alumina studied by the transient method. J. Catal. 1984, 86, 245–253. [Google Scholar] [CrossRef]
  26. Prairie, M. A fourier transform infrared spectroscopic study of CO2 methanation on supported ruthenium. J. Catal. 1991, 129, 130–144. [Google Scholar] [CrossRef]
  27. Marwood, M.; van Vyve, F.; Doepper, R.; Renken, A. Periodic operation applied to the kinetic study of CO2 methanation. Catal. Today 1994, 20, 437–448. [Google Scholar] [CrossRef]
  28. Marwood, M.; Doepper, R.; Renken, A. In-situ surface and gas phase analysis for kinetic studies under transient conditions The catalytic hydrogenation of CO2. Appl. Catal. A Gener. 1997, 151, 223–246. [Google Scholar] [CrossRef]
  29. Falbo, L.; Martinelli, M.; Visconti, C.G.; Lietti, L.; Bassano, C.; Deiana, P. Kinetics of CO2 methanation on a Ru-based catalyst at process conditions relevant for Power-to-Gas applications. Appl. Catal. B Environ. 2018, 225, 354–363. [Google Scholar] [CrossRef]
  30. Kwak, J.H.; Kovarik, L.; Szanyi, J. CO2 Reduction on Supported Ru/Al2O3 Catalysts: Cluster Size Dependence of Product Selectivity. ACS Catal. 2013, 3, 2449–2455. [Google Scholar] [CrossRef]
  31. Mendes, D.; Mendes, A.; Madeira, L.M.; Iulianelli, A.; Sousa, J.M.; Basile, A. The water-gas shift reaction: From conventional catalytic systems to Pd-based membrane reactors—A review. Asia-Pac. J. Chem. Eng. 2010, 5, 111–137. [Google Scholar] [CrossRef]
  32. Levenspiel, O. The Chemical Reactor Omnibook; OSU Book Stores: Corvallis, OR, USA, 2002. [Google Scholar]
  33. Levenspiel, O. Chemical Reaction Engineering, 3rd ed.; Wiley: Hoboken, NJ, USA, 1999. [Google Scholar]
  34. Badenhop, T. Fuel Cells in the Energy Supply of Households. In Hydrogen and Fuel Cell; Töpler, J., Lehmann, J., Eds.; Springer Berlin Heidelberg: Berlin/Heidelberg, Germany, 2016; pp. 127–144. [Google Scholar]
  35. Viessmann. Brennstoffzellen-Heizgerät VITOVALOR PT2. Available online: https://www.viessmann.de/content/dam/vi-brands/DE/Produkte/Kraft-Waerme-Kopplung/Brennstoffzelle/Vitovalor-PT2/kpr-w-Vitovalor_PT2.pdf/_jcr_content/renditions/original.media_file.download_attachment.file/kpr-w-Vitovalor_PT2.pdf (accessed on 17 December 2018).
Figure 1. Reaction rate of CO conversion at different CO concentrations (but constant H2 concentration) for different temperatures (marks) compared to the curve fitting according to the Langmuir–Hinshelwood rate expression (solid lines) (0.12–1.4 vol% CO, 55 % H2, rest N2, mcat = 2 g, 162–182 °C, 1 bar).
Energies 12 00469 g001
Figure 2. Influence of CO2 addition on the CO conversion and comparison of experimental data and kinetic model, Equations (4) and (6). The CO2 conversion is also indicated for experiments with CO2 addition (1.13 vol% CO, 10% H2O, 55% H2, 0–18% CO2, rest N2, mcat = 2 g, p = 1 bar, τ(190 °C) = 260 kg s·m−3). The equation describing the CO2 methanation, which was used here to calculate the CO2 conversion is introduced in Section 3.2.
Energies 12 00469 g002
Figure 3. Rate of reaction of CO2 with H2 (to CH4) at different initial CO2 concentration at different temperatures (marks) compared to calculations based on Equation (6) (solid lines) (55 vol% H2, rest N2, mcat = 2 g, p = 1 bar).
Energies 12 00469 g003
Figure 4. (a) Calculated initial CO and CO2 reaction rates (Equations (4) and (6)) and (b) ratios for different CO concentrations (20% CO2, 55% H2 in N2, mcat = 2 g, τ (190 °C) = 413 kg·s·m−3, τ (230 °C) = 380 kg·s·m−3, 1 bar).
Energies 12 00469 g004
Figure 5. Calculated and measured CO concentration during CO2 methanation (feed gas: 6 vol% CO2, 55% H2, rest N2, mcat = 2 g). (a) reaction temperature variation for VSTP = 22 l h−1; (b) residence time variation at 223 °C or 234 °C. Calculation based on (wrong) assumption that CO2 is only converted to CO via reverse water gas shift (RWGS) and then subsequently to methane (indirect mechanism). The large deviation of the calculated CO content from the measurement strongly indicates that CO2 is directly converted to methane.
Energies 12 00469 g005
Figure 6. Influence of CO concentration on the effectiveness factor with regard to pore diffusion of CO methanation for a “full” and the egg shell catalyst used in this work (200 °C, 55% H2, 1 bar).
Energies 12 00469 g006
Figure 7. Influence of temperature on the effectiveness factor with regard to pore diffusion of CO methanation for a “full” and the egg shell catalyst used in this work (0.5% CO, 55% H2, p = 1 bar).
Energies 12 00469 g007
Figure 8. Measured and modelled conversion of CO for a feed gas with 1.41 or 0.5 vol% CO, 55% H2, rest N2 (τ(190 °C) = 300 kg·s·m−3 for 1.41% CO and 227 kg·s·m−3 for 0.5% CO, p = 1 bar).
Energies 12 00469 g008
Figure 9. Measured and modeled CO and CO2 conversion of a feed gas with 1.13 vol% CO, 8% CO2, 10% H2O and 55% H2 in N2 ( τ (200 °C) = 230 kg·s·m−3, p = 1 bar).
Energies 12 00469 g009
Figure 10. Temperature and conversion profiles of an adiabatic fixed-bed reactor for inlet temperatures of 120 °C, 130 °C and 140 °C (971 l h−1 (STP), feed gas: 0.5% CO, 10% CO2, 10% H2O, 79.5% H2).
Energies 12 00469 g010
Table 1. Characteristic data of the Ru catalyst.
ParameterValue
Particle radius, rp1.25 mm
Shell thickness, dsh0.35 mm
Density of particle, ρp980 kg·m−3
Porosity of particle, εp0.49
Tortuosity, τp2
Average pore diameter, dpore9.3 nm
BET surface area215 m2·g−1
Ru particle size6 nm
Table 2. Parameters of the kinetics of CO methanation (see Equations (4) and (5)).
ParameterValue
EA,CO90 kJ·mol−1
k0,CO3.61 × 107 m6·s1·kg1·mol1
K123 m3·mol−1
K20.3 m3·mol−1
Table 3. Parameters of the kinetics of CO2 methanation (see Equations (6) and (7)).
ParameterValue
EA,CO281 kJ·mol−1
k0,CO22.8 ×104 m6·s1·kg1·mol1
K0,38.4 m3·mol−1
ΔH315 kJ·mol−1
K0,41.15 ×10−13 m3·mol−1
ΔH4−125 kJ·mol−1
K51.1 m3·mol−1
Table 4. Basic data of an adiabatic reactor for selective CO-methanation for three different initial temperatures.
Tin in °CTout in °Cmcat in kgXCO in %XCO2 in %XH2 in %EH2CO Content at Reactor Outlet
1202104.2598.000.612.161.17Limit value of 100 ppm just reached
2256.4099.991.682.731.48<1 ppm
2388.5099.992.603.191.73<1 ppm
1302212.6098.000.742.221.20Limit value of 100 ppm just reached
2343.9099.951.592.691.453 ppm
2455.2099.992.373.081.67<1 ppm
1402331.7098.000.902.301.24Limit value of 100 ppm just reached
2442.5599.861.602.691.457 ppm
2533.4099.992.253.021.63<1 ppm

