Characteristics and Control of Mining Induced Fractures above Longwall Mines Using Backfilling


Abstract
:
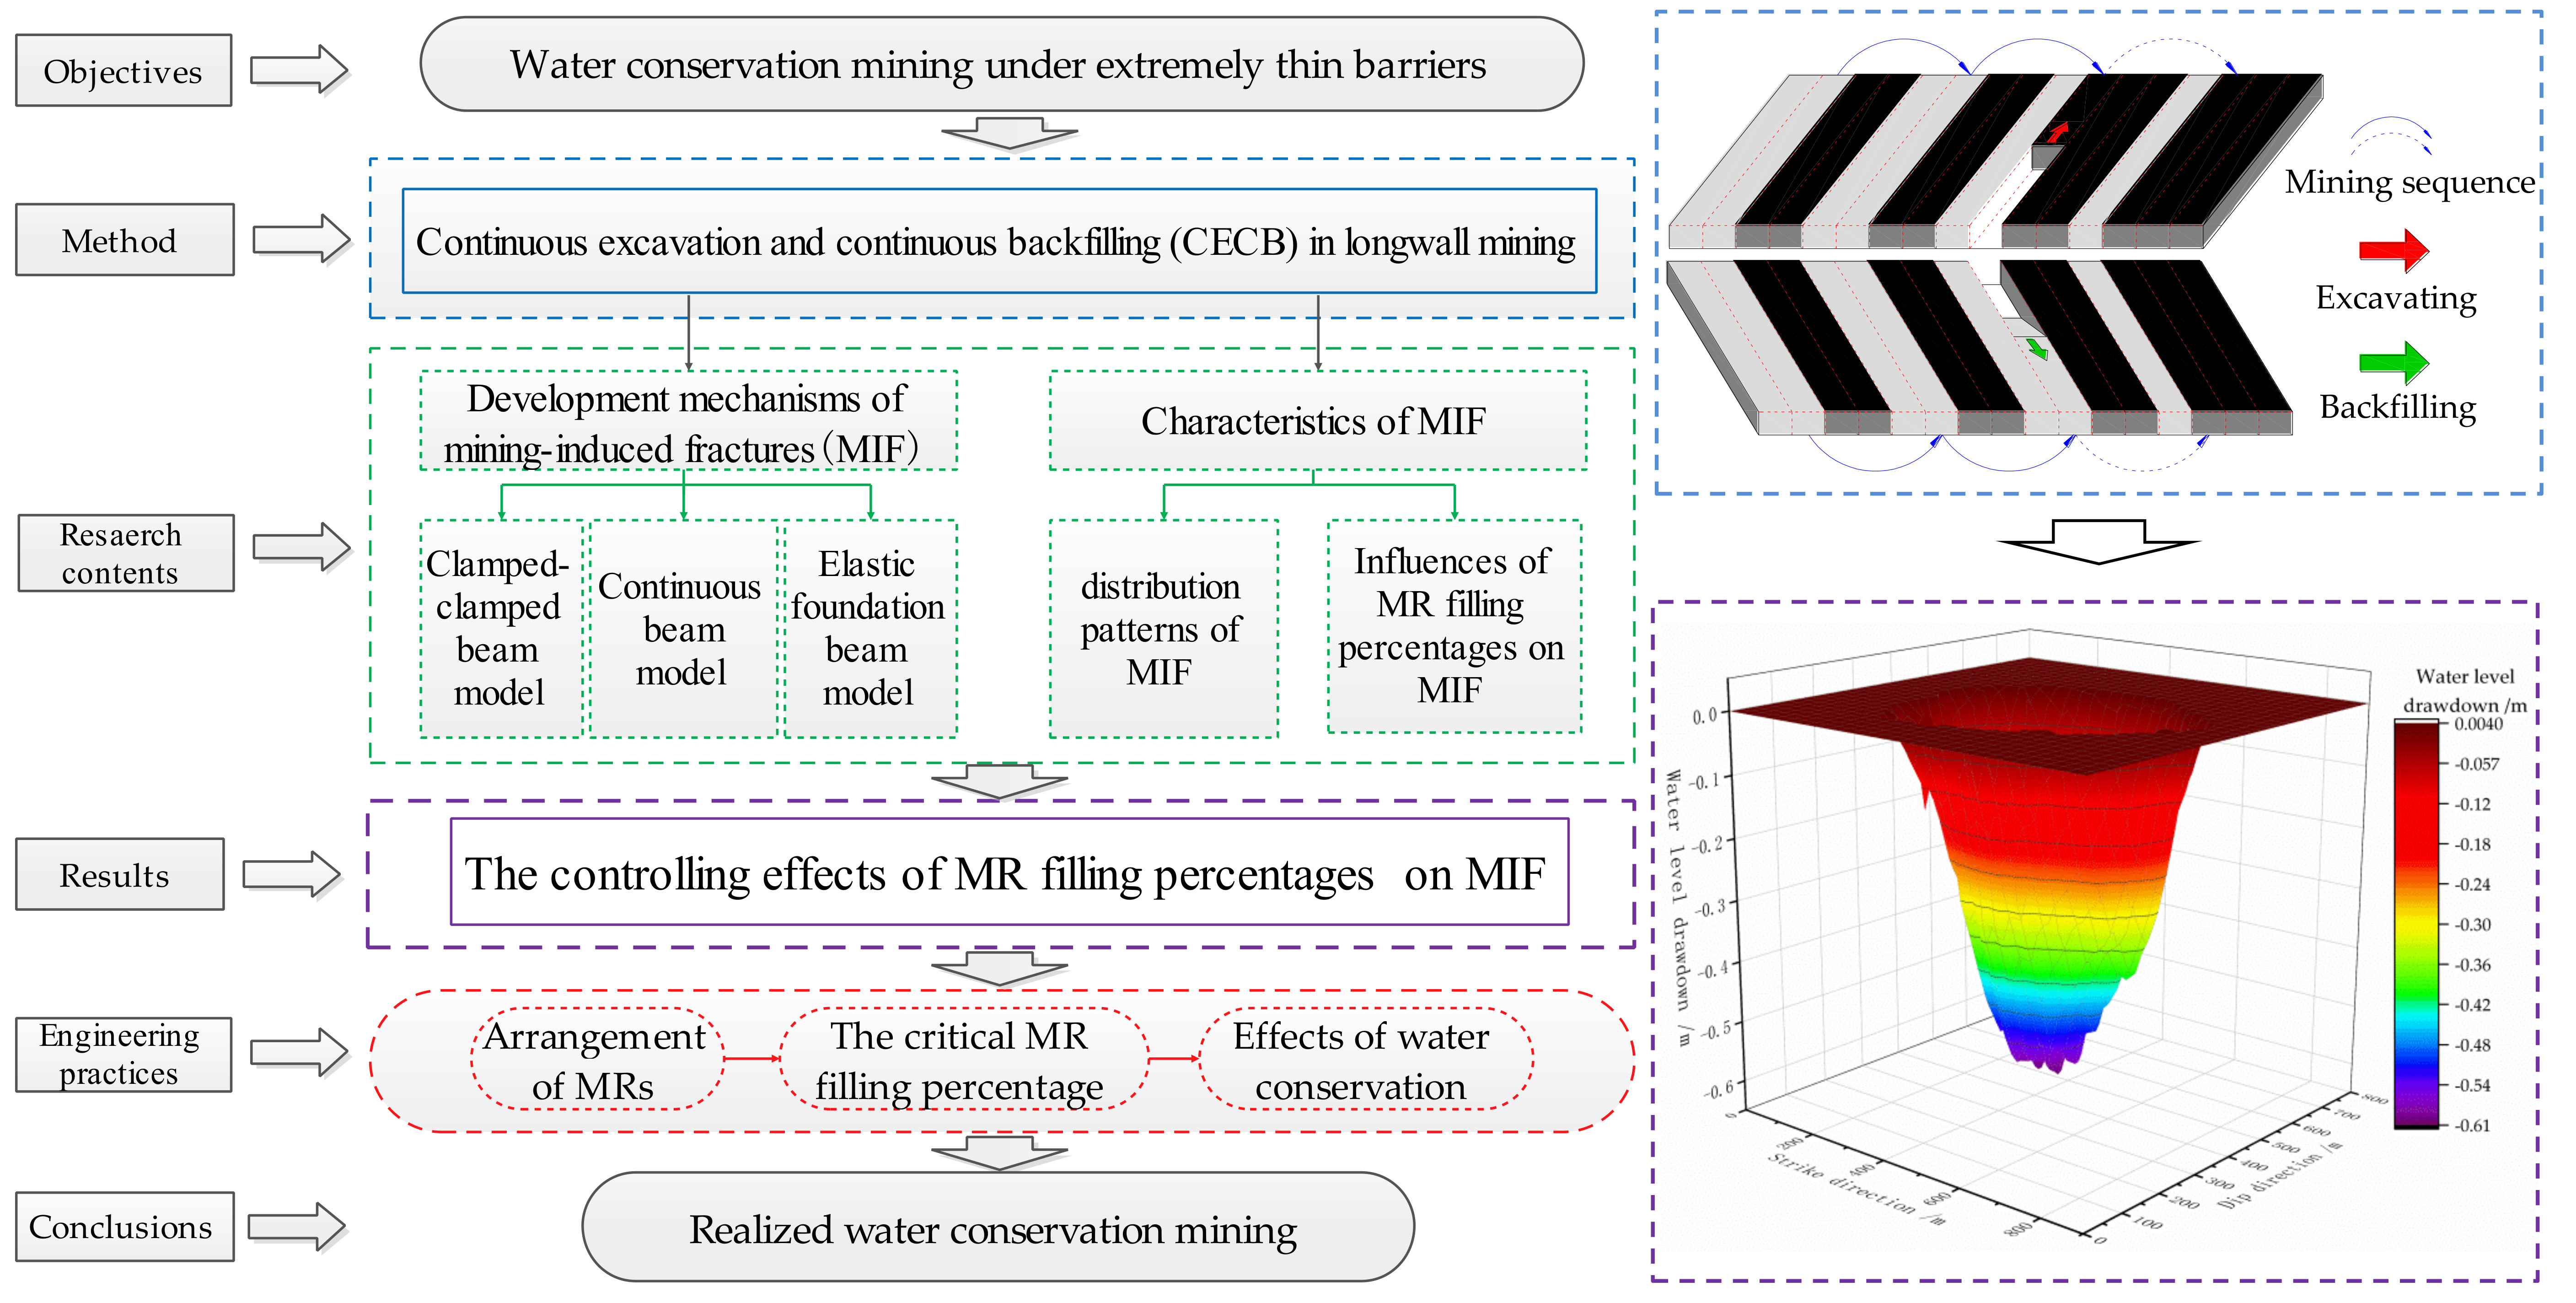
1. Introduction
2. Research Background
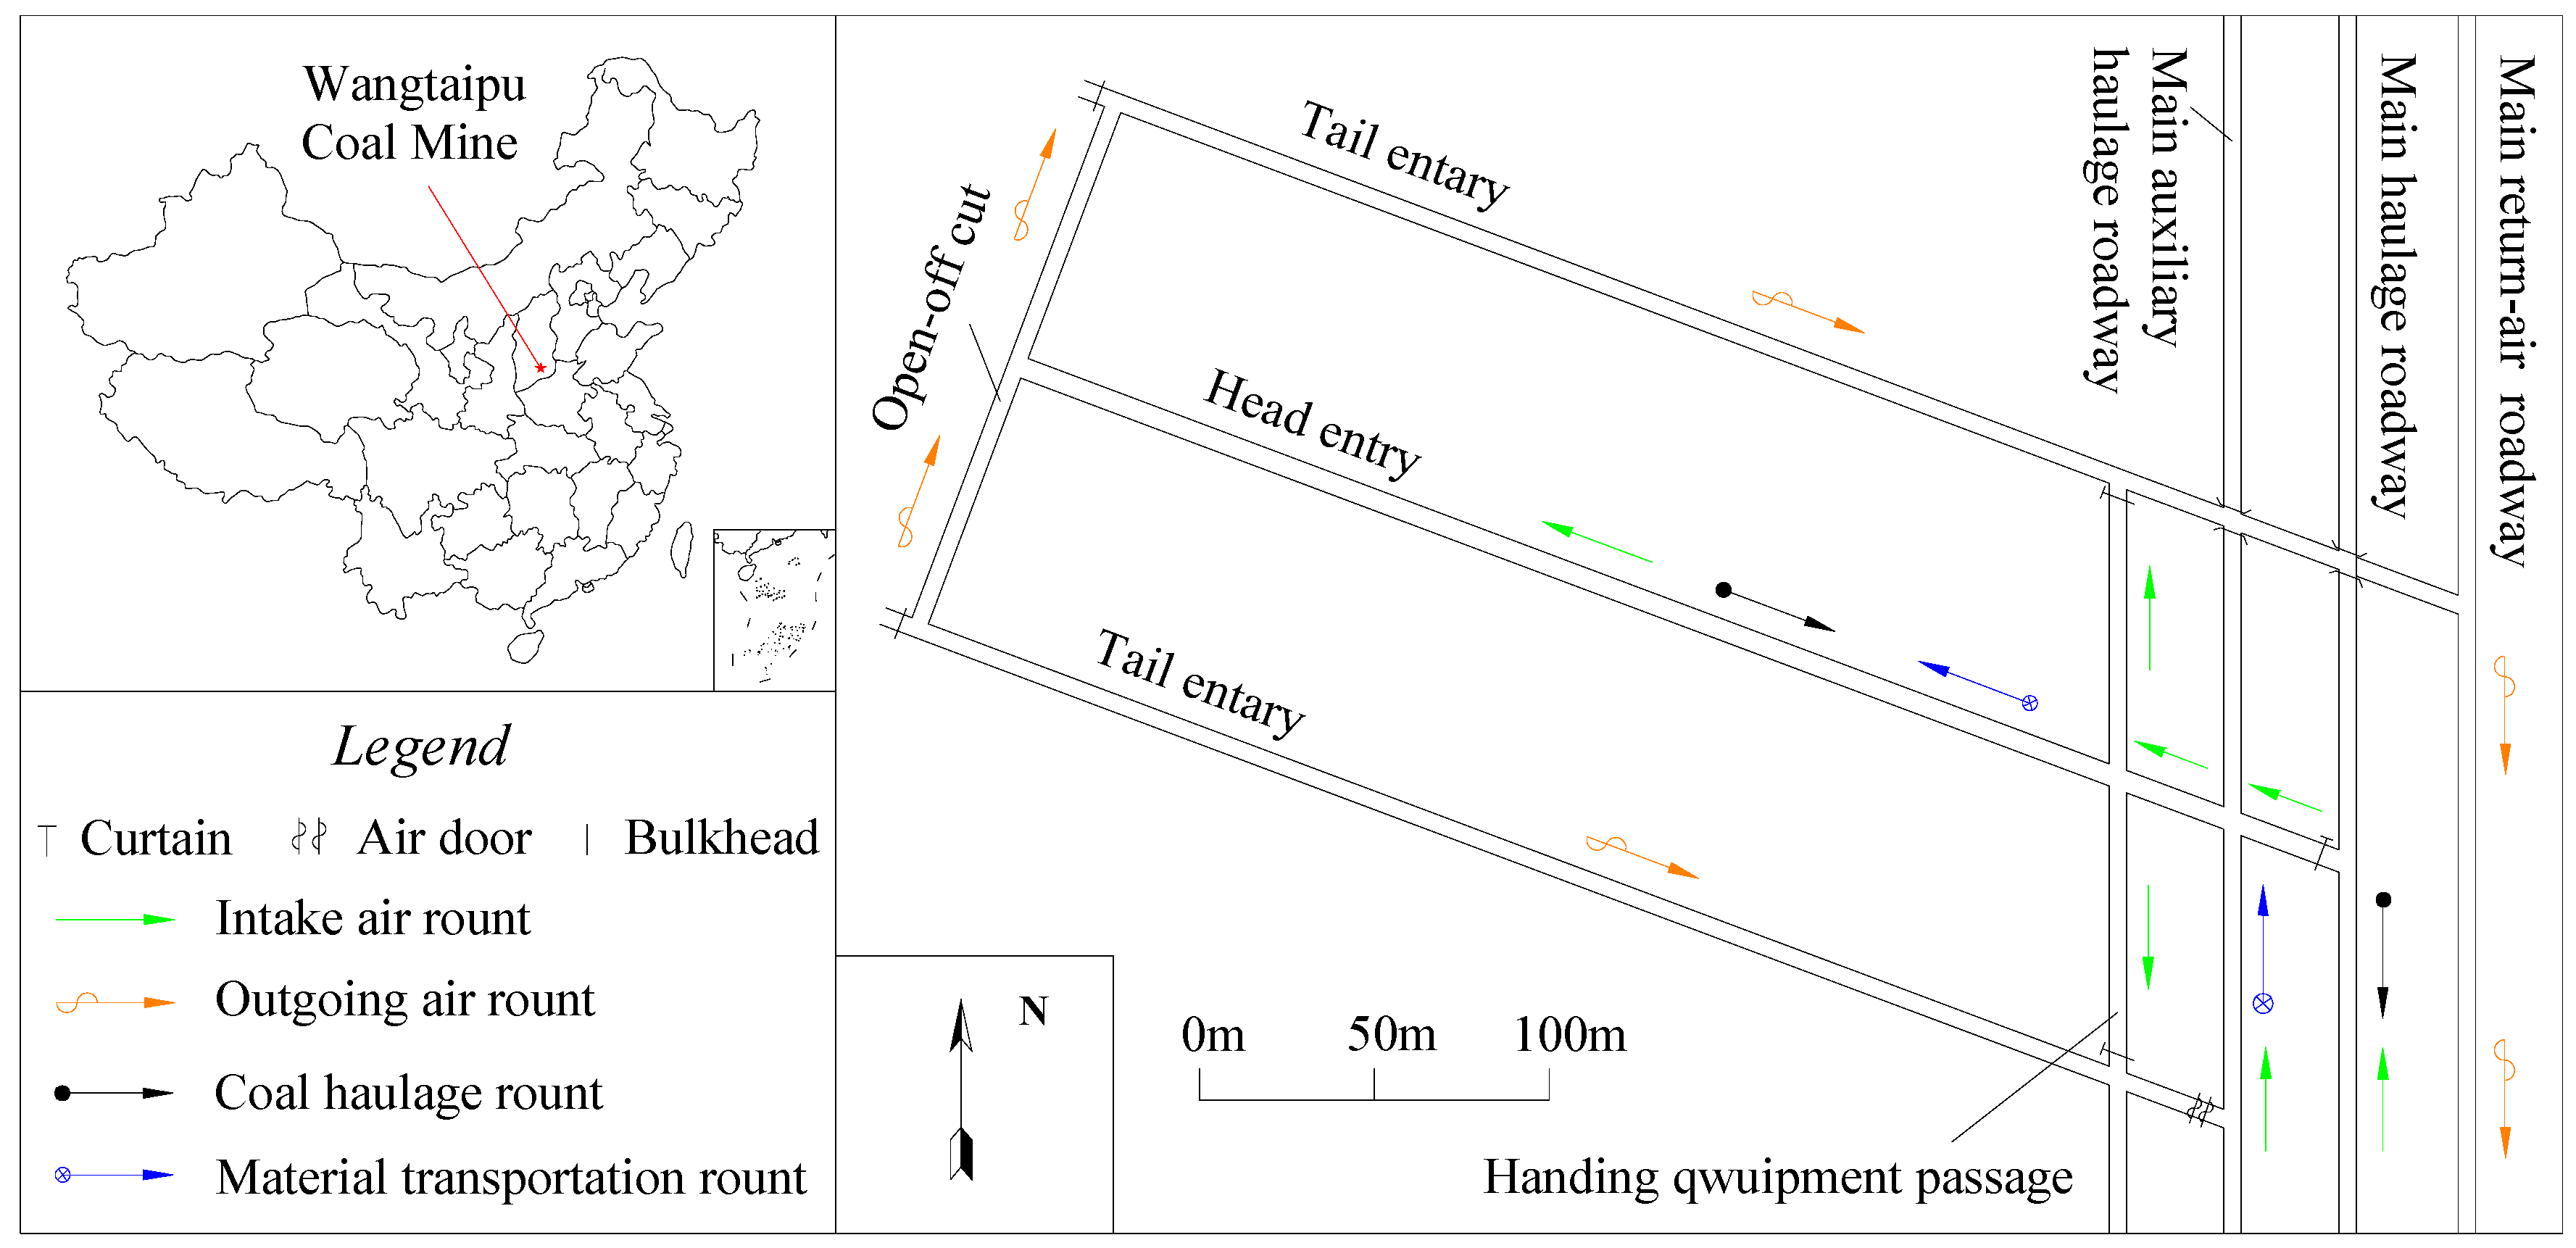
2.1. Profile of the Study Area
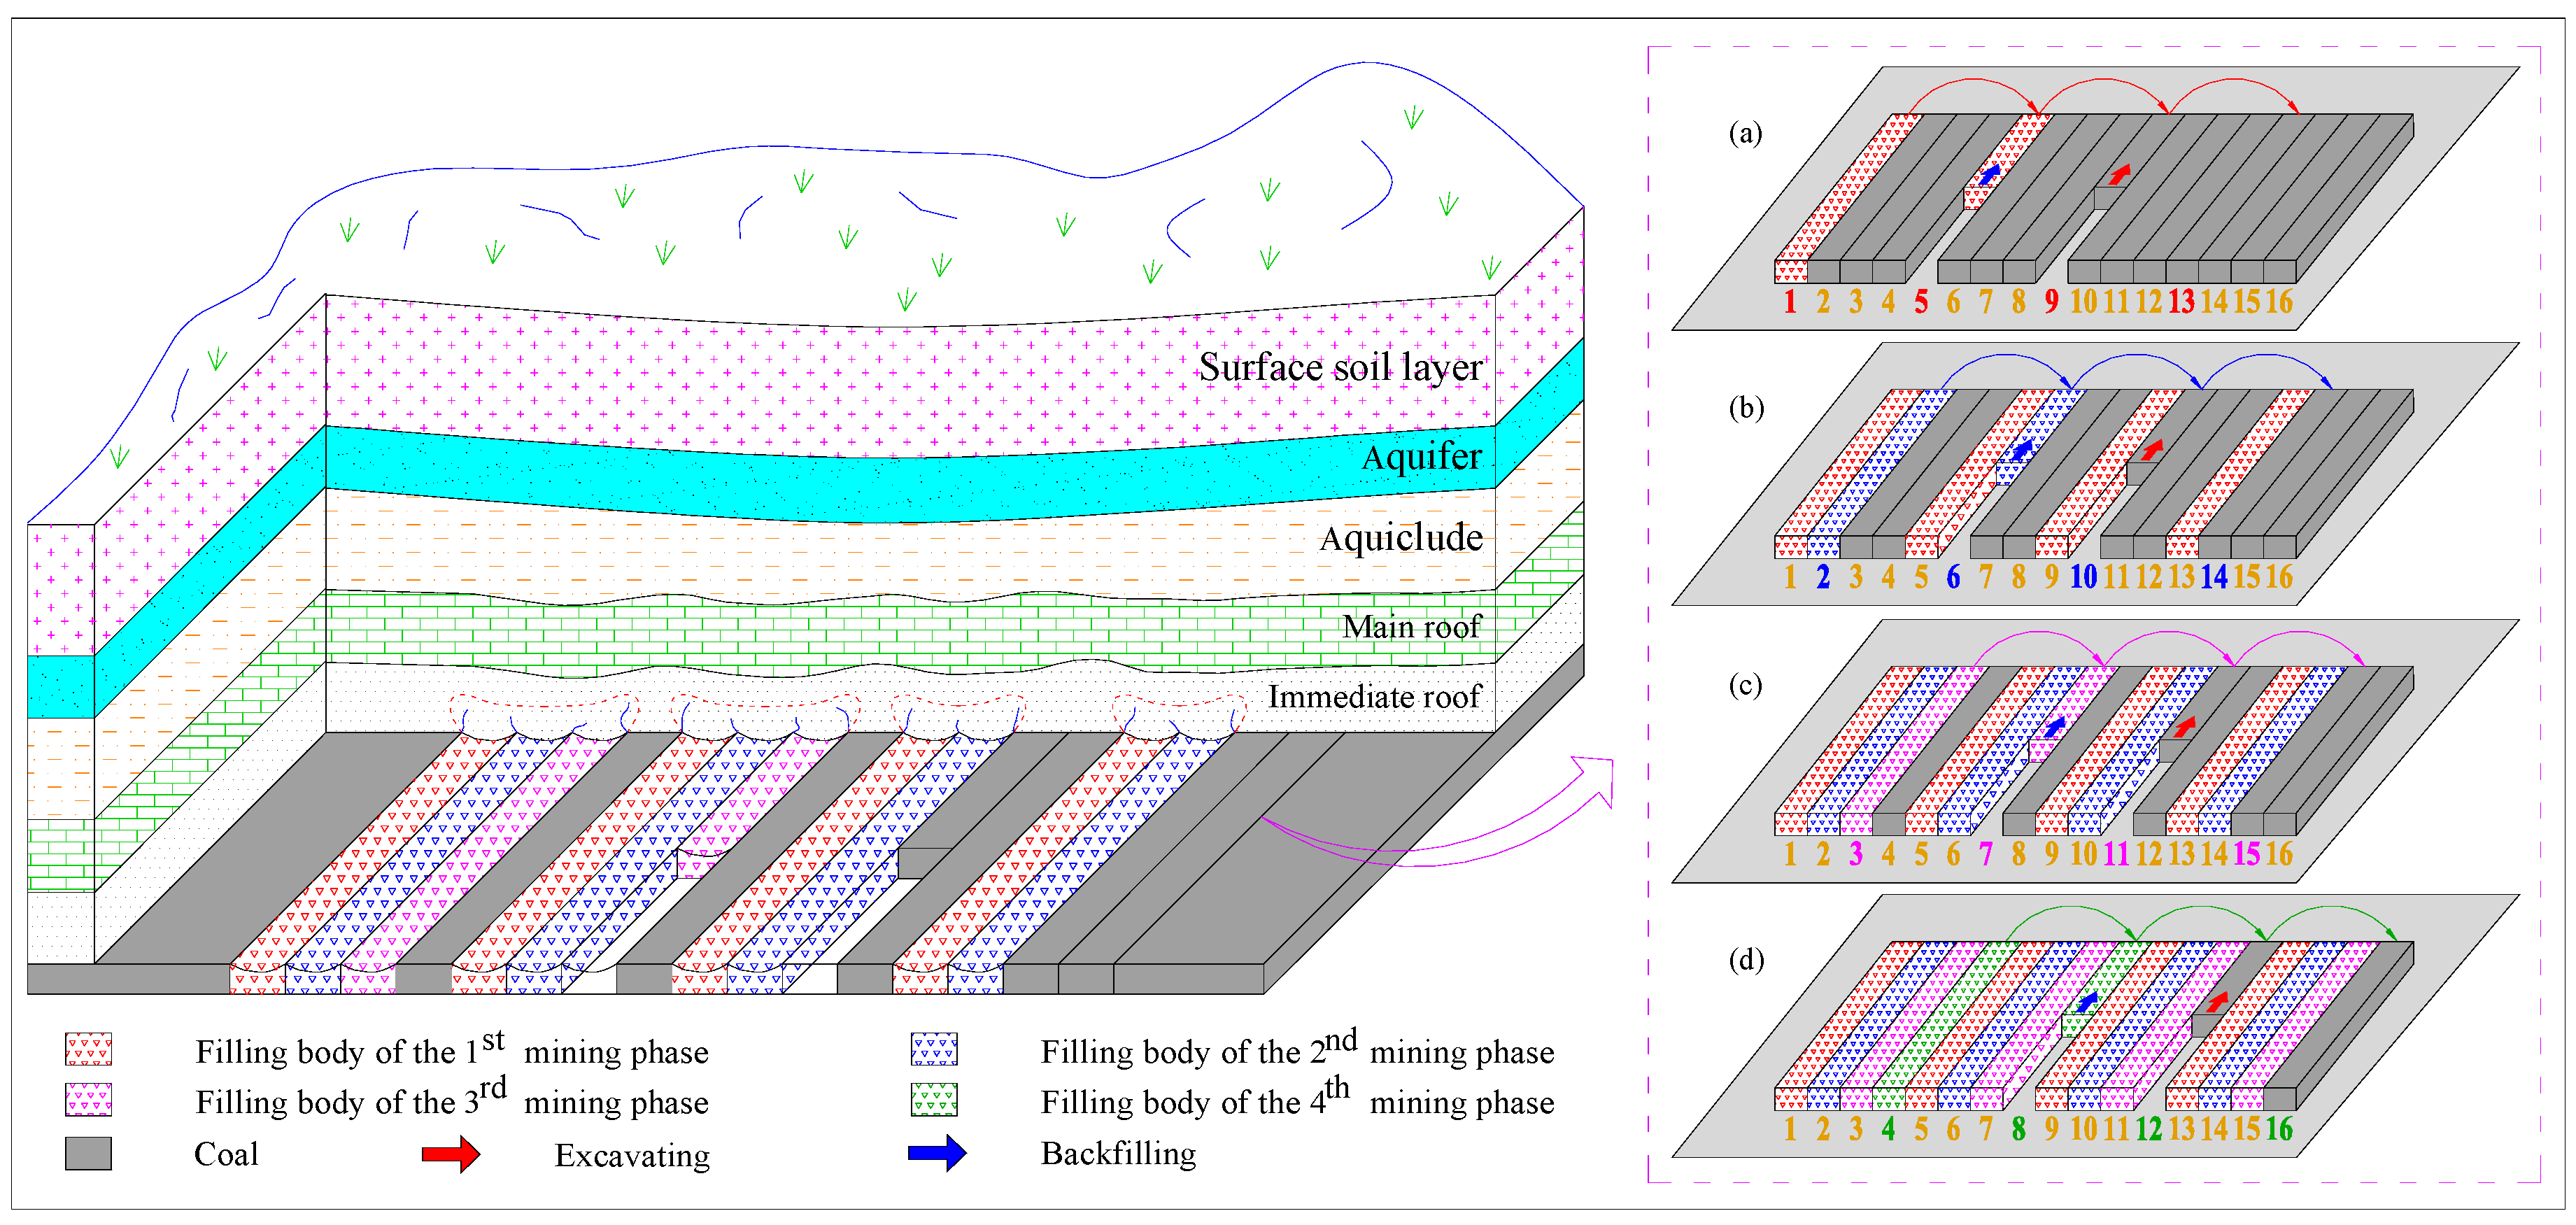
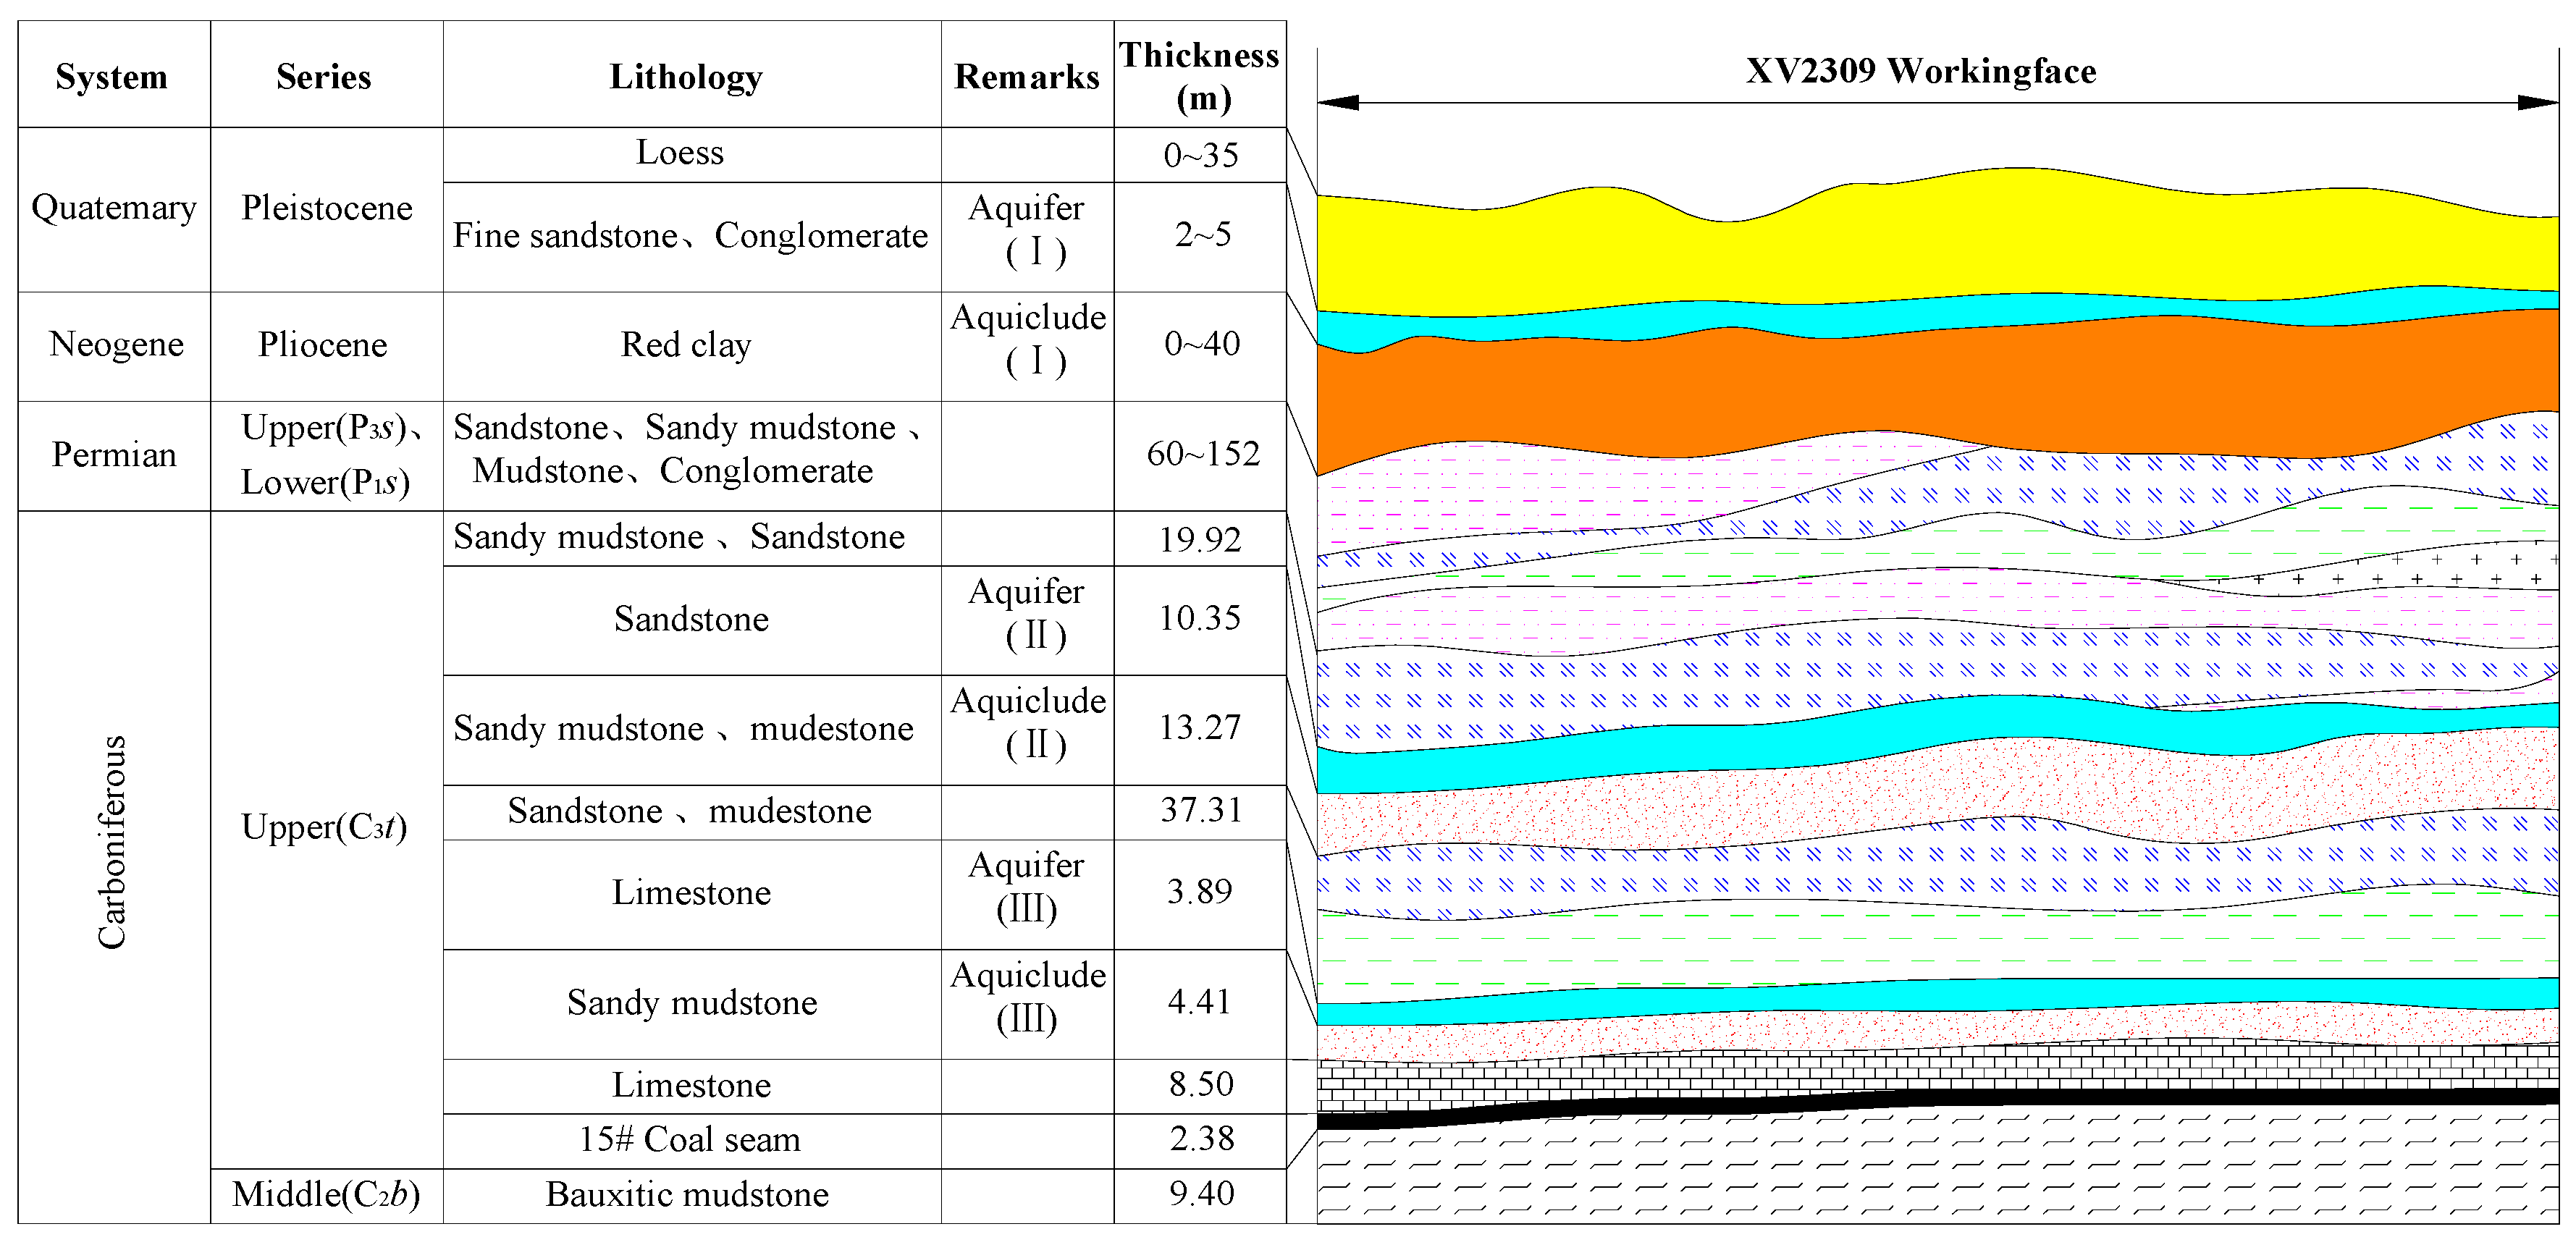
2.2. Stratigraphic Structure
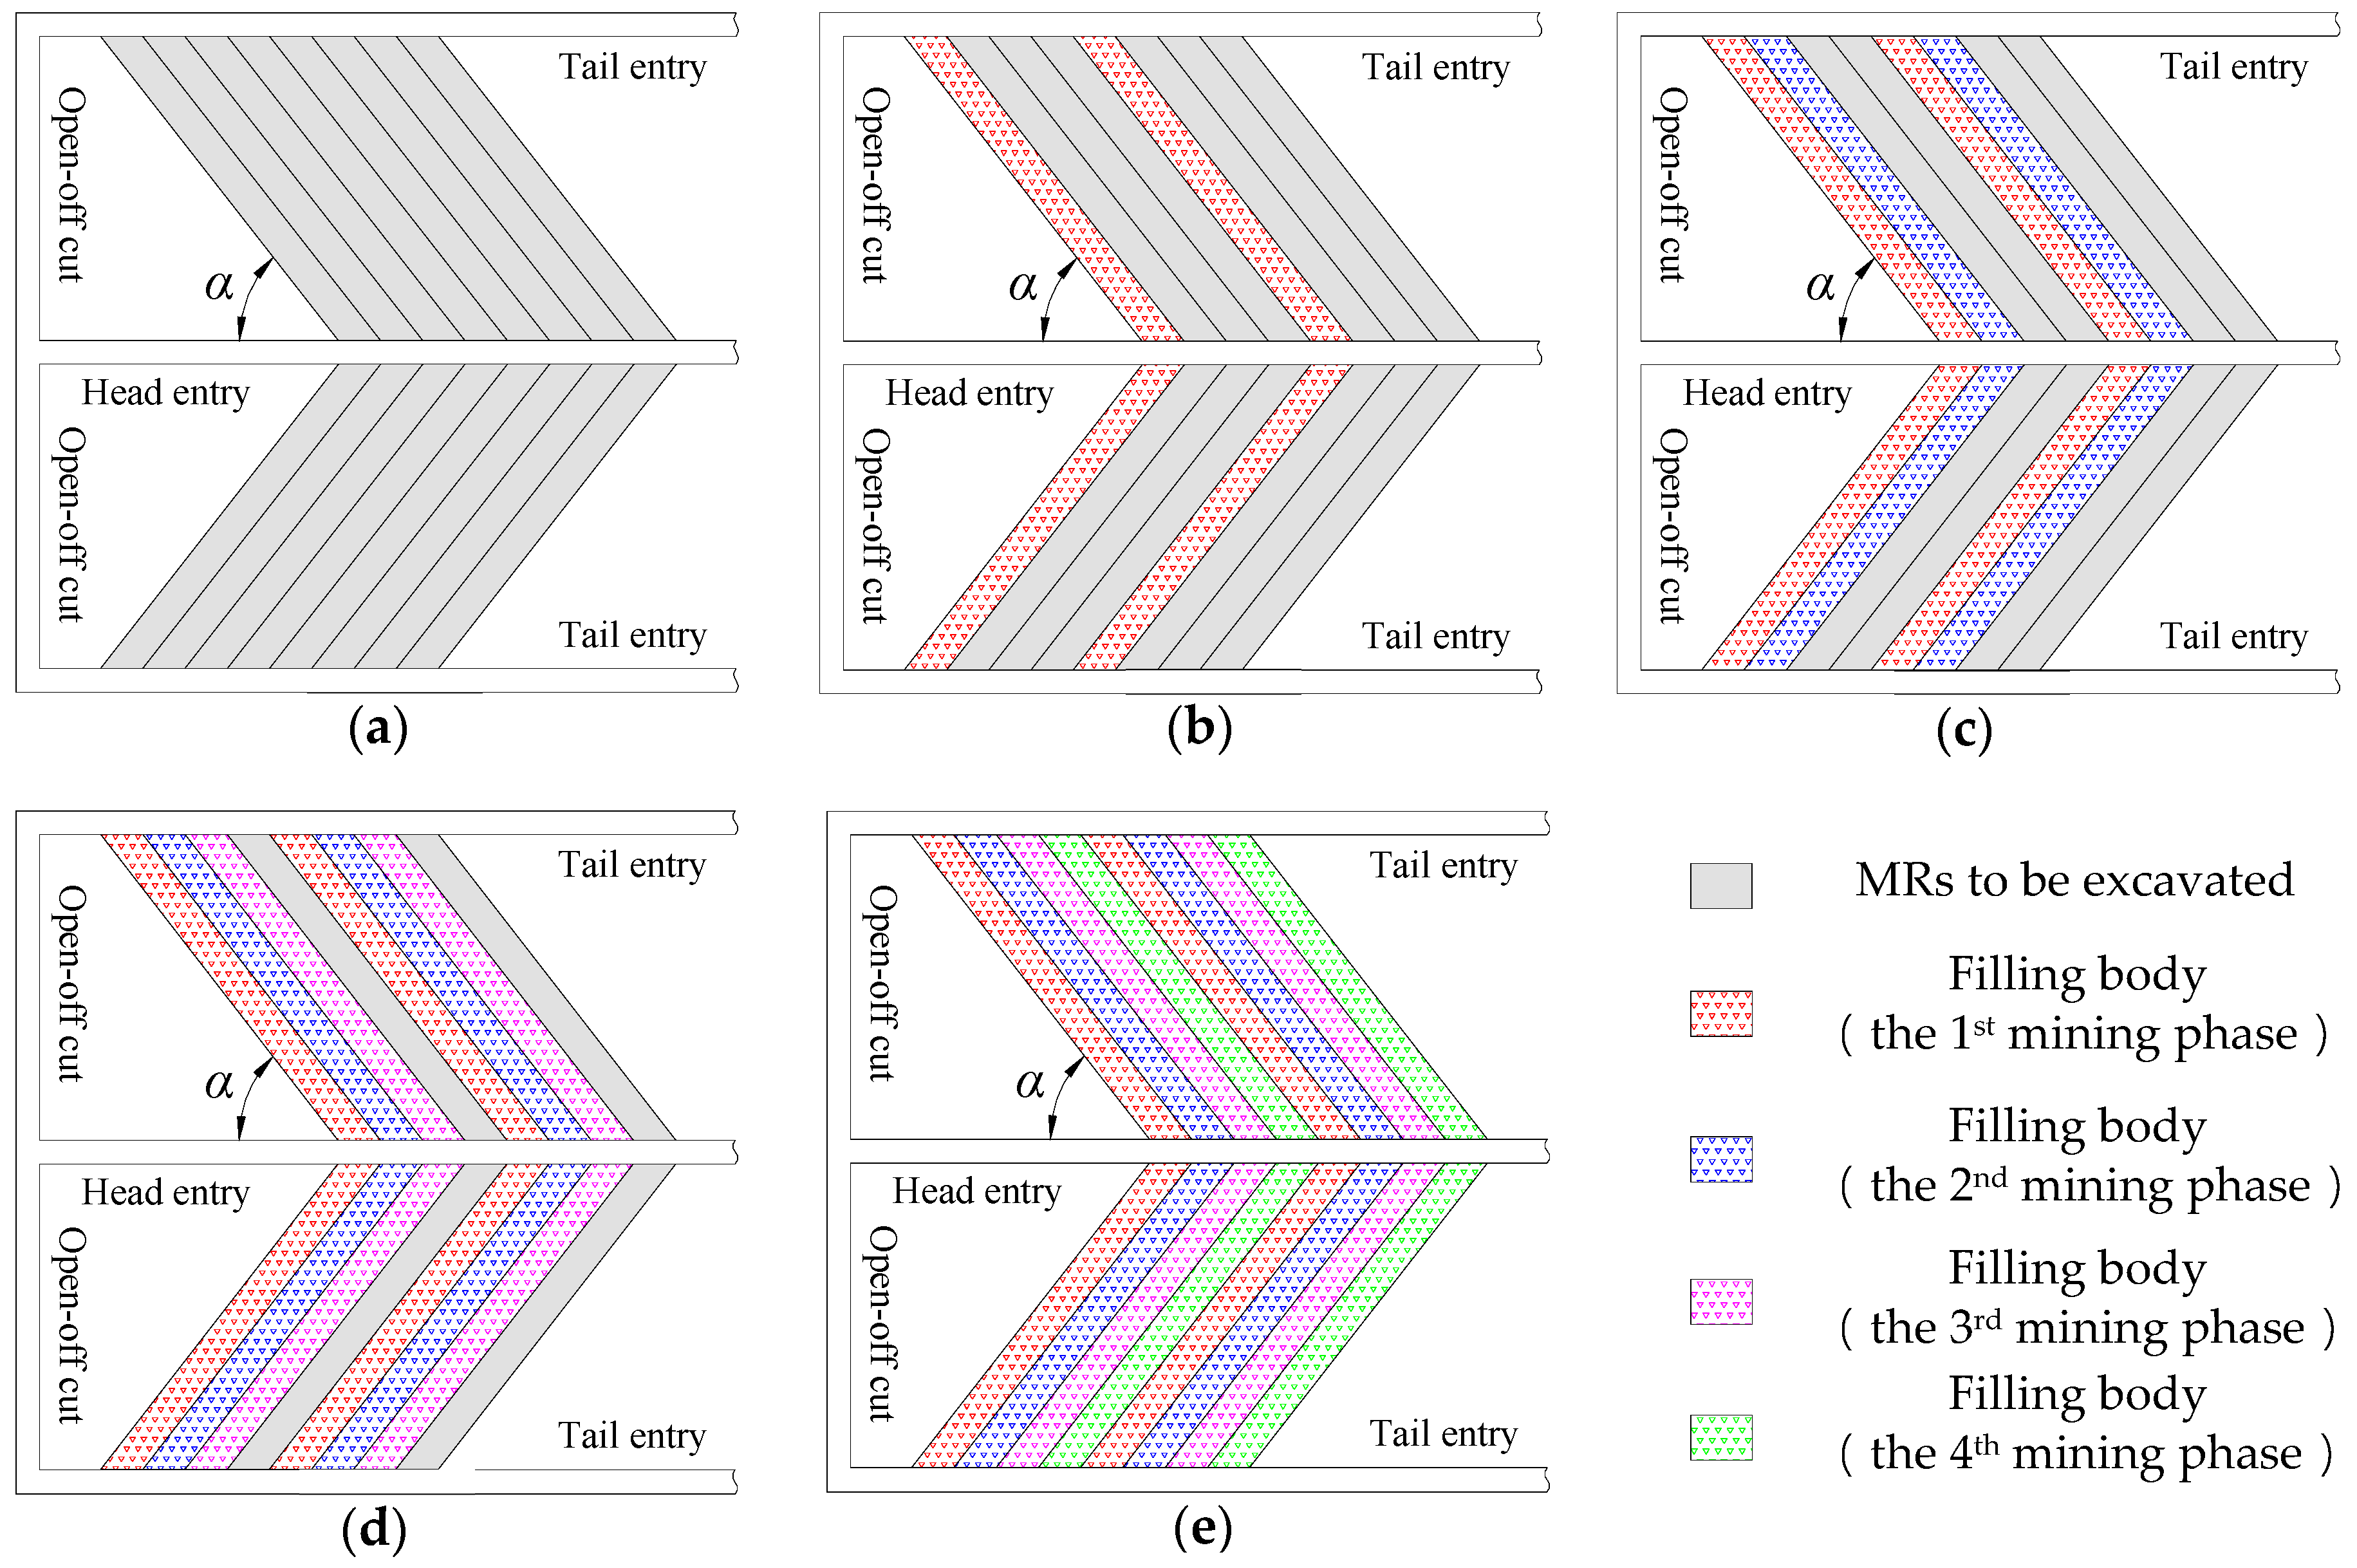
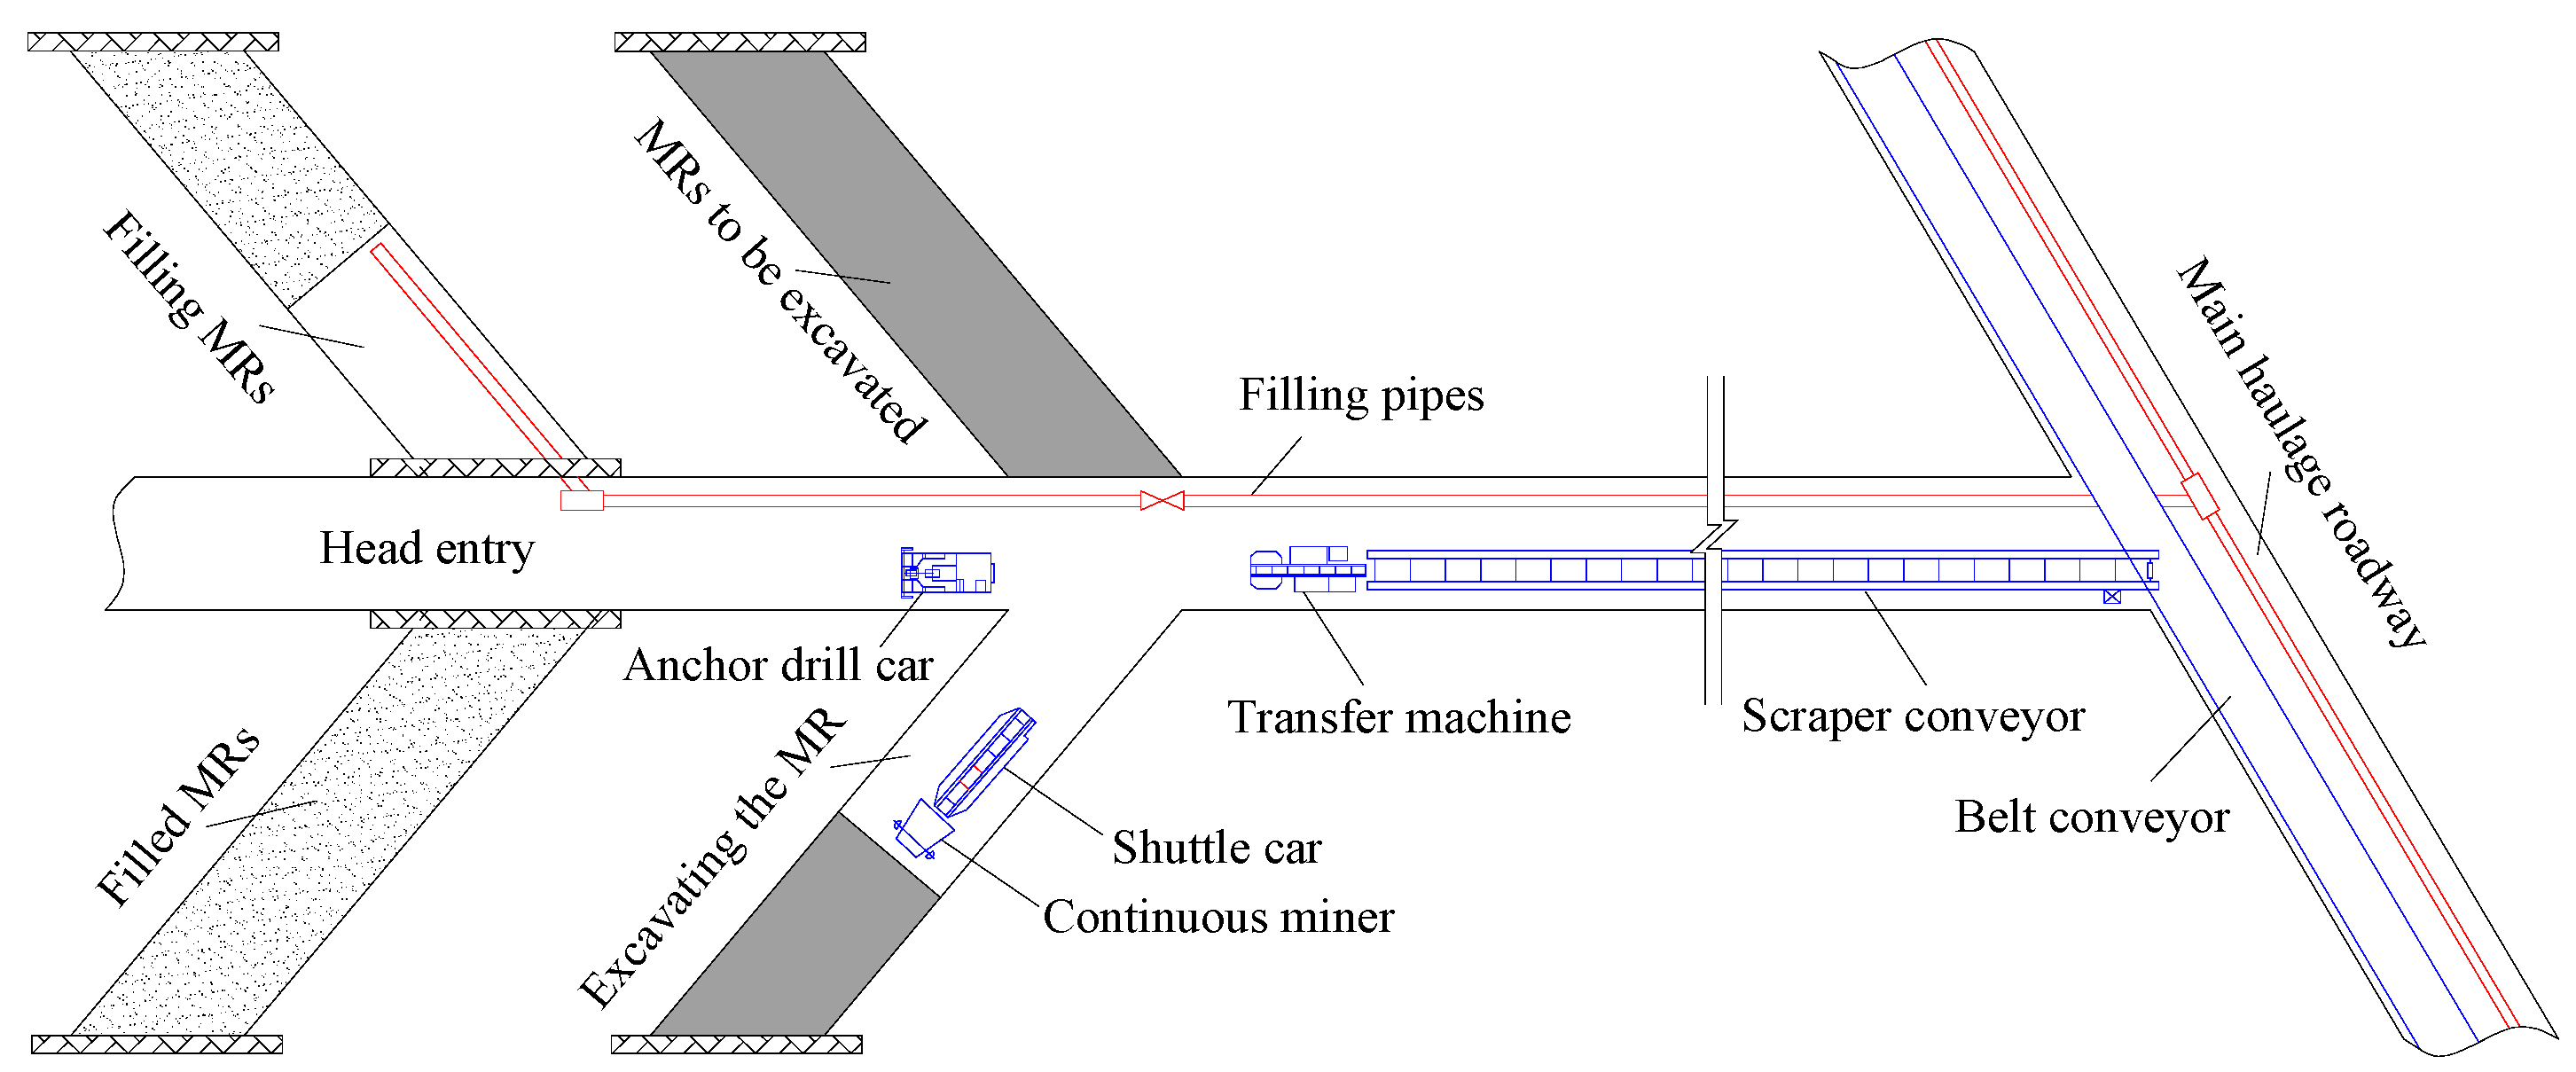
2.3. Mining Method of CECB
3. Development Mechanisms of MIF
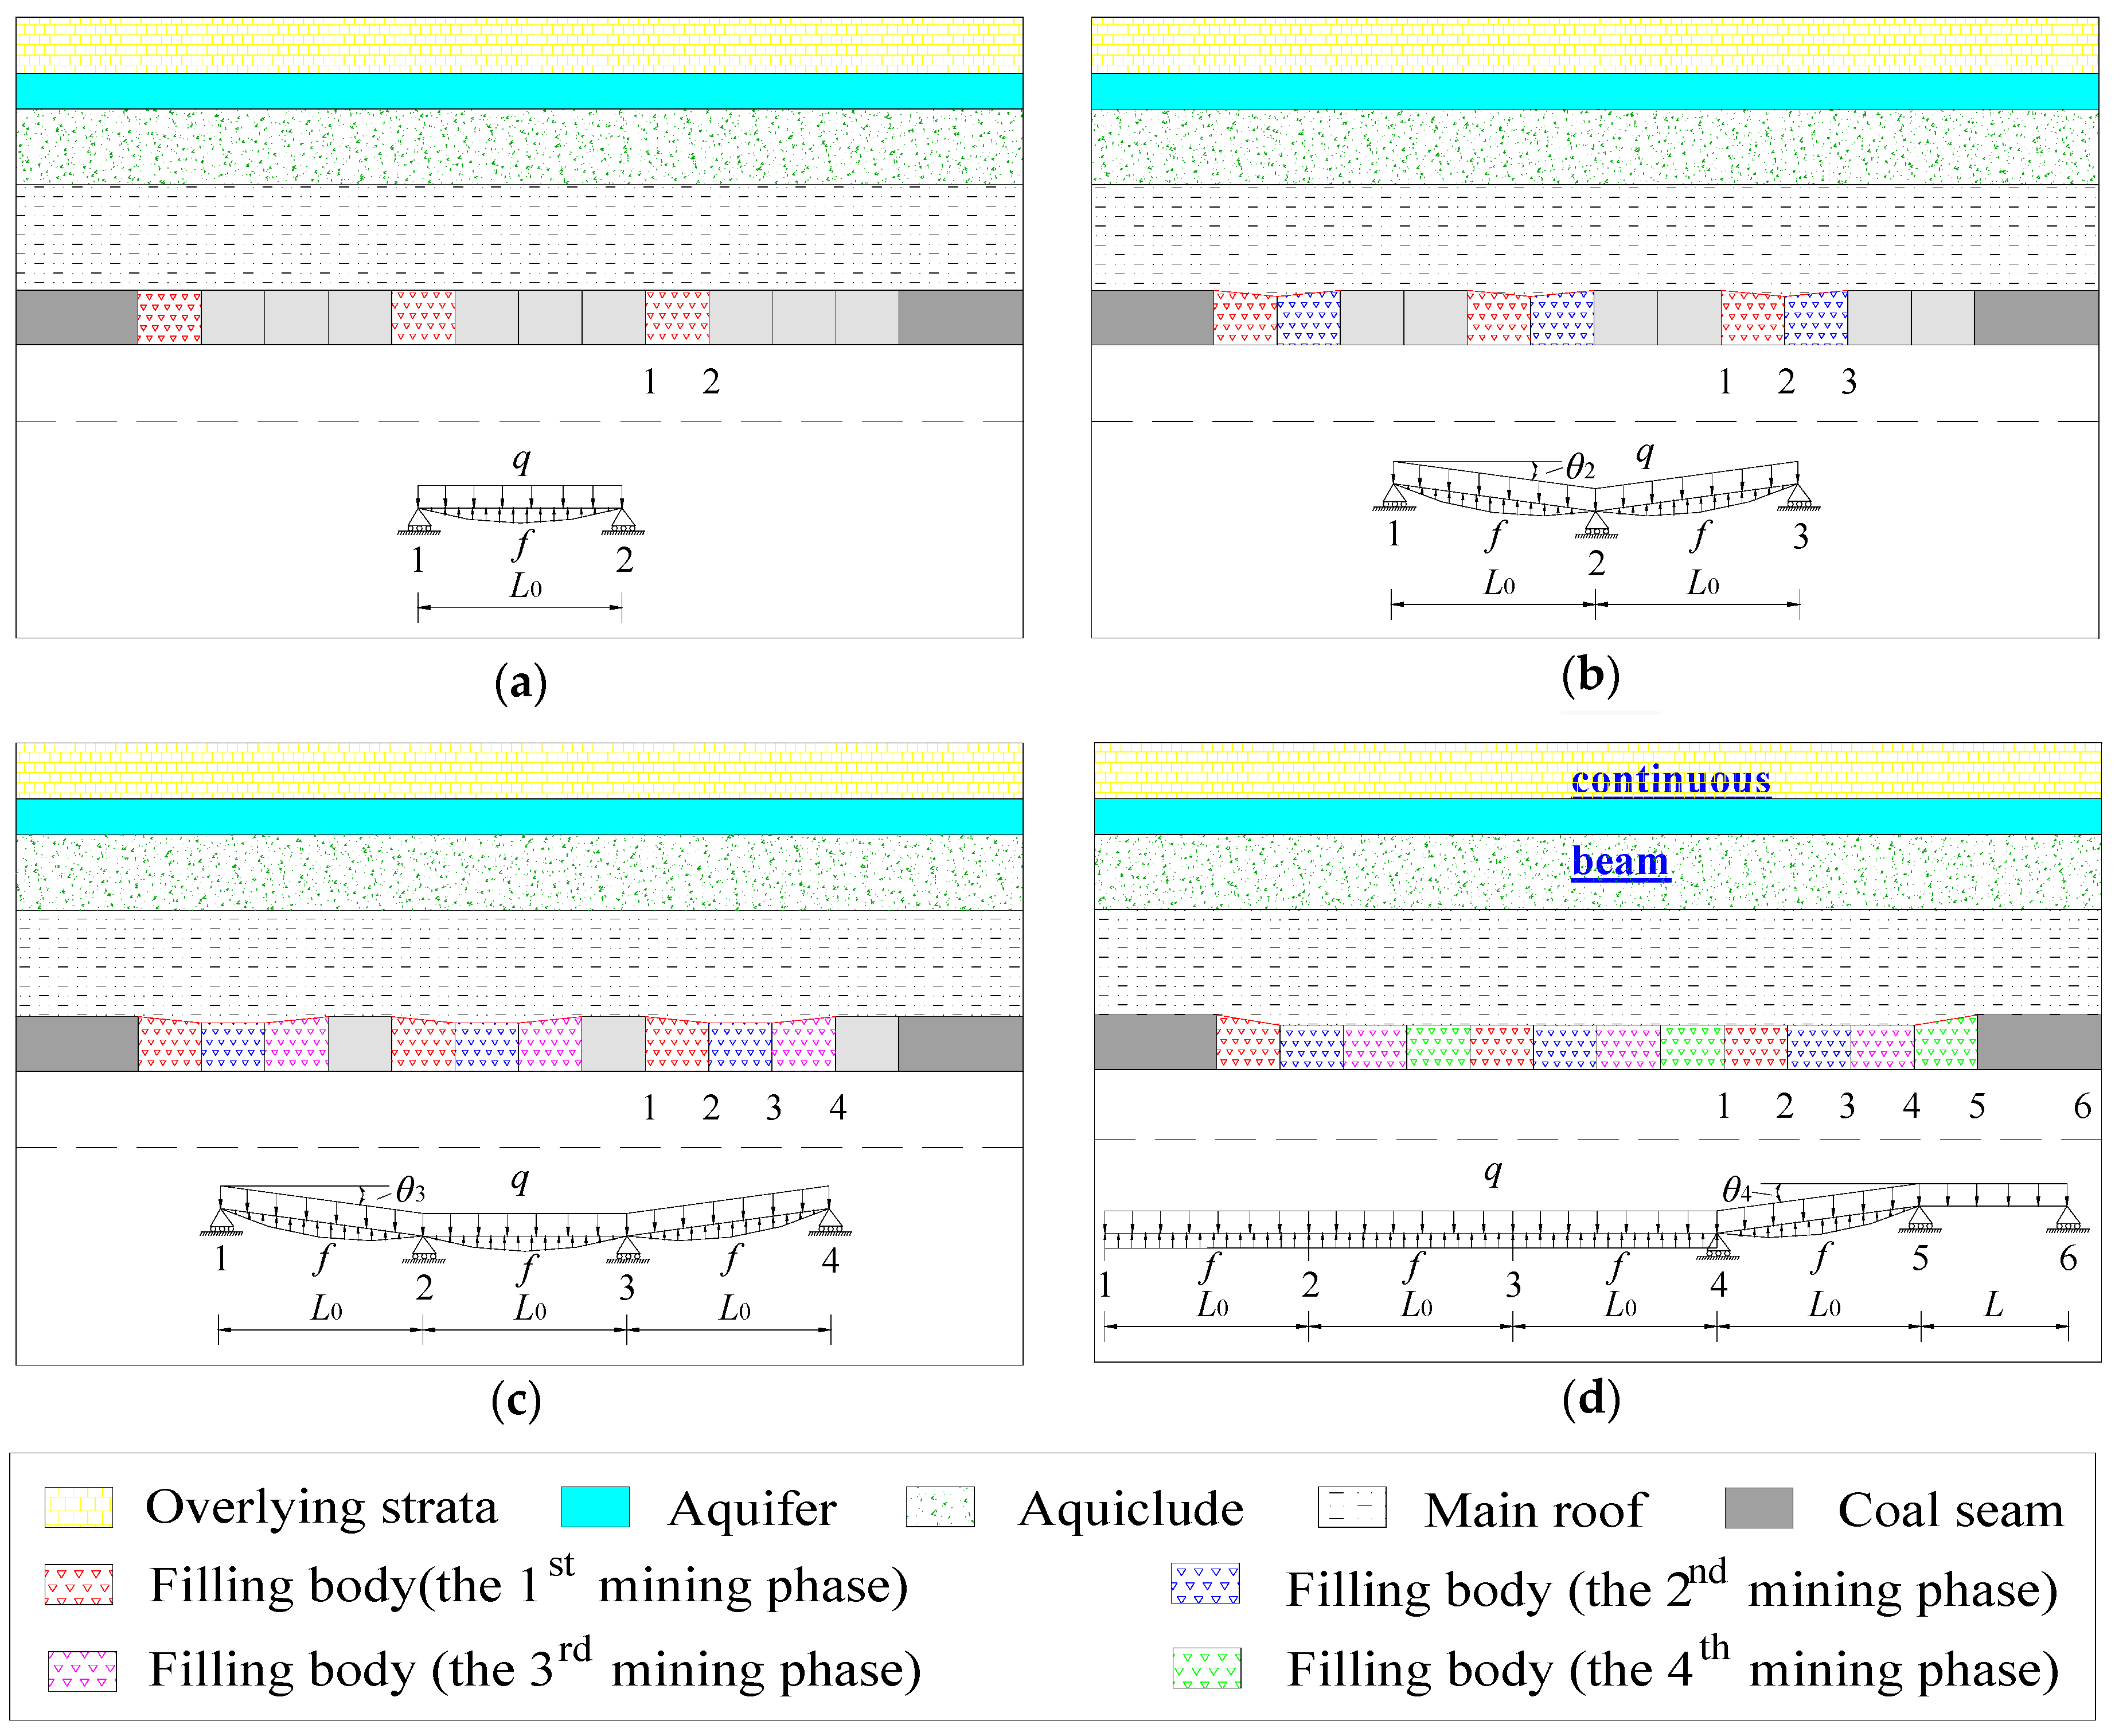
3.1. Mechanical Models
3.1.1. Clamped–Clamped Beam Model
3.1.2. Continuous Beam Model
3.1.3. Elastic Foundation Beam Model
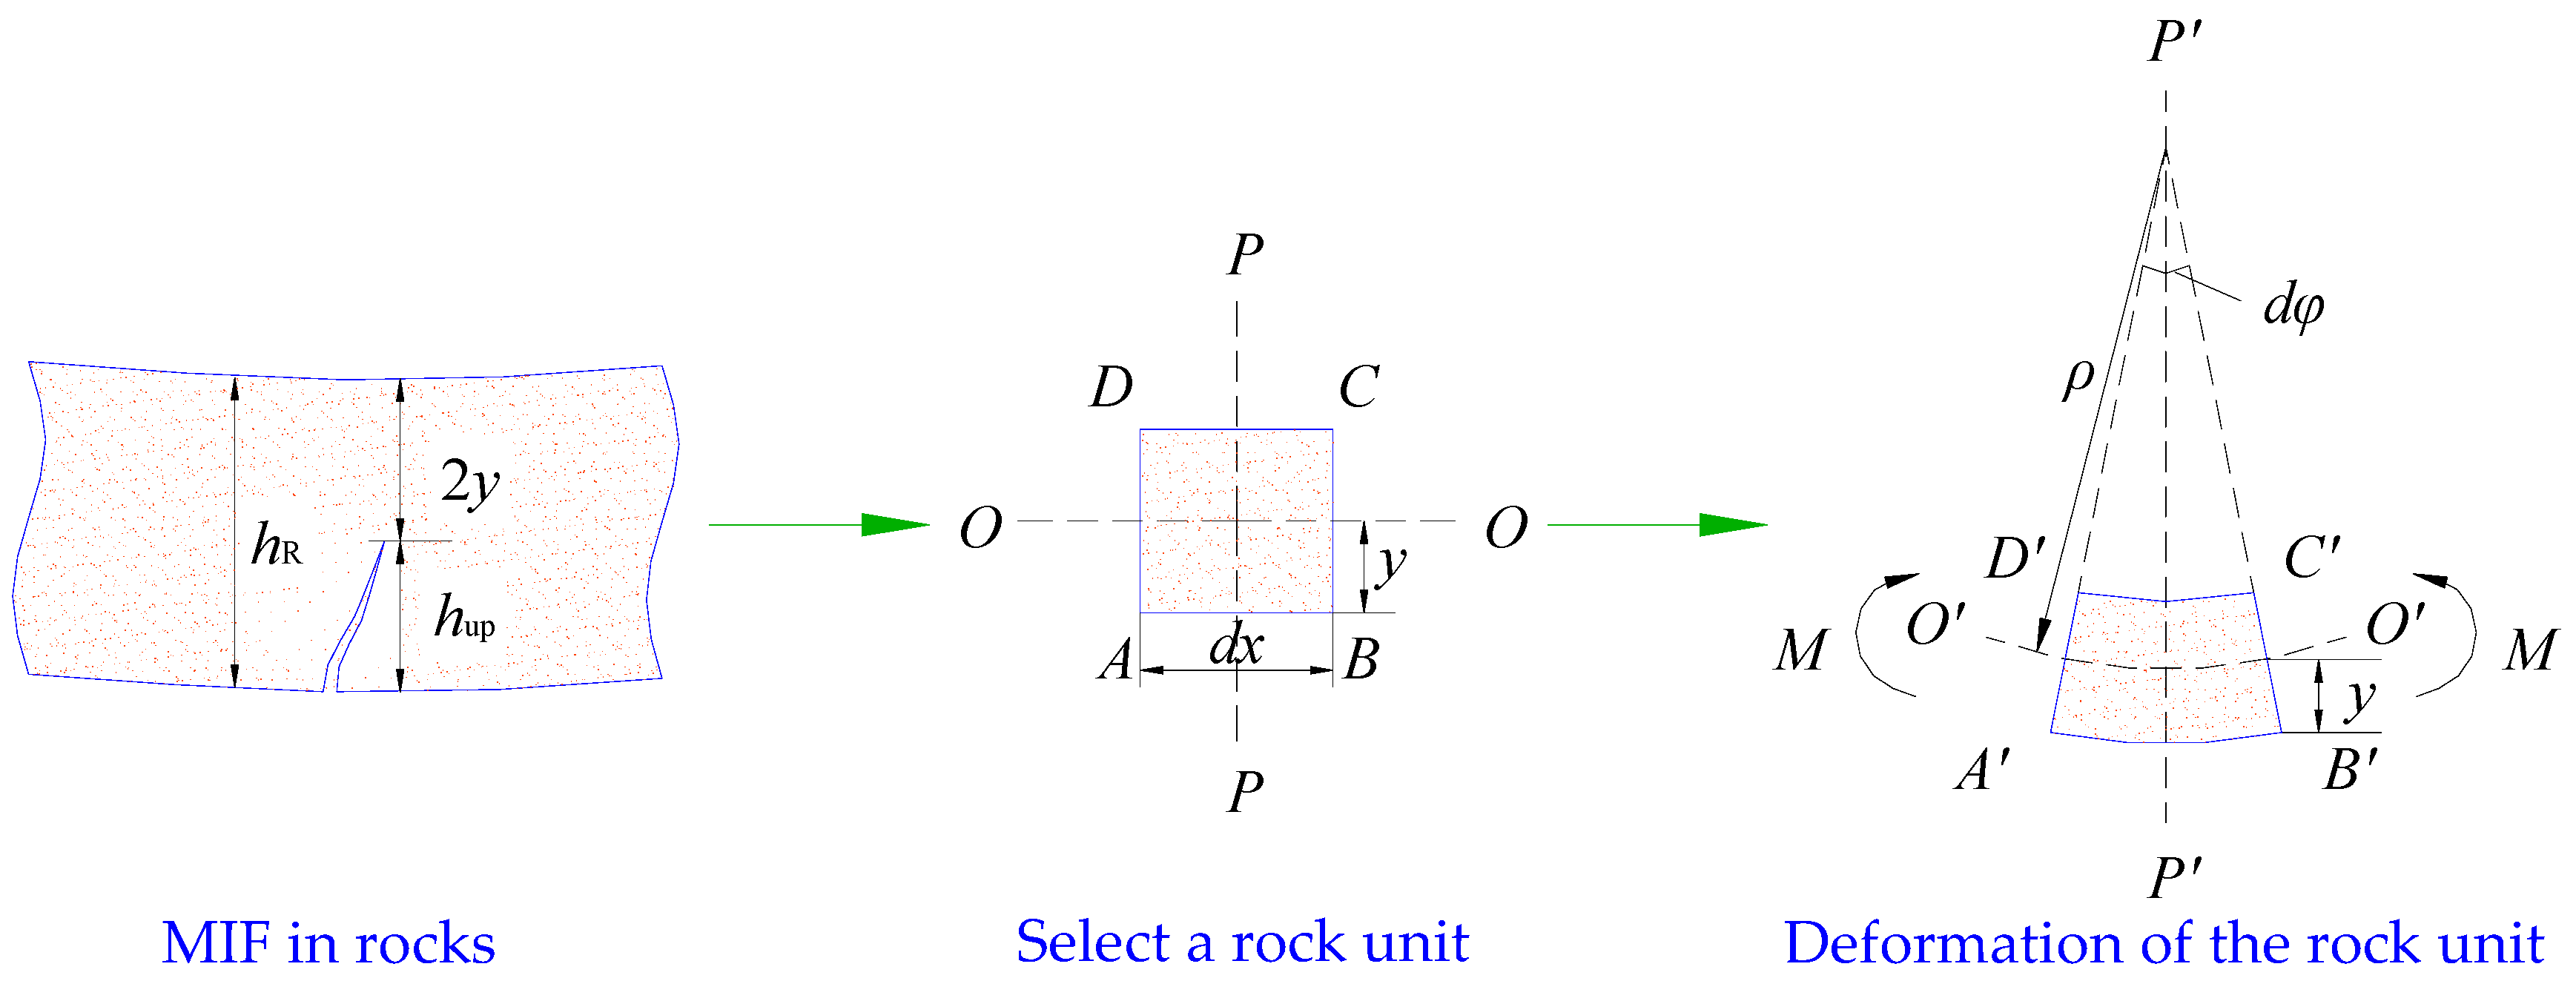
3.2. Deformation Characteristics of the Beam Models
3.2.1. The Structure of the Continuous Beam
3.2.2. The Structure of the Elastic Foundation Beam
3.3. Fractures in the Overlying Strata
4. Characteristics of MIF
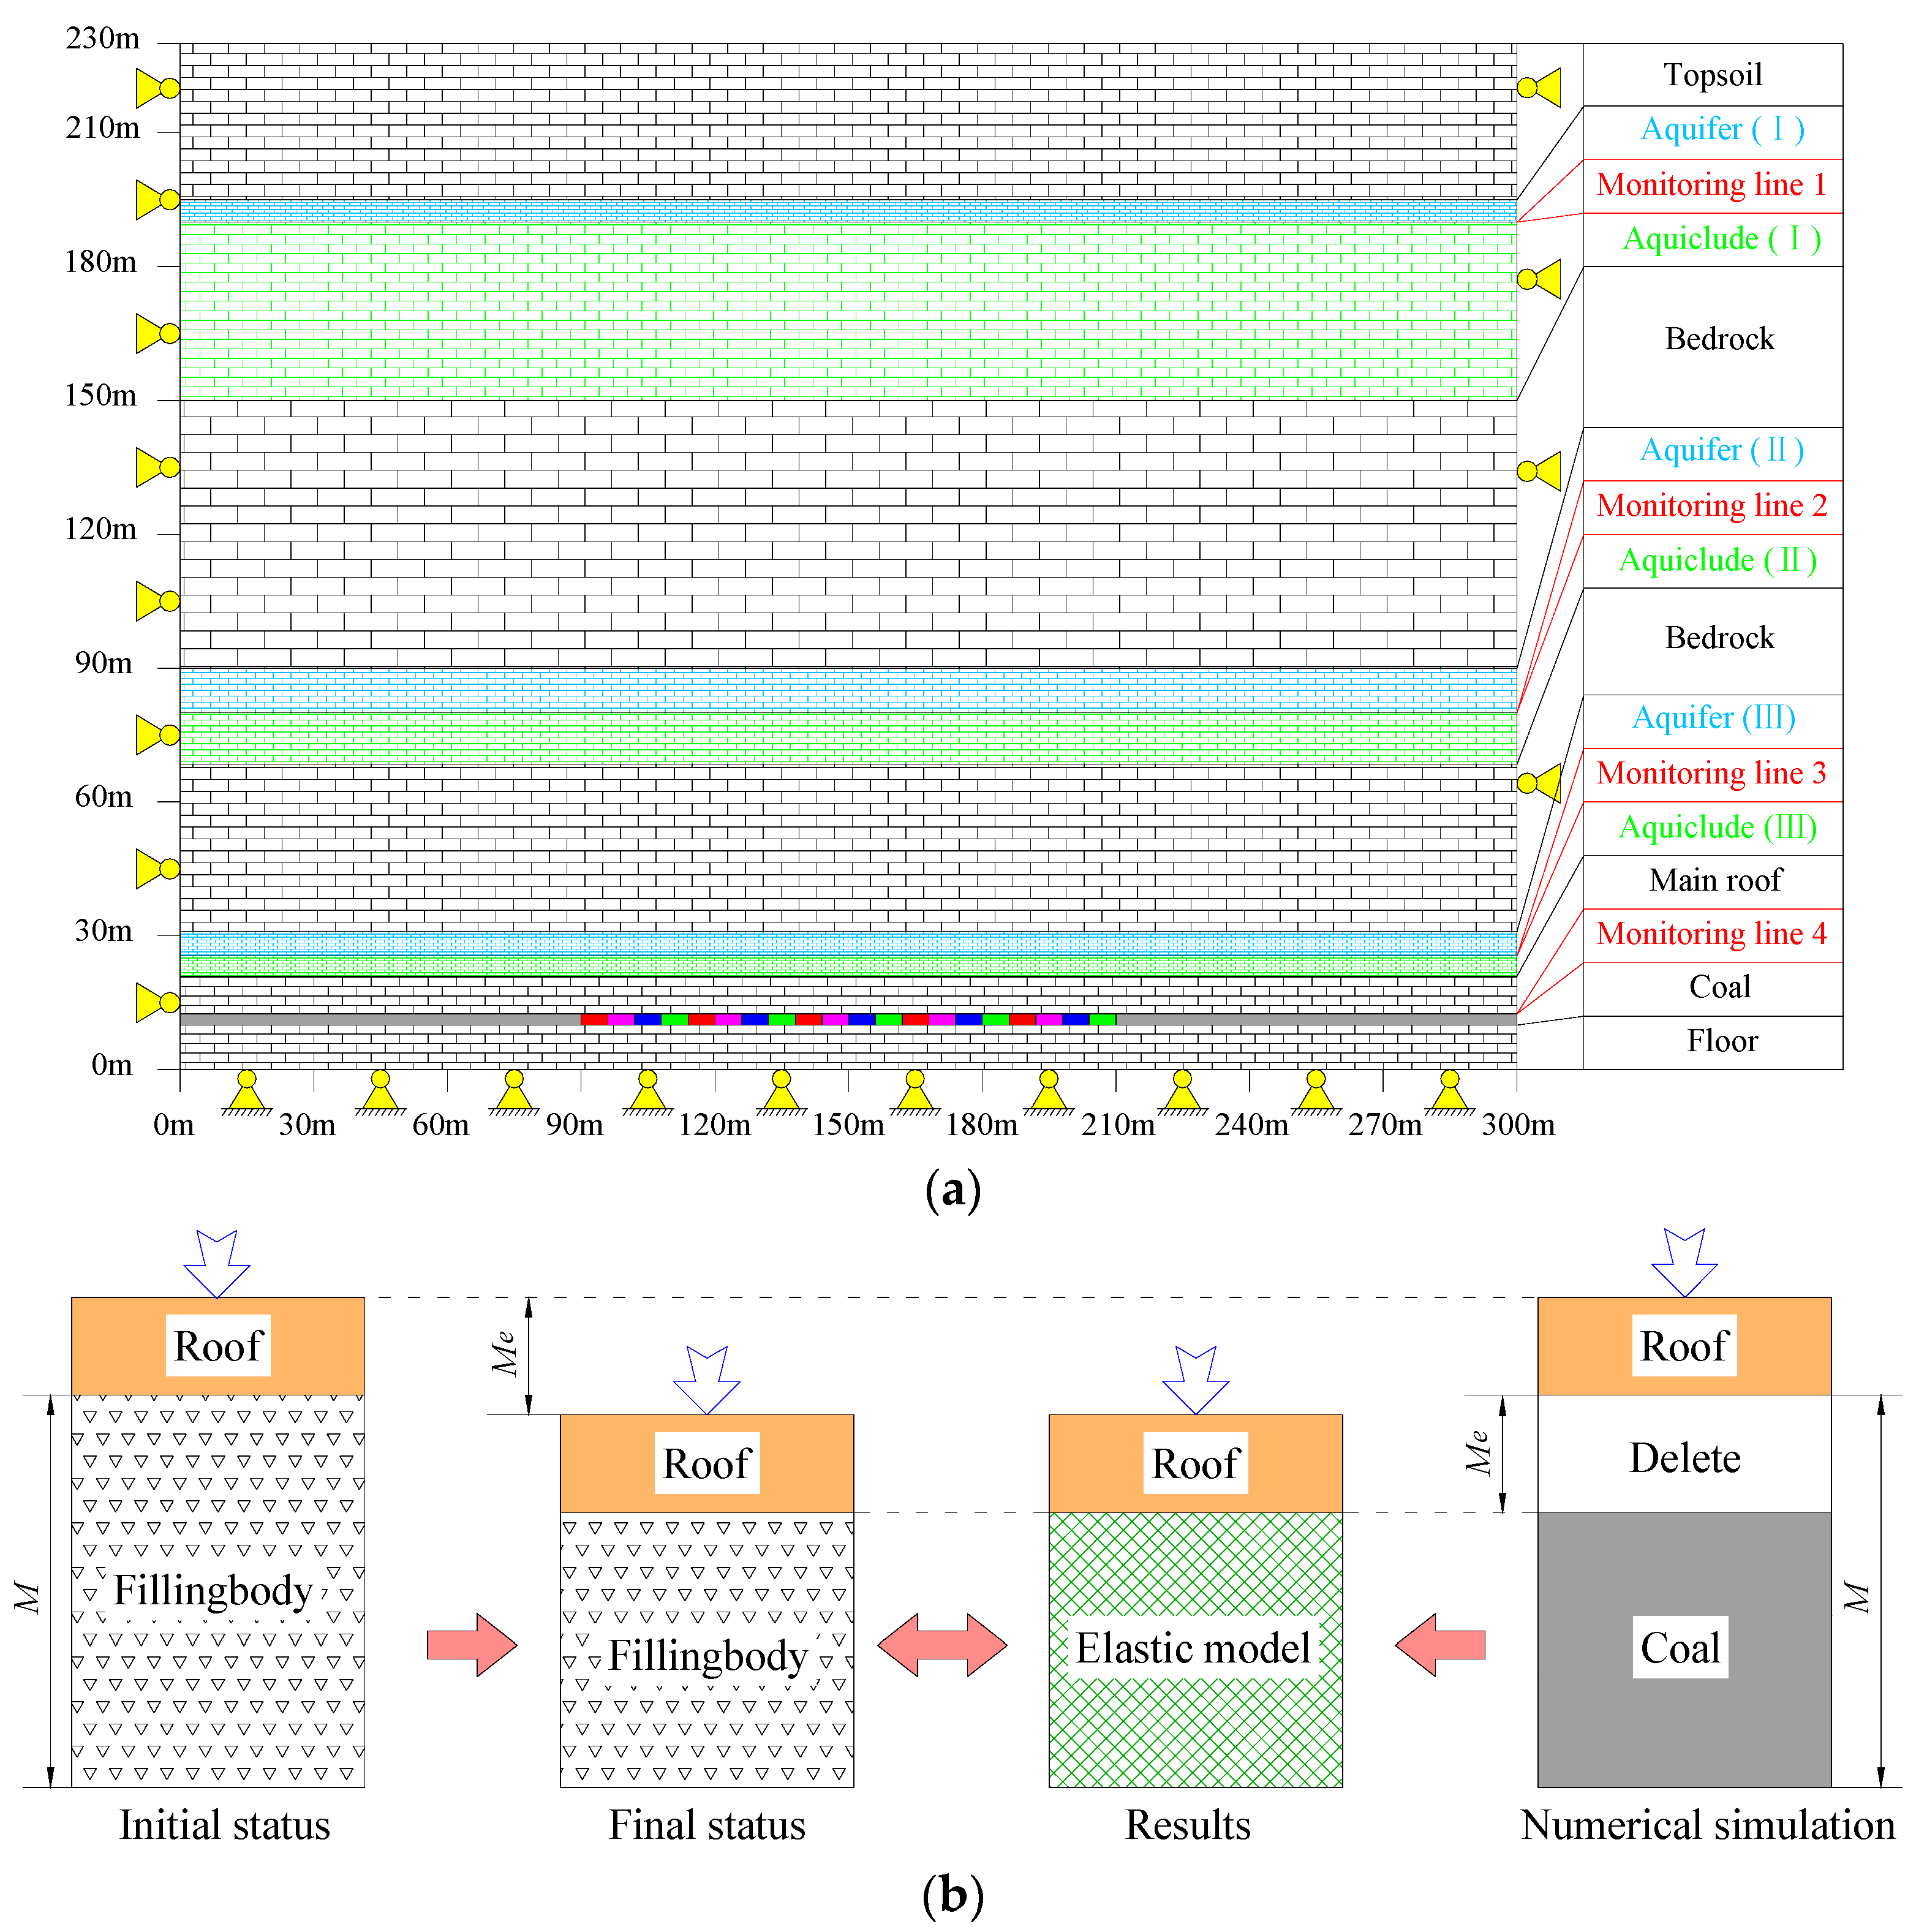
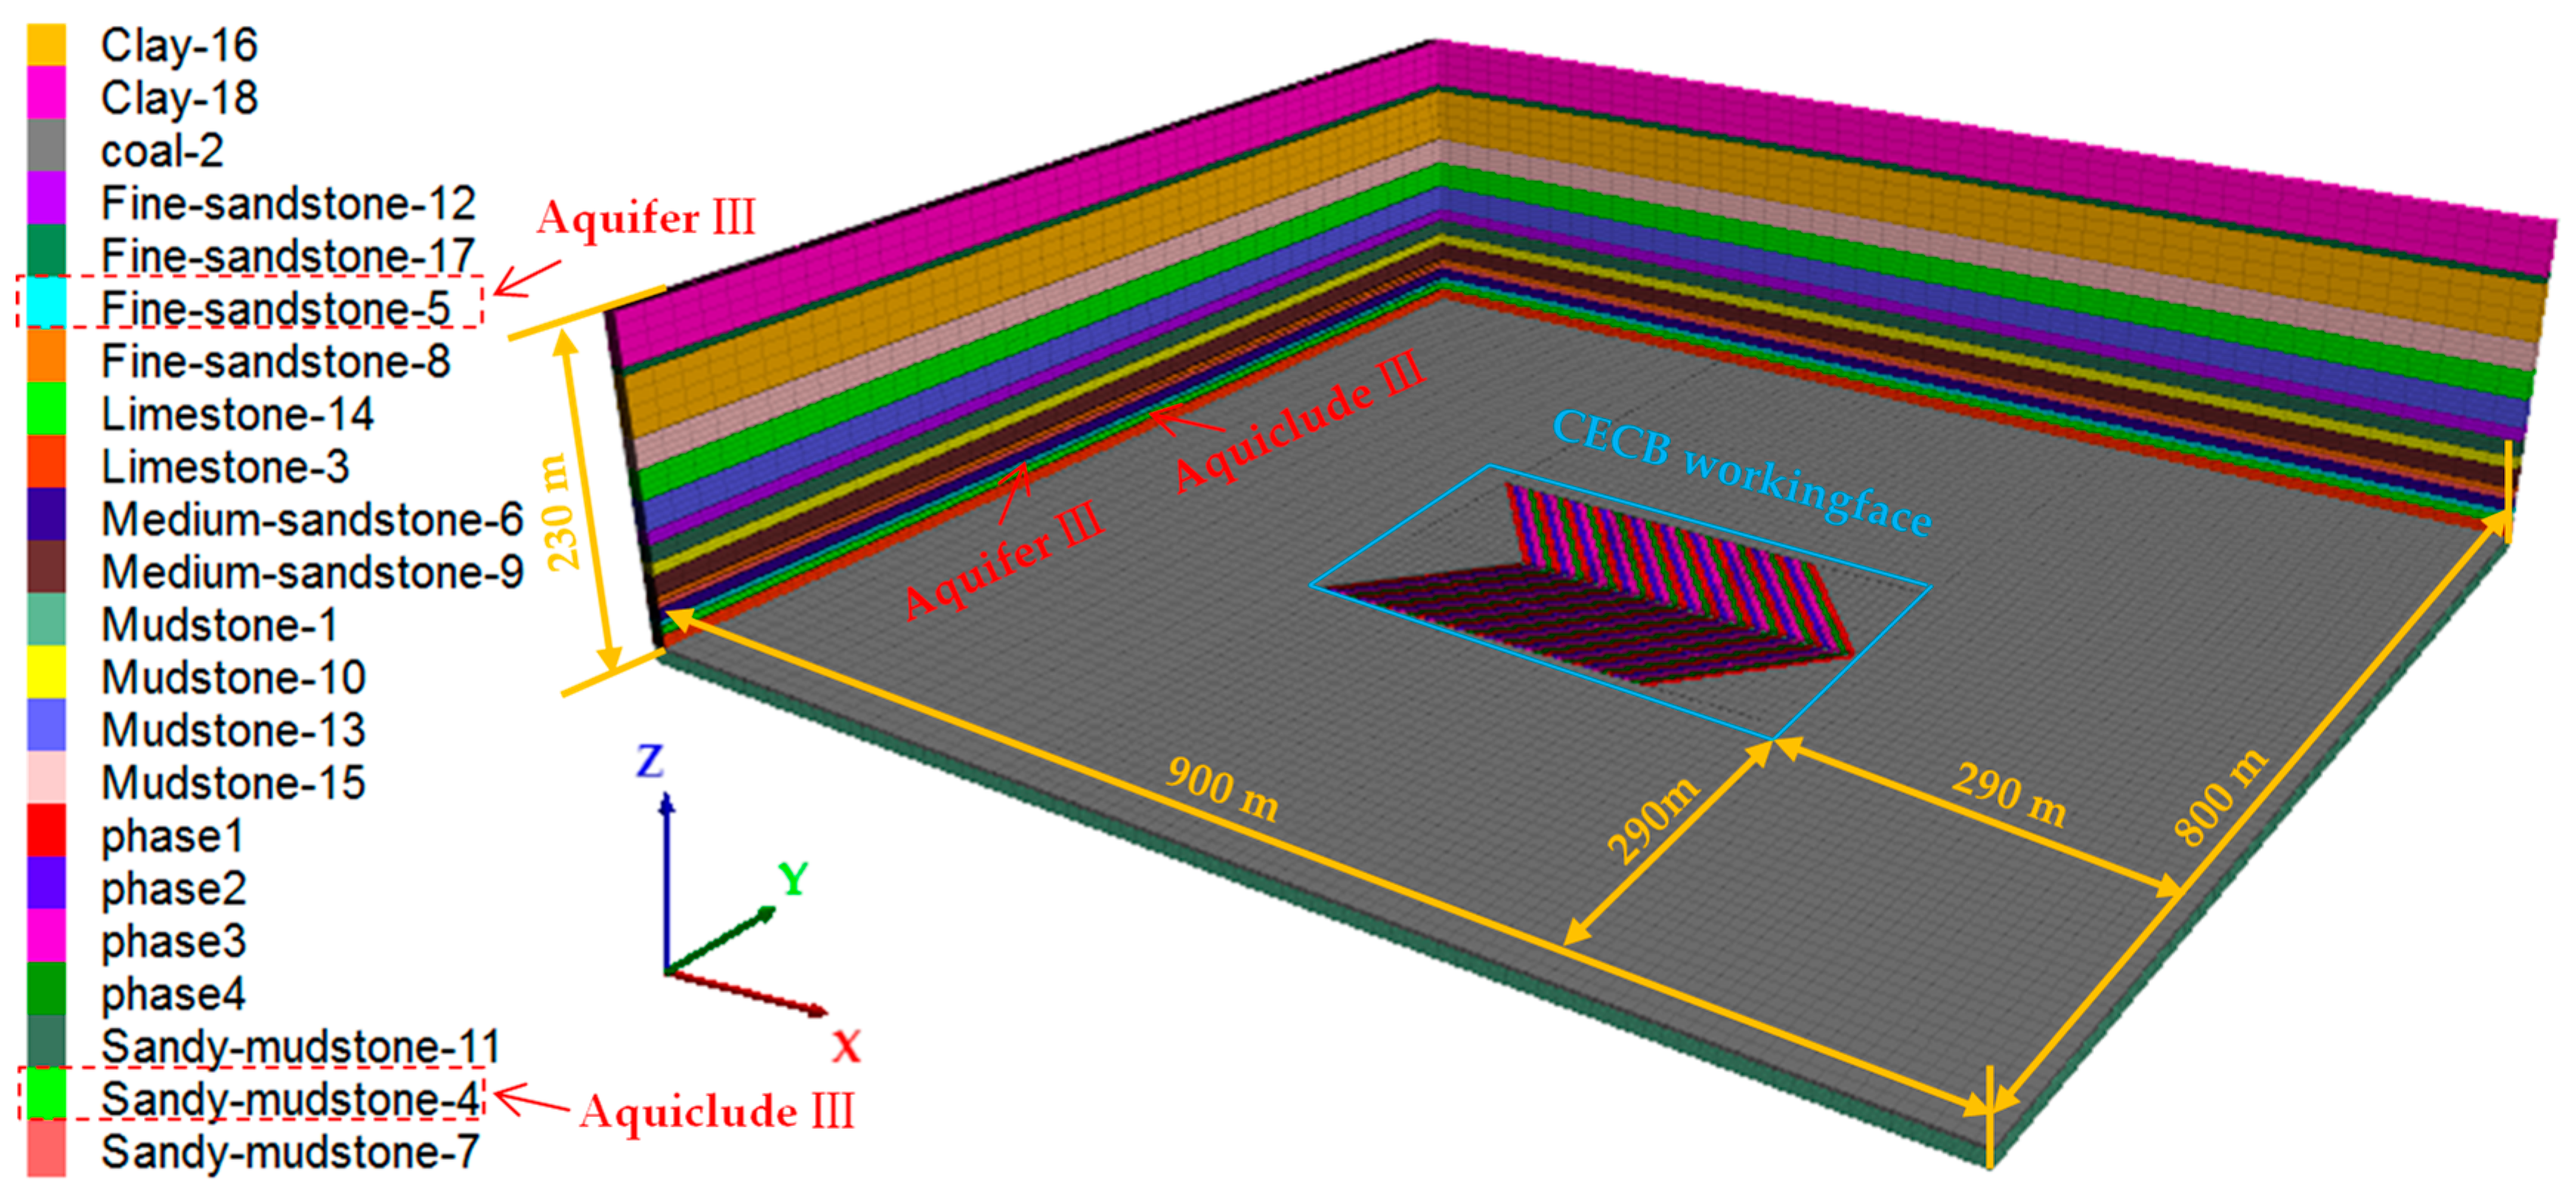
4.1. The Numerical Model and the Scheme
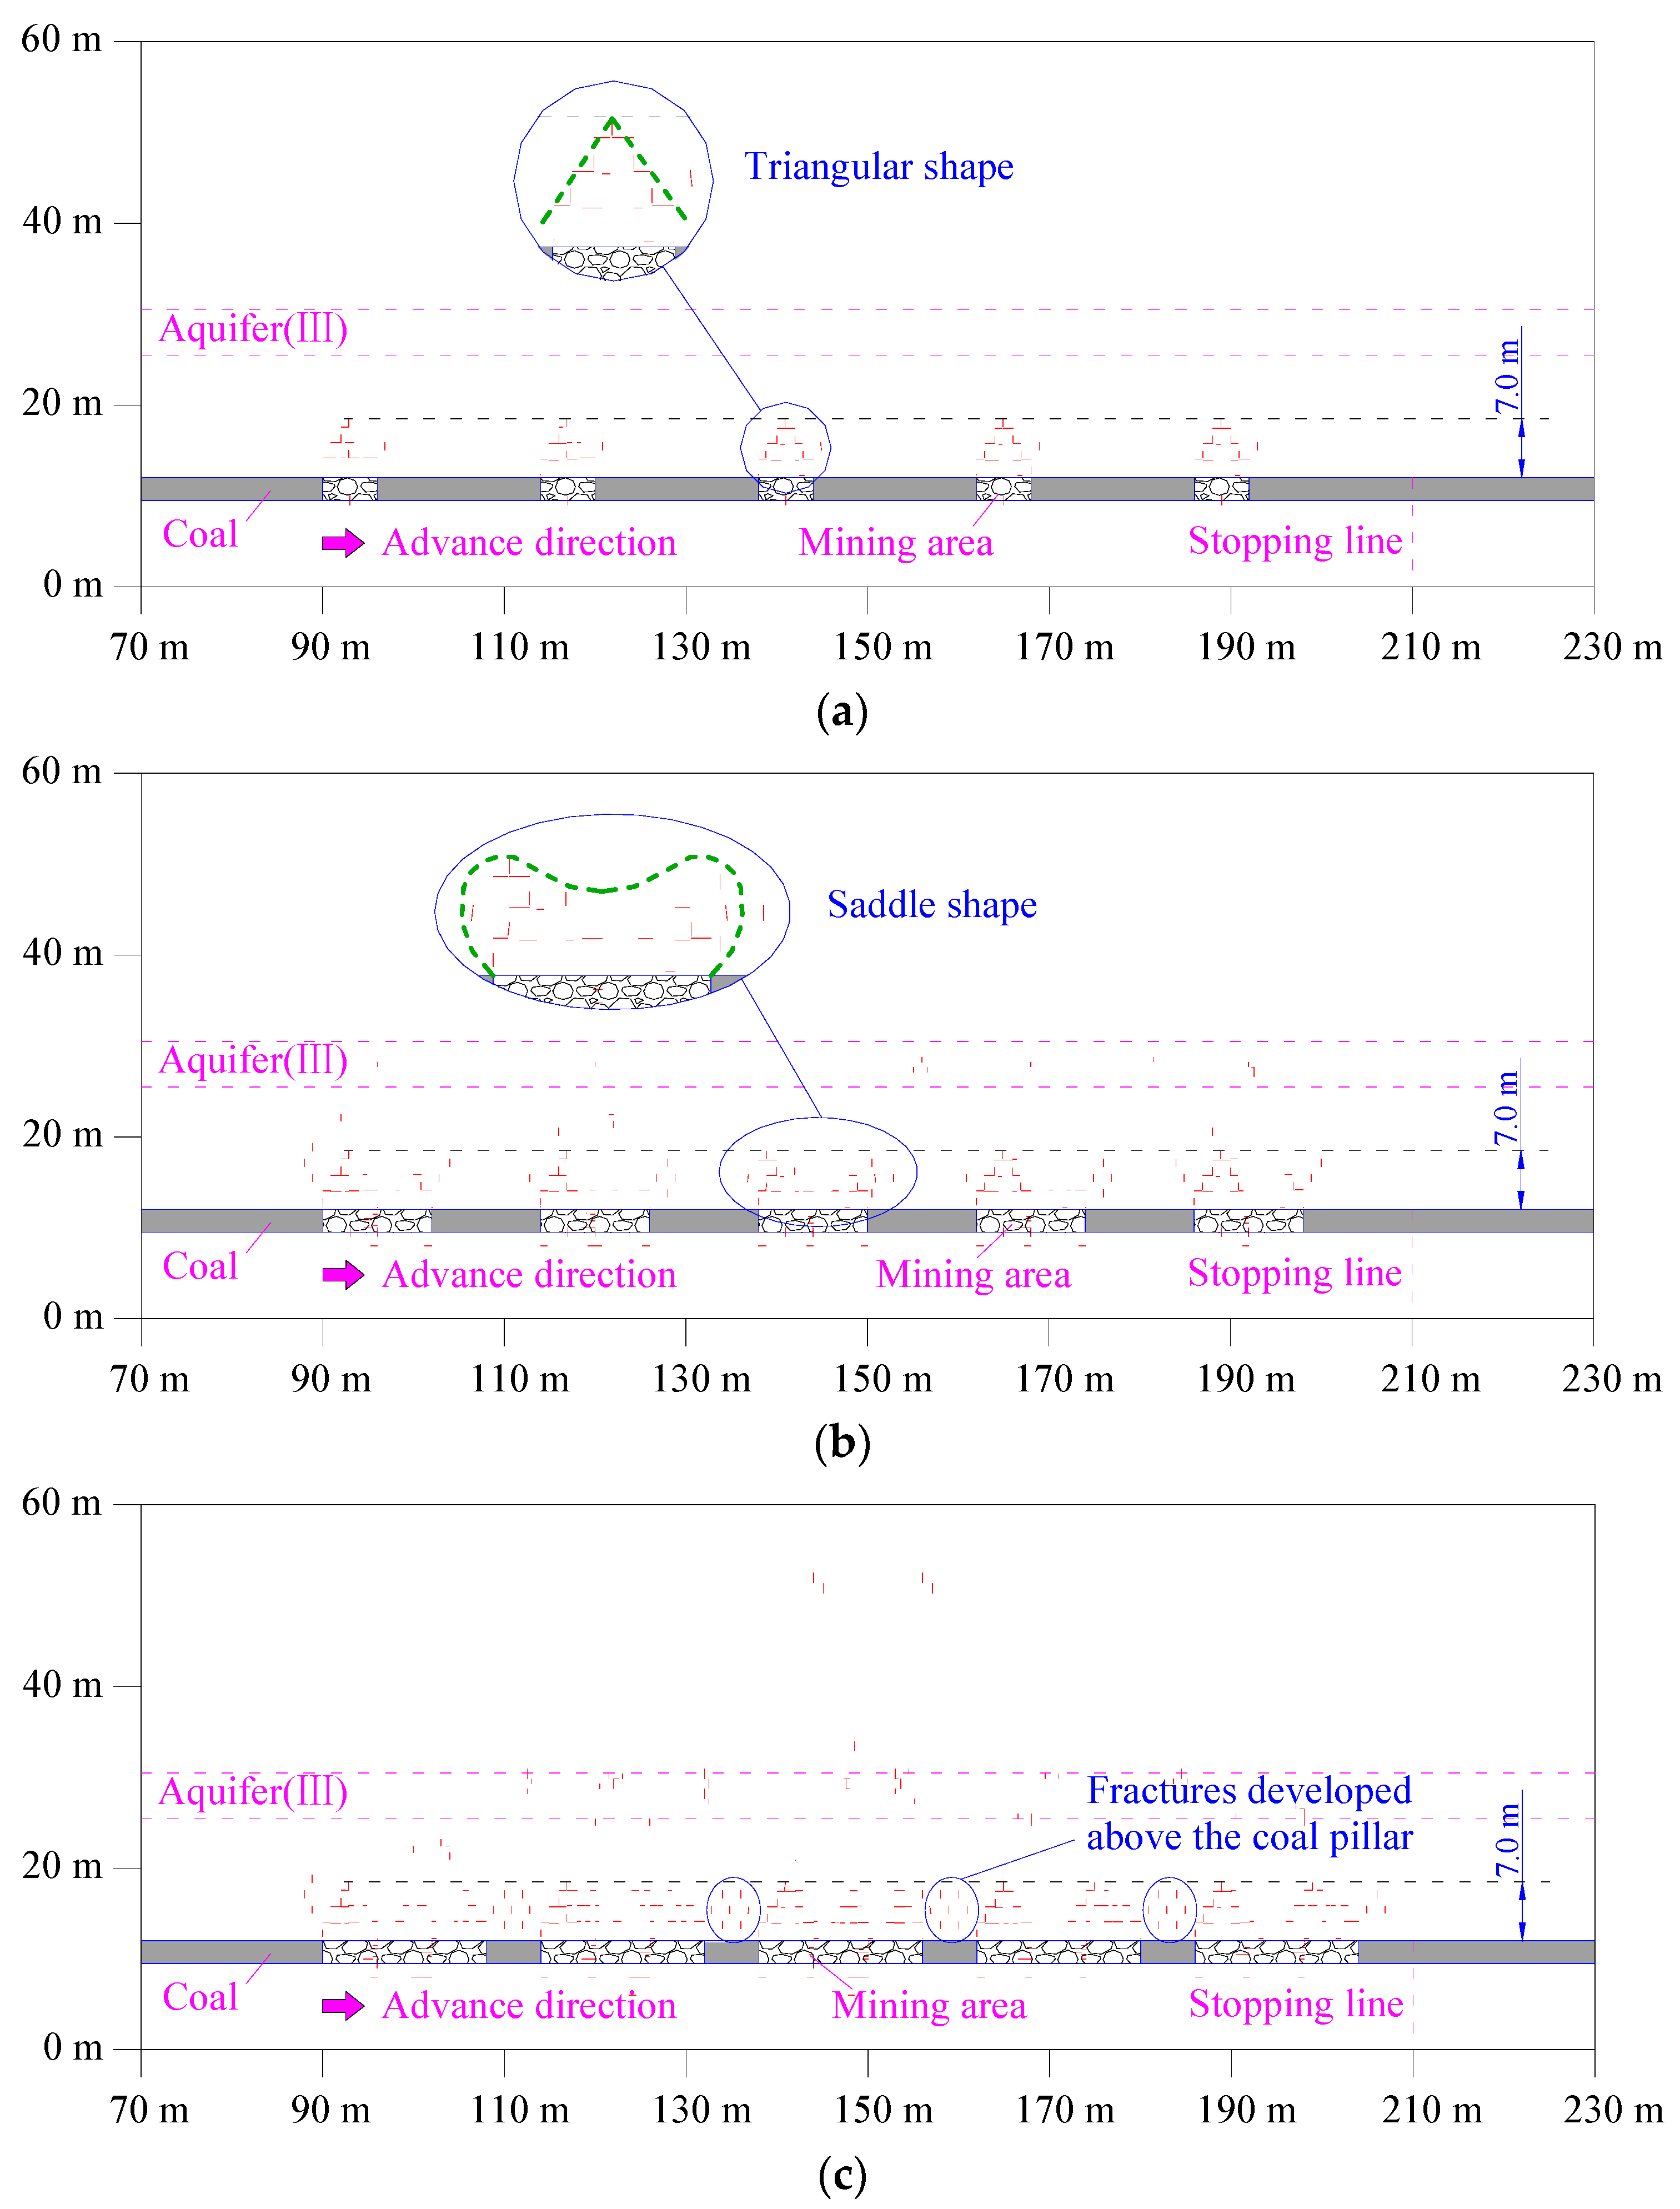
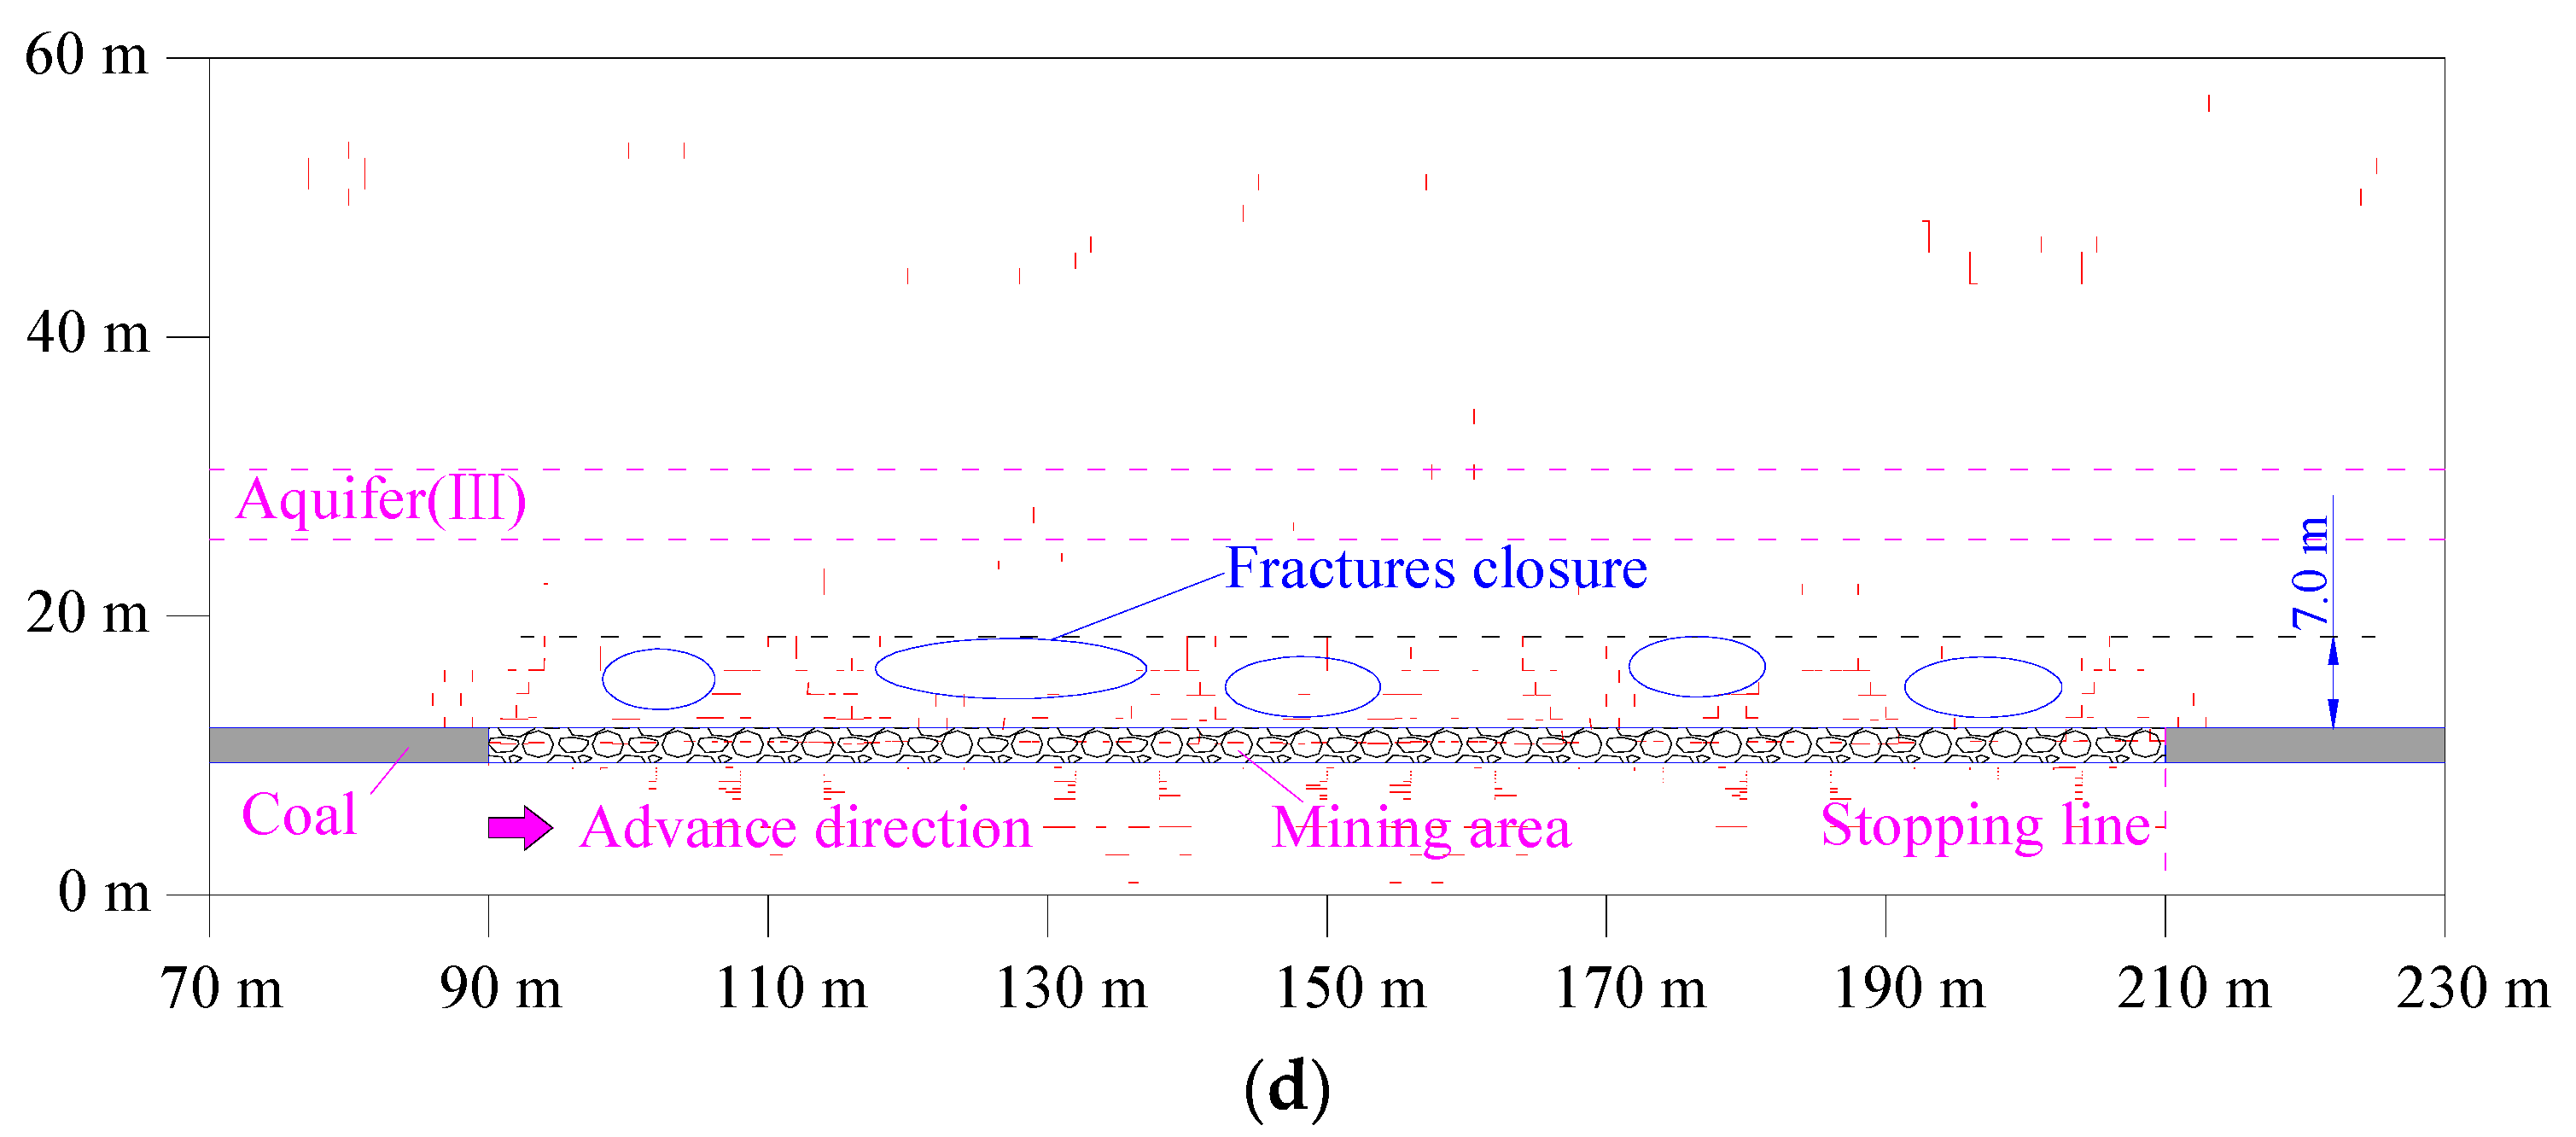
4.2. Distribution Patterns of MIF
4.2.1. The Elastic Foundation Beam Structure
4.2.2. The Elastic Foundation Beam Structure
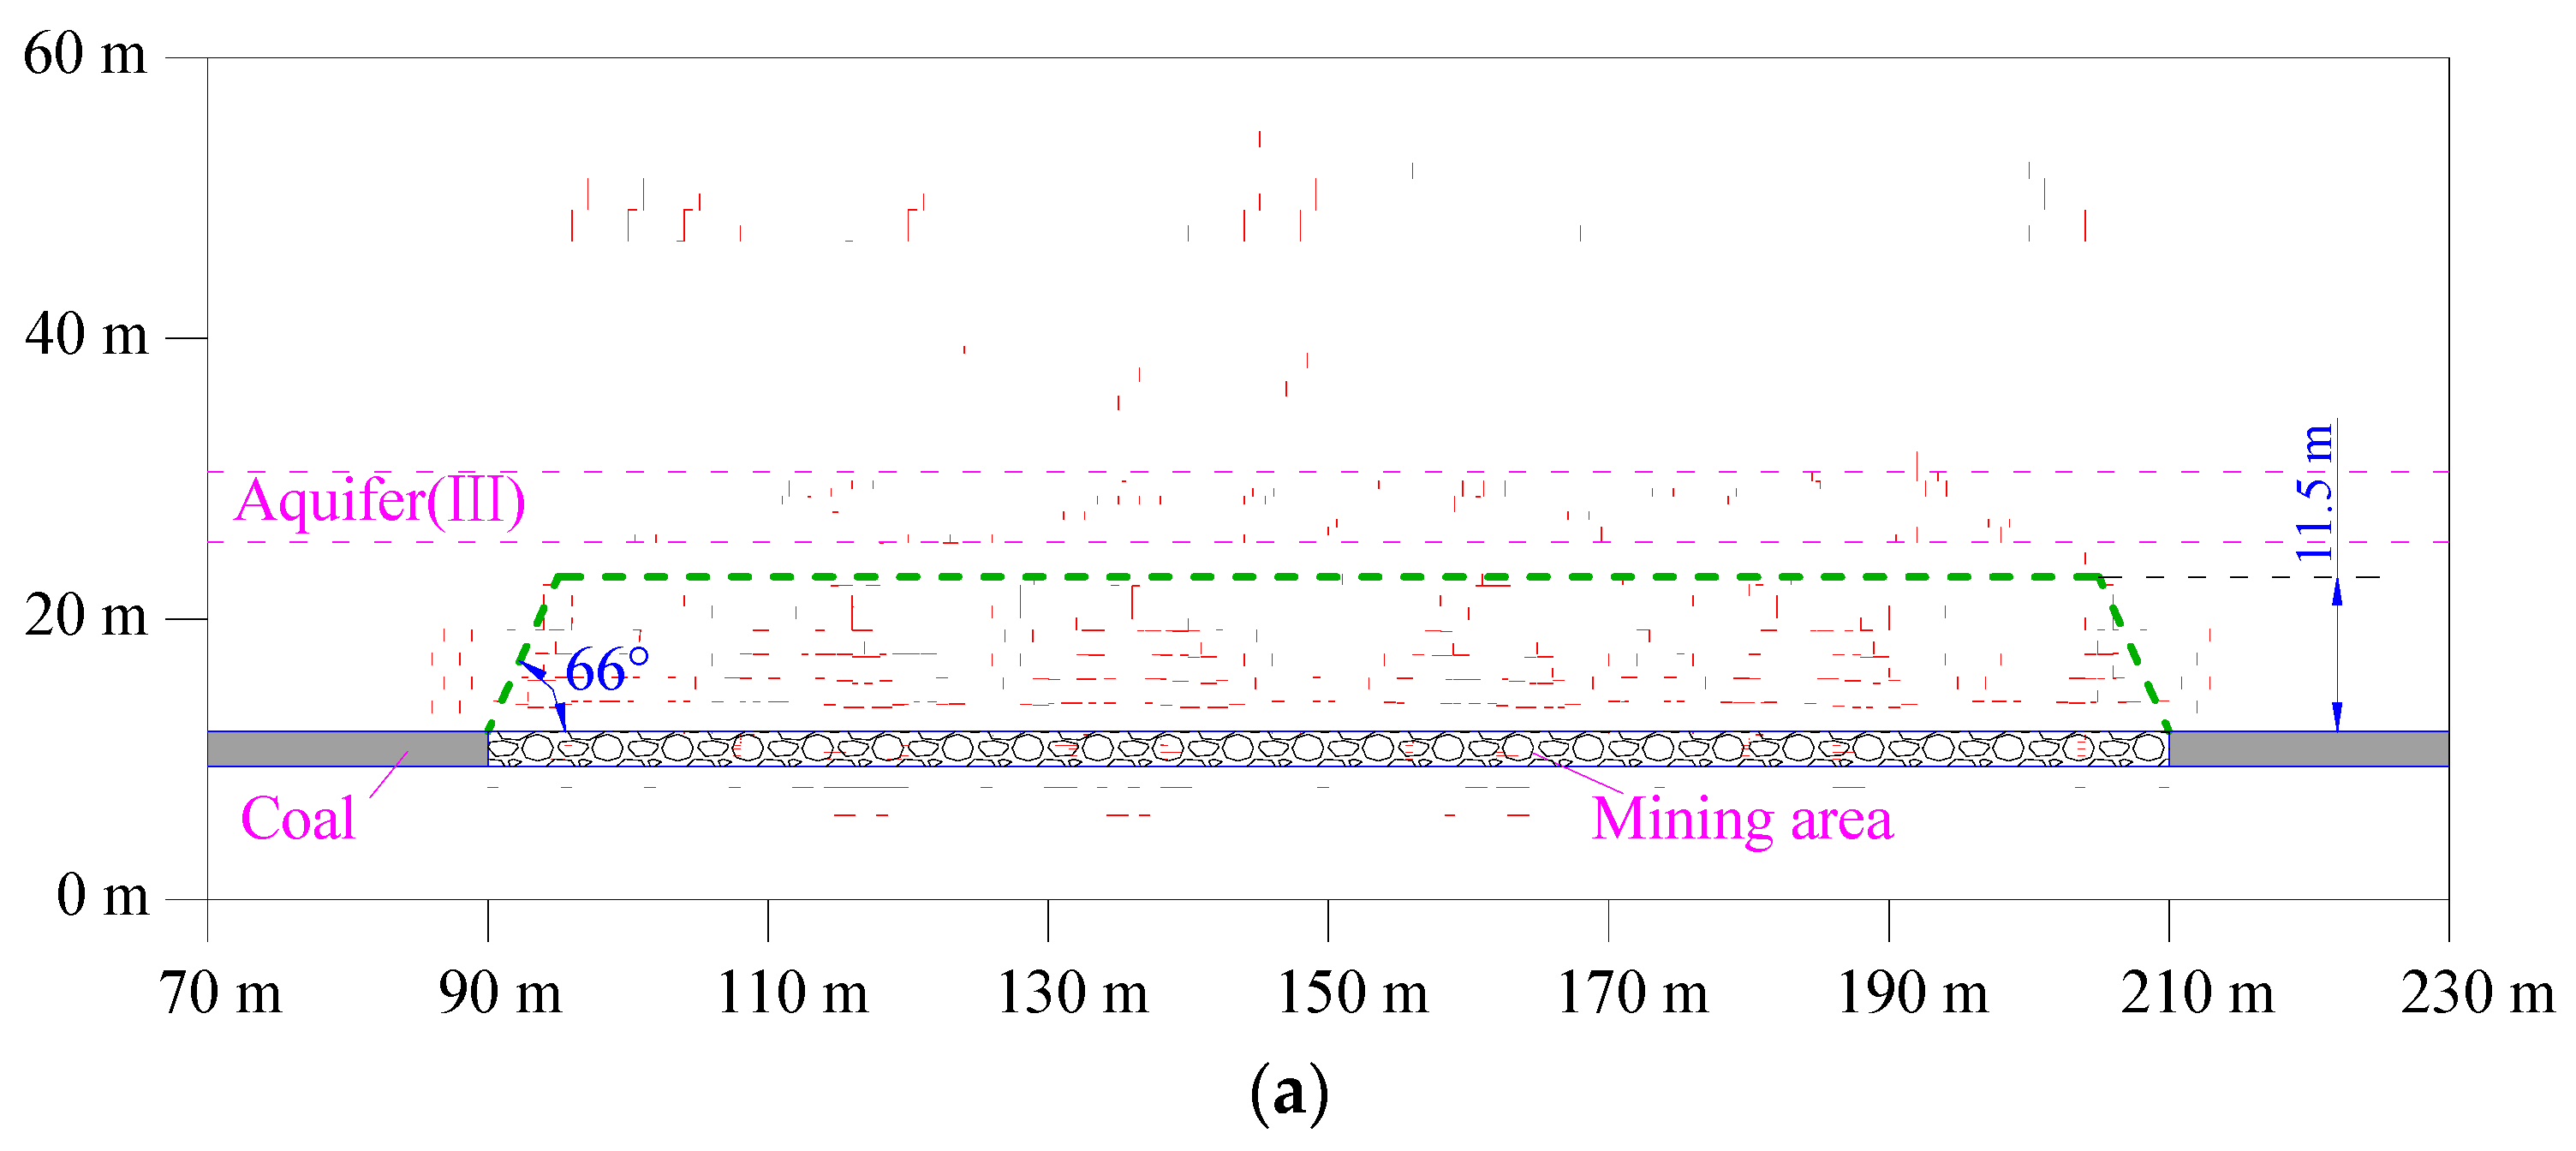
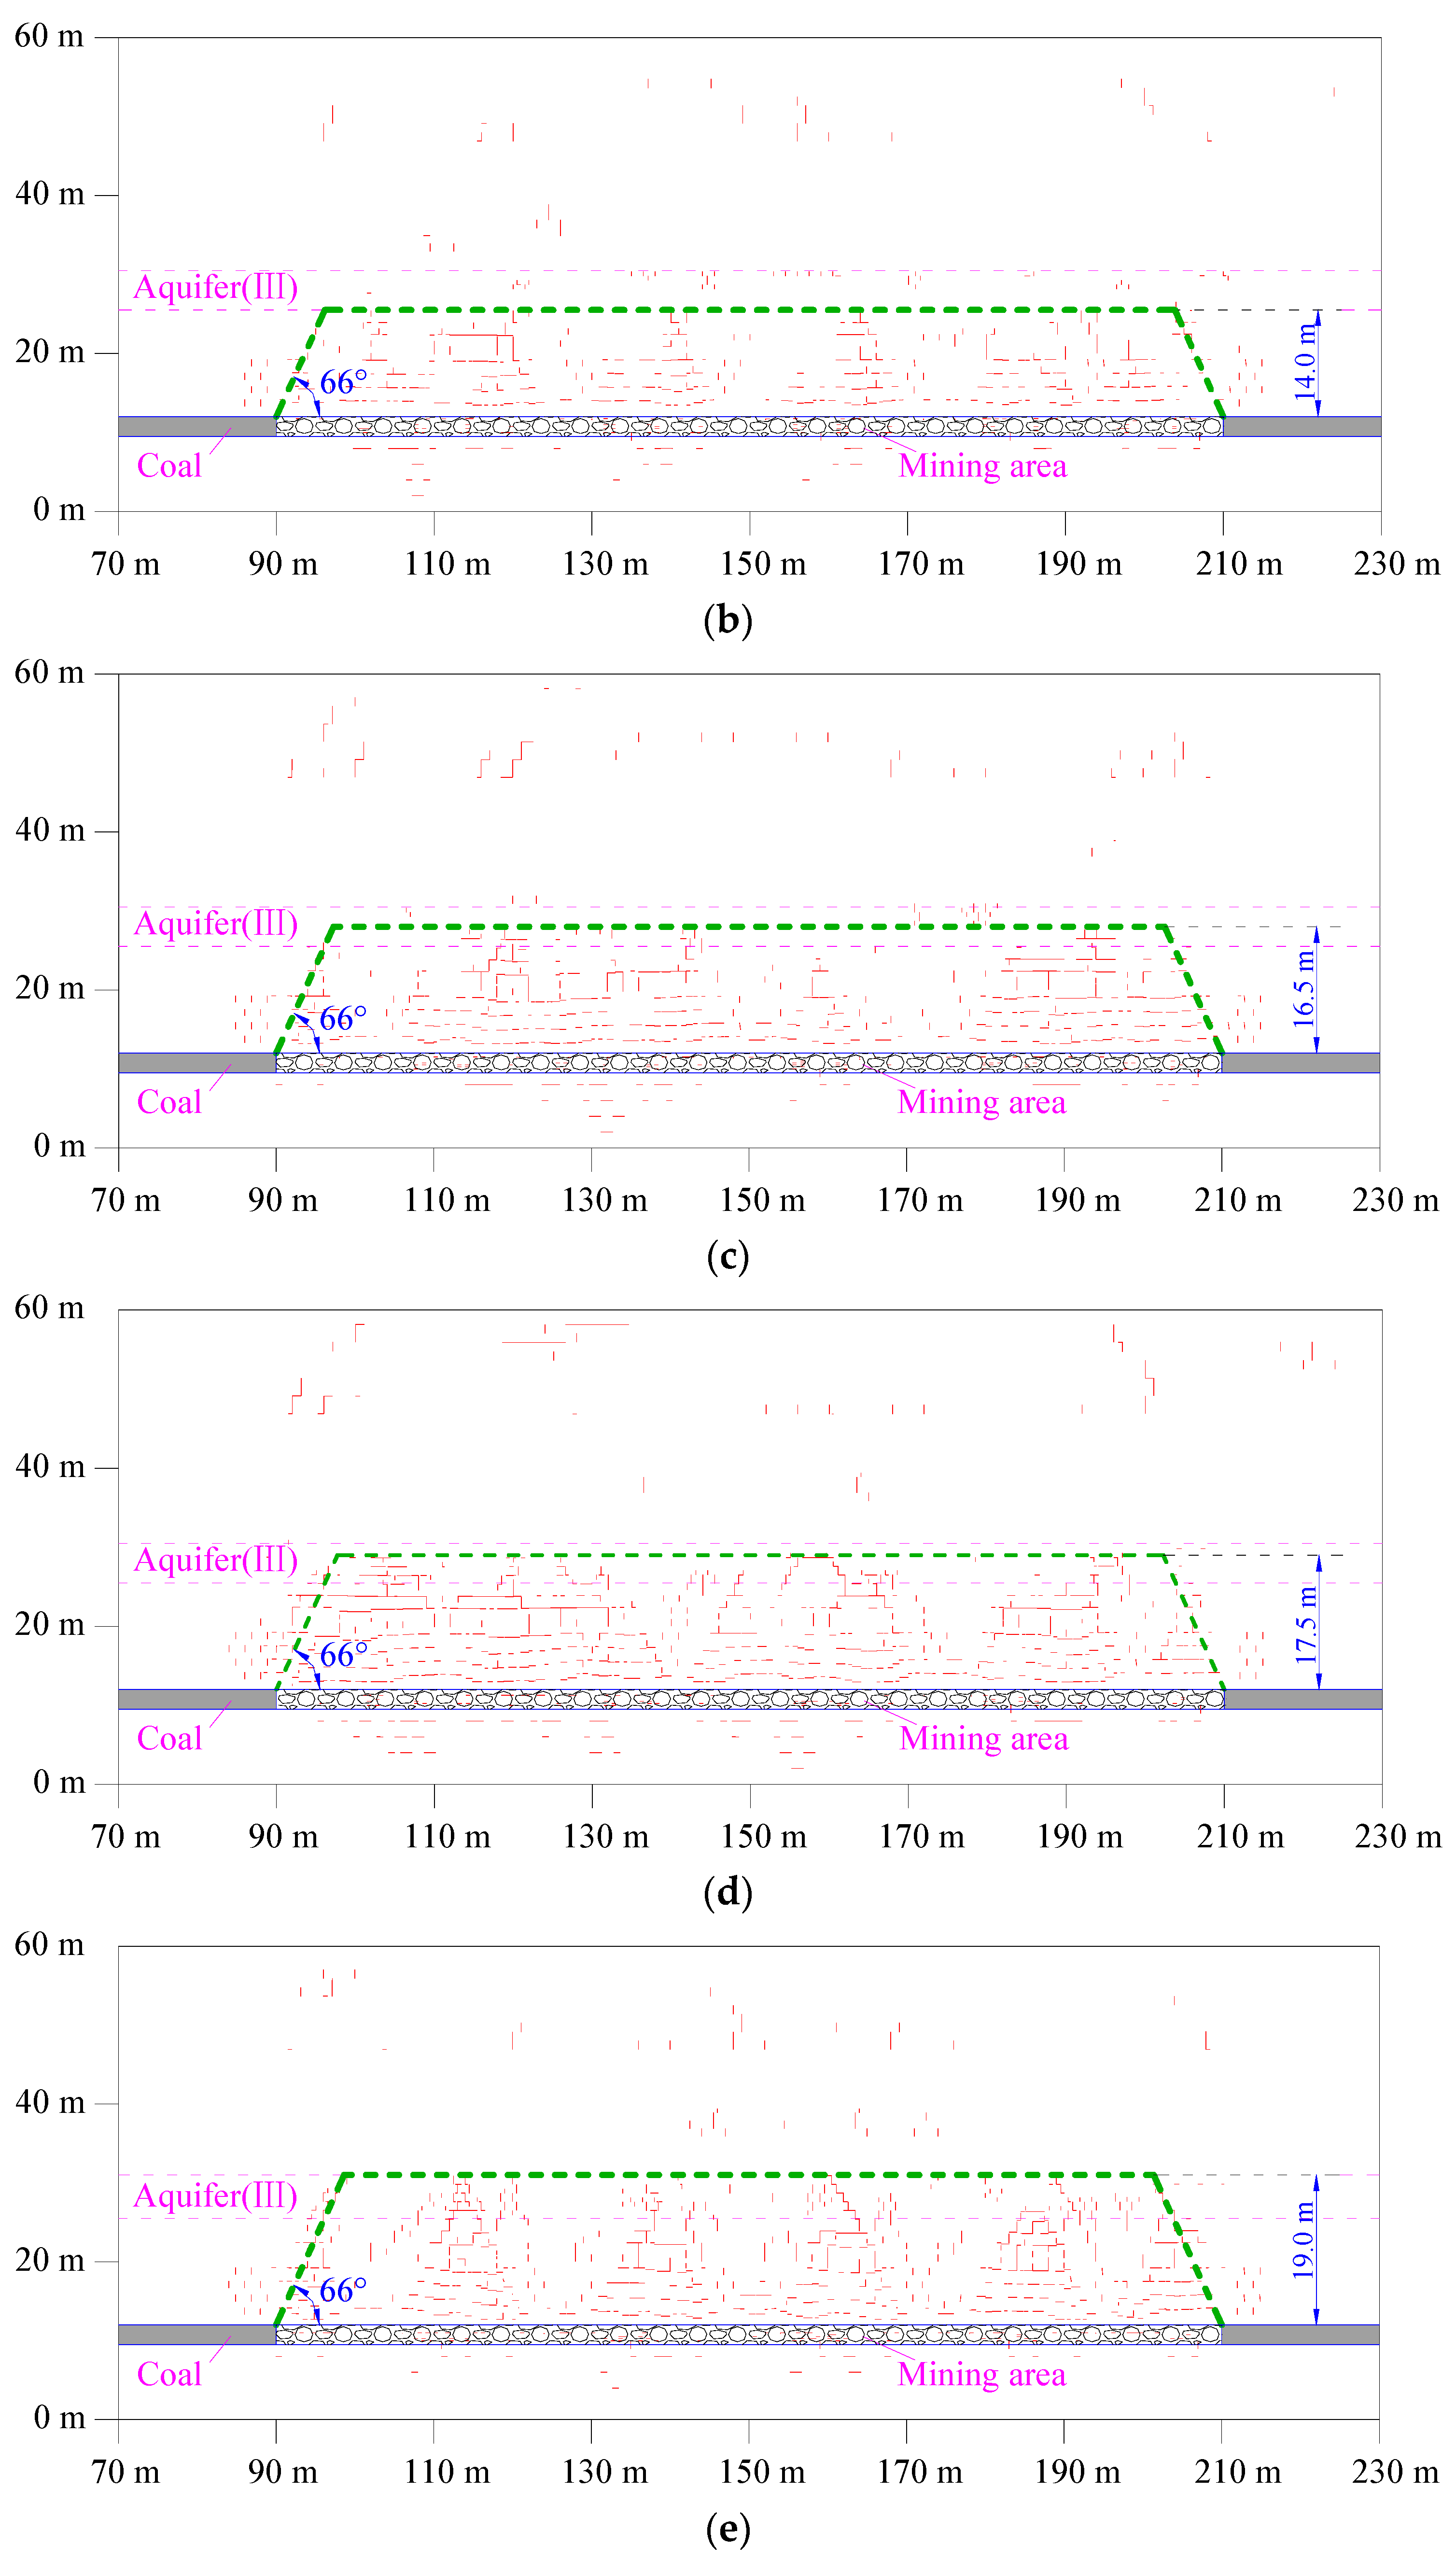
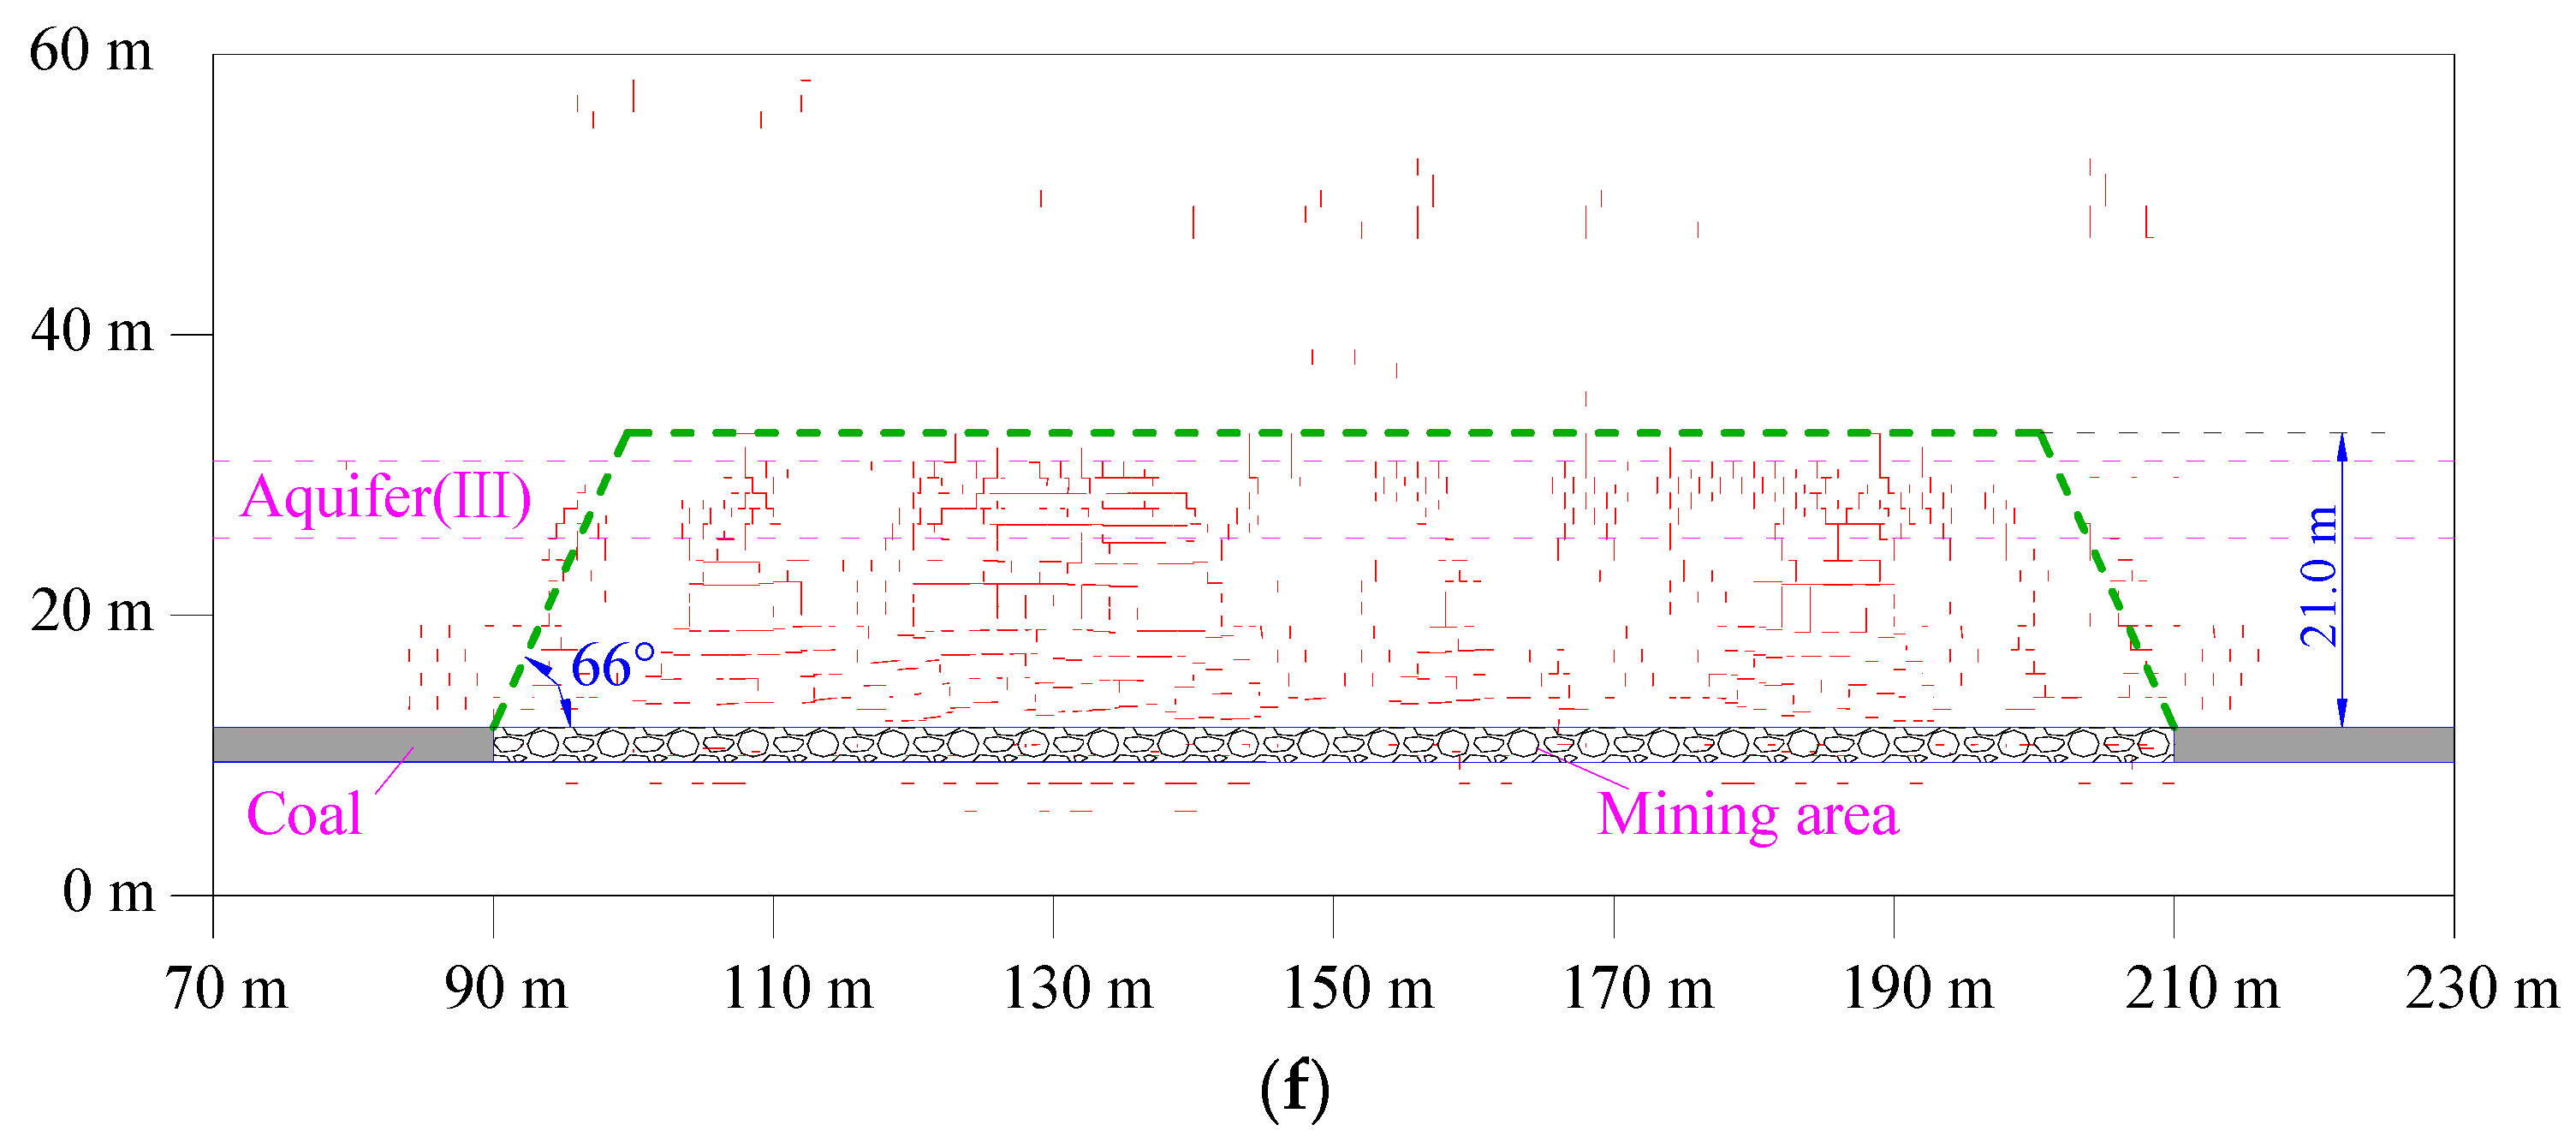
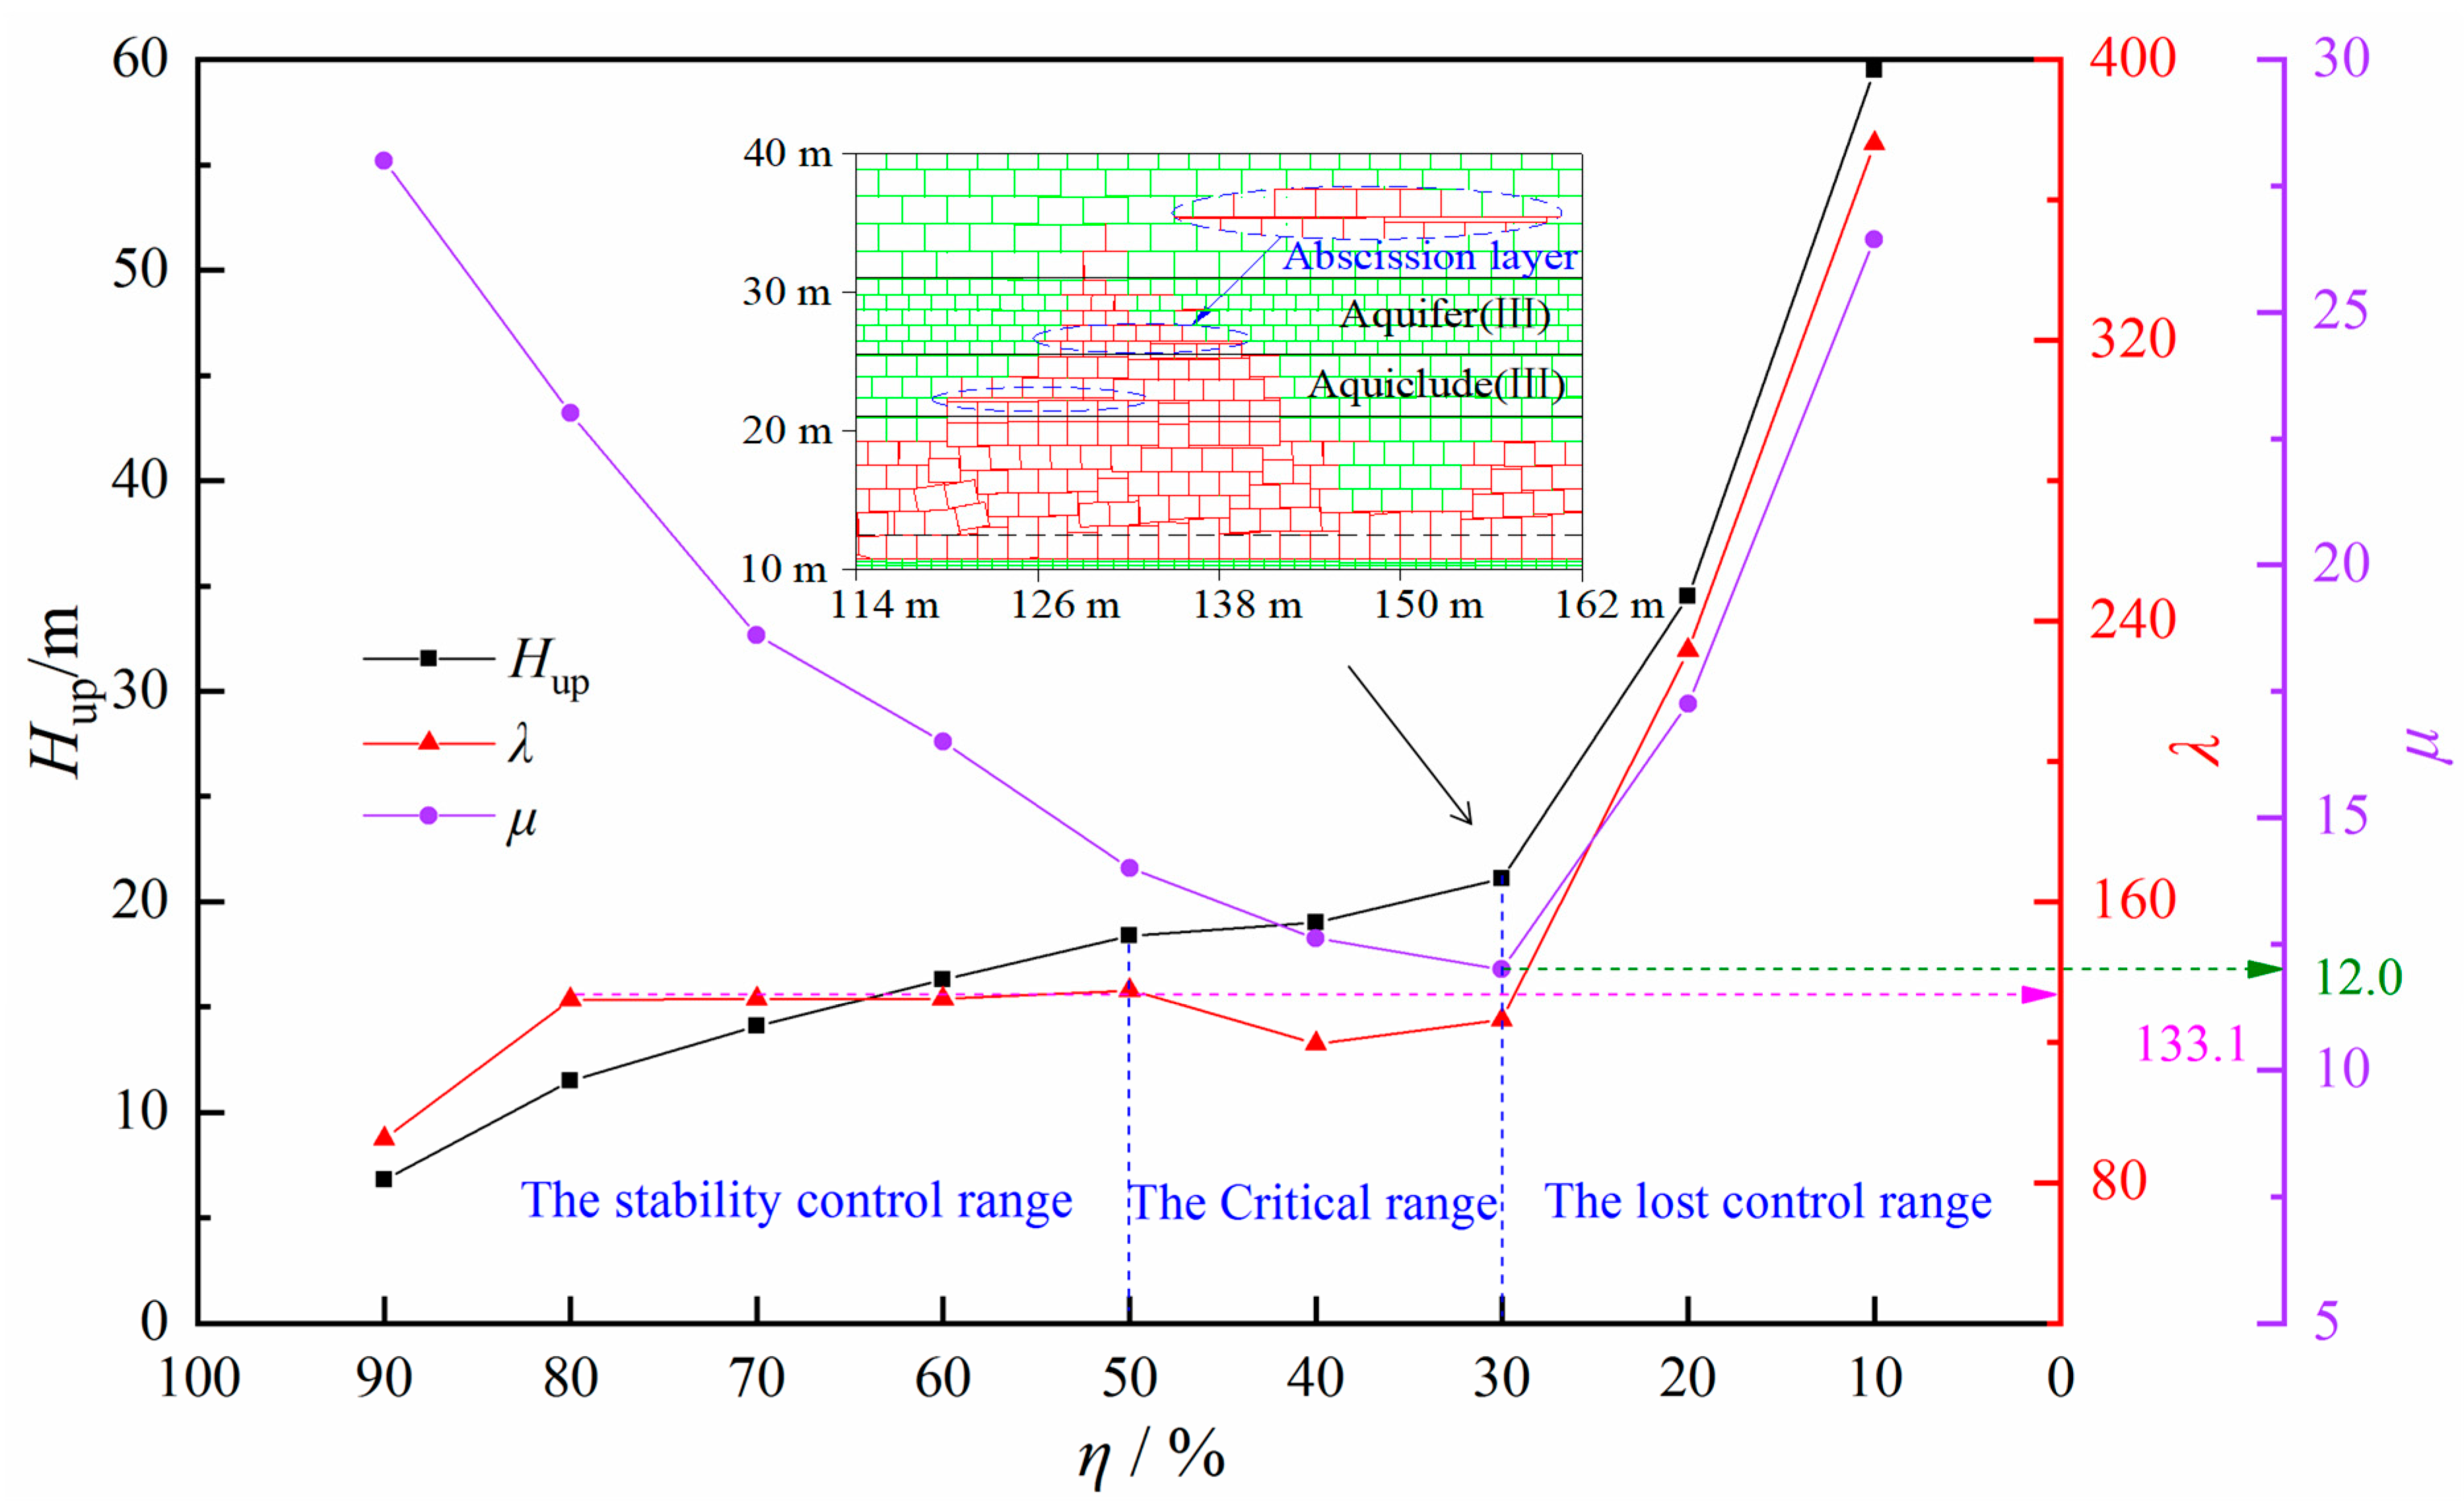
4.3. Influences of MR Filling Percentages on MIF
5. Engineering Practices
5.1. Arrangement of MRs
5.2. The Critical MR Filling Percentage
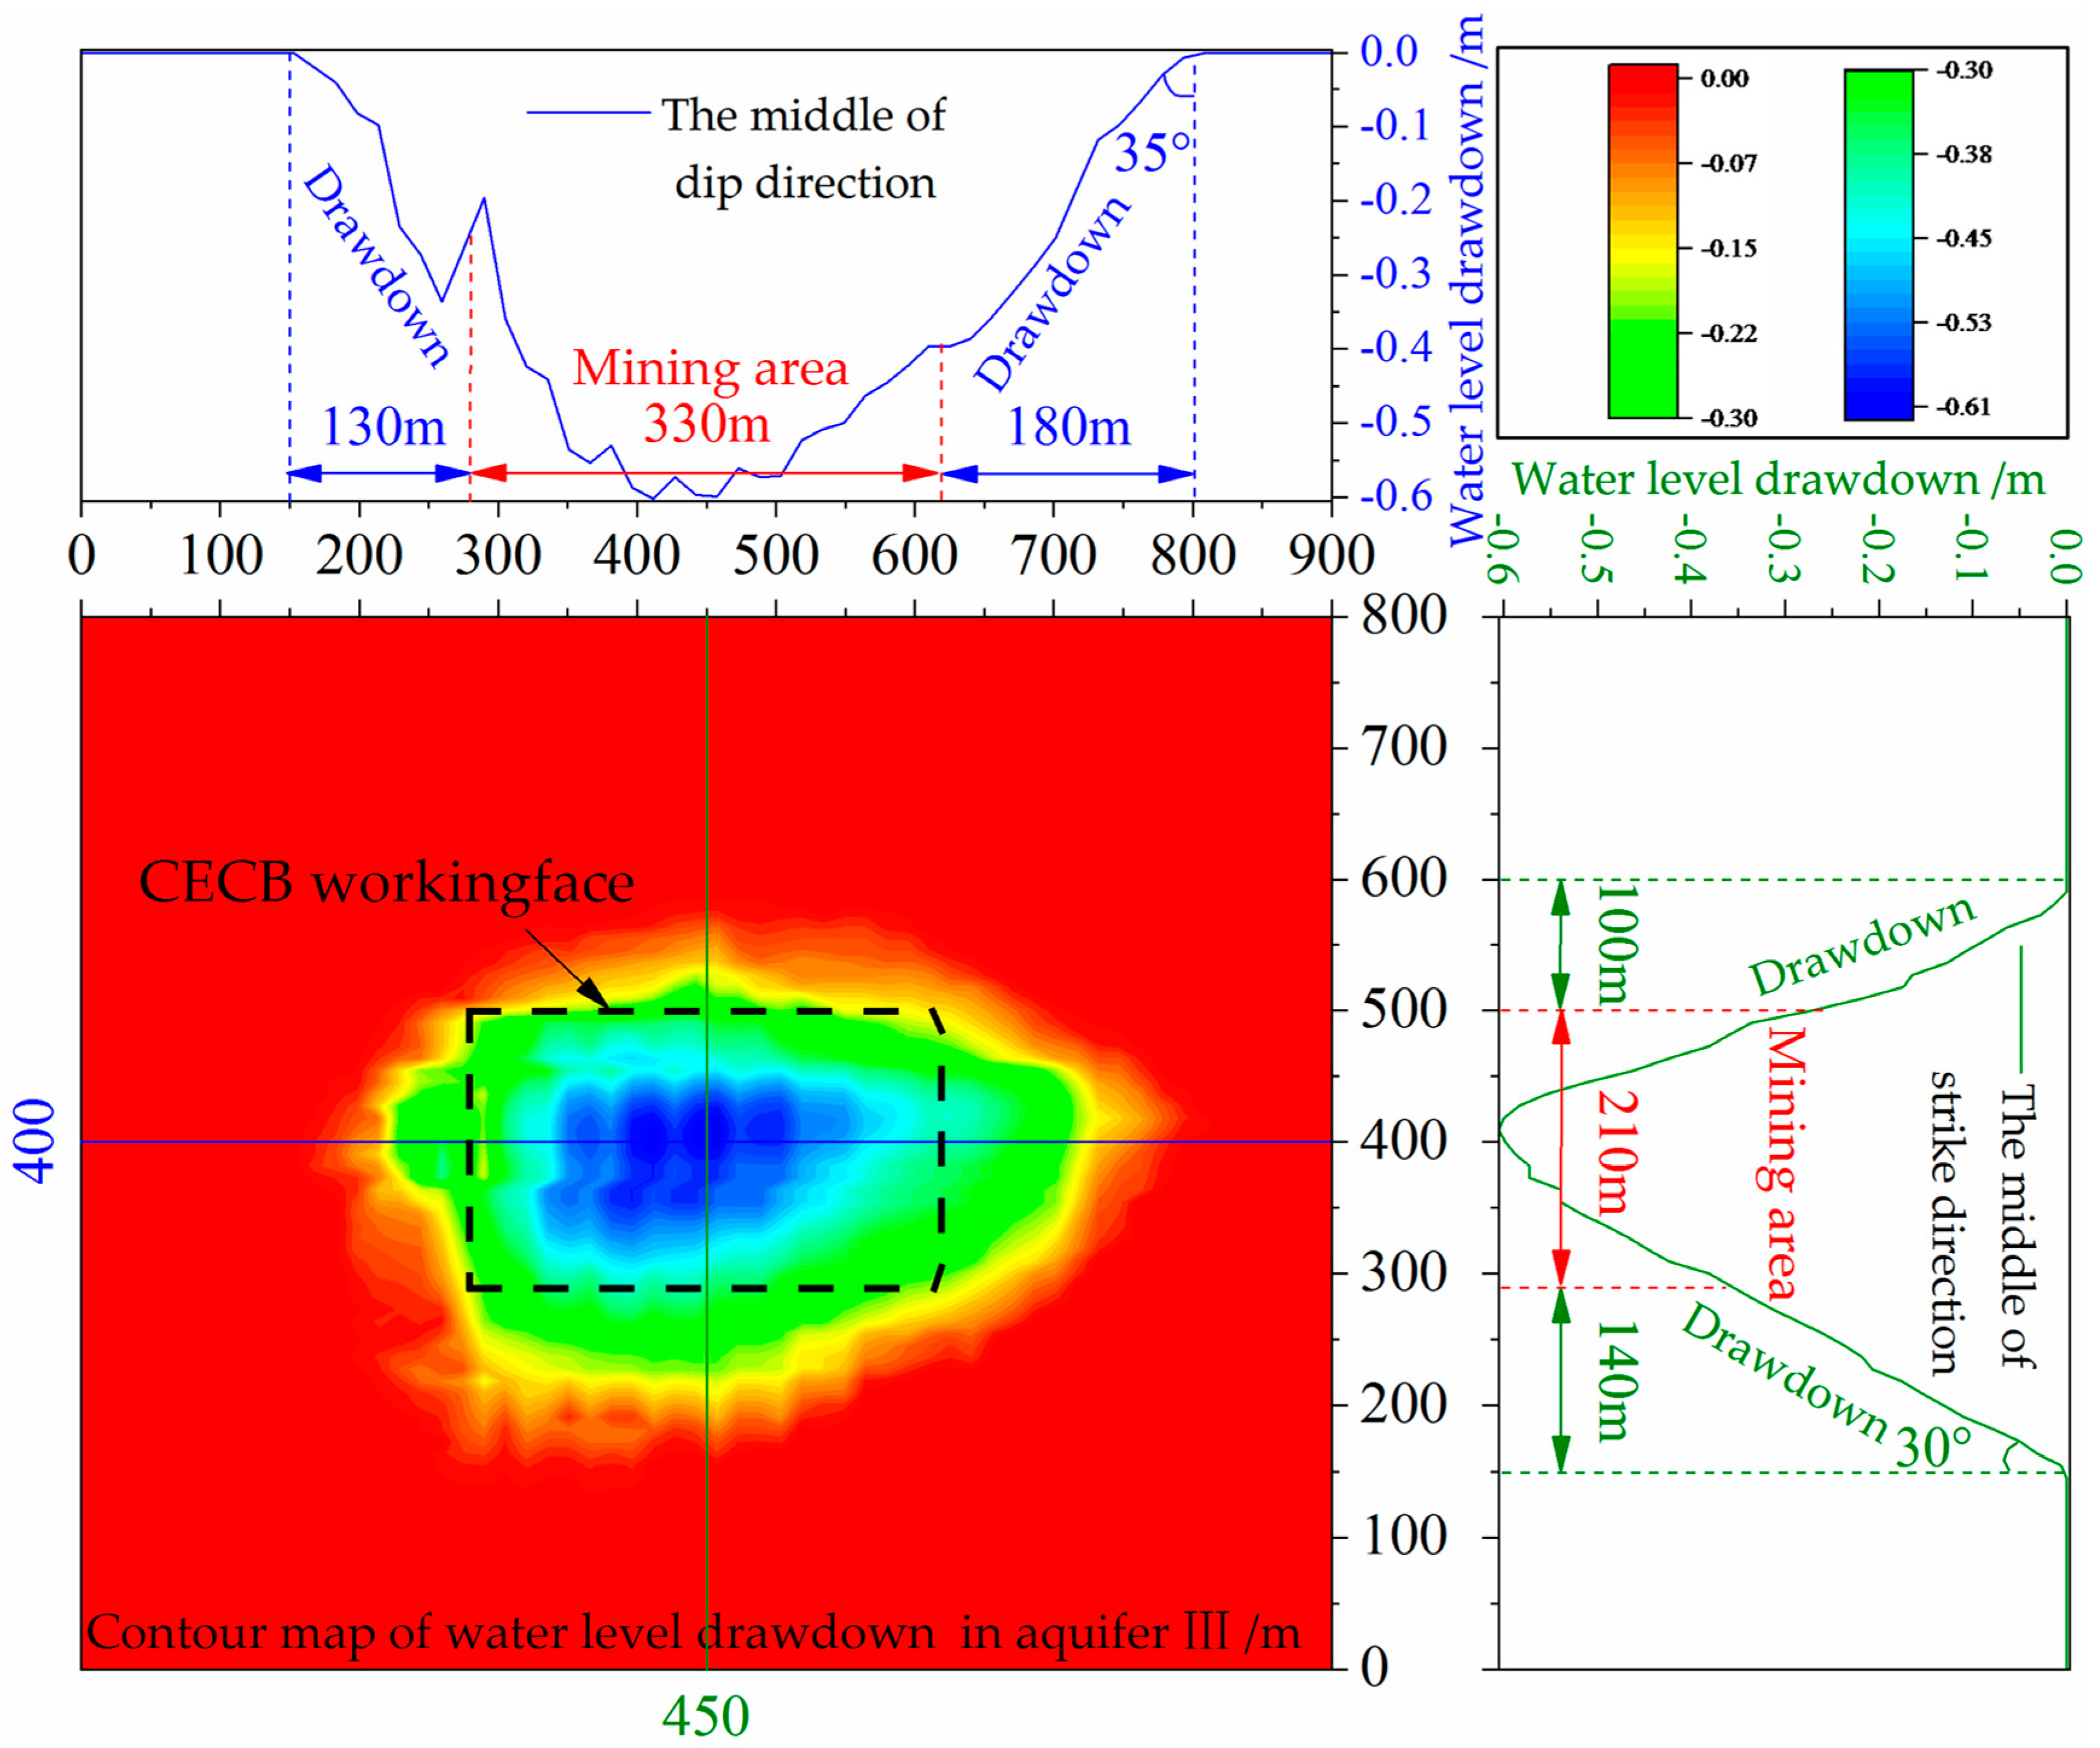
5.3. Effects of Water Conservation
6. Discussions
7. Conclusions
Author Contributions
Funding
Conflicts of Interest
References
- Xie, H.P.; Wu, L.X.; Zheng, D.Z. Prediction on the energy consumption and coal demand of China in 2025. J. China Coal Soc. 2019, 44, 1949–1960. [Google Scholar]
- Fan, L.M. Scientific connotation of water-preserved mining. J. China Coal Soc. 2017, 42, 27–35. [Google Scholar]
- Howladar, M.F. Coal mining impacts on water environs around the barapukuria coal mining; area, dinajpur, Bangladesh. Environ. Earth Sci. 2013, 70, 215–226. [Google Scholar] [CrossRef]
- Zhang, D.S.; Li, W.P.; Lai, X.P.; Fan, G.W.; Liu, W.Q. Development on basic theory of water protection during coal mining in northwest of China. J. China Coal Soc. 2017, 42, 36–43. [Google Scholar]
- Ma, L.Q.; Sun, H.; Wang, F.; Liang, J.M.; Jin, Z.Y.; Zhang, W. Analysis of the ground water level change of aquifer-protective mining in longwall coalface for shallow seam. J. Min. Saf. Eng. 2014, 31, 232–235. [Google Scholar]
- Yang, D.J.; Bian, Z.F.; Lei, S.G. Impact on soil physical qualities by the subsidence of coal mining: A case study in western china. Environ. Earth Sci. 2016, 75, 652. [Google Scholar]
- Azapagic, A. Developing a framework for sustainable development indicators for the mining and minerals industry. J. Clean. Prod. 2004, 12, 639–662. [Google Scholar] [CrossRef]
- Ma, D.; Miao, X.X.; Bai, H.B.; Huang, J.H.; Pu, H.; Wu, Y.; Zhang, G.M.; Li, J.W. Effect of mining on shear sidewall groundwater inrush hazard caused by seepage instability of the penetrated karst collapse pillar. Nat. Hazards 2016, 82, 73–93. [Google Scholar] [CrossRef]
- Gomes, C.J.B.; Costa, J.F.C.L. The environmental impact of coal mining: A case study in Brazil’s sangão watershed. Mine Water Environ. 2011, 30, 159–168. [Google Scholar] [CrossRef]
- Galhardi, J.A.; Bonotto, D.M. Hydrogeochemical features of surface water and groundwater contaminated with acid mine drainage (amd) in coal mining areas: A case study in southern Brazil. Environ. Sci. Pollut. Res. 2016, 23, 1–17. [Google Scholar] [CrossRef] [Green Version]
- Mather, J.D.; Gray, D.A.; Jenkins, D.G. The use of tracers to investigate the relationship between mining subsidence and groundwater occurrence at aberfan, south wales. J. Hydrol. 1969, 9, 136–154. [Google Scholar] [CrossRef]
- Fawcett, R.J.; Hibberd, S.; Singh, R.N. An appraisal of mathematical models to predict water inflows into underground coal workings. Int. J. Mine Water 1984, 3, 33–54. [Google Scholar] [CrossRef]
- Booth, C.J. Strata-movement concepts and the hydrogeological impact of underground coal mining. Ground Water 2010, 24, 507–515. [Google Scholar] [CrossRef]
- Li, W.P.; Ye, G.J.; Zhang, C.; Duan, Z.H.; Zhai, L.J. Study on the engineering geological conditions of protected water resources during coal mining action in Yu-Shen-Fu Mine Area in the North Shanxi Province. J. China Coal Soc. 2000, 25, 449–454. [Google Scholar]
- Miao, X.X.; Pu, H.; Bai, H.B. Principle of Water-Resisting Key Strata and Its Application in Water-Preserved Mining. J. China Univ. Min. Technol. 2008, 37, 1–4. [Google Scholar]
- Ma, L.Q.; Jin, Z.Y.; Liang, J.M.; Sun, H.; Zhang, D.S.; Li, P. Simulation of water resource loss in short-distance coal seams disturbed by repeated mining. Environ. Earth Sci. 2015, 74, 5653–5662. [Google Scholar] [CrossRef]
- Sun, Q.; Zhang, J.X.; Zhou, N. Study and discussion of short- strip coal pillar recovery with cemented paste backfill. Int. J. Rock Mech. Min. Sci. 2018, 104, 147–155. [Google Scholar] [CrossRef]
- Sheshpari, M. A review of underground mine backfilling methods with emphasis on cemented paste backfill. Electron. J. Geotech. Eng. 2015, 20, 5183–5208. [Google Scholar]
- Jiang, H.Q.; Miao, X.X.; Zhang, J.X.; Liu, S.W. Gateside packwall design in solid backfill mining—A case study. Int. J. Min. Sci. Technol. 2016, 26, 261–265. [Google Scholar] [CrossRef]
- Martin, J.; Holger, W. Progress in the research and application of coal mining with stowing. Int. J. Min. Sci. Technol. 2013, 23, 7–12. [Google Scholar]
- Tan, Y.; Guo, W.B.; Bai, E.H.; Yang, D.M.; Xu, G.S.; Yan, H. Overburden failure induced by instability of coal pillar in strip Wongawilli mining. J. China Coal Soc. 2017, 42, 1656–1662. [Google Scholar]
- Guo, W.B.; Xu, F.Y. Numerical simulation of overburden and surface movements for Wongawilli strip pillar mining. Int. J. Min. Sci. Technol. 2016, 26, 71–76. [Google Scholar] [CrossRef]
- Zhang, J.X.; Sun, Q.; Zhou, N.; Jiang, H.Q.; Germain, D.; Abro, S. Research and application of roadway backfill coal mining technology in western coal mining area. Arab. J. Geosci. 2016, 9, 558. [Google Scholar] [CrossRef]
- Ma, L.Q.; Zhang, D.S.; Wang, S.K.; Xie, Y.S.; Yu, Y.H. Water-preserved mining with the method named “backfilling while mining. J. China Coal Soc. 2018, 43, 62–69. [Google Scholar]
- Wang, A.L.; Ma, L.Q.; Wang, Z.W.; Zhang, D.S.; Li, K.; Zhang, Y.; Yi, X.J. Soil and water conservation in mining area based on ground surface subsidence control: Development of a high-water swelling material and its application in backfilling mining. Environ. Earth Sci. 2016, 75, 779. [Google Scholar] [CrossRef]
- Fan, L.M. Some scientific issues in water-preserved coal mining. J. China Coal Soc. 2019, 44, 667–674. [Google Scholar]
- Booth, C.J.; Bertsch, L.P. Groundwater geochemistry in shallow aquifers above longwall mines in Illinois, USA. Hydrogeol. J. 1999, 7, 561–575. [Google Scholar] [CrossRef]
- Booth, C.J. Groundwater as an environmental constraint of longwall coal mining. Environ. Geol. 2006, 49, 796–803. [Google Scholar] [CrossRef]
- Palchik, V. Localization of mining-induced horizontal fractures along rock layer interfaces in overburden: Field measurements and prediction. Environ. Geol. 2005, 48, 68–80. [Google Scholar] [CrossRef]
- Liu, Y.; Yuan, S.C.; Yang, B.B.; Liu, J.W.; Ye, Z.Y. Predicting the height of the water-conducting fractured zone using multiple regression analysis and GIS. Environ. Earth Sci. 2019, 78, 422. [Google Scholar] [CrossRef]
- Guo, W.B.; Zhao, G.B.; Lou, G.Z.; Wang, S.R. A new method of predicting the height of the fractured water-conducting zone due to high-Intensity longwall coal mining in China. Rock Mech. Rock Eng. 2019, 52, 2789–2802. [Google Scholar] [CrossRef]
- Zhang, J.X.; Sun, Q.; Li, M.; Zhao, X. The mining induced seepage effect and reconstruction of key aquiclude strata during backfll mining. Environ. Earth Sci. 2019, 38, 590–601. [Google Scholar]
- Huang, Q.X.; Lai, J.Q. Study on mechanical model of aquifuge beam supported by filling strip in the water preserved mining. J. Min. Saf. Eng. 2016, 33, 592–596. [Google Scholar]
- Yu, Y.H.; Ma, L.Q. Application of Roadway Backfill Mining in Water-Conservation Coal Mining: A Case Study in Northern Shaanxi, China. Sustainability 2019, 11, 3719. [Google Scholar] [CrossRef] [Green Version]
- Lv, K.; Deng, Z.G.; Xuan, Z.T.; Xiao, J.; Wu, X.Y. Surrounding rock failure mechanism of reserved roadway under superimposed mining and its control technology. J. Min. Saf. Eng. 2019, 36, 685–695. [Google Scholar]
- Huang, Q.X. Research on roof control of water conservation mining in shallow seam. J. China Coal Soc. 2017, 42, 50–55. [Google Scholar]
- Teerapharp, A.; Sontipee, A. A symplectic analytical approach for beams resting on multi-layered elastic foundations. Int. J. Mech. Sci. 2019, 153–154, 457–469. [Google Scholar]
- Ma, L.Q.; Xu, Y.J.; Zhang, D.S.; Lai, X.P.; Huang, K.J.; Du, H.L. Characteristics of aquiclude and surface deformation in continuous mining and filling with wall system for water conservation. J. Min. Saf. Eng. 2019, 36, 34–40. [Google Scholar]
- Guo, G.L.; Zhu, X.J.; Zha, J.F.; Wang, Q. Subsidence prediction method based on equivalent mining height theory for solid backfilling mining. Trans. Nonferrous Met. Soc. China 2014, 24, 3302–3308. [Google Scholar] [CrossRef]
- Miao, X.X.; Huang, Y.L.; Ju, F.; Mao, X.B.; Guo, G.L.; Zhang, J.X. Strata movement theory of dense backfilling mining. J. China Univ. Min. Technol. 2012, 41, 863–867. [Google Scholar]
- Cui, F.P.; Wu, Q.; Lin, Y.H.; Zeng, Y.F.; Zhang, K.L. Damage features and formation mechanism of the strong water inrush disaster at the daxing co mine, guangdong province, China. Mine Water Environ. 2018, 37, 1–5. [Google Scholar] [CrossRef]
- Gao, R.; Yan, H.; Ju, F.; Mei, X.C.; Wang, X.L. Influential factors and control of water inrush in a coal seam as the main aquifer. Int. J. Min. Sci. Technol. 2018, 28, 187–193. [Google Scholar] [CrossRef]


| Number | Stratum | Bulk Modulus (GPa) | Shear Modulus (GPa) | Density (kg/m3) | Friction Angle (°) | Cohesion (MPa) | Tensile Strength (MPa) |
|---|---|---|---|---|---|---|---|
| 1 | Bauxitic mudstone | 12.1 | 10.8 | 2450 | 19 | 1.0 | 1.0 |
| 2 | Coal seam | 3.9 | 2.3 | 1410 | 21 | 1.1 | 0.8 |
| 3 | Limestone | 21.9 | 18.2 | 2500 | 40 | 2.3 | 5.4 |
| 4 | Mudstone | 13.5 | 11.7 | 2350 | 23 | 1.0 | 1.0 |
| 5 | Sandy mudstone | 12.3 | 10.5 | 2400 | 22 | 1.0 | 1.0 |
| 6 | Fine sandstone | 31.2 | 20.9 | 2600 | 34 | 5.8 | 4.1 |
| 7 | Medium sandstone | 21.8 | 14.0 | 2550 | 30 | 4.3 | 2.2 |
| 8 | Clay | 8.5 | 4.2 | 2200 | 25 | 2.0 | 0.9 |
| Number | Strata | Normal Stiffness (GPa/m) | Shear Stiffness (GPa/m) | Cohesion (MPa) | Friction Angle (°) | Tensile Strength (MPa) |
|---|---|---|---|---|---|---|
| 1 | Bauxitic mudstone | 1.1 | 0.8 | 0.5 | 12 | 0.3 |
| 2 | Coal seam | 4.0 | 2.0 | 0.3 | 15 | 0.5 |
| 3 | Limestone | 1.8 | 1.2 | 0.9 | 30 | 0.6 |
| 4 | Mudstone | 0.9 | 0.7 | 0.4 | 10 | 0.2 |
| 5 | Sandy mudstone | 1.0 | 0.8 | 0.5 | 10 | 0.3 |
| 6 | Fine sandstone | 0.8 | 0.6 | 0.6 | 13 | 0.5 |
| 7 | Medium sandstone | 0.7 | 0.5 | 0.5 | 14 | 0.4 |
| 8 | Clay | 0.3 | 0.1 | 0.2 | 18 | 0.1 |
| MR Filling Percentages | 90% | 80% | 70% | 60% | 50% | 40% | 30% | 20% | 10% |
|---|---|---|---|---|---|---|---|---|---|
| Hup | 7.0 | 11.5 | 14.1 | 16.3 | 18.4 | 19.0 | 21.1 | 30.5 | 49.5 |
| μ | 92.4 | 132.0 | 132.2 | 132.3 | 134.8 | 119.6 | 126.3 | 231.6 | 376.1 |
| ΔHup | 7.0 | 4.7 | 2.6 | 2.2 | 2.1 | 0.6 | 2.1 | 13.4 | 25.0 |
| μ | 28.0 | 23.0 | 18.6 | 16.5 | 14.0 | 12.6 | 12.0 | 17.25 | 26.44 |
© 2019 by the authors. Licensee MDPI, Basel, Switzerland. This article is an open access article distributed under the terms and conditions of the Creative Commons Attribution (CC BY) license (http://creativecommons.org/licenses/by/4.0/).
Share and Cite
Wang, S.; Ma, L. Characteristics and Control of Mining Induced Fractures above Longwall Mines Using Backfilling. Energies 2019, 12, 4604. https://doi.org/10.3390/en12234604
Wang S, Ma L. Characteristics and Control of Mining Induced Fractures above Longwall Mines Using Backfilling. Energies. 2019; 12(23):4604. https://doi.org/10.3390/en12234604
Chicago/Turabian StyleWang, Shuokang, and Liqiang Ma. 2019. "Characteristics and Control of Mining Induced Fractures above Longwall Mines Using Backfilling" Energies 12, no. 23: 4604. https://doi.org/10.3390/en12234604