Review

A Review of Energy Assessment Methodology for Water Supply Systems

Institute of Environmental Engineering, Poznan University of Technology, ul. Berdychowo 4, 60-965 Poznań, Poland
*
Author to whom correspondence should be addressed.
Energies 2019, 12(23), 4599; https://doi.org/10.3390/en12234599
Submission received: 16 October 2019 / Revised: 13 November 2019 / Accepted: 27 November 2019 / Published: 3 December 2019
(This article belongs to the Section B: Energy and Environment)

Abstract

:
Energy assessment is one of the most important parts of water utility performance evaluation. In recent years, many methods for the evaluation of energy transformation in water distribution systems have been presented in the literature. The methods vary in terms of the scope and aim of assessment. The main objective of this paper was to give a review and comparative analysis of the methods for assessing the energy efficiency of water supply systems, which are described in the scientific literature and technical standards. Because the energy assessment of water supply systems is performed for different purposes, it is not possible to indicate one universal method. The main aim of the research was to present and analyze the methods currently in use. The review of different performance assessment methodologies provided information on issues related to the classification of methods, energy balancing, determination of reference values for performance assessment, the use of supporting computer tools, and the importance of data reliability. Gaps, challenges, and possibilities for future research were also described.

1. Introduction

Water supply has a crucial role in urban development. Due to the development of cities and population growth, the demand for electrical energy for water supply purposes is continually increasing. Based on various sources, it is estimated that, currently, between 3% and 6% of energy consumption is related to water transportation [1,2]. The reduction of the energy demand for water supply should be a priority in utility management. The water supply is provided by operators, which are obliged to ensure the optimal operational condition of the equipment. The performance of a water utility may be assessed by different stakeholders, including water utility managers (who are interested in optimizing processes in their systems), local authorities (which are usually responsible for the water supply and maybe the owners of water utility assets), regulatory offices (which monitor levels of service, water prices, and service quality), environmental protection agencies (responsible for protecting natural resources for future generations), customers (who are interested in good quality of service and low prices), development banks (which provide subsidies and loans to utilities), non-governmental agencies, etc. The principles and methods of evaluation of enterprises depend on the purpose and scope of that evaluation. During such evaluation, energy assessment should always be included as an important part.
In recent years, many methods for the evaluation of energy transformation in water distribution systems have been presented in the literature. Because the energy assessment of water supply systems is performed for different purposes, it is not possible to indicate one universal method. The methods vary in terms of the scope and aim of assessment. The main objective of this paper was to give a review and analysis of the methods of assessing the energy efficiency of water supply systems, which are described in the scientific literature and technical standards. The second part of the paper contains a critical analysis of methods currently in use. In the first part, the scheme of energy transformation in the water supply is presented, and the methods are briefly described. The complex description of the methods is given in Appendix A. Issues related to the classification of methods, energy balancing, determination of reference values for performance assessment, the use of supporting computer tools, and the importance of data reliability are described in the second part of the paper. In the final part, gaps, challenges, and possibilities for future research are indicated.

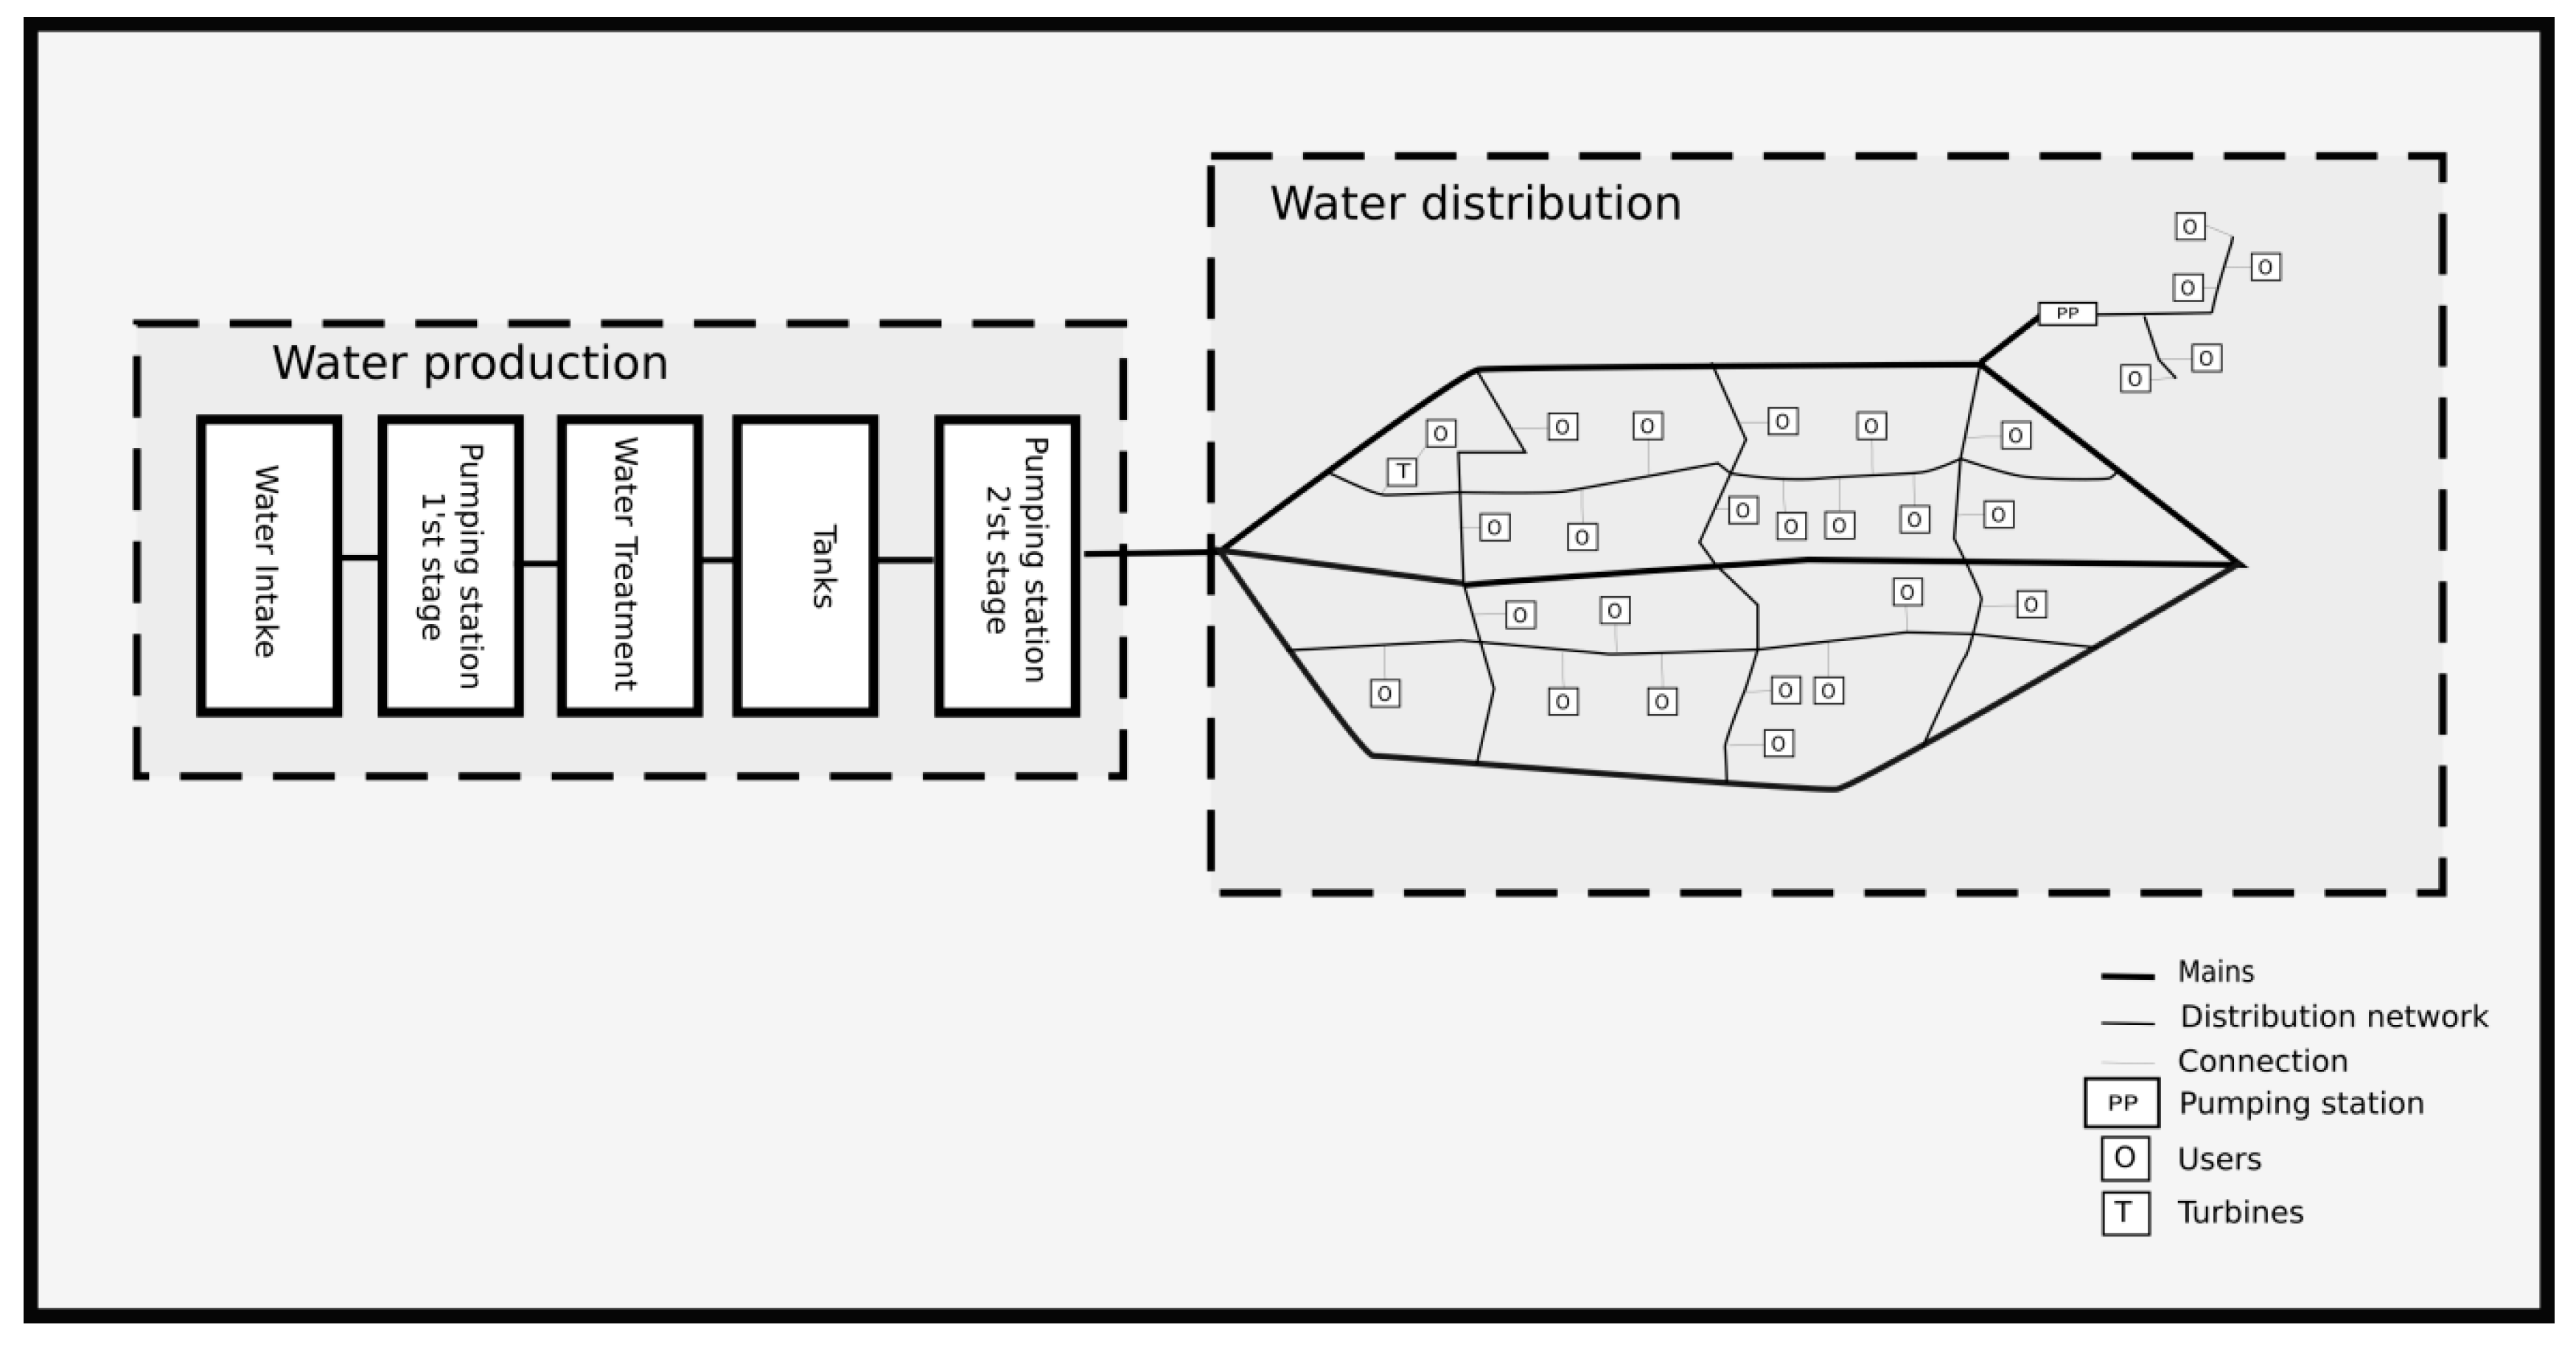
2. Energy Transformation in Water Supply Systems

In all physical and chemical processes related to water flow, energy transformations occur. The energy for a water supply system originates from a natural surface or groundwater source. This energy is described by the natural water level (e.g., streams, reservoirs, or aquifer head). Usually, this energy is insufficient to supply water to all users. It is, therefore, necessary to provide energy from other sources, usually electrical energy. This energy is transformed into kinetic and potential energy of water to ensure proper operation of the system, providing water for all users. By the second law of thermodynamics, in all thermodynamic processes, energy dissipation occurs during transformation. Energy dissipation results from imperfect energy transformation in pumps, friction in pipes, water losses, maintenance of higher pressure than required, etc. The structure of the water distribution system is presented in Figure 1. Figure 2 shows a scheme of energy transformation with the main sources of dissipation marked.

3. Review of Energy Assessment for Water Supply

The energy assessment is an important element of enterprise evaluation. The development of principles and methods for this type of evaluation is the subject of many research works and technical standards. Indicators of energy flow in water supply systems are used in various areas of assessment, most often in the evaluation of water utility operation (technical indicators). The energy assessment is also a criterion for evaluating an enterprise’s environmental impact (e.g., by calculating greenhouse gas emissions). Because the cost of electricity is one of the major components of the enterprise’s operating costs, the energy assessment is also a component of economic assessment. Moreover, energy evaluation is recommended as an element in the process of evaluation of investment plans (as a criterion for investment design).
The main aim of the research was to give revive of energy assessment methodologies of the water supply system. In points, 3.1—3.3, the methods have been briefly described. The full results of the review, with a description and references for each of the performance assessment methodologies, are presented in Appendix A. The main focus was on describing energy metrics and performance indicators. The two types of methodologies were referred to, respectively, as top-down and bottom-up. The descriptions of all methods were accompanied by remarks, case studies, and information on the types of computer tools used.
Energy assessment of a water supply and sewage company may concern all processes in the abstraction, treatment, and distribution of water, and sewage disposal and treatment. The principles and methods of this type of assessment are the subjects of work being carried out as part of larger projects on increasing the efficiency of infrastructural assets. In projects of this type, the energy assessment is carried out on a large scale (applicable to all processes in the water supply and sewage disposal system). In this kind of method, assessment can include all processes in water utilities. The energy transformation evaluation is one of the criteria of water utilities performance assessment. The performance assessment methods of the water utility, which include energy evaluation, have been described in point 3.1.
In points, 3.2 and 3.3., publications and technical reports related only to the energy assessment of the water supply system have been presented. In these methods, the energy assessment could be conducted using indicators, which are based only on data collected in water utilities. Another way of performing energy assessment is to describe processes with the use of mathematical models of physical processes. Such a model may be used to evaluate the efficiency of energy transformation. Because the construction of mathematical models requires the collection of a large quantity of data, this approach is usually applied on a smaller scale. The results are more detailed and make it possible to determine a strategy for reducing the energy requirements of particular devices. The methods based on collected data and analyzing processes of the water supply system without modeling of physical processes have been described in point 3.2. In point 3.3, the methods based on mathematical modeling of physical processes in the water distribution system have been described.

3.1. Performance Assessment Methodologies for Water Supply

One of the best-known methodologies of performance assessment of water utility was developed by the International Water Association (IWA) and described in the IWA Manual of Best Practice Performance Indicators for Water Supply Services [3]. Manual is a standard for the development of a performance assessment system for water utilities. The manual referred to 166 indicators, divided into six groups. The following indicators related to energy were specified in the physical indicators group: percentage of pump capacity used, standardized energy consumption, reactive energy consumption, energy recovery. The one energy-related indicator was classified under economic and financial indicators: electrical energy costs. Using the IWA manual, several computer applications in which this methodology is implemented, e.g., Sigma software [4] and AWAR-P [5], were developed. The manual presents a guide for implementing a performance assessment system. The indicators might be used by water utility managers, benchmarking organizations, statistical offices, and water regulation offices.
The big project about energy and performance assessment of water utility was ECAM (Energy Performance and Carbon Emissions Assessment and Monitoring Tool), a tool developed under the Wastewater Companies for Climate Mitigation project, implemented by GIZ (Deutsche Gesellschaft für Internationale Zusammenarbeit) and the IWA (International Water Association) [6]. The tools could be used to evaluate all processes in both water and wastewater systems. The main aim of this evaluation was to calculate Greenhouse Gases (GHG) emissions (CO2 emission equivalent). Two types of emissions were distinguished: direct emissions (related to fuel burning and emissions CO2, CH4, NO2 from wastewater systems and wastewater treatment plants) and indirect emissions (related to electrical energy usage, discharge without treatment, truck transport, biogas, etc.). Two levels of assessment were available: tier 1(fast and simple assessment) and tier 2 (more comprehensive and detailed assessment). In tier 2, performance indicators were calculated separately for water abstraction, water treatment, water supply, wastewater collection, wastewater treatment, effluent discharge/reuse, and fecal sludge management (containment, treatment, reuse/disposal). ECAM enabled the calculation of 18 energy-related performance indicators. Internal benchmarking could be used to assess the system (find the largest source of GHG and evaluate changes in emissions over time). For some indicators, ranges for assessment were taken from the literature. During the project, a free and open Web-based platform for water utility systems was developed.
One of the biggest projects about performance assessment of water utility was The International Benchmarking Network for Water and Sanitation Utilities (IBNET) developed by the World Bank project [7,8]. Its main aim was to provide data about water utilities worldwide for utility managers, regulators, authorities, investors, and the general public. Data were freely available to all and were published by the Web application. The performance indicators in IBNET concerned 14 areas: service coverage, water consumption and production, operating costs and staff, non-revenue water, meters, network performance, quality of service, billings and collections and financial performance, assets. For energy assessment, two performance indicators were calculated: electricity consumption per m3 sold [kWh/m3] and electrical energy costs as a percentage of operational costs. Data were sent voluntarily by water utilities; e.g., 2445 utilities took part in the survey in 2015, 769 in 2016, and 545 in 2017. All data were free and publicly available via an Internet application. Due to the wide range of the project, it was not possible to verify all of the data. The platform is an appropriate tool to perform macroeconomic analyses, but the possibilities of assessing single utilities might be limited.
The comprehensive methodologies of water utility performance assessment were developed in the AquaRating project [9]. The project has been developed by the International Water Association and the Inter-American Development Bank. In the project, 112 assessment factors were aggregated in eight groups. The result of the evaluation was an aggregated “rating” of a utility’s performance. The evaluation used both performance indicators (quantitative assessment) and good practices (qualitative assessment). The good practices were a set of recommendations for water utilities related to management. Methods of assessment were specified for each indicator and good practice, as well as the method for aggregating all of the criteria into a single “rating”. The energy assessment was carried out as part of the assessment of the implementation of eight good practices and two indicators. In the project, much attention was paid to data reliability. During the assessment, documents that confirmed data reliability should be collected. The methodology defined which documents should be checked and with what frequency.

3.2. Energy Assessment Methodologies for Water Supply

The comprehensive tool only for energy assessment in water utility was developed by the United States Environmental Protection Agency (US EPA) [10]. The EPA’s Energy Use Assessment Tool was developed to support small and medium-sized water utilities in conducting energy audits. The assessment was based on data on electricity consumption (read from meters) for all devices, such as pumps, blowers, Heating, Ventilation, and Air Conditioning (HVAC) installations, lighting, etc. The data were assigned to processes (e.g., distribution pumping, filtration, clarification, HVAC, low service pumping, etc.). The audit was recommended for a minimum period of one year (optimally five years). As part of the assessment, the trend of changes in the value of energy consumption was checked, and the most energy-consuming processes were selected. The audit enabled the assessment of changes in the value of energy consumption indicators within the enterprise (internal benchmarking). Also, energy cost data were collected for the performance of economic analyses.
The complex report about energy assessment was presented by the Water Research Foundation as “Toolbox for Water Utility Energy and Greenhouse Gas Emission Management” [11]. The main objective of the toolbox was to present a framework for energy and GHG emission assessments for water utilities. The document contains a review of energy and GHG emissions assessment programs and presents currently used models and algorithms and future research needs for energy evaluation. The sources and types of GHG emissions from water and wastewater treatment facilities were distinguished. Emissions were classified by scope designation, ownership level (direct/indirect), and contribution sources. Strategies and best practices for utilities were also presented under the project. Energy benchmarking and management tools and software were reviewed. The report was supplemented by the results of a survey on the use of energy assessment tools by different water utilities. In the report, it was shown that it was not possible to develop a single methodology for energy and GHG emissions assessment for all water utilities. A methodology should always be selected, taking into account the local conditions and aims. It was only possible to lay down general standards and good practices. The report presented a decision framework for GHG emissions’ accounting and reporting.
The interesting investigation about energy usage and water supply was jointly conducted by the American Water Works Association (AWWA) Research Foundation, California Energy Commission, and New York State Energy Research and Development Authority. The result of the work was a report “The Energy Index Development for Benchmarking Water and Wastewater Utilities” [12]. The objective of the research was to review existing energy data and assessment methods used by utilities, develop a statistical model and characteristics of energy use, apply and evaluate a benchmark score system, which is similar to the EPA’s Energy Star rating system and present case studies of the use of the metrics at sample utilities. During the research, information characterizing utilities was collected by means of a survey. The statistical model was tested to find the correlation between different parameters and energy consumption in water utilities. About 100 parameters were considered in the investigation. A combination of the six best-represented model parameters was found. Using this parameter, the water utility energy model was developed as a function.
Big study about the relation between water and energy was presented by the Alliance to Save Energy in the report: WATERGY: Energy and Water Efficiency in Municipal Water Supply and Wastewater Treatment—Cost-Effective Savings of Water and Energy [13]. WATERGY is a project concerning the relationships between water and energy in all elements of a water and sewage system. The report described all elements of the system (devices and processes) in which significant amounts of energy were consumed. The report recommended an energy audit for all devices. It was stated that in order to increase energy efficiency, three elements were necessary: (1) political will, (2) technical and economic analysis, (3) implementation. Attention was also paid to ways of financing investments related to improving energy intensity, e.g., through performance-based contracts. The study did not present an energy assessment methodology but described general principles of conducting these types of audits.
The interesting research about energy assessment methodologies was presented by Baki and Makropoulos [14] as an Urban Water Operating Tool (UWOT) [15] software. In this software, a “library” of specific (unit) energy consumption was defined. The authors proposed using unit values (kWh/L) to assess all processes, which are connected with energy transformation in the water supply. The main advantage of the presented methodology was the possibility of easy comparing different scenarios of system development using computer software. For these scenarios, opportunities for energy demand reduction could be identified. The system facilitated the identification of the elements, which required the most urgent modernization. The methodology enabled the analysis of such objects as pumping stations and turbines. It was mainly the results of measurements that were analyzed (computer models of water transport systems were not analyzed). In the research, a large case—the example of Athens (about 6 million inhabitants)—was analyzed.
The project about energy assessment of the water supply system conducted on a wide scale was presented in the Brazilian National Sanitation Information System report [16]. In this methodology, the classification of water supply systems was based on energy efficiency. In the study, the authors presented the example of the classification of systems based on indicators calculated from data obtained by the Brazilian National Sanitation Information System. Six performance indicators were used in this paper: efficiency index, reservoir capacity, roughness index, connection loss index, specific consumption of electricity, and macrometering index. Some of the indicators were identical to indicators collected by SNIS (the national system of information on sanitation in Brazil) [17] and indicators from the IWA performance indicators guidelines [3]. The authors presented the values of indicators for various water utilities in Brazil. A case study covered 4941 water utilities and was developed using data from SNIS. Because SNIS did not collect all of the indicators and additional measurements need to be performed, not all indicators were calculated for the 4941 utilities. A full case study (with all indicators) was given for 21 pumping stations.

3.3. Energy Assessment Methodologies for Water Supply—Based on Modeling of Physical Processes

One of the first studies in which authors proposed physical modeling for an energy assessment of water supply was presented by Pelli and Hitz [18]. The research was carried out in selected cities in Switzerland. The article proposed indicators for assessing the efficiency of energy use in water supply systems. The concept was based on a definition of minimal energy (Emin), which was needed to ensure water supply. The minimal energy is defined as “the least energy theoretically needed (without friction or pumping loss) to transport the water from its production locations to the users, at an operational pressure of about 6 bar (88 psi).” Using the concept of minimum energy, indicators characterizing the water supply network were defined: structure indicator (describes the structure of the water supply network, and is defined as the minimum amount of energy needed to inject 1 m3 of water into the network);quality indicator (describes how efficiently the energy is used in a particular system/utility). In this paper, the ranges for assessing the quality indicator were presented. The authors presented several case studies from Switzerland (mountain regions), where there is a possibility of recovering significant amounts of energy from the distribution system. Attention was drawn to the benefits of using performance indicators to assess the potential for the recovery of energy from the water supply network. In the article, the factors influencing the energy quality indicators were analyzed. The possibilities of saving energy through better network design and rehabilitation (cleaning of pipes, replacement of pumps) were emphasized.
The complex energy balance for the water supply system was presented by Cabrera et al. in the article: “Energy Audit of Water Networks” [19]. This article described a methodology for performing energy audits of water networks. The method was developed using the energy conservation law (Bernoulli equation). The audit was performed with computer models of water supply networks. Analyses made it possible to evaluate indicators for water supply system assessment, which could be used for better planning of action to increase energy efficiency. The paper presented the components of the energy audit and equations for calculating their value. On the basis of the energy audit, five indicators were determined for a water supply system: excess in supplied energy, network energy efficiency, energy dissipated through friction, leakage energy, and standard compliance. The article was supplemented with a case study with the calculation of water audit values and indicators for a simple water supply network (consisting of 10 nodes, a pump, and two tanks). Based on research the authors developed a computer tools for perform energy audit: ITA Energy [20].
The additional performance indicators for a pressure water supply system were presented in the Energy Assessment of Pressurized Water Systems [21]. In the research, new performance indicators for the Energy Audit of Water Networks [19] were presented based on the concept of the “ideal system”. In the article, an “ideal system” was defined as a system with no friction, head losses, leaks, or excess pressure. In the research, three new performance indicators were presented: the efficiency index of the ideal system, with full energy recovery; the efficiency of an ideal system, without energy recovery; the efficiency of a real system. The difference between the efficiency of an ideal system and the efficiency of a real system was used for performance assessment. By evaluating changes in this difference over time, one could define and monitor goals for improving energy efficiency. The paper was supplemented by the presentation of methods for improving the energy efficiency of a system and case study.
The energy audit was used to determine indicators for classifying the water supply system based on energy criteria. The publication “Towards an energy labeling of pressurized water networks” [22] described procedures to minimize energy consumption in a water distribution system and methodology for labeling water energy usage in water supply systems. The authors proposed a six-stage methodology for energy improvement in a water system: (1) basic diagnostics, (2) water audit, (3) energy audit, (4) analysis of operation actions, (5) analysis of structural action, (6) label the efficiency of the pressurized water system. A case study concerned an orange irrigation system in Cap de Terme, Villarreal (Spain). The authors did not describe the methodology of energy labeling of water distribution systems but stated that the development of this methodology was the main objective of a new European Commission (EC) directive project [23,24,25], which is now under evaluation.
The more comprehensive research about energy labeling of water supply system was presented in publication: Labeling Water Transport Efficiencies [2]. The main contribution of this paper was a global energy score (IS), which is a combination of several metrics. The global energy score could be calculated, including water loss, energy dissipated through friction in pipes, energy pumping station losses. For assessing this value, the references were obtained using economic level of leakage (ELL) [26] and infrastructure leakage index (ILI) [27] for leakage energy losses; economic level of friction (ELF) [28] for friction energy losses; minimum efficiency index (MEI) and energy efficiency index as defined by the European Commission [29] for pumping station losses. The article described a detailed methodology for calculating components of the global energy score. The authors presented a case study using a simple network with 13 pipes, 10 nodes, two pumps, and a reservoir.
The complex and comprehensive version of energy balance was presented by Mamade et al. [30]. Research presented energy balance and performance indicators for assessing water distribution networks. The authors described the novel features of their audit method and differences between their energy balance and previous ones (e.g., Cabrera et al. [19]). The methodology was based on three stages: 1. System characterization and data collection, 2. Perform energy balance, 3. Assessment of energy performance indicators. The authors indicated that the Ph5 indicators (from the IWA Manual [3]) and specific energy consumption could be calculated as performance indicators. They proposed the following additional performance indicators: energy in excess per unit of authorized consumption, natural energy in excess per unit of authorized consumption, shaft energy in excess per unit of authorized consumption, and ratios of the energy in excess (total, network, pumps, and losses). Two types of assessments were proposed: simplified and complete. The simplified assessment did not require modeling. During the complete assessment, the EPANET model of a water distribution system could be used to calculate the energy balance values. The simplified energy balance was tested for 17 water utilities in Portugal, and it was shown that there was significant potential for energy saving in the water sector through reductions in water loss, changes in the network operation layout, and reduced pump inefficiency. The complete assessment was performed using a calibrated model of a water distribution system supplying water to 62,306 consumers in southern Portugal. The simulation was made for one year, considering winter and summer daily consumption patterns with a 15-min time interval.
The energy balance for the water supply system was presented by Walski [31]. The balance was obtained using the law of energy conservation. A computer model of a water distribution system was used to calculate the values of energy balance. Two case studies for the energy balance were presented. It was emphasized that it could be difficult to compare energy balance values between systems because each system has specific characteristics. It was also necessary to collect a large quantity of data to perform an audit. Because of this, the authors stated with regard to the energy balance: “it is not certain whether this can become a practical engineering tool” [31]. It was pointed out that the minimization of energy losses might be profitable only for water mains. The authors pointed out that in some countries, such as the United States, networks are designed for fire conditions, and therefore the values of energy losses due to friction in pipes are usually small or negligible. The energy balance can be used to better describe the network, but, in engineering practice, the derivation of the balance will not in itself increase energy efficiency. Increased efficiency is possible only through corrective actions. In some cases, the preparation of a balance might support the planning of such tasks.
The big case study about using energy balance to describe the water distribution system was presented by Dziedzic and Karney [32]. In this research, based on computer modeling, aggregate indicators of capacity, efficiency, and costs were given. The authors presented energy balance and equations for calculating values. The case study concerned a skeletonized model of the Toronto water distribution system. The system consisted of 6000 km of water mains and served a population of 470,000. The article included a graph of daily energy dissipation due to different causes in two scenarios: winter and summer. Also, the daily cost of energy and the amount of CO2 produced were presented. The calculated metrics for all pipes were shown on maps.
The energy balance can be used for developing performance indicators. Lenzi et al. [33] developed new indicators on the basis of the energy balance described by Cabrera et al. [19]. The following aggregated performance indicators were proposed as additions to the energy balance: water supply energy efficiency, network energy efficiency and leakage energy efficiency, pumping energy efficiency. The methodology was tested in two case studies. The first concerned one of Ganaceto District Metered Area (DMA), part of the water distribution system in Modena, Italy, with a 35.37 km network, serving a population of 2925. The second was for Marzaglia DMA, part of the Modena system with a 5 km network, serving a population of 1247, with two variable-speed pumps.
An interesting study about performance indicators metric was conducted by Gay and Sinha [34]. They presented an energy efficiency metric for raw water extraction in an urban water supply system. The authors gave a score based on the ratio between minimum and actual energy usage in water utilities. This approach was contrasted with a benchmarking method based on an empirical approach. The mechanistic approach was based on analyzing the energy requirements of each asset in the process. The scope of the research was limited to raw water pumping. The thermodynamic score was defined as the minimum required energy and actual energy use. The minimum required energy was the energy supply to the system when the system worked in the ideal conditions, defined as follows: water is delivered at zero pressure, water loss is zero, wire-to-water pumping efficiency is 100%. The authors used the Darcy–Weisbach equation to calculate friction loss. A case study for eight voluntary water utilities in Virginia was described. The result obtained for the thermodynamic score was compared with an energy benchmarking methodology [12]. The authors compared the two methods and showed the advantages and disadvantages of each. Both types of the methodology are needed for a good and complete assessment.
The analysis of thermodynamic transformation in the pumping station was also described by Vilanova et. al. [35]. The authors proposed a methodology for calculating energy efficiency indicators for pumps. The main aim of the research was to create new energy effectivity indicators. The main reason for undertaking the research was problems with using standard energy consumption indicators (unit energy consumption per m3). The proposed indicators were developed using the general definition of effectiveness, described as the ratio of the targeted effect on the number of resources necessary to implement the process. The following performance indicators were proposed: theoretical global energy efficiency (ratio between energy delivery to the user and total energy consumed by the system);potential global energy efficiency (ratio between minimum energy necessary to meet consumer demand, assuming that there is no pressure excess at any junction and total energy consumed by the system);global energy efficiency indicator (ratio between target-value energy, the minimum energy supplied to the system assuming that the system is operated optimally in technological terms. This value is obtained through optimization and current energy consumption). The authors proposed a general energy efficiency indicator. This indicator described how the current situation (value of indicators) corresponded to the optimal hydraulic conditions of operation. The analyzed case study concerned a simple system consisting of a pump and a reservoir. In the study, the potential gains from the optimization were calculated. The authors gave examples of methods for determining optimal pump operating conditions. The study was supplemented by guidelines for improving energy efficiency in the water supply systems.
The study with detailed analyses of energy loss in pipes was presented by Speight [36]. The research considered the impact of pipe roughness on the amount of energy consumed in the process of pumping water and the impact of system rehabilitation on increasing the energy efficiency of the system. Potential energy savings for various recovery plans for the water supply network were analyzed. The Hazen–Williams equation was used to estimate head losses in pipes. The methodology entailed comparing different scenarios of system modernization and calculating the percentage change in energy dissipation for each scenario. A computer model of a water distribution system was used to support this task. The research was conducted using real data for a system consisting of 28 pumping stations, 5900 km of network, and 121 pumps, which pump 530 megaliters of water per day, supplying the one-million population of a city in the Midwestern United States. The case study showed that even in the case of a large system, the savings from pipe rehabilitation would be small. The authors calculated the possible savings at only 0.7% to −0.2%. For some scenarios, network renovation might increase the energy consumption of the entire system.
The research about the impacts of pipes on energy was also presented in the publication: “Pipe-level energy metrics for energy assessment in water distribution networks” [37]. This article described the energy balance for a single pipe in the distribution system. Using the balance, the authors proposed the following performance indicators, describing the efficiency of energy use in the water supply system:
-
Efficiency metrics—describe the water supply energy efficiency (M1—the ratio between energy delivered to the user and energy supplied to the system and M2—the ratio between energy delivered to the user and the net energy in the pipe),
-
Requirements metric—defined as the relationship between the required energy to be delivered to users (to fulfill water network requirements) and the amount of energy supplied to users. This indicator describes the pressure excess in the water supply network,
-
Energy loss metrics—describe the relationship between energy loss and energy supplied to the pipes: M4—includes the part of energy loss connected with friction, but only for water flow, which is delivered to users and M5—includes the part of energy loss connected with friction, for water flow delivered to users and for water flow lost due to leakage.
The article presented example calculations of the energy balance and performance metrics for the water supply networks. Two case studies were presented. The first concerned a network with 12 pipes with a total length of 19,260 m. The second concerned the network reported by Cabrera [19] with 14 pipes totaling 40 km. Numerical values of the calculated indices were given, but no rules for their evaluation (acceptable values) were defined.
For assessing the total amount of energy consumed during the production, operation, and disposal of water transport lines, the life-cycle analyses were used. These kinds of analyses were presented by Filion etal. [38] According to the methodology, the total amount of energy was defined as a sum of energy used during pipeline production, use of the pipeline, and the disposal phase. The author used a unit energy consumption for the production of a given material, published by the U.S. Department of Commerce. The energy loss due to friction (in use of the pipelines phase) was calculated using a computer model of the water distribution system. Case study analyses were carried out, for example, simple water supply networks consisting of 16 and 20 nodes (the New York Tunnel problem). A sensitivity analysis was also carried out—the authors showed how the final result (the total amount of energy consumed) was affected by changes in the model parameters, such as pipe roughness.
The life-cycle analysis for energy usage in the water distribution system was presented by Nault and Papa [39]. In the research methods for determining life-cycle costs, the amount of energy consumed and greenhouse gas emissions were described. Indicators and rules for calculating the values of these parameters for the EIO-LCA (economic input-output life-cycle assessment) methodology were given. The methodology of indicator assessment consisted of comparing values of indicators for different pump operation scenarios. In the analysis, technical aspects (energy consumption), as well as environmental (greenhouse gas emissions) and economic aspects (cost, planning period, discount rate, etc.), were considered. The hydraulics of the system were represented by the pump and system characteristic curves. A case study considered a pump installed in an Ontario water treatment plant. The analyses covered the years from 1997 to 2003.

4. Analysis of Current Research Papers and Technical Methodologies

The amount of energy which should be delivered to a water supply system for the implementation of technological processes depends on many factors, such as landform, characteristics and location of users, network characteristics (e.g., materials used, pumps), etc. The incomparability of systems makes their objective assessment a very difficult task. The main purpose of all energy assessment methodologies is to answer the following questions: whether the amount of energy supplied to the water transport system is optimal, and whether there are any possibilities of reducing that amount. It may be very hard to establish one reliable assessment method for all water supply systems.
There is a need to use different methods for water supply assessment results from many factors. Above all, many regional factors have an impact on energy consumption [11]. The scope and methods of assessment depend on the entity conducting the assessment. The principles and methods of evaluation will depend on the objectives and tasks formulated by the evaluator. Various stakeholders are interested in different aspects of energy assessment. For example, environmental protection agencies are interested in climate mitigation (which requires the calculation of GHG emissions), while managers of water utilities may be interested in financial questions (which require economic analyses), the water utility operators are interested in technical questions, etc. The different objectives of evaluation make it necessary to use different energy assessment methods. To perform a full and comprehensive energy audit, it is necessary to have available a large quantity of data and computer models. Not all water utilities collect reliable data or possess calibrated computer models and qualified staff. For this reason, some authors distinguish two types of assessment: simple and detailed [6,30]. A simple assessment is needed, especially in macroeconomic analyses, where the availability of data is limited.
Based on the current state of knowledge, it will be very hard to determine one method of energy assessment for water supply systems. However, it is possible to make a classification of the methods used, noting their significant differences and similarities. The main difference between methods lies in the approach taken to evaluation. Generally, it is possible to classify energy assessment methodologies as top-down and bottom-up [11].

4.1. Top-Down Methodologies

In top-down methodologies, the system is assessed with the aim of determining the values of indicators characterizing overall processes in a water utility. As a part of the assessment, energy requirements are computed on the basis of meter readings. Usually, unit indicators are analyzed; less often, detailed analyses are performed for particular devices. The assessment method may be based on external or internal benchmarking. In addition, the trends of changes in indicator values over the time of operation can be analyzed [10]. The values of indicators and practices used in an enterprise can be compared with benchmarks created using expert knowledge [6,9]. The evaluation is generally conducted on a larger scale; it may be carried out by an external stakeholder (e.g., a government agency, regulator, statistical office, etc.). In Appendix A, top-down methodologies are listed as items 1–10.
Top-down methodologies may concern not only energy usage but the economic issues can also be analyzed. Usually, the analysis relates to the cost of energy as a percentage of all operating costs [3,40]. For the assessment of performance indicators, external benchmarking is often used. IBNET, as described earlier in this paper, is the largest benchmarking project. Energy assessment is also performed under several national and international benchmarking projects, including European Benchmarking Co-operation [41], DANVA (Danish Water and Waste Water Association Benchmarking) [42], Polish Waterworks Chamber of Commerce Benchmarking [43], the American Water Works Association Utility Benchmarking Program [44], New South Wales Water Supply and Sewerage Benchmarking Report [40], etc. Benchmarking makes it possible to compare different utilities and determine the range and scale of variation in indicator values. Statistical analyses using benchmarking [12] have shown the main factors impacting on energy consumption to be total system flow, purchased water flow, total pumping horsepower, production pumping horsepower distribution, main length miles, and distribution system elevation change feet.
The analyses performed under top-down methodologies make it possible to carry out macroeconomic analyses. These analyses are needed, particularly during investment and rehabilitation planning for long-term management. For this purpose, unit indicators (defined, for example, under a benchmarking project) are used [14].

4.2. Bottom-Up Methodologies

Bottom-up methods use a mathematical description of processes, developed using the laws of physics (mass and energy continuity laws). Taking into account the results of model calculation, assessment indicators for individual processes are defined. In these methods, mathematical models of water transport systems [19,21,22,30,31,32,33,36,37] are often used. The assessment is usually performed within enterprises, as part of the analysis of technical condition and management of infrastructural assets. Bottom-up energy assessment methods are listed in Appendix A as items 11–25.
In bottom-up methods, particular attention is paid to identifying the causes of energy losses in water supply systems. Different energy balances derived from the first law of thermodynamics are described in the literature. Performance assessment in bottom-up methodologies is more detailed. Usually, the evaluation of performance assessment indicators involves comparing the calculated values with reference values. The reference values may be determined using a modeling technique, usually on the basis of an idealized “optimal” model.

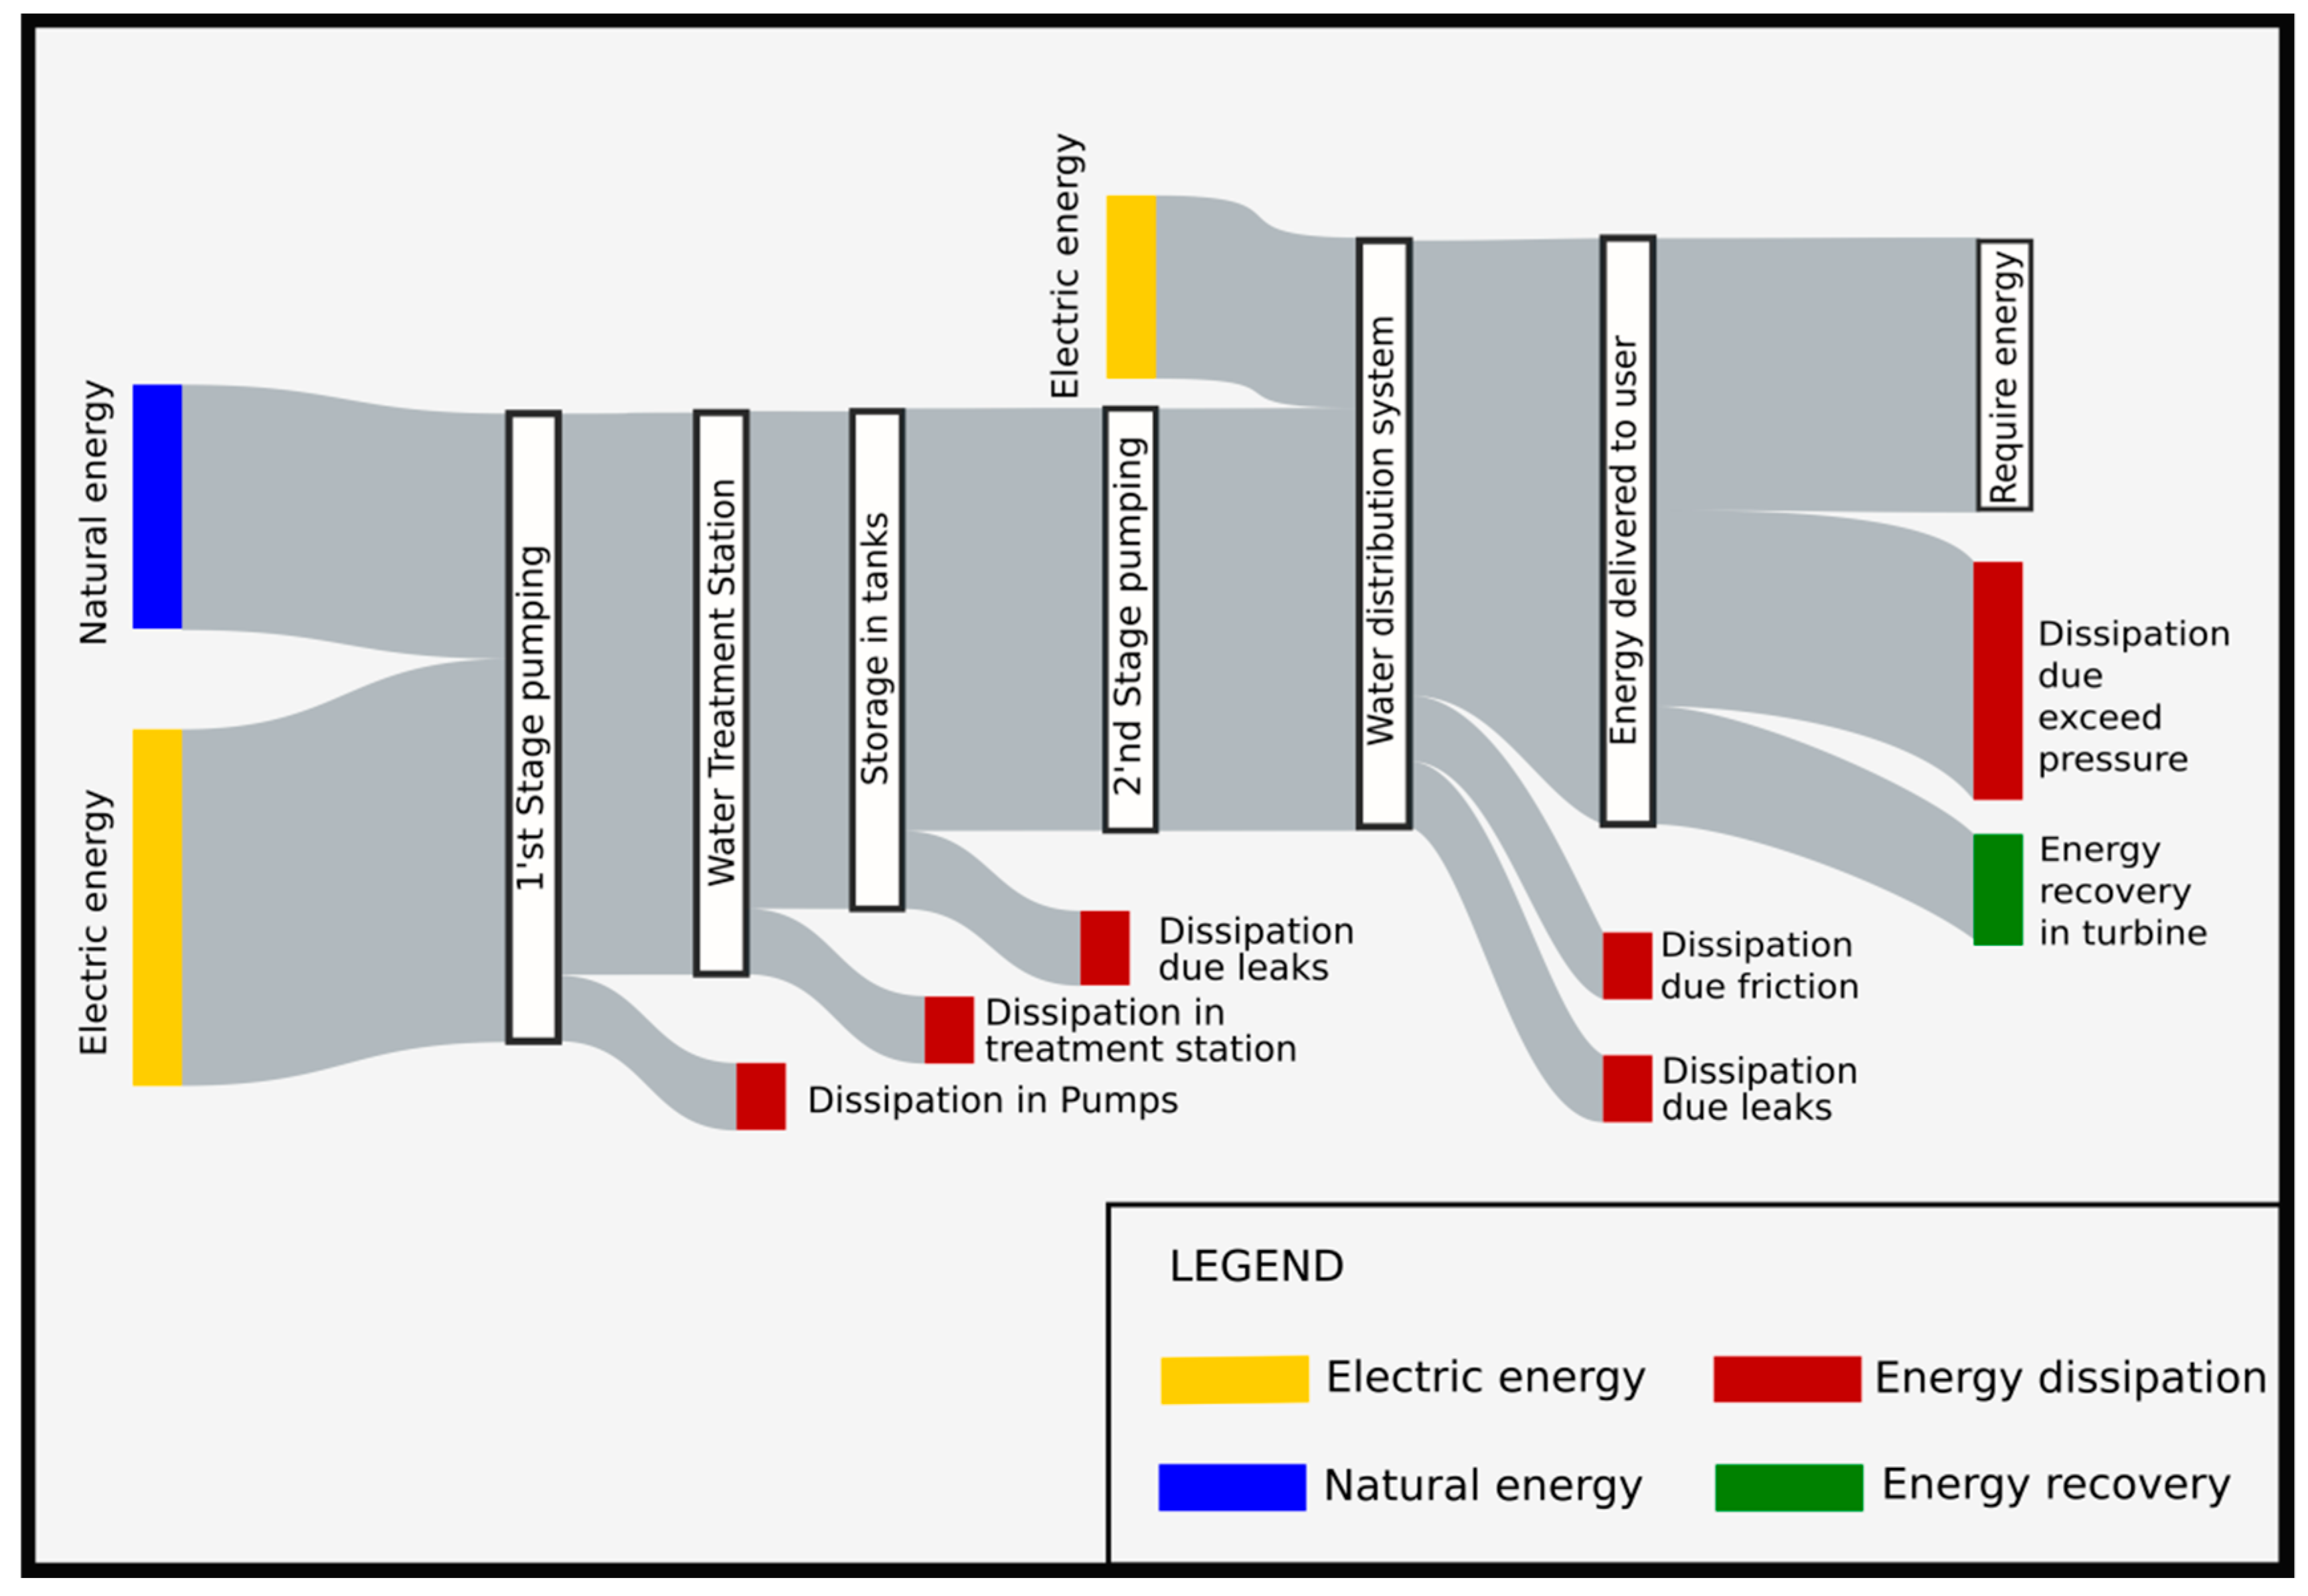
4.3. Energy Balance for Water Supply Systems

In an energy balance, the amount of energy flowing into the system (natural and shaft energy) is compared with the amount of energy supplied to users or dissipated through imperfections of the system. There are several energy balances presented in the literature [19,30,31,32,37]. In all cases, it is emphasized that energy dissipation occurs in:
  • pumps, due to the imperfection of conversion of electrical energy to the kinetic and potential energy of water;
  • pipes and valves, due to friction;
  • leaks, due to the dissipation of energy with lost water mass caused by leaks in pipes and tanks;
  • users, due to maintenance of pressures higher than required in the water supply network.
A quantitative assessment of energy transformation has been presented in several energy balances. The main difference between them is the degree of detail and methods of taking account of water loss. In practical cases, energy balancing is performed using a mathematical model of a water distribution system. Because such models are usually created for an extended period of simulation, it is possible to derive a balance for a longer period (e.g., one year).
Energy balancing can be performed following analysis of water losses in the network. Analyses of leakage can be performed using a water balance [27]. The energy and water loss balances enable a better understanding of the operation of the network. The main advantage of using these balances is the possibility of calculating the potential gain from modernization. This value should always be considered under economic analysis.

4.4. Reference Values and Performance Assessment

In both top-down and bottom-up methodologies, an important part of an energy assessment is the calculation of performance indicators. The assessment is carried out based on these indicators. The evaluation includes comparing the indicators calculated for individual utilities with reference values. One of the main problems in assessment is to determine the reference value and acceptable range for indicators. One of the most commonly used methods of determining reference values is comparative analysis (benchmarking) [3,7,8,12,16]. Benchmarking allows one to determine the lowest and highest values of an indicator, as well as average values. It is also possible to classify a utility using statistical analyses. There are two types of benchmarking: internal and external. In internal benchmarking, it is possible to compare different processes within a utility. This approach enables the identification of elements, which have the highest impact on energy usage [6], or the observation of changes in indicator values over the time of operation [10]. External benchmarking serves to compare processes in different utilities. Under this approach, it is possible to establish how the indicator value for one utility compares with the average. It is also possible to test statistical models using data collected during benchmarking. Testing the correlation between different parameters and energy demand allows one to find which factor has the greatest impact on energy usage [12]. In some projects, the reference values are designated by experts [6,9,18]. In this case, the experts indicate the desired value of indicators as a standard for utilities based on benchmarking, knowledge of the literature, and their experience.
The main disadvantage of benchmarking for water utilities is that this approach does not take account of the specific features of a particular water supply system, such as landform, user characteristics, economic conditions, etc. It is difficult to indicate the target value of an indicator that a company should achieve using only benchmarking. This value should always be calculated, taking into account local characteristics and economic conditions. Because of this, many authors have proposed to determine reference values for a particular utility by comparing the actual values of indicators with optimal values calculated using a computer model of the water distribution system.

4.5. The Concept of Minimal Energy and an Ideal System

The concept of an ideal system and minimal energy is used for determining reference values for indicator assessment. There are several definitions of an ideal system and minimal energy. In the general case, this idea is based on an idealized model, which can be described as a model of a process where all parameters correspond to the best performance (for instance, in an idealized model, it is assumed that the pipe roughness is as for new pipes, the pump efficiency characteristics are as for new pumps, there is no head loss caused by the throttle valves, there is no pressure excess, there is no water loss, etc.) [43]. Using the ideal model, the minimal energy requirement can be calculated. The first definition of minimal energy was stated by Pelli and Hitz as “the least energy theoretically needed (without friction or pumping loss) to transport the water from its production locations to the users, at an operational pressure of about 6 bar (88 psi)” [18]. The following definition of an ideal system was given by Cabrera etal.: “An ideal system is one where there are no friction head losses or leaks (while the kinetic energy is disregarded, a common practice in network analysis). There is no excess pressure because, at the critical point, the pressure is equal to the required service pressure, p0.”
The difference or ratio between the values of indicators calculated using real and ideal models can be used for the evaluation of a water supply system [2,12,18,22,26,29,30,34]. The approach in which reference values are calculated from an idealized model is also used in proposals for the energy labeling of water distribution systems.
One of the problems with using idealized reference values is how to develop an idealized model. The easiest way to determine a reference model is to calculate the energy required by the user. Because the required pressure and demand are known, calculating these values is simple. The simplest way to perform energy assessment is to compare the value of the energy supplied to the system with the minimum needed (e.g., the I1 indicators in the Cabrera Energy Audit of Water Networks [19]). This approach makes it possible to assess a utility’s overall energy usage and calculate the potential maximal energy, which can be reduced or recovered from the system. However, using only this indicator, it is not possible to indicate which elements of the system have the greatest impact on energy usage. Assessment of each element of the energy balance is possible after determining reference values for all elements of the system. Methods are described in the literature for determining reference values for water losses [26,27] and friction losses [28] using economic analyses. Determining an idealized model can be especially hard for friction loss. Because changes in pipe roughness cause changes in water flow, an idealized model may be incomparable with a real model. In some conditions, the reduction of the roughness coefficient for particular pipes can cause an increase in energy dissipation [36].
Another method for developing an idealized model is to use an optimization procedure [35]. This approach may be more objective, but because there exist different optimization methods and criteria for water supply optimization [44,45], this methodology may be problematic to implement on a larger scale from a practical point of view.

4.6. Tools and Software Supporting Energy Assessment of Water Supply Systems

Computer tools play a significant role in supporting the performance of analyses, especially for large and comprehensive systems. The authors of some energy assessment methodologies have used existing software or developed their own for performing analyses. These tools are helpful in the process of data collection and for calculating performance indicators. For this reason, several computer applications for performance assessment have been developed. For example, to calculate the indicators presented in the IWA Manual of Performance Indicators for Water Supply Services, Sigma software [4] and AWARE-P [5] were developed. There are also Web platforms supporting energy assessment. One of the most comprehensive platforms, created particularly for energy and GHG emissions assessment, is ECAM [6].
In bottom-up methods, hydraulic analyses of water transport systems have been widely used as a tool to support energy assessment and perform energy balancing. The simplest hydraulic analyses may be based on calculating friction with the use of the Hazen–Williams or Darcy–Weisbach formulae, and estimating pump efficiency using pump curves [34,35,39]. The potential to perform and assess the energy balance is extended with the use of a computer model of the water distribution system. In most of the methodologies [21,30,31,32,33,36,37], the EPANET model [41] is used. There is also a dedicated software available for performing energy audits: ITA energy [20], based on the EPANET model.
In the literature, there are many case studies using EPANET for energy balance calculation. In some cases, a simple model with only a few pipes is presented [2,19,38]. There are also several case studies for real large water distribution systems [21,22,30,31,32,33,36,37,39]. The possibility of visualizing energy assessment using GIS software has been discussed by, among others, Dzidziec et al. [32]. This type of visualization makes it easier to interpret results and take decisions. In recent years, much attention has been paid to Web-based applications. The use of a Web-based interface makes analyses simpler and more accessible for all users [5,6,9]. Another factor contributing to the popularization of the use of computer tools is the availability of Open Source software [4,6,7,8]. A factor of great importance for analysis is data availability. Currently, data availability remains a challenge (especially in macroeconomic analyses), but there are some opportunities to obtain free data using Web-based interfaces, such as IBNET [7,8].

4.7. Notes on Data Reliability andAvailability

Data collection is always the greatest challenge and the most time-consuming task when performing an energy audit. The reliability and availability of data have a crucial impact on the quality of the results of the analysis. During an audit, a clear procedure for data collection and data quality assessment should be implemented. An example of how to establish a clear procedure for collecting energy-related data is provided by the AquaRating [9] audit. In AquaRating, it is required to collect documents, which confirm data reliability. The methodology defines types of documents and the frequency of updates. In addition, an external audit is recommended.
The evaluation of data quality is of particular importance when the assessment is performed by an external entity, such as a regulating agency. The assessment methodology should always be chosen according to data availability: for example, for macroeconomic analyses, simple methods of assessment should be used. It may be hard to apply an energy balance with computer modeling of water distribution systems when comparing a large number of utilities (e.g., in regulatory benchmarking).
For energy balancing, a computer model of the water distribution system is usually needed. A large quantity of data is needed to develop a computer model of a system [42,43,44]. Some data can be obtained by direct measurement (e.g., pump characteristics, pipe diameters, etc.), but many parameters have to be evaluated using indirect measurement. Two parameters, which play an important role in energy audits—water loss and pipes roughness—are determined by indirect measurement. For the determination of water loss, there exist widely known methodologies [27,45]. Despite the fact that many companies have been conducting water loss audits for years, there may still be problems with assigning water losses to particular pipes in the network due to the inadequate quantity and accuracy of measuring devices. Determining the roughness of pipes is also a complex task. It is not possible to measure this value directly, but it is determined through a calibration procedure. The calibration of a water network requires the collection of a large number of measurements and the use ofoptimization techniques [46]. Also, the roughness can change during the assessment period, especially when the water mains are flushed. On the other hand, it is noted that the minimization of energy dissipation due to friction may be profitable only for undersized water mains. The identification of pipes of this type can be based on expert knowledge and does not require a comprehensive modeling technique. It is also pointed out that in some countries (such as the United States), networks are designed for fire conditions, and therefore the values of energy losses due to friction in pipes are usually small or negligible [31]. This fact is confirmed in a study by Hashemi et al. [36], showing that the maximal reduction in energy dissipation due to friction is only 0.7%.
Another problem related to data reliability and the energy balance is the dependence between the assumed simulation time step (and demand pattern) and the water balance result. For example, in some research, the audit has been conducted with a simulation time step of 15 min [30], while, in other cases, a time step of 1 has been used [32]. Sensitivity analyses concerning the impact of the time step (and other assumed model parameters) should always be carried out.

4.8. Recommendation for Water Utilities

The authors emphasize that the first stage of improving efficiency is collecting data and calculating an energy balance [21,22,30]. The energy balance can be used to better describe the network, but as Walski notes: “By itself, an energy balance won’t affect energy consumption.” Increasing the efficiency of a supply system is possible only through corrective actions. The preparation of a balance may support the planning of such tasks. Energy assessment allows one to identify elements of a system that can be improved [31]. The literature review shows how systems can be managed to increase energy efficiency and how to analyze the impact of potential modernization. Two types of action are distinguished: operational and structural [22]. Operational actions relate to optimization processes and changes to methods of system control. Structural actions concern better planning and system modernization. Many good practices and methodologies reported in the literature contain recommendations for improving system operation. An algorithm for increasing the efficiency of a water system has also been presented [21]. There is great potential for the use of Web tools and knowledge data bases in implementing good practices and recommendations for water utilities [6].
It should be emphasized that not only technical aspects are important in the assessment of an enterprise. Other issues are also important, such as the reduction of CO2 emissions, economic aspects, the use of appropriate forms of investment financing (e.g., based on performance-based contracts), and appropriate principles for the design of pricing systems. Water supply companies are usually subject to public administrative bodies. For that reason, aspects related to the implementation of appropriate energy policy at higher levels of administration are highly significant [6,11,13].
Attention is drawn to the possibility of energy recovery from a water supply system. In some papers [3,6,9], formulae are derived for the quantitative assessment of energy recovery on the scale of the whole enterprise, including processes in the water and sewage system. In other papers, indicators related to energy recovery only for the water system (using a turbine) are used [14,18,19,21,31,38]. This solution may be economically justified, for example, in mountainous areas and in places where there is a need to reduce pressure. Energy assessment methodology can be helpful in establishing criteria for optimal turbine locations.

4.9. The Comparative Analyses of Methodologies

The main differences between the methodologies concern approach to assessment. Two types of assessment are distinguished: top-down and bottom-up. The methodologies also vary on types of performance indicators and methods of the determination reference value and performance assessment. The difference between methodologies concerns also a type of used model for calculation and assessment of performance indicators. In all analyzed publications and reports, there are several recommendations for water utilities. The recommendation varies on methods and approaches.
The differences between methodologies are presented in a comparative table (Table 1). In the table, the summary of the methodology description is presented. The full description of methods is presented in Appendix A. The ID (first column in Table 1) refers to their identifiers used in Appendix A.

4.10. Discussion

Twenty-five methodologies of energy assessment of water utility were presented in the review. One of the most important steps during performance assessment is to choose a methodology of utility evaluation. The methodologies were classified depending on the approach: top-down or bottom-up. In the top-down methodologies, usually, energy is evaluated as a part of the whole utility performance assessment. One of the most significant works about assessing water utility performance was described in the IWA Manual [3]. Bottom-up methodologies are more detailed and comprehensive. Most of the bottom-up methodologies are based on energy balance. The most significant work about energy balance was made by the group of scientists from Valencia [19,20,21,22,28] and Lisbona [30].
A lot of effort was done on developed energy performance indicators and metrics. In the review, more than 60 performance indicators were described. Most of the indicators concern a unit value of energy usage. The unit value can be referred to as 1 m3 of sold water [7,8], 1 m3 of produced water [16], 1 m3 of water injected to the network [18], or 1 m3 of water pumped at 100 m of the head [3,6].It is possible to evaluate this indicator using internal or external benchmarking. In the bottom-up approach, usually, the energy assessment is based on comparing the amount of energy used in the real system and the ideal system. Using the concept of ideal network, several indicators were developed [2,12,18,22,26,28,29,30,34]. For developing an ideal network, the mathematical modeling of physical phenomena is needed. Usually, to develop an ideal network, a computer model (EPANET) of water supply is used [21,30,31,32,33,36,37]. The simplest hydraulic analyses (calculating friction with the use of the Hazen–Williams or Darcy–Weisbach formulae, and estimating pump efficiency using pump curves), in some cases, are also used for developing a reference (ideal) value for indicators [34,35,39].
The main aim of conducting energy evaluation was to found a connection between performance evaluation and performance increasement. In all analyzed articles, the recommendation for water utility was presented. In some literature, recommendations concern only the methods of implementation of the performance assessment system. In other publications, the full set of activities, which could be conducted for increasing the energy efficiency in the water distribution system, was presented.

5. Gaps and Future Challenges

Much effort has been devoted to creating methodologies for an energy assessment of water supply systems. Water utilities have a good base and tools for evaluating their own systems. The energy balance has been precisely defined, which allows utilities to perform a reliable evaluation of their system [19]. However, there is still much discussion [47,48] concerning the definition, scope, and methods of energy balancing [30]. Therefore, there is a need for clarification of terms, metrics, and indicators. It would appear useful to establish a unified energy assessment terminology, similarly as for water loss auditing [49].
The most significant current challenge in energy auditing relates to data collection and the implementation of water audits at utilities. It is important to implement the methodologies even if the utilities do not have a complete set of data—there are some methodologies that do not require a large quantity of data, but can nonetheless provide a good description of a network.
The literature review presented here showed that methodologies for an energy assessment of water supply systems are already well-developed, but there are still some possibilities for future research:
  • Energy assessment is a part of the overall assessment of a water supply utility. In such an overall assessment, it is required to aggregate different indicators into a single indicator. The assessment of this type is presented in AquaRating [9], which uses weighted sum methods. There is great potential for testing other multi-criteria methods for the overall assessment of water utilities.
  • Reference has been made to the need for and possibilities of introducing a labeling system for an energy assessment. Implementation of a labeling system will improve the possibility of an objective comparison of water supply systems.
  • Performance of a full energy balance requires the use of a computer model of a water distribution system. The methodologies for building models for energy assessment should be unified. It seems reasonable to test how simplification of the model will affect the result of calculations. In particular, it would be useful to determine a standard time horizon, time step, and pattern characteristic (for how many seasons, patterns should be taken into account).
  • The presented water balance case studies were performed using demand-driven simulation (DDA), in which the water demand does not depend on pressure. In recent years, much effort has been devoted to the development of pressure-driven simulation (PDD) [50,51,52,53,54]. PDD is particularly helpful in analyses of the impact of pressure reduction. Pressure reduction can also cause a reduction in pumps’ energy demand and water loss. It is reasonable to implement an energy balance for a PDD model also.
  • In the context of climate change, GHG emissions assessment is coming to play an important role in performance evaluation. The main source of emissions from a supply system is indirect emissions due to electrical energy consumption [6]. It should be noted that analyzing only these emissions may be insufficient. There are other emission sources in water supply systems, such as direct emissions from trucks (when the water is supplied by trucks) and fuel engines, and indirect emissions related to the use of various reagents in water treatment and disinfection. It is also important to analyze the carbon footprint over the whole life-cycle (production, use, and disposal phase) [30,38]. All analyses related to climate mitigation should be performed according to the Intergovernmental Panel on Climate Change (IPCC) recommendation [55].
  • The energy balance is derived based on the law of energy conservation for the water supply network. This law is usually described using the Bernoulli equation. In the analyzed literature, thermodynamic descriptions of water supply networks concern only losses of kinetic and potential energy, as well as imperfections of energy transformations in pumps. There are no complete descriptions of all types of energy transformation in water supply systems (physical, chemical, and thermal energy). There is also no comprehensive description of the water supply system derived from the second law of thermodynamics (using an entropy and exergy approach). In light of the analysis of energy assessment of water supply systems, it is reasonable and necessary to develop an energy model for those systems. Such a model can be determined using the first and second laws of thermodynamics. This model will allow the analysis of changes in all types of energy in systems.
  • Currently, energy assessment in the water supply is limited to water distribution systems. To reduce overall energy consumption, users’ plumbing should also be analyzed. Reducing water demand has a significant impact on energy usage. There are several methods for assessing and labeling water usage efficiency [2,22]. It may be useful to integrate these methods with the energy balance for water supply.

6. Summary and Conclusions

Energy evaluation of water supply systems is a comprehensive task that can be performed using different methodologies. In the last 20 years, several of these methods have been presented in the literature. The methods vary in terms of the scope and aim of assessment. Water utilities are obliged to carry out tasks connected with continuous measurement and improvement of their performance. The performance of a water utility may be assessed by different stakeholders, including water utility managers, local authorities, regulatory offices, environmental protection agencies, customers, development banks, non-governmental agencies, etc. Because the energy assessment of water supply systems is performed for different purposes, it is not possible to indicate one universal method. The main objective of this paper was to review the methods currently used for an energy assessment of water supply systems. Selected methods were presented in the article. Appendix A includes a brief description of the methodologies, the most important indicators, and remarks about the research and case studies. The methods were assigned to two groups—bottom-up and top-down—following the classification of the Water Research Foundation [11]. The main characteristics of both types of methodologies were described. In addition, the problem of finding reference values for energy assessment was analyzed. Attention was paid to the concept of minimal energy and an ideal system. This concept was developed using mathematical models of water distribution systems. To support the modeling of water distribution systems, computer software was commonly used. Possibilities of using different computer tools to support energy assessment were discussed in the article. The use of modeling techniques required the collection of large quantities of data. The article included notes about data reliability and availability. At the end of the article, some general recommendations for water utilities were presented, in addition to gaps, possibilities for future research, and technical challenges.
The analysis of the currently available literature showed that the problem of energy balancing and energy assessment is well described. Water utilities have a very good base for performing energy balancing and performance assessment. There are also many software tools that can be used to support the assessment. Currently, the greatest challenge is to collect reliable data and implement energy balances at utilities. The preparation of this type of assessment will help in determining corrective action, which can enable utilities to reduce their energy demand.

Author Contributions

Conceptualization, J.B. and T.M.; Methodology, J.B.; Formal Analysis, J.B.; Investigation, J.B.; Resources, J.B.; Writing—Original Draft Preparation, J.B.; Writing—Review and Editing, T.M.; Visualization, J.B.; supervision, T.M.

Funding

This publication was funded by the Polish Ministry of Science and Higher Education, research subsidy number 01/13/SBAD/0912.

Acknowledgments

This work is based on the results of Jedrzej Bylka’s Ph.D. thesis entitled “The assessment of water transport systems using integrated IT tools” (original title: “Ocena układów transportujących wodę z zastosowaniem zintegrowanych narzędzi informatycznych”) under the supervision of Tomasz Mroz.

Conflicts of Interest

The authors declare no conflict of interest. The funders had no role in the design of the study; in the collection, analysis, or interpretation of data; in the writing of the manuscript; or in the decision to publish the results.

Appendix A

Table A1. Review of energy assessment methodologies for water supply systems.
Brief DescriptionMethodology/IndicatorsBottom-Up/Top-Down
Computer Tools, Modeling Case Study, Remarks
1. IWA Manual of Performance Indicators for Water Supply Services [3]
IWA Manual of Best Practice Performance Indicators for Water Supply Services is a standard for the development of a performance assessment system for water utilities. The manual referred to 166 indicators, divided into six groups: water resources indicators (four indicators), personnel indicators (26 indicators), physical indicators (15 indicators), operational indicators (40 indicators), quality of service indicators (34 indicators), and economic and financial indicators (47 indicators).The following indicators related to energy were specified in the physical indicators group:
  • Ph4—the percentage of pump capacity used (%)
  • Ph5—standardized energy consumption (average energy consumption to pump 1 m3 of water at 100 m of the head) (kWh/m3/100 m)
  • Ph6—reactive energy consumption (% of energy consumption for reactive energy consumption)
  • Ph7—energy recovery (%)
Another energy-related indicator is classified under economic and financial indicators:
  • Fi10—electrical energy costs (%)
The manual did not provide a range of values for the above-mentioned indicators and did not propose methods for their evaluation. The purpose of the guide was to present standards for performance indicators. These indicators might be used within the enterprise (as an element of self-assessment—internal benchmarking) or for comparing different enterprises (external benchmarking).
Top-down methodology

There were several computer applications in which this methodology was implemented, e.g., Sigma software [4], AWAR-P [5].

The manual presented a guide for implementing a performance assessment system. The indicators might be used by water utility managers, benchmarking organizations, statistical offices, and water regulation offices.
The manual also contained examples of application, remarks on data quality, and recommendations on how to increase performance using the system of indicators. Possibilities of using performance assessment indicators as a part of asset management were also presented.
2. ECAM—Energy Performance and Carbon Emissions Assessment and Monitoring Tool [6]
ECAM (Energy Performance and Carbon Emissions Assessment and Monitoring Tool) is a tool developed under the Wastewater Companies for Climate Mitigation project, implemented by GIZ (Deutsche Gesellschaft für Internationale Zusammenarbeit) and the IWA (International Water Association). The tool could be used to evaluate all processes in both water and wastewater systems.The main aim of this evaluation was to calculate GHG emissions (CO2 emission equivalent) for all processes. Two types of emissions were distinguished:
  • Direct emissions—related to fuel burning and emissions from wastewater systems and wastewater treatment plants (emissions of CO2, CH4, NO2);
  • Indirect emissions—related to electrical energy usage, discharge without treatment, truck transport, biogas, etc.
Under the WaCClM project, the ECAM tool was developed. ECAM is a free and intuitive Web-based tool for an energy assessment. Two levels of assessment were available:
  • Tier 1—fast and simple assessment. The results of the assessment were aggregated CO2 equivalent indicators for all elements of water and wastewater systems.
  • Tier 2—a more comprehensive and detailed assessment. In tier 2, performance indicators were calculated separately for water abstraction, water treatment, water supply, wastewater collection, wastewater treatment, effluent discharge/reuse, and fecal sludge management (containment, treatment, reuse/disposal).
ECAM enabled the calculation of the following energy-related performance indicators:
  • Total GHG water supply (kg CO2eq/year/serv.pop.)
  • Total GHG water abstraction per assessment period (kg CO2eq)
  • Total GHG water treatment per assessment period (kg CO2eq)
  • Total GHG water distribution per assessment period (kg CO2eq)
  • Energy consumption per abstracted water (kWh/m3)
  • Energy consumption per treated water (kWh/m3)
  • Energy consumption per volume injected to distribution (kWh/m3)
  • Energy consumption per authorized consumption (kWh/m3)
It was also possible to calculate other indicators related to water pumping and transportation, such as:
  • Unit head loss (m/km)
  • Electromechanical efficiency of the existing pump (%)
  • Standardized energy consumption (average energy consumption to pump 1 m3 of water at 100 m of the head) (kWh/m3/100 m)
Performance assessment was also conducted for unit head loss and standardized energy consumption. Values were assessed using benchmarks taken from the literature. The results of the assessment in ECAM were indicated by green, yellow, or red lights (good, acceptable, and poor) displayed alongside the values.
For a water distribution system, it was possible to assess topographical energy. The following indicators were used:
  • Global water distribution energy efficiency (%)
  • Percentage of topographic energy (%)
The software enabled the assessment of possible improvements to pump efficiency, by calculating:
  • Estimated standardized energy consumption of a new pump (kWh/m3/100m)
  • Energy consumption with expected new pump efficiency (kWh)
  • Estimated electricity savings (kWh)
  • Estimated GHG reduction per assessment period (kg CO2eq)
If water was transported by truck, the following indicator could be calculated:
  • Total GHG—Trucks (Fuel) (kg CO2eq)
Internal benchmarking could be used to assess the system (find the largest source of GHG and evaluate changes in emissions over time). For some indicators, ranges for assessment were taken from the literature.
Top-down methodology

A free and open Web-based platform for the performance assessment and Web-based learning platform.
During the project, a Web-based platform for water utility systems was developed. Several case studies were presented on the platform. There was also a set of good practices for improving energy efficiency, presented on the Web-based knowledge platform.
3. IBNET—The International Benchmarking Network [7,8]
IBNET is a World Bank project. Its main aim was to provide data about water utilities worldwide for utility managers, regulators, authorities, investors, and the general public. The project was open to all water utilities, which could send data about their performance using a toolbox. Data were freely available to all and were published by the Web application. The performance indicators in IBNET concerned 14 areas: service coverage, water consumption and production, operating costs and staff, non-revenue water, meters, network performance, quality of service, billings and collections, financial performance, assets.The project related to water and wastewater infrastructure assessment.
The following data on energy consumption were collected under the project:
  • 30.01—Total electricity consumption (kWh)
  • 30.02—Electricity consumption—Water (kWh)
  • 97—Electrical energy costs (currency/year)
Using this data, the following performance indicators were calculated:
  • 30.2—Electricity consumption per m3 sold (kWh/m3),
  • 13.2—Electrical energy costs as a percentage of operational costs (%)
Top-down methodology
A free and open Web-based platform.
Data were sent voluntarily by water utilities; e.g., 2445 utilities took part in the survey in 2015, 769 in 2016, and 545 in 2017. All data were free and publicly available via an Internet application. The application could be used to create reports and compare different indicators at the global level. Due to the wide range of the project, it was not possible to verify all of the data. The platform is an appropriate tool to perform macroeconomic analyses, but the possibilities of assessing single utilities might be limited.
4. AquaRating [9]
AquaRating is a performance assessment system for water utilities. The result of the evaluation was an aggregated “rating” of a utility’s performance. The project had been developed by the International Water Association and the Inter-American Development Bank. In the project, 112 assessment factors were aggregated in eight groups: service quality, investment planning and implementation efficiency, operating efficiency, business management efficiency, financial sustainability, access to service, corporate governance, and environmental sustainability. The evaluation used both performance indicators (quantitative assessment) and good practices (qualitative assessment). The good practices were a set of recommendations for water utilities related to management. Methods of assessment were specified for each indicator and good practice, as well as the method for aggregating all of the criteria into a single “rating”.The energy assessment was carried out as part of the assessment of the implementation of the following good practices:
  • OE2.1—Energy usage efficiency:
    • Energy audits that include all energy-consuming facilities in the “system” are carried out at least once every five years.
    • Measures and recommendations proposed in energy audits are implemented, at least in facilities that account for 90% of total recommendations as measured by energy consumption.
    • Plans exist for optimizing energy consumption in operation of drinking water supply, treatment, and distribution “systems” and in operation of wastewater collection and treatment systems.
    • Energy optimization is considered during the infrastructure and equipment design phase.
    • Energy optimization is considered when planning the operation of facilities and the “system” as a whole.
    • A plan exists for improving and reducing unit energy consumption and includes annual objectives and monitoring of objective fulfillment
  • OE4.1—Operational and maintenance cost efficiency:
    • /.../
    • 4. Individual and segregated monthly accounting analyses are carried out for the main components of these operating costs: staff, reagents, energy consumption, and third-party services.
    • /.../
  • ES 2.3. Environmental operation and promotion:
    • /.../
    • 5. Energy efficiency improvement programs exist.
    • /.../
It is recommended to calculate the following energy usage indicators:
  • ES 2.5 Energy consumption balance—this concerns the ratio between energy consumed and produced in the entire water and wastewater system:
    ES   2.5 = [ S A V 3 ] [ S A V 4 ] [ ]
where:
[SA-V3]—energy consumed by all drinking water and wastewater processes (kWh)
[SA-V4]—energy generated in facilities linked to the “system” (kWh)
  • ES2.6 Greenhouse gas emissions linked to drinking water and/or wastewater management:
    ES   2.6 = [ S A V 5 ] [ S A V 15 ] [ M g C o 2 M k ]
where:
[SA-V5]—annual emission of CO2 equivalent in the calendar year preceding the rating date (tons CO2),
[SA-V15]—number of inhabitants (inhabitants).
The reduction of CO2 emission is also proposed as a part of good practices:
  • PE1.3 Methodology for identifying and analyzing alternatives and defining solutions:
    • /.../
      5. Possible solutions are subject to multi-criteria assessment of alternatives that explicitly analyzes the available options, taking into consideration definition and assessment of the available project options in terms of configuration, sizing, analysis horizon, technological options, environmental or other restrictions, service delivery and environmental regulations, optimal date of operation start-up, restrictions due to preparation and implementation times, etc.
In the project, much attention was paid to data reliability. During the assessment, documents that confirm data reliability should be collected. The methodology defined which documents should be checked and with what frequency. If there was no documentary proof of the value of indicators, the rating for a given element took the value zero. Also, an external audit was required during the certification process.
Top-down methodology

Web-based platform (available to participants).

The project website contained many case studies. The methodology had been implemented by water utilities in countries, including Argentina, China, Colombia, Ecuador, Spain, El Salvador, Fiji, Sierra Leone, Jamaica, and Mexico.
5. EPA’s Energy Use Assessment Tool [10]
The EPA’s Energy Use Assessment Tool was developed by the United States Environmental Protection Agency (US EPA) to support small and medium-sized water utilities in conducting energy audits.The assessment was based on data on electricity consumption (read from meters) for all devices, such as pumps, blowers, HVAC installations, lighting, etc. The data were assigned to processes (e.g., distribution pumping, filtration, clarification, HVAC, low service pumping, etc.). The audit was recommended for a minimum period of one year (optimally five years). As part of the assessment, the trend of changes in the value of energy consumption was checked, and the most energy-consuming processes were selected. The audit enabled the assessment of changes in the value of energy consumption indicators within the enterprise (internal benchmarking). Also, energy cost data were collected for the performance of economic analyses.Top-down methodology

Excel spreadsheet (free access via the US EPA website).

Some case studies were presented in the guide, as well as audit tips and recommendations.
6. Water Research Foundation—Toolbox for Water Utility Energy and Greenhouse Gas Emission Management [11]
The main objective of the toolbox was to present a framework for energy and GHG emission assessments for water utilities. The document contained a review of energy and GHG emissions assessment programs and presented currently used models and algorithms and future research needs for energy evaluation. Strategies and best practices for utilities were also presented under the project.In this project, methodologies for energy and GHG emission assessment from various countries were presented, along with case-studies from different countries. GHG accounting standards (IPPC, UNFCCC, etc.) were described. The sources and types of GHG emissions from water and wastewater treatment facilities were distinguished. Emissions were classified by scope designation, ownership level (direct/indirect), and contribution sources. Energy benchmarking and management tools and software were reviewed. The report was supplemented by the results of a survey on the use of energy assessment tools by different water utilities.
In the report, it was shown that it was not possible to develop a single methodology for energy and GHG emissions assessment for all water utilities. A methodology should always be selected, taking into account the local conditions and aims. It was only possible to lay down general standards and good practices. The report presented a decision framework for GHG emissions’ accounting and reporting. According to this framework:
  • There is a need for GHG accounting and GHG regulation.
  • Increasing energy efficiency should involve four steps: (I) Planning; (II) Set Boundaries and Flowchart Facilities; (III) Select Reporting Protocols; (IV) Enter Data and Prepare Report.
  • The drivers of GHG accounting are regional (emission factors and methodology assessment vary by geographical region).
There were two types of methodology for energy and GHG emissions assessment:
  • Top-down—this involves calculating an emission rate using the unit emission factor (Mega TonsCO2/Mega Galons of water per Day) and activity data (MGD). These methodologies are usually used on a large scale, in macroeconomic analyses (the emission factor is usually based on a national average).
  • Bottom-up—based on data measured at the facility level. This type of methodology is used on a local scale, in microeconomic analyses.
The study presented a review of methodologies and did not indicate one as the best.

The report contained many case studies from different countries.
7. Energy Index Development for Benchmarking Water and Wastewater Utilities [12]
These guidelines were sponsored jointly by the AWWA Research Foundation, California Energy Commission, and New York State Energy Research and Development Authority. The objective of the research was to review existing energy data and assessment methods used by utilities, develop a statistical model and characteristics of energy use, apply and evaluate a benchmark score system, which is similar to the EPA’s Energy Star rating system, and present case studies of the use of the metrics at sample utilities.During the research, information characterizing utilities was collected by means of a survey. The analysis was made using data from 125 water utilities. The main aim of the analysis was to find the correlation between different water utility working parameters and energy use.
In the survey, the water utilities were asked about raw water parameters, water treatment objectives, water treatment processes and residual handling parameters, water distribution parameters, water energy use parameters, and general water parameters. About 100 parameters were considered in the investigation. Statistical data characterizing water utilities were presented in the report. During the investigation, the statistical model was tested to find the correlation between different parameters and energy consumption in water utilities. A combination of the six best-represented model parameters was found. Using this parameter, the water utility energy model was constructed as:
LN(Source kBty/yr) = 8.2394
+0.4993 × LN(total system flow kGD)
−0.063 × LN(purchased water flow + 1kGD)
+ 0.3724 × LN(total pumping horsepower)
+ 0.0620 × LN(production pumping horsepower + 1)
+ 0.2385 × LN(distribution main length miles)
+ 0.0991 × LN(distribution system elevation change feet)
For the development of an energy performance metric, the ratio between average energy use and the energy calculated from the model was used. This ratio was used to assess utilities’ performance.
Top-down methodology

Statistical modeling.

In the report, some of the data from the survey were presented. These data made it possible to perform aggregated analyses. There was also data on particular water utilities. In the document, more detailed analyses were performed for utilities with the highest and lowest energy scores. Several case studies were given.
8. WATERGY: Energy and Water Efficiency in Municipal Water Supply and Wastewater Treatment—Cost-Effective Savings of Water and Energy [13]
WATERGY is a project carried out by the Alliance to Save Energy and concerned the relationships between water and energy in all elements of a water and sewage system. The report described all elements of the system (devices and processes) in which significant amounts of energy were consumed.The report recommended an energy audit for all devices. It was stated that in order to increase energy efficiency, three elements were necessary:
  • political will—this concerns willingness to change on the part of decision-makers, who are usually politicians dealing with water management in cities;
  • technical and economic analysis—related to the definition and mapping of energy processes, the conduct of audits, and definition of objectives, principles, and assessment indicators;
  • implementation—this concerns the implementation of plans and measuring and improving the energy consumption of processes by such means as pump replacement, search and removal of leaks, pressure management, automation, monitoring, use of appropriate materials in pipeline construction, optimal system planning, etc.
Attention was also paid to ways of financing investments related to improving energy intensity, e.g., through performance-based contracts. The study did not present an energy assessment methodology but described general principles. Attention was paid to aspects other than technical ones, such as political conditions and economic issues.
No single methodology was indicated as the best. The guide was rather a review and collection of best practices.
The report contained many case studies from different countries, including South Africa, India, Brazil, and Mexico.
9. Tools for Energy Footprint Assessment in Urban Water Systems [14]
This article described the possible use of the software UWOT—The Urban Water Operating Tool [15] for modeling the interaction between water and energy in a city.The authors proposed using unit values (kWh/L) that were calculated in UWOT. A “library” of specific (unit) energy consumption was defined in UWOT. The main advantage of the presented methodology was the possibility of comparing different scenarios of system development. For these scenarios, opportunities for energy demand reduction could be identified. The system facilitated the identification of the elements, which require the most urgent modernization. The methodology enabled the analysis of such objects as pumping stations and turbines. It was mainly the results of measurements that were analyzed (computer models of water transport systems were not analyzed).Top-down methodology

Software—the UWOT model for water supply management [15].

In the research, a large case study was analyzed. The example of Athens (about 6 million inhabitants) was presented. In that agglomeration, energy recovery was currently used. The paper indicated potential ways of increasing energy recovery from this system.
10. Classification of Water Supply Systems Based on Energy Efficiency [16]
In this article, the authors proposed the use of an indicator for classifying water supply systems in energy terms. In the study, the authors presented an example of the classification of Brazilian systems based on indicators obtained by the Brazilian National Sanitation Information System.The following performance indicators were presented in this paper:
EI—Efficiency index—this indicator serves to compare obtained efficiency with the maximum efficiency of the pumps, and is given as:
E I = η c u r r e n t η m a x P c P t o t a l 100   [ % ]
where:
η current —the current efficiency of the motor pump (%)
η maxt —maximum possible efficiency of the motor pump set under the same operating conditions (%)
P c —power of the motor pump set (kW)
P total —total power installed in the system (kW).
RC—Reservoir capacity—the capacity that pumping station reservoirs have to meet to maintain the water supply during peak hours, calculated as:
R C = t P c 782 P i η e 100   [ % ]
where:
t —number of operational hours during peak hours in 1 year
P c —the average power consumed by the pumping station during peak hours
P i —power installed at the pumping station
782—assumed number of peak hours during 1 year
η e —the number of pumping stations in the system.
RI—Roughness index—this evaluates the increase in the roughness of pipelines due to aging and is defined as:
R I = C c u r r e n t C n e w η a 100   [ % ]
where:
C c u r r e n t —current Hazen–Williams roughness coefficient
C new —Hazen–Williams roughness coefficient of a new pipe of the same material
η a —the number of pipelines in the system.
CLI—Connection loss index—describes water loss from the system, calculated as:
R I = ( V p + V i V s V c ) 1000 365 η l   [ m 3 con day ]
where:
V p —the volume of water produced annually (m3)
V i —the volume of water imported annually (m3)
V s —the volume of water consumed for service annually (m3)
V c —the volume of water effectively consumed annually (m3)
η l —the number of service connections in the system (-).
SC—Specific consumption of electricity—the amount of energy needed to produce 1m3 of water, defined as:
S C = E c V p [ kWh m 3 ]
where:
E c —specific consumption of electricity.
MMI—Macrometering index:
M M I = V M V e V p + V i V e [ % ]
where:
V M —the volume of water macrometered at the exit of the water treatment station, simplified treatment units and wells, and at the inlet of the imported water (m3)
V e —the volume of water exported annually (m3)
V i —the volume of water imported annually (m3).
WMI—Water metering index:
W M I = η l H η l 100 [ % ]
where:
η lH —the number of active connections with metering.

Using statistical analysis, the indicator values were assigned to five classes (A, B, C, D, E).
Top-down methodology

Some of the indicators were identical to indicators collected by SNIS (the national system of information on sanitation in Brazil) [17] and indicators from the IWA Performance Indicators guidelines [3]. The authors presented the values of indicators for various water utilities in Brazil. A case study covered 4941 water utilities and was developed using data from SNIS. Because SNIS did not collect all of the indicators and additional measurements needed to be performed, not all indicators were calculated for the 4941 utilities. A full case study (with all indicators) was given for 21 pumping stations.
11. Energy Indicators and Savings in Water Supply [18]
This article was one of the first publications on measuring energy efficiency for water supply systems. The research was carried out in selected cities in Switzerland. The article proposed indicators for assessing the efficiency of energy use in water supply systems. The concept was based on a definition of minimal energy (Emin), which is needed to ensure water supply.The minimal energy is defined as “the least energy theoretically needed (without friction or pumping loss) to transport the water from its production locations to the users, at an operational pressure of about 6 bar (88 psi).”
Using the concept of minimum energy, indicators characterizing the water supply network are defined as:
  • Structure indicator—this describes the structure of the water supply network and is defined as the minimum amount of energy needed to inject 1 m3 of water into the network:
    I 1 = E m i n Q v   [ kWh m 3 ]
where:
Qv is the annual amount of water used by consumers (m3).
If WS < 0, then it is possible to recover electrical energy from the water supply system. This occurs, for example, when the water source is located higher than the receivers.
  • Quality indicator—this describes how efficiently the energy is used in a particular system/utility and is defined as:
    I 2 = E E m i n   [ ]
where:
E is the energy actually consumed during one year (kWh).
The authors presented the following assessment ranges for this indicator:
  • I2 < 2—Very Good
  • 2 < I2 < 2.5—Good
  • 2.5 < I2 < 3—Fairly good
  • 3 < I2 < 4—Needs improvement
  • >4—Needs immediate improvement
Bottom-up methodology

The methodology was developed in Switzerland (in mountain regions), where there is a possibility of recovering significant amounts of energy from the distribution system. The authors presented several case studies from that country. Attention was drawn to the benefits of using performance indicators to assess the potential for recovery of energy from the water supply network. In the article, the factors, which influence the energy quality indicators (I2), were analyzed. The possibilities of saving energy through better network design and rehabilitation (cleaning of pipes, replacement of pumps) were emphasized.
12. Energy Audit of Water Networks [19]
This article described a methodology for performing energy audits of water networks. The method was developed using the energy conservation law (Bernoulli equation). The audit was performed using computer models of water supply networks. Analyses made it possible to evaluate indicators for water supply system assessment, which could be used for better planning of action to increase energy efficiency. The paper presented the components of the energy audit (Figure A1Appendix B) and equations for calculating their value.The authors presented equations for calculating values for components of the energy audit. The values were calculated using the modeling of a water distribution system.
On the basis of the energy audit, the following indicators are determined for a water supply system:
  • I1—Excess in supplied energy—the ratio of the energy delivered to the system to the minimal energy required for water supply. I1 can be calculated as:
    I 1 = E I n p u t γ i = 1 n V u , i ( t p ) h m i n , i [ ]
where:
γ —the specific weight of water (kG/m3)
V u , i ( t p ) —the total demand of node i during the simulation period tp(m3)
n—number of nodes (-)
h min , i —minimum required piezometric head at node I (mH2O)
  • I2—Network energy efficiency—defined as:
    I 2 = E U ( t p ) E Input ( t p ) [ ]
  • I3—Energy dissipated through friction—defined as:
    I 3 = E F ( t p ) E Input ( t p ) [ ]
  • I4—Leakage energy—resulting from water energy dissipated through leakage and higher energy dissipation due to the friction of water flow, which will not be used by customers. I4 is defined as:
    I 4 = E L ( t p ) + E F ( t p ) E f ( t p ) E Input ( t p ) [ ]
    where:
    E f ( t p ) —friction energy in a leak-free network (kWh)
  • I5—standard compliance—defined as:
    I 5 = E U ( t p ) γ i = 1 n V u , i ( t p ) h min , i   [ ]
I5 describes the ratio of the amount of energy delivered to the customer, assuming that at the collection point, there is no excess pressure (all of the energy actually delivered to the customer is used by the customer). The I5 indicator can take the following values:
<1, meaning that the pressure is lower than required—the customer service standard is not fulfilled;
=1, the ideal situation, when there is no excess pressure—generally impossible from the point of view of system topography;
>1, when there is excess pressure—this situation is the most frequent, and, in this case, it is possible to recover energy from the network, e.g., by the use of turbines.
Bottom-up methodology

Computer modeling of a water distribution system—the EPANET model. The authors also developed a computer application: ITA Energy [20].

The article was supplemented with a case study with the calculation of water audit values and indicators for a simple water supply network (consisting of 10 nodes, a pump, and two tanks).

The article presented a standard methodology for conducting an energy audit of a water network. The audit could be used to better describe the energy used in the network and assess its performance. The authors recommended combining the technical audit with economic (energy price) and environmental (greenhouse gas emission) audits for a more holistic evaluation of a water utility.
13. Energy Assessment of Pressurized Water Systems [21]
This article presented additional performance indicators for a pressure water supply system. In the research, new performance indicators for the Energy Audit of Water Networks [19] were presented.In the article, an “ideal system” was defined as a system with no friction, head losses, leaks, or excess pressure. The concept of an ideal system was used for developing performance indicators for water supply. In the research, three new performance indicators were presented:
The efficiency index of the ideal system, with full energy recovery, can be calculated as:
η w i = E u 0 + E t i E s i = 1 E e i E s i   [ ]
where:
E u 0 —the minimum energy required by users (constant, no matter whether the system is real or ideal) (kWh)
E ti —topographic energy required by the ideal system, corresponding to the minimal amount of energy, which should be delivered to the system to maintain the required pressure at a critical point. This energy at points other than critical (e.g., those where excess pressure is present) can be recovered by turbines (kWh)
E si —total supplied energy for the ideal system (kWh)
E ei —supplied excess energy for the ideal system (present at all nodes where excess pressure is present) (kWh)
In the ideal system, E ei = 0—all excess energy is recovered by turbines. In this case, η wi = 1.
In a real system, for economic reasons (related to the installation of turbines in the system), only a part of E ti is recovered.
The efficiency of an ideal system, without energy recovery, can be calculated from the formula:
η a i = E u 0 E s i = 1 E t i E s i E e i E s i   [ ]
The efficiency of a real system can be calculated from the formula:
η a r = E u 0 E s r   [ ]
where:
E sr —total supplied energy for the ideal system (kWh)
The article presented an algorithm for improving the efficiency of a water distribution system. In the algorithm, methods of evaluating performance indicators (using cost/benefit analysis) were proposed.
Bottom-up methodology

Computer modeling of a water distribution system—the EPANET model.

By calculating η ai η ar , one could determine the difference between a real and ideal system. By evaluating changes in this difference over time, one could define and monitor goals for improving energy efficiency. The paper presented methods for improving the energy efficiency of a system, such as reduction of leaks, reduction of energy related to friction in pipes, application of turbines, pump replacement, and improvement of the network structure. A case study of an agricultural irrigation system, covering 55 km of network and 400 water intakes, was presented.
14. Towards an Energy Labeling of Pressurized Water Networks [22]
This paper described procedures to minimize energy consumption in a water distribution system. The authors proposed a methodology for labeling water energy usage in water supply systems.The authors proposed a six-stage methodology for energy improvement in a water system:
  • First stage—basic diagnostics—diagnostics using basic performance indicators and reference values;
  • Second stage—Water audit—auditing losses in the water distribution network;
  • Third stage—Energy audit—performed an energy audit as in [19];
  • Fourth stage—Analysis of operation actions—implement action to increase energy efficiency (the authors gave examples of corrective actions), through changes to the rules of operations;
  • Fifth stage—Analysis of structural actions—established what type of energy is lost, performed cost-benefit analyses, and chose which action (network modernization) should be implemented;
  • Sixth stage—Label the efficiency of the pressurized water system—the authors discussed the need to develop a labeling system for energy management in the water supply. The European directives referred to were Directive 2010/30 on the indication by labeling of the consumption of energy (EU, 2010b) [23], Directive 2009/125 with regard to ecodesign requirements for pumps (EU, 2012a) [24], and Directive 2012/27 on energy efficiency (EU, 2012b) [25].
Bottom-up methodology

The EPANET model was used.

A case study concerned an orange irrigation system in Cap de Terme, Villarreal (Spain). In the article, the authors described all six stages of the energy assessment and improvement methodology and presented examples of structural and operational actions, which could be carried out. The authors did not describe the methodology of energy labeling of water distribution systems but stated that the development of this methodology was the main objective of a new EC directive project, which is now under evaluation.
15. Labeling Water Transport Efficiencies [2]
The authors presented metrics for objective assessment of the efficient use of energy in the water supply. The metrics were based on adding environmental costs to water and energy costs. The main contribution of this paper was a global energy score (IS), which is a combination of several metrics.The global energy score IS could be calculated as:
I S = E rl E l , e E l , e E 0 , e + E rf E f , e E f , e E 0 , e + E rp E p , e E p , e E 0 , e = E rl E l , e γ 1 + E rf E f , e γ f + E rp E p , e γ p
where:
E rl —the energy embedded in leaks
E l , e —economic energy leakage losses reference level
E rf —the energy dissipated through friction in pipes and valves
E f , e —economic energy friction losses references level
E rp —energy pumping station losses
E p , e —economic energy pumping losses reference level
E 0 , e —global energy loss reference, equal to E l , e + E f , e + E p , e
γ1—the weighting factor for energy leakage losses reference
γ f —the weighting factor for energy friction losses reference
γ p —the weighting factor for energy pumping losses reference
The value of actual losses was calculated by means of an energy audit [19].
The reference value of an indicator could be calculated using:
  • Economic level of leakage (ELL) [26] and infrastructure leakage index (ILI) [27] for leakage energy losses;
  • Economic level of friction (ELF) [28] for friction energy losses;
  • Minimum efficiency index (MEI) and energy efficiency index as defined by the European Commission [29] for pumping station losses.
The article described a detailed methodology for calculating components of the global energy score.
Bottom-up methodology

The EPANET model was used.

The authors presented a case study using a simple network with 13 pipes, 10 nodes, two pumps, and a reservoir. The authors presented an energy and water audit for the network. In the article, the authors also provided a detailed description of methods of calculating reference values for the indicators.
16. A Comprehensive and Well Tested Energy Balance for Water Supply Systems [30]
This article presented energy balance and performance indicators for assessing water distribution networks. The methodology consisted of three stages: system characterization and data collection, energy balance calculation, and performance indicator assessment. The authors described the novel features of their audit method and differences between their energy balance and previous ones (e.g., Cabrera et al. [19]).The methodology was based on three stages:
  • System characterization and data collection—during this step, the boundaries of the system and main assets (pipes, tanks, pumps) should be described, and all data needed for the energy balance were collected.
  • Perform energy balance—the authors presented the energy balance (Figure A2 Appendix B). It was stated that two types of assessment might be performed: simplified assessment (which requires a minimal amount of data and can be used without a computer model of the water distribution system) and complete assessment (which requires a calibrated model of the water distribution system). In the article, the authors presented methods for calculating each component of the energy balance.
  • Assessment of energy performance indicators. The authors indicated that the Ph5 indicators (from the IWA Manual [3]) and specific energy consumption could be calculated as performance indicators.
The authors proposed the following additional performance indicators:
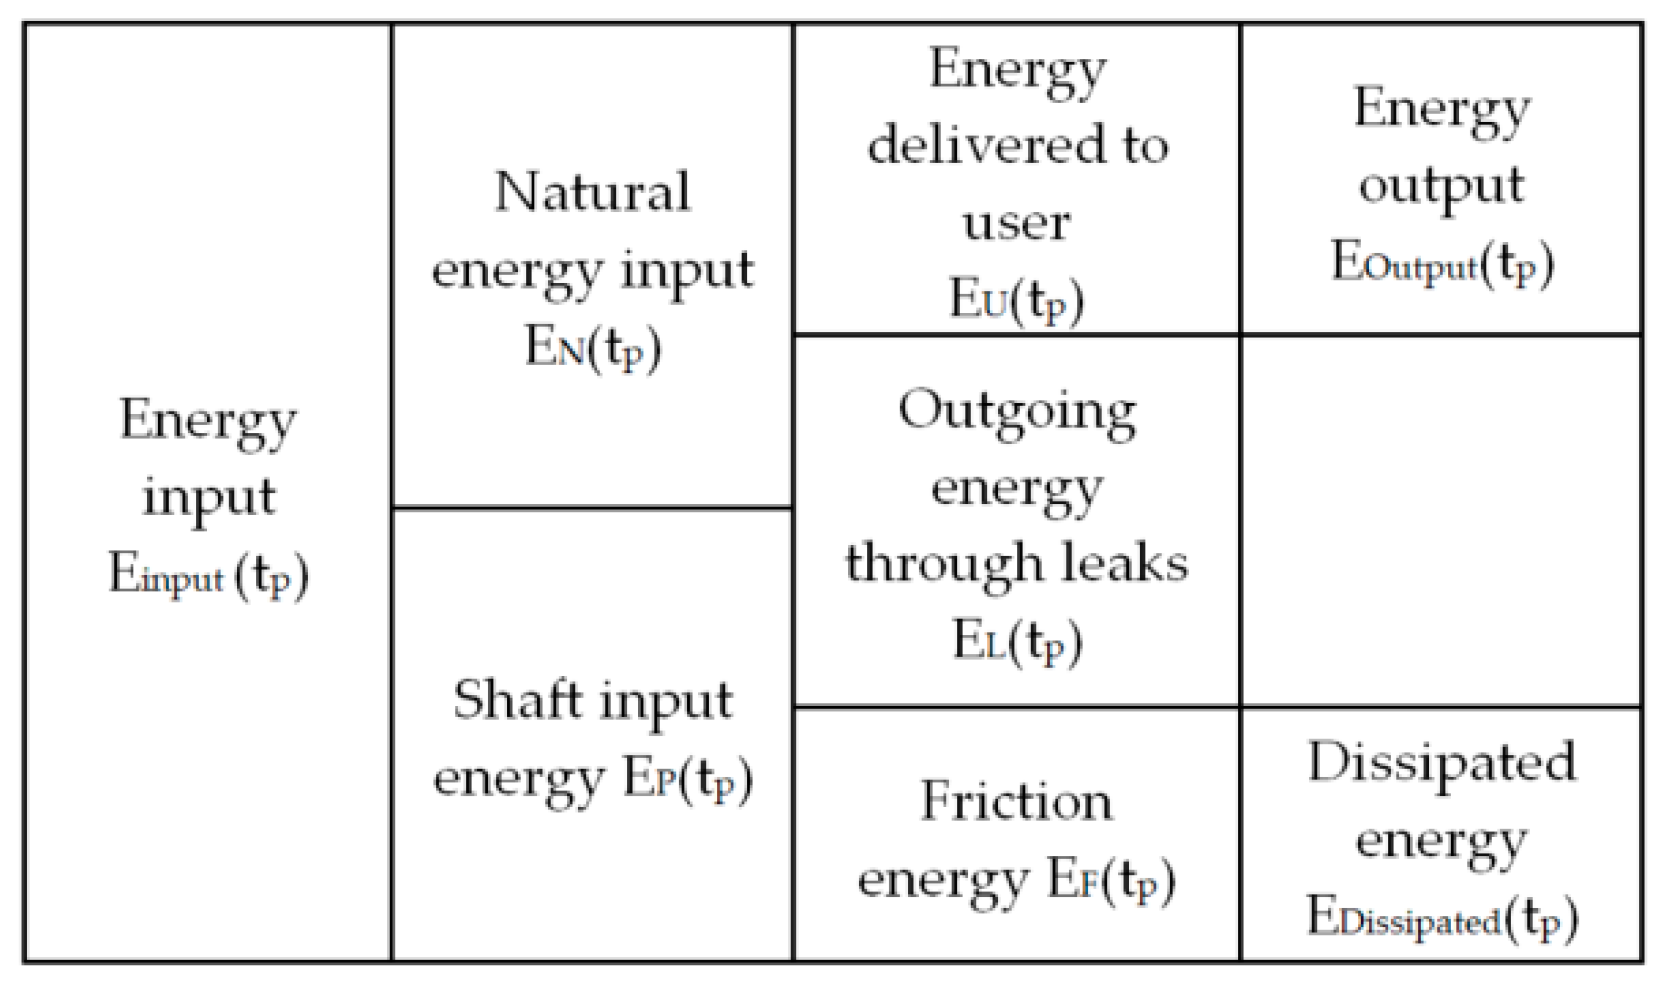
E2—Energy in excess per unit of authorized consumption (kWh/m3), defined as:
E2 = (Etot − Emin− Erec)/∀AC
where:
Etot—total input energy
Emin—the minimum required energy to supply consumers
Erec—energy recovery from the system
AC—annual authorized consumption
E2 (natural)—Natural energy in excess per unit of authorized consumption (kWh/m3), defined as:
E2 (natural) = (EN − Emin− Erec)/∀AC
where:
EN—natural energy input to the system

Figure A2 Energy balance scheme [30]

E2 (shaft)—Shaft energy in excess per unit of authorized consumption (kWh/ m3), defined as:
E2 (shaft) = (ES − Emin− Erec)/∀AC
where:
ES—shaft energy input to the system

E3—Ratio of the total energy in excess (–), defined as:
E3 = (Etot − Emin− Erec)/Emin

E3 (network)—Ratio of the energy in excess due to network operation and layout (–), defined as:
E3 (network) = (Esurp + Ediss,pAC + Ediss,vAC)/Emin
where:
Esurp—surplus energy in the system
Ediss,pAC—energy loss due to friction associated with authorized consumption
Ediss,vAC—energy loss in valves associated with authorized consumption

E3 (pumps)—Ratio of the energy in excess due to dissipated energy in pumps, defined as:
E3 (pumps) = (Ediss,SAC)/Emin
where:
Ediss,SAC—dissipated energy in pumping stations

E3(losses)—Ratio of the energy in excess due to water losses, defined as:
E3 (losses) = (EWL− ErecWL)/Emin
where:
EWL—input energy associated with water loss
ErecWL—component of recovery energy associated with water loss
Bottom-up methodology

The simplified assessment did not require modeling. During the complete assessment, the EPANET model of a water distribution system could be used to calculate the energy balance values.

The simplified energy balance was tested for 17 water utilities in Portugal, and it was shown that there was significant potential for energy saving in the water sector through reductions in water loss, changes in the network operation layout, and reduced pump inefficiency.

The complete assessment was performed using a calibrated model of a water distribution system supplying water to 62,306 consumers in southern Portugal. The simulation was made for one year, considering winter and summer daily consumption patterns with a 15-min time interval.
17. Energy Balance for a Water Distribution System [31]
In this research, the energy balance for a water distribution system was presented. The balance was obtained using the law of energy conservation.The energy balance was presented as follows:
E in _ s + Δ E in _ p = Δ E loss _ f + Δ E loss _ v + Δ E r _ t + Δ E tan + E out _ top + E out _ del
where:
E in _ s —the energy at sources (kWh)
Δ E in _ p —the energy at pumps (kWh)
Δ E loss _ f —the energy lost in pipe friction (kWh)
Δ E loss _ v —the energy lost in valves (kWh)
Δ E r _ t —the energy recovered at turbines (kWh)
Δ E tan —the energy at tanks (kWh)
E out _ top —the energy used to raise the water to node elevation (kWh)
E out _ del —the energy delivered to customers or leaks (kWh)
Bottom-up methodology

A computer model of a water distribution system was used.

Two case studies for the energy balance were presented. It was noted that the energy balance allowed one to compare different systems. It was emphasized that it could be difficult to compare energy balance values between systems because each system has specific characteristics. It was also necessary to collect a large quantity of data to perform an audit. Because of this, the authors stated with regard to the energy balance: “it is not certain whether this can become a practical engineering tool”. It was pointed out that the minimization of energy losses might be profitable only for water mains. The authors pointed out that in some countries, such as the United States, networks are designed for fire conditions, and therefore the values of energy losses due to friction in pipes are usually small or negligible. The energy balance could be used to better describe the network, but, in engineering practice, the derivation of the balance would not in itself increase energy efficiency. Increased efficiency is possible only through corrective actions. In some cases, the preparation of a balance might support the planning of such tasks.
18. Energy Metrics for Water Distribution System Assessment: Case Study of the Toronto Network [32]
The authors presented an energy metric for a water distribution system based on EPANET modeling. Aggregate indicators of capacity, efficiency, and costs were given.The energy metric was derived from the following general equation:
E supplie = E dissipated + E lost + E potential + E delivered
where:
E supplie —the energy supplied at pumps, tanks, and reservoirs (Wh)
E dissipated —the energy dissipated in pipes, pumps, connections, and valves due to friction and inefficiency (Wh)
E lost —the energy lost due to leakage of pressurized water (Wh)
E potential —the energy delivered to nodes or tanks in the form of pressure and velocity, including requirements and excess energy (Wh)
E delivered —the potential energy established by the difference in elevation between supply and delivery
The authors presented equations for calculating each value.
Bottom-up methodology

The EPANET model was used.

The case study concerned a skeletonized model of the Toronto water distribution system. The system consisted of 6000 km of water mains and served a population of 470,000. The article included a graph of daily energy dissipation due to different causes in two scenarios: winter and summer. Also, the daily cost of energy and the amount of CO2 produced were presented. The calculated metrics for all pipes were shown on maps.
19. From Energy Balance to Energy Efficiency Indicators, Including Water Losses [33]
The main objective of this work was to determine a methodology for assessing the energy efficiency of the entire water supply system and to determine the impact of water losses on the value of energy efficiency indicators. Indicators were determined on the basis of the energy balance described by Cabrera et al. [19].The following performance indicators were proposed as additions to the energy balance:
  • WSEE—Water supply energy efficiency, defined as
    W S E E = E min ( t p ) E P C ( t p )   [ ]
where:
E min ( t p ) —the difference between the minimum potential energy of water supplied to users and potential energy input to the system during the simulation period; Emin was determined according to the definition given by Pelli and Hitz [28]
E PC ( t p ) —the energy actually consumed by the pumps (kWh)
  • NEE—Network energy efficiency. defined as:
    N E E = E min ( t p ) E P 0 ( t p )   [ ]
where:
E P 0 ( t p ) —the energy consumed by the pumps in hypothetical zero-leakage conditions (kWh)
LEE—Leakage energy efficiency, defined as:
L E E = E P 0 ( t p ) E P ( t p )   [ ]
where:
E P ( t p ) —the energy supplied to the water by all pumping stations (kWh)
  • PEE (Pumping energy efficiency):
    P E E = E P ( t p ) E P C ( t p )   [ ]
Bottom-up methodology

EPANET software was used for the calculation of performance indicators.

The methodology was tested in two case studies. The first concerned Ganaceto DMA, part of the water distribution system in Modena, Italy, with a 35.37 km network, serving a population of 2925. The second was for Marzaglia DMA, part of the Modena system with a 5km network, serving a population of 1247, with two variable-speed pumps.
20. Measuring Energy Efficiency in Urban Water Systems Using a Mechanistic Approach [34]
In this paper, the authors presented an energy efficiency metric for raw water extraction in an urban water supply system. The authors gave a score based on the ratio between minimum and actual energy usage in water utilities. This approach was contrasted with a benchmarking method based on an empirical approach.The mechanistic approach was based on analyzing the energy requirements of each asset in the process. The scope of the research was limited to raw water pumping. The thermodynamic score was defined as:
TS = 100 ( E min E actual )   [ % ]
where:
E min —minimum required energy (J), described as a function:
E min = f ( E ideal ,   pump   efficiency ,   water   loss ,   required   pressure )
where:
E ideal —theoretical minimum required to deliver raw water to the treatment station, defined as:
E ideal = static   head + friction   head   loss
The ideal conditions were defined as follows:
  • Water is delivered at zero pressure
  • Water loss is zero
  • Wire-to-water pumping efficiency is 100%
E actual —actual energy use (J)
Bottom-up methodology

The authors used the Darcy–Weisbach equation to calculate friction loss.

The scope of the research was limited to raw water pumping. A case study for eight voluntary water utilities in Virginia was described. The result obtained for the thermodynamic score was compared with an energy benchmarking methodology [12]. The authors compared the two methods and showed the advantages and disadvantages of each. Both types of methodology were needed for a good complete assessment.
21. Modeling of Hydraulic and Energy Efficiency Indicators for Water Supply Systems [35]
The authors proposed a methodology for calculating energy efficiency indicators for pumps. The main aim of the research was to create new energy effectivity indicators. The main reason for undertaking the research was problems with using standard energy consumption indicators (unit energy consumption per m3). The proposed indicators were developed using the general definition of effectiveness, described as the ratio of the targeted effect on the number of resources necessary to implement the process.The following performance indicators were proposed:
  • TGEE—Theoretical global energy efficiency, defined as:
    T G E E = E O U T E I N P 100   [ % ]
where:
E OUT —the energy delivery to the user (kWh)
E INP —the total energy consumed by the system (kWh)
  • PGEE—Potential global energy efficiency, defined as:
    P G E E = O E O U T E I N P 100   [ % ]
where:
OE OUT —the minimum energy necessary to meet consumer demand, assuming that there is no pressure excess at any junction (kWh)
  • GEE—Global energy efficiency indicator, defined as:
    G E E = V A E L D S E L D 100   [ % ]
where:
VA ELD —target-value energy, the minimum energy supplied to the system, assuming that the system is operated optimally in technological terms. This value is obtained through optimization;
S ELD —current energy consumption (kWh)

The authors proposed a general energy efficiency indicator. This indicator described how the current situation (value of indicators) corresponded to the optimal hydraulic conditions of operation. This indicator was defined as:
I = V A S 100   [ % ]
where:
VA—target value of the analyzed component (indicator)
S—current value of the indicator
Bottom-up methodology

The authors focused only on the assessment of the energy use of pumps (using characteristics of pumps and pipes).

The methodology was based on comparing the values of indicators for pumps in operation and model pumps operating in optimal conditions. The analyzed case study concerned a simple system consisting of a pump and a reservoir. In the study, the potential gains from optimization were calculated. The authors gave examples of methods for determining optimal pump operating conditions. The study was supplemented by guidelines for improving energy efficiency in water supply systems.
22. Impact of Pipe Roughness on Pumping Energy in Complex Distribution Systems [36]
This paper considered the impact of pipe roughness on the amount of energy consumed in the process of pumping water and the impact of system rehabilitation on increasing the energy efficiency of the system.Potential energy savings for various recovery plans for the water supply network were analyzed. The Hazen–Williams equation was used to estimate head losses in pipes. The methodology entailed comparing different scenarios of system modernization and calculating the percentage change in energy dissipation for each scenario.Bottom-up methodology

A computer model of a water distribution system was used.

The research was conducted using real data for a system consisting of 28 pumping stations, 5900 km of network, and 121 pumps, which pump 530 megaliters of water per day, supplying the one-million population of a city in the Midwestern United States. The case study showed that even in the case of a large system, the savings from pipe rehabilitation would be small. The authors calculated the possible savings at only 0.7% to −0.2%. For some scenarios, network renovation might increase the energy consumption of the entire system.
23. Pipe-Level Energy Metrics for Energy Assessment in Water Distribution Networks [37]
This article described methods for assessing energy transformation in individual pipelines of water supply systems.The following equation was obtained as an energy balance for pipes:
E s u p p l i e d = E d e l i v e r e d + E d s + E l e a k + E f r i c t i o n ( d e m a n d ) + E f r i c t i o n ( l o s s ) +   E f r i c t i o n ( d s ) + E l o c a l
where:
E supplied —the energy supplied to the upstream end of the pipe (kWh)
E delivered —the energy delivered to the user to satisfy demand at required pressure head (kWh)
E ds —the energy that flows out of the pipe to meet downstream user demands (kWh)
E leak —the energy lost from water loss due to leakage (kWh)
E friction ( demand ) —friction energy loss to meet the demand at the end of each pipe (kWh)
E friction ( loss ) —friction energy loss to carry a portion of the flow to meet leakage at the end of each pipe (kWh)
E friction ( ds ) —frictional losses associated with the conveyance of flow to downstream users (kWh)
E local —local energy losses through valves or turbine, or blockages (kWh)
The article described methods for calculating the above values, using computer models of water supply networks. The EPANET software was used.
The authors proposed performance indicators, describing the efficiency of energy use in the water supply system:
  • Efficiency metrics—describe the water supply energy efficiency:
    M1—the ratio between energy delivered to the user and energy supplied to the system:
    M 1 = E d e l i v e r d E s u p p l i e d   [ ]
    M2—the ratio between energy delivered to the user and the net energy in the pipe:
    M 2 = E d e l i v e r d E s u p p l i e d E d s E f r i c t i o n ( d s )   [ ]
  • Requirements metric—defined as the relationship between the required energy to be delivered to users (to fulfill water network requirements) and the amount of energy supplied to users. This indicator describes the pressure excess in the water supply network:
    M 3 = E d e l i v e r d E r e q   [ ]
  • Energy loss metrics—describe the relationship between energy loss and energy supplied to the pipes:
  • M4—includes the part of energy loss connected with friction, but only for water flow, which is delivered to users:
    M 4 = E f r i c t i o n E s u p p l i e d E d s E f r i c t i o n ( d s ) [ ]
  • M5—includes the part of energy loss connected with friction, for water flow delivered to users and for water flow lost due to leakage:
    M 5 = E l e a k + E f r i c t i o n ( l e a k ) E s u p p l i e d E d s E f r i c t i o n ( d s ) [ ]
Bottom-up methodology

The authors used the EPANET Toolkit and Visual Basic code to model the water supply system.

The article presented example calculations of the energy balance and performance metrics for water supply networks. Two case studies were presented. The first concerned a network with 12 pipes with a total length of 19,260 m. The second concerned the network reported by Cabrera [19] with 14 pipes totaling 40 km. Numerical values of the calculated indices were given, but no rules for their evaluation (acceptable values) were defined.
24. Life-Cycle Energy Analysis of a Water Distribution System [38]
The authors proposed an LCA (life-cycle energy analysis) to assess the total amount of energy consumed during the production, operation, and disposal of water transport lines. The total energy consumption was calculated using unit indicators.According to the methodology, the total amount of energy necessary for the production, use, and utilization of the pipeline was defined as a sum of energy used during:
  • Pipeline production—understood as costs of extraction and processing of materials, production, and transport. The value was estimated using the unit energy consumption for the production of a given material, published by the U.S. Department of Commerce. The methodology took into account the case when the pipeline material could be recycled.
  • Use of the pipeline—energy usage was estimated, taking into account the lifetime of the pipes and their repairs. To calculate the value of energy losses in pipelines, the total usage time was divided into discrete intervals. For each interval, energy loss due to friction was calculated using a computer model of the water distribution system (EPANET). The aging of pipelines was also taken into account: changes in the roughness coefficient over time were estimated, and the efficiency of the pumping system was adjusted due to pump aging. The methodology allowed the account to be taken of the possibility of energy recovery as a result of the use of turbines. The energy needed to repair pipelines was calculated using a statistical model (estimation of the number of failures).
  • The disposal phase—energy usage was determined on the basis of unit indicators, taking into account the possibility of partial or full recycling of the material.
Bottom-up methodology

The authors used the EPANET model to estimate energy dissipation due to friction.

Case study analyses were carried out, for example, simple water supply networks consisting of 16 and 20 nodes (the New York Tunnel problem). A sensitivity analysis was also carried out—the authors showed how the final result (the total amount of energy consumed) was affected by changes in the model parameters, such as pipe roughness.
25. Life-Cycle Assessment of a Water Distribution System Pump [39]
Use of the EIO-LCA (economic input-output life-cycle assessment) methodology was proposed to determine the overall life cycle costs of pumps. The article described a model only for pumps, the element of the water supply system with the highest energy demand.Methods for determining life cycle costs, the amount of energy consumed, and greenhouse gas emissions were described. Indicators and rules for calculating the values of these parameters for the EIO-LCA methodology were given. The methodology of indicator assessment consisted of comparing values of indicators for different pump operation scenarios. In the analysis, technical aspects (energy consumption), as well as environmental (greenhouse gas emissions) and economic aspects (cost, planning period, discount rate, etc.), were considered.Bottom-up methodology

The hydraulics of the system were represented by the pump and system characteristic curves.

A case study considered a pump installed in an Ontario water treatment plant. The analyses covered the years from 1997 to 2003.

Appendix B. Energy Balance for Water Networks

Figure A1. Components of an energy audit of a water network [19].
Energies 12 04599 g0a1
Figure A2. Energy balance for water supply system [30].
Energies 12 04599 g0a2

References

  1. Water in the West. In Water and Energy Nexus; Stanford University: Stanford, CA, USA, 2013.
  2. Gómez, E.; Del Teso, R.; Cabrera, E.; Cabrera, E.; Soriano, J. Labeling Water Transport Efficiencies. Water 2018, 10, 935. [Google Scholar] [CrossRef] [Green Version]
  3. Alegre, H.; Baptista, J.M.; Jr, E.C.; Cubillo, F.; Duarte, P.; Hirner, W.; Merkel, W.; Parena, R. Performance Indicators for Water Supply Services; IWA Publishing: London, UK, 2016. [Google Scholar]
  4. Sigma. Performance Software for Water Undertakings. ITA. Introduction. Available online: https://www.sigmalite.com/sigma-en.php (accessed on 17 July 2019).
  5. AWARE-P AWARE-P / Home. Available online: http://aware-p.org/np4/home (accessed on 17 July 2019).
  6. ECAM Web Tool. Available online: http://wacclim.org/ecam/ (accessed on 6 July 2019).
  7. IBNET English | The International Benchmarking Network. Available online: https://www.ib-net.org/ (accessed on 6 July 2019).
  8. Danilenko, A.; Van den Berg, C.; Macheve, B.; Macheve, L.J. The IBNET Water Supply and Sanitation Blue Book 2014: The International Benchmarking Network for Water and Sanitation Utilities Databook; The World Bank: Washington, DC, USA, 2014. [Google Scholar]
  9. Aquarating. Available online: http://aquarating.org/ (accessed on 6 July 2019).
  10. United States Environmental Protection Agency. Energy Use Assessment at Water and Wastewater Systems. Available online: https://www.epa.gov/sustainable-water-infrastructure/energy-use-assessment-water-and-wastewater-systems (accessed on 17 July 2019).
  11. McGuckin, R.; Oppenheimer, J.; Badruzzaman, M.; Contreras, A.; Jacangelo, J.G. Toolbox for Water Utility Energy and Greenhouse Gas Emission Management; Water Research Foundation: Denver, CO, USA, 2013. [Google Scholar]
  12. Carlson, S.W.; Walburger, A. Energy Index Development for Benchmarking Water and Wastewater Utilities; AWWA Research Foundation: Denver, CO, USA, 2007. [Google Scholar]
  13. Watergy. Available online: https://www.ase.org/projects/watergy (accessed on 6 July 2018).
  14. Baki, S.; Makropoulos, C. Tools for Energy Footprint Assessment in Urban Water Systems. Procedia Eng. 2014, 89, 548–556. [Google Scholar] [CrossRef] [Green Version]
  15. Rozos, E.; Makropoulos, C. Source to tap urban water cycle modelling. Environ. Model. Softw. 2013, 41, 139–150. [Google Scholar] [CrossRef] [Green Version]
  16. Lima, G.M.; Viana, A.N.C.; Dias Junior, R.S.C.; Luvizotto Junior, E. Classification of water supply systems based on energy efficiency. Water Supply 2015, 15, 1193–1199. [Google Scholar] [CrossRef]
  17. SNIS—Sistema Nacional deInformaçõesSobreSaneamento—PáginaInicial. Available online: http://www.snis.gov.br/ (accessed on 17 July 2019).
  18. Pelli, T.; Hitz, H.U. Energy indicators and savings in water supply. J. Am. Water Work. Assoc. 2000, 92, 55–62. [Google Scholar] [CrossRef]
  19. Cabrera, E.; Pardo, M.A.; Cobacho, R. Energy Audit of Water Networks. J. Water Resour. Plan. Manag. 2010, 136, 669–677. [Google Scholar] [CrossRef]
  20. Gomez, E. ITAEnergy, a tool to perform energy audits in water pressurized networks. In Proceedings of the Water Ideas 2016, Intelligent Distribution for Efficient and Affordable Supplies, Bologna, Italy, 18–21 October 2016. [Google Scholar]
  21. Cabrera, E.; Gómez, E.; Soriano, J.; Espert, V. Energy Assessment of Pressurized Water Systems. J. Water Resour. Plan. Manag. 2014, 141. [Google Scholar] [CrossRef]
  22. Cabrera, E.; Cabreraa, E., Jr.; Cobachoa, R.; Sorianoa, J. Towards an energy labeling of pressurized water networks. Procedia Eng. 2014, 70, 209–217. [Google Scholar] [CrossRef] [Green Version]
  23. European Commission Brussels; EU (European Union). Directive 2010/30/ on the Indication by Labelling and Standard Product Information of the Consumption of Energy and Other Resources by Energy-Related Products; European Commission Brussels: Brussels, Belgium, 2010. [Google Scholar]
  24. European Commission Brussels; U (European Union). Directive 2009/125/EC of the European Parliament and of the Council with Regard to Ecodesign Requirements for Water Pumps; European Commission Brussels: Brussels, Belgium, 2012. [Google Scholar]
  25. European Commission Brussels; U (European Union). Directive 2010/30/on Energy Efficiency; European Commission Brussels: Brussels, Belgium, 2012. [Google Scholar]
  26. Review of the Sustainable Economic Level of Leakage. Available online: http://www.waterukevents.co.uk/documents/Nigel%20Hepworth%20EA%20Introduction%20to%20the%20review.pdf (accessed on 6 July 2019).
  27. Lambert, A. Losses from Water Supply Systems: Standard Terminology and Recommended Performance Measures; IWA Blue-pages: London, UK, 2010. [Google Scholar]
  28. Cabrera, E.; Gómez, E.; Cabrera, E.; Soriano, J. Calculating the Economic Level of Friction in Pressurized Water Systems. Water 2018, 10, 763. [Google Scholar] [CrossRef] [Green Version]
  29. EUR-Lex—32012R0547—EN—EUR-Lex. Available online: https://eur-lex.europa.eu/legal-content/EN/TXT/?uri=CELEX%3A32012R0547 (accessed on 17 July 2019).
  30. Mamade, A.; Loureiro, D.; Alegre, H.; Covas, D. A comprehensive and well tested energy balance for water supply systems. Urban Water J. 2017, 14, 853–861. [Google Scholar] [CrossRef]
  31. Walski, T. Energy Balance for a Water Distribution System. In Proceedings of the World Environmental and Water Resources Congress 2016, West Palm Beach, FL, USA, 22–26 May 2016. [Google Scholar]
  32. Dziedzic, R.; Karney, B.W. Energy Metrics for Water Distribution System Assessment: Case Study of the Toronto Network. J. Water Resour. Plan. Manag. 2015, 141. [Google Scholar] [CrossRef] [Green Version]
  33. Lenzi, C.; Bragalli, C.; Bolognesi, A.; Artina, S. From energy balance to energy efficiency indicators including water losses. Water Sci. Technol. Water Supply 2013, 13, 889–895. [Google Scholar] [CrossRef]
  34. Gay, L.F.; Sinha, S.K. Measuring Energy Efficiency in Urban Water Systems Using a Mechanistic Approach. J. Infrastruct. Syst. 2013, 19, 503–505. [Google Scholar] [CrossRef]
  35. Vilanova, M.R.N.; Balestieri, J.A.P. Modeling of hydraulic and energy efficiency indicators for water supply systems. Renew. Sustain. Energy Rev. 2015, 48, 540–557. [Google Scholar] [CrossRef]
  36. Speight, V.L. Impact of Pipe Roughness on Pumping Energy in Complex Distribution Systems. Procedia Eng. 2014, 70, 1575–1581. [Google Scholar] [CrossRef]
  37. Hashemia, S.; Filion, Y.R.; Speight, V.L. Pipe-level Energy Metrics for Energy Assessment in Water Distribution Networks. Procedia Eng. 2015, 119, 139–147. [Google Scholar] [CrossRef] [Green Version]
  38. Filion, Y.R.; MacLean, H.L.; Karney, B.W. Life-Cycle Energy Analysis of a Water Distribution System. J. Infrastruct. Syst. 2004, 10. [Google Scholar] [CrossRef] [Green Version]
  39. Nault, J.; Papa, F. Lifecycle Assessment of a Water Distribution System Pump. J. Water Resour. Plan. Manag. 2015, 141. [Google Scholar] [CrossRef]
  40. Performance Monitoring—Water in New South Wales. Available online: https://www.industry.nsw.gov.au/water/water-utilities/best-practice-mgmt/performance-monitoring (accessed on 17 July 2019).
  41. Rossman, L. Epanet 2 User Manual; National Risk Management Research Laboratory, US EPA: Cincinnati, OH, USA, 2000.
  42. Walski, T.M.; Chase, D.V.; Savic, D.A.; Grayman, W.; Beckwith, S.; Koelle, E. Advanced Water Distribution Modeling and Management; Bentley Institute Press: Exton, PA, USA, 2007. [Google Scholar]
  43. Boulos, P.F.; Lansey, K.E.; Karney, B.W. Comprehensive Water Distribution Systems Analysis Handbook for Engineers and Planners; American Water Works Assosiationn: Pasadena, CA, USA, 2006. [Google Scholar]
  44. American Water Works Association. Computer Modeling of Water Distribution Systems—Manual of Water Supply Practices, M32, 3rd ed.; American Water Works Association: Pasadena, CA, USA, 2012. [Google Scholar]
  45. American Water Works Association. M36 Water Audits and Loss Control Programs, 4th ed.; American Water Works Association: Pasadena, CA, USA, 2016. [Google Scholar]
  46. Kapelan, Z. Calibration of Water Distribution System Hydraulic Models; Lambert Academic Publishing: Saarbrücken, Germany, 2010. [Google Scholar]
  47. Cabrera, E.; Gómez, E.; Cabrera, E.; Arregui, F. Discussion of “Energy Metrics for Water Distribution System Assessment: Case Study of the Toronto Network” by Rebecca Dziedzic and Bryan, W. Karney. J. Water Resour. Plan. Manag. 2016, 142, 07016003-1–07016003-3. [Google Scholar] [CrossRef]
  48. Dziedzic, R.; Karney, B.W. Closure to “Energy Metrics for Water Distribution System Assessment: Case Study of the Toronto Network” by Rebecca Dziedzic and Bryan, W. Karney. J. Water Resour. Plan. Manag. 2016, 142. [Google Scholar] [CrossRef]
  49. Awwa Water Loss Control Committee. Committee Report: Applying worldwide BMPs in water loss control. J. Am. Water Work. Assoc. 2003, 95, 65–79. [Google Scholar] [CrossRef]
  50. Bałut, A. Modelling of water distribution systems in low pressure condition, Gas. Water Sanit. Eng. 2019, 1, 19–23. [Google Scholar] [CrossRef]
  51. Ciaponi, C.; Creaco, E. Comparison of Pressure-Driven Formulations for WDN Simulation. Water 2018, 10, 523. [Google Scholar] [CrossRef] [Green Version]
  52. Muranho, J.; Ferreira, A.; Sousa, J.; Gomes, A.; Marques, A.S. Pressure-dependent Demand and Leakage Modelling with an EPANET Extension—WaterNetGen. Procedia Eng. 2014, 89, 632–639. [Google Scholar] [CrossRef] [Green Version]
  53. Seyoum, A.G.; Tanyimboh, T.T. Investigation into the Pressure-Driven Extension of the EPANET Hydraulic Simulation Model for Water Distribution Systems. Water Resour. Manag. 2016, 30, 5351–5367. [Google Scholar] [CrossRef] [Green Version]
  54. IPCC—Intergovernmental Panel on Climate Change. Available online: https://www.ipcc.ch/ (accessed on 18 July 2019).
  55. Burton, A.; Bent, C.; Horne, B.; Grossman, C.; Wai Cheng, W.; Orgill, Y.; Philpot, C.; Schein, J.; Xue, B. Review of International Water Efficiency Labelling; The International Water Association Efficient Urban Water Management Specialist Group: London, UK, 2019. [Google Scholar]
Figure 1. The scheme of the water supply system.
Energies 12 04599 g001
Figure 2. Scheme of energy transformation in a water supply system.
Energies 12 04599 g002
Table 1. Comparative analyses of energy assessment methodologies.
IDTop-Down/
Bottom-Up
Performance Indicators, Reference Value, and Performance AssessmentPhysical Process ModelingSet of Recommendation
(Yes/No)
1. IWA Manual of Performance Indicators for Water Supply Services [3]Top-DownFive indicators
No reference value
NoThe set of recommendation about implementing a performance assessment system is presented
2. ECAM—Energy Performance and Carbon Emissions Assessment and Monitoring Tool [6]Top-Down18 indicators
Internal benchmarking and reference value from literature
NoWeb-based learning platform
3. IBNET—The International Benchmarking Network [7,8]Top-DownTwo indicators
External benchmarking
NoA Web-based platform for supporting water utility managers was developed in the project.
4. AquaRating [9]Top-DownTwo indicators with a reference value
Eight good practice
NoSet of good practice, a case study published on a Web page
5. EPA’s Energy Use Assessment Tool [10]Top-DownUnit energy usage and cost indicators
Internal benchmarking
NoGuide and Excel spreadsheet
6. Water Research Foundation—Toolbox for Water Utility Energy and Greenhouse Gas Emission Management [11]Top-DownNo (present a review of indicators used in other projects)No Several case studies and recommendation arepresented
7. Energy Index Development for Benchmarking Water and Wastewater Utilities [12]Top-DownPerformance metric (ratio between average energy use and the energy calculated from the statistical model)Statistical modelSeveral case studies and recommendation arepresented
8. WATERGY: Energy and Water Efficiency in Municipal Water Supply and Wastewater Treatment—Cost-Effective Savings of Water and Energy [13]Top-DownNoNoThe guide shows a collection of best practices
9. Tools for Energy Footprint Assessment in Urban Water Systems [14]Top DownUnit energy usageNo Recommendations described in case study
10. Classification of Water Supply Systems Based on Energy Efficiency [16]Top DownSix performance indicators
External benchmarking
No The study shows the methodology which can help to assess big groups of different water utilities (e.g., In regulatory benchmarking)
11. Energy Indicators and Savings in Water Supply [18]Bottom-UpTwo performance indicators
The reference value based on the concept of minimal energy is presented
Yes (model of ideal energy)Set of recommendation about the possibility of energy recovery from the water supply system
12. Energy Audit of Water Networks [19]Bottom-UpFive performance indicators
The concept of “minimal energy” can be used to determine a reference value
Yes (computer model of water distribution system) Recommendation about the energy audit of the water distribution system
13. Energy Assessment of Pressurized Water Systems [21]Bottom-UpThree performance indicators, additional to indicators from “Energy Audit of Water Networks”
The concept of “minimal energy” can be used to determine a reference value
Yes (computer model of water distribution system)Presentation of methods for improving energy efficiency
14. Towards an Energy Labeling of Pressurized Water Networks [22]Bottom-UpIndicators from “Energy audit Water Networks” [19]Yes (computer model of water distribution system)Energy improvement methodology is presented with examples of structural and operational actions which can be carried out
15. Labeling Water Transport Efficiencies [2]Bottom-UpGlobal energy score indicators
Reference value based on the economic level of leakage (ELL), infrastructure leakage index (ILI), economic level of friction (ELF), minimum efficiency index (MEI), and energy efficiency index (EEI)
Yes (computer model of water distribution system)Recommendation about methods of calculating reference values for the indicators
16. A Comprehensive and Well Tested Energy Balance for Water Supply Systems [30]Bottom-Up
and
Top-Down
Seven performance indicators, additional to indicators from “Energy audit [19] of Water Networks” and Ph5 indicators from IWA Manual
Bench
Yes (computer model of water distribution system)Recommendation about energy saving in the water sector through reductions in water loss, changes in the network operation layout, and reduced pump inefficiency
17. Energy Balance for a Water Distribution System [31]Bottom-UpNoYes (computer model of water distribution system)Example of action connected with energy consumption reduction
18. Energy Metrics for Water Distribution System Assessment: Case Study of the Toronto Network [32]Bottom-UpSeveral energy metrics are presented, but there are no new indicators describedYes (computer model of water distribution system)The big case study (Toronto network) is presented as a good practice of energy assessment
19. From Energy Balance to Energy Efficiency Indicators, Including Water Losses [33]Bottom-UpFour performance indicatorsYes (computer model of water distribution system)Two case studies are presented to show how to choose appropriate strategies of energy reduction in the supply system
20. Measuring Energy Efficiency in Urban Water Systems Using a Mechanistic Approach [34]Bottom-UpOne aggregated performance indicator
The concept of “minimal energy” can be used to evaluate indicators value
Yes (simple model based on Darcy–Weisbach equation)In the study, the recommendation about supplement benchmarking with a mechanistic approach is underlined
21. Modeling of Hydraulic and Energy Efficiency Indicators for Water Supply Systems [35]Bottom-UpThree performance indicators and one general energy efficiency indicator (which can be used to evaluate changing energy consumption over time)Yes (simple model based on characteristics of pumps and pipes)The study is supplemented by guidelines for improving energy efficiency in water supply systems. The authors give examples of methods for determining optimal pump operating conditions
22. Impact of Pipe Roughness on Pumping Energy in Complex Distribution Systems [36]Bottom-UpNoYes (computer model of water distribution system)The case study shows the possible savings from pipe rehabilitation
23. Pipe-Level Energy Metrics for Energy Assessment in Water Distribution Networks [37]Bottom-UpFive performance indicators
No reference value
Yes (computer model of water distribution system)Authors show the possibility to use metrics to help municipalities identify energy inefficiencies in and guide the rehabilitation of water mains to reduce energy use and operating cost
24. Life-Cycle Energy Analysis of a Water Distribution System [38]Bottom-UpNoYes (computer model of water distribution system)In the publication, the recommendation about model parameters’ impact on energy usage is presented.
25. Life-Cycle Assessment of a Water Distribution System Pump [39]Bottom-UpNoYes (simple model based on pumps and pipes characteristic curves)In the article, several conclusions about life-cycle costs, energy consumption, and GHG emissions are presented

