1. Introduction
For most of the wind tunnels used in automotive or aerospace applications, the ideal test section flow should be spatially and temporally uniform throughout the whole test volume. However, such ideal flow conditions will most likely never be achieved in a real wind tunnel, but the non-uniformities can be kept in control by careful design of the flow path. One such non-uniformity is flow angularity, defined as the angle between the wind tunnel centerline and the local velocity vector. In the ideal case, it should be zero in both yaw and pitch.
For automotive wind tunnels striving for accurate measurements of the aerodynamic forces of the vehicle, understanding the flow angularity pattern in the test section is an important part of assessing the measurement quality. This has been further emphasized by the introduction of the worldwide harmonized light vehicle test procedure (WLTP) [
1] in 2018. Under these regulations, vehicle manufacturers are allowed to replace costly coast-down tests performed on a test track with wind tunnel measurements for emissions certification, if sufficient flow quality can be demonstrated. For flow angularity, the regulations state that the root mean square of both yaw and pitch shall not exceed
for a grid of nine equally distributed points over the nozzle inlet plane.
There are numerous examples in the literature of test section flow angularity measurements for subsonic and transonic wind tunnels [
2,
3,
4,
5,
6,
7,
8,
9,
10,
11,
12,
13,
14,
15], typically performed as part of commissioning activities during the start-up phase after construction or after an upgrade. However, investigations of the causes of flow angularity in the test section are less common. Arrington et al. [
16] performed measurements of flow angularity in the test section of a subsonic icing tunnel, as well as measurements at a number of stations throughout the wind tunnel circuit. Their investigations showed that the cooler mounted between corners three and four induced some angularity, but that its influence could not be seen in the settling chamber. However, they found large yaw angles in the settling chamber, which they attributed to the flow being overturned by the fourth corner guide vanes. Their findings are in line with Barlow et al. [
17], who provide some guidelines on how to minimize flow angularity, and state that regions of vortexlike flow in the test section often are the result of non-uniform flow upstream of the third corner, or of over- or underturned flow in the forth. In a work by Murthy et al. [
18], extensive measurements were gathered in the settling chamber and test section of a transonic tunnel in order to design a turbulence reduction system. A later work by Amaya and Murthy [
19] reports that the constructed turbulence reduction system, consisting of a honeycomb and two screens, did reduce the flow angularity, especially the yaw component. Furthermore, they showed that the flow in the wide-angle diffuser in the back leg of the tunnel gave rise to instabilities and possibly rotating flow, which was mitigated by a flow-smoothening system.
The present work aims at improving the understanding of the flow angularity pattern in the test section of an automotive slotted wall wind tunnel. This is done using measurements under standard operating conditions as well as with modifications to the flow conditioning in the settling chamber. Furthermore, a vehicle is tested under both the standard operating conditions and with one of the modifications installed, in order to quantify the impact of the flow angularity on the measured forces.
1.1. The Volvo Cars Aerodynamic Wind Tunnel
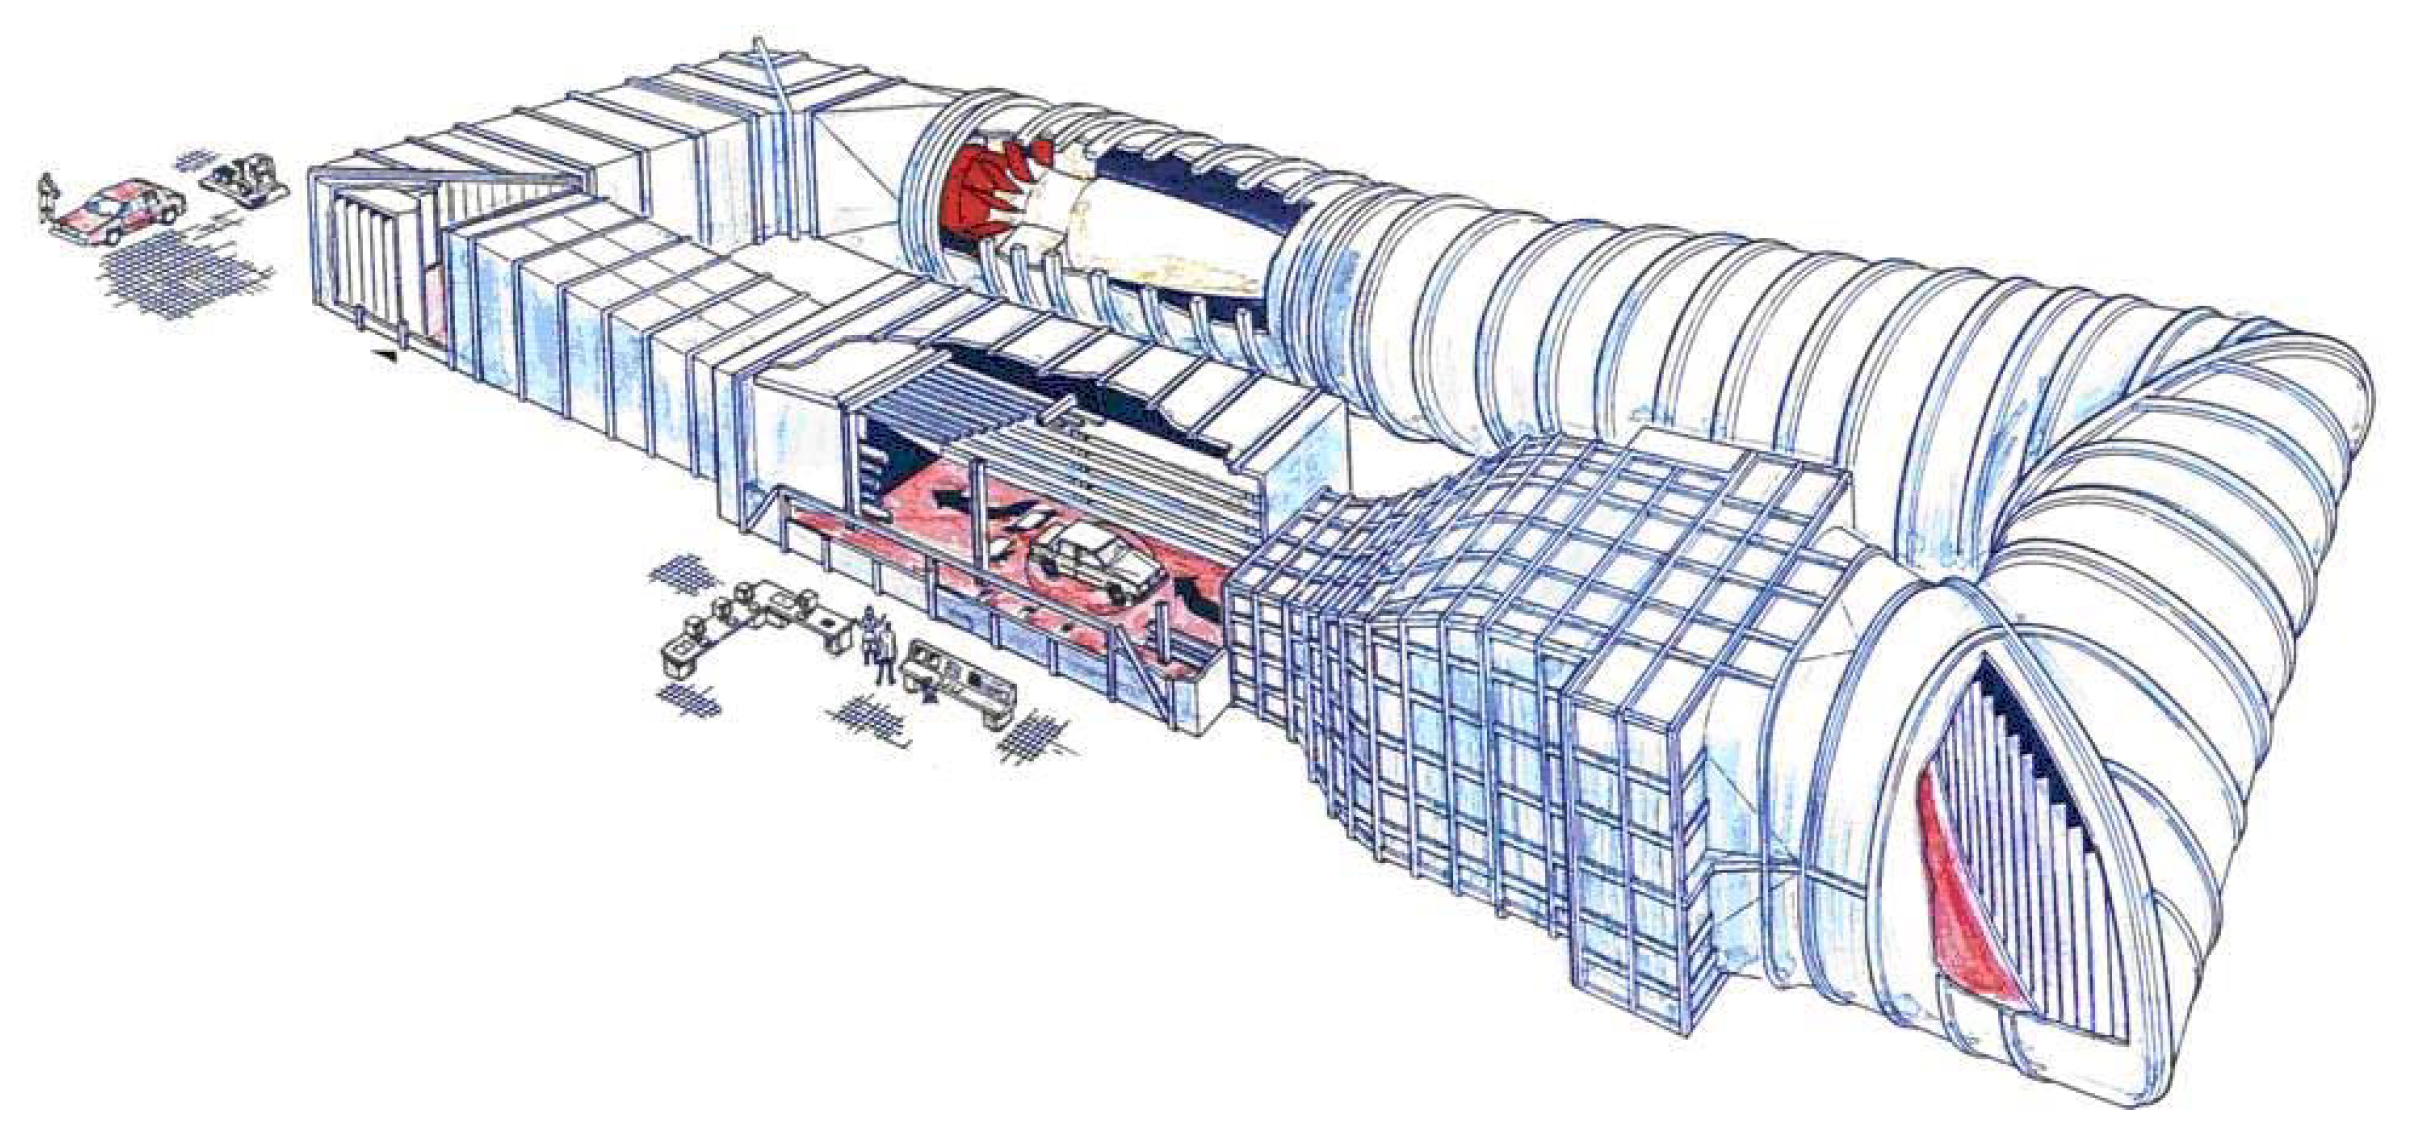
The tunnel under consideration in this work is the Volvo Cars full scale aerodynamic wind tunnel (PVT), which is a closed return tunnel with a slotted wall test section of
cross sectional area. An overview of the tunnel layout can be seen in
Figure 1. The tunnel is capable of both aerodynamic and thermodynamic testing due to its systems for control of both temperature and humidity. At its inauguration in 1986, PVT was not equipped with a rolling road, and boundary layer growth was controlled by a suction patch at the upstream end of the test section. The facility was upgraded with a more powerful fan and improved ground simulation in 2006, which both increased the maximum wind speed to 250
/
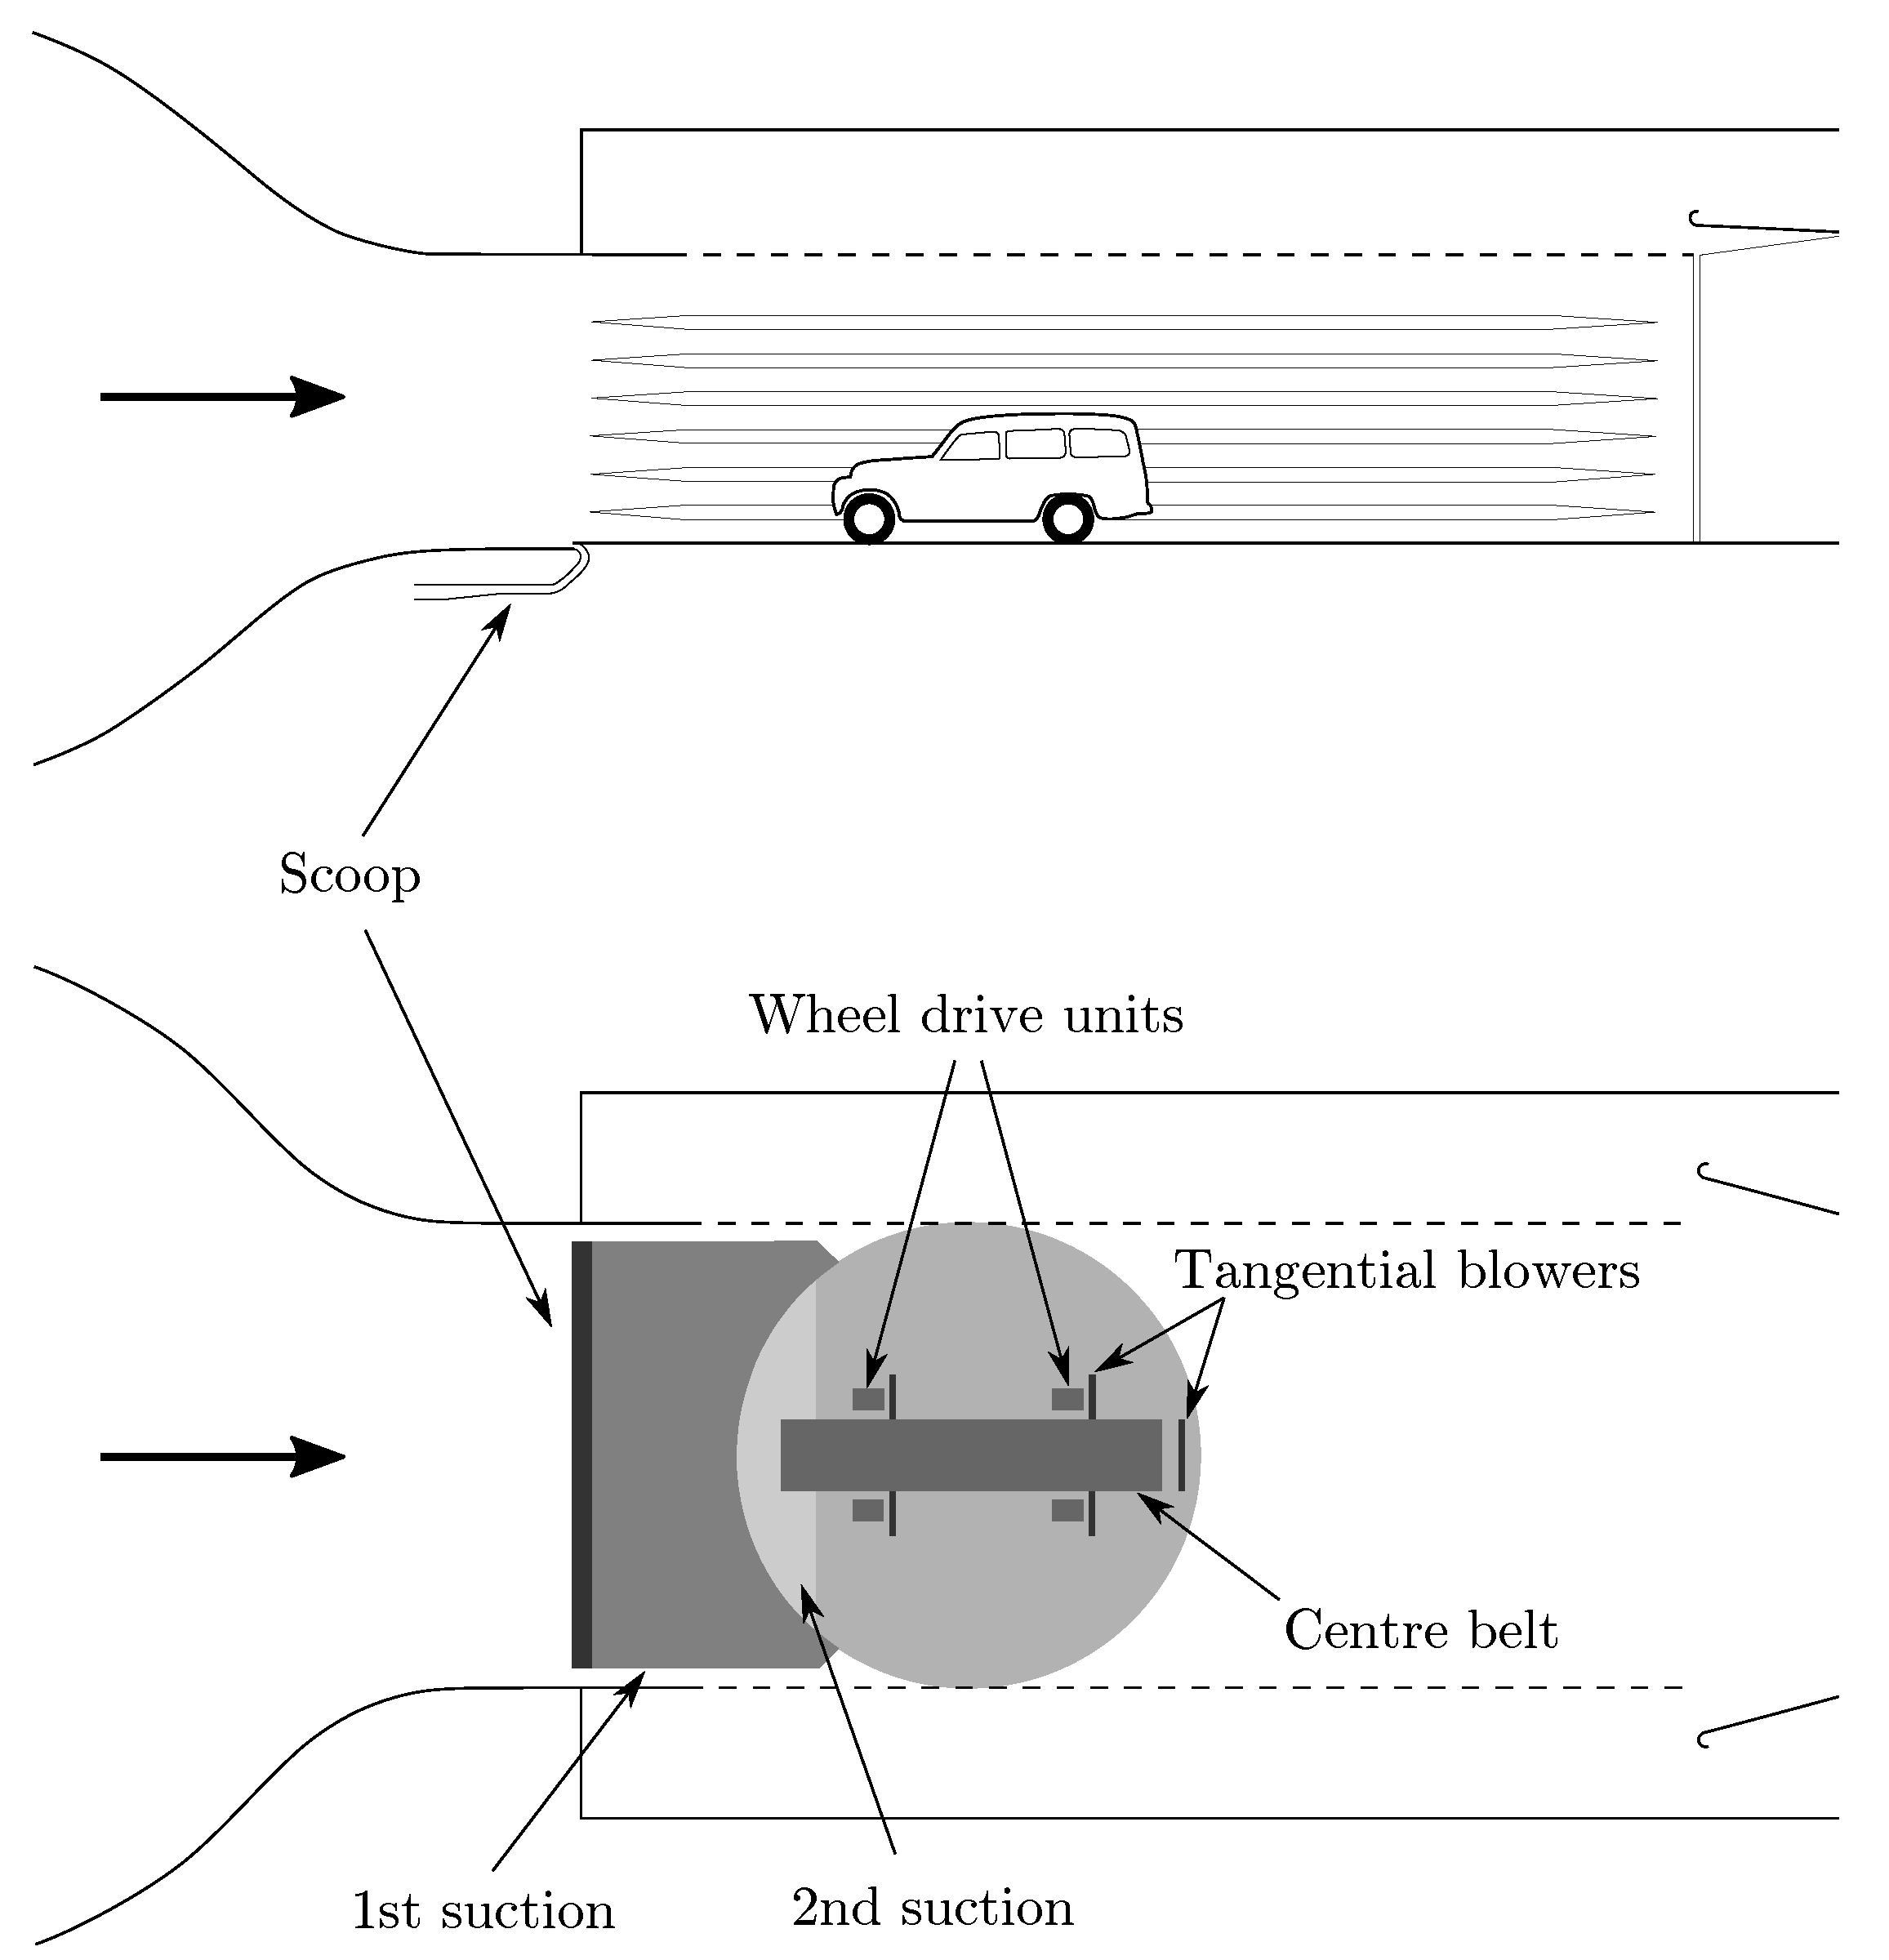
and enhanced the simulation of the on road conditions. The ground simulation system consists of a boundary layer scoop at the upstream end of the test section, followed by distributed suction on the floor upstream of the turntable. A second distributed suction system prevents boundary layer buildup between the upstream end of the turntable and the five belt rolling road, which consists of a centerbelt running under the car and four wheel drive units. To extend the apparent length of the belts, a tangential blower is mounted behind each belt and acts to fill in the momentum deficit in the boundary layer that would build up on the stationary floor. A schematic of the moving ground system can be seen in
Figure 2, while a more thorough description of the upgrade, the moving ground system, and the results of the commissioning activities was given by Sternéus et al. [
12].
Flow Conditioning and Quality
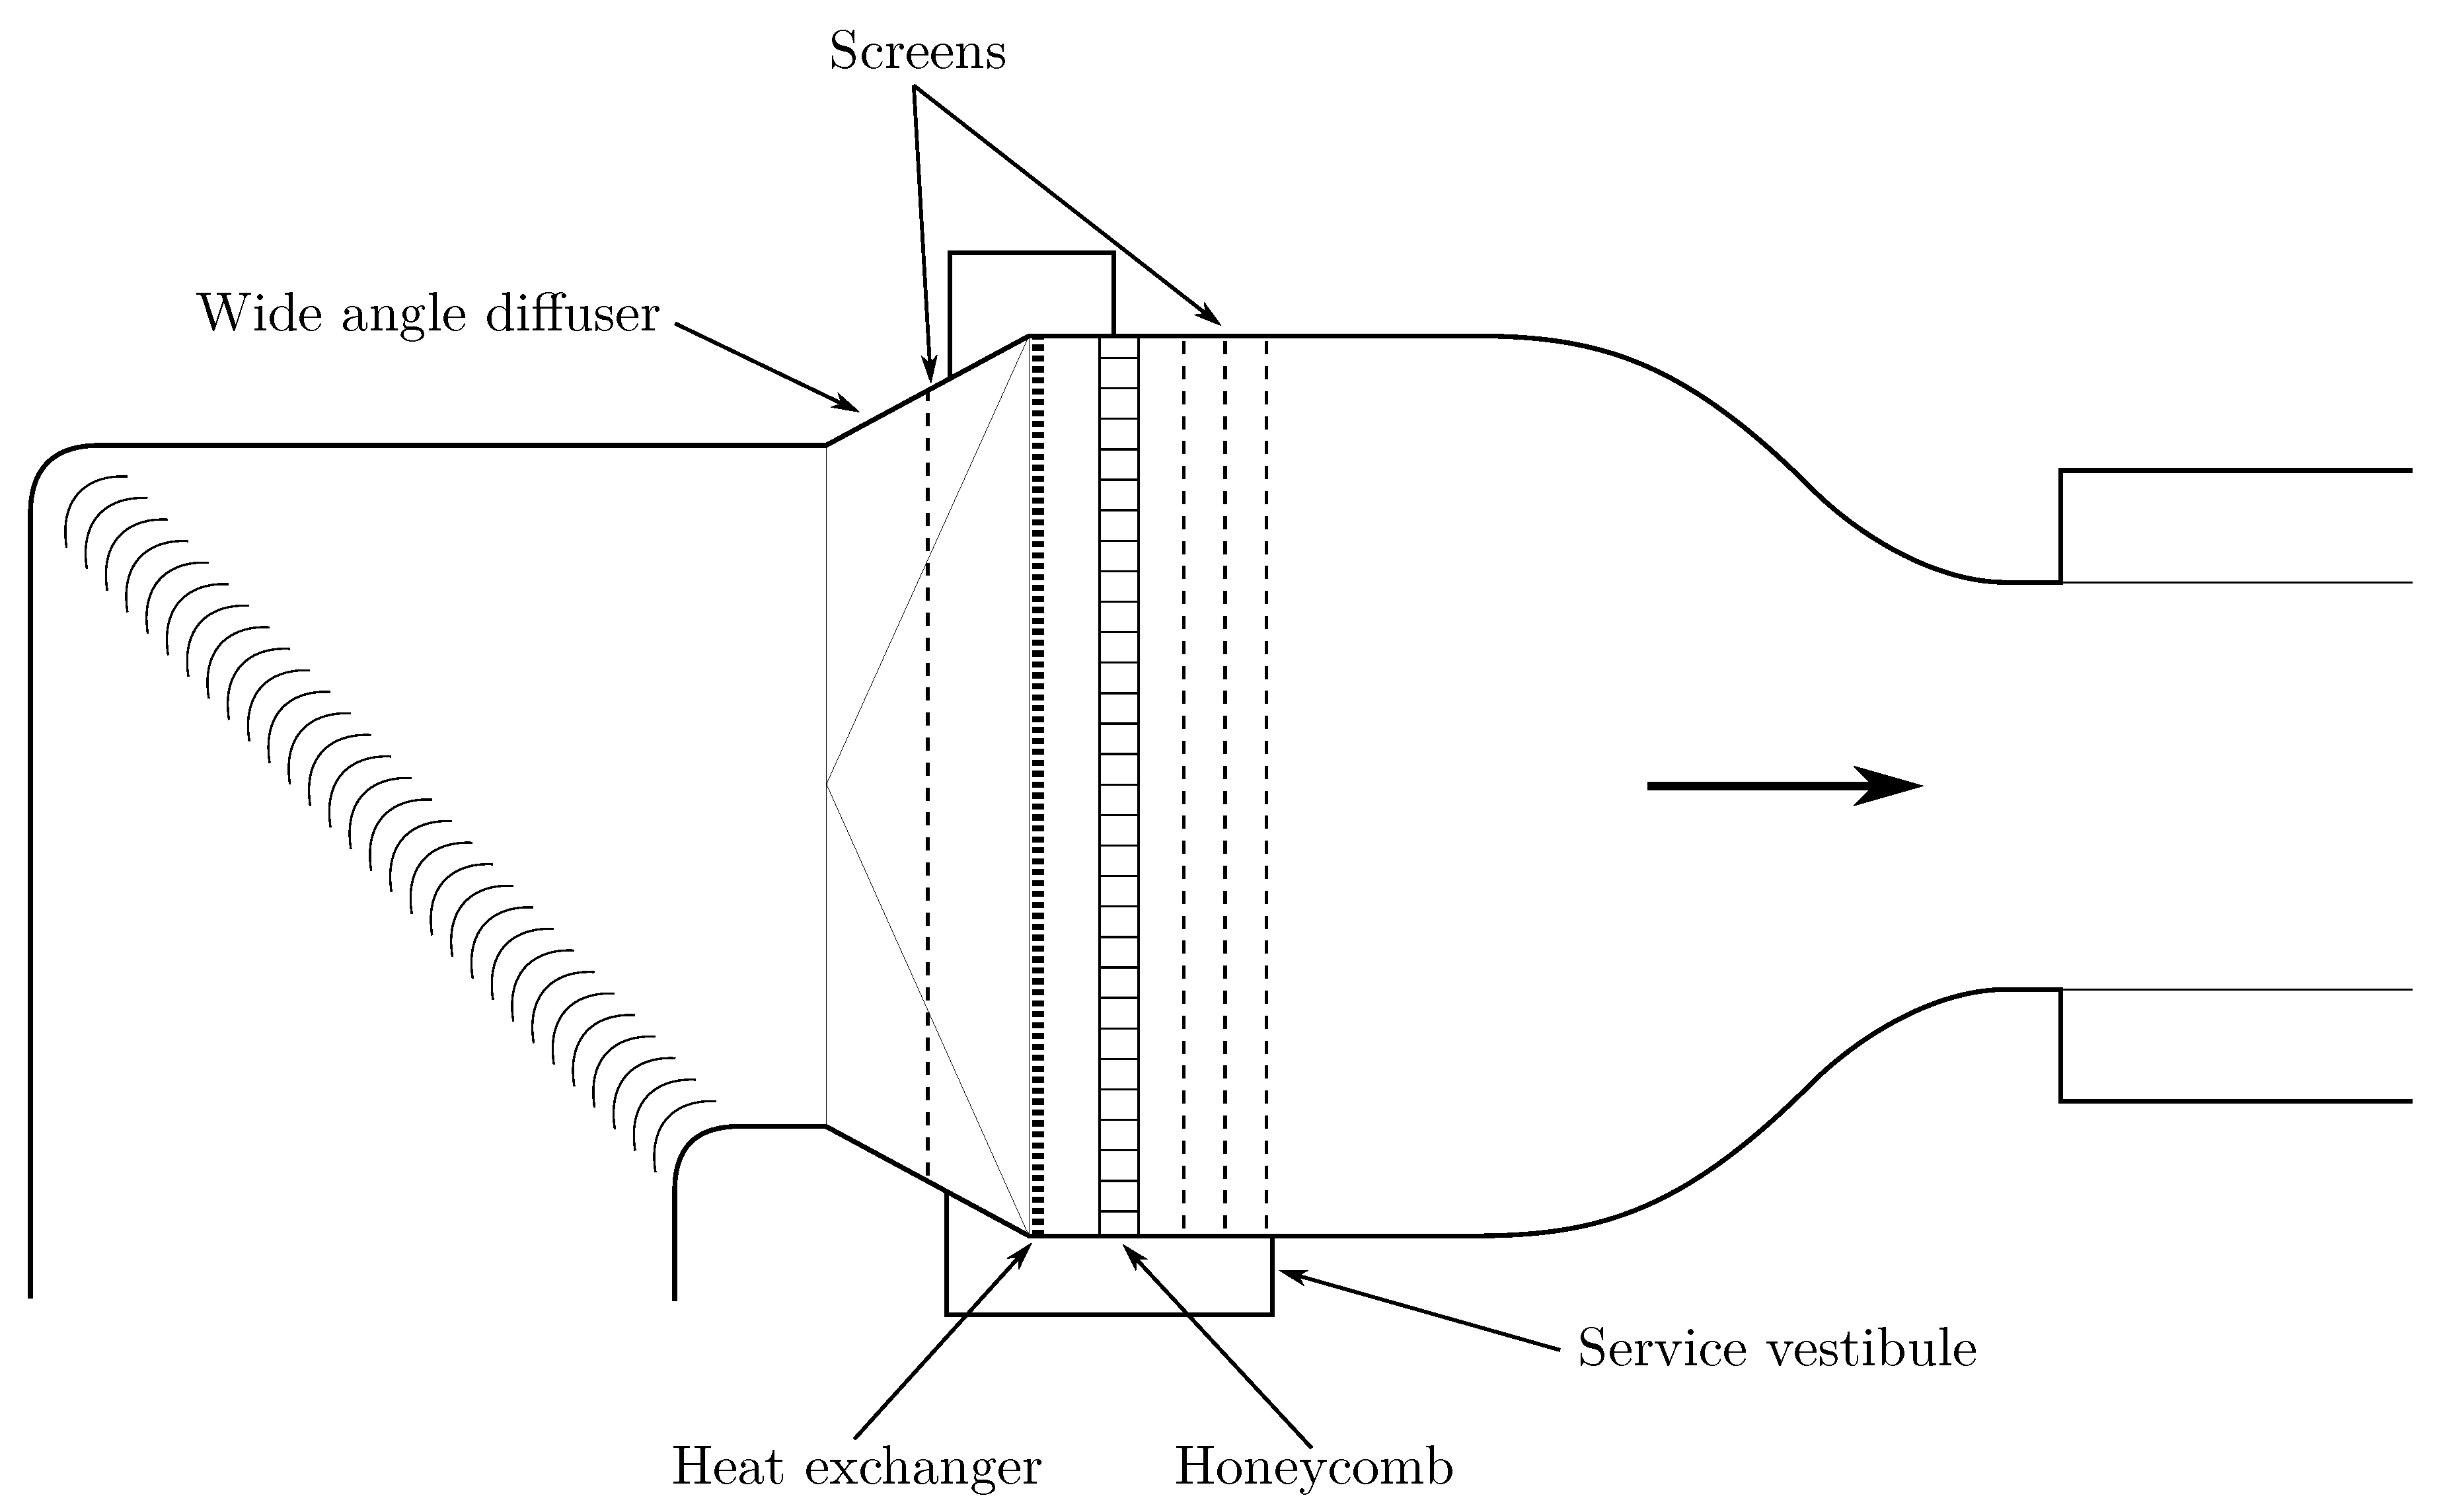
In terms of flow conditioning, all corners are equipped with guide vanes to help the flow turn and reduce losses. The settling chamber is, as outlined in
Figure 3, equipped with a total of four screens, a heat exchanger, and a honeycomb structure. One of the screens is mounted in the wide angle diffuser that connects the circular fourth corner and the rectangular settling chamber, and acts to suppress separation in the diffuser. The heat exchanger is mounted at the upstream end of the settling chamber, and makes the flow more uniform through its large loss. It is installed so that its core spans the full width and height of the settling chamber, which means that the pipes supplying the cooling (or heating in thermodynamic mode) water are mounted in small vestibules outside of the settling chamber. These vestibules are sealed towards the atmosphere, but not towards the settling chamber, which means that flow can escape from the upstream side of the heat exchanger core and reenter on the downstream side. After passing the heat exchanger, the flow is aligned by the 800
deep honeycomb, after which it passes through the remaining three screens. Due to the size of the settling chamber, each screen is made out of two halves welded together at the centerline. Finally, a 6:1 contraction ratio nozzle with chamfered edges to suppress corner vortices accelerates the flow into the test section.
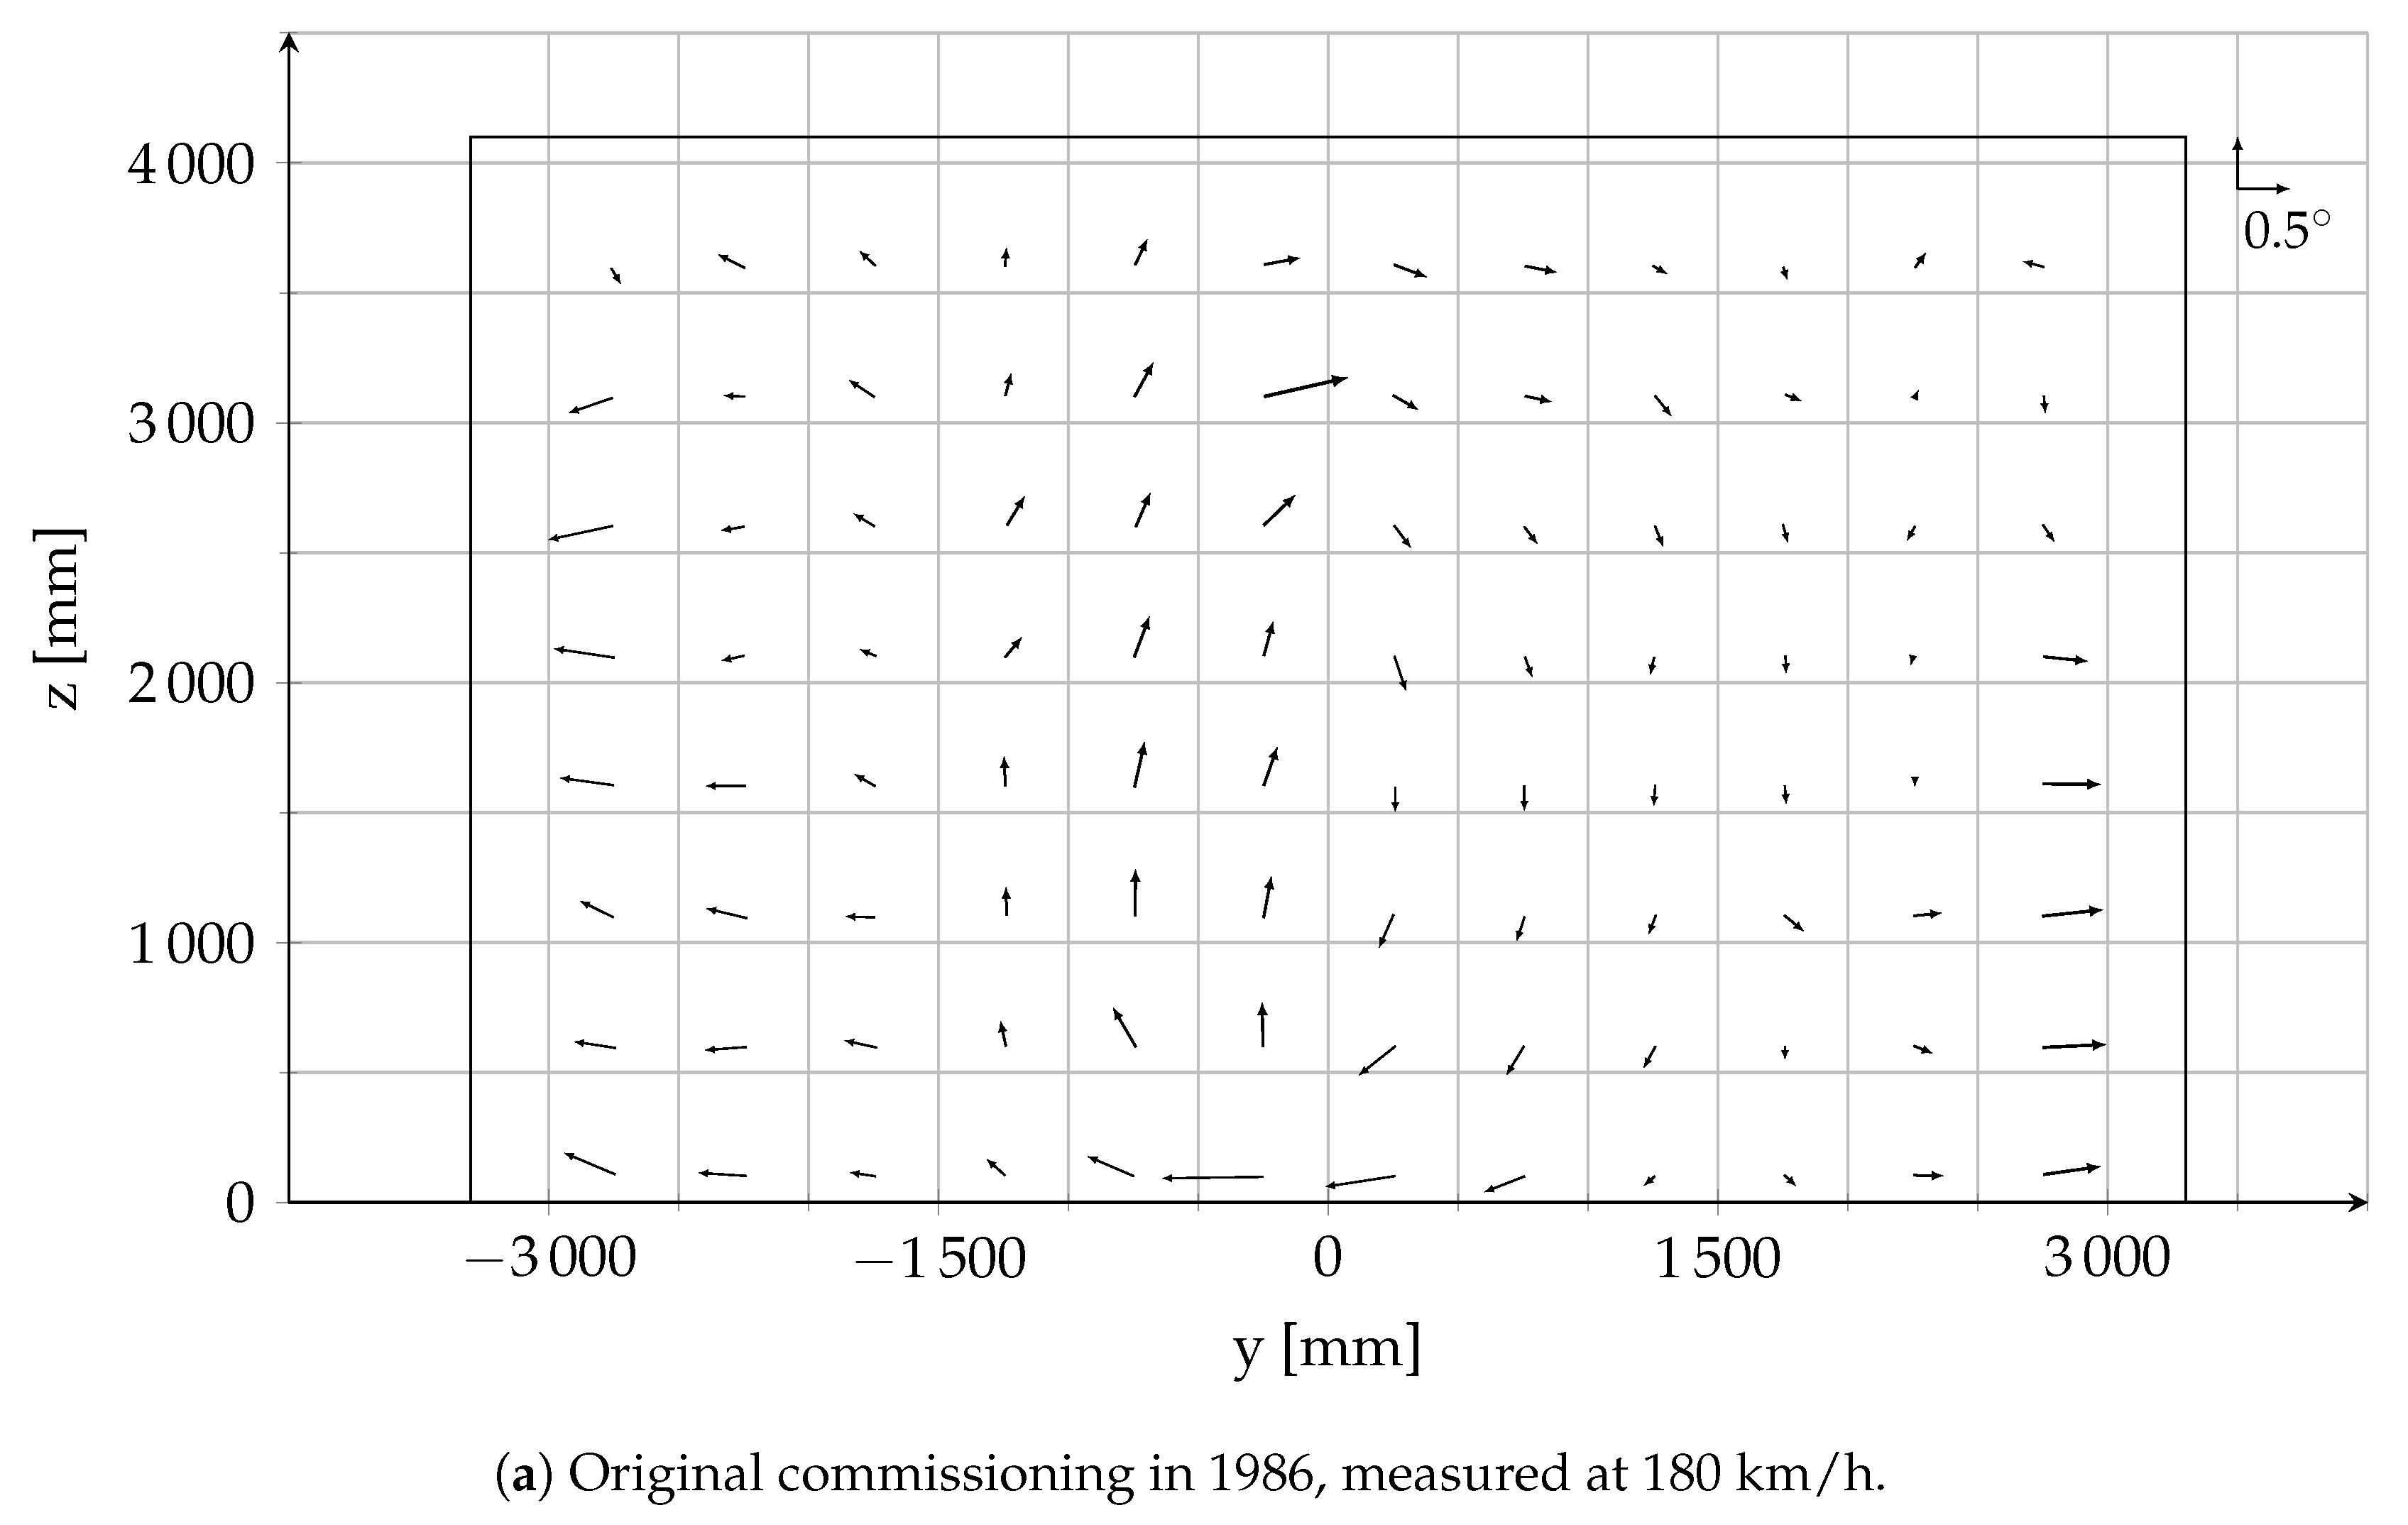
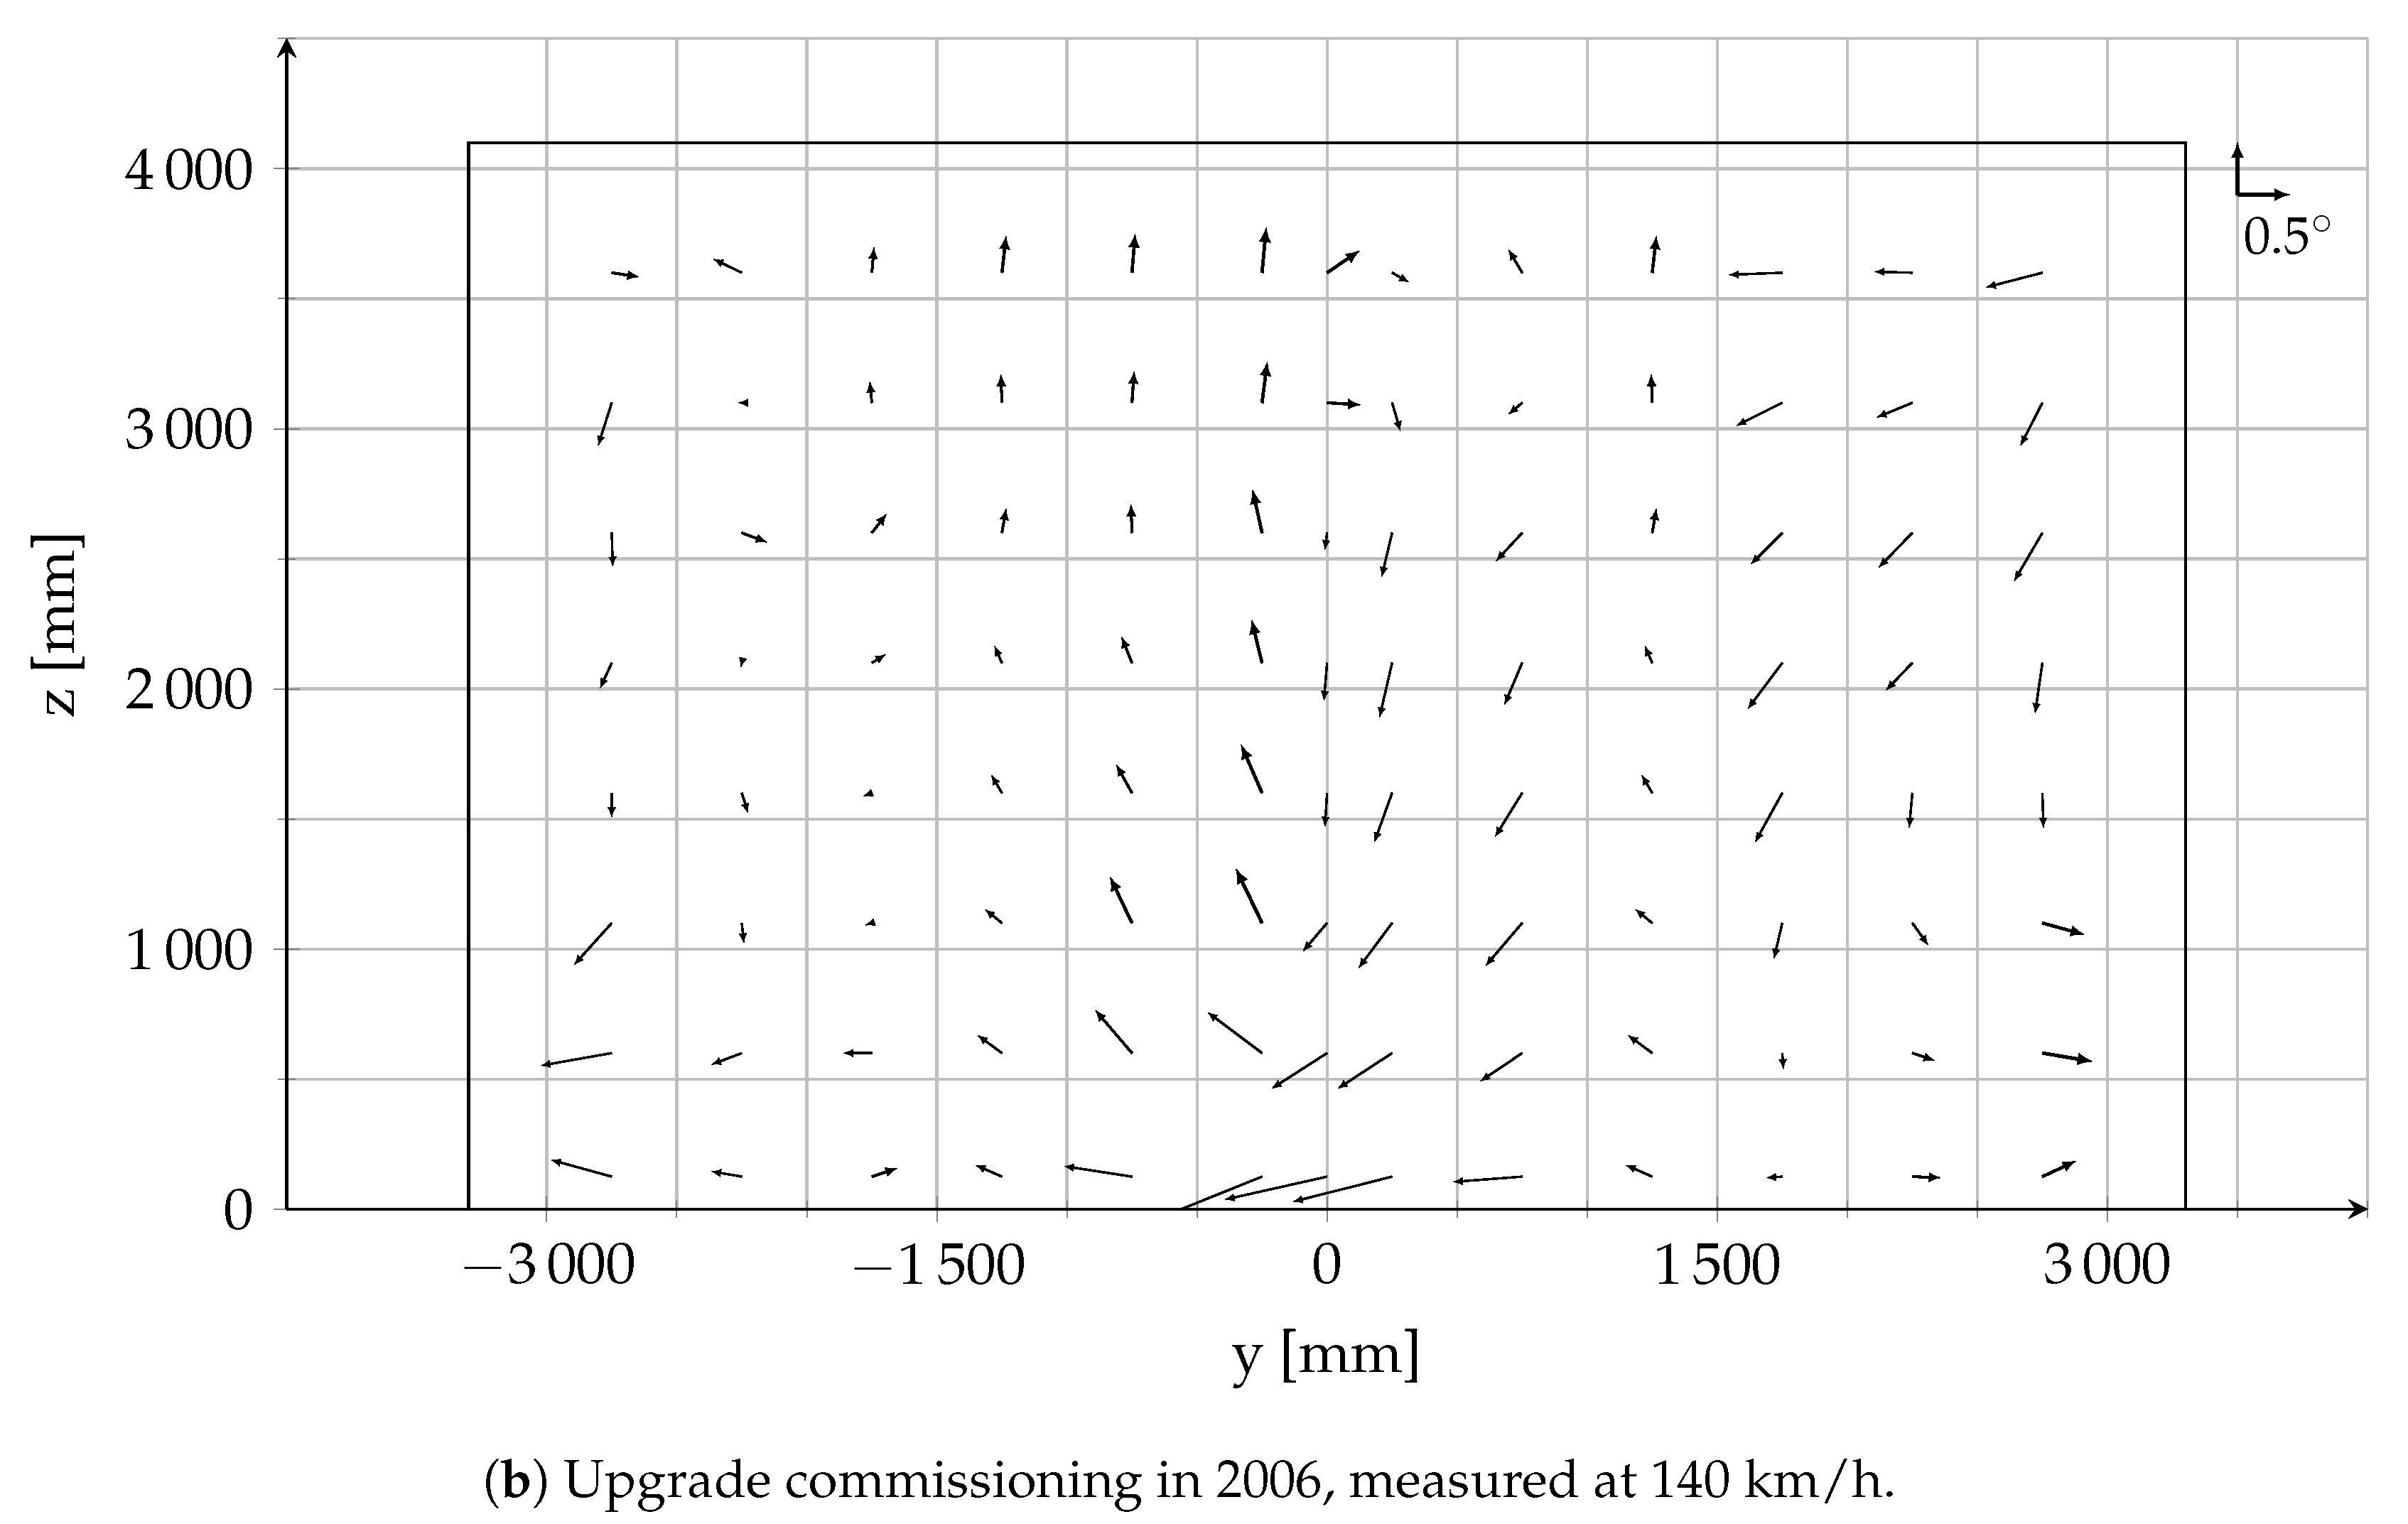
The flow angularity measured at the turntable center plane during the commissioning in 1986 can be seen in
Figure 4a, and the corresponding data from 2006 is found in
Figure 4b. It can be seen that the vortical structure in the center of the test section is similar, with a slightly weaker rotation and more downwash seen in the lower region for the 2006 data. The downwash is caused by the installation of the distributed suction in the boundary layer control system. The flow pattern also differs in the upper corners of the test section, with a more inward and downward flow in 2006, the cause of which was not discussed in the upgrade commissioning. Furthermore, the measurements performed in the two commissioning campaigns are not corrected for strut interference, and the same commissioning strut was used for both measurement campaigns.
The direction of the vortical structure seen in the test section corresponds to the rotational direction of the fan, and it is thus plausible that the flow pattern is caused by residual swirl from the fan not fully eliminated by the flow conditioning devices. However, it has been hypothesized that the flow angularity might be caused by two insufficiencies of the flow conditioning devices themselves; a leakage flow path around the heat exchanger, and the welds of the turbulence screens. Both these alternative causes are investigated in this paper.
2. Method
The methods used for the measurements are described in this section, beginning with an introduction of the new flow angularity measurements. This is followed by a description of the modifications to the flow conditioning devices that were performed to test two different hypotheses for the cause of the observed flow angularity pattern. Finally the measurement setup for force measurements of a reference vehicle is presented.
2.1. Flow Angularity Measurements
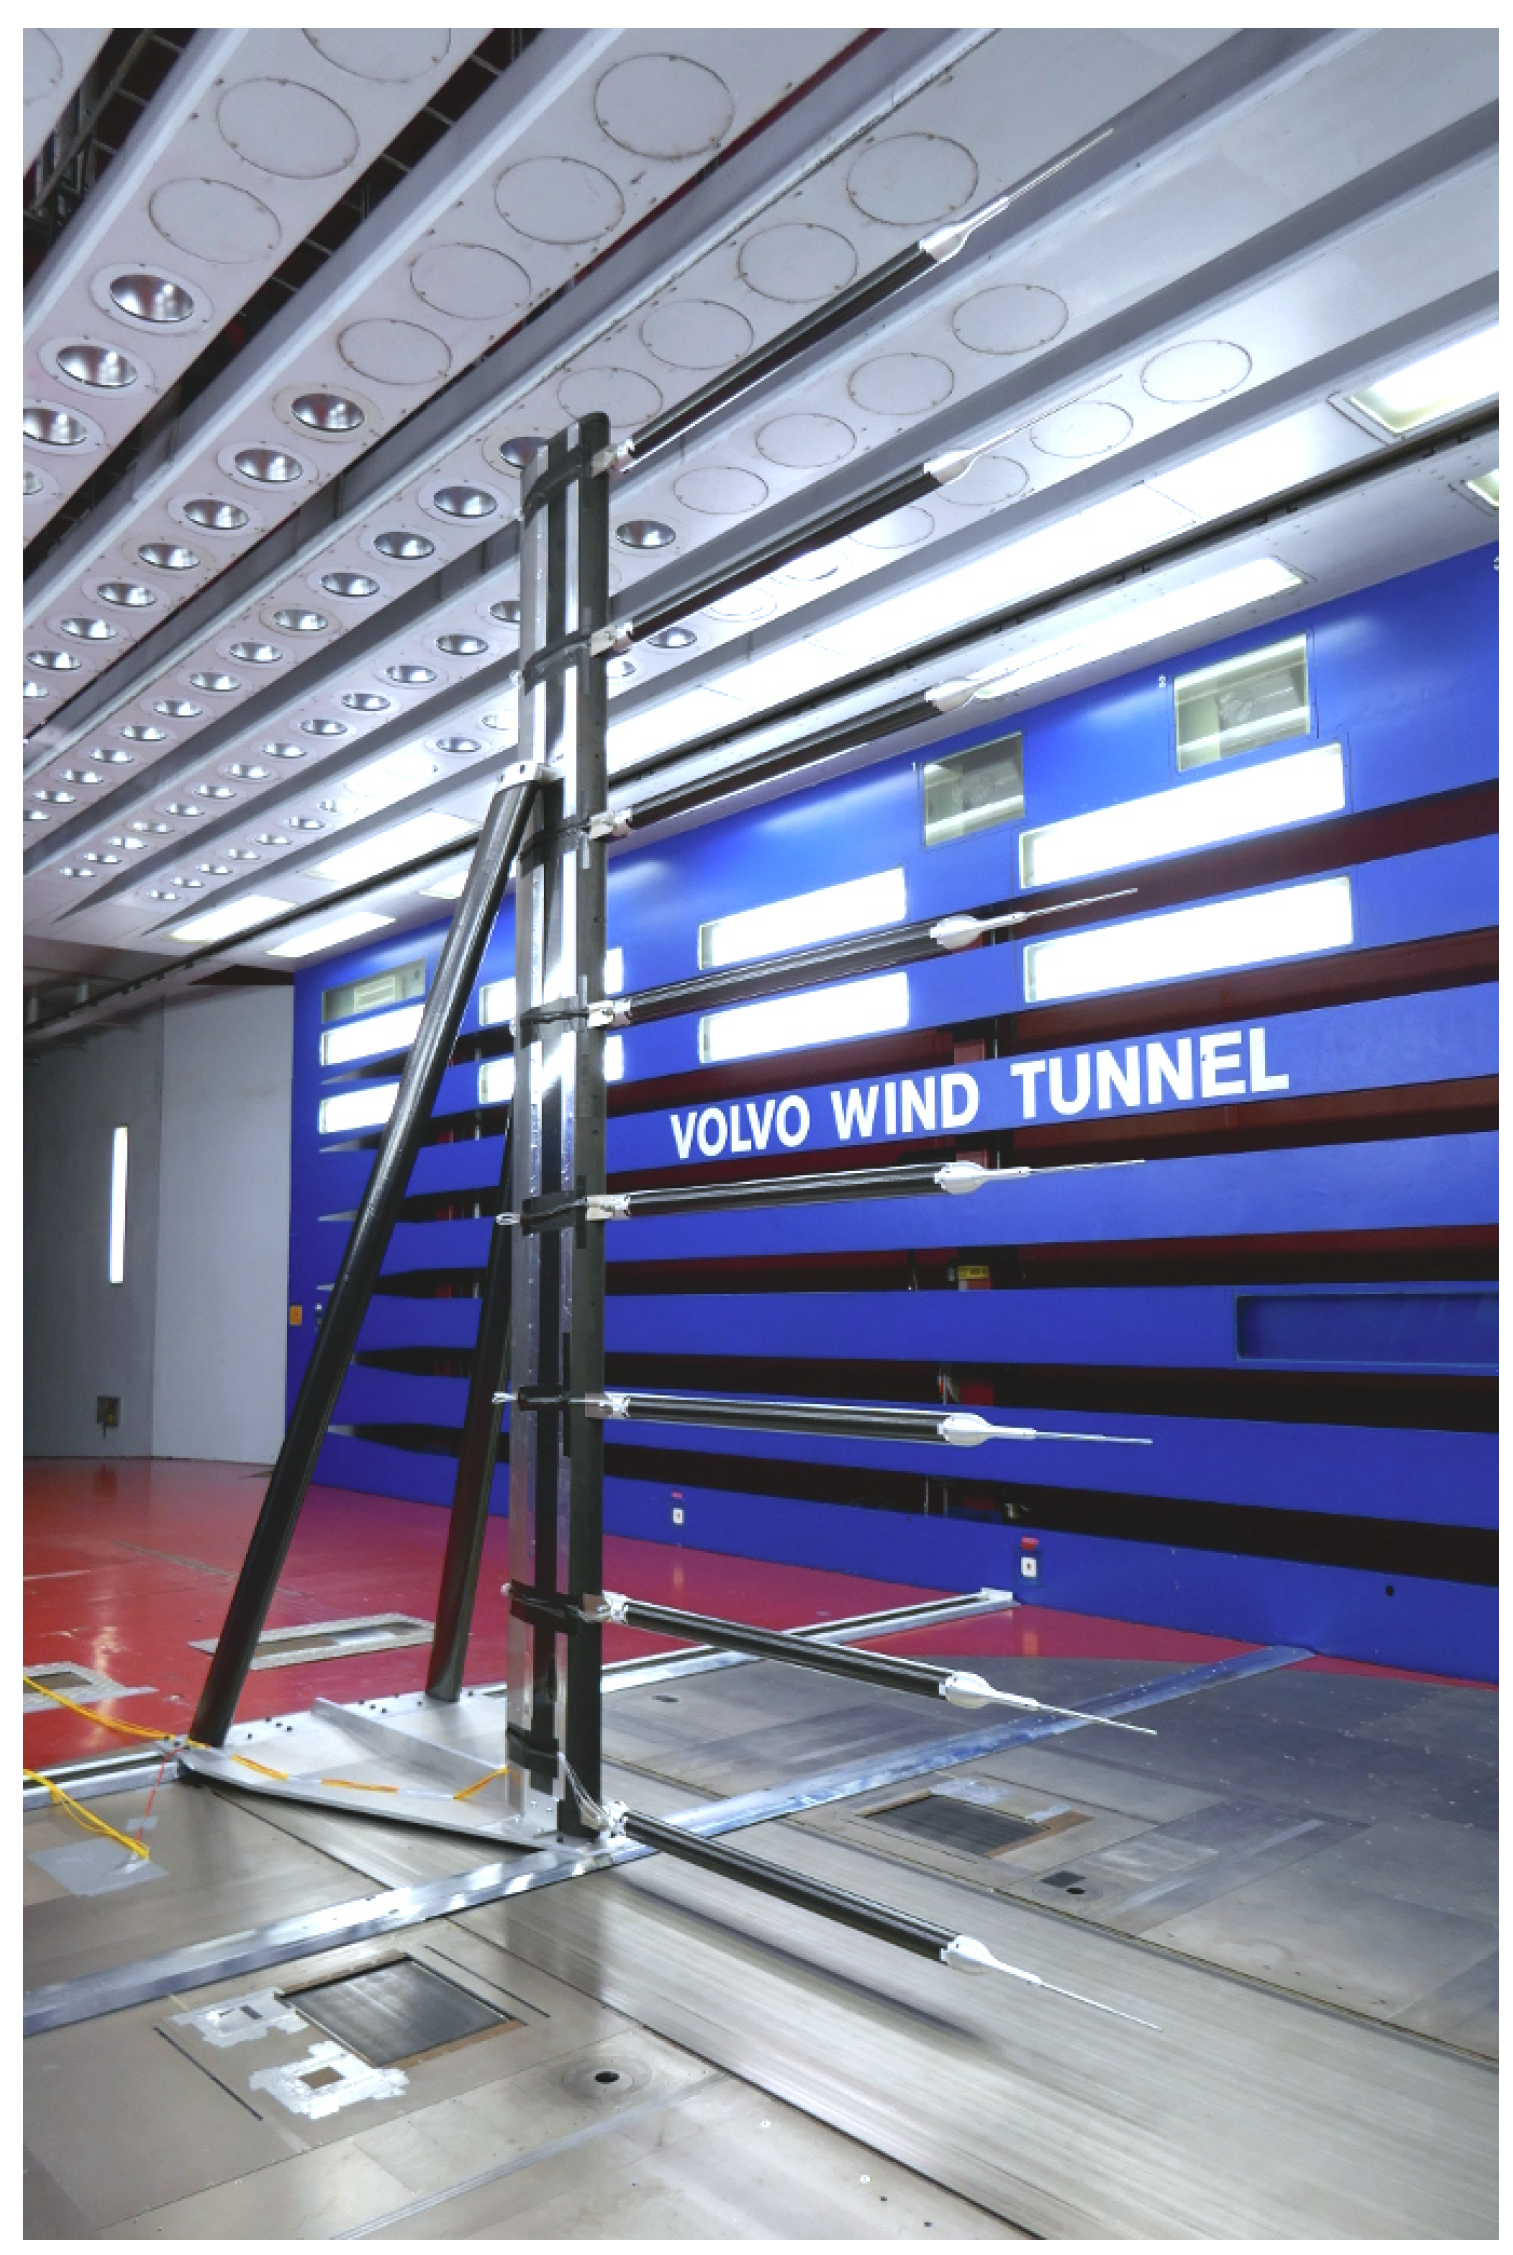
The flow angularity measurements were performed using the purpose built flow measurement rig, which can be seen in
Figure 5. It featured eight probe arms and measured flow angularity as well as static and total pressure simultaneously using five-hole Aeroprobe Air data probes connected to the pressure measurement system installed in the wind tunnel. Due to the design of the strut assembly, the flow interference from the strut at the probe locations was non-uniform and was corrected for using an approach combining numerical simulations and physical measurements of the interference. The total uncertainty of the full measurement chain was estimated according to the JCGM Guide to the expression of uncertainty in measurement [
23], and included the uncertainty of all measured quantities and the interference correction. A more thorough description of the rig, the interference correction, and the quantification of measurement uncertainties was given by Ljungskog et al. [
24]. Typical uncertainties for the flow angularity measurements are given in
Table 1, where it can be seen that the uncertainties varied slightly over a plane, but had a weak velocity dependency. This is since the uncertainties are not dominated by the pressure measurements, but rather by the optical measurement of the offset angles of the probe arms [
24]. Furthermore, it can be noted that the measurement uncertainties for the full measurement chain were significantly lower than the stated accuracy of a factory calibrated Air data probe (
). This was achieved by calibrating the probes in situ for a narrow range of angles (
) following the procedure outlined in the AIAA recommended practice on calibration of subsonic and transonic wind tunnels [
25].
Measurements were performed at wind speeds of 100, 140, and 200
/
. However, since the flow angle variations between the three velocities were negligible, only the data for 140
/
is presented in this work. This wind speed independence is consistent with the results of the two previous commissioning campaigns [
21,
22].
2.2. Modifications to the Flow Conditioning
In order to investigate the cause of the flow angularity observed in the previous commissioning campaigns, two modifications of the flow conditions in the physical wind tunnel were performed, as described below.
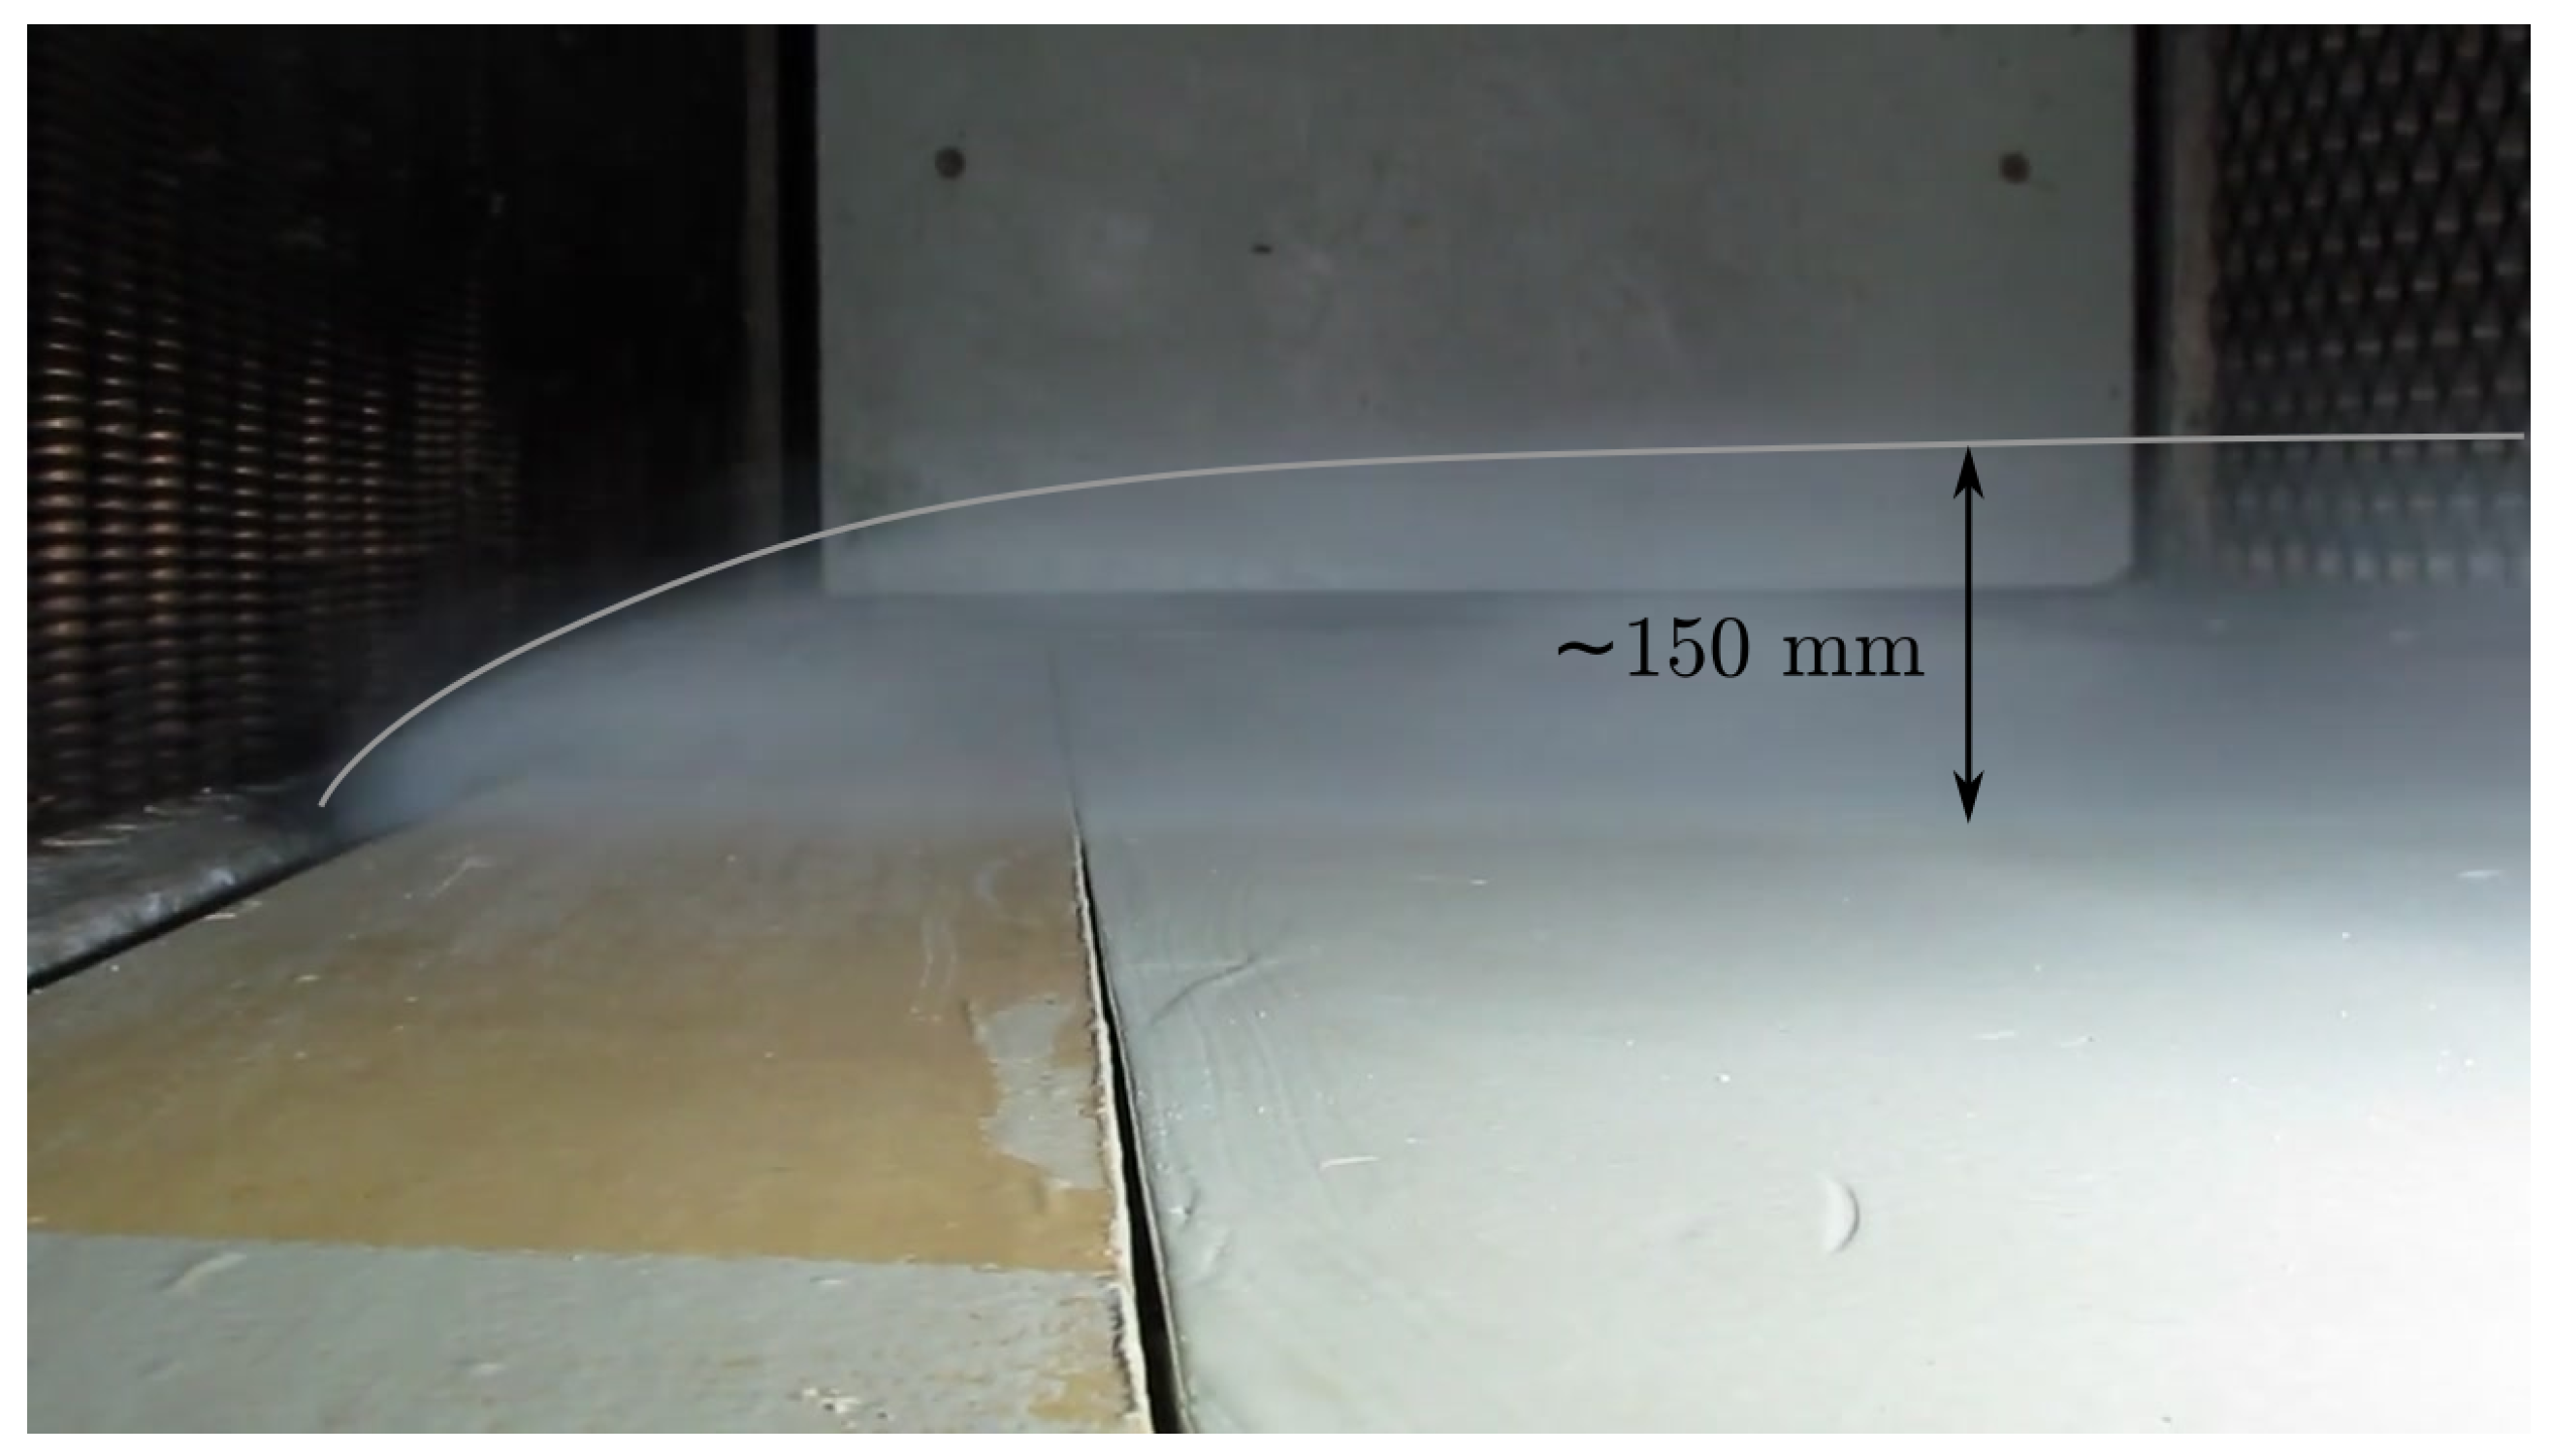
2.2.1. Sealing the Leak around the Heat Exchanger
The installation of the heat exchanger, schematically shown in
Figure 3, resulted in a possible flow path around the heat exchanger core. The width of the slot through which the air leaked ws not uniform along the height of the heat exchanger, ranging from about 10
–40
, which has been hypothesized to have caused the swirling motion seen in both 1986 and 2006. The local effect of this leakage on the near wall flow between the heat exchanger and the honeycomb can be seen in
Figure 6, where smoke is used to visualize the air reentering into the airline from the service vestibule. In order to quantify the effect from this leakage on the flow in the test section, the leakage was sealed using tubular pipe insulation and tape, and the flow angularity was then measured.
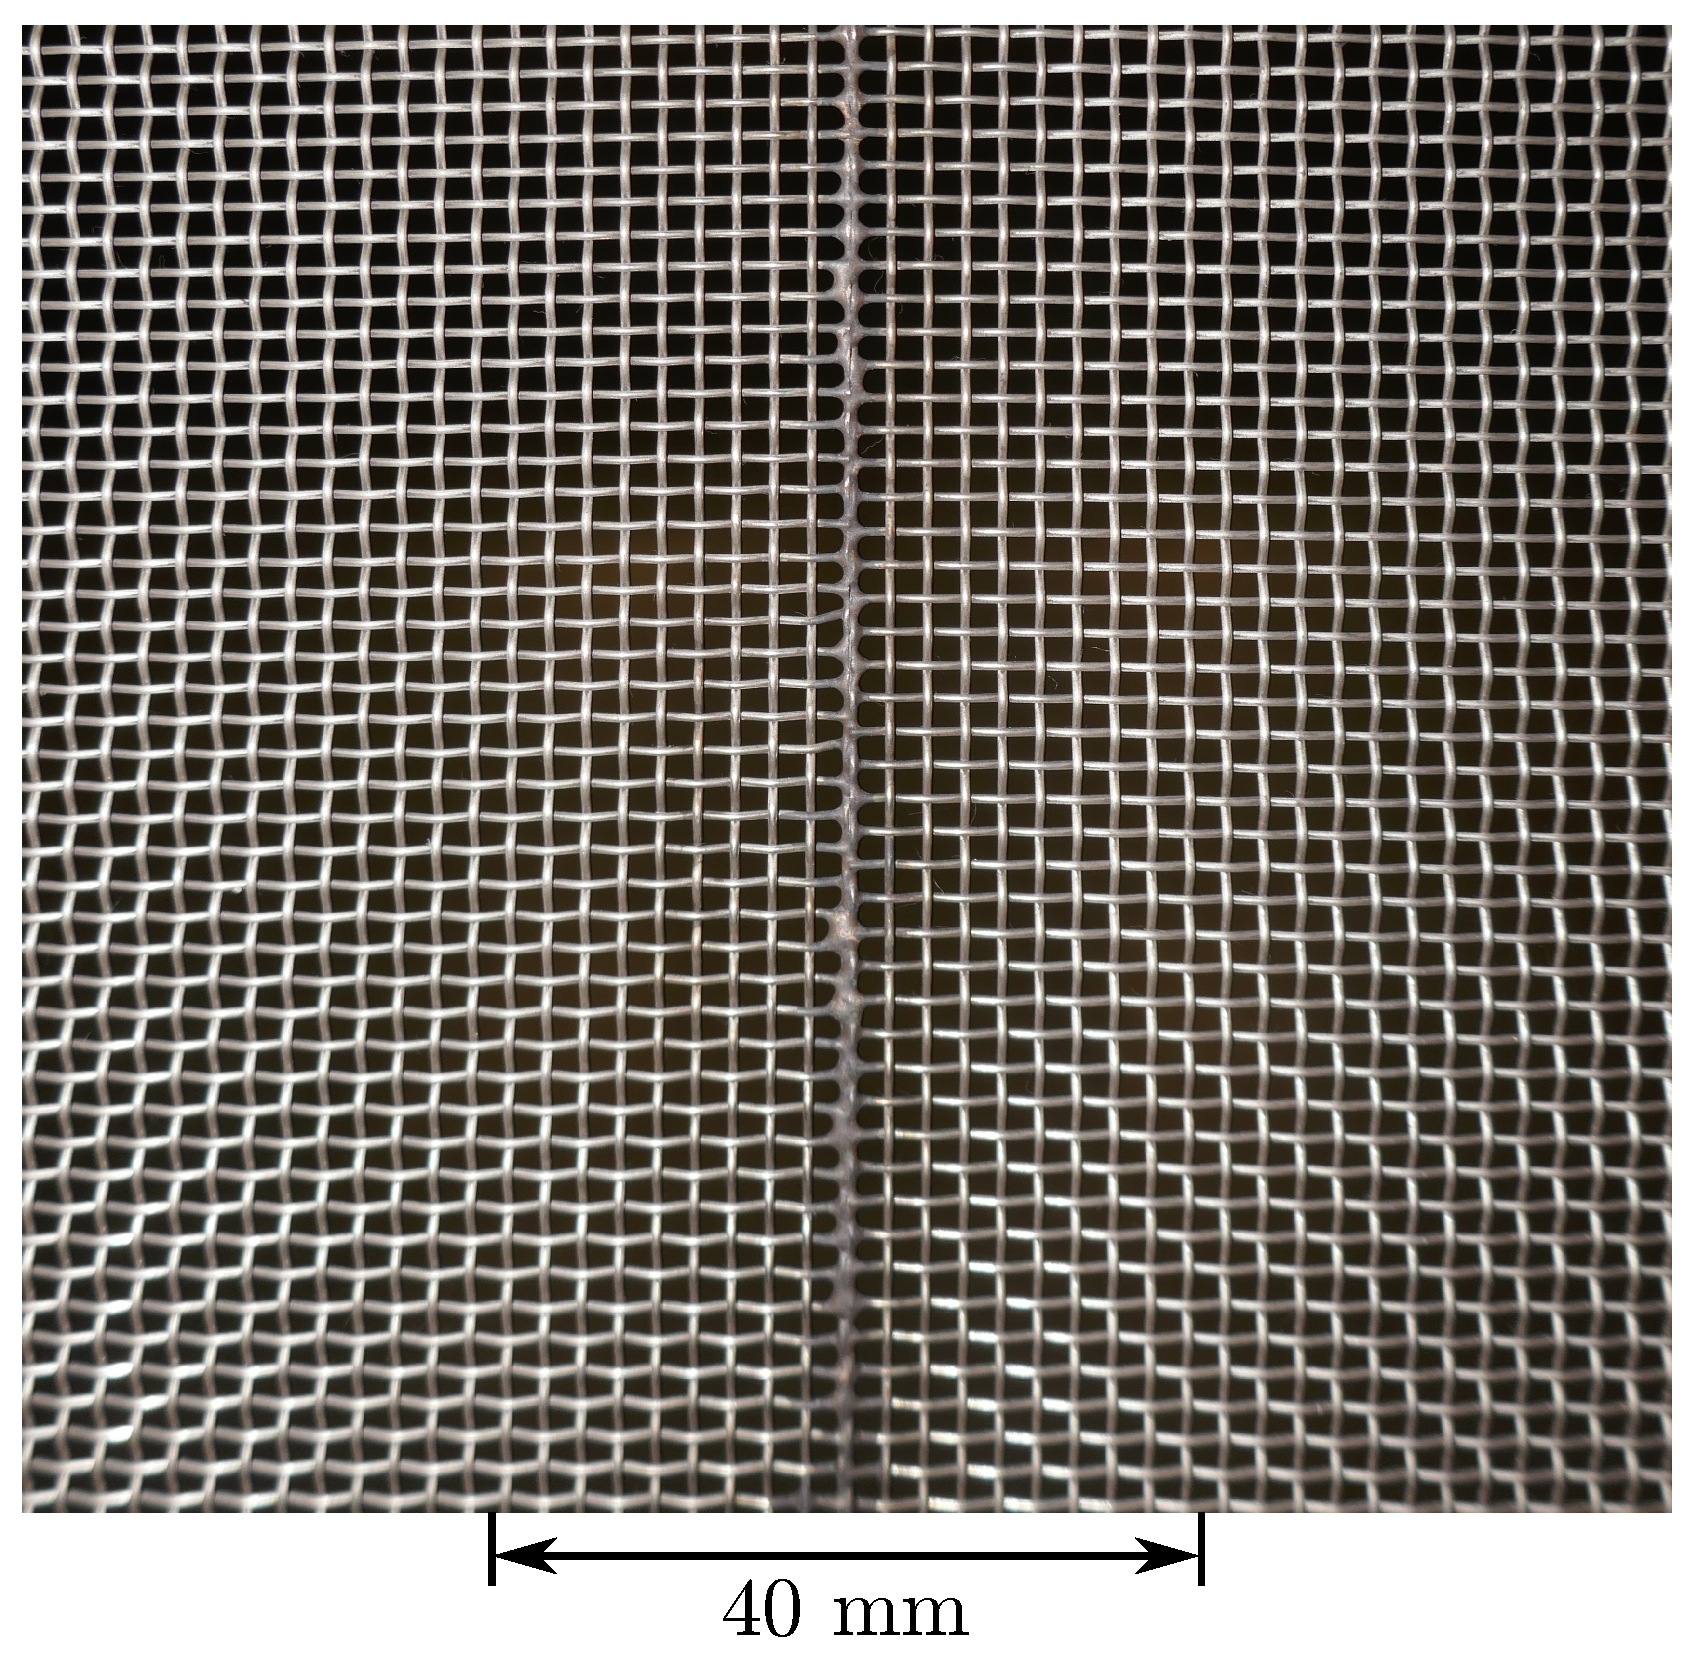
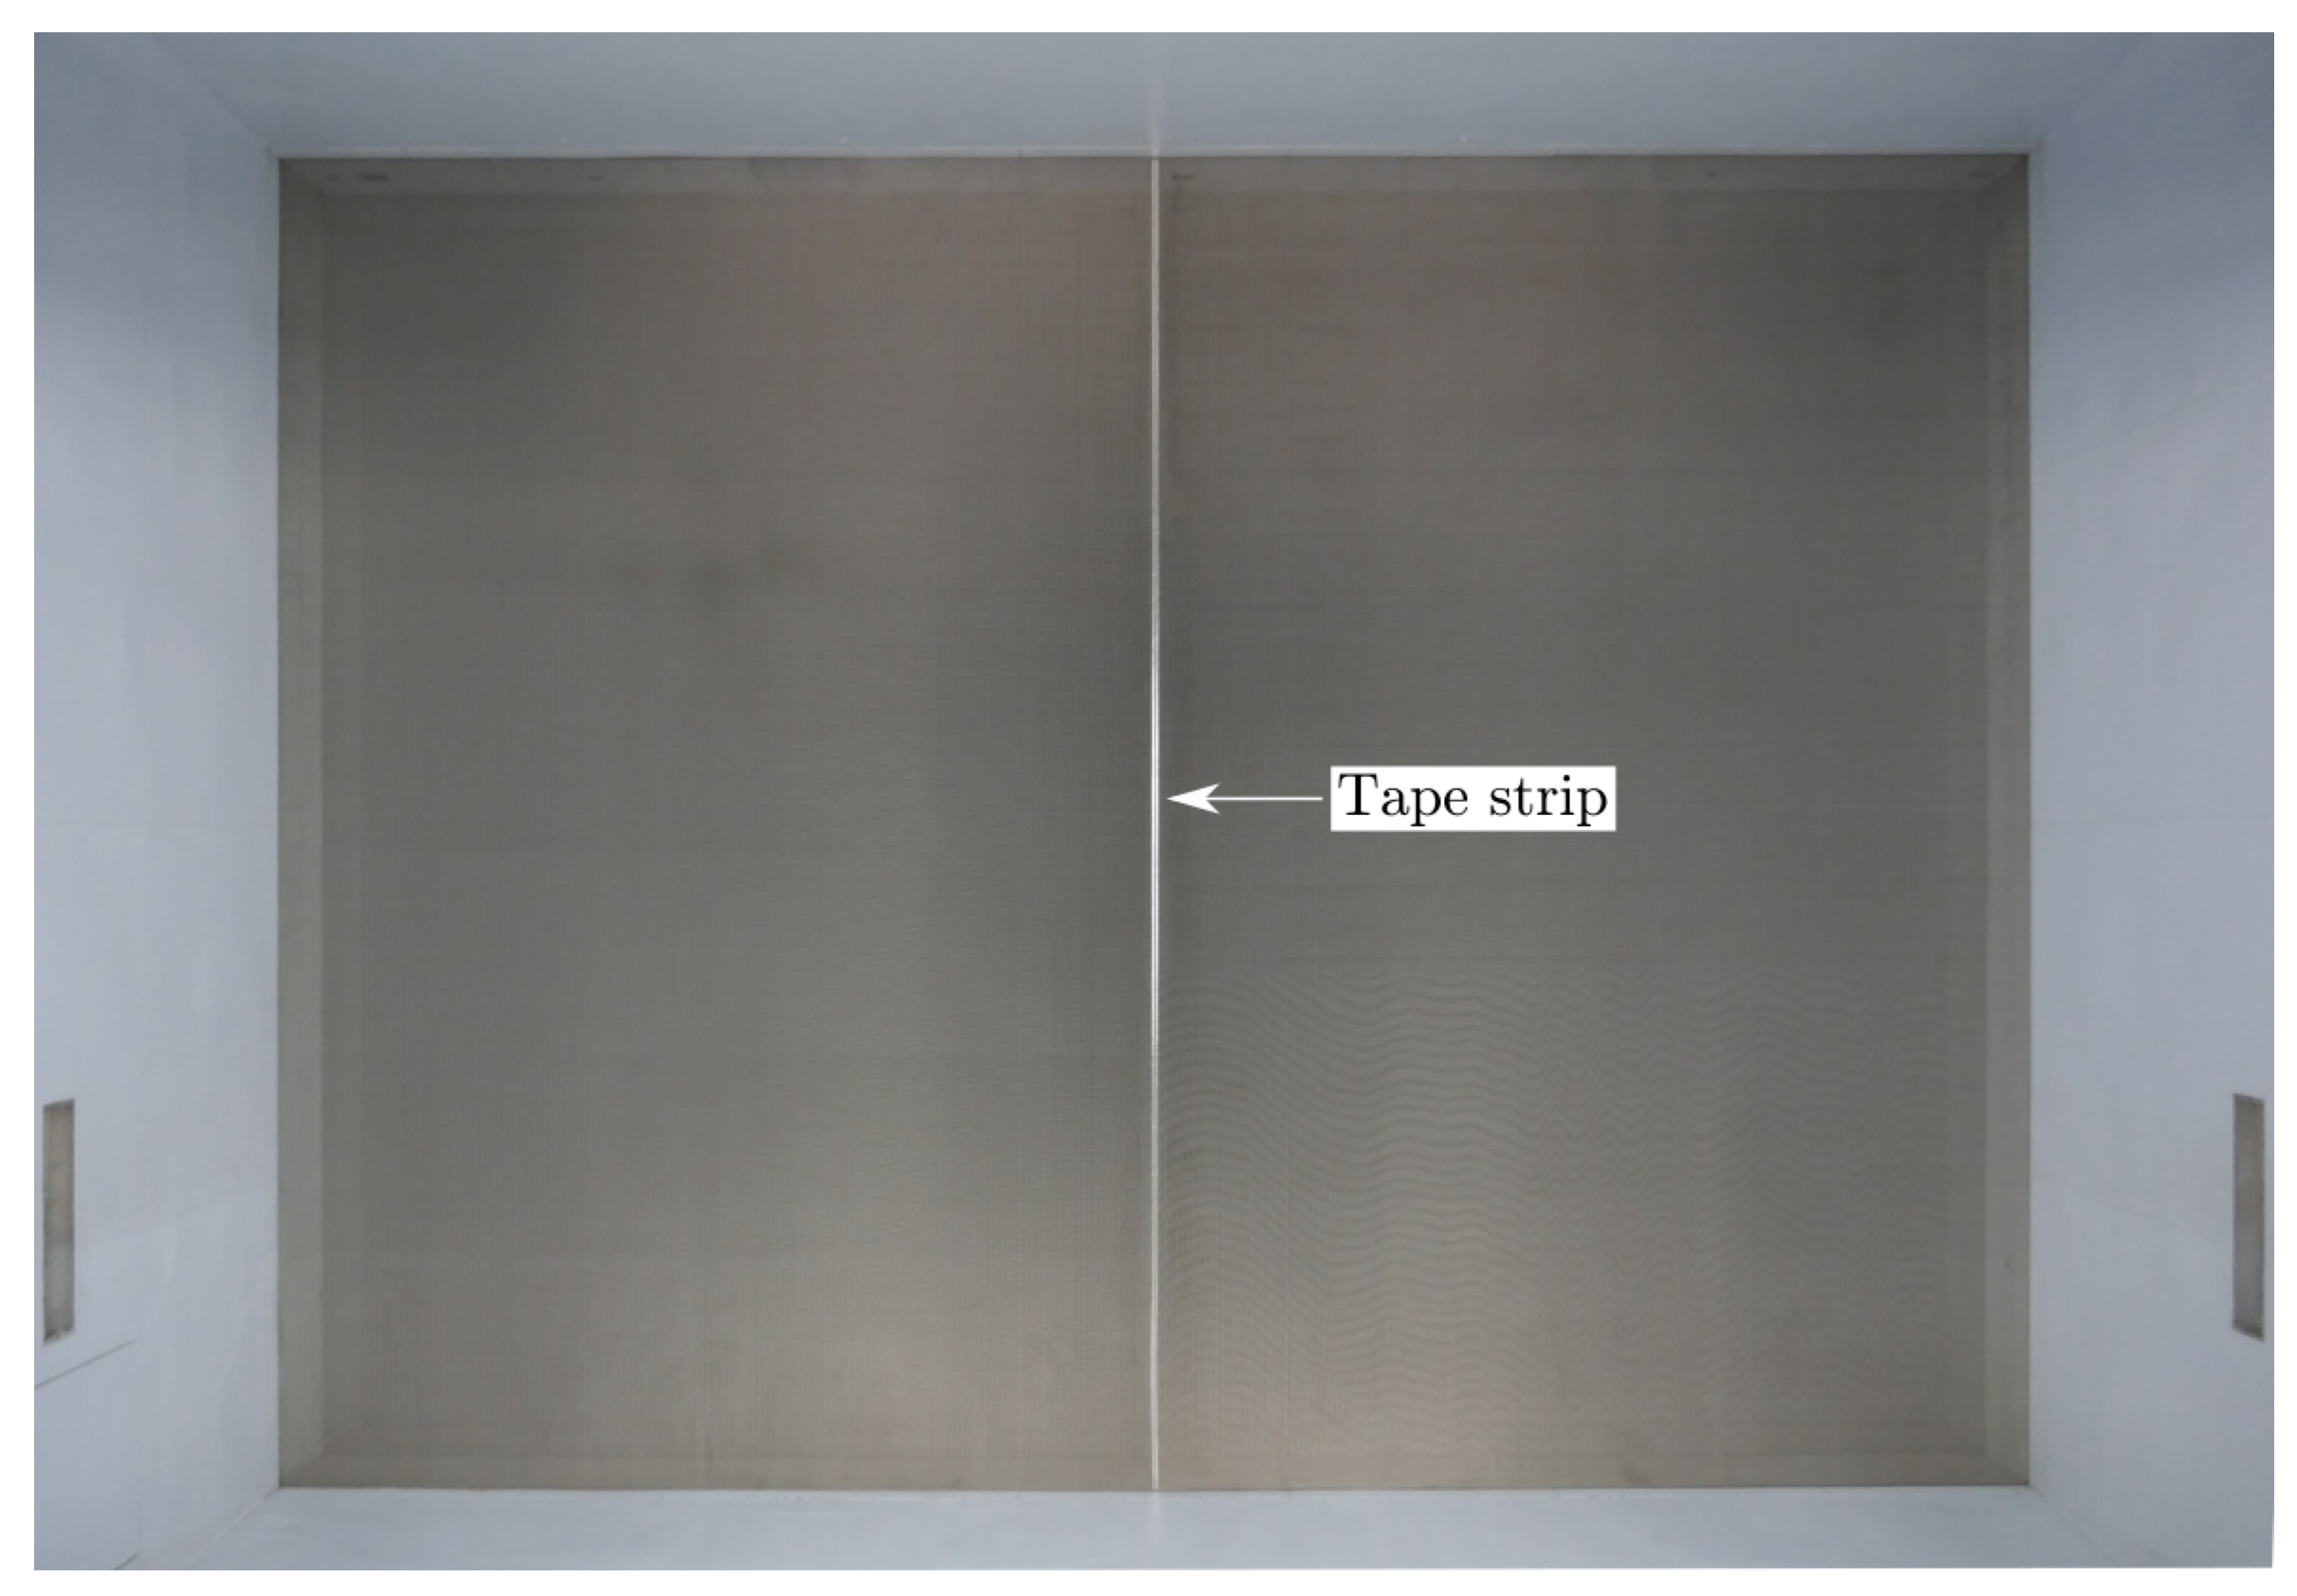
2.2.2. Exaggerating the Effect of the Turbulence Screen Weld
As described, each turbulence screen consisted of two sheets welded together vertically at the centerline. This was done thread-by-thread as shown in
Figure 7 in order to minimize the blockage. Despite this precaution, it has been hypothesized that these welds might have had an impact on the test section flow, especially since they lined up for the three screens. This was tested by exaggerating the width of the weld by adding a strip of 40
-wide tape to the upstream side of the downstream screen, as shown in
Figure 8, and then measuring the flow angularity.
2.3. Force Measurements on a Vehicle
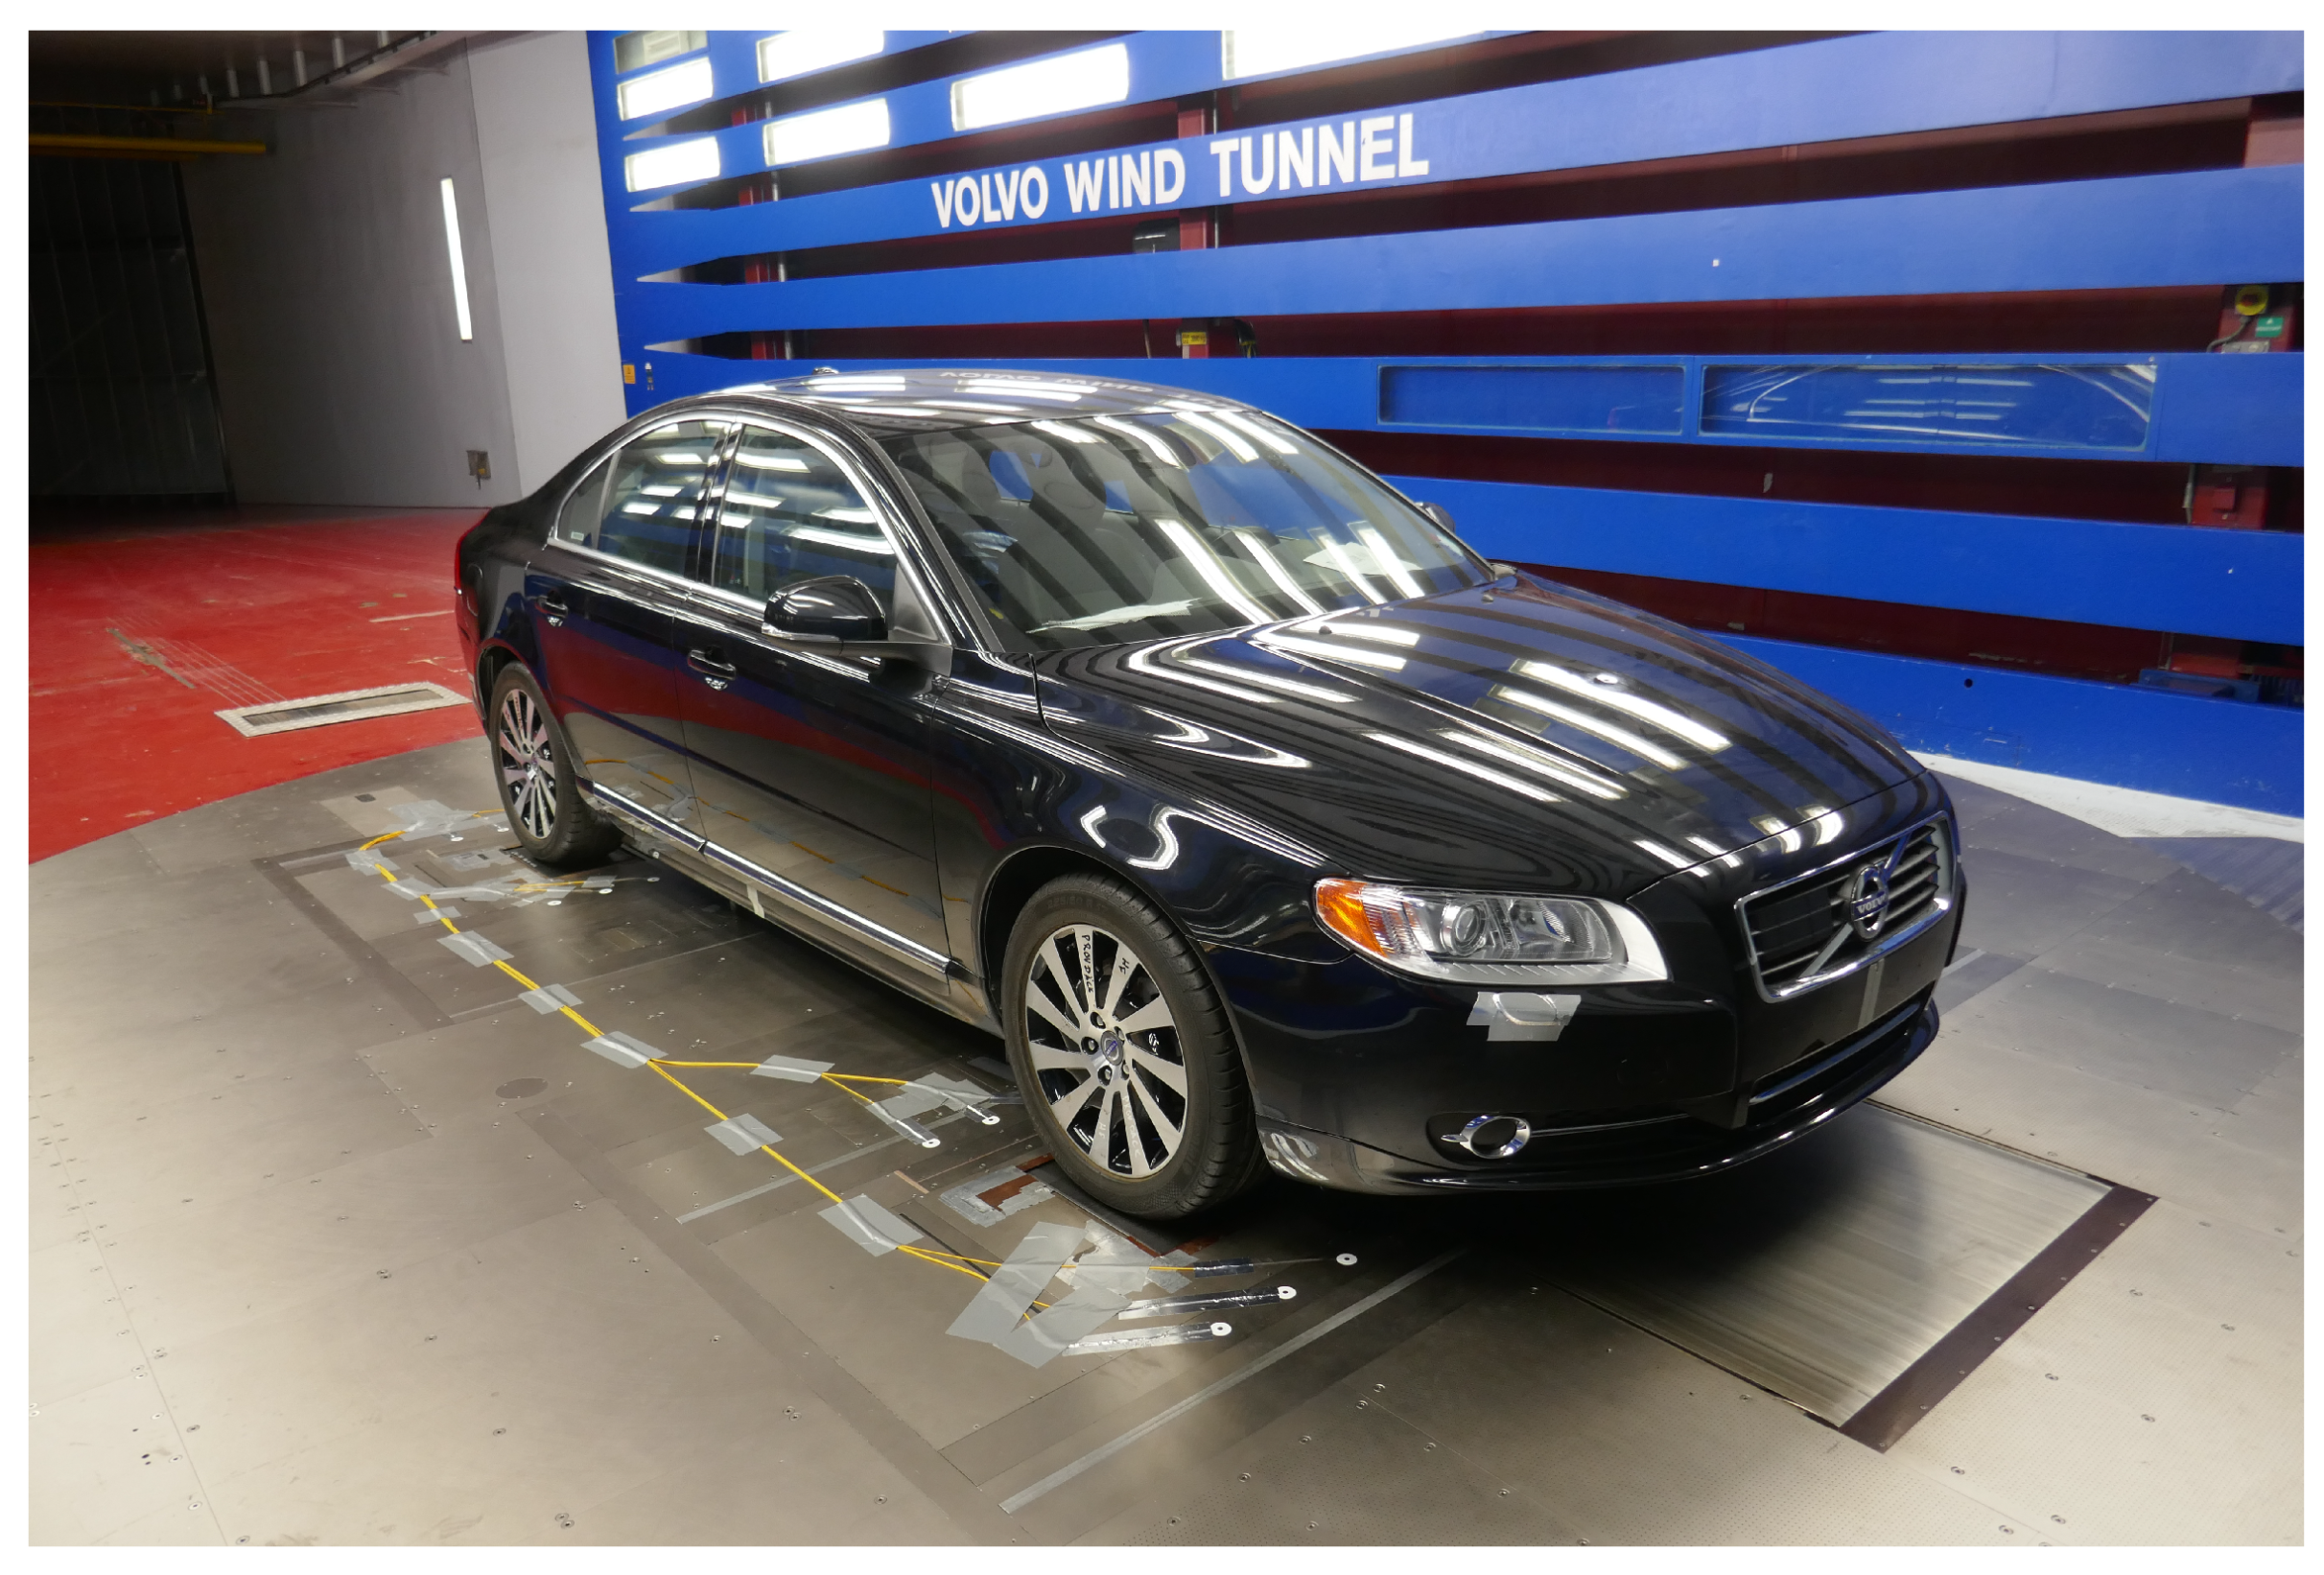
In order to quantify the influence from the flow angularity induced by the tape on the downstream screen onto the aerodynamic forces of interest during vehicle development, a reference vehicle that was used to perform regular checks of the wind tunnel repeatability was tested. The tests were run as yaw sweeps from
to
, both in standard operating conditions and with the tape. The vehicle was a Volvo S80 of model year 2008, and can be seen in
Figure 9. Forces were measured using the underfloor balance and averaged for 20 seconds for each of the yaw angles. The wind speed was 140
/
and all ground simulation systems were activated, which is the standard test setup for aerodynamic development work. The specified repeatability of the force coefficients in this mode of operation are given in
Table 2, where the test figures within refer to the repeatability for measurements performed with the vehicle mounted in the test section between the runs. Correspondingly, the between test numbers refer to the case when the vehicle has been removed and reinstalled between the measurements, on the same day or at a different time. It can be noted that the front- and rear axle lift coefficients had the same repeatability between tests, but differed within a test. This is because the within test repeatability was mostly determined by unsteady flow behavior around the car, and thereby the averaging time. Since the front of the vehicle was subjected to a steady oncoming flow, the time averaged force converged faster than for the rear lift, which was more affected by unsteady flow under the car and in the separated base wake. Hence, the within test repeatability could be improved by increasing the averaging time from the current standard, which was chosen as a tradeoff between repeatability and productivity for day to day vehicle development work. In contrast, the between test repeatability is mostly determined by the installation of the vechicle, which might differ slightly between tests.
3. Results and Discussion
In this section, the results of the flow angularity measurements in standard operating conditions are presented and discussed, together with the results of the alterations of the flow path and the impact on the measured forces on the reference vehicle.
3.1. Flow Angularity in Standard Operating Conditions
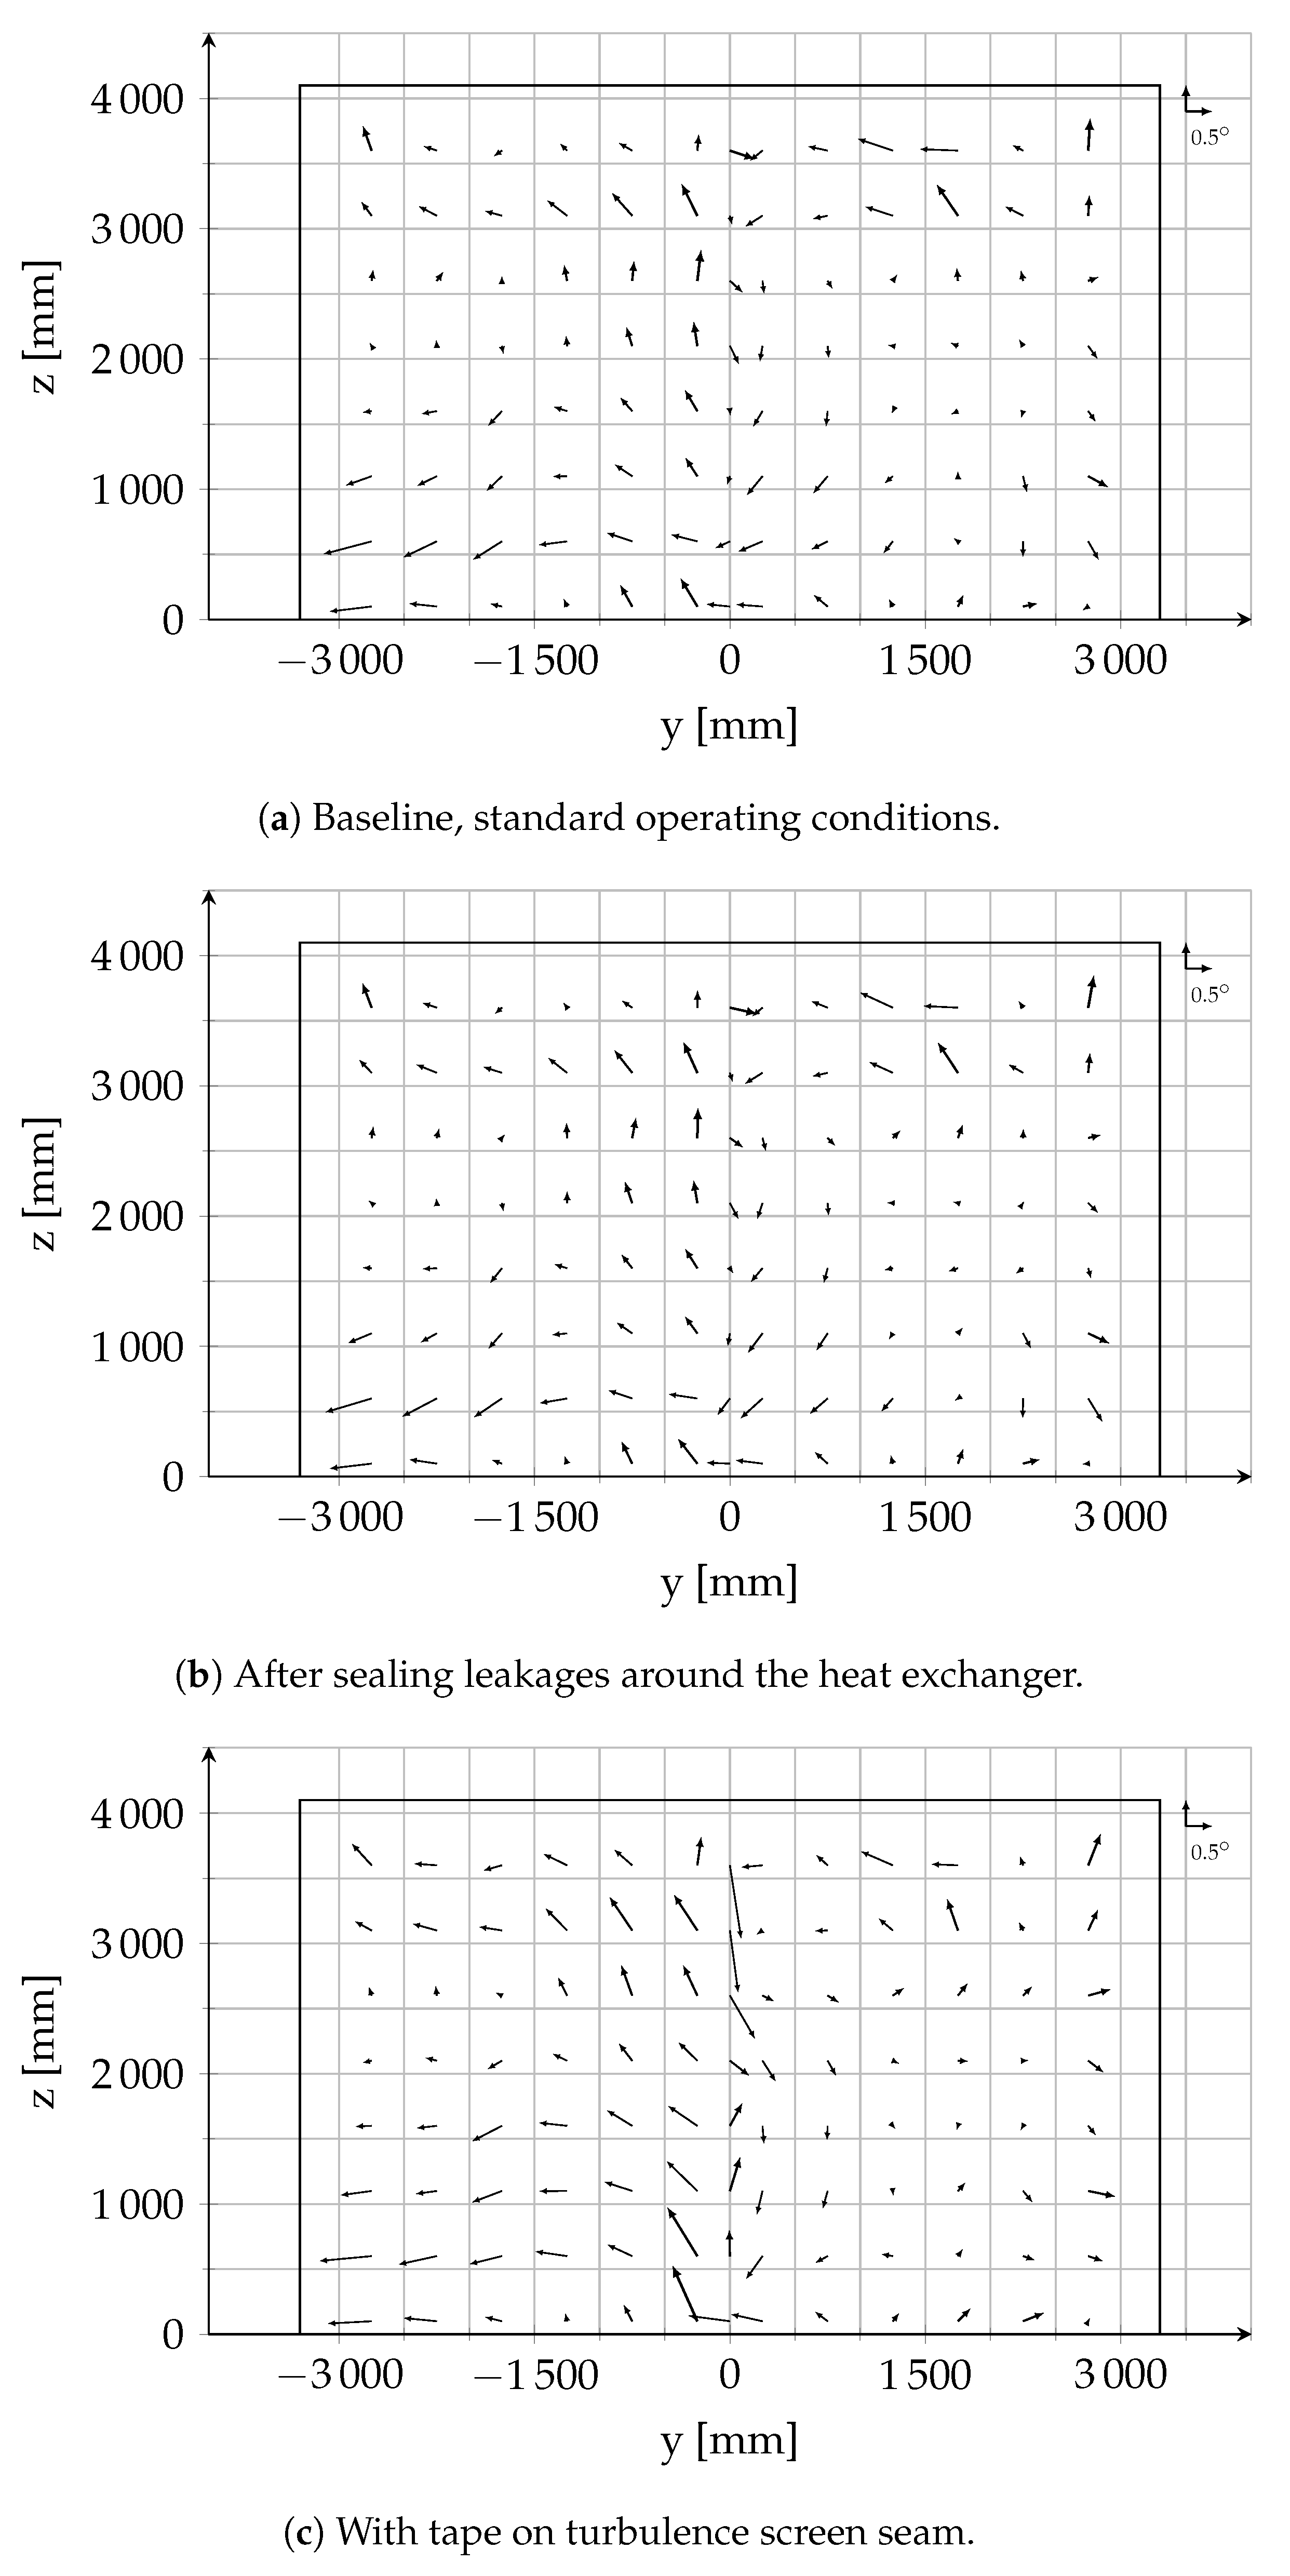
The flow angularity for standard operating conditions is shown in
Figure 10a. Since the airpath has not been altered in any major way after the moving ground upgrade,
Figure 4b and
Figure 10a should be very similar. However, a significant difference can be seen in the upper half of the right side of the test section, where the inward and downward flow seen in 2006 is not visible in the present data. A similar flow pattern is visible in all of the measurement planes for the 2006 data [
22]; for the most upstream planes the whole right hand side has a strong in- and downwash. The clear difference between the two lateral halves for the most upstream plane does not appear to be physical, and it is believed that this was caused by issues with the references used for the optical measurements of the probe mounting angles. These measurements were performed using a total station, which was likely mounted on different sides of the test section depending on the lateral position of the vertical strut. Hence, it is plausible that different reference points were used for the two lateral halves, thus causing the observed offset of the angles if one set of reference points were misplaced.
Further differences in pitch can be seen both in the uppermost and lowermost parts of the measurement region. These most likely stem from the fact that the commissioning strut used in 1986 and 2006 interfered with the flow in these regions. The vertical part of the commissioning strut was hanging from a roof beam fastened in the slotted roof and secured at the bottom by a beam laid down on the floor, and both these beams would deflect the flow. Furthermore, since the overall flow interference from the old commissioning strut was larger than for the new flow measurement rig due to a thicker structure and a shorter standoff distance between the probes and the leading edge of the vertical strut, it is concluded that the present data is more likely to be representative of the actual flow pattern. This is further strengthened by the fact that the present measurements are corrected for rig interference [
24], which was not the case for the commissioning measurements.
Comparing to the 1986 data in
Figure 4, it can be seen that the present flow pattern in
Figure 10a is not as symmetric between the lateral halves as the old data. The recent measurements indicate a flow that was more directed to the left in the lower part of both the left and the right side. Furthermore, much of the outwash seen in the upper part of the left hand side in the 1986 data was absent already in 2006 and is still so here. It is thereby likely that this change occurred during the upgrade, which means that either the fan or the boundary layer control system was the cause. It is not plausible that any of the sub-systems in the boundary layer control system and moving ground, which are all located at the floor, had such an impact in this part of the measurement region, which indicates that at least some of the flow angularity was caused by the fan.
3.2. Modification to the Flow Conditioning
The influence on flow angularity from the performed modifications to the flow conditioning devices in the settling chamber can be seen in
Figure 10. Comparing
Figure 10a and
Figure 10b, it can be seen that sealing the heat exchanger leakage does not impact the flow angularity in the test section. It is likely that the disturbance from the leakage flow is small enough to be dampened out by the three turbulence screens mounted downstream of the heat exchanger, and thus not result in any measurable impact on the test section flow field.
Turning to
Figure 10c, it can be seen that adding the tape to the turbulence screen had a clear influence on the flow angularity at and around
, but did not change the overall behavior of the flow pattern in a major way. Since the tape was significantly wider than the screen weld, the flow influence from the weld itself was much smaller than that caused by the tape. Thus, given that the overall influence from the tape was relatively small, it is concluded that the weld might have a minor influence on the flow angles at the lateral center, but that it is not a significant contributor to the swirling flow pattern in the test section. This is expected, since the weld is very small compared to the total size of the settling chamber.
Since both the heat exchanger leakage flow and the screen welds have been ruled out as the cause of the rotating flow angularity pattern in the test section, the reason has to be found elsewhere. The fact that the rotation of the observed pattern corresponded to the rotational direction of the fan, and that the flow pattern changed slightly when the fan was changed during the moving ground upgrade, indicates that the rotation stemmed from residual swirl from the fan. This corresponds well to the statement by Barlow et al. [
17], saying that vortex-like flow patterns could be caused by non-uniform flow upstream of the third corner. In order to confirm this, measurements would have to be performed throughout the airpath of the tunnel.
3.3. Influence from Flow Angularity on Measured Forces on a Vehicle
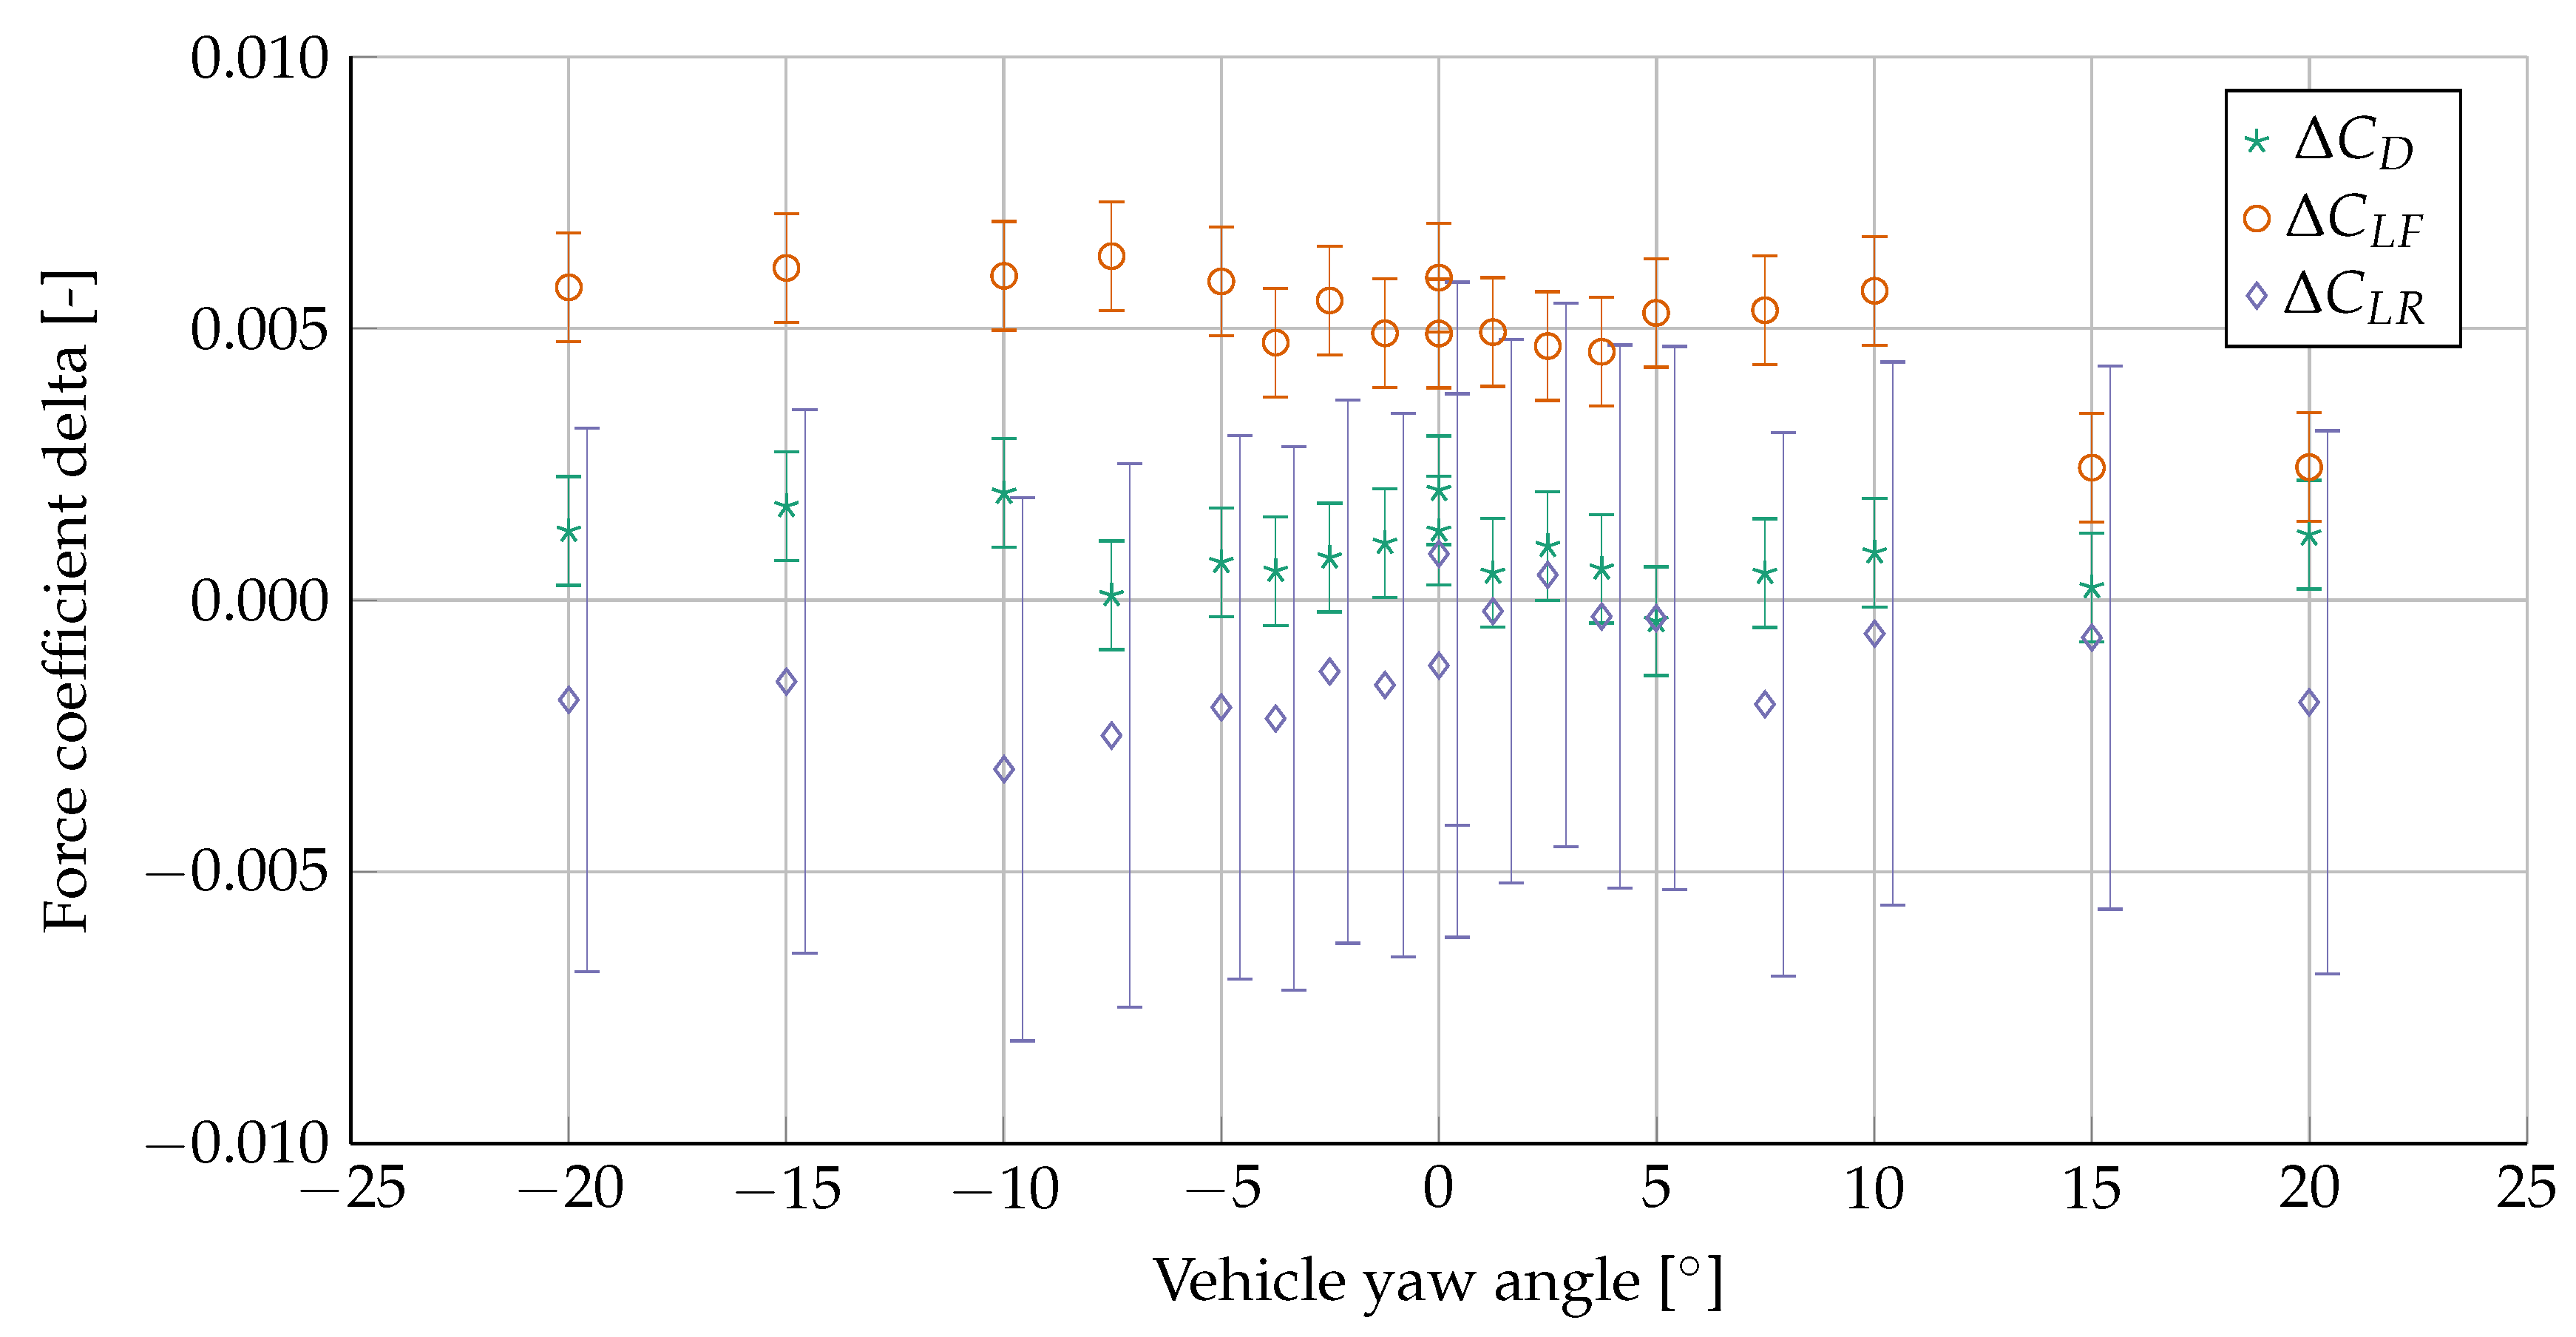
The force coefficient differences between standard operating conditions and taped downstream turbulence screen can be seen in
Figure 11, where the error bars represent the within-test repeatability given in
Table 2. The reason for the double measurements at zero yaw is that the yaw sweep procedure is built up by two procedures, each starting at zero yaw measuring either the positive or negative angles.
From the figure, it can be seen that
is within the in-test repeatability for most yaw angles, with a notable exception being the largest negative angles. However, the maximum delta is still within the between test repeatability. Considering the rear axle lift, the measured difference is within the in-test repeatability for all yaw angles. This is not the case for the front axle lift, which was consistently increased by
over the full yaw angle range, with the exception of the two largest positive angles. This increase is expected, given that the tape induces an upwards flow in the lower central region of
Figure 10c. However, both
and
are within the between test repeatability of the wind tunnel throughout the full yaw angle range, and thus not considered substantial. Furthermore, the difference in flow angularity introduced by the tape was of a similar magnitude as the flow angularity under standard operating conditions. Thus, it is likely that the present flow angularity did not have a significant influence on the forces measured on a vehicle, compared to an ideal flow without angularity.
4. Conclusions
The flow angularity in the test section of an automotive slotted wall wind tunnel has been investigated. Since the original commissioning in 1986, through an upgrade commissioning in 2006, to present measurements, a rotating flow pattern has been observed in the center of the test section.
By sealing a non-uniform leakage flow path around the heat exchanger in the settling chamber, it was shown that the leakage has no impact on the flow angularity in the test section. Furthermore, the influence from the weld of the two halves of the turbulence screens was exaggerated by adding a 40 -wide tape strip over the weld at the most downstream screen. The results show that this disturbance of the flow at the lateral center in the settling chamber only impacted the corresponding region in the test section, and that the screen welds did not have an impact on the global flow angularity pattern. Based on these findings and the fact that the rotation of the pattern corresponds to the rotational direction of the fan, it is likely that the cause of the observed vortexlike structure is residual swirl from the fan not being fully countered by the flow conditioning devices between the fan and the test section.
By measuring the forces on a reference car with the flow angularity introduced by the screen tape, it was found that the influence from from the tape induced flow angularity was mostly within the in-test repeatability for drag and rear axle lift. For the front axle lift, an increase was seen due to the increased upflow in the region where the car is located. However, the increase was within the specified between test repeatability for front axle lift, and thus it is not deemed significant. Furthermore, the extra angularity caused by the screen tape was of similar magnitude as the flow angles seen for normal operating conditions, which indicates that the levels of flow angularity for regular testing does not impact the measurement results in any major way.
Although the slotted wall test section configuration of the investigated wind tunnel is uncommon among automotive wind tunnels, the results are still applicable to a wider range of tunnels. For example, the layout of the settling chamber with a heat exchanger and turbulence screen is commonly used for any test section type, meaning that the results presented here showing that leakage paths and turbulence screen welds do not have a significant influence on the test section flow angularity can likely be applied to any wind tunnel with a similar flow conditioning setup.
Author Contributions
Conceptualization, E.L., S.S. and A.B.; methodology, E.L.; validation, E.L.; formal analysis, E.L; investigation, E.L.; resources, A.B.; data curation, E.L.; writing—original draft preparation, E.L.; writing—review and editing, E.L., S.S., and A.B.; visualization, E.L.; supervision, S.S. and A.B.; project administration, S.S. and A.B.; funding acquisition, S.S. and A.B.
Funding
This work was funded by FFI grant P2014-01359 (Fordonsstrategisk Forskning och Innovation, Strategic Vehicle Research and Innovation) through Vinnova (Sweden’s innovation agency), and Volvo Cars.
Conflicts of Interest
The authors declare no conflict of interest. The funders had no role in the design of the study; in the collection, analyses, and interpretation of data; in the writing of the manuscript, or in the decision to publish the results.
References
- Global Technical Regulation No. 15 (Worldwide Harmonized Light Vehicles Test Procedure), Appendix 1 to Amendment 1 to UN GTR No. 15 ECE/TRANS/180/Add.15/Amend.1/Appendix 1. United Nations Global Technical Regulation. Available online: https://www.unece.org/fileadmin/DAM/trans/main/wp29/wp29wgs/wp29gen/wp29registry/ECE-TRANS-180a15am1app1e.pdf (accessed on 30 November 2019).
- Jackson, C.M. Description and Calibration of the Langley Unitary Plan Wind Tunnel; NASA: Washington, DC, USA, 1981.
- Mcghee, R.J.B. Recent Modifications and Calibration of the Langley Low-Turbulence Pressure Tunnel; NASA: Washington, DC, USA, 1984.
- Nilsson, L.U.; Berndtsson, A. The New Volvo Multipurpose Automotive Wind Tunnel; SAE Technical Paper 870249; SAE International: Warrendale, PA, USA, 1987. [Google Scholar] [CrossRef]
- Olson, L.E.; Zell, P.T.; Soderman, P.T.; Falarski, M.D.; Corsiglia, V.R.; Edenborough, H.K. Aerodynamic Flow Quality and Acoustic Characteristics of the 40- by 80-Foot Test Section Circuit of the National Full-Scale Aerodynamic Complex; SAE International: Warrendale, PA, USA, 1987. [Google Scholar] [CrossRef]
- Henderson, A., Jr.; Mckinney, L.W. Overview of the 1989 Wind Tunnel Calibration Workshop; NASA: Washington, DC, USA, 1993. Available online: https://ntrs.nasa.gov/archive/nasa/casi.ntrs.nasa.gov/19940007397.pdf (accessed on 30 November 2019).
- Arrington, E.; Gonzalez, J. Flow quality improvements in the NASA Lewis Research Center 9- by 15-Foot Low Speed Wind Tunnel. In Proceedings of the 31st Joint Propulsion Conference and Exhibit, San Diego, CA, USA, 10–12 July 1995; American Institute of Aeronautics and Astronautics: Reston, VA, USA, 1995. [Google Scholar] [CrossRef]
- Meredith, S.; Martindale, W.; Benetti-Longhini, L.; Boylan, D.; Chaney, M. Aerodynamic commissioning results for the Korea Air Force Academy Subsonic Wind Tunnel. In Proceedings of the 38th Aerospace Sciences Meeting and Exhibit, Reno, NV, USA, 10–13 January 2000; American Institute of Aeronautics and Astronautics: Reston, VA, USA, 2000. [Google Scholar] [CrossRef]
- Alvarez, J.; Landman, D. Test section flow quality surveys of the Langley Full-Scale Tunnel. In Proceedings of the 40th AIAA Aerospace Sciences Meeting & Exhibit, Reno, NV, USA, 14–17 January 2002; American Institute of Aeronautics and Astronautics: Reston, VA, USA, 2002. [Google Scholar] [CrossRef]
- Walter, J.; Duell, E.; Martindale, B.; Arnette, S.; Geierman, R.; Gleason, M.; Romberg, G. The DaimlerChrysler Full-Scale Aeroacoustic Wind Tunnel; SAE Technical Paper 2003-01-0426; SAE Technical Paper 870249; SAE International: Warrendale, PA, USA, 2003. [Google Scholar] [CrossRef]
- Waudby-Smith, P.; Bender, T.; Vigneron, R. The GIE S2A Full-Scale Aero-Acoustic Wind Tunnel; SAE Technical Paper 2004-01-0808; SAE International: Warrendale, PA, USA, 2004. [Google Scholar] [CrossRef]
- Sternéus, J.; Walker, T.; Bender, T. Upgrade of the Volvo Cars Aerodynamic Wind Tunnel; SAE Technical Paper 2007-01-1043; SAE International: Warrendale, PA, USA, 2007. [Google Scholar] [CrossRef]
- Ueno, M.; Sudani, N. Flow Angularity Measurement of JAXA 2m × 2m Transonic Wind Tunnel. In Proceedings of the 46th AIAA Aerospace Sciences Meeting and Exhibit, Reno, NV, USA, 7–10 January 2008; American Institute of Aeronautics and Astronautics: Reston, VA, USA, 2008. [Google Scholar] [CrossRef]
- Duell, E.G.; Kharazi, A.; Muller, S.; Ebeling, W.; Mercker, E. The BMW AVZ Wind Tunnel Center; SAE Technical Paper 2010-01-0118; SAE International: Warrendale, PA, USA, 2010. [Google Scholar] [CrossRef]
- Bender, T.; Hoff, P.; Kleemann, R. The New BMW Climatic Testing Complex—The Energy and Environment Test Centre; SAE Technical Paper 2011-01-0167; SAE International: Warrendale, PA, USA, 2010. [Google Scholar] [CrossRef]
- Arrington, E.; Pickett, M.; Sheldon, D. Flow quality studies of the NASA Lewis Research Center Icing Research Tunnel. In Proceedings of the 25th Plasmadynamics and Lasers Conference, Colorado Springs, CO, USA, 20–23 June 1994; American Institute of Aeronautics and Astronautics: Reston, VA, USA, 1994. [Google Scholar] [CrossRef]
- Barlow, J.B.; Pope, A.; Rae, W.H. Low-Speed Wind Tunnel Testing, 3rd ed.; Wiley: Hoboken, NJ, USA, 1999. [Google Scholar]
- Murthy, S.; Kmak, F.; Koss, B. The design and installation of a turbulence reduction system for the NASA Ames 11- by 11-foot Transonic Wind Tunnel. In Proceedings of the 20th AIAA Advanced Measurement and Ground Testing Technology Conference, Albuquerque, NM, USA, 15–18 June 1998; American Institute of Aeronautics and Astronautics: Reston, VA, USA, 1998. [Google Scholar] [CrossRef]
- Amaya, M.; Murthy, S. Flow quality measurements in the NASA Ames upgraded 11-by 11-foot transonic wind tunnel. In Proceedings of the 21st Aerodynamic Measurement Technology and Ground Testing Conference, Denver, CO, USA, 19–22 June 2000; American Institute of Aeronautics and Astronautics: Reston, VA, USA, 2000. [Google Scholar] [CrossRef]
- Ljungskog, E. Investigations of Flow Conditions in an Automotive Wind Tunnel. Licentiate Thesis, Chalmers University of Technology, Gothenburg, Sweden, 2017. [Google Scholar]
- DSMA International Inc. Aerodynamics Commissioning Report Phase I Programme; Internal Report 4034/R184; DSMA International Inc.: Toronto, ON, Canada, 1986. [Google Scholar]
- Bender, T. Commissioning Report: PVT Ground Simulation Upgrade; Internal Report 4147R269; Aiolos Engineering Corporation: Etobicoke, ON, Canada, 2006. [Google Scholar]
- BIPM; IEC; IFCC; ILAC; IUPAP; ISO; OIML; IUPAC. Evaluation of Measurement Data—Guide to the Expression of Uncertainty in Measurement; ISO: Geneva, Switzerland, 2008. [Google Scholar]
- Ljungskog, E.; Sebben, S.; Broniewicz, A. Uncertainty Quantification of Flow Uniformity Measurements in a Slotted Wall Wind Tunnel; SAE Technical Paper 2019-01-0656; SAE International: Warrendale, PA, USA, 2019. [Google Scholar] [CrossRef]
- AIAA. Recommended Practice: Calibration of Subsonic and Transonic Wind Tunnels (AIAA R-093-2003); AIAA Standards; American Institute of Aeronautics and Astronautics, Inc.: Reston, VA, USA, 2003. [Google Scholar] [CrossRef]
© 2019 by the authors. Licensee MDPI, Basel, Switzerland. This article is an open access article distributed under the terms and conditions of the Creative Commons Attribution (CC BY) license (http://creativecommons.org/licenses/by/4.0/).


