Article

Life Cycle Assessment and Techno-Economic Analysis of Pressure Sensitive Bio-Adhesive Production

Department of Agricultural and Biosystems Engineering, Iowa State University, Ames, IA 50011, USA
*
Author to whom correspondence should be addressed.
Energies 2019, 12(23), 4502; https://doi.org/10.3390/en12234502
Submission received: 9 August 2019 / Revised: 19 November 2019 / Accepted: 19 November 2019 / Published: 27 November 2019
(This article belongs to the Special Issue Sustainability of Biorenewable Systems and Processes)

Abstract

:
Bioproducts have attracted much attention in recent years due to the increasing environmental concerns about petroleum products. In this study, we aimed to explore potential environmental impacts and economic feasibility of pressure sensitive bio-adhesive (PSA) produced from the reversible addition-fragmentation chain transfer polymerization process. A detail process model of pressure sensitive bio-adhesive was developed in order to thoroughly understand both economic and environmental impacts of this production process. Life cycle assessment results showed that the overall environmental impacts of bio-adhesive was ~30% lower compared to the petro-adhesive’s production process. The minimum selling price for this pressure sensitive bio-adhesive was calculated as $3.48/kg. Sensitivity analysis results indicated that raw materials costs had the most significant impact on pressure sensitive bio-adhesive’s selling price, followed by total capital investment. Electricity sources had larger environmental impacts to the overall bio-adhesive production process compared to transportation distance and product yield. These results highlight the environmental advantage and potential economic competency of this pressure sensitive bio-based adhesive.

Graphical Abstract

1. Introduction

Fossil fuel plays a key role in current chemical industry due to its capability to produce varieties of raw materials for industrial manufacturing through petroleum refining process [1]. According to the U.S. Environmental Protection Agency (U.S. EPA), 65% of the global greenhouse gas (GHG) emission come from CO2; among which fossil fuel consumption is the primary source of CO2 [2]. Therefore, numerous efforts have been made to reduce the dependency on fossil fuel. Adhesives are one of the materials that can be produced from chemicals derived from petroleum refineries [3]. As estimated by Research and Markets, the worldwide adhesive market will reach U.S. $53.3 billion by 2022 [4]. Environmental-friendly and sustainable bio-adhesives are needed to meet the demand of the growing global adhesive market.
A widely applied adhesive known as pressure sensitive adhesive (PSA) is able to bond materials on their surface by applying pressure [5]. PSA has been used in many areas, such as packaging tapes, automotive, electricity and medical industries [6]. The demand of PSA has increased rapidly over the last decade. Based on the survey from Statistics Market Research Consulting (MRC), PSA market is estimated to reach U.S. $13.63 billion by 2023 [7].
The reversible addition-fragmentation chain transfer (RAFT) polymerization process was explored in this study to produce polymers due to its convenience and flexibility [8]. Environmental-friendly solvents such as water-based solvent and ionic liquids can be used to conduct the RAFT polymerization process [9,10]. Additionally, renewable resources can also be polymerized through the RAFT polymerization process to produce bio-polymers [11]. In 2013, Cochran et al. used plant oil and animal oil to produce thermoplastic homopolymers and block copolymers via the RAFT polymerization process [12]. Gallagher et al. further developed the characteristics of PSA using acrylic triblock copolymer (prepared from the RAFT polymerization process) and they reported higher peel force, tack force and no failure time up to 10,000 minutes [13]. Glycerol-based polymers produced through the RAFT polymerization process seem to offer better properties than petro-based polymers due to the high amount of hydroxyl groups, which can provide opportunities to meet various needs [14]. These products are currently being deployed commercially, and there is still ongoing work focusing on optimization of the glycerol-based PSA production process so that it can be commercially successful. A key component to successful commercialization is developing processes that have lower environmental and cost impacts compared to traditional manufacturing methods and substrates.
In this study, the environmental impact of this PSA production process was quantified by life cycle assessment (LCA) and economic feasibility of this process was evaluated by techno-economic analysis (TEA). LCA has been used to evaluate the environmental impacts associated with all the stages of a product’s life from cradle to grave since the 1960s [15]. Initial LCA results can provide decision makers key information about potential environmental impacts from the process, and can aid in process development choices. Typically, there are four steps in an LCA study. The first step is to define goal and scope of the study, including determining system boundary and functional unit (FU). The next step is to compile the input and output data within the system boundary, also known as inventory analysis. After that, impact assessment is conducted by choosing a proper impact assessment method to categorize emissions for quantify environmental impacts’ calculation. Last but not least, an interpretation step is needed to interpret the results from the previous steps [16]. Environmental impact assessment has been conducted in formaldehyde-based adhesive extensively, [17,18,19]; however, little has been done regarding the PSA. A TEA study requires technical parameters to conduct mass and energy balance of the production process, and then economic factors need to be considered to assess the economic feasibility of the process [20]. TEA has been widely applied in the area of renewable energy [21,22,23,24]. In the field of adhesives, Yang and Rosentrater compared the economic feasibility of structural bioadhesive relative to petro-based adhesive [25]; yet, little has been done for PSA.
The main objectives of this study were to evaluate environmental impacts and the economic feasibility of PSA from the RAFT polymerization process, in order to help guide commercialization efforts. A detailed process model was developed (based on laboratory and pilot-scale data) to explore both environmental impacts and production costs associated with this process. Glycerol was the most important raw material to produce monomers which can be further used in polymerization process; its sources are also compared in both LCA and TEA models. Sensitivity analyses were conducted to determine the most sensitive parameters in terms of the unit production price ($/kg), as well as GHG emissions.

2. Methods

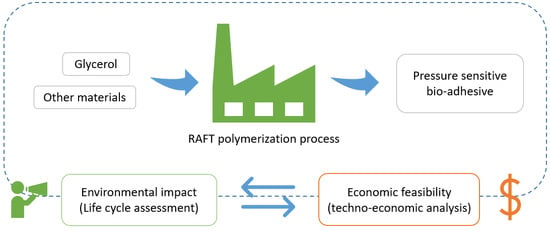
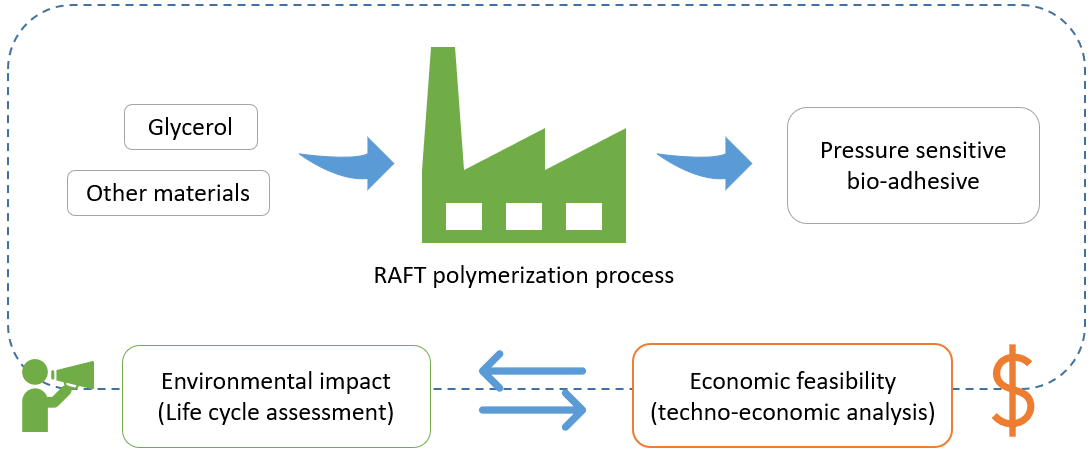
2.1. Life Cycle Assessment

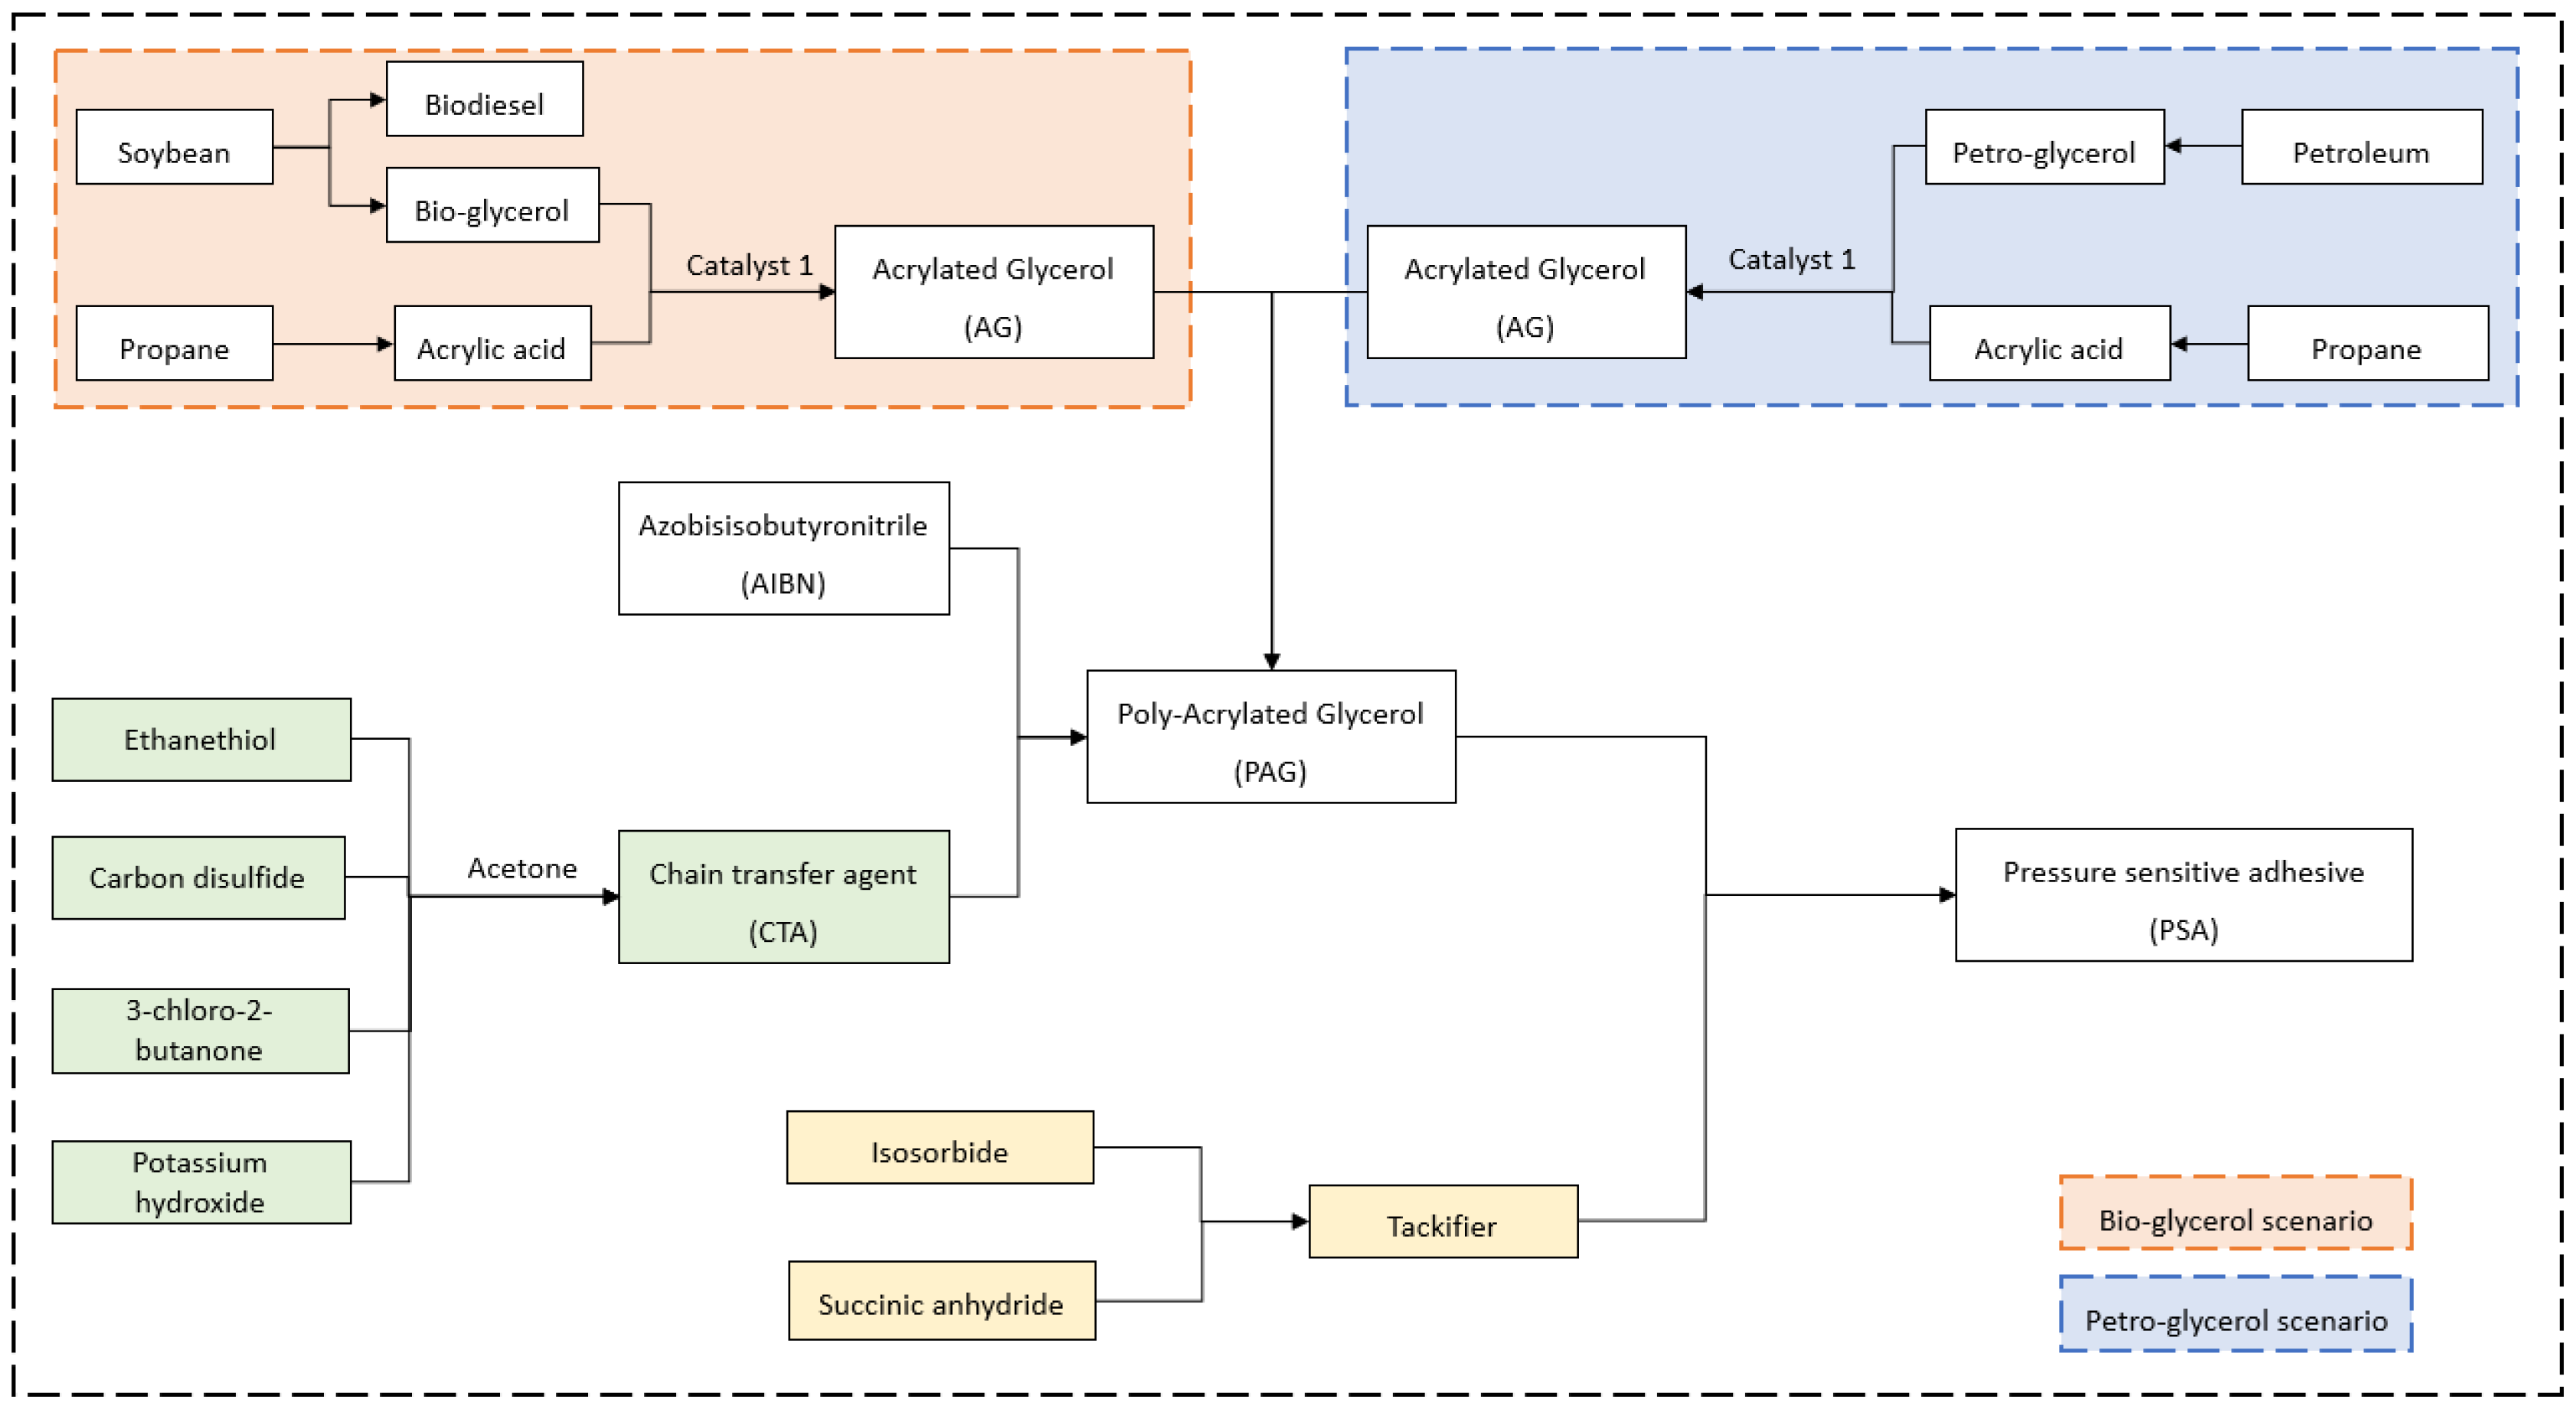
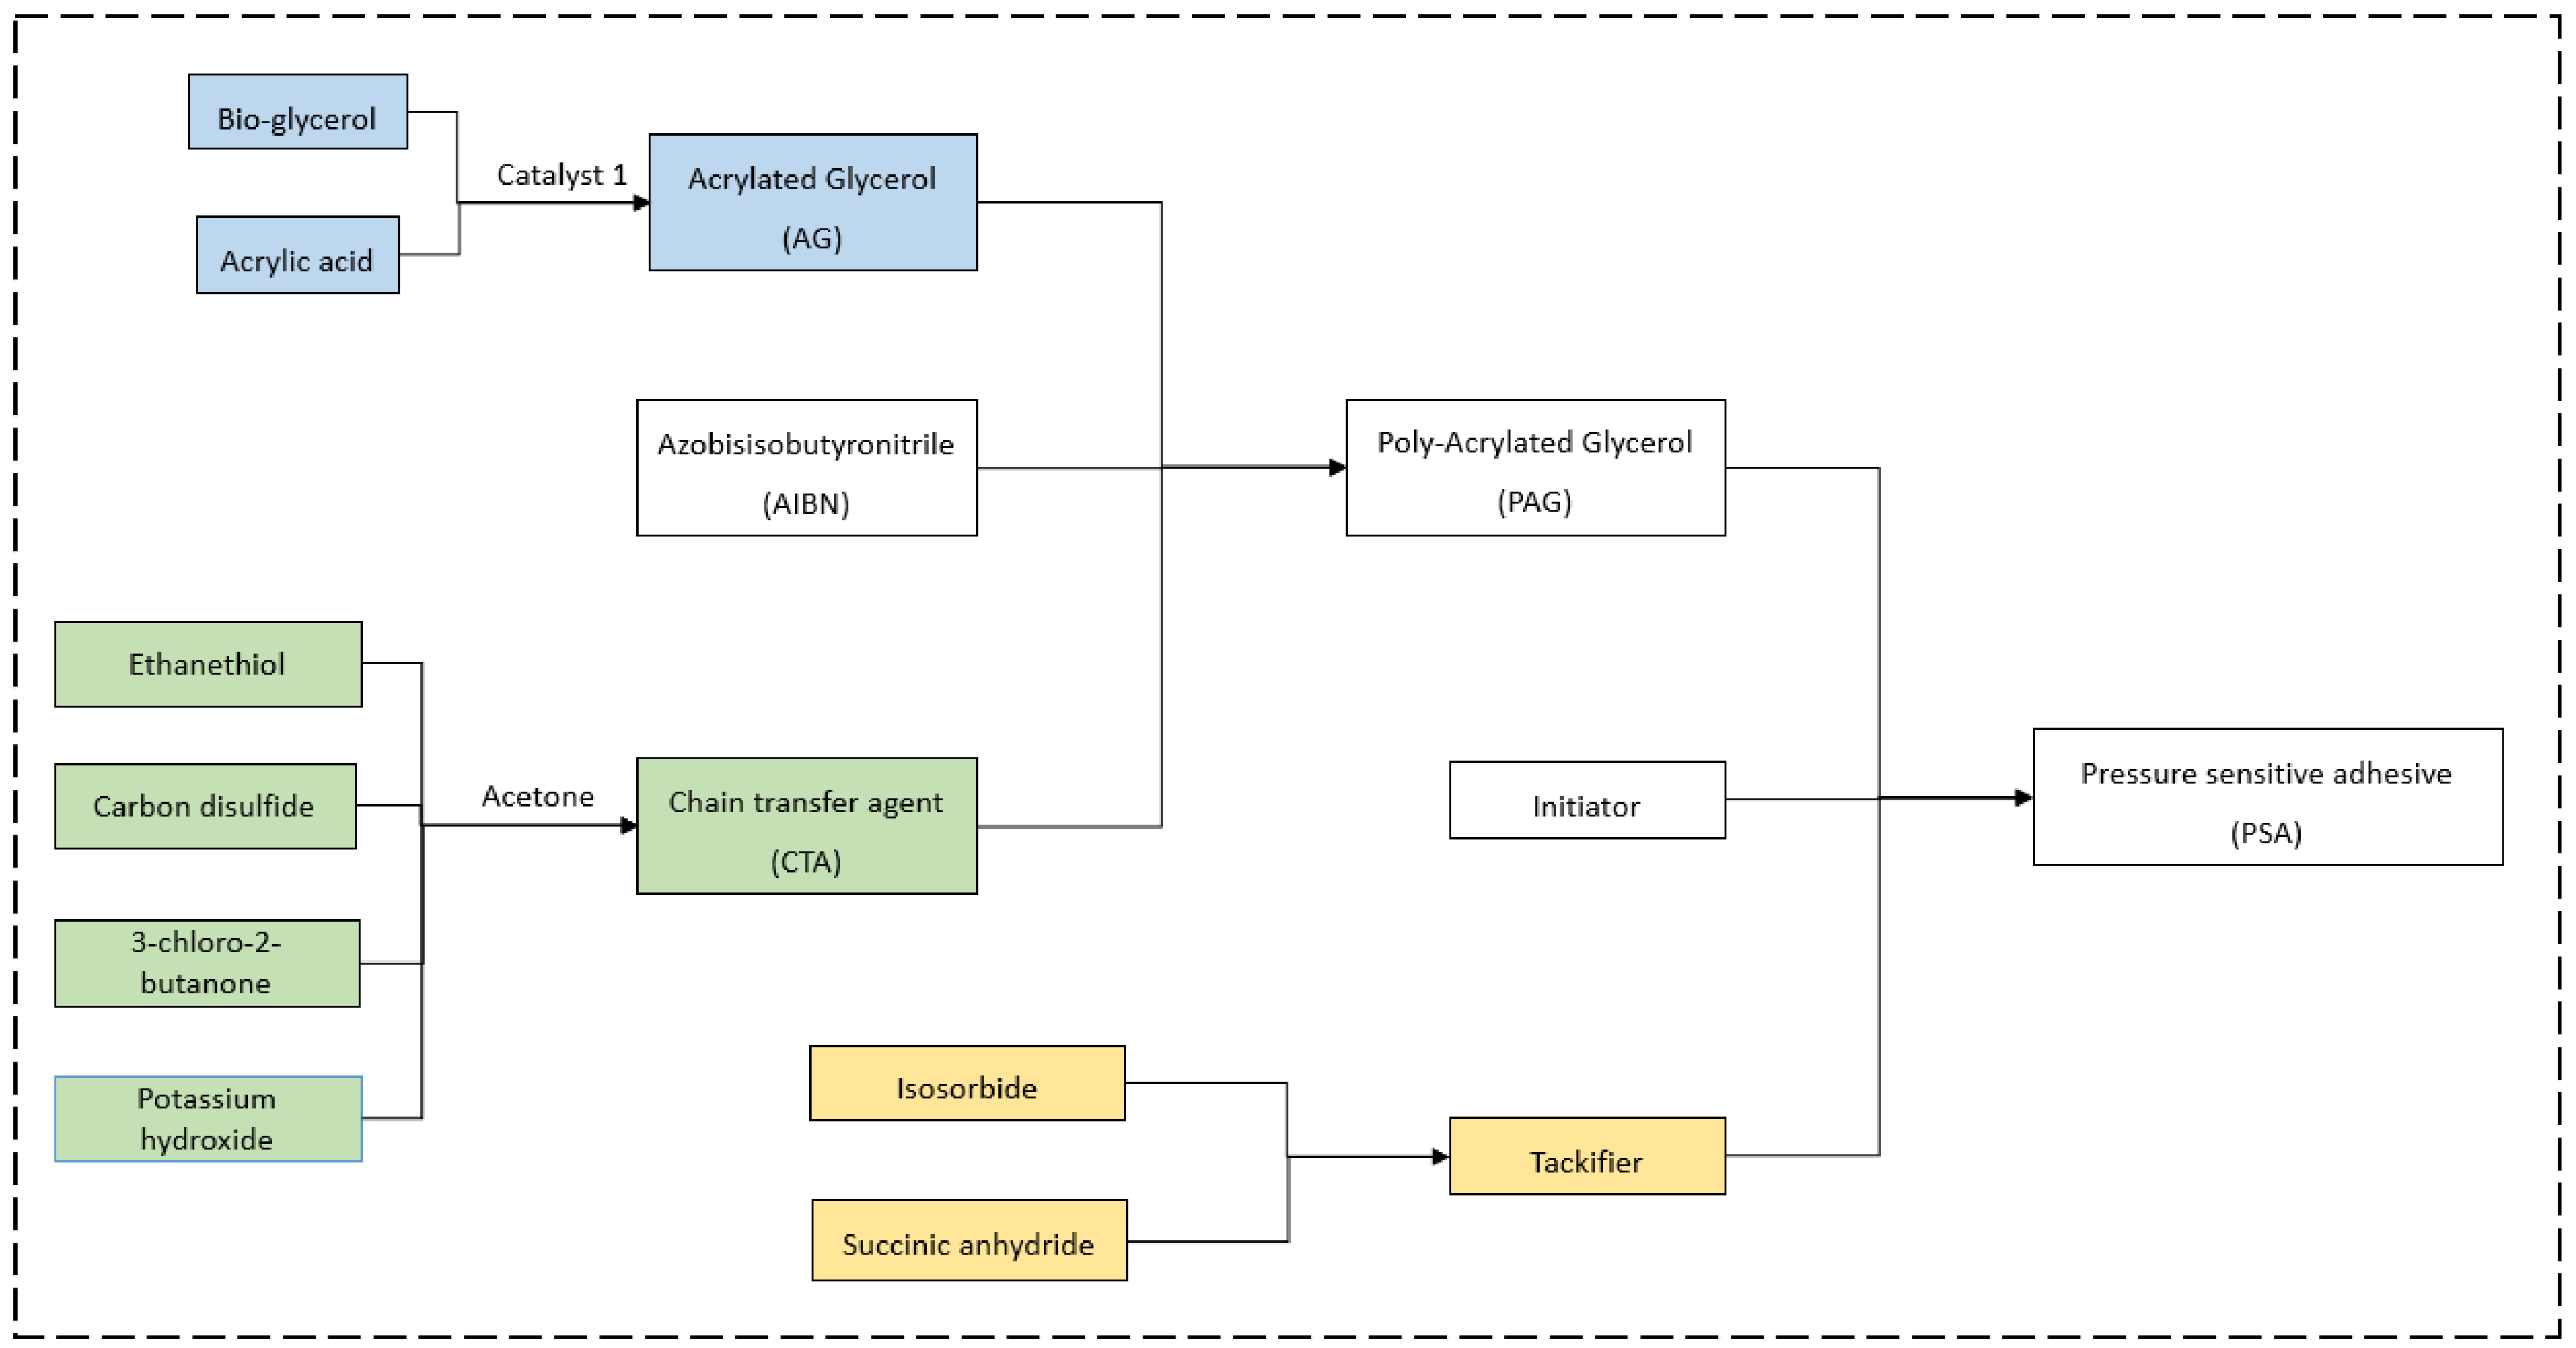
2.1.1. Goal and Scope Definition

In this study, we conducted cradle to gate LCA with two glycerol sources as shown in Figure 1. Bio-glycerol scenario means that glycerol comes from the biodiesel plant, while the petro-glycerol scenario refers to the origin of glycerol was the petroleum refinery plant. The PSA production plant was assumed to be located in central Iowa, U.S. A diesel-powered truck was used as the transportation vehicle and transportation distance of raw materials to the production plant was set to be 80.5 km (50 miles). The system boundary starts from raw material extraction, truck transportation to the PSA production plant, monomer production, polymer production, and PSA production in the plant. The functional unit (FU) used in this study was 1 kg of PSA produced.

2.1.2. Life Cycle Inventory Analysis

Electricity source data was collected from the U.S. Energy Information Administration (U.S. EIA) report [26]. As shown in supporting information (SI) Table S1, approximately 58% of electricity in Iowa was produced from fossil fuel, followed by 18% of hydroelectric power and 14% of wind power. A preliminary environmental assessment on electricity source indicates that GHG emission could be reduced from ~1 kg CO2-eq./MJ electricity produced from fossil fuel to ~0.04 kg CO2-eq./MJ electricity produced with 100% renewable sources. The large reduction in GHG emission makes us believe that electricity source is a sensitive input parameter in terms of the overall environmental impacts of the PSA production process.
The PSA production data was mainly obtained from Iowa State University’s research laboratory. Literature, industry reports, and patents were used as background data. Databases, including EcoInvent, GaBi, and U.S. life cycle inventory (U.S. LCI), were also employed to cover data gaps. The overall PSA production process can be divided into five parts: (1) acrylated glycerol (AG) production process; (2) chain transfer agent (CTA) production process; (3) poly-acrylated glycerol (PAG) production process; (4) tackifier production process; (5) PSA production process. Energy consumption data in the PSA production process was obtained from techno-economic models.
In a bio-glycerol scenario, glycerol comes from biodiesel production plant. Biodiesel plant data was collected from the U.S. Department of Energy (U.S. DOE) biodiesel production report [27]. The biodiesel production process uses soybean as raw material; it begins with soybean grain cultivation, soybean oil production, and biodiesel production through oil transesterification. Crude glycerol (80 wt%) was obtained as a co-product in biodiesel production. The mass ratio between crude glycerol and biodiesel was 0.15 to 1. Energy inputs of 104.04 MJ (28.9 kWh) electricity and 1356 MJ of steam are needed when producing 1000 kg of biodiesel. More details of the biodiesel plant can be found in the U.S. DOE report [27]. As for petro-glycerol scenario, glycerol was produced from a petroleum refinery plant. The GaBi database was used in modeling this process. After glycerol was produced from either a biodiesel plant or a petroleum refinery plant, acrylic acid along with catalysts (amberlyst 15 and phenothiazine) were added to produce acrylated glycerol (AG) at 100 °C for 5 hours.
A chain transfer agent (CTA) or a RAFT agent was a key chemical in the RAFT polymerization process. Ethanethiol was reacted with potassium hydroxide for 30 minutes; carbon disulfide was further added to react with the neutralized solution for another 30 minutes; then, 3-chloro-2-butanone was added to produce the CTA under room temperature. Buffer solutions, such as acetone, are needed during CTA production processing; its recycle rate was set to be 97%, as suggested by other researchers (obviously higher is better, but 97% is a conservative estimate that can account for potential leaks and losses). As soon as AG and CTA are obtained, they react at 70 °C for 4 hours along with azobisisobutyronitrile (AIBN) to produce poly-acrylated glycerol (PAG) with molar mass of 10,000 g/mole. Afterwards, isosorbide and succinic anhydride with molar ratio of 1 to 2.2 are employed to produce tackifier at 80 °C for 2 hours. Once PAG and tackifier are ready, PSA was produced by mixing PAG and tackifier, with 4, 4′-azobis acting as an initiator. Main inventory data are summarized in Table 1.

2.1.3. Life Cycle Impact Assessment

In the LCA study, we chose two different life cycle impact assessment methods: the U.S. EPA’s Tool for the Reduction and Assessment of Chemicals and Other Environmental Impacts (TRACI) and EcoIndicator 99 (EI 99). TRACI is a mid-point impact assessment method, which considers the cause-effect chain of a particular impact category [28]. The impact categories in TRACI version 2.1 include global warming potential (GWP) to calculate GHG relative to CO2, acidification potential (AP) to assess the increasing hydrogen ion (H+) concentration, eutrophication potential (EP) to measure the enrichment of an aquatic ecosystem with nutrients such as P and N, ozone depletion potential (ODP) to calculate the relative importance of substances that contribute to the breakdown of the ozone layer, human health cancer and noncancer, and photochemical smog formation [29]. EI 99 is an end-point assessment method, which includes human health, resource, and ecosystem impacts, happens as a result of impact indicators usually addressed in a mid-point approach [28]. This could be more understandable to decision makers, since it evaluates the environmental impacts at the end-point level and it is usually expressed in one single score of the overall environmental impacts [30].

2.2. Techno-Economic Analysis

The PSA production plant was modeled in SuperPro Designer v9.5 software (Intelligen Inc., Cambridge, Massachusetts, USA) at five various plant scales: 1 t/d, 2 t/d, 5 t/d, 10 t/d, and 40 t/d. In this TEA study, we assume online time of the PSA production plant was 329 days per year (7896 hours per year), thus, 40 t/d was selected as the upper bound of the plant size since a commercial resin plant has a capacity of 10,000–15,000 tons per year [31]. Figure 2 exhibits the PSA production plant used in the techno-economic analysis. Bio-glycerol scenario as defined in life cycle assessment was modeled in the TEA study as the base case scenario. PSA production process was the same as described in life cycle inventory analysis. Mass and energy balance are performed in SuperPro Designer.

2.3. Total Capital Investment (CTCI) Analysis

Total capital investment (CTCI) was the sum of direct fixed capital cost (CDFC), working capital (CW), and start-up and validation cost (CS). In direct fixed capital category, equipment purchase cost, piping, instrumentation, insulation, electrical facilities, building, installation, yard improvement, land, engineering, construction, contingency, and contractor’s fee are considered. Equipment purchase cost was obtained directly from SuperPro Designer database. Others were calculated based on different factors of either purchase cost or direct cost [32]. Working capital, which refers to the money invested in making a plant into productive operation, was assumed to be 15% of direct fixed capital cost (CDFC) [33]. Start-up and validation cost was set to be 10% of direct fixed capital cost (CDFC) used to make the transition from construction to operation [34]. Detail assumptions of total capital cost (CTCI) are listed in SI Table S2.

2.4. Annual Operating Cost (CAOC) Analysis

Annual operating cost (CAOC) includes material cost (CM), utility cost (CU), labor cost (CL), and facilities cost (CF). Detail assumptions used in obtaining these costs are listed in SI Table S3. Material costs are mainly obtained from retailer websites, as listed in sources. We found that the price of glycerol from vegetable oil was $1.04/kg, but this can be dramatically reduced to $0.20/kg if obtained from crude oil [35]. Electricity price was $0.05/kWh as collected from the U.S. EIA electric power monthly report [36]. Steam, process water, and other utilities costs were gathered directly from SuperPro Designer database. Labor cost, excluding supervisory cost, was set at 20% of annual operating cost (CAOC). Straight-line depreciation method was used in this study; the recovery period was 9.5 years for the manufacture of chemicals and allied products as specified by the U.S. Internal Revenue Service (U.S. IRS) [37]. The salvage value of the equipment was assumed to be zero as often used in depreciation evaluation [38]. Waste treatment process and distribution and marketing costs were not considered due to insufficient data. Other assumptions, such as property insurance, local taxes, and plant overhead cost, were obtained from Peters et al. [32].

2.5. Profitability Analysis

Several economic parameters were used in the profitability analysis. Gross profit ($) measures the profit the PSA plant makes after deducting the costs required to make it (Equation (1)) [39]. It can help you decide whether you need to reduce operating cost or to increase PSA selling price. Net profit ($) is the amount obtained after annual gross profit subtracting annual local taxes and adding annual depreciation (Equation (2)) [32]. Depending on gross profit and net profit, we can evaluate the financial health of the PSA plant. Unit production cost ($/kg) is the total capital investment divided by reference flow, such as the amount of PSA produced per year (Equation (3)). Payback period (in years) is the time needed to recover total capital investment (Equation (4)) [38]. Net present value (NPV) is the difference between cash inflows and cash outflows (Equation (5)) [40]:
Gross   profit = Revenues C AOC
Net   profit = Gross   Profit Taxes + Depreciation
Unit   production   cos t =   Total   capial   investment Reference   flow
Payback   period =   Total   capial   investment Net   profit
Net   present   value = 1 t C t ( Net   cash   flow   at   year   t ) ( 1 + discount   rate ) t C 0 ( net   cash   flow   at   year   0 )

2.6. Discounted Cash Flow Analysis

Discounted cash flow analysis was carried out by considering the time value of money to determine the minimum bio-adhesive selling price (MSP). The MSP was the price that makes the net present value equal zero when other factors are kept constant [41]. The discount rate was set as 10%, commonly-used as reported in the literature [42,43]. The plant life was assumed to be 15 years and we assume this PSA plant was 100% equity financed. The construction time of the PSA plant was assumed to be 24 months, and the start-up time was assumed to be 6 months. The federal income tax rate was 40% [44]. All costs were reported in 2016 U.S. dollar in this study.

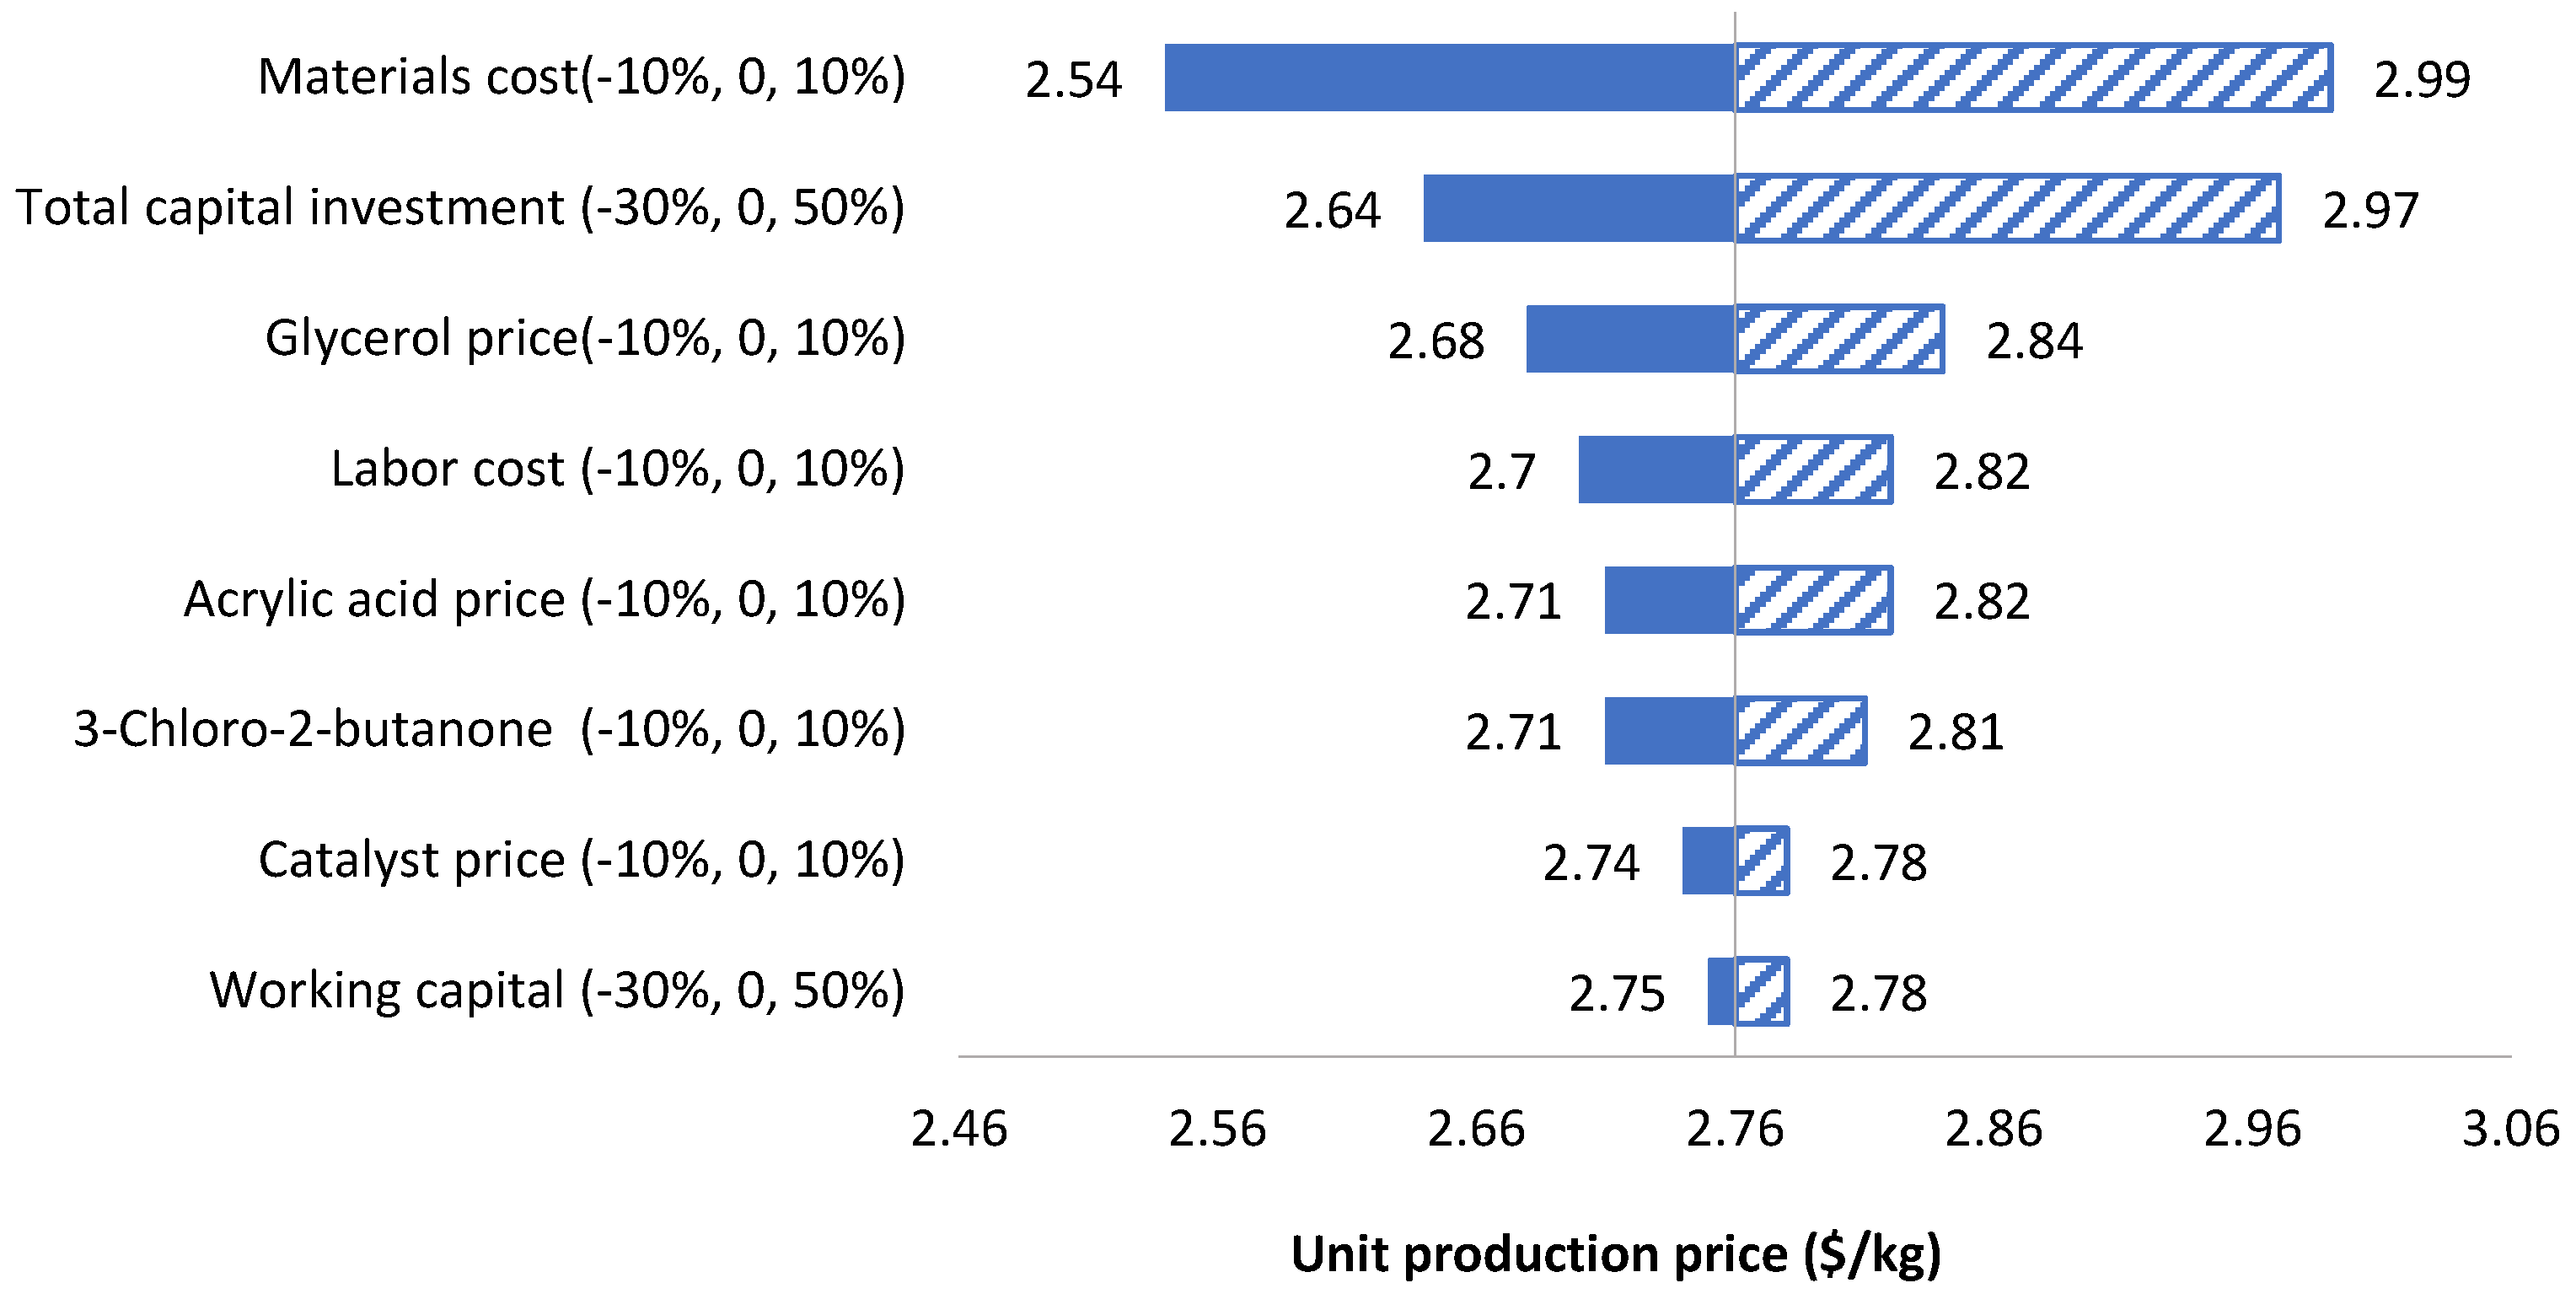
2.7. Sensitivity Analyses

One way to investigate uncertainty associated with the product value due to input variable variation is by using a sensitivity analysis [45] In the environmental impact assessment, electricity source, transportation distance and product yield are chosen based on their potential impact on GHG emission, represented by GWP result. Electricity source in the base case scenario was ~60% of fossil fuel; due to the large reduction in GHG emission by replacing electricity from renewables, sensitivity analysis on electricity sources (fossil fuel or renewable fuel) were investigated. GHG emission was reported to increase ~35% with a 50% increase in transportation distance for a centralized biorefinery plant [46]; thus, it has the potential to be a sensitive input as well. Product yield was selected due to the uncertainty associated with the production process itself. In the economic feasibility analysis, we explored the sensitivity of non-operating parameters on unit production cost. For instance, the impacts of raw materials costs and labor cost are explored within ±10%; the impact of working capital and project contingency reflected through total capital investment varies between −30% to 50% [47].

3. Results and Discussion

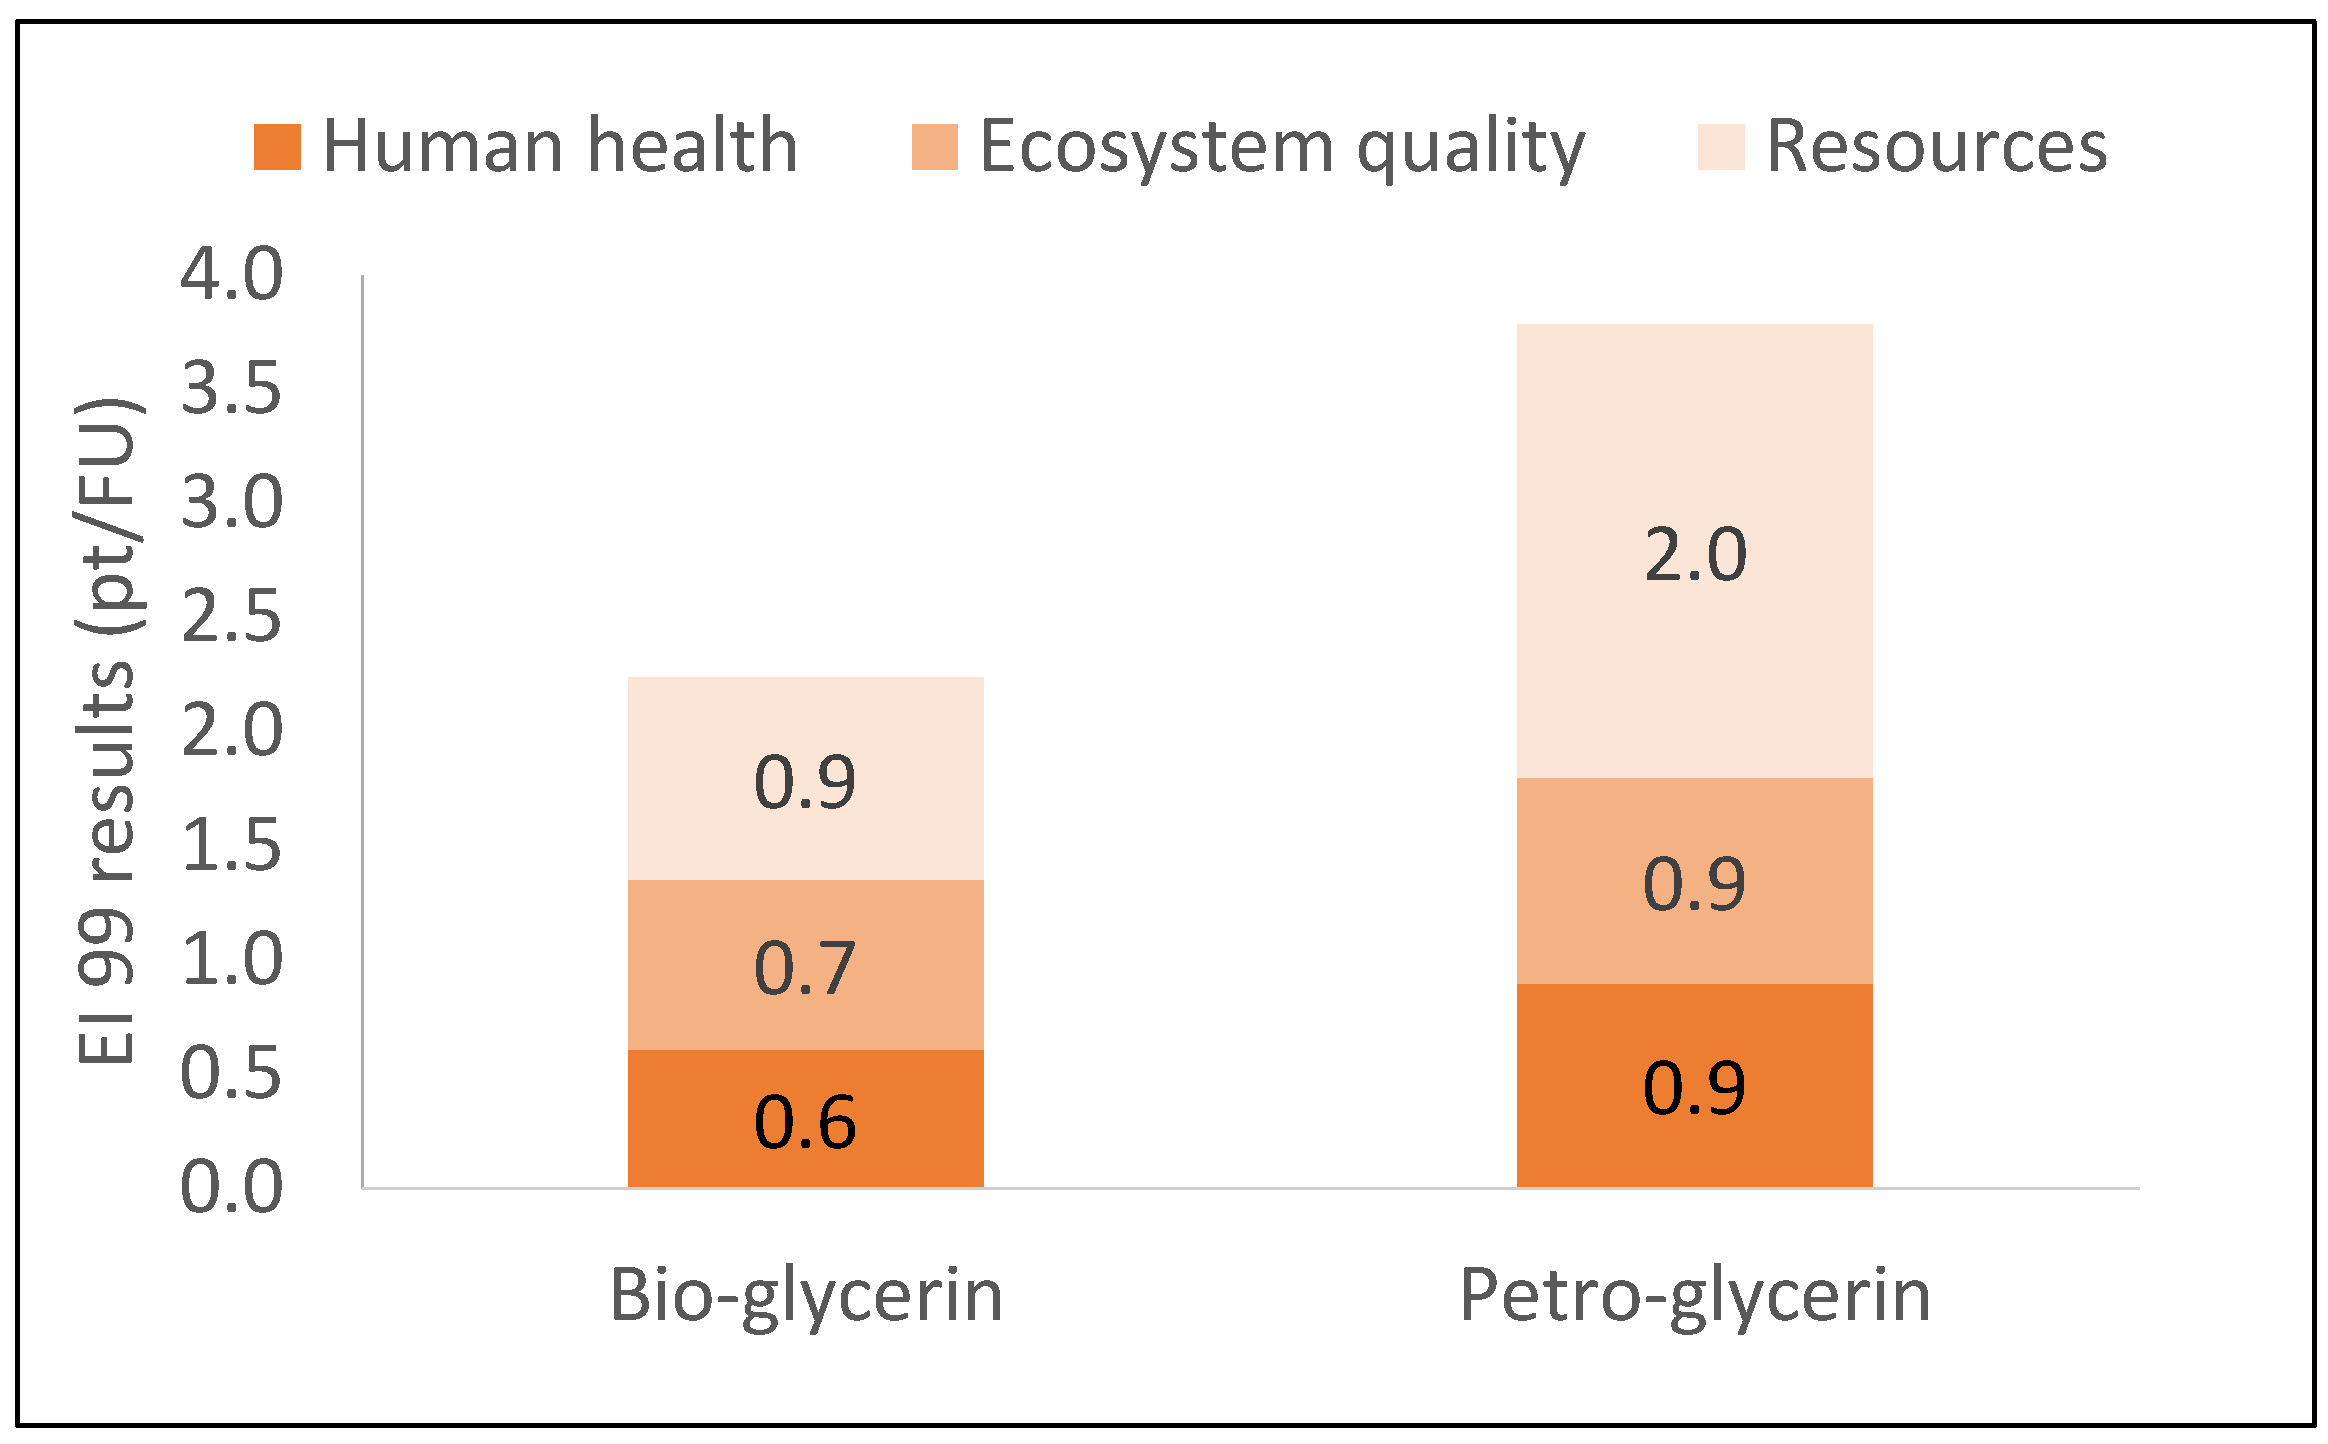
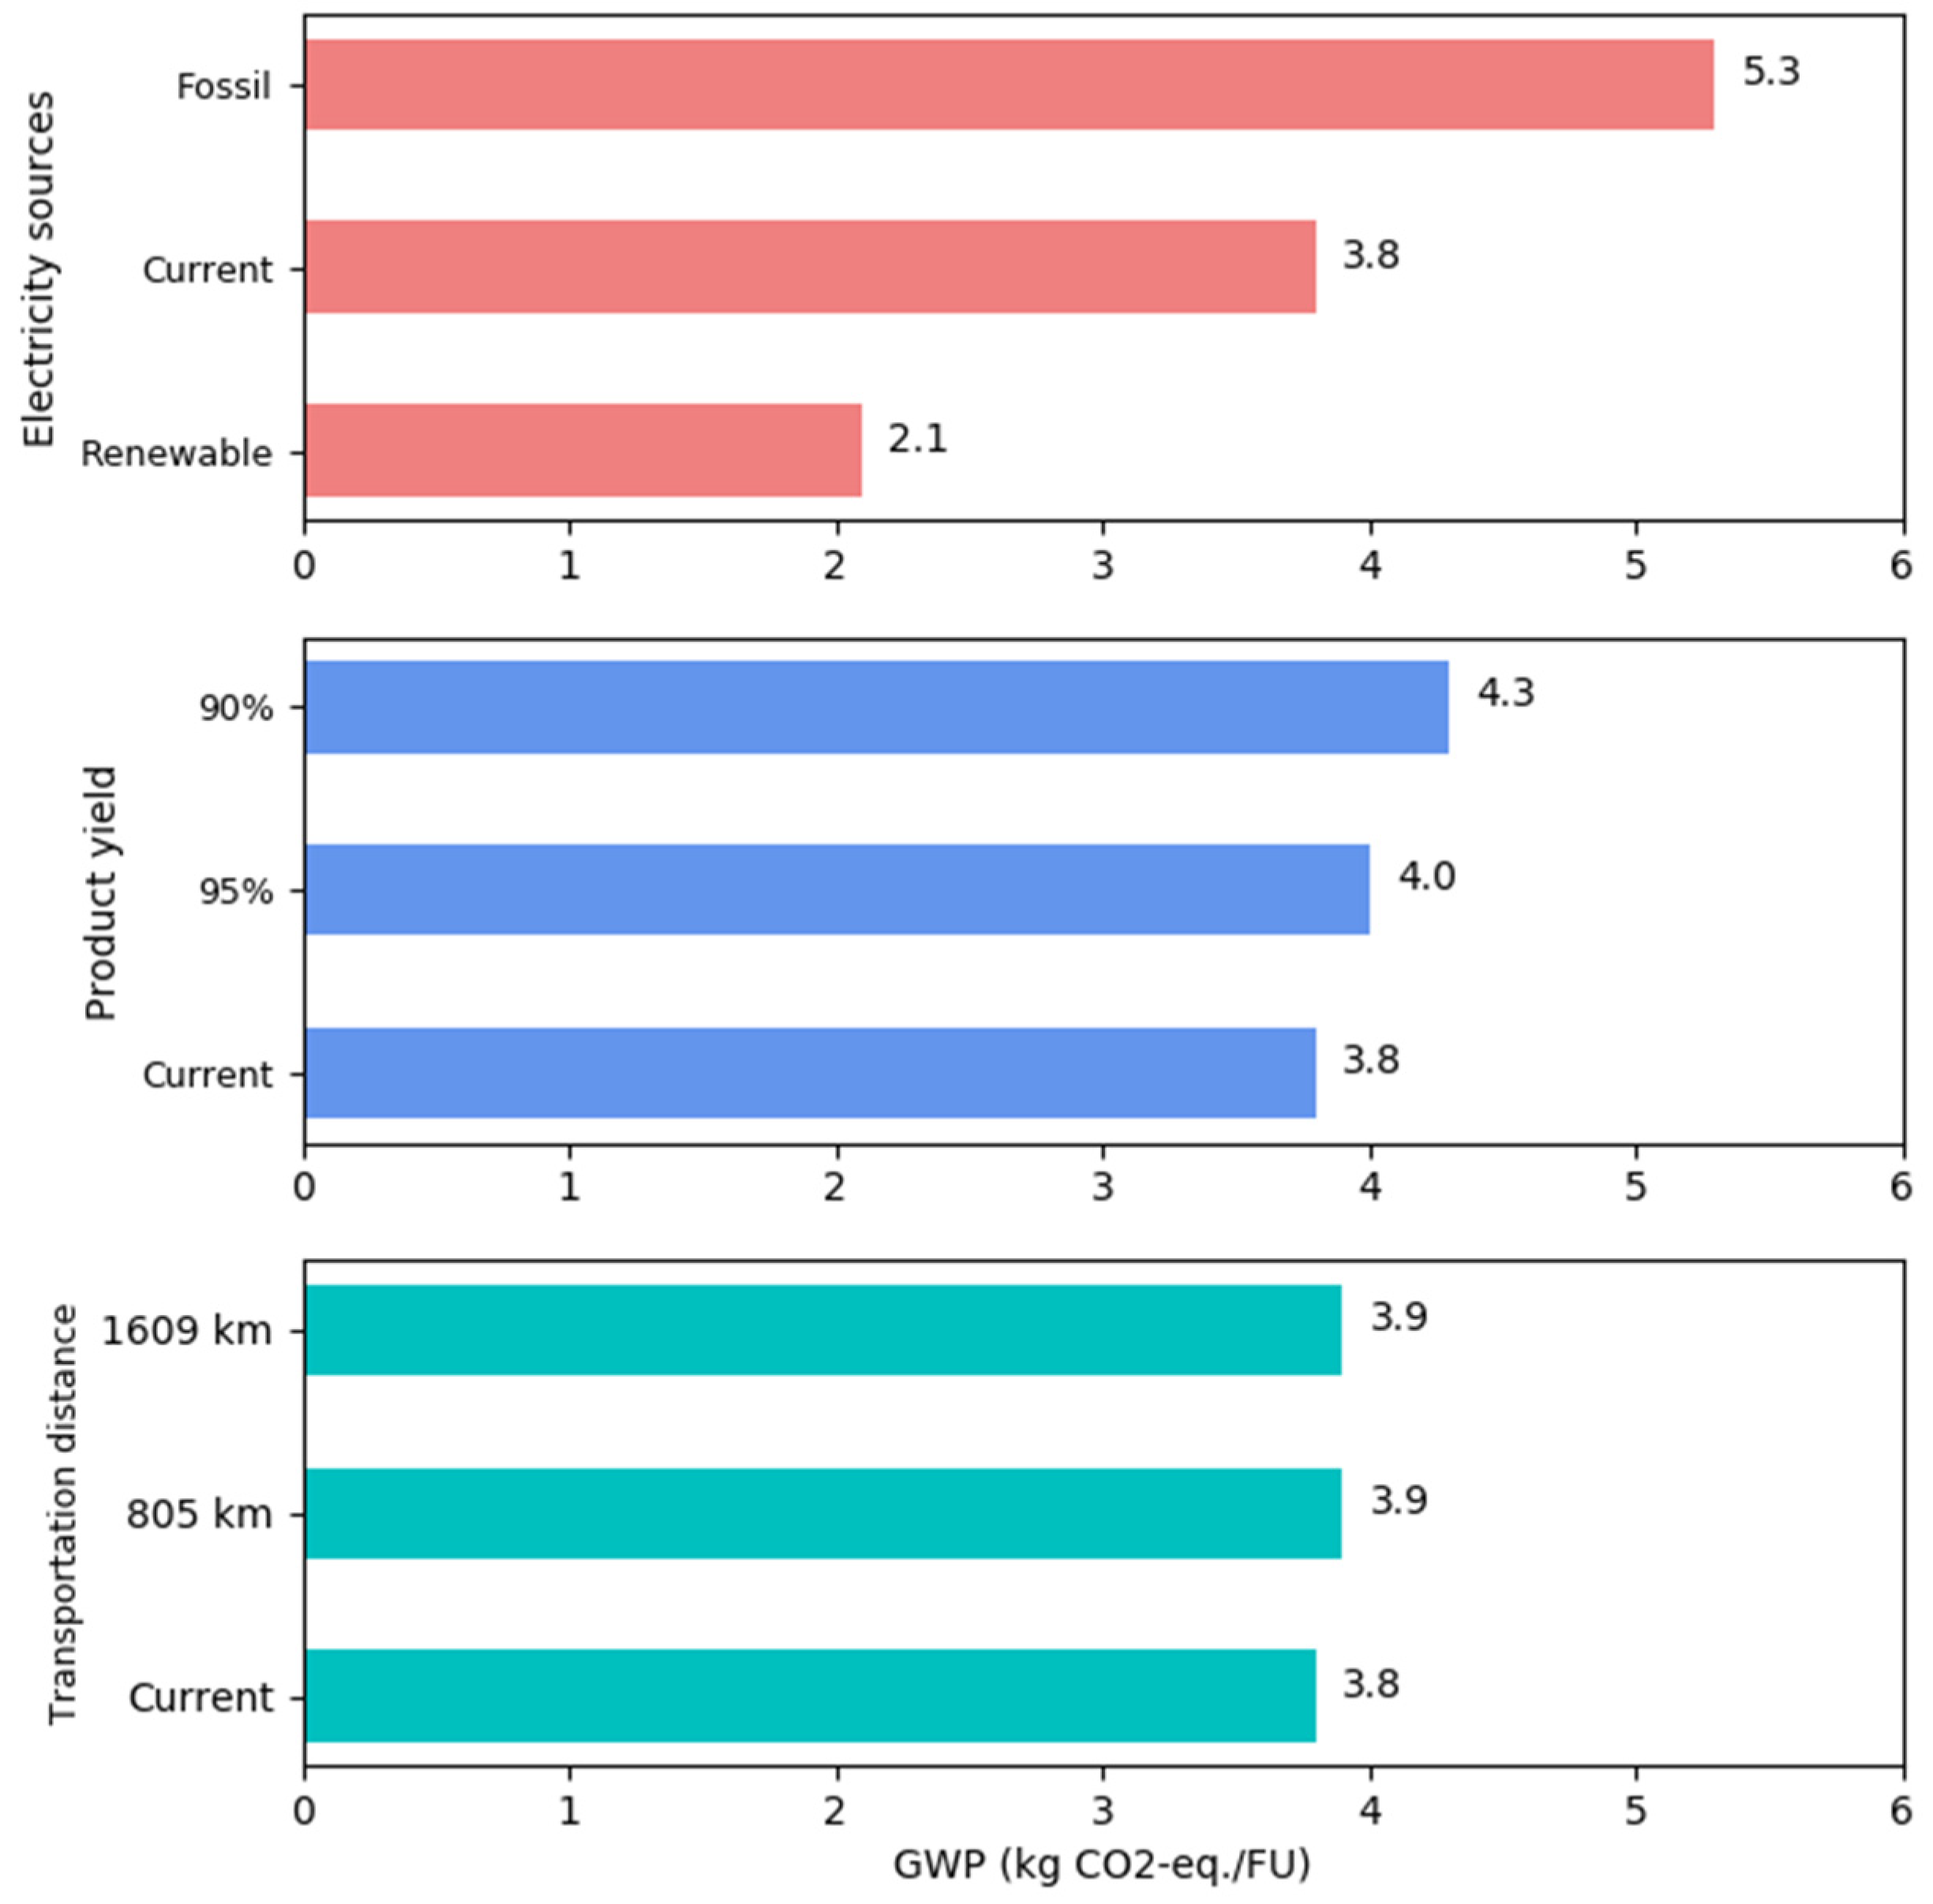
3.1. Life Cycle Assessment (LCA) Results

Life cycle assessment using TRACI impact assessment method results are shown in Table 2. TRACI assessment results imply that in general, bio-glycerol scenario has lower environmental impacts than petro-glycerol scenario across all impact categories. Global warming potential (GWP) impact per kg PSA produced in bio-glycerol scenario was 3.8 kg CO2-eq., ~40% lower than petro-glycerol scenario. The largest contributor to GWP was from the RAFT polymerization process, which accounts for nearly 50%. Even though lower GWP was obtained (1.6 kg CO2-eq. per kg melamine-urea-formaldehyde produced) on other adhesive, the production process of formaldehyde-based adhesive is less complex than the PSA investigated in this study [17]. Compared with other biopolymers, the product in our study actually has lower GWP [48]. Acidification potential (AP) impact per kg PSA produced in both scenarios are similar (1.26 kg H+ moles-eq. in bio-glycerol scenario and 1.34 kg H+ moles-eq. in petro-glycerol scenario), indicating the increasing H+ concentration in bio-glycerol scenario was basically the same as in petro-glycerol scenario. Eutrophication potential (EP) impact per kg PSA produce in bio-glycerol scenario was higher than in petro-glycerol scenario, meaning more N and P are produced in bio-glycerol scenario. As expected, the RAFT polymerization contributes the most to the EP. Kim and Dale had similar findings, in that bio-based polymer offered better environmental performance than petro-based polymer, excluding eutrophication [49]. The largest difference between bio-glycerol scenario and petro-glycerol scenario comes from the ozone depletion potential (ODP) impact. Nearly three-fold more emission was observed in the petro-glycerol scenario than in the bio-glycerol scenario, which implies bio-glycerol pathway is more sustainable than petroleum refinery process. In terms of the impacts to human health, the results show that no difference was observed in cancer air impact between the two scenarios, and a slightly higher smog air impact in the petro-glycerol scenario. These results indicate bio-glycerol based PSA is more beneficial to human beings than petro-glycerol based PSA.
Figure 3 shows the overall environmental impacts of the bio-glycerol scenario and petro-glycerol scenario by EI 99 impact method. In accordance with TRACI results, the petro-glycerol scenario has a higher environmental impact score (3.8 points per kg of PSA produced) than the bio-glycerol scenario (2.2 points per kg of PSA produced) for all three impact categories. Ecosystem quality impact of EI 99 in the bio-glycerol scenario was 0.2 points per kg of PSA produced lower than the petro-glycerol scenario. Ecosystem quality impact include damages caused by acidification, eutrophication, land occupation and ecotoxicity [30]. As indicated by the TRACI results, most of these subcategories (AP and EP) have lower score in the bio-glycerol scenario. Human health impact contains carcinogenic effects, respiratory effects, damage caused by climate change, and damage caused by ozone layer depletion [30]. As with ecosystem quality impact, the direct impact from those subcategories (GWP, ODP, human health, and smog air) are lower in the bio-glycerol scenario, which explains why the human health impact of EI 99 was 0.3 points per kg of PSA produced lower than the petro-glycerol scenario. Resources impact of EI 99 has the largest difference between the bio-glycerol scenario (0.9 points per kg of PSA produced) and the petro-glycerol scenario (2.0 points per kg of PSA produced). The resources impact is composed of damages caused by extraction of minerals and extraction of fossil fuels [30]. The petro-glycerol scenario requires more energy (116 MJ per kg of PSA produced) than the bio-glycerol scenario (85 MJ per kg of PSA produced). In the bio-glycerol scenario, ~40% of the energy was needed in bio-glycerol production or biodiesel plant; in the petro-glycerol scenario, ~55% of the energy was required in glycerol production or petroleum refinery process. The higher consumption in petro-glycerol scenario lead to higher resources impact from the end-point impact assessment perspective. LCA results in our study are consistent with the previous study on environmental performance comparison between bio-based adhesive and petro-based adhesive. McDevitt and Grigsby reported that the throughout the entire life cycle, the overall environmental impact of the petro-based adhesive was ~22% higher than the bio-based adhesive [50].
Sensitivity analysis was conducted on electricity sources, production yield, and transportation distance to determine the most sensitive parameter in terms of global warming potential (GWP) impact of the bio-glycerol scenario throughout the PSA life cycle. As Figure 4 exhibits, electricity source has the largest influence on GWP per kg of PSA produced. In the bio-glycerol scenario, electricity was generated by 58% of fossil fuel, as shown in SI Table S1. By altering to electricity generated by total renewable source, GWP impact could be decreased to 2.1 kg CO2-eq. per kg of PSA produced. However, if electricity was generated by fossil fuel only, this number will jump to 5.3 kg CO2-eq. per kg of PSA produced. With the increasing adhesive market worldwide, total GWP impact will increase by orders of magnitude in this situation, which is obviously not a wise choice in pursuing sustainability. Product yield was also a sensitive parameter to GWP impact. Current bio-glycerol scenario assumes 100% conversion rate in polymerization process based on empirical results; it is possible that the product yield may decrease on a commercial scale. We found that when the product yield decreases to 90%, GWP impact may increase to 4.3 kg CO2-eq. per kg of PSA produced. This reduction was not as great as changing the electricity source, but it also highlights the necessity to maintain product yield. Surprisingly, changes in transportation distance results the least GWP impact differences. In the current bio-glycerol scenario, transportation distance was assumed to be 80.5 km (50 miles), which is basically within the state of Iowa. Increasing transportation distance to 805 km (500 miles) or 1609 km (1000 miles) only increased the GWP impact of 0.1 kg CO2-eq. per kg of PSA produced. Olukoya et al. proved that GHG emissions may have 0% increase when transportation distance increased by 50% from base case [46].

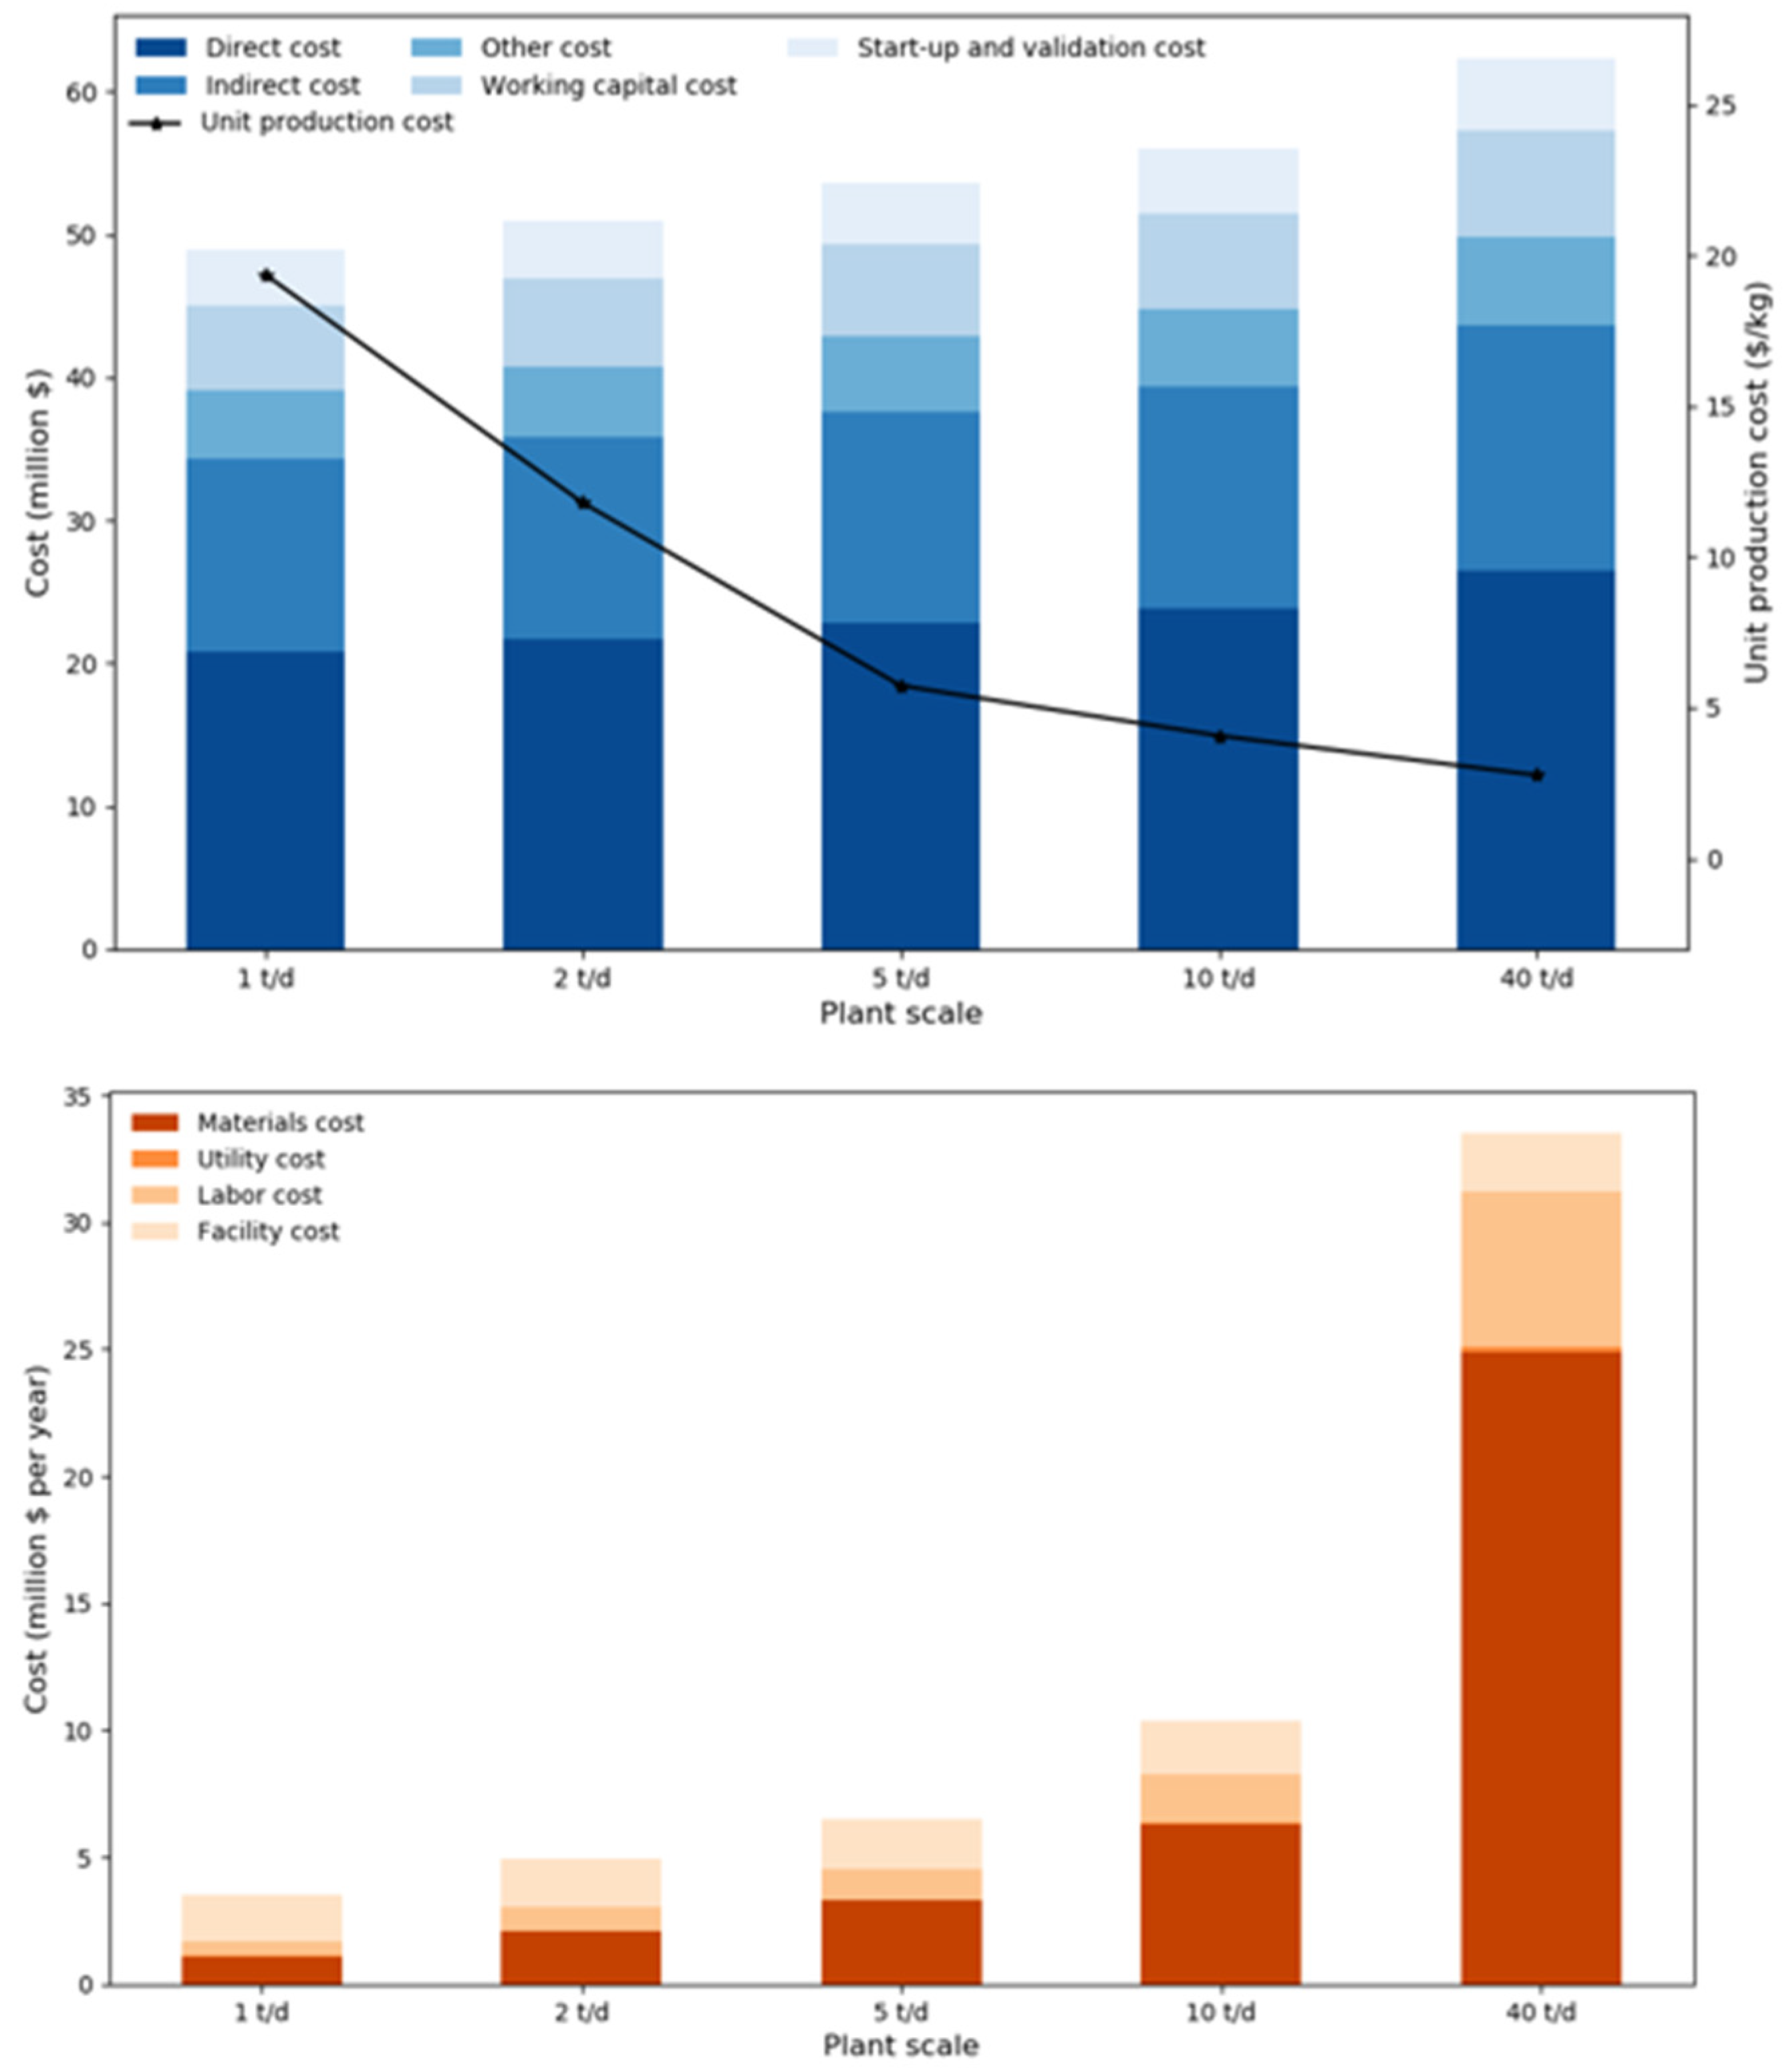
3.2. Techno-Economic Analysis (TEA) Results

Figure 5 displays the breakdown of total capital investment and annual operating cost, along with unit production price obtained in five different bio-glycerol based PSA production plant scale. PSA plant with larger scale requires higher capital investment and higher operating cost as expected (SI Table S4). Total capital investment increases from $49 million of the 1 t/d PSA plant to $63 million of the 40 t/d PSA plant. Among the categories in total capital investment, direct cost was fundamental to other cost calculations. The smallest PSA plant requires ~$5 million in purchasing equipment, and the largest PSA plant needs ~$6 million in equipment. The difference in equipment purchase cost leads to the different total capital investment since other cost parameters are calculated based on factors of equipment purchase cost. Among all the equipment, we found that stirred reactors contributed the most to equipment purchase cost. This was largely because it was required in numerous steps, such as the neutralization process, purification process, polymer production process, and materials storage process. Annual operating cost increases dramatically from the smallest plant ($4 million) to the largest plant ($34 million). Materials cost contributes ~60% of the annual operating cost, which implies the PSA production plant was driven by materials more than any other category. Acrylated glycerol (AG) production process requires the highest materials cost since AG is the monomer in building PSA. Chain transfer agent (CTA) production process and tackifier production process requires less materials cost due to its small amount required in polymerization process. The RAFT polymerization process needs the least materials cost because most materials needed in this process were produced in the plant. Utility cost was quite small compared to materials cost mainly because this PSA production process does not require higher temperature as well as pressure, which are the main sources of utility consumption. Unit production cost ($/kg) of bio-glycerol based PSA plant is also shown in Figure 5. Increasing plant scales result in decreasing unit production price. Unit production cost decreases from $19.37/kg in the smallest plant to $2.76/kg in the 40 t/d PSA production plant. The trend line from the smallest plant to the largest one follows Equation (6) with R2 = 0.95:
Unit   production   cos t = 16.62 × Plant   Scale 0.54
The lowest unit production cost obtained in this study was lower than that in the current marking price. This was because in this study, we only investigated gate-to-gate boundary in economic analysis; the whole TEA study stops when PSA is produced, hence, marketing, advertising and other miscellaneous are not considered. The unit production price calculated here was the merchant price.
Cumulative discounted after-tax cash flow was conducted afterwards on the largest PSA production plant (40 t/d). In this study, the discount rate was set at 10% as the base case scenario. In this scenario, the minimum PSA selling price (MSP) was determined to be $3.48/kg, and the corresponding payback time was 9.2 years. Gross profit of this PSA production plant was ~$22 million per year, and net profit was ~$14 million per year. By decreasing discount rate to 5%, the MSP was $3.15/kg; the payback time reduces to ~4 years, and the NPV at the end of the plant was ~$40 million higher than the base case scenario. However, if discount rate increases to 15%, the payback time may be ~14 years, and the NPV decreases to less than $5 million. The MSP increases to $3.85/kg. Detail results are depicted in SI Figure S1.
Sensitivity analysis was further performed on the 40 t/d PSA production plant in terms of unit production price (Figure 6). Materials cost was the most sensitive factor to the unit production cost among all input variables. This corresponds to the previous discoveries in annual operating cost that materials cost was the driving force of the plant. By decomposing materials cost, we found that glycerol price, acrylic acid price, 3-chloro-2-butanone price, and catalyst price were among the top most sensitive factors. Glycerol price varied within ±10% in this sensitivity analysis in order to be consistent with other raw materials; however, glycerol obtained in the petroleum refinery plant can be as low as $0.2/kg [35]; thus, the unit production price in this situation may be $2.11/kg. Even though obtaining glycerol from petroleum plant has more economic advantage, its associated environmental impact may increase ~35% compared to bio-glycerol source [27]. Total capital investment was the second parameter that had the largest influence on the unit production cost. Due to the contingency of the TEA project, the unit production cost may vary between $2.64/kg to $2.97/kg. Labor cost was another sensitive factor in this study, which suggests that the unit production price may increase to $2.82/kg if we consider administrative cost, supervisory cost and other labor costs. However, all the sensitive parameters found in this study belongs to non-operating parameters. It is recommended to include operating parameters in the future analysis to explore how operating condition changes may impact the economics. In addition, since PSA can also be prepared from other polymerization process such as photoiniferter polymerization, which has the ability to maintain the radical at a low concentration and ambient temperature [51], future TEA and LCA research could also focused on exploring the most sustainable polymerization process in PSA production.

4. Conclusions

In this study, the environmental impacts associated with pressure sensitive bio-adhesive (PSA) derived from the reversible addition-fragmentation chain transfer polymerization (RAFT) process was thoroughly investigated, as well as its economic feasibility with various PSA production plant scales. The results showed that by producing 1 kg of PSA, the global warming potential was estimated to be 3.84 kg CO2-eq. Compared with petro-glycerol, PSA produced from bio-glycerol has less environmental impact (40% lower). The lowest unit production price obtained in this study was $2.76/kg for a 40 t/d PSA production plant. Sensitivity analyses results suggested that electricity sources have large impacts on greenhouse gas emissions, while raw material cost was the most sensitive parameter with respect to product unit cost. In addition, based on cash flow analysis, it was found that this project should be pursued due to its positive internal rate of return. Given the uncertainty associated with the modeling parameters, however, we recommend that future analyses should be conducted to compare both environmental and economic performance of this PSA with that from other sources. This work has been conducted to help guide commercial deployment. Additional research into the RAFT process should be pursued, however, (i.e., beyond the scope of this study), including examination of potential byproducts, various methods for their reuse or repurposing, and then understanding how these additional processes might impact the LCA and TEA results from this study.

Supplementary Materials

The following are available online at https://www.mdpi.com/1996-1073/12/23/4502/s1. Table S1. Electricity sources in Iowa, 2016 (adapted from [26]). Table S2. Assumptions of total capital investment (CTCI) in the pressure sensitive bio-adhesive production plant. Table S3. Assumptions of annual operating cost (CAOC) in the pressure sensitive bio-adhesive production plant. Table S4. Techno-economic analysis results of bio-glycerol based PSA plant with five different plant scales. Figure S1. Discounted cash flow results for the 40 t/d PSA production plant at different discount rates. NPV: net present value. Moreover, the supplementary materials have used various references from the main paper, but references [52,53] were specifically cited in the supplementary materials alone.

Author Contributions

M.Y. conducted the modeling and wrote the original manuscript. K.A.R. directed the research and edited the manuscript.

Funding

This study was funded by the National Institute of Food and Agriculture of the United States Department of Agricultural, under the project number 214-38202-22318.

Conflicts of Interest

The authors declare no conflict of interest.

References

  1. Nitzsche, R.; Budzinski, M.; Gröngröft, A. Techno-Economic Assessment of a Wood-Based Biorefinery Concept for the Production of Polymer-Grade Ethylene, Organosolv Lignin and Fuel. Bioresour. Technol. 2016, 200, 928–939. [Google Scholar] [CrossRef] [PubMed]
  2. U.S. EPA. Global Greenhouse Gas Emissions Data | Greenhouse Gas (GHG) Emissions | US EPA. Available online: https://www.epa.gov/ghgemissions/global-greenhouse-gas-emissions-data (accessed on 19 November 2019).
  3. Matar, S.; Hatch, L.F. Chemistry of Petrochemical Processes, 2nd ed.; Gulf Professional Publishing: London, UK, 2001. [Google Scholar] [CrossRef]
  4. Markets, R.; Global Adhesives Market. 2017–2022—$53.5 Billion Opportunity Analysis and Industry Forecasts. Available online: https://www.globenewswire.com/news-release/2017/10/17/1148538/0/en/Global-Adhesives-Market-2017-2022-53-5-Billion-Opportunity-Analysis-and-Industry-Forecasts.html (accessed on 19 November 2019).
  5. Doyle, J.S.; O’Quinn, R.C. Adhesives Types, Mechanics and Applications; Nova Science Publishers: New York, NY, USA, 2011. [Google Scholar]
  6. Mohammed, I.K.; Charalambides, M.N.; Kinloch, A.J. Modelling the Interfacial Peeling of Pressure-Sensitive Adhesives. J. Nonnewton. Fluid Mech. 2015, 222, 141–150. [Google Scholar] [CrossRef]
  7. Reuters. Pressure Sensitive Adhesives Market Size, Share, Report, Analysis, Trends. Available online: https://www.reuters.com/brandfeatures/venture-capital/article?id=13015 (accessed on 19 November 2019).
  8. Moad, G.; Rizzardo, E.; Thang, S.H. Radical Addition-Fragmentation Chemistry in Polymer Synthesis. Polymer 2008, 49, 1079–1131. [Google Scholar] [CrossRef]
  9. Lowe, A.B.; McCormick, C.L. Reversible Addition-Fragmentation Chain Transfer (RAFT) Radical Polymerization and the Synthesis of Water-Soluble (Co) Polymers under Homogeneous Conditions in Organic and Aqueous Media. Prog. Polym. Sci. 2007, 32, 283–351. [Google Scholar] [CrossRef]
  10. Chakraborty, S.; Jähnichen, K.; Komber, H.; Basfar, A.A.; Voit, B. Synthesis of Magnetic Polystyrene Nanoparticles Using Amphiphilic Ionic Liquid Stabilized RAFT Mediated Miniemulsion Polymerization. Macromolecules 2014, 47, 4186–4198. [Google Scholar] [CrossRef]
  11. Boyer, C.; Bulmus, V.; Davis, T.P.; Ladmiral, V.; Liu, J.; Perrier, S. Bioapplications of RAFT Polymerization. Chem. Rev. 2009, 109, 5402–5436. [Google Scholar] [CrossRef]
  12. Cochran, E.W.; Williams, R.C.; Hernandez, N.; Cascione, A. Thermoplastic Elastomers via Atom Transfer Radical Polymerization of Plant Oil. US Patent US20180237571A1, 2013. [Google Scholar]
  13. Gallagher, J.J.; Hillmyer, M.A.; Reineke, T.M. Acrylic Triblock Copolymers Incorporating Isosorbide for Pressure Sensitive Adhesives. ACS Sustain. Chem. Eng. 2016, 4, 3379–3387. [Google Scholar] [CrossRef]
  14. Forrester, M.J. Glycerol-Based Polymers and Their Pathway to Industrial Relevance. Ph.D. Dissertation, Iowa State University, Ames, IA, USA, 2018. [Google Scholar]
  15. Guinée, J.B.; Heijungs, R.; Huppes, G.; Zamagni, A.; Masoni, P.; Buonamici, R.; Ekvall, T.; Rydberg, T. Life Cycle Assessment: Past, Present, and Future. Environ. Sci. Technol. 2011, 45, 90–96. [Google Scholar] [CrossRef]
  16. Guinée, J.B.; Heijungs, R.; Huppes, G.; Kleijn, R.; de Koning, A.; van Oers, L.; Wegener Sleeswijk, A.; Suh, S.; Udo de Haes, H.A.; de Bruijn, H.; et al. Life Cycle Assessment: An Operational Guide to the ISO Standards, Final Report; Leiden University: Leiden, The Netherlands, 2001. [Google Scholar] [CrossRef]
  17. Silva, D.A.L.; Lahr, F.A.R.; Varanda, L.D.; Christoforo, A.L.; Ometto, A.R. Environmental Performance Assessment of the Melamine-Urea-Formaldehyde (MUF) Resin Manufacture: A Case Study in Brazil. J. Clean. Prod. 2015, 96, 299–307. [Google Scholar] [CrossRef]
  18. Kim, S. Environment-Friendly Adhesives for Surface Bonding of Wood-Based Flooring Using Natural Tannin to Reduce Formaldehyde and TVOC Emission. Bioresour. Technol. 2009, 100, 744–748. [Google Scholar] [CrossRef]
  19. Wilson, J.B. Life-Cycle Inventory of Particleboard in Terms of Resources, Emissions, Energy and Carbon. Wood Fiber Sci. 2010, 42, 90–106. [Google Scholar]
  20. Chau, J.; Sowlati, T.; Sokhansanj, S.; Preto, F.; Melin, S.; Bi, X. Techno-Economic Analysis of Wood Biomass Boilers for the Greenhouse Industry. Appl. Energy 2009, 86, 364–371. [Google Scholar] [CrossRef]
  21. Ou, L.; Li, B.; Dang, Q.; Jones, S.; Brown, R.; Wright, M.M. Understanding Uncertainties in the Economic Feasibility of Transportation Fuel Production Using Biomass Gasification and Mixed Alcohol Synthesis. Energy Technol. 2016, 4, 441–448. [Google Scholar] [CrossRef]
  22. Xu, F.; Sun, J.; Konda, N.V.S.N.M.; Shi, J.; Dutta, T.; Scown, C.D.; Simmons, B.A.; Singh, S. Transforming Biomass Conversion with Ionic Liquids: Process Intensification and the Development of a High-Gravity, One-Pot Process for the Production of Cellulosic Ethanol. Energy Environ. Sci. 2016, 9, 1042–1049. [Google Scholar] [CrossRef]
  23. Shen, R.; Tao, L.; Yang, B. Techno-economic Analysis of Jet-fuel Production from Biorefinery Waste Lignin. Biofuels, Bioprod. Biorefining 2019, 13, 486–501. [Google Scholar] [CrossRef]
  24. Yang, M.; Rosentrater, K.A. Techno-Economic Analysis (TEA) of Low-Moisture Anhydrous Ammonia (LMAA) Pretreatment Method for Corn Stover. Ind. Crops Prod. 2015, 76, 55–61. [Google Scholar] [CrossRef]
  25. Yang, M.; Rosentrater, K.A. Techno-Economic Analysis of the Production Process of Structural Bio-Adhesive Derived from Glycerol. J. Clean. Prod. 2019, 228, 388–398. [Google Scholar] [CrossRef]
  26. U.S. Energy Information Administration. Electric Power Monthly with Data for June 2018; EIA: Washington, DC, USA, 2018.
  27. Sheehan, J.; Camobreco, V.; Duffield, J.; Graboski, M.; Shapouri, H. Life Cycle Inventory of Biodiesel and Petroleum Diesel for Use in an Urban Bus; National Renewable Energy Lab.(NREL): Washington, DC, USA, 1998. [Google Scholar]
  28. Bare, J.C.; Hofstetter, P.; Pennington, D.W.; de Haes, H.A.U. Midpoints versus Endpoints: The Sacrifices and Benefits. Int. J. Life Cycle Assess. 2000, 5, 319–326. [Google Scholar] [CrossRef]
  29. Bare, J. Tool for the Reduction and Assessment of Chemical and O Ther Environmental Impacts (TRACI), TRACI Version 2.1, User’s Guide; TRACI-EPA: Cincinnati, OH, USA, 2012. [Google Scholar]
  30. Dreyer, L.C.; Niemann, A.L.; Hauschild, M.Z. Comparison of Three Different LCIA Methods: EDIP97, CML2001 and Eco-Indicator 99. Int. J. Life Cycle Assess. 2003, 8, 191–200. [Google Scholar] [CrossRef]
  31. Phoenix Equipment Corporation. Formaldehyde Resins Plant—15,000 TPY. Available online: https://www.phxequip.com/plant.104/formaldehyde-resin-plant-15-000-tpy.aspx (accessed on 6 September 2018).
  32. Peters, M.S.; Timmerhaus, K.D.; West, R.E. Plant Design and Economics for Chemical Engineers, 5th ed.; McGraw-Hill Education: New York, NY, USA, 2013. [Google Scholar]
  33. Ulrich, G.D. A Guide to Chemical Engineering Process Design and Economics; John Wiley & Sons: New York, NY, USA, 1984. [Google Scholar]
  34. Humphreys, K.K. Project and Cost Engineers’ Handbook, 4th ed.; Humphreys, K.K., Ed.; CRC Press: New York, NY, USA, 2004. [Google Scholar]
  35. Landress, L. ICIS Pricing, Glycerine (US Gulf). Available online: https://www.icis.com/globalassets/global/icis/pdfs/sample-reports/chemicals-glycerine.pdf (accessed on 9 April 2019).
  36. Ronald, H. Electric Power Monthly with Data for September 2017; US EIA: Washington, DC, USA, 2017.
  37. IRS. Publication 946: How to Depreciate Property. 2018. Available online: https://www.irs.gov/publications/p946 (accessed on 19 November 2019).
  38. Turton, R.; Baille, R.C.; Whiting, W.B.; Shaeiwitz, J.A. Analysis, Synthesis, and Design of Chemical Processes, 3rd ed.; Prentice Hall: Upper Saddle River, NJ, USA, 2009. [Google Scholar]
  39. Hayes, A. Gross Profit Definition. Available online: https://www.investopedia.com/terms/g/grossprofit.asp (accessed on 10 April 2019).
  40. Kenton, W. Net Present Value (NPV). Available online: https://www.investopedia.com/terms/n/npv.asp (accessed on 10 April 2019).
  41. Humbird, D.; Davis, R.; Tao, L.; Kinchin, C.; Hsu, D.; Aden, A. Process Design and Economics for Biochemical Conversion of Lignocellulosic Biomass to Ethanol; National Renewable Energy Laboratory: Golden, CO, USA, 2011. [Google Scholar]
  42. Swanson, R.M.; Platon, A.; Satrio, J.A.; Brown, R.C. Techno-Economic Analysis of Biomass-to-Liquids Production Based on Gasification. Fuel 2010, 89 (Suppl. 1), S11–S19. [Google Scholar] [CrossRef]
  43. Li, Q.; Zhang, Y.; Hu, G. Techno-Economic Analysis of Advanced Biofuel Production Based on Bio-Oil Gasification. Bioresour. Technol. 2015, 191, 88–96. [Google Scholar] [CrossRef] [PubMed]
  44. SmartAsset. Free Income Tax Calculator. Available online: https://smartasset.com/taxes/income-taxes (accessed on 10 April 2019).
  45. Saltelli, A.; Ratto, M.; Andres, T.; Campolongo, F.; Cariboni, J.; Gatelli, D.; Saisana, M.; Tarantola, S. Global Sensitivity Analysis; John Wiley & Sons: Hoboken, NY, USA, 2008. [Google Scholar]
  46. Olukoya, I.A.; Bellmer, D.; Whiteley, J.R.; Aichele, C.P. Evaluation of the Environmental Impacts of Ethanol Production from Sweet Sorghum. Energy Sustain. Dev. 2015, 24, 1–8. [Google Scholar] [CrossRef]
  47. Dysert, L.R.; Christesen, P. AACE International Recommended Practice No. 18R-97, Cost Estimate Classification System—As Applied in Engineering, Procurement, and Construction for the Process Industries; Inc.: New York, NY, USA, 2016. [Google Scholar]
  48. Wernet, G.; Conradt, S.; Isenring, H.P.; Jiménez-González, C.; Hungerbühler, K. Life Cycle Assessment of Fine Chemical Production: A Case Study of Pharmaceutical Synthesis. Int. J. Life Cycle Assess. 2010, 15, 294–303. [Google Scholar] [CrossRef]
  49. Kim, S.; Dale, B.E. Life Cycle Assessment Study of Biopolymers (Polyhydroxyalkanoates) Derived from No-Tilled Corn. Int. J. Life Cycle Assess. 2005, 10, 200–210. [Google Scholar] [CrossRef]
  50. McDevitt, J.E.; Grigsby, W.J. Life Cycle Assessment of Bio- and Petro-Chemical Adhesives Used in Fiberboard Production. J. Polym. Environ. 2014, 22, 537–544. [Google Scholar] [CrossRef]
  51. Arrington, K.J.; Radzinski, S.C.; Drummey, K.J.; Long, T.E.; Matson, J.B. Reversibly Cross-Linkable Bottlebrush Polymers as Pressure-Sensitive Adhesives. ACS Appl. Mater. Interfaces 2018, 10, 26662–26668. [Google Scholar] [CrossRef] [PubMed]
  52. Heinzle, E.; Biwer, A.P.; Cooney, C.L. Development of Sustaiable Bioprocesses: Modelling and Assessment; John Wiley & Sons: Chichester, UK, 2006. [Google Scholar]
  53. Molbase. Chemical B2B E-commerce Platform. Available online: http://www.molbase.com/ (accessed on 9 April 2019).
Figure 1. System boundary used in life cycle assessment. Two glycerol sources are considered in the environmental impact assessment: bio-glycerol scenario and petro-glycerol scenario. Acrylated glycerol production happens at 100 °C and 1 atm; catalyst 1 include amberlyst 15 and phenothiazine (PTA). Chain transfer agent (CTA) production process is shown in green blocks; CTA is produced at room temperature and 1 atm. Poly-acrylated glycerol happens 70 °C and 1 atm. Tackifier production process is shown in yellow blocks, and it is produced at 80 °C and 1 atm. Pressure sensitive bio-adhesive (PSA) is produced at room temperature and 1 atm.
Energies 12 04502 g001
Figure 2. Design block flow diagram of PSA production plant. Catalyst 1 included amberlyst 15 and phenothiazine (PTA). Acrylated glycerol (AG) production process is highlighted in blue block. Chain transfer agent (CTA) production process is highlighted in green block. The tackifier production process is highlighted in yellow block.
Energies 12 04502 g002
Figure 3. Eco-Indicator 99 (EI 99) results of bio-glycerol scenario and petro-glycerol scenario. FU stands for functional unit. In this study, 1 kg of PSA produced was chosen as the FU.
Energies 12 04502 g003
Figure 4. Sensitivity analysis results on electricity source, product yield and transportation distance. GWP stands for global warming potential. FU stands for functional unit. In this study, 1 kg of PSA produced was used as the FU. Current refers to bio-glycerol scenario as defined in Materials.
Energies 12 04502 g004
Figure 5. Techno-economic analysis results of bio-glycerol based PSA plant with five different plant scales.
Energies 12 04502 g005
Figure 6. Sensitivity analysis of the 40 t/d PSA production plant.
Energies 12 04502 g006
Table 1. Main inventory data of pressure sensitive bio-adhesive (PSA) production process.
ParameterUnitDataGHG Emission Factor
Input
Glycerolkg0.631.28 kg CO2-eq/kg
Acrylic acidkg0.491.37 kg CO2-eq/kg
Acetonekg0.101.61 kg CO2-eq/kg
Ethanethiolkg0.132.35 kg CO2-eq/kg
Carbon disulfidekg0.311.47 kg CO2-eq/kg
3-Chloro-2-butanonekg0.430.97 kg CO2-eq/kg
Potassium hydroxidekg0.131.68 kg CO2-eq/kg
AIBNkg2.46 × 10−54.79 kg CO2-eq/kg
Succinic hydridekg0.020.45 kg CO2-eq/kg
Isosorbidekg0.013.01 kg CO2-eq/kg
Transportation distancekm80.53.20 × 10−5 kg CO2-eq/(kg × km)
Output
PSAkg1
Potassium chloridekg0.286
Table 2. Life cycle assessment results of bio-glycerol scenario and petro-glycerol scenario.
Impact CategoryBio-Glycerol ScenarioPetro-Glycerol Scenario
TRACI global warming (kg CO2-eq./FUa)3.86.1
TRACI acidification (kg H+ moles-eq./FU)1.31.3
TRACI eutrophication (kg N-eq./FU)1.4 × 10−31.1 × 10−3
TRACI ozone depletion (kg CFC 11-eq./FU)2.0 × 10−118.9 × 10⁻¹¹
TRACI smog air (kg O3-eq./FU)0.20.3
TRACI human health particulate air (kg PM 2.5-eq./FU)1.2 × 10−31.4 × 10−3
TRACI human health, cancer air (CTUb/FU)1.1 × 10−91.1 × 10−9
FUa: functional unit (1 kg of PSA produced as defined in Materials). CTUb: comparative toxicity unit.

