Article

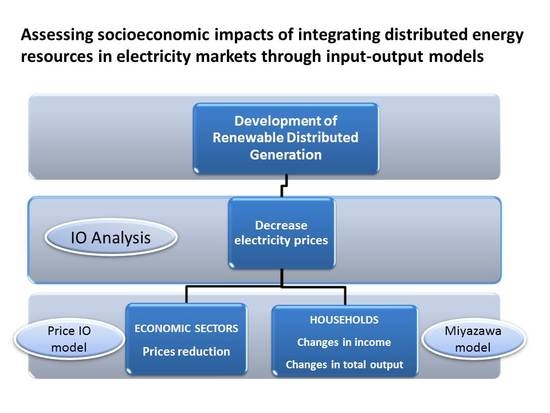
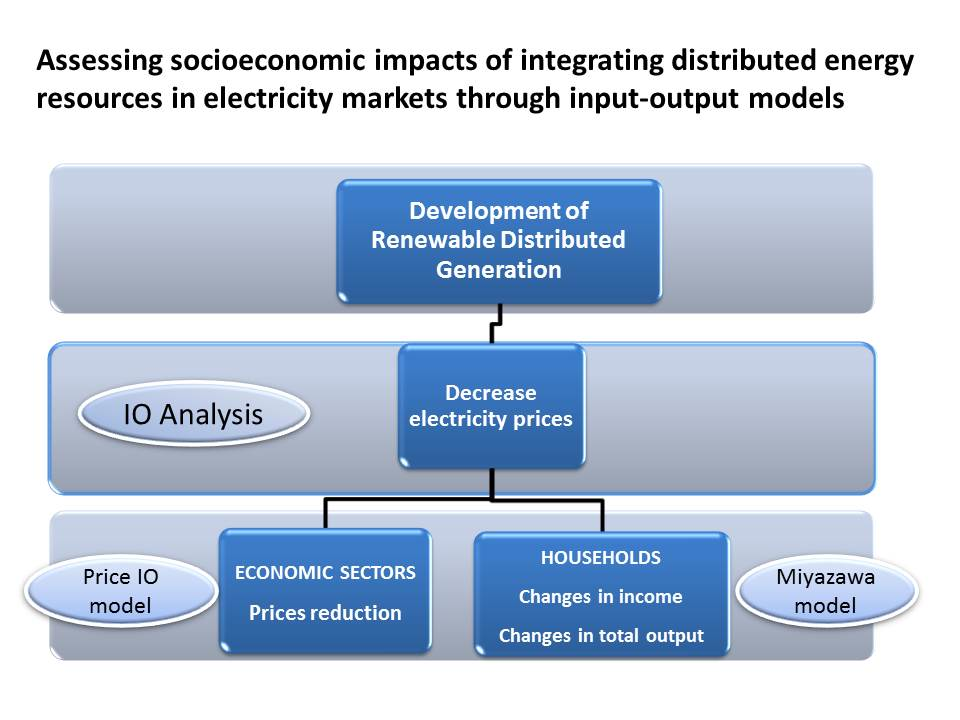
Assessing Socioeconomic Impacts of Integrating Distributed Energy Resources in Electricity Markets through Input-Output Models

by
Carmen Ramos Carvajal
*,
Ana Salomé García-Muñiz
and
Blanca Moreno Cuartas
Regional Economics Laboratory (RegioLab), Faculty of Economics and Business, Department of Applied Economic, University of Oviedo, Campus del Cristo s/n, 33006 Oviedo, Spain
*
Author to whom correspondence should be addressed.
Energies 2019, 12(23), 4486; https://doi.org/10.3390/en12234486
Submission received: 29 October 2019 / Revised: 16 November 2019 / Accepted: 18 November 2019 / Published: 25 November 2019
(This article belongs to the Special Issue Economics of Sustainable and Renewable Energy Systems)

Abstract

:
In competitive electricity markets, the growth of electricity generated by renewable sources will reduce the market price of electricity assuming marginal cost pricing. However, small renewable distributed generation (RDG) alone cannot modify the formation of electricity prices. By aggregating small RDG units into a Virtual Power Plants (as a single unit market) they are capable of dealing at the wholesale electricity market analogous to large-scale producer following in changes in wholesale prices. This paper investigates the socioeconomic impacts of different type of RDG technologies on Spanish economic sectors and households. To this end, we applied an input-output price model to detail the activities more sensitive to changes in electricity price due to RDG technologies deployment and the associated modifications in income and total output associated with the households’ consumption variation. Detailed Spanish electricity generation disaggregation of the latest available Spanish Input-Output table, which refers to 2015, was considered. It was found that the integration of RDG units in the electricity market project a better situation for the economy and Spanish households. This paper’s scope and information can be used to benefit decision-making with respect to electricity pricing policies.

Graphical Abstract

1. Introduction

In 2019, the Spanish Government approved the Royal Decree (RD) 244/2019 that regulates the categories of electricity supply and generation with self-consumption. This RD establishes the new conditions for self-consumption of electricity around the possible association of several consumers for a collective self-consumption and simplifies the mechanism for compensation of self-produced and unconsumed energy, mainly for those who install small distributed generation technologies, based on renewable distributed generation (RDG). These measures support the arrival of households and small businesses into the electrical system and can foster a reduction of the price of the electricity bill. However, small RDG is not sufficiently capable of modifying the formation of the electricity prices. By aggregating small RDG units into a Virtual Power Plant (as a single unit market) are capable of dealing at the wholesale electricity market analogous to large-scale producer following in changes in wholesale prices These changes in electricity prices could have an impact on the final consumers in the economy differently. It should be noted that the household energy in total energy consumption is not negligible, with figures of around 30% in some European and American countries [1].
The deployment of electricity generated by renewable sources (RES-E) has a predictable impact on wholesale and retail electricity prices [2]. In competitive electricity markets, the growth in the amount of electricity generated by renewable sources will decrease electricity prices under the marginal cost pricing assumption. In the wholesale electricity market, the offered amount and price for every generated unit is determined by electricity generation companies according to their short-term marginal cost. According to their marginal costs, the ranking capacity from the cheapest to the most expensive, i.e., the “merit order” of plants of different technologies, determined the supply curve in electricity generation markets. This fixes the wholesale electricity price. Therefore, the formation of the price of electricity is marked by the meeting point between the supply curve and the demand curve, and hence fixed by the last source of production that comes into operation. Thus, the lower prices of electricity generated by renewable resources (RES-E) produce a shift to the right in the supply curve, resulting in a decreased price.
Changes in the regulatory framework have favored a large penetration of renewables. According to data from Red Eléctrica de España [3], renewable energy increased its share to 38.4% in the overall annual electricity generation in 2018, compared to 26.4% in 2009 in Spain. In this context, renewable energies are a source of economic growth and industrial competitiveness as factor related with the decline of wholesale energy prices in recent years. The relationship between renewable energy and economic sustainability has been widely discussed [4]. RES-E drives sustainability of energy, economy, environment and society.
This paper investigates the socioeconomic impacts of RDG technologies on Spanish economic sectors and households through the changes that their deployment produces on electricity prices through an input-output (IO) price model. Input-output analysis is widely applied to the macroeconomic study of direct, indirect and induced effects of renewable sources. The existing IO literature on assessing economic-energy-environment policies mainly concentrates on its effectiveness in terms of value of lost load, output, employment and emissions (see a review of input-output multi-objective models in an energy framework in [5]).
However, the studies that connect changes in prices with variations in the demand are scarce [6]. The use of IO price models for assessment energy policies has attracted the attention of the international scientific community [7,8]. The literature highlights that energy prices impact on industrial and energy structures [9] and emphasizes the relevance of studying their connections.
Thus, there has been increased interest in the application of IO price models in response to strikes, trade barriers and/or other sources of resource shortage. Reference [10] discussed the literature on the application of the input-output model to analyze economic impacts of shortages. The utility for decision-makers has brought IO price models on economic impacts of energy subsidy reforms. Reference [11] revealed how subsidies spoil the price mechanism and have noteworthy effects on energy-intensive industry. Reference [12] pointed out as a benefit of the removal of energy subsidies, the reduction in total energy consumption and GHG emissions, among others. More generally, the input-output price model has been employed to assess the augmentation energy price impact on price variations of sectors such as agriculture [13] transportation [14] or wide economic sectors [15].
Some extensions are applied in the context of environment and/or energy as [15,16]. Reference [16] evaluated the price changes related to new water policy scenarios in Spain. Reference [15] studied the effects of price changes of oil and other fossil fuels on the demand for tourism services. As shown in the literature, there have been few empirical studies on the socio-economic effects of the spread of RDG technologies, considering the interaction of different types of renewables in detail.
Usually, the aggregation degree considering RES-E is quite large. As far as Spain is concerned, there is a paucity of studies on the disaggregation of the electricity sector according to different technologies ([17,18,19], among others).
The main objective of this paper is to detail the activities most sensitive to changes in electricity prices due to renewable generation capacity deployment in Spain and the associated modifications in income and total output associated with the household consumption variations. Specific disaggregation of the Spanish electricity generation of the latest available Spanish Input-Output table, which refers to the table from 2015, is considered. To the best of our knowledge, this is the first study to quantify the effect on electricity price changes in the Spanish economy of a set of RES-E under an extended Input-Output Model in which household consumption is endogenized. This paper aims to fill a gap found in the existing literature with a twofold contribution. First, empirical studies have shown the importance of taking into account the industry-household linkage in the corresponding contexts. This leads to Input-Output models, which account not only for the direct and indirect impacts around goods and services supplied but the induced impacts based on purchases made by employees. This approach seeks to assess the influence of electricity price reduction in the households and their effects on the different economic sectors. Special attention is paid to the electricity sector. The detailed level of disaggregation of electricity sector around different type of RES-E developed in the paper is other of the contributions.
The remainder of the paper is as follows. In Section 2, the used methodology to obtain the impact of RDG is presented. In Section 3, given that the analysis of this paper focuses on RES-E, an electricity generation sector disaggregation of the latest available Spanish Input-Output table is discussed prior to the results. Section 4 presents the price impacts of electricity price changes on each sector and on households. The final section contains the main concluding remarks and discussion lines.

2. Methodology

The Input–Output framework has been used extensively in environmental economics. This section describes the input-output methodology employed in this work. The IO price model is used to delve into the impact of price changes in the electricity supply sector on the price of other sectors. Additionally, an input-output model with endogenous consumption to take into account the linkage between the household sector and the electricity consumption is applied, based on the Miyazawa model [20].

2.1. Price Input-Output Model

Determining how changes in other variables or in economic policy affect prices is an aspect of great relevance, thus, the modeling of these changes is an unquestionable help in making economic decisions. The input-output analysis is a methodology that allows achieving this objective.
The demand-driven input-output model can be represented as follows:
x = Xi + y
where x is the total output, X is the intermediate demand, y is the final demand and i is a vector of ones.
Defining the input coefficient (or technical coefficient) matrix A whose elements are a ij = X ij x j , i.e., direct requirements of commodity i required per unit of commodity j’s production, the model in Equation (1) can be rewritten as:
x = Ax + y
or, alternatively, as:
x = (IA)−1y
where (IA)−1 is the Leontief inverse matrix. The basic assumption of the Leontief model is the input coefficients are fixed.
The supply-driven input-output model can be written in matrix terms as:
x = iX + v
or:
x = x B + v
where x′ is the transpose vector of gross output total, v′ is the transpose vector of value added and B is the allocation coefficient matrix whose elements are b ij = X ij x j and allocate (sales) the current total inputs to each sector. Otherwise, this equation can be written as:
x = v ( I B ) 1
where ( I B ) 1 is the Ghosh inverse. The basic assumption of the Ghosh model is that allocation of output over sectors is fixed.
Considering changes in exogenous variables (y and v) of expressions (3) and (6), a before (0) and after situation (1) can be defined. Henceforth, the demand driven input-output model is represented by the following expressions assuming that input coefficients are fixed:
x0 = (IA)−1y0
x1 = (IA)−1y1
and the supply driven input-output model can be presented as follows assuming that output coefficients are fixed:
x 0 = v 0 ( I B ) 1 x 1 = v 1 ( I B ) 1
When the Ghosh model is interpreted as price model, it is equivalent to the Leontief price model [21]. Therefore, the supply model is to be interpreted as price model instead of a quantity model. In the input-output framework, the cost structure of the production activity of each sector can be considered. Hence, it is possible to study the price impacts based on this. The starting point is the relation between the input coefficients (A) and the output coefficients (B). Considering Equations (2) and (4) and applying matrix notation:
A = X x ^ 1   and   B = x ^ 1 X
then:
A = x ^ B x ^ 1   and   B = x ^ 1 A x ^
Suppose a change in the primary input cost leading to x 1 = v 1 ( I B ) 1 . The percentage change can be expressed as:
ω = v 1 v ^ 0 1
Likewise, the direct requirements of value added is given by a diagonal matrix (V), which would take the following expressions before (V0) and after (V1) a change in costs:
V 0 = v ^ 0 x ^ 0 1   and   V 1 = v ^ 1 x ^ 1 1
As can be seen from expression (4):
i = i X x ^ 1 + i v ^ x ^ 1 = i A + i V
Following [21], it can be interpreted that the price per unit of output of each activity equals the sum of the intermediate inputs costs and value added.
Considering the change in the cost of intermediate inputs will result in a modification of the prices:
p = p A 0 + ω V 0
where p′ is a vector of price ratios for the products. Thus, the solution of the Leontief price model is:
p = ω V 0 ( I A 0 ) 1 = v 1 v ^ 0 1 v ^ 0 x ^ 0 1 ( I A 0 ) 1 = v 1 x ^ 0 1 ( I A 0 ) 1
On the other hand, in relation to Leontief price model, reference [22] pointed out that it is a model whose solution is not production prices but price indices; this is because this model uses prices in two periods.
The Leontief price model analyzes the direct and indirect impact of the unit price change in the value added, import or intermediate input on each sector. If the aim of the study is also delved into the impact of price changes in the electricity supply sector on the price of the rest of sectors the electricity supply activity should be treated as exogenous.
This process means that the considered sector will be extracted from the intermediate demand matrix to become part of new value-added and final demand vectors. That is, initially, we would have [23]:
p 0 = v 0 x ^ 0 1 ( I A 0 ) 1 = V 0 L 0
where p 0 represents the price level at the initial time once the sector considered is exogeneized, v 0 is the added value after the exogenization process (it is the sum of the added value before exogenizing the sector and the sales made by this sector to the rest of the economy, excluding self-consumption), x ^ 0 is the output after the exogenization process and A 0 is the matrix of technical coefficients after the exogenization process.
Once the change in the price of the sector considered occurred, the expression takes the following form:
p 1 = v 1 x ^ 0 1 ( I A 0 ) 1 = V 1 L 0
where p 1 represents the price level at the final time once the sector considered is exogeneized and v 1 the added value after the exogenization process at the final time.
Therefore, the change in the prices of the economy is:
Δ p = ( v 1 v 0 ) x ^ 0 1 ( I A 0 ) 1 = Δ v x ^ 0 1 L 0

2.2. Input-Output Model with Endogenous Consumption

In order to consider the influence of the electricity price reduction in the households and their impacts on the economy, Miyazawa model [20] is used, which uses the following expression:
[ x y H ] = [ A C W 0 ] [ x y H ] + [ f g ]
where x is a vector of gross outputs of production sectors, yH is the total household income by groups, A is a matrix of input coefficients, W is a vector of value added ratios of households classified by income groups, C is a vector of consumption coefficients, f is a vector of final demands other than household consumption and g is the exogenous income of the household sector. Solving the system in (19) yields the model:
[ x y H ] = [ L ( I + CKWL ) LCK KWL K ] [ f g ]
where L is the Leontief inverse matrix (IA)−1, LC is a matrix of production induced by endogenous consumption, WL is a matrix of endogenous income (per unit of income) in each household sector associated with the production, P is the product matrix and WLC, which represents a matrix of expenditures from endogenous income. Furthermore, K = (IWLC) = (IP)−1 is the so-called Miyazawa inter-relational multiplier which measures how direct changes in the income of one group of individuals results in indirect and induced income changes in another (in this work, we will be taking a single income group).
From the latter, the following equation is obtained:
yH = KWLf
x = L (I + CKWL) f
which provides values of income and total output.
The changes (reduction) in electricity prices made possible changes (increase) in the household consumption [24], which will be denoted as C*. Then, after the change, the expression (20) can be rewritten as:
[ L [ ( I + C K WL ] L C K K WL K ]
where K = (IWLC*)1 and the changes in the output and income can be expressed as follows:
y H = K WL f
x = L   [ I + C   K WL ]   f
where y H , x* and f* are income, output and final demand excluding household consumption, after the changes in electricity prices.

3. Disaggregation of the Spanish Electricity Sector

In Spain, there are few studies on the disaggregation of the electricity sector in an input-output table according to different technologies ([17,18,19], among others).
To the best of our knowledge, this is the first study quantifying the effect on electricity price changes in the Spanish economy of a set of RES-E under an extended Input-Output Model in which household consumption is endogenized.
With this aim, the most recent symmetric Spanish Input-Output table published by the Spanish Statistical Institute was used. Initially, the input-output table of 2015 distinguishes 64 NACE (Statistical classification of Economic Activities in the European Community) Revision.2 activities and 64 products from the CPA (Classification Products by Activity) classification 2008. The activity/product 24 is called ‘Electricity, gas, steam and air conditioning supply’ and includes the groups shown in Table 1.
The initial aim of this work is to disaggregate the group 35.1. Electric power generation, transmission and distribution in its activities (production, transmission, distribution and trade of electricity). A separation of 35.2 and 35.3 is not necessary.
These groups will remain aggregated. Details about the disaggregation of intermediate demand and final demand of the 35.1 group are displayed in the following epigraphs.

3.1. Disaggregation of Intermediate Demand

The process is carried out in three stages. In the first phase, the electricity, gas, steam and air conditioning sector is segregated into two separate sub-sectors, Production, transportation and distribution and commercialization of electrical energy (NACE 35.1) and Production and distribution of gas, steam and air conditioning (NACE 35.2, 35.3). To that end, sorted information of Structural Business Statistics: Industrial Sector [26] on NACE-2009 digits) was considered. This statistic provides information, among other, on the value of production and total purchases of goods and services which are used as proxies for disaggregating rows (sales) and columns (purchases), respectively, in the input-output table. The included activities of this statistic contain the following divisions, groups and classes shown in Table 2.
The proportion of value of production and total purchases of goods and services of group 35.1 was deemed in one part, and of groups 35.2 and 35.3 was calculated in the other. The disaggregation can be made supposing that the new activities have the same technologies and links to the other activities proportionally to their output weights. Assuming this analogue distribution, a new table with 65 activities/product is obtained. Thus, the activity 24 has been broken down in 24.1. Electric energy and 24.2. Gas, steam and air conditioning supply. Then, in the second phase, the group 24.1 Electric energy is separated in 24.11 Transmission of electricity, 24.12 Distribution of electricity, 24.13 Trade of electricity and 24.14 Production of electricity. This operation was performed in a very similar way to stage 1. The same proxies (value of production and total purchases of goods and services) and analogous assumptions made under the previous point have been considered. Although it should be noted that to calculate the weight of 24.11 Transmission of electricity the values of 35.15, 35.16, 35.17, 35.18 and 35.19 classes of Structural Business Statistics: Industrial Sector have been considered jointly. The coefficients applied to the input-output table in the first and second stage are presented in Table 3.
To conclude this phase, a bi-proportional adjustment procedure in the intersection cells of sales and purchases between disaggregated activities has had to be established.
In the third stage, according to the interests of the aim of the paper, the Production of electrical energy has been broken down into Production of electrical energy from a Wind Source, Production of Hydroelectric Energy, Photovoltaic, Other renewables and Production of Electric Power from a Conventional Origin.
Special attention is dedicated to Wind Sources and Photovoltaic Energies. Wind and Solar power present a prevalence of the increase in the power sector over all other renewable energies [28]. This transformation is mainly due to their price and levelized the cost of energy (LCOE), which are in line with fossil fuels and nuclear [29,30].
Furthermore, from the technology and bio-physical settings, Solar PV and Wind Energy technologies have been the most widely implemented systems in community renewable energy (CRE) initiatives. This disaggregation cannot be made using the information of Structural Business Statistics, as there is a breakdown different from that used in this work.
In the disaggregation, the used information is based on the Production of electrical energy in physical units (GWh) published by the Red Eléctrica de España (REE). This value is classified in the way it appears in Table 4 in which the required correspondences are additionally established to obtain the precise classification. Moreover, since REE provides data about total electricity, i.e., electricity consumed by households and economic sectors, previously an allocation between both types of consumers is made from the information of Supply, transformation and consumption of electricity statistics of Eurostat [31]. From this statistic, the consumption of electricity in relative terms is 70% for the economic sectors and 30% for the households.
Given that the input-output table is expressed in monetary units, the monetary value of production has been obtained by multiplying the physical units by the corresponding prices, which have been obtained from the Electricity prices for non-household consumers statistic [32] (to make this operation possible, the productive sectors average price including fees and taxes is employed). From this economic valuation, the weighting factors are determined by activity as shown in Table 4.
The sales of sub-sectors to the rest of the economic sectors are distributed according to the productive structure of the Production of Electrical Energy Activity. The sales between sub-sectors was considered to be self-consumption. The disaggregation by purchases has been made under the assumption that the purchases structure of Production of Electrical Energy Activity remains for all sub-sectors and the purchases volume is correlated with the sector production.

3.2. Disaggregation of Final Demand

With the aim of contemplating the household behavior in an energy price fluctuation scenario, the final household consumption was disaggregated into the aforementioned energy sources. In the first phase, the Electricity, gas, steam and air conditioning sector was split into Production, transportation and distribution and commercialization of electrical energy sub-sector and Production and distribution of gas, steam and air conditioning sub-sector. To carry out this step, information of the Household Budget Survey—HBS [33] was employed. This statistic provides information on household expenditure on electricity and gas in relative terms. These proportions are presented in Table 5.
The Household Budget Survey does not provide information concerning steam and water energy consumption; consequently, assumed that it was set out in the gas parcel. In the second phase, the Electric energy group was broken down into Transmission of electricity, Distribution of electricity, Trade of electricity, Wind source, Production of Hydroelectric Energy, Photovoltaic, Other renewables and Production of Electric Power from a Conventional Origin. As for the REE information and EUROSTAT Supply, transformation and consumption of electricity statistics, the disaggregation of the different aforementioned activities could be established. In order to seek household expenditure in physical units in Transmission, Distribution and Trade, the household electricity consumption proportion (about 30 percent of the total aggregate activity) from Supply, transformation and consumption of electricity statistic [31] has been employed.
The valuation in economic terms were carried out on the basis of the information of average electricity prices reported by components. The prices of components were classified in Energy and supply, Network costs and Taxes, fees, levies and charges. For 2015, these prices (electricity prices for household consumers) were 0.1341, 0.0523 and 0.0507 euros/kWh, respectively (the indicated prices correspond to a consumption band between 2500 kWh and 5000 kWh). The weighting factors of consumption estimated under these assumptions are presented in Table 6.
Once the disaggregation of final household consumption was completed, we could disaggregate the total final consumption expenditure. As the final values of both are coincident (16,442.9 million of euros), we assigned the same magnitude. The final demand of Electricity, gas, steam and air conditioning supply was 16,990.1 million euros, i.e., 547.2 million euros over the final consumption expenditure. The final demand disaggregation was done in agreement with the following expression:
FD i = TCE i + TCE i i TCE i ( FD TCE )
where FDi represents the estimated final demand of sub-activitity i, TCEi is total consumption expenditure of sub-activity i, TCE i i TCE i reflects the so-called weighting factors, and FD and TCE represent the final demand and total consumption expenditure of the Electricity, gas, steam and air conditioning supply. The employed weighting factors in the disaggregation of final demand are shown in Table 7.
On the basis of the estimated final demand and the value of intermediate demand, the total output of the sub-activities under consideration will be disaggregated. With regard to the rows, the estimation of disaggregated gross value added is determined by the difference between output total and intermediate supply.

3.3. Disaggregation of Primary Inputs and Total Production

The total output of sub-sectors under consideration is disaggregated on the basis of the estimated final demand and intermediate demand. The gross valued added is determined by the difference between this output and the intermediate supply. One of the items which makes up the gross valued added is the workers’ salary. Their salaries are their main source of income. In order to break down this magnitude, information about Structural Business Statistics: Industrial Sector (concerning personnel costs) was employed.
The percentages of each electrical sub-sector with regard to the total in the mentioned statistic were calculated from IOT2015 and Structural Business Statistics: Industrial Sector [27]. The results are presented in Table 8.
Moreover, disaggregation of the production electrical energy in the sub-activities studies in this work is still needed. On the other hand, it should be noted that the Structural Business Statistics: Industrial Sector does not provide information about the Production of electrical Energy or Nuclear energy as they are subject to the rule of statistical secrecy. However, it can be determined from the difference that the percentage of personnel costs is 0.1443. Both sources in association with the conventional thermal generation are considered as conventional energies and then, the weighting factor is 0.3239. The electrical production of other sources has a weighting factor of 0.0337 and this includes, following our classification, the Photovoltaic and the Other renewables (it was assumed that Electrical Production of other types is made up of renewables sources only). With the aim of estimating the salaries of Photovoltaic, information of employment data is employed referring to 2015 from APPA (Association of Renewable Energy Producers). This organization provides information on employment broken down into different green energy sources (information obtained from www.appa.es/energias-renovables/renovables-y-empleo/ accessed on 11 July 2019). Employment figures are 22.10% and 13.20% of the total in Electrical energy from Wind Source and Photovoltaic, respectively. Therefore, the estimated weighting factor of personnel costs in Photovoltaic is 0.0201, which can be calculated by the following expression:
CRSF = CRSE PEE PEF
where CRSF and CRSE are the Photovoltaic weighting factors of personnel costs of Photovoltaic and Electrical energy from Wind Source, respectively, PEE is the employment percentage of Electrical energy from Wind Source and PEF is the employment percentage of Photovoltaic with respect to the total renewable employment. Therefore, in order to perform the estimation of weighting factors of personnel costs of Photovoltaic, employment was used as a proxy and a relation was assumed between the employment and personnel costs analogue to the Electrical Energy from Wind Source. To conclude, it is fundamental to develop consistent tables by means of a bi-proportional adjustment procedure which will make it possible to achieve coherence in the rows and columns figures. Due to the numerical calculus of this bi-proportional adjustment, an error margin was obtained in the output total and final demand lower than 10−7.

4. Results

This section describes the activities that are more sensitive to changes in electricity price and the associated modifications in income and total output associated with the households’ consumption variations. Different scenarios of changes in the electricity price are presented.

4.1. Scenarios

There is a widespread review of the effect of renewable energies on wholesale electricity prices available in the literature (i.e., [34,35], among others). For the Spanish market [34], transformed the results of other previous studies such as [36,37,38] into homogeneous units (€/MWh per each additional GWh of renewable production) and highlighted a price effect of around −2 €/MWh, without significant variation (the merit order effect ranges from −1.1 to −3.99 €/MWh). Researchers have continued intensively estimating the effect of renewable energies on the wholesale electricity market (merit order effect) in Spain: [39,40], among others. Reference [39], by using artificial intelligence techniques, analyzed and compared the merit order effects of Photovoltaic and Wind Power on spot electricity prices in year 2012 (under the Wind Power received subsidies). The results indicated that final electricity prices are decreased by 9.10 €/MWh and 2.18 €/MWh in the case of Wind power and Photovoltaic Power, respectively. As they pointed out, the penetration degree of Wind Power in the mix does not match with its influence on pool prices. This gap can be correlated with the fact that Wind Power and Photovoltaic Power decrease price levels at different times, the former at night and the latter in the daytime. Thus, Wind Power acts when the price of energy is cheaper and demand is lower, while Photovoltaic Power is generated when demand is higher.
It should be noted that some authors have analyzed the impact of renewable power on Spanish electricity tariffs for domestic consumers under the context of feed-in tariff support for renewables, since feed-in-tariffs are passed on directly to the access charges of final consumers, leading to an increased electricity price. However, the support system was phased out through Royal Decree 9/2013 of 12 July of 2013. The feed-in tariff was exchanged through the current Spanish Royal Decree 413/2014.
In this context, the deployment of renewable generation directly affects electricity final prices through the reduction of the wholesale electricity price. Renewable generation capacity deployment has developed electricity price divergences among spot electricity markets [5].
In order to elaborate different scenarios for electricity price changes in this work, we have used the studies of [40]. Reference [40] analyzed the effect of electricity generated by renewable sources on spot electricity prices from 2008 to 2013. To examine this issue, they estimated the linear regression model with the marginal price in the day-ahead market (€/MWh) as a dependent variable and the renewable generation share as an independent variable. The (significative) estimated effect is −0.5 (R2 = 0.27), meaning that when the renewable generation share increases by 1%, the marginal price will likely decrease by −0.5 €/MWh.
Following [40], a linear regression model has been estimated with the annual spot electricity price (€/MWh) as a dependent variable and the renewable generation share as an independent variable (Table 9 shows the used data for the estimation).
The regression estimation indicates that the variable RES-E is significant at 10% and the estimated effect is −0.36, meaning that when the renewable generation share increases by 1% the marginal price is likely to decrease by −0.36 €/MWh. By using the estimated effect of RES-E on wholesale electricity prices (energy and supply price component of the final prices) and, ceteris paribus, for the rest of electricity price components for domestic and industrial consumers (network costs, taxes, fees, levies and charges), we have elaborated different scenarios according to different levels of RES-E increment in 2015 with respect to 2014 (from 5% to 100%).
The range has been extended up to 100% in order to determine the impact of the highest level of RES-E power production for the Spanish electrical system. The range of variability of these percentages is responding to the expectations expressed on several occasions by different institutions.
According to the recent Global Energy Transformation: A Roadmap to 2050 (GET2050) reported by IRENA, the renewable share in power generation would achieve only 57% and 86% in 2030 and 2050, respectively, with particular emphasis on Solar and Wind deployment [28]. In 2019, Spain has set out plans to adjust renewable electricity generation to 74% in 2030 and entirely by 2050. This new climate plan—National Integrated Energy and Climate Plan 2021–2030 (PNIEC)—is part of the Strategic Energy and Climate Framework, the Draft Bill on Climate Change and Energy Transition and the Just Transition Strategy Renewable. The attractiveness of the renewable energy investment and deployment opportunities is increasing in Spain in line with the Renewable Energy Country Attractiveness Index—RECAI published by Ernst and Young. RECAI ranking is based on five pillars around macro conditions, energy imperative based on security and affordability, policy enablement, project delivery and technology potential. Table 10 shows the electricity price reduction (impact of renewable power on Spanish electricity tariffs for domestic consumers) according to different levels of RES-E increment.

4.2. Exogenizing Electrical Energy from a Wind Source and Photovoltaic Source

Assumed to lead a change in the electricity price of Electrical Energy from a Wind Source and Photovoltaic source, these two activities will be exogenized to study their impact on the economy. Overall, the exogenizing process is to consider these two activities outside the matrix of intermediate relationships. That is, initially, the equations of the model will be (2) and (3), where the matrix A is the size n × n and the vectors of output total and final demand n × 1.
Once Wind and Photovoltaic sources have been exogenized, A will be the size (n − 2) × (n − 2). Those activities will be considered as consumption in columns and will be part of the final demand and in rows, they will be classified as payments made and included in the added value [10,41].
With a view to determining the changes in prices, different theoretical scenarios have been considered. Specifically, we have taken as a starting point the estimations that are shown in Table 9. By applying model (15) on IOT2015, economic variations related with the electricity price change can be determined. Table 11 shows the global price reduction in the economy.
As seen in the table below, a hypothetical decline in the electricity price, owing to the more widespread introduction of Wind energy and Photovoltaic energy, are associated with significant drops in the economy. Reference [42] reviewed the literature on the influence of energy price in the industrial framework.
As seen above, a hypothetical decline in the electricity price owing to the more widespread introduction of Wind energy and Photovoltaics is associated with significative drops in the economy. Reference [42] made a review of the literature on the influence of energy prices in the industrial framework.
In [43], the negative impact of the energy price increment on industrial competitiveness is underlined and, therefore, the reduction of its benefit. In this respect, the paper of [44] analyzes the electricity charges (and energy use in general) of energy intensive sectors and their relation with competitiveness.
The economic sectors most affected by this price reduction, i.e., those above the upper third quartile, are shown in Table 12. In addition to the electricity activities, most of the sectors are industrial and only one of those belongs to the service sector (motion picture, video and television program production services, sound recording and music publishing; programming and broadcasting services).
With regard to the industrial sectors, they are among the highest electricity consumers to carry out their production (Energy Consumption Survey, [45]). The same occurs with the service sector stated above, which requires a high electricity consumption for its performance.

4.3. The Impact of Electricity Price Reduction on Households

Households, as electricity energy consumers, are also affected by price changes. In detail, and according to Final Energy Balances (1990–2017) of the Institute for the Energy Diversification and Saving (IDAE), households require around 19% of total electricity and, additionally, 35% of energy consumption in the residential sector is electricity. To quantify these modifications in the electricity consumption for residential purposes, we can use the price elasticity. Different authors have made estimations of price elasticity of household electricity demand. Some of these results for the Spanish case are presented in Table 13.
Since the results are mixed, with most about 0.25, we considered this price elasticity value for providing estimates of changes in electricity consumed. From the decline in prices estimated in Table 11 and the assumed price elasticity, the increase of the households’ final consumption and the consequent changes in income and output of the economy were determined. Applying Equations (24) and (25), the following results presented in Table 14 were obtained. The results have been obtained assuming that the increase in wind power and photovoltaic consumption is followed by an equivalent decline in the consumption of conventional energy sources. The magnitude of the values shown is relatively small, due to the fact that the weights of Electrical Energy from a Wind Source and Photovoltaic sub-activities are relatively modest in the economy.
Table 15 details the activities that saw their production grow faster due to a drop in electricity prices. As can be seen in the table, the sectors that experienced the greatest growth in their production were fundamentally those related to household consumption: Food products; beverages; tobacco products has a weighting in the CPI (Consumer Price Index) of 21.77%. In addition, this sector “pulls” those of Products of agriculture, hunting and related services and Fish and other fishing products; aquaculture products; support services to fishing.
The group Textiles; wearing apparel; leather and related products represents 8.16% of spending on goods and services of families, and is, therefore, one of the most important spending groups. Other activities that appear in the table are Accommodation and food services, Financial services and Services auxiliary to financial services and insurance services, which also show relatively high weights in the CPI: 11.31% and 4.47%, respectively. Retail trade services, except for motor vehicles and motorcycles, is a sector closely interrelated with household consumption, thus, an increase in this consumption will be followed by an increase in the production of this activity. Human health services have a high weight in household spending of approximately 15.47%; thus, they are also an important item in the family budget.
On the other hand, and as is logical, the activities related to the production of renewable energies (Electrical energy from a wind source, Photovoltaics and Other renewables) directly affected by the change experienced by energy consumption, also saw their production increase.

5. Discussion

In Spain, the dominant actors successfully block the energy transition on the basis of resiliency of the conventional energy production systems [50].
According to Eurostat data [31], RDG represented more than 30% of all electricity generated in EU in 2017. By countries, Austria is the largest producer of renewable energy (70.6%) followed by Sweden (65.8%) and Portugal (52.6%) in 2015. Spain is in 8th position with a share of renewable energy sources in electricity of 37% in 2015. The position of Spain remains at an impasse in this ranking in 2017, the latest data available. Focusing on Spain electricity prices for households and non-households, they exceed European average in 2015 and 2017 [31]. Denmark has the highest electricity price for households (0.307 euro per kWh) in 2015, followed by Germany (0.295), Italy (0.245), Ireland (0.243) and Spain (0.231). The variation on Spanish electricity prices for households has been minimal in 2017. However, the change on Spanish electricity prices for non-households has been a decreased of 11% in 2017 with respect to 2015. The impact on consumers’ electricity prices of the deployment of renewable generation can be produced through the energy and supply component of the electricity price formation. The final price of electricity depends on a range of different energy and supply conditions, including the energy mix in the wholesale electricity market, but also network costs, environmental protection costs or levels of excise and taxation. In Spain, the share of energy and supply in electricity prices (56.6%) is above the European average in 2015 (39.1%). In contrast, the share of network costs (22.1%) and taxes, fees, levies and charges (21.4%) are under the European average (26.5% and 34.4%, respectively). Only Malta (77.9%), Bulgaria (60.3%, UK (59.8%) and Cyprus (59.1) present a higher energy supply component [31].
In social terms, energy poverty, i.e., “the inability to realise essential capabilities as a direct or indirect result of insufficient access to affordable, reliable and safe energy services, and taking into account available reasonable alternative means of realising these capabilities” [51] is around 11% [52]. To deal with this situation that affects between 3.5 and 8.1 million citizens in Spain, the Spanish Government approved in March 2019 the National Strategy against Energy Poverty 2019–2024, which complements the Strategic Energy and Climate Framework. The RE-electrification transition is the key to unlocking a future with greater energy security, improved health and quality of life.
One of the ways that can help to alleviate this poverty is the use of small RDG, as its use reduces the costs in the transmission and distribution of electricity. Moreover, by aggregating small RDG under new management systems such as the Virtual Electrical Power Plant, they can have enough capacity to deal at the wholesale electricity market analogous to large-scale producer following a decrease in wholesale electricity price, thus increasing affordability of electricity for the economy. In Spain, the regulatory framework has favored a large penetration of renewables in the electricity generation that reaches a share to 38.4% in the overall annual electricity generation in 2018 [3].
In fact, the current Royal Decree 244/2019 simplifies the mechanism for compensation of self-produced and unconsumed energy, mainly for those who install small RDG units. These measures countenance the arrival of households and small businesses into the electrical system.
Although under the scenario of a large-scale penetration of renewables, the electricity price diminished as a result of the so-called merit order effect, other effects should be considered. RES-E deployment implicates other connections that may affect final electricity prices. The intermittent and non-fully predictable nature of RES-E increased the cost of ancillary services associated with the services of the electric grid to support the flow of electricity, guaranteeing equilibrium between supply and demand. In fact, fostering the implementation of RES-E implies additional flexibility requirements on System Operators (SO) to cover the demand with the electricity supply [53]. Thus, the potential of sector coupling should be considered, i.e., improving energy efficiency and reducing CO2 emissions and costs. Besides this, the onset of new electricity generators in a competitive market can produce a consequent change in the behavior of the different actors, not only in the electricity sector, but also in other parts of the renewable energy scenario, fostering the connections of the power sector with transport, heating and cooling activities.
The use of innovative technologies, such as electric cars, power-to-heat solutions and/or demand-side management, could increase the system’s flexibility and produce an impact in the cost offering solutions to the problem of variable power generation from RES-E.

6. Conclusions

Over the next few years, renewable capacities will grow significantly in order to fulfill long-term climate targets. The European Commission fosters a strategic long-term plan “for a prosperous, modern, competitive and climate-neutral economy by 2050”, maximizing the deployment of renewables, among other issues [54]. Under this clean energy transition scenario, RDG can have a significant role in fostering electricity system flexibility and energy democracy between different income groups of households.
To the best of our knowledge, the present paper introduces an unexplored view of the energy prices impacts. This is the first study quantifying the effect on electricity prices changes of a set of RES-E under an extended Input-Output Model in which household consumption is endogenized. The contribution, then, is twofold. First, the importance to take into account the industry-household linkage with price electricity has been tackled. The results can be used to benefit decision-making with respect of electricity pricing policies for an efficient allocation of resources. Second, regarding the lack of information relating to renewable energy sources in electricity, this paper shows the need to make estimations for the disaggregated input-output table. The procedure could be applied to any other country in the world in order to evaluate between different future RDG mix.
In this paper, the analysis is established for Spain. Spain represents a case study of significant wider interest, as it is one of the countries with more locations with potential for the installation of distributed generation renewable resources [55].
Specific disaggregation of the Spanish electricity generation of the latest available Spanish Input-Output table, which refers to 2015, was developed. Although some uncertainty can be associated with the sources of these forecasts, we considered that their reliability was adequate given its origin. Special attention was paid to Electric power from a conventional origin, Electrical energy from a Wind source, Photovoltaics and Other renewables.
Even though the input-output model has commonly been applied to evaluate economic policies and to estimate short and medium impacts, some caution should be taken in relation with its assumptions. The IO model assumes a linear relationship for the production process of each unit or sector and constantly returns to scale and non-substitution effects in response to price change. For a detailed overview of strengths and weaknesses of IO models, see [23].
The obtained results corroborate how a hypothetical decline in the electricity price owing to the more widespread introduction of wind energy and photovoltaics are associated with significant drops in the economy, not only in terms of electricity activities, but also in most industrial sectors. Households, as electricity energy consumers, are also affected by price changes with a positive impact on income. Therefore, households induced a variation in the total output of outstanding services sectors, such as education, human health, public administrations or transport services, among others. Reference [7] reveals that usually the service industries are least affected by energy price shocks. However, this statement can probably be related to an underestimate of economic impacts given that they omit household and factor income activities. The non-omission of households in the estimation could assess the induced effect and provide an upper bound of the economic effects [23].
Further avenues for research include a multi-regional input-output model (MRIO). The Spanish economy is not isolated from, but embedded in the globalized world. MRIO takes into account not only the domestic impacts directly and indirectly generated inside the nation, but also the consequences of international trade. The local variation of the energy mix can have repercussions on the economic and social frameworks for the production of renewable energy-related goods and services of other countries. This provides supplementary insights about inter-regional competition and delocalization of socioeconomic impacts of different energy mix scenarios. Additionally, a study of motives and/or the barriers for the consumer acceptance of RES is needed, emphasizing the importance of consumer characteristics. Thus, linking energy consumption and further disaggregation of household income groups in the context of IO modeling will delve into the relationship among changes in prices with variations in the demand.

Author Contributions

Conceptualization, A.S.G.-M. and B.M.C.; methodology, C.R.C. and A.S.G.-M.; software, C.R.C.; validation, C.R.C.; formal analysis, C.R.C. and A.S.G.-M.; investigation, C.R.C., A.S.G.-M. and B.M.C.; resources, C.R.C., A.S.G.-M. and B.M.C.; data curation, C.R.C., A.S.G.-M. and B.M.C.; writing—original draft preparation, C.R.C., A.S.G.-M.; and B.M.C.; writing—review and editing, C.R.C., A.S.G.-M. and B.M.C.; visualization, C.R.C.; supervision, B.M.C.; project administration, B.M.C.; funding acquisition, B.M.C.

Funding

This work has been supported by the Spanish ministry of Economics, Industry, and Competitiveness under Grant ENE2016-80053-R.

Conflicts of Interest

The authors declare no conflict of interest.

References

  1. Zhou, K.; Yang, S. Understanding household energy consumption behavior: The contribution of energy big data analytics. Renew. Sustain. Energy Rev. 2016, 56, 810–819. [Google Scholar] [CrossRef]
  2. Trujillo-Baute, E.; del Río, P.; Mir-Artigues, P. Analysing the impact of renewable energy regulation on retail electricity prices. Energy Policy 2018, 114, 153–164. [Google Scholar] [CrossRef]
  3. REE. Las energías renovables en el sistema eléctrico español 2018; Red Eléctrica de España: Madrid, Spain, 2019. [Google Scholar]
  4. Akadiri, S.S.; Alola, A.A.; Akadiri, A.C.; Alola, U.V. Renewable energy consumption in EU-28 countries: Policy toward pollution mitigation and economic sustainability. Energy Policy 2019, 132, 803–810. [Google Scholar] [CrossRef]
  5. Soares, N.; Martins, A.G.; Carvalho, A.L.; Caldeira, C.; Du, C.; Castanheira, É.; Rodrigues, E.; Oliveira, G.; Pereira, G.I.; Bastos, J.; et al. The challenging paradigm of interrelated energy systems towards a more sustainable future. Renew. Sustain. Energy Rev. 2018, 95, 171–193. [Google Scholar] [CrossRef]
  6. Choi, J.-K.; Bakshi, B.; Haab, T. Effects of a carbon price in the U.S. on economic sectors, resource use, and emissions: An input–output approach. Energy Policy 2010, 38, 3527–3536. [Google Scholar] [CrossRef]
  7. Valadkhani, A.; Babacan, A.D.A. The impacts of rising energy prices on non-energy sectors in Australia. Econ. Anal. Policy 2014, 44, 386–395. [Google Scholar] [CrossRef]
  8. Gemechu, E.; Butnar, I.; Llop, M.F.; Castells, F. Environmental tax on products and services based on their carbon footprint: A case study of the pulp and paper sector. Energy Policy 2012, 50, 336–344. [Google Scholar] [CrossRef]
  9. Finn, M. Perfect competition and the effects of energy price increases on economic activity. J. Money Credit Bank. 2000, 32, 400–416. [Google Scholar] [CrossRef]
  10. Wu, K.-Y.; Huang, Y.-S.; Wu, J.-H. Impact of electricity shortages during energy transitions in Taiwan. Energy 2018, 151, 622–632. [Google Scholar] [CrossRef]
  11. Jiang, Z.; Tan, J. How the removal of energy subsidy affects general price in China: A study based on input–output model. Energy Policy 2013, 63, 599–606. [Google Scholar] [CrossRef]
  12. Ogarenko, I.; Hubacek, K. Eliminating Indirect Energy Subsidies in Ukraine: Estimation of Environmental and Socioeconomic Effects Using Input–Output Modeling. J. Econ. Struct. 2013, 2, 1–27. [Google Scholar] [CrossRef]
  13. Wang, Y.; Wang, N.; Wu, M. The impacts of energy price fluctuations on China’s agriculture and rural economic development. Adv. Mater. Res. 2012, 524–527, 3216–3219. [Google Scholar] [CrossRef]
  14. Knetsch, T.A.; Molzahn, A. Supply side effects of strong energy price hikes in German industry and transportation. Empir. Econ. 2012, 43, 1215–1238. [Google Scholar] [CrossRef]
  15. Logar, I.; Van Den Bergh, J.C.J.M. The impact of peak oil on tourism in Spain: an input–output analysis of price, demand and economy-wide effects. Energy 2013, 54, 155–166. [Google Scholar] [CrossRef]
  16. Llop, M. Economic impact of alternative water policy scenarios in the Spanish production system: An input-output analysis. Ecol. Econ. 2008, 68, 288–294. [Google Scholar] [CrossRef]
  17. Cámara, A.; Martínez, M.I. Hacia una economía baja en carbono: Objetivos para 2030 en energías renovables. Regional Sectoral Econ. Stud. 2017, 17, 103–124. [Google Scholar]
  18. Langarita, R.; Duarte, R.; Hewings, G.; Sánchez-Chóliz, J. Testing European goals for the Spanish electricity system using a disaggregated CGE model. Energy 2019, 179, 1288–1301. [Google Scholar] [CrossRef]
  19. Ramos, C.; García-Muñiz, A.; Moreno, B.; Díaz, G. Small-scale renewable power technologies are an alternative to reach a sustainable economic growth: Evidence from Spain. Energy 2019, 167, 13–25. [Google Scholar] [CrossRef]
  20. Miyazawa, K. Input-output analysis and interrelational multiplier as a matrix. Hitotsub. J. Econ. 1968, 9, 39–58. [Google Scholar]
  21. Dietzenbacher, E. In Vindication of the Ghosh Model: A Reinterpretation as a Price Model. J. Reg. Sci. 1997, 37, 629–651. [Google Scholar] [CrossRef]
  22. De Mesnard, L. Is the Ghosh Model Interesting. J. Reg. Sci. 2009, 49, 361–372. [Google Scholar] [CrossRef]
  23. Miller, R.E.; Blair, P.D. Input-Output Analysis: Foundations and Extensions; Cambridge University Press: Cambridge, UK, 2009. [Google Scholar]
  24. Okuyama, Y.; Hewings, G.J.D.; Sonis, M. Economic impacts of an unscheduled event: Based on Miyazawa’s framework. J. Appl. Reg. Sci. 1996, 2, 79–93. [Google Scholar]
  25. Eurostat. NACE Rev.2. Statistical Classification of Economic Activities in the European Communit; Eurostat Methodologies and Working Papers; European Commission: Luxembourg, 2008. [Google Scholar]
  26. Spanish Statistical Institute. Structural Business Statistics: Industrial Sector; INE: Madrid, Spain, 2015; Available online: https://www.ine.es/dyngs/INEbase/en/operacion.htm?c=Estadistica_C&cid=1254736143952&idp=1254735576550&menu=resultados&secc=1254736143612&padre=&capsel=4601 (accessed on 22 November 2019).
  27. Spanish Statistical Institute. Structural Business Statistics: Industrial Sector, Trade Sector, Services Sector. Methodology; INE: Madrid, Spain, 2019; pp. 1–57. [Google Scholar]
  28. IRENA. Global Energy Transformation A roadmap to 2050; IRENA-International Renewable Energy Agency: Abu Dhabi, UAE, 2019. [Google Scholar]
  29. IRENA. Renewable Power Generation Costs in 2017; IRENA-International Renewable Energy Agency: Abu Dhabi, UAE, 2018. [Google Scholar]
  30. GWEC. Global Wind Report 2018; GWEC—Global Wind Energy Council: Brussels, Belgium, 2019. [Google Scholar]
  31. Eurostat. Supply, Transformation and Consumption of Electricity Statistics. 2018. Available online: https://ec.europa.eu/eurostat/web/products-datasets/-/NRG_105A (accessed on 22 November 2019).
  32. Eurostat. Electricity Prices for Non-Household Consumers Statistic; Eurostat: Brussels, Belgium, 2015. [Google Scholar]
  33. Spanish Statistical Institute. Household Budget Survey—HBS; INE: Madrid, Spain, 2015. [Google Scholar]
  34. Würzburg, K.; Labandeira, X.; Linares, P. Renewable generation and electricity prices: Taking stock and new evidence for Germany and Austria. Energy Econ. 2013, 40, S159–S171. [Google Scholar] [CrossRef]
  35. Dillig, M.; Jung, M.; Karl, J. The impact of renewables on electricity prices in Germany–An estimation based on historic spot prices in the years 2011–2013. Renew. Sustain. Energy Rev. 2016, 57, 7–15. [Google Scholar] [CrossRef]
  36. Linares, P.; Santos, F.J.; Ventosa, M. Coordination of carbon reduction and renewable energy support policies. Clim. Policy 2008, 8, 377–394. [Google Scholar] [CrossRef]
  37. Gil, H.A.; Gomez-Quiles, C.; Riquelme, J. Large-scale wind power integration and wholesale electricity trading benefits: Estimation via an ex post approach. Energy Policy 2012, 41, 849–859. [Google Scholar] [CrossRef]
  38. Gelabert, L.; Labandeira, X.; Linares, P. An ex-post analysis of the effect of renewables and cogeneration on Spanish electricity prices. Energy Econ. 2011, 33, S59–S65. [Google Scholar] [CrossRef]
  39. Azofra, D.; Martínez, E.; Jiménez, E.; Blanco, J.; Azofra, F.; Saenz-Díez, J.C. Comparison of the influence of photovoltaic and wind power on the Spanish electricity prices by means of artificial intelligence techniques. Renew. Sustain. Energy Rev. 2015, 42, 532–542. [Google Scholar] [CrossRef]
  40. Ballester, C.; Furió, D. Effects of renewables on the stylized facts of electricity prices. Renew. Sustain. Energy Rev. 2015, 52, 1596–1609. [Google Scholar] [CrossRef]
  41. Vaca, J.; Núñez, G.; Kido, A. Análisis multisectorial del incremento de precios de la electricidad en la economía de México. Problemas del Desarrollo. 2019, 50, 167–189. [Google Scholar] [CrossRef]
  42. Arlinghaus, J. Impacts of Carbon Prices on Indicators of Competitiveness: A Review of Empirical Findings; OECD Environment Working Papers, 87; OECD: Paris, France, 2015. [Google Scholar] [CrossRef]
  43. Arocena, P.; Díaz, A.C. La evolución de los costes energéticos y su efecto en la competitividad de la industria española. Econ. Ind. 2015, 396, 151–162. [Google Scholar]
  44. Álvarez, E.; Larrea, M.; Díaz, A.C.; Kamp, B. ¿Afectan los costes de energía a la competitividad de la industria? Econ. Ind. 2016, 401, 155–170. [Google Scholar]
  45. Spanish Statistical Institute. Energy Consumption Survey; INE: Madrid, Spain, 2015; Available online: https://www.ine.es/dyngs/INEbase/en/operacion.htm?c=Estadistica_C&cid=1254736146240&menu=ultiDatos&idp=1254735576715 (accessed on 22 November 2019).
  46. Labandeira, X.; Labeaga, J.M.; López-Otero, X. Estimation of elasticity price of electricity with incomplete information. Energy Econ. 2012, 34, 627–633. [Google Scholar] [CrossRef]
  47. Blázquez, L.; Boogen, N.; Filippini, M. Residential electricity demand in Spain: New empirical evidence using aggregate data. Energy Econ. 2013, 36, 648–657. [Google Scholar] [CrossRef]
  48. Romero-Jordán, D.; Del Río, P.; Peñasco, C. An analysis of the welfare and distributive implications of factors influencing household electricity consumption. Energy Policy 2016, 88, 361–370. [Google Scholar] [CrossRef]
  49. Romero-Jordán, D.; Peñasco, C.; del Río, P. Analysing the determinants of household electricity demand in Spain. An econometric study. Int. J. Electr. Power Energy Syst. 2014, 63, 950–961. [Google Scholar] [CrossRef]
  50. Hewitt, R.; Winder, N.; Hernandez-Jimenez, V.; Alonso, P.; Bermejo, L. Innovation, pathways and barriers in Spain and beyond: An integrative research approach to the clean energy transition in Europe. Energy Res. Soc. Sci. 2017, 34, 260–271. [Google Scholar] [CrossRef]
  51. Day, R.; Walker, G.; Simcock, N. Conceptualising energy use and energy poverty using a capabilities framework. Energy Policy 2016, 93, 255–266. [Google Scholar] [CrossRef]
  52. Aristondo, O.; Onaindia, E. Counting energy poverty in Spain between 2004 and 2015. Energy Policy 2018, 113, 420–429. [Google Scholar] [CrossRef]
  53. Hirth, L.; Ziegenhagen, I. Balancing Power and Variable Renewables: Three Links. Renew. Sustain. Energy Rev. 2015, 50, 1035–1051. [Google Scholar] [CrossRef]
  54. European Commission. A Clean Planet for All A European Strategic Long-Term Vision for a Prosperous, Modern, Competitive and Climate Neutral Economy; COM(2018) 773 Final; European Commission: Brussels, Belgium, 28 November 2018. [Google Scholar]
  55. Bódis, K.; Monforti, F.; Szabó, S. Could Europe have more mini hydro sites? A suitability analysis based on continentally harmonized geographical and hydrological data. Renew. Sustain. Energy Rev. 2014, 37, 794–808. [Google Scholar] [CrossRef]
Table 1. NACE Rev. 2. Electricity, gas, steam and air conditioning supply Section (4 digits).
35 Electricity, Gas, Steam and Air Conditioning Supply
35.1 Electric power generation, transmission and distribution
35.11 Production of electricity
35.12 Transmission of electricity
35.13 Distribution of electricity
35.14 Trade of electricity
35.2 Manufacture of gas; distribution of gaseous fuels through mains
35.21 Manufacture of gas
35.22 Distribution of gaseous fuels through mains
35.23 Trade of gas through mains
35.3 Steam and air conditioning supply
35.30 Steam and air conditioning supply
Source: [25].
Table 2. Electric energy, gas, steam and air conditioning supply Section. (NACE 2009 4 digits). Structural Business Statistics: Industrial Sector.
35 Electric Energy, Gas, Steam and Air Conditioning Supply
35.1 Production, transport and distribution of electrical energy
35.12 Transmission of electricity
35.13 Distribution of electricity
35.14 Trade of electricity
35.15 Production of hydroelectric energy
35.16 Production of electric power from a conventional thermal origin
35.17 Production of electrical energy from a nuclear source
35.18 Production of electrical energy from a wind source
35.19 Production of electrical energy of another type
35.2 Production of gas; Pipeline distribution of gaseous fuels
35.21 Gas production
35.22 Distribution of gaseous fuels through mains
35.23 Trade of gas through mains
35.3 Supply of steam and air conditioning
35.30 Supply of steam and air conditioning
Source: [27].
Table 3. Weighting factors.
ActivitiesRowColumn
Production, transport and distribution of electrical energy0.8700.780
Transmission of electricity0.0350.006
Distribution of electricity0.1170.021
Trade of electricity0.4290.746
Production of electrical energy0.4190.228
Production of gas; Pipeline distribution of gaseous fuels, Supply of steam and air conditioning0.1300.220
Source: Own elaboration from Structural Business Statistics: Industrial Sector [26].
Table 4. Correspondence between RES-E activities and weight coefficients.
ActivitiesRES-E ActivitiesWeighting Factors
Electric power from a conventional originNuclear0.63
Coal
Fuel oil/natural gas
Combined Cycle
Cogeneration
Electrical energy from a wind sourceWind0.18
PhotovoltaicPhotovoltaic0.03
Other renewablesThermoelectric solar0.15
Hydraulic
Hydro-wind
Other renewables
Source: Own elaboration from Red Eléctrica de España (REE).
Table 5. Weighting factors of total household expenditure on electricity and gas.
Level of Functional BreakdownWeighting Factors
04.5.1.0 Electricity0.725
04.5.2.1 City gas and natural gas0.220
04.5.2.2 Liquefied gas (butane, propane, …)0.055
Source: Own elaboration from HBS.
Table 6. Weighting factors of final demand of household final consumption.
Electricity ActivitiesWeighting Factors
Transmission of electricity0.218
Distribution of electricity0.011
Trade of electricity0.001
Electrical energy from a wind source0.137
Photovoltaic0.024
Other renewables0.123
Electric power from a conventional origin0.486
Source: Own elaboration from data of REE and Eurostat.
Table 7. Weighting factors of final demand.
ActivitiesWeighting Factors
Transmission of electricity0.1580
Distribution of electricity0.0083
Trade of electricity0.0004
Electrical energy from a wind source0.0997
Photovoltaic0.0171
Other renewables0.0892
Electric power from a conventional origin0.3523
Production of gas; Pipeline distribution of gaseous fuels, Supply of steam and air conditioning0.2750
Source: Own elaboration from IOT2015.
Table 8. Weighting factors of personnel costs by activities.
ActivitiesWeighting Factors
Production, transport and distribution of electrical energy0.8735
Transmission of electricity0.0440
Distribution of electricity0.3581
Trade of electricity0.0801
Production of electrical energy0.3913
Production of gas; Pipeline distribution of gaseous fuels, Supply of steam and air conditioning0.1265
Source: Own elaboration from IOT2015 and Structural Business Statistics: Industrial Sector [27].
Table 9. RES-E and Spot Electricity Price in Spanish electricity market.
YearElectricity Generated by Renewable Resources RES-E (%) *Spot Electricity Price (€/MWh) *
200519.1256.62
200619.9952.63
200721.6840.35
200823.7565.15
200927.8437.35
201029.7837.87
201131.5650.73
201233.4748.63
201336.7345.98
201437.7744.64
201536.9552.75
201636.6141.90
Source: Eurostat and DataStream Database. Notes: * Spanish Electricity Market Operator Day Ahead Average Electricity Spot Price in Spain (€/MWh) extracted from the DataStream Database.
Table 10. Estimated electricity price reduction for medium size electricity consumers in Spain. 2015.
ScenariosEstimated Electricity Price Reduction (%)
Increase of % RES-EHouseholdIndustry
5−2.2−2.6
25−11.4−13.0
50−22.8−26.1
75−34.2−39.1
85−38.7−44.4
100−45.6−52.2
Source: Own elaboration based on [40].
Table 11. Global Price Reduction.
ScenariosPrice Reduction (%)
Increase of % RES-EIndustry ElectricityGlobal
5−2.6−0.14
25−13.0−0.72
50−26.1−1.45
75−39.1−2.18
85−44.4−2.47
100−52.2−2.90
Source: Own elaboration from IOT2015.
Table 12. Activities most affected by electricity price reduction under different scenarios (%).
Activities\Scenarios2.61326.139.144.452.2
Food, beverages and tobacco products0.0010.0040.0090.0120.0130.018
Wood and products of wood and cork, except furniture; articles of straw and plaiting materials0.0010.0040.0090.0120.0130.018
Paper and paper products0.0010.0080.0150.0200.0230.031
Printing and recording services0.0010.0050.0110.0140.0160.022
Chemicals and chemical products0.0010.0070.0130.0170.0200.027
Rubber and plastic products0.0010.0050.0110.0150.0160.022
Other non-metallic mineral products0.0030.0170.0350.0460.0520.070
Basic metals0.0020.0110.0220.0280.0320.043
Fabricated metal products, except machinery and equipment0.0010.0070.0140.0190.0220.029
Transmission of electricity0.0170.0850.1700.2230.2530.341
Distribution of electricity0.0190.0980.1960.2570.2910.394
Trade of electricity0.0280.1400.2810.3690.4170.564
Other renewables0.0140.0720.1440.1890.2140.289
Electric power from a conventional origin0.0150.0750.1510.1970.2230.302
Production of gas; Pipeline distribution of gaseous fuels, Supply of steam and air conditioning0.0090.0440.0890.1170.1320.178
Constructions and construction Works0.0010.0050.0110.0140.0160.021
Motion picture, video and television program production services, sound recording and music publishing; programming and broadcasting services0.0010.0050.0090.0130.0140.019
Source: Own elaboration from IOT2015.
Table 13. Electricity Price Elasticity: different estimations for Spain.
AuthorPeriodElasticity
[46]2005–2007−0.2536
[47]2000–2008−0.07
[48]1998–2009−0.2673
[49] *2006–2008Min: −0.1138, Max: −0.163
2010–2012Min: −0.2084, Max: −0.3307
* The estimation results have been provided by percentile Source: Own elaboration.
Table 14. Changes in income and total output under different scenarios.
Variations (pmp)
Price Scenarios−2.2−11.4−22.8−34.2−38.7−45.6
Total income0.231.22.43.64.74.9
Total output2.22.63.03.33.53.8
Source: Own elaboration from IOT2015.
Table 15. Activities that increase production are in the third quartile.
Activities
Products of agriculture, hunting and related services
Fish and other fishing products; aquaculture products; support services to fishing
Food products; beverages; tobacco products
Textiles; wearing apparel; leather and related products
Electrical energy from a wind source
Photovoltaics
Other renewables
Retail trade services, except for motor vehicles and motorcycles
Accommodation and food services
Financial services, except insurance and pension funding
Services auxiliary to financial services and insurance services
Real estate services
Travel agents, tour operators and other reservation services and related services
Human health services
Residential care services; social work services without accommodation
Creative, arts and entertainment services; library, archive, museum and other cultural services; gambling and betting services
Source: Own elaboration from IOT2015.

