Article

Using the Magnetotelluric Method for Detecting Aquifer Failure Characteristics under High-Intensity Mining of Thick Coal Seams

1
School of Energy Science and Engineering, Henan Polytechnic University, Jiaozuo 454003, China
2
State Key Laboratory of Water Resource Protection and Utilization in Coal Mining, Beijing 102211, China
3
Synergism Innovative Centre of Coal Safety Production in Henan Province, Jiaozuo 454003, China
4
School of Mines, China University of Mining and Technology, Xuzhou 221116, China
5
Department of Mining Engineering, West Virginia University, Morgantown, WV 26505, USA
*
Author to whom correspondence should be addressed.
Energies 2019, 12(22), 4397; https://doi.org/10.3390/en12224397
Submission received: 3 October 2019 / Revised: 1 November 2019 / Accepted: 18 November 2019 / Published: 19 November 2019

Abstract

:
In the ecologically fragile mining area of northwest China, high-intensity mining has seriously affected the aquifer and surface eco-environment. In order to better implement water-preserved mining in ecologically fragile areas, the aquifer failure characteristics should be first detected accurately; therefore, it is necessary to find a convenient and fast detection method. Based on the analysis of the basic principles and influencing factors of the magnetotelluric (MT) method, the feasibility of using the MT method to detect aquifer failure is verified by testing the mined area with MT detection and field borehole measurement. Subsequently, the failure characteristics of overburden and unconsolidated aquifers under high-intensity mining are studied by MT detection and physical simulation. By comparing the physical simulation with the field measurement from the aspects of the maximum surface subsidence, interval of periodic weighting and step cracks, the reliability of the height of the water flowing fracture zone and caving zone obtained from physical simulation is verified. The analysis from MT detection and physical simulation shows that the results of the two methods are in accord with each other, which further confirms that the MT method can be used to detect the failure of overburdened structures and aquifers. The penetrating fractures are the main channel for the downward seepage of water resources, which is caused by the “two-zone” of overburden model and located in the “dimple” shape in the apparent resistivity (AR) isogram. It can provide a reference and technical support for the corresponding new water-preserved mining technology and the construction of digital mines.

1. Introduction

With the strategic westward migration of coal resources, high-intensity mining in western mining areas has become normal [1,2,3,4]. Fan [5] defined the concept of high-intensity mining from the aspects of the proportion of the mining area, panel size and mining rate. Subsequently, Guo et al. [6,7] proposed a new definition of high-intensity mining and technical characteristics based on the green mining theory. Through the innovation in theory, technology and equipment, China has made great progress in thick seam mining [8,9,10,11]. At present, the world’s first 8.8 m super-large mining height, intelligent and fully mechanized mining face (panel size: 5262 m × 299.2 m) has been successfully operated at the Shangwan coalmine, with a daily coal output of about 54,000 t [12]. Wen et al. established the roof control design criteria and support-load calculation method for large mining-height stopes, and had been successfully applied in 8204 working faces in the Datong Coal Mine [13]. Roof cutting pressure releasing technology in the retracement channel had been proposed and applied in many coalmines, such as Tashan [14], Halagou [15] and Ningtiaota [16]. A few key technologies with independent intellectual property rights have been formed by studying the safe and efficient mining of an 8-m-thick coal seam, which achieves more than 15.5 Mt/a [17]. The coal resources in northwest China are abundant, which are characterized by a shallow-buried depth, stable occurrence, hard coal quality and poor caving ability; therefore, it is suitable for high-intensity mining. However, large-scale and high-intensity mining is liable to cause roof cutting, water and sand inrush, surface subsidence, groundwater and environmental damage, as well as other disasters, which seriously restricts the sustainable development of the western economy [18,19,20]. While the “silk road economic belt” brings new opportunities for coal enterprises to “go global”, meanwhile, it also draws people’s attention to the geological disasters in western China, especially the destruction of aquifers.
In recent years, in view of the serious leakage of groundwater and the deterioration of the environment caused by high-intensity mining in areas with a fragile ecology, water-preserved mining was proposed [21]. Its basic idea is to protect the water-bearing structure from being destroyed while mining as much coal as possible, and where the groundwater level does not fall or decline even slightly. One of the keys to realize water-preserved mining is to grasp the aquifer failure characteristics induced by high-intensity mining.
In order to find overburdened aquifers, various methods have been used in previous studies [22,23]. At present, the geophysical method is a hot topic in detecting the overburden damage, which has the characteristics of being fast, low cost and dynamic [24]. Yang [25] applied the magnetotelluric (MT) method to detect the water-rich properties of collapse columns in a coal mine and constructed boreholes on the ground surface for data validation. The detection results were in good agreement with the drilling data. Asaue et al. [26] used the MT method to clarify the deep geological structure in a coal-mining area in Kushiro, southeastern Hokkaido, Japan, and estimated the dip of the Osotsunai fault. Hu et al. [27] proposed a constrained inversion method of MT data by the artificial fish swarm algorithm, and the field test indicates that it can be used to process field data and a good result can be achieved. Nigel et al. [28] through monitoring the changes of rock resistivity, obtained the changes of fractures in the strata, and further obtained the storage of coal bed gas in the strata. Li et al. [29] used integrated geophysical and nuclear methods to delineate groundwater-bearing zones in a granite terrain in the Boshan region, Shandong Province, China; the result shows that it can help to identify two disconnected groundwater systems, offering an alternative freshwater source for the region if shallow groundwater or surface water is polluted. Zhang et al. [30] present a joint 2D inversion approach for MT and gravity data with elastic-net regularization and cross-gradient constraints; the results of a synthetic model validation and field application show that it can obtain higher details, a clearer boundary and better depth resolution. However, there are few studies on the aquifer failure characteristics under high-intensity mining using the MT method. Therefore, it is necessary to study the failure characteristics of aquifers under high-intensity mining by MT exploration, so as to provide reference and technical support for the corresponding new technology of water-preserved mining and the construction of digital mines.

2. Principles and Influencing Factors of the MT Method

2.1. Basic Principles of the MT Method

The MT method is a geophysical detection method which uses natural electromagnetic fields as the field source to study the electrical and distribution characteristics of underground strata, with strong penetration and resolution, a short detection period, little influence of external conditions on measuring points, simple field operation and a high efficiency. When electromagnetic wave propagates underground, the electromagnetic field values observed on the surface contain electrical information of underground media. Affected by the skin effect, the high frequency electromagnetic wave attenuates quickly, and vice versa. In this way, the apparent resistivity (AR) characteristics from different depths can be obtained by studying the electromagnetic field responses of different frequencies on the surface.
For the mining influence on the aquifer of a thick coal seam, the overburden before mining is relatively complete. In the mining area with simple geological conditions, its AR curve is smoother than those with complex geological conditions. The complete strata with larger thickness and hardness have poor conductivity and higher AR. Because the conductivity of the fluid is higher than that of rock, the higher the water content (i.e., aquifer) in the overlying stratum, the lower the AR is than that of an adjacent stratum. After high-intensity mining of thick coal seams in the northwest mining area, the overlying strata and the surface have undergone serious movement and deformation, some of them forming a “two-zone” model (as shown in Figure 1). The overburden fracture penetrates the aquifer and causes water resources to run deeper. The air fills the voids in the aquifer, which leads to a decrease in electrical conductivity and the increase of AR. Due to the loss of water resources, the voids will decrease after compaction, and the interval between AR curves within the caving zone will be smaller and AR will increase significantly when the strata are compacted again under the action of the strata gravity. Meanwhile, combined with hydrogeological data such as the borehole column of the working face, the mining influence on the aquifer of the thick coal seam can be judged, which is also the basic principle of the MT method.

2.2. Influencing Factors of the MT Method

There are many factors affecting the AR of strata, which are mainly related to overburden structure and water content. Most strata can be regarded as consisting of uniformly connected cements and mineral particles of different shapes. Its AR will depend on the AR, shape and relative content of these cements and mineral particles.
For the different lithologic strata, a different composition leads to a different internal porosity, which results in indifferent AR. Generally, the higher the mud content, the lower the AR; the larger the porosity, the smaller the AR. The variation of AR of relatively stable strata is controlled by its void size, permeability and water-bearing state. Because of the water adsorption by rock particles, a part of the water can be retained in the pore, and the smaller the pore diameter, the larger the capillary force, and the stronger the ability to retain water; so, the AR of clay is low. Because the AR of groundwater and other natural water are low, the rock with a large water content, the number and charge of conductive ions in water and the migration speed are also higher; so, the AR is lower, and vice versa. For example, the low AR of igneous rocks is caused by the development of fractures or joints due to weathering or structural damage; metamorphic rocks with a high degree of metamorphism have high AR because of their compact structure and small porosity. At the same time, the voids in the strata directly affect the permeability of the aquifer under the action of stress. Stress-strain and permeability-strain curves under the saturated condition (Figure 2) [31] show that rock permeability tends to be “lower–higher–lower” under loading conditions, and the peak value of permeability often lags behind the peak value of stress. This is because the porosity of rock changes during loading, resulting in changes in water conductivity, which indirectly affects the AR.

3. Validation of the MT Method by Field Measurement

3.1. MT Detection Experiments

In order to explain the results of the MT method more accurately, the ground test was carried out in the mined area of Lugou coalmine by using a CAN-Ⅱ portable MT detector. According to the geological mining conditions of the working face, the panel layout for the working face was 713.5 m long by 103.5 m wide with 470.4~481.8 m depth. The overall structure of the coal seam was simple. The average thickness of coal seam was 6.4 m with an average dip angle of 14°. The overlying strata were mainly soft strata, such as mudstone and sandy mudstone, as well as hard strata, such as fine-grained sandstone and medium-grained sandstone. Due to a water reservoir above the working face, the survey points were arranged along the edge of the reservoir. After the mining was completed, the surface geophysical prospecting test of the goaf was carried out by the MT method.
Through the ground test above goaf before and after mining with the MT method, it is known that when the depth of the goaf is 100 m, there is an abnormal resistance area. This is because under the action of self-weight and compaction of overlying strata, the overburden fissures close gradually. However, due to the integrity and compactness of the overlying strata, the water flowing fracture zone was destroyed, resulting in abnormal changes in the AR contour. In the upper part of the anomalous area, the AR of most strata is smooth, and only a few closed circles appear, which indicates that the corresponding strata are only bent and subsided, and the tension of the strata reduces their compactness, or that a closed circle is formed because of the existence of geological structures. Therefore, it can be considered that the anomalous range of AR is the height of the water flowing fracture zone, which is 110.4 m. In order to verify the height of the water flowing fracture zone detected by the MT method, the ground drilling method was used for on-site monitoring.

3.2. Field Measurement of the Water Flowing Fracture Zone

According to previous studies [32,33,34,35], the ground drilling method is the most accurate method to observe the height of the water flowing fracture zone. In order to verify the accuracy of the geophysical results, the ground drilling method was used to observe the height of the water flowing fracture zone [36]. On-site construction was carried out by using a TXB-1000A drilling rig and NBB-250/60 mud machine. The total depth was 450.9 m, and the final hole was located within the caving zone, which was 20 m away from the roof of the coal seam. The design of the monitoring section was 126.83 m, and the borehole diameter was 47 mm; the borehole diameter was 56 mm in the range of 314.83 m above the observation section, and the casing with a diameter of 53 mm was installed; the borehole diameter of 76 mm in the range of 314.83~324.07 m, with a casing diameter of 73 mm. The outer wall of the casing was completely sealed with 2000 kg cement. Figure 3 shows the diagram structure of the drilling.
In the ground drilling construction, the drilling depth was determined by a drill pipe, drill collar, core pipe and bit. When the drilling tool was down to the bottom of hole and the flushing fluid circulates normally, the buoy water level gauge was used to measure the original water volume and residual water volume of the water tank of 3 m × 3 m × 1.5 m; meanwhile, the stopwatch is used to record the time. The losses of flushing fluid were calculated according to the original water volume, added water volume and residual volume. The depth of the drilling water level was determined by a measuring rope and clock before and after each drilling and recorded to two decimal points. After field observation, the borehole was closed by 0.4 m3 fine sand, 0.4 m3 fine stone, 0.08 m3 clay and 3500 kg cement.
When monitoring the height of the water flowing fracture zone in the field, the position of the height vertex was determined mainly according to the following principles: (1) The leakage of drilling fluids increases significantly, and basically increases with the increase of borehole depth. (2) The water level of borehole has been significantly reduced, and the rate of decline has been accelerated or some boreholes even have no water in them. By observing the leakage of drilling fluid and the depth of the water level in a borehole with a depth of 450.9 m, the relationship between the leakage of drilling fluid, the depth of water level in the borehole and the borehole depth was obtained as shown in Figure 4.
From Figure 4a, it can be seen that when the drilling depth is 0~104.8 m, the leakage of drilling fluid is basically in a stable state, indicating that there is little difference in the compactness of strata at this stage, and there are no obvious fissures or structures. When the drilling depth is 105.6~110.8 m, the leakage of drilling fluid increases to1.71 L/min, which is due to the existence of primary fissures 1~3 mm partially filled by calcite veins in fine-grained sandstone, resulting in a significant increase in the leakage of drilling fluid. When the drilling depth is 112.2~320.8 m, the drilling fluid was restored to a stable state again. When the drilling depth is 320.8~363 m, the leakage shows a gradual increase trend, and reaches 1.98 L/min, indicating that the strata at this stage have begun to be affected by coal mining, possibly in the bending zone, and the strata have separated or cracked. When the drilling depth is 363.9 m, the leakage of drilling fluid increases rapidly from 1.98 L/min to 5.4 L/min, and all of them are lost afterwards, indicating that the mining fractures has been penetrated into this area.
As can be seen from Figure 4b, the water level is relatively stable when the drilling depth is 0~104.8 m. When the drilling depth is 104.8~351.6 m, the water level decreases by 14.25 m, which is mainly due to the existence of primary cracks in the stratum structure with a depth of 106.3 m. When the drilling depth is 354.6 m, the water level decreases from 18.5 m to 95.8 m, indicating that there are obvious strata separation or fissures in the strata. The water level decreases from 95.8 m to 293.5 m when the drilling depth is 356.3~363.9 m, and at this stage, the water level decreases the fastest, which indicates that the cracks are developed. When the drilling depth is 365.4~394.2 m, the decline rate of the water level slows down and basically stabilizes at 275.2 m. According to the theory of key strata and its calculation, the phenomenon is mainly caused by the combination strata controlled by sub-key strata, and the strata present a whole shape. When the drilling depth is 394.2~446.2 m, the water level depth varies from 341.2 m to 345.4 m.
Therefore, according to the leakage and water level of the drilling fluid, the vertex depth of the water flowing fracture zone is determined to be 363.9 m by field measurement, and the height of the water flowing fracture zone can be calculated by the following formula:
Hli = Hh1 + W
where H is the distance between the drilling hole and coal seam roof, m; h1 is the vertical depth between the vertex of the water flowing fracture zone and drilling hole, m; and W is the strata compression value of fracture zone during drilling construction, taking 0.2 times mining thickness.
Therefore, according to the above formula and the leakage and field measurement, the height of water conduction fracture zone is 108.3 m.
Comprehensive analysis shows that the height of the water flowing fracture zone obtained by the MT method is 110.4 m with a detection error of 1.9%, which is basically consistent with the field measurement. It can be concluded that the MT method can be used to distinguish the failure characteristics of overburden and an unconsolidated aquifer under mining influence.

4. Engineering Application

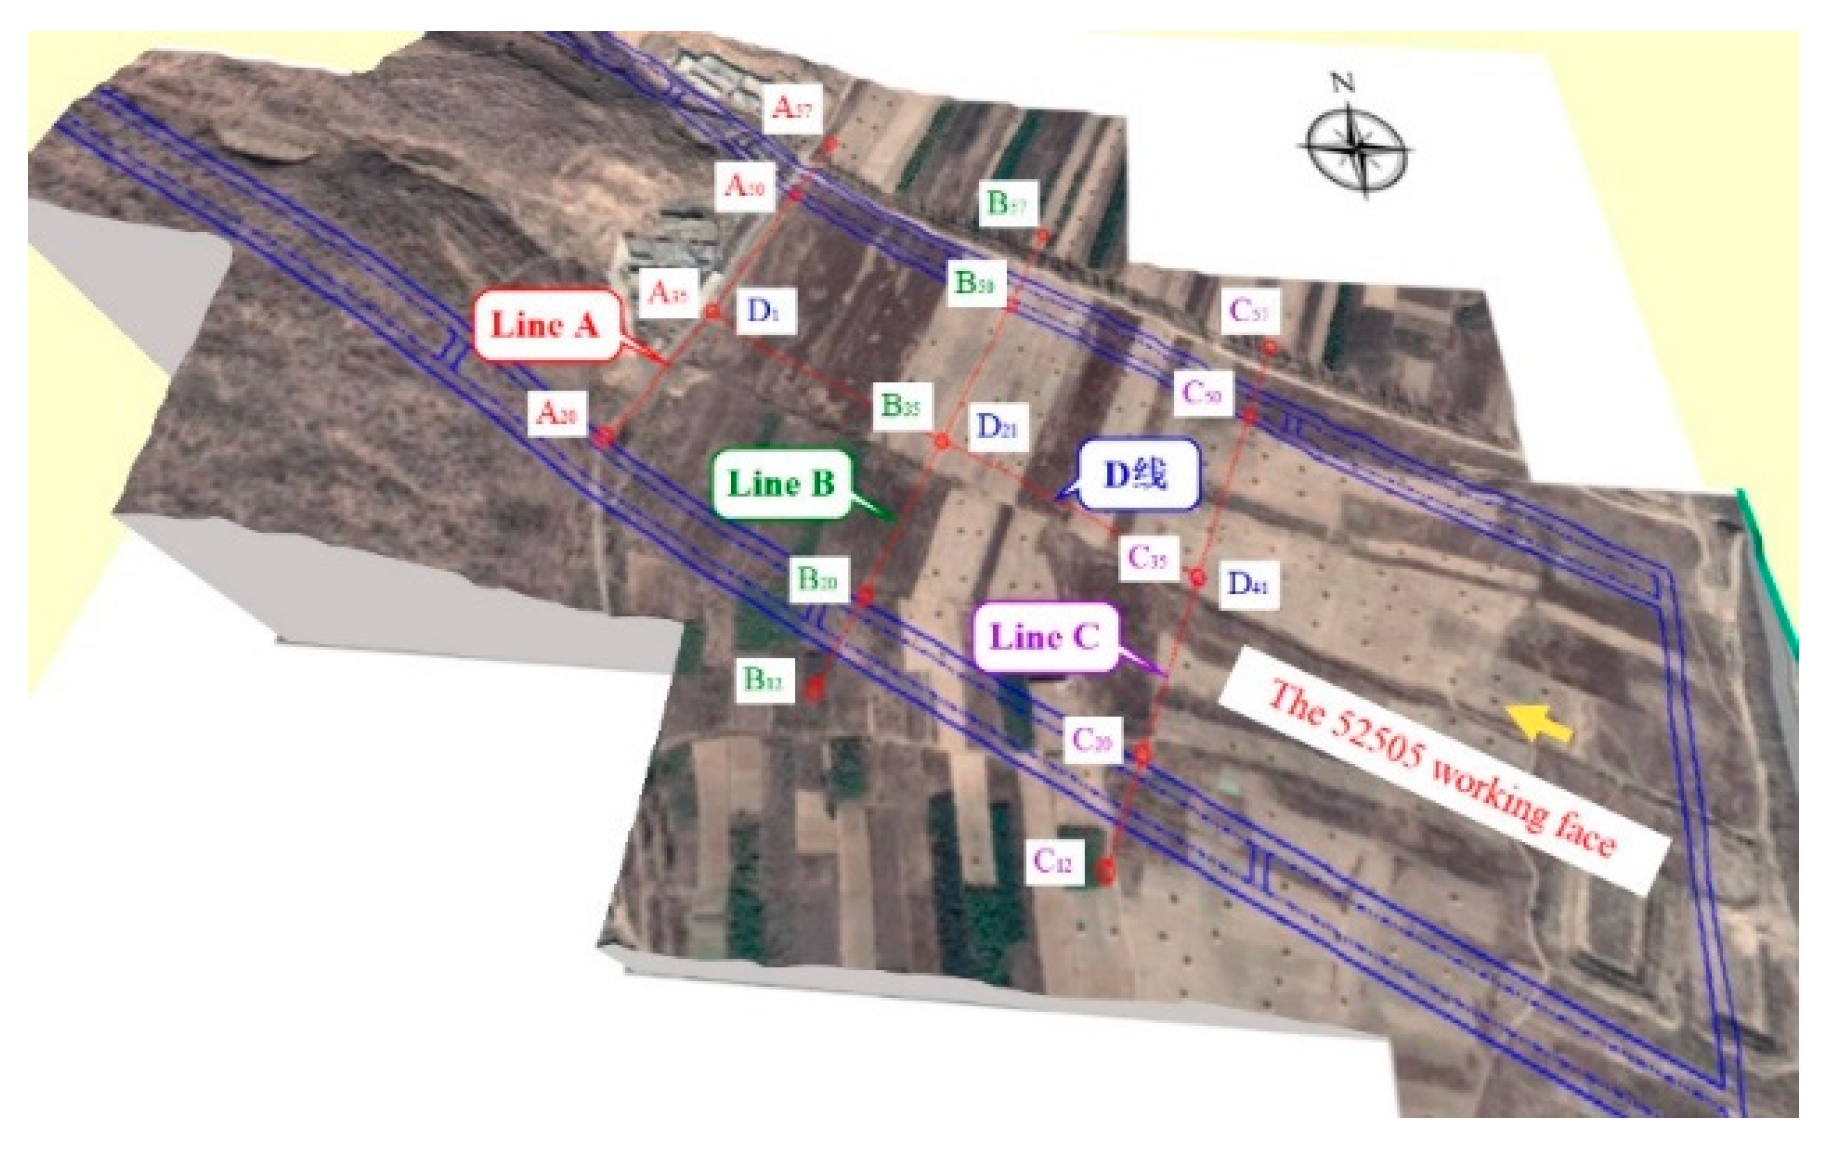
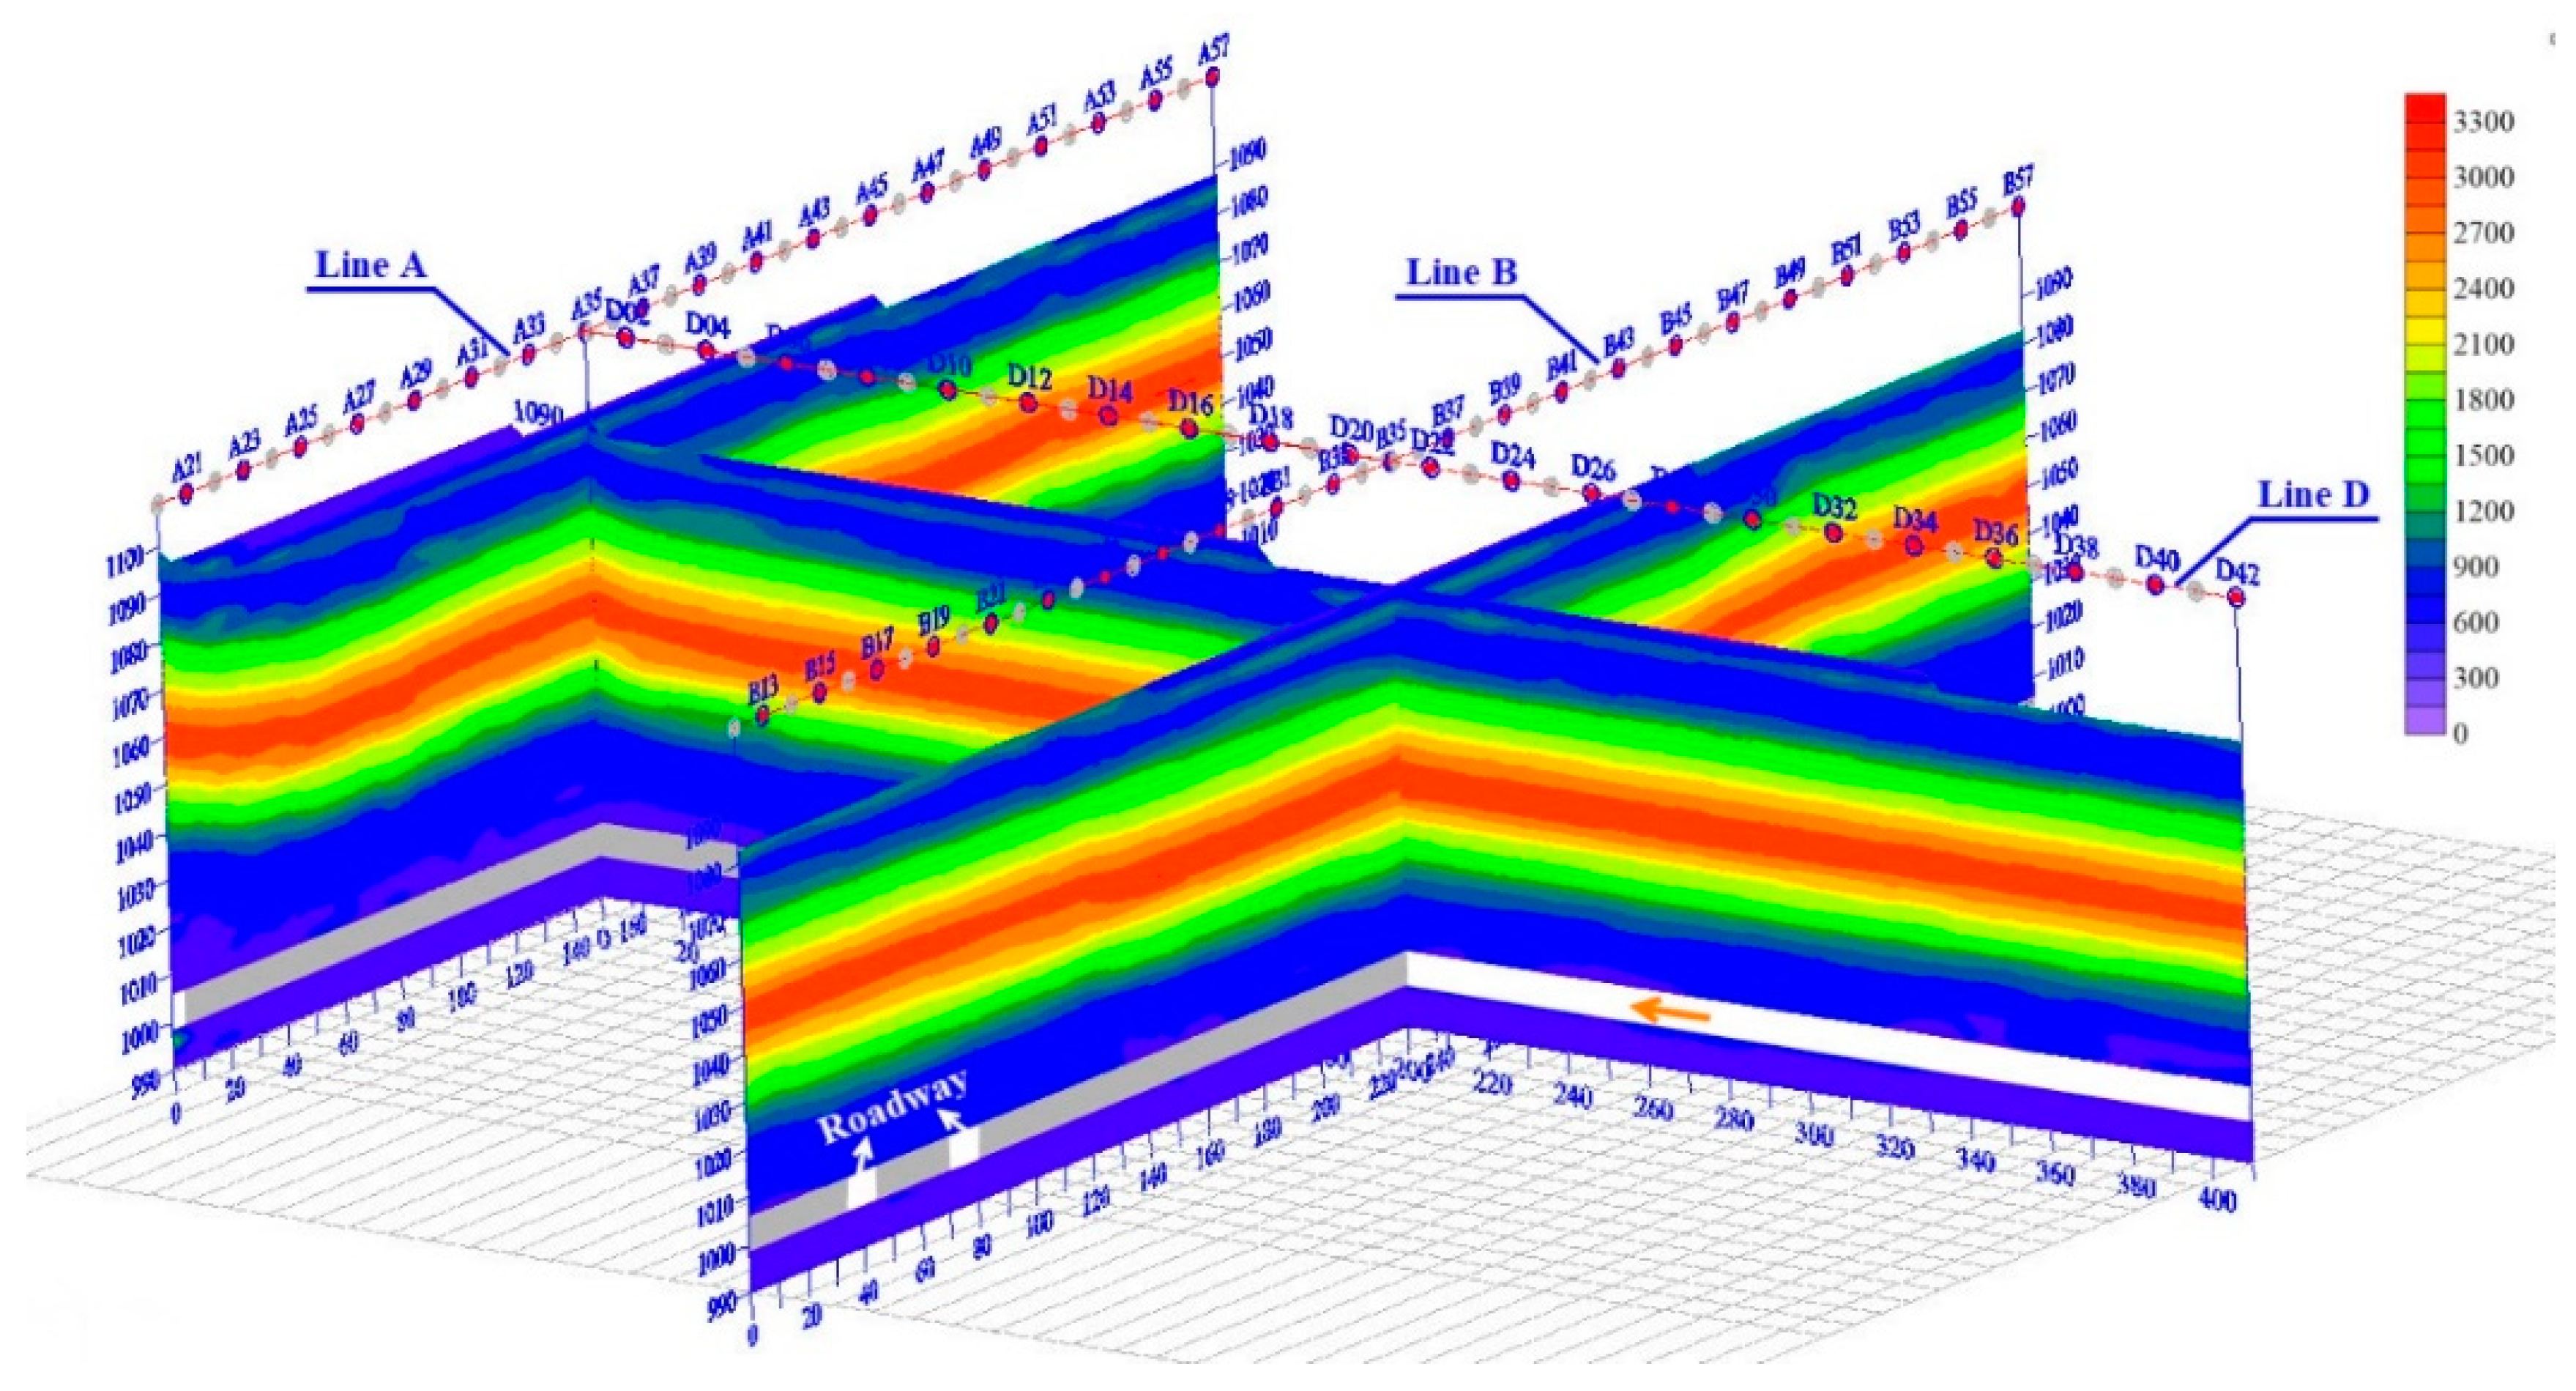
4.1. Region Overview

The Daliuta coalmine (in Shenmu District, China) covers a field area of 189.9 km2. The coalmine has a designed capacity of 21.7 million t/a. The 52,505 working face, located in the No. 5 panel, is about 4268.8 m in length and 301.3 m in width. The mineable coal is the No. 52 coal seam of the Yan’an Formation of the Triassic system with an average thickness of 7.2 m and average buried depth of 90 m, which has a stable horizon and simple structure, as shown in Figure 5. The overburden aquifer is mainly composed of various sandstones, of which the sandstones with large thickness and local fracture development pose a certain threat to the safety recovery of the working face. Based on the engineering design and the high-intensity mining technique characteristics, the overburden and surface will be seriously damaged after mining is completed, which can easily lead to water–sand inrush, roof cutting and collapse accidents. Therefore, it is of great significance to study the response of overburden and an unconsolidated aquifer in high-intensity mining of a thick coal seam for water-preserved mining and environmental protection.

4.2. Detection, Analysis and Discussion

Due to the MT method being susceptible to an undulating terrain, it is characterized by the fact that the closer to the steep straight edge, the more susceptible it is to the terrain, the larger the difference between the mountain or the valley, the more susceptible it is to the terrain, and the mountain is more affected by the terrain than the valley. Considering the topographic factors of the ground surface, the relatively flat area above the setup room of the working face is selected for the MT method detection. Four detection lines were set on the ground surface (as shown in Figure 5), where the A, B, and C lines are parallel to the width of the working surface, and the distance between the adjacent two lines is 200 m. The D line is parallel to the length of the working face and is located at the center of the working face. The probe distance is 10 m. Combining with the survey lines and mining situation, the aquifer failure characteristics of line A are mainly analyzed, and line B is used as the verification of line A. According to the detection results before mining, the AR contour of overburden is shown in Figure 6.
According to the AR before mining of line A (Figure 7), the overburden AR shows a horizontal distribution, which indicates that the overburden is stable, simple in structure and basically without geological structure. In the range of 1055~1095 m, the overburden AR increases with the increase of burial depth, while in the range of 1005–1055 m, it is exactly the opposite. Considering the cumulative water inflow of 92,000 m3 in the top side within four months after mining, it can be concluded that the water-rich overlying strata is the reason for the low AR. Besides, there are a few “closed circles” in the strata with the highest AR in the middle, which indicates that the strata here are relatively hard and compact, and there are smaller geological structures or primary fractures.
As shown in Figure 7, according to the numerical variation of overburden AR and geological boreholes, it can be seen that the layered loose aquifers shown in the figure have fluidity and recharge with the surface water. This area where the AR of lower overburden decreases is the sandstone aquifer rich in fracture water. Due to the strong water-rich nature at the primary fracture and the flow and erosion of water, the fracture water is unstable. Thus, there are many “closed circles” in Figure 7a, which will have a certain impact on the mining safety of the working face.
When the second measurement is taken (Figure 7b), the working face has been advanced to 500 m in front of line A (a total of 700 m, with an average speed of 13.5 m/d). According to the characteristics of overburden and surface movement and deformation in the northwest mining area, the overburden at line A is basically in a stable state. By comparing the AR of line A before and after mining, it can be seen that the mining influence on aquifer and overburden failure is mainly manifested in the following aspects:
(1)
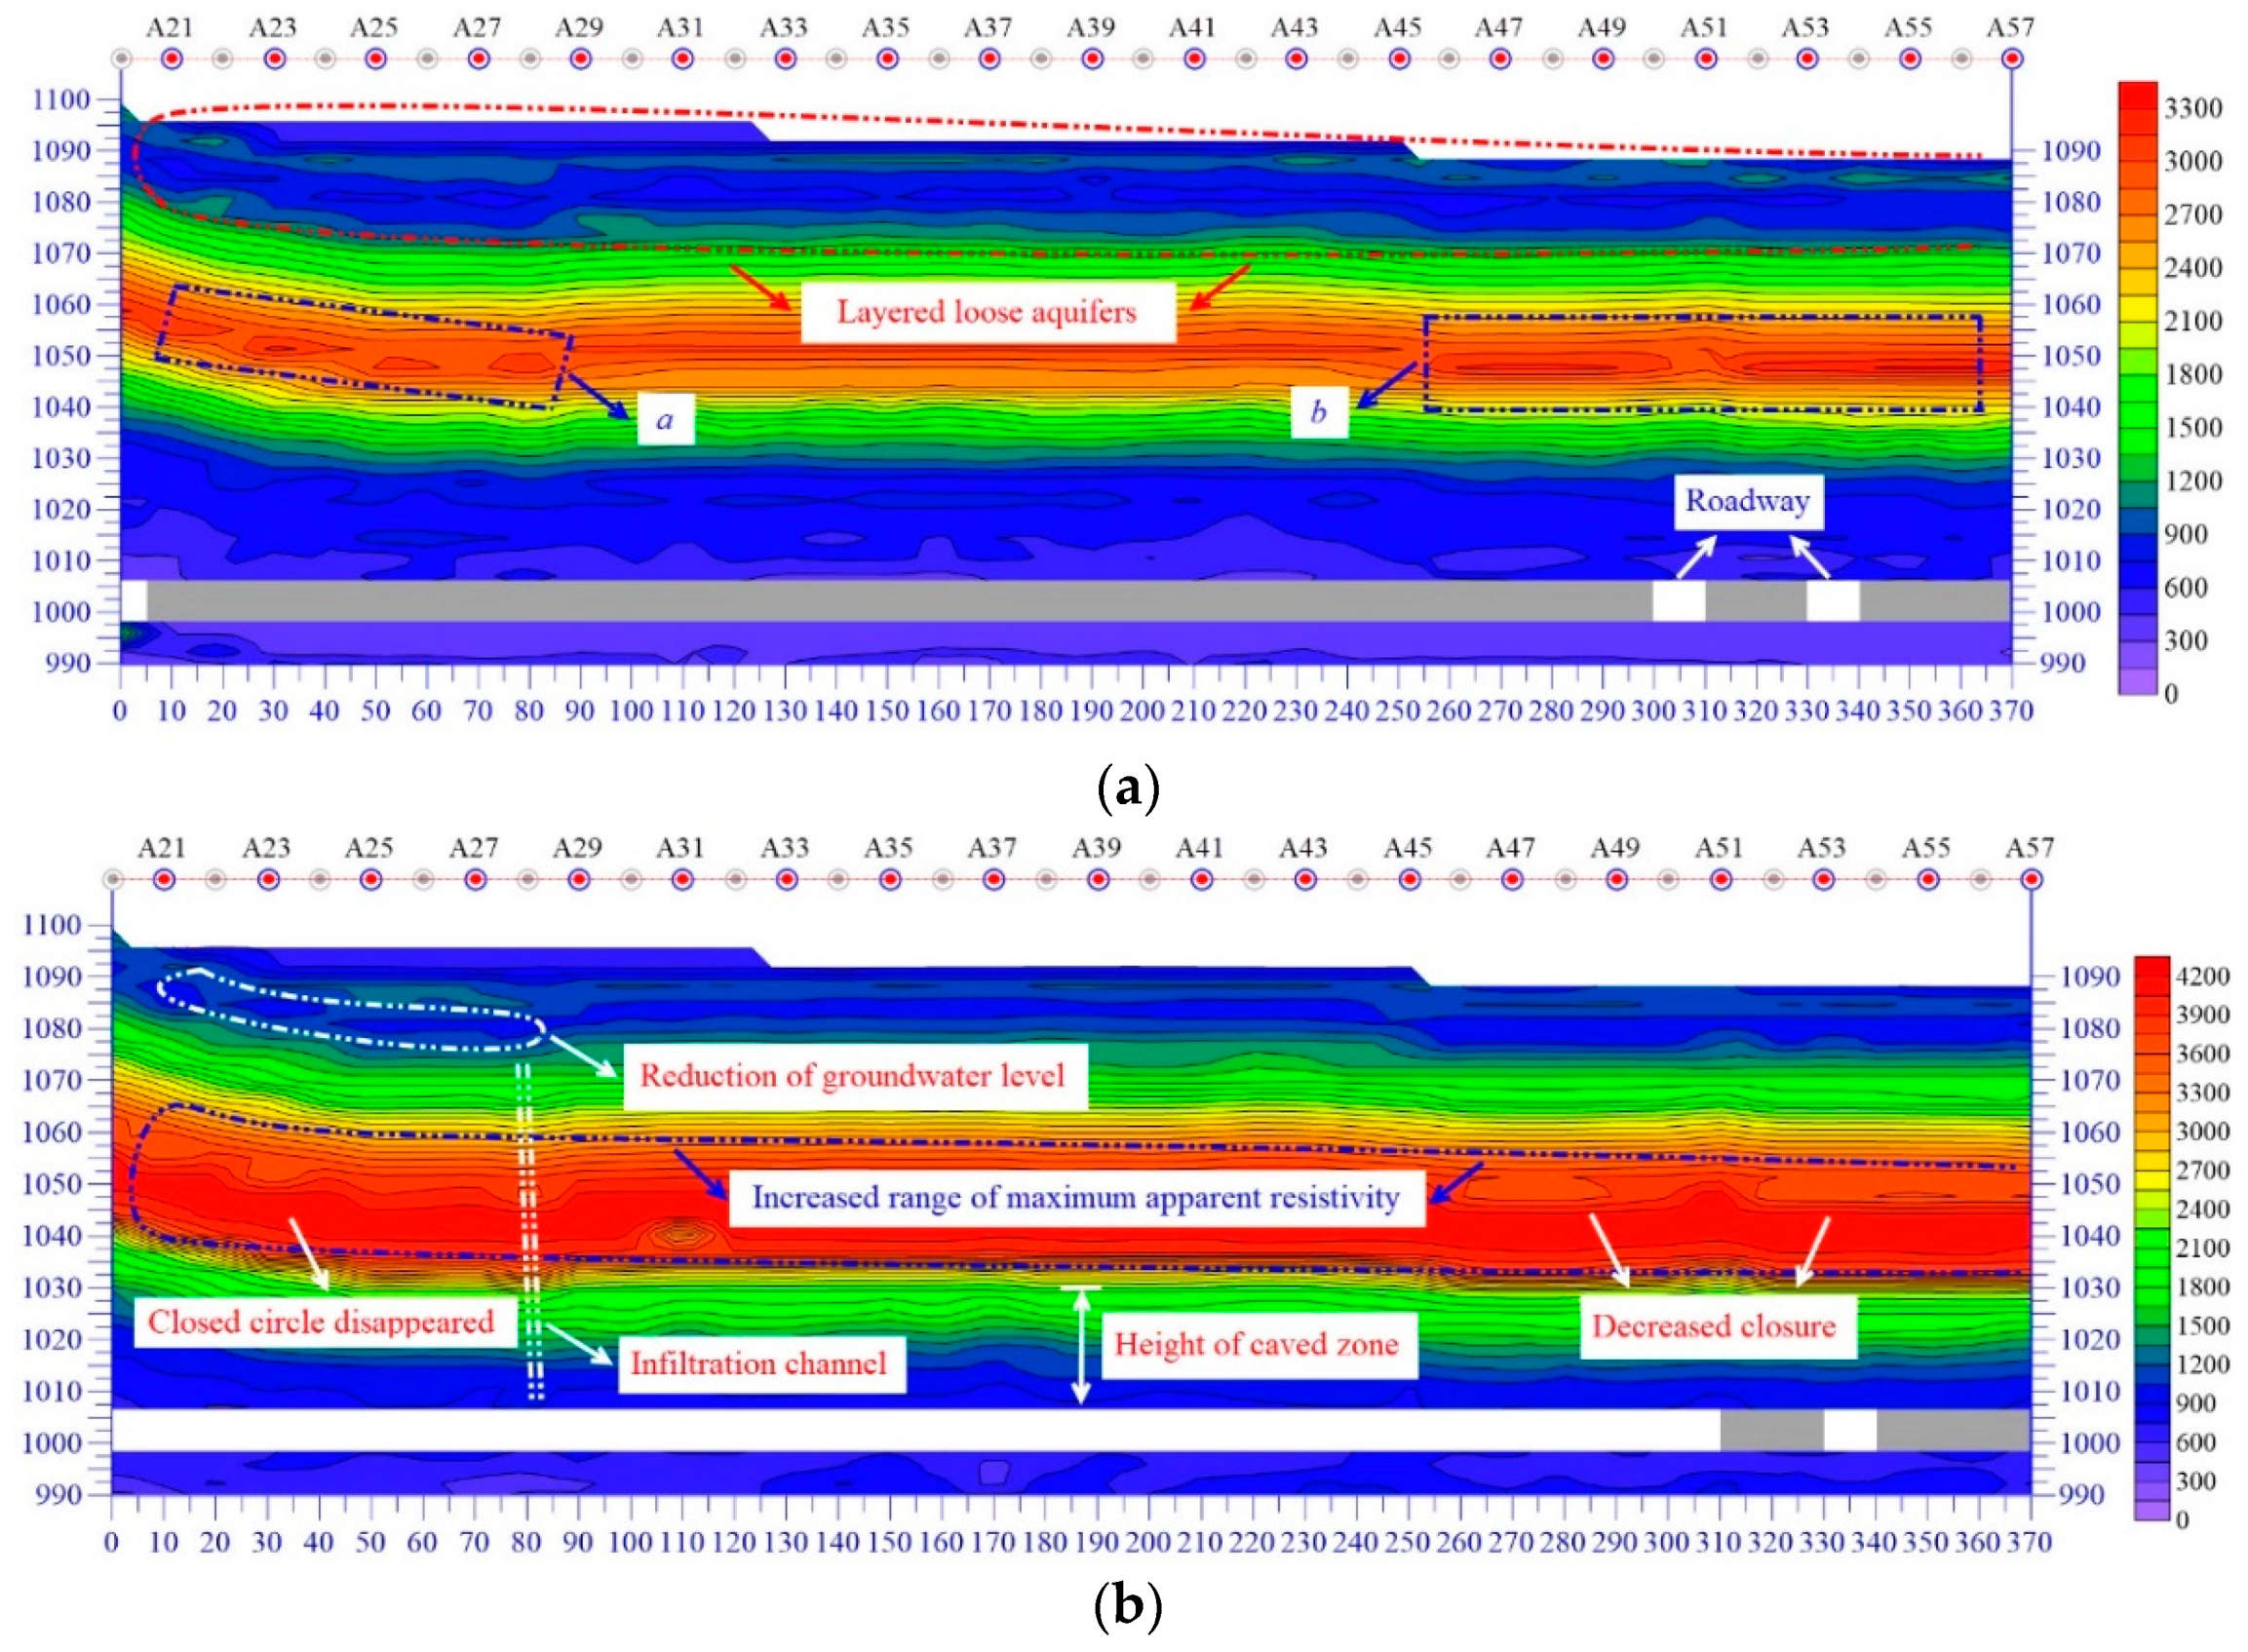
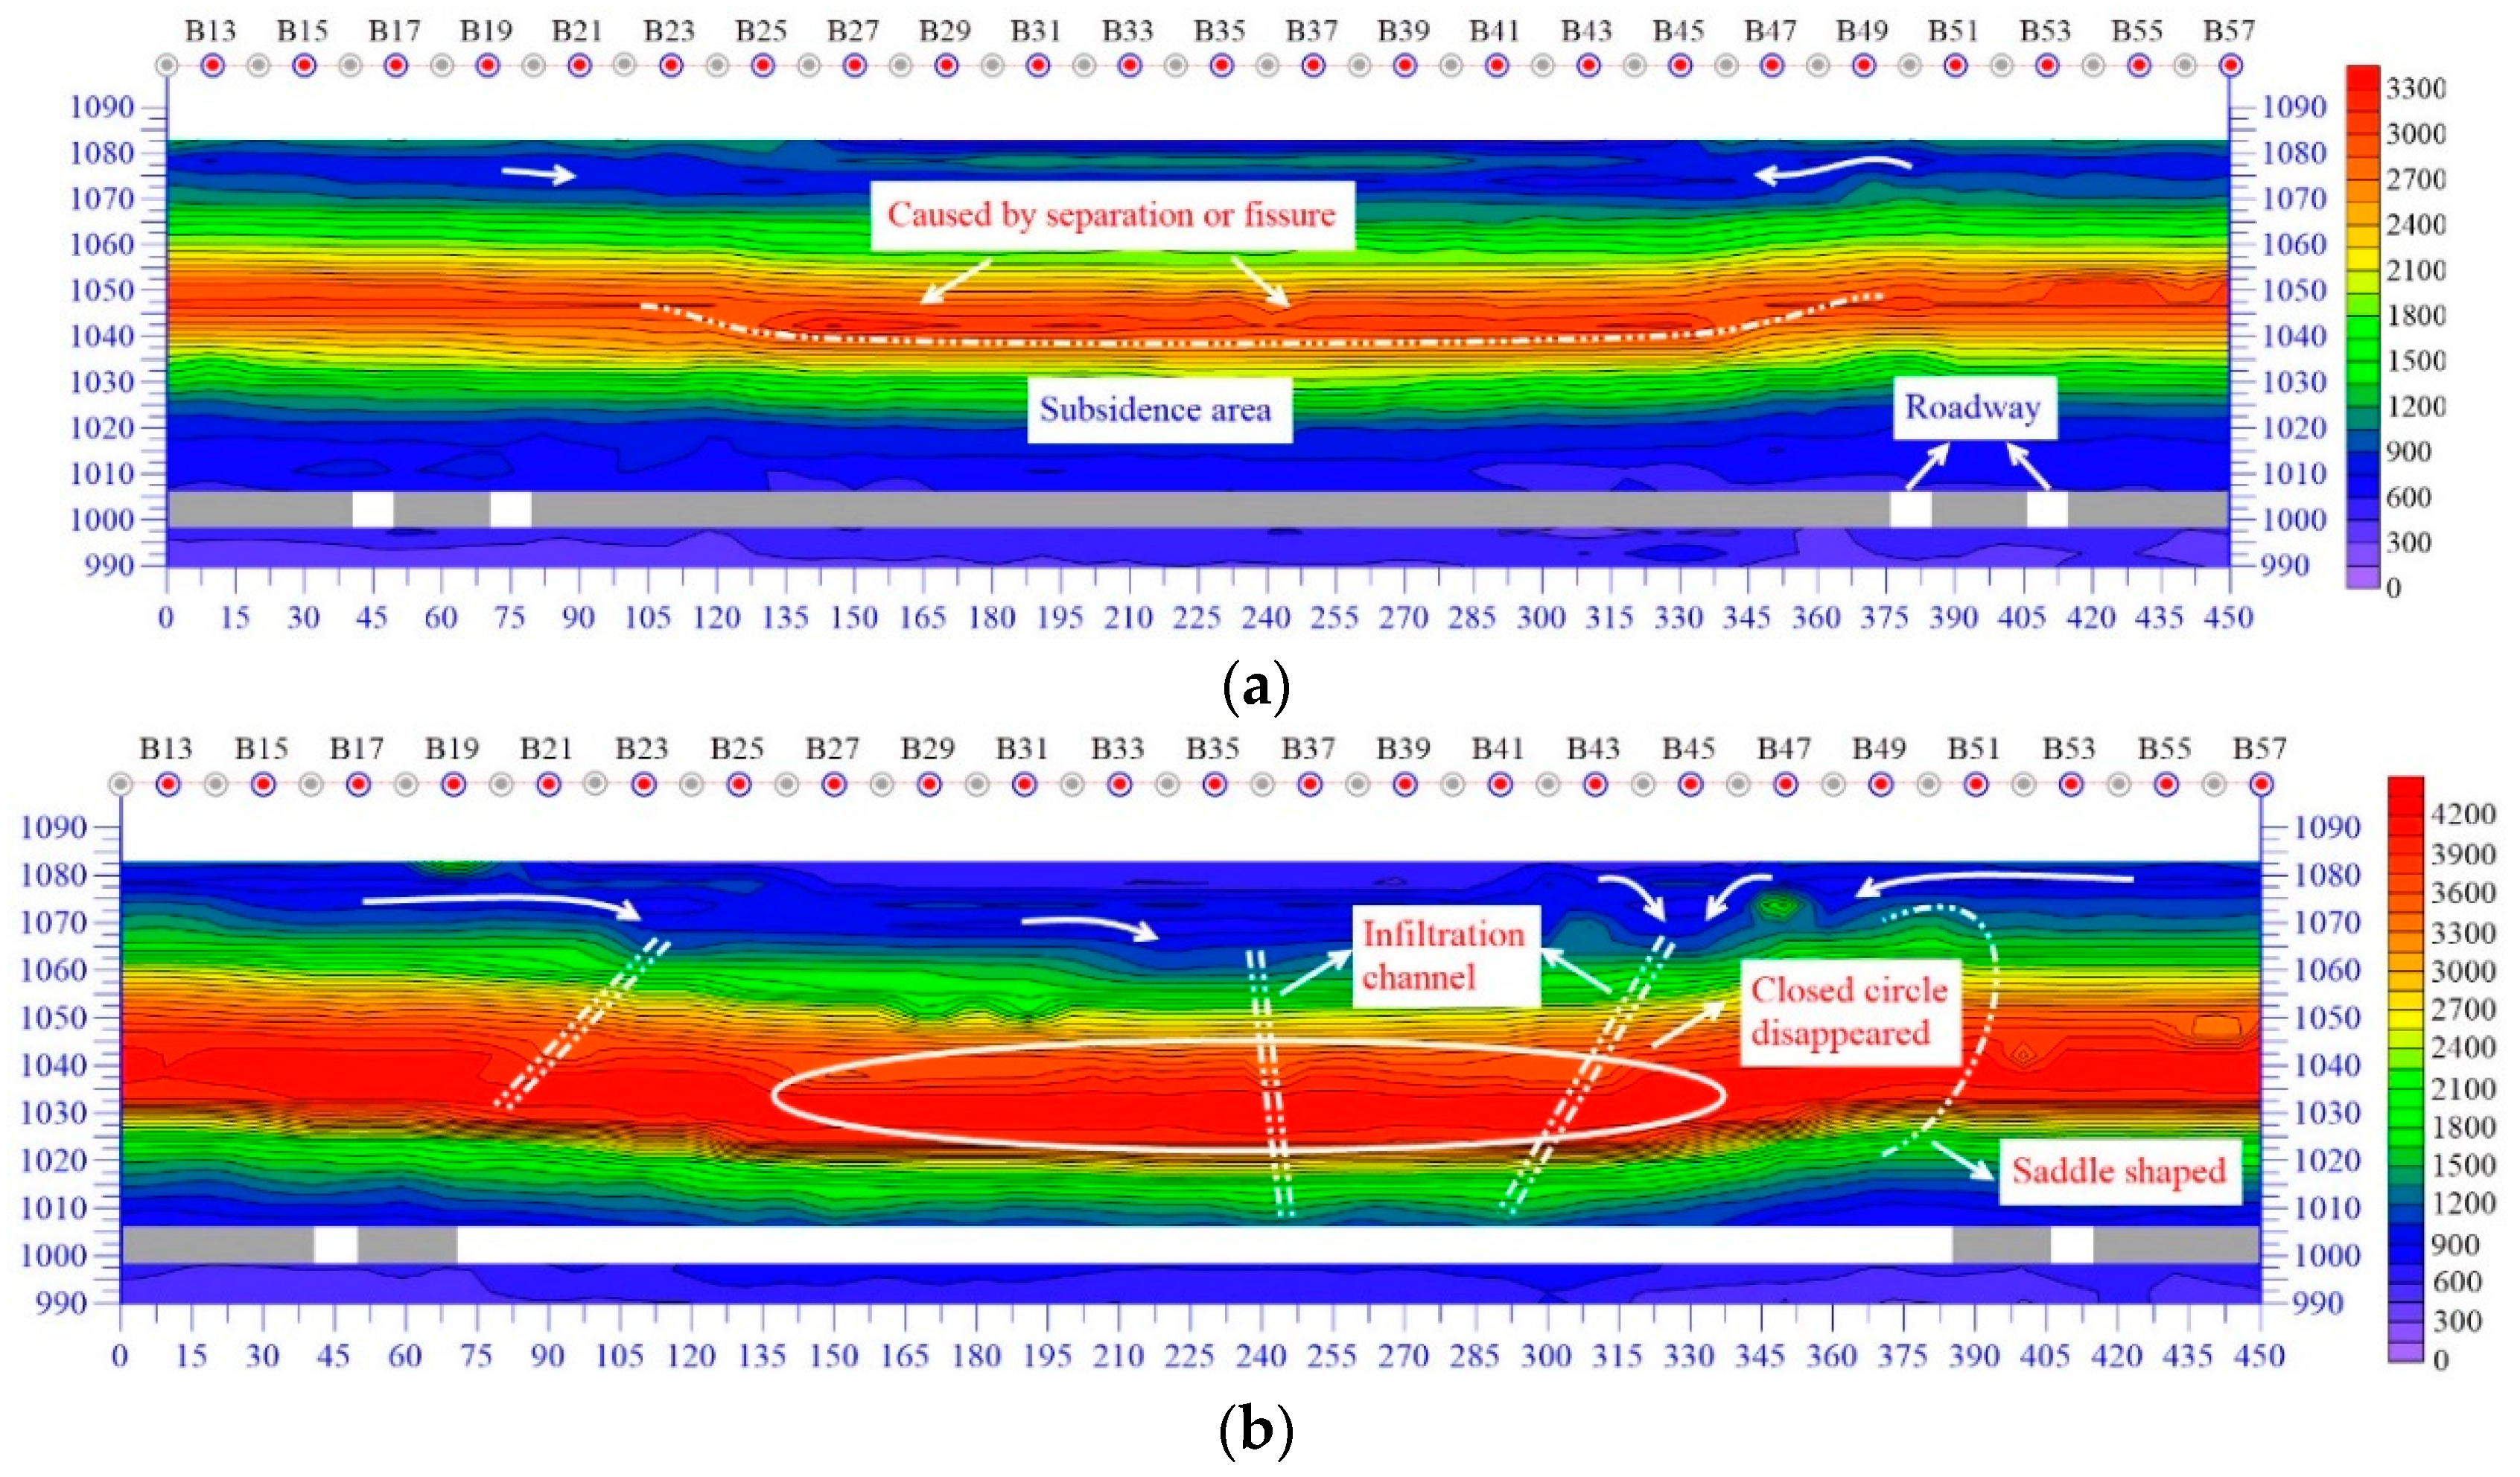
Under the mining influence, the AR after mining at the same position showed an increase as a whole, and the range of the maximum AR expanded. Combining with the “two-zone” model of overburden failure in adjacent working faces, it can be known that the upward cracks caused by high-intensity mining penetrate with the downward cracks at the surface, and the fracture water flows to the goaf through the cracks, which to a certain extent aggravates the overburden failure. With the further compaction of the caving zone, the compactness of strata increases correspondingly. Meanwhile, the loss of some water resources in unconsolidated aquifer not only reduces the water content, but also forms a hydration film with the surface of rock to reduce friction, which makes the fracture closure easier. Therefore, the whole overburden AR after mining is larger than that before mining.
(2)
The AR of overlying strata has changed obviously after mining. It indicates that the densification of overlying strata is indirectly increased due to the water loss and stress redistribution, resulting in the sparseness of its contours compared with that before mining. Due to only part of the water resources being lost in the unconsolidated aquifer, the AR contour has little change with that before mining. Under the mining influence, the AR contour of broken rock strata changes densely because of the closure of primary cracks and mining cracks after the strata stabilize again. Meanwhile, due to the high hardness and compactness of hard strata (key strata) below, the combination of mining cracks and primary cracks is more compact than that before mining, so its AR contour shows sparse change. After the water loss in an unconsolidated aquifer, the AR contour becomes dense because of the strata separation or the closure of mining fractures and overburden re-compaction in the fracture zone and caving zone. Due to the water loss of the sandstone fracture above the coal seam, the AR of this rock strata is similar and sparse.
(3)
The “closed circle” phenomenon in the area of maximum overburden AR is reduced. There may be some geological structures before mining, and their AR generally shows a local “closed” curve. However, after mining, under the overburden self-weight and the water loss, the geological structures intersect with the mining fractures, and then close gradually because the overburden stabilizes again. Therefore, the phenomenon of a “closed circle” in the hard strata is reduced. Meanwhile, the phenomenon of a “bulge” or “dimple” is formed because of fractures in the roof and floor of hard strata.
(4)
The height of water flowing fracture and caving zone can be judged. According to the comparison of overburden AR contours before and after mining, the height of caving zone is located at the lower edge of first concentration of AR contour above the coal seam, and its AR is smaller than the upper adjacent strata, that is, the first dense boundary of AR contour from bottom to top is the boundary of caving zone. Therefore, the height of caving zone and water flowing fracture zone are 24.30 m (3.38H) and greater than 90 m (12.5H), respectively, which completely penetrates the overburden and surface, causing the loss of groundwater resources.
In summary, the water resources in the unconsolidated aquifer are obviously reduced after high-intensity mining. However, due to the closure of mining fractures and other factors, it cannot be completely drained, but the groundwater level will be significantly decreased, resulting in partition aggregation.
In order to verify the credibility of line A’s detection results, the AR characteristics of line B during and after mining were selected for comparison. It should be noted that the second measurement after mining is delayed for several days because of the rainy days, so the line B is detected immediately after the weather clears up. Therefore, the occurrence state of overburden and aquifers detected by line B in the second measurement is not entirely affected by mining, but its structural change is reflected by high-intensity mining. The overburden AR contours during and after mining are shown in Figure 8.
From Figure 8a, it can be seen that the overburden AR contour presents a layered distribution as a whole, which is basically the same as that of line A. Only the density of the AR contour and the subsidence state of the central position are different, and the AR increases obviously in the loose layer above the middle of the working face. Combined with the AR “dimple” phenomenon above the middle of working face, the difference is mainly due to the mining influence on line B, the overburden destruction and the downward water loss in unconsolidated aquifers. The phenomenon of a “closed circle” in the middle contour is mainly caused by the mining fractures or separation layers.
In Figure 8b, it can be seen that the AR after mining is larger, and the “closed circle” of middle overburden disappears. Moreover, the variation characteristics of the contour density are basically the same as that of line A. The scope of maximum AR increases and subsides obviously. However, the water content in the unconsolidated aquifer is relatively rich, mainly because the atmospheric precipitation recharges the unconsolidated aquifer through mining cracks before detection. From the fast replenishment rate, it can be inferred that there are many overburden fractures and surface cracks, which are in good agreement with the actual measurement. After the mining of line B, the surface at the boundary of goaf forms a “funnel” phenomenon (as shown by the arrow in the figure) due to the water loss caused by fractures, which presents a wavy or locally dense closed circle. Meanwhile, it can be seen that the overburden failure presents a saddle shape, which further verifies the “two-zone” model of the overburden, and its characteristics are basically consistent with line A. Due to the overburden, failure characteristics are not changed although the unconsolidated aquifer is recharged by atmospheric precipitation; therefore, the detection results play a role in verifying and supplementing the accuracy of line A.
In order to verify the rationality of AR characteristics, the height of overburden failure can be checked and analyzed. According to the geological and mining conditions, the overburden lithology is hard strata with a mining thickness of 7.2 m. Based on the stipulation of “two-zone” height in the “Specifications of coal mining under buildings (construction), railways and water-bodies”, the height of caving zone (Hk) and water flowing fracture zone (Hli) is calculated as follows:
{ H k = 100 M 2.1 M + 16 ± 2.5 H l i = 30 M + 10
where Hk is the height of caving zone, m; Hli is the height of water flowing fracture zone, m; and M is the mining thickness, which is 7.2 m.
From the above formula, it can be calculated that the height of the caving zone is 20.64~25.64 m, and the height of the water flowing fracture zone is 90.50 m (greater than 90 m), which is basically consistent with the results of the MT method detection. Due to the mining influence on overburden being through cracks or fractures, in order to further verify the accuracy of the MT method, a physical simulation is carried out to study the overburden failure characteristics under high-intensity mining.

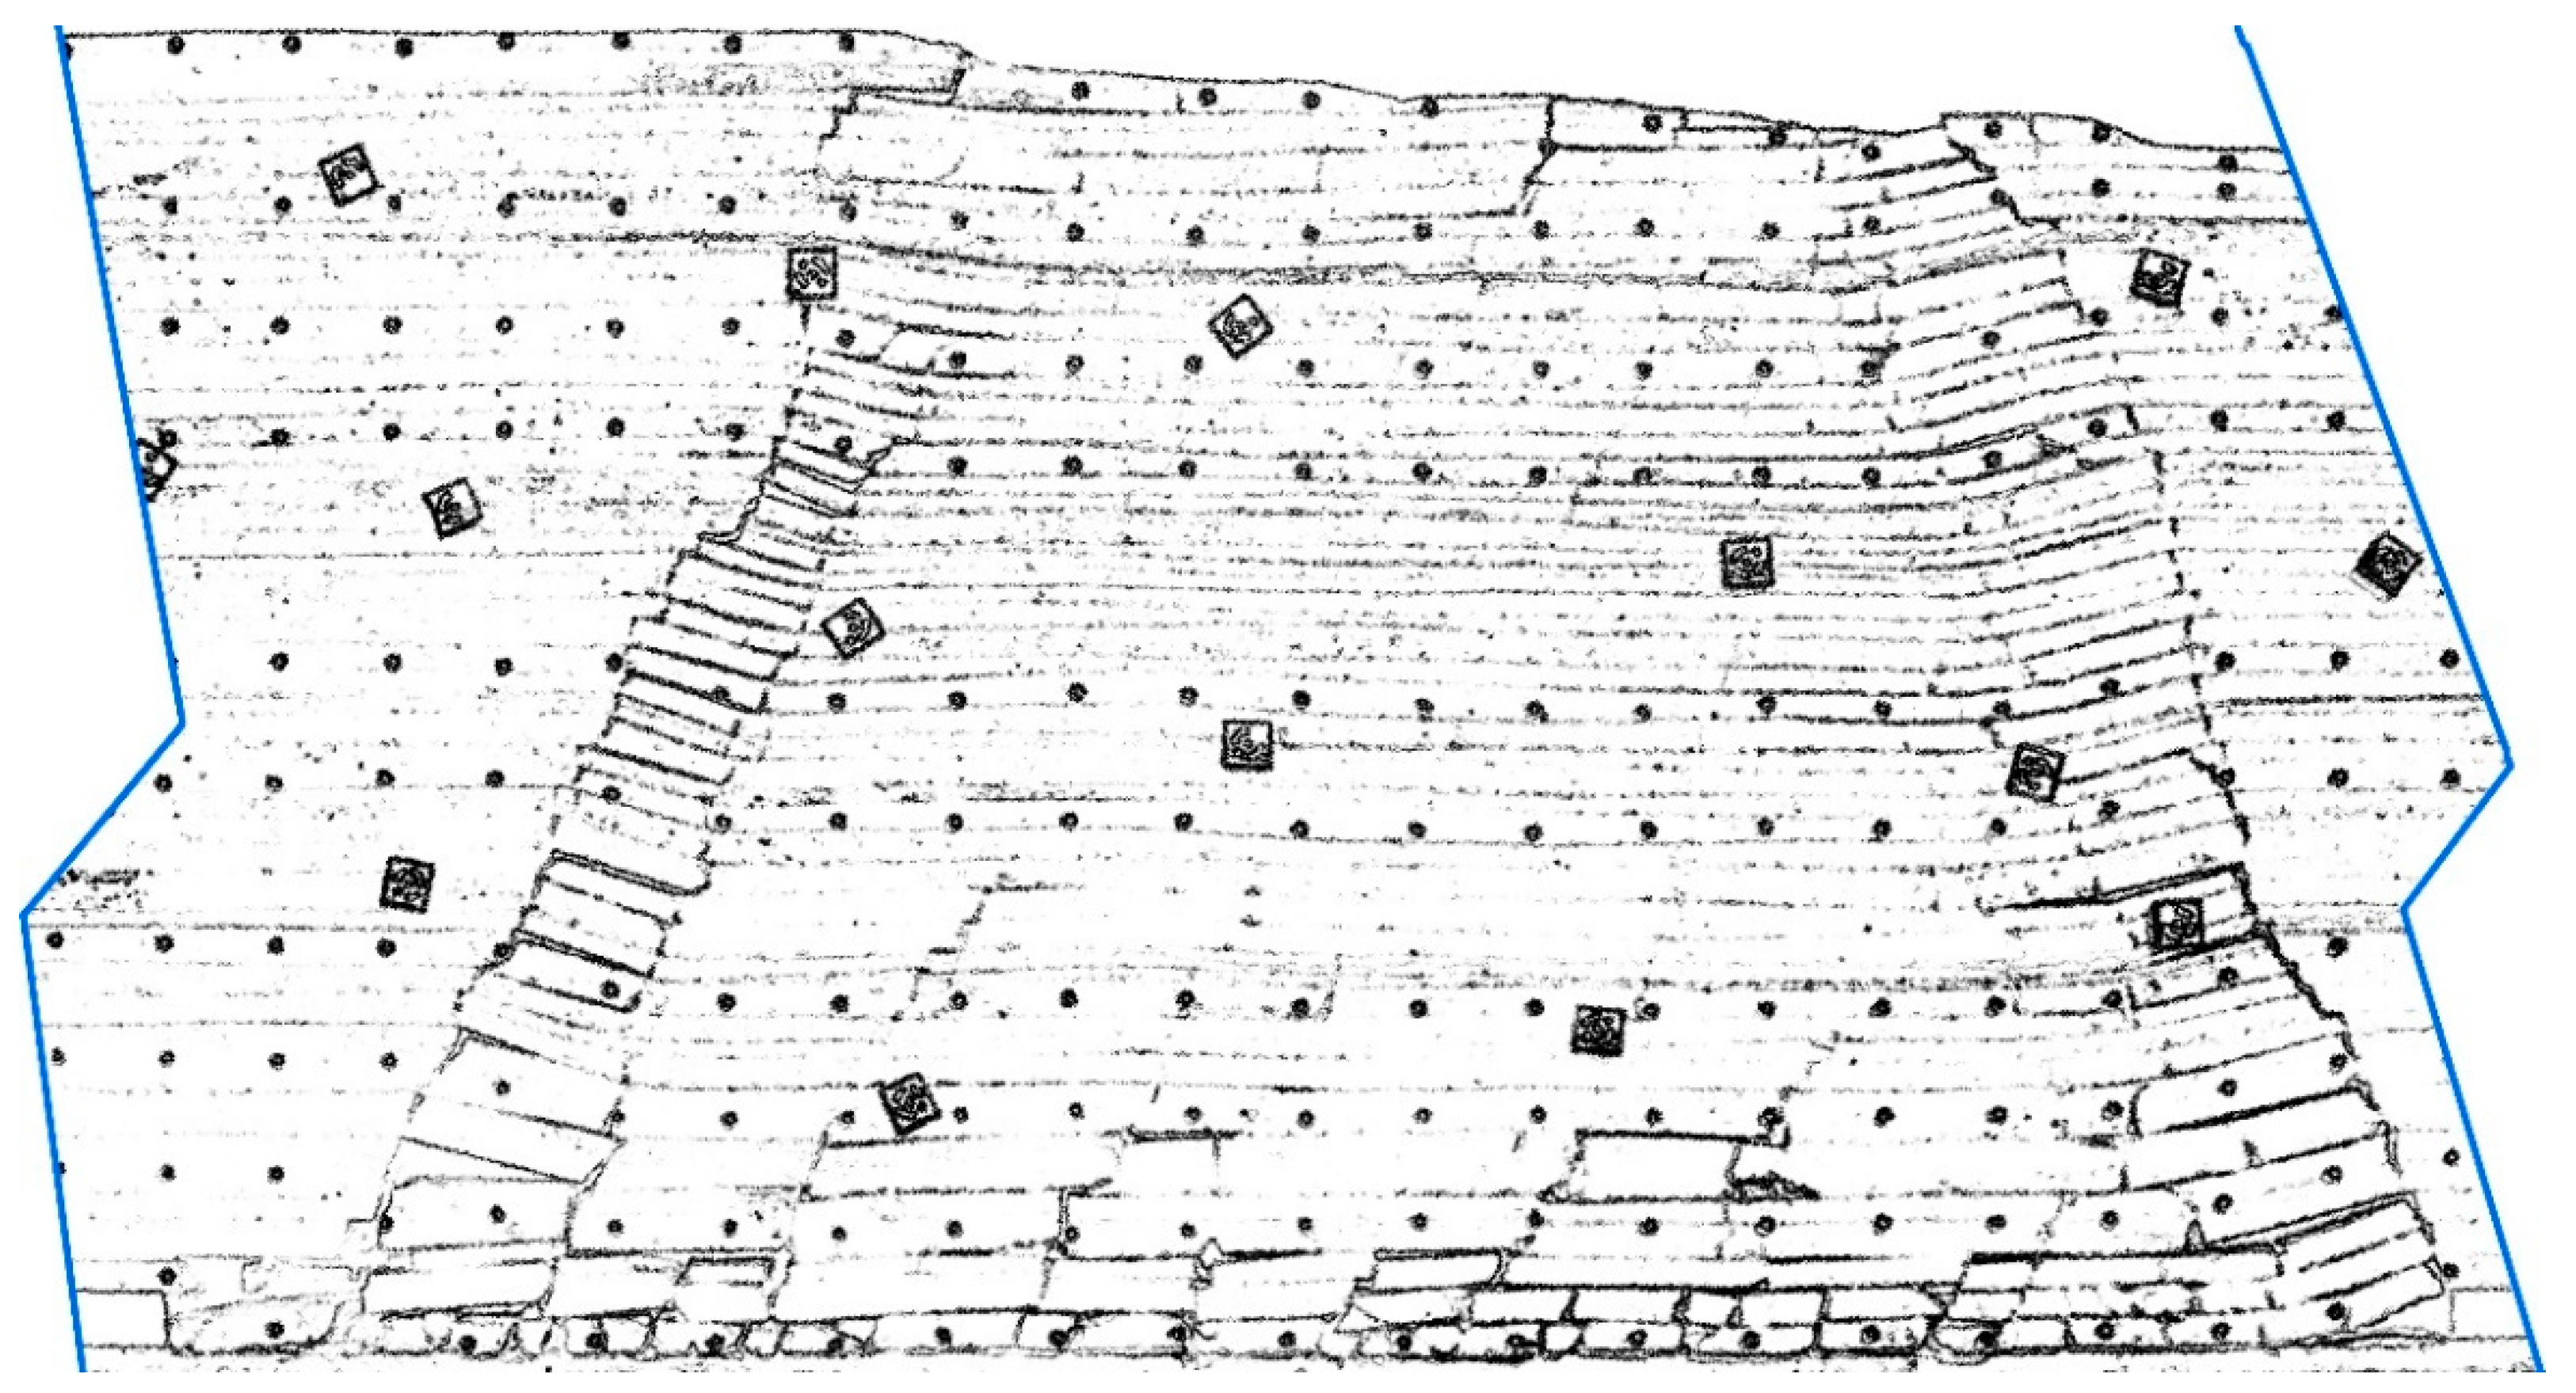
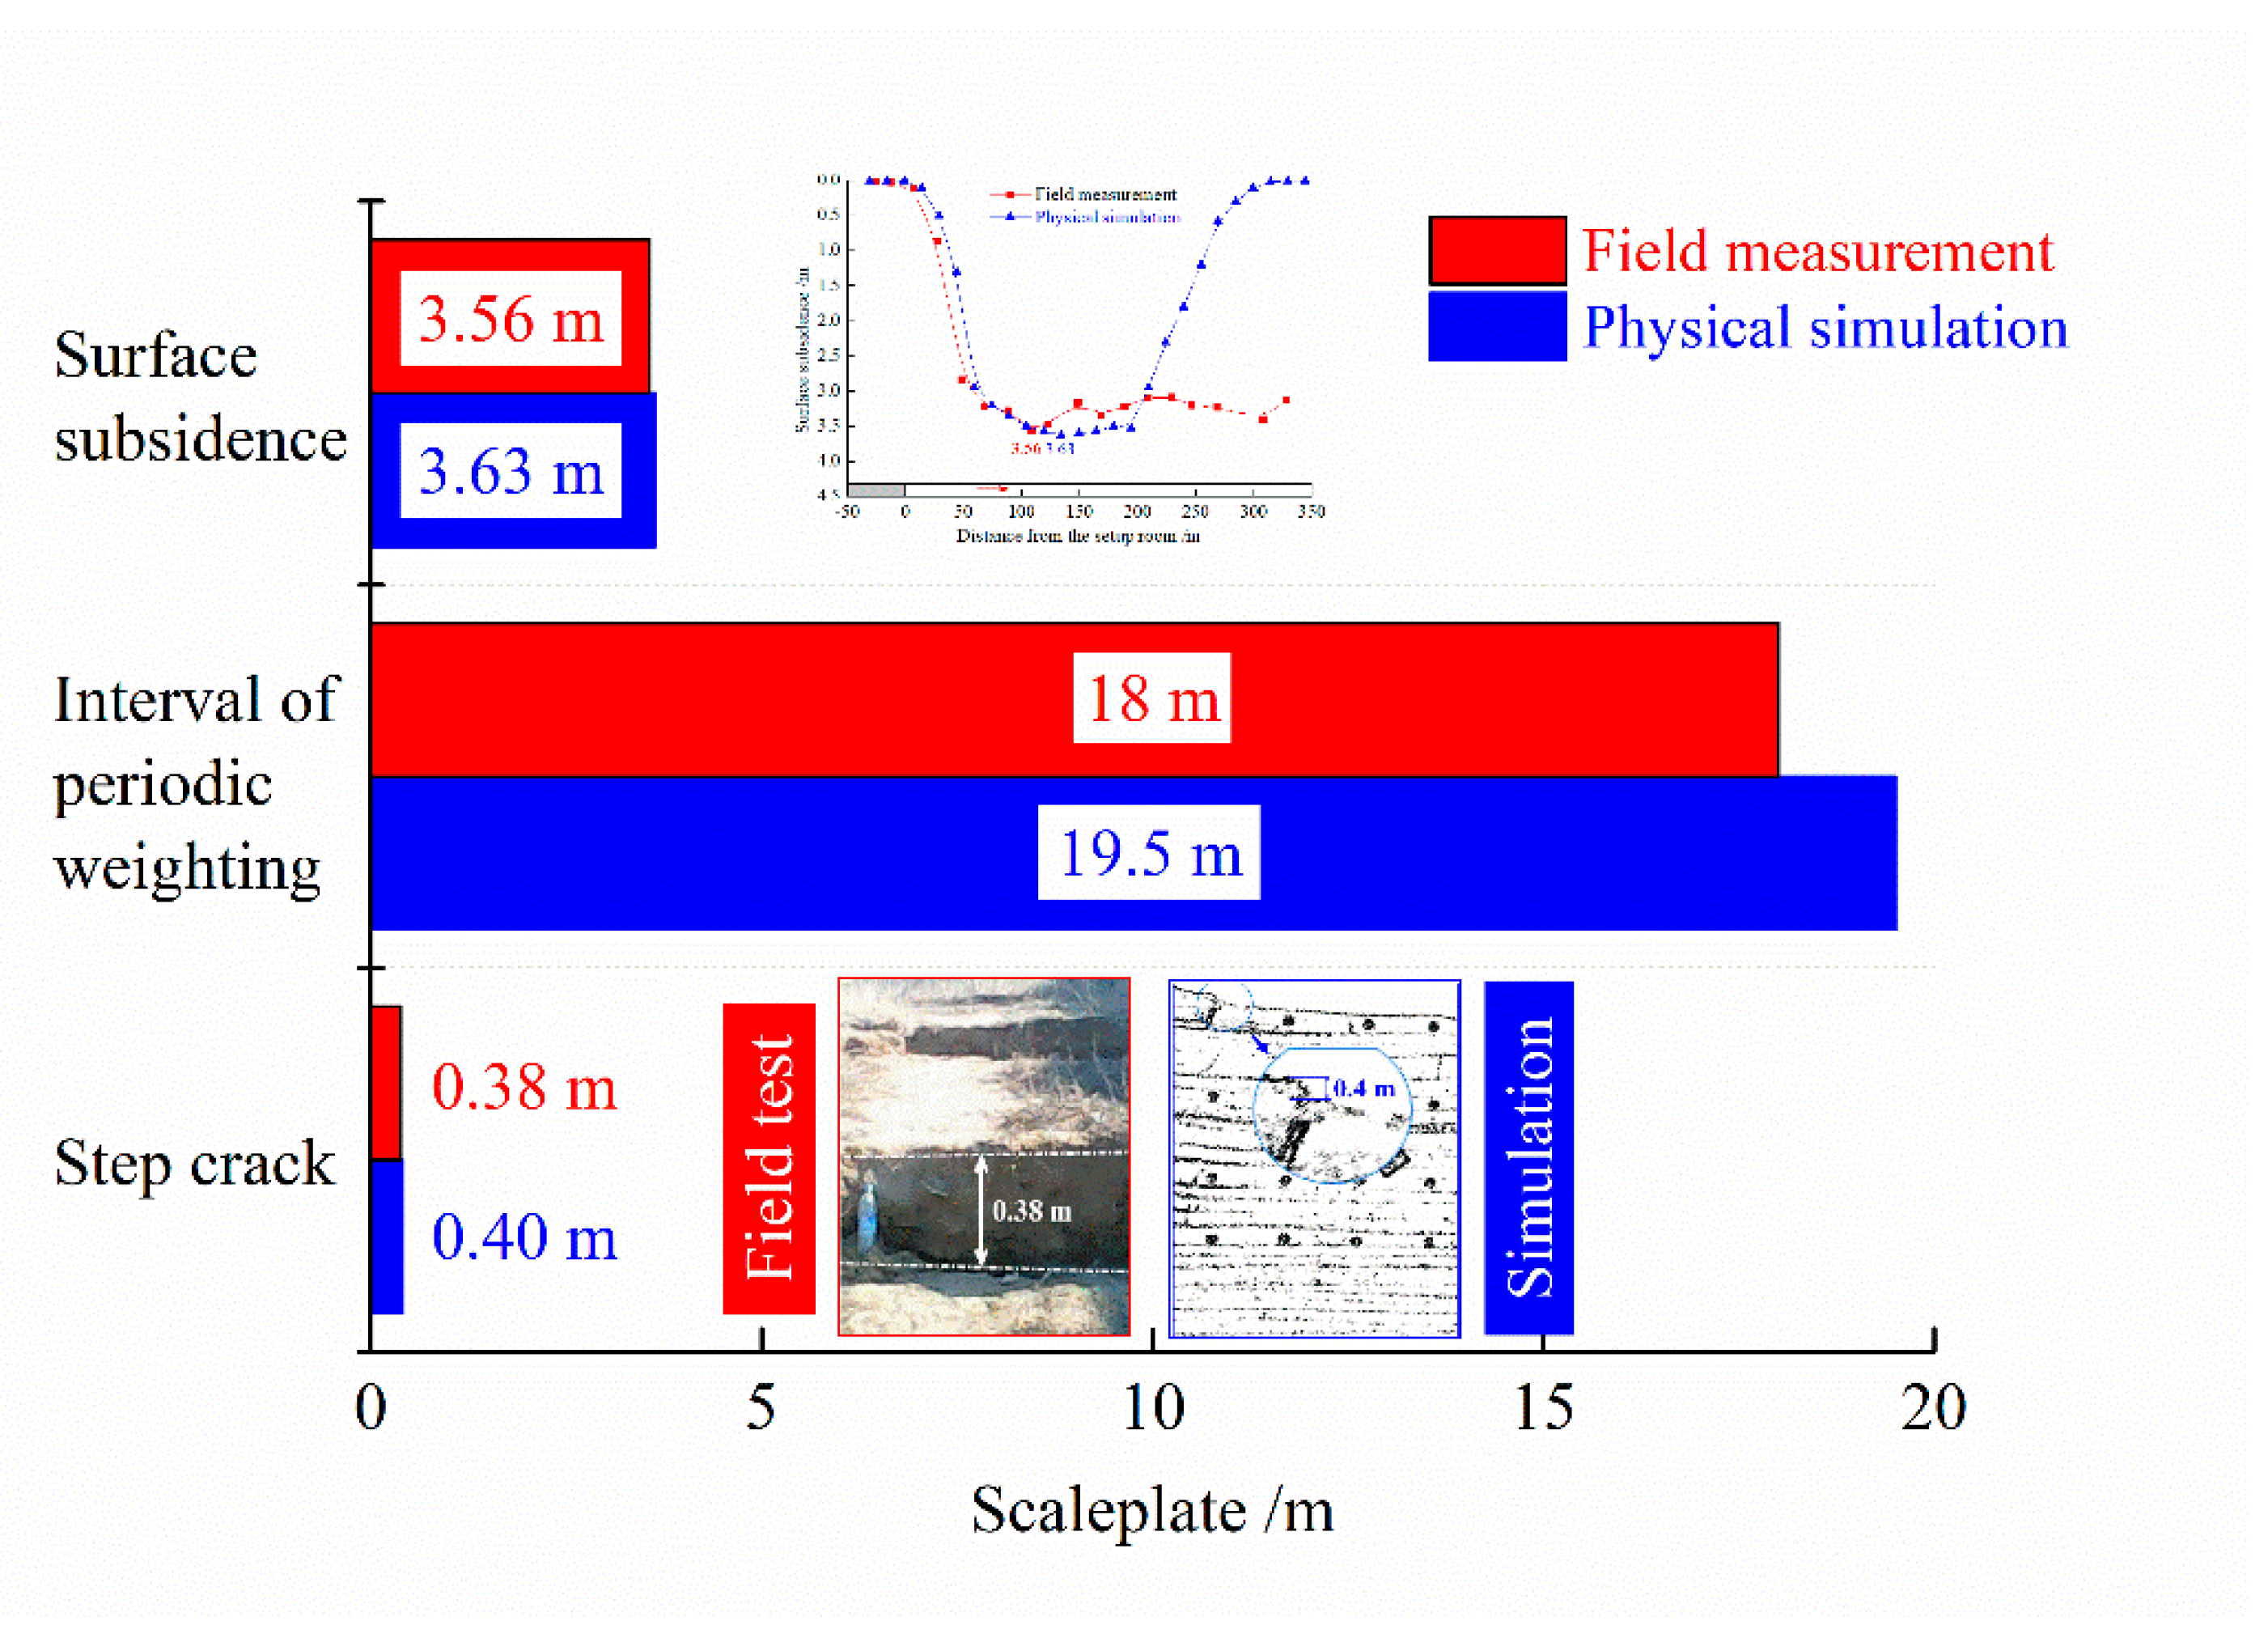
4.3. Validation of the Physical Simulation

Considering the geological conditions and the test-bed size (length × width × height = 4 m × 0.3 m × 2.2 m), the similarity coefficient of model is determined based on the principles of moderate size, easy to construct, similar and effective, easy to observe, and objective and reliable: Geometric similarity is 1/70, time similarity is 1/8.366, bulk density is similar to 0.6, and the strength and elastic modulus are both 0.00857. A 50 m coal pillar is reserved on both sides of the model. Combined with the field advance speed and similarity coefficient, the model is advanced 0.1 m each time from right to left. During the mining process, the coding and non-coding points on the model surface are observed by a three-dimensional optical photogrammetry system (XJTUDP). The sketch of the overburden failure pattern when advanced 300 m is shown in Figure 9, and the comparison between simulation and field measurement from surface subsidence, interval of periodic weighting and step crack is shown in Figure 10.
As shown in Figure 9, the collapse of overburden strata in high-intensity mining is intense, and significantly sudden and discontinuous. Combined with the strata collapse during the advancing process, the interval of periodic weighting is 18~21 m, with an average of 19.5 m; the step cracks formed on the surface is 0.4 m when the fracture zone passes through ground surface and the maximum surface subsidence is 3.63 m. It should be noted that, because of the simplification of the strata in the physical simulation, it is not completely consistent with the actual measurement on the surface subsidence curve, but its trend and shape are basically the same. Therefore, it can be considered that the physical simulation can approximately reflect the actual movement of overburden and the ground surface. By comparing the simulation with the field measurement (Figure 10), it can be seen that the average interval of periodic weighting is 18 m, and the step cracks with 0.38 m and a maximum surface subsidence with 3.56 m, which is basically consistent with the simulation results. Therefore, it can be considered that the height of the caving zone is 21 m, and the water flowing fracture zone is greater than 90 m, which accords with the field and the MT method.

5. Conclusions

(1)
On the basis of explaining the basic principles and influencing factors of the MT method, the surface MT method detection test is carried out in goaf. Combined with field ground drilling, the error is only 1.9%, which indicates that the MT method can be applied to the detection of aquifer and overburden failure.
(2)
According to MT detection and physical simulation, the failure characteristic of overburden and unconsolidated aquifers are in accord with each other. Afterwards, the reliability of the physical simulation was verified by field measurement from three aspects. Therefore, the failure characteristics of overburden and aquifers detected by the MT method can reflect the real situation.
(3)
The overburden AR will change significantly under mining influence in the Daliuta coalmine, which can be well displayed in MT detection. The penetrating fractures are the main channel for the downward seepage of water resources, which provides a fast and efficient method for the detection of an unconsolidated aquifer, as well as new technical support for the construction of digital mines.

Author Contributions

E.B., W.G. and D.Z. conceived and designed the research; E.B., Y.T. and M.G. analyzed the data and wrote paper; E.B., M.G. and G.Z. collected the measured data; all authors have read and agreed for submission.

Funding

This research was funded by National Natural Science Foundation of China (51774111), Key Project of the National Natural Science Foundation of China (U1810203), Open Fund of State Key Laboratory of Water Resource Protection and Utilization in Coal Mining (GJNY-18-76.13) and Innovation and Outstanding Talent Project of Henan Province Science and Technology (184200510003).

Acknowledgments

This research was financially supported by National Natural Science Foundation of China (51774111), Key Project of the National Natural Science Foundation of China (U1810203), Open Fund of State Key Laboratory of Water Resource Protection and Utilization in Coal Mining (GJNY-18-76.13) and Innovation and Outstanding Talent Project of Henan Province Science and Technology (184200510003).

Conflicts of Interest

The authors declare no conflict of interest.

References

  1. Bai, E.H.; Guo, W.B.; Tan, Y. Negative externalities of high-intensity mining and disaster prevention technology in China. Bull. Eng. Geol. Environ. 2019, 78, 5219–5235. [Google Scholar] [CrossRef]
  2. Li, M.; Zhang, J.X.; Huang, Y.L.; Gao, R. Measurement and numerical analysis of influence of key stratum breakage on mine pressure in top-coal caving face with super great mining height. J. Cent. South Univ. 2017, 24, 1881–1888. [Google Scholar] [CrossRef]
  3. Ju, J.F.; Xu, J.L. Structural characteristics of key strata and strata behaviour of a fully mechanized longwall face with 7.0 m height chocks. Int. J. Rock Mech. Min. Sci. 2013, 58, 46–54. [Google Scholar] [CrossRef]
  4. Ju, F.; Xiao, M.; He, Z.Q.; Ning, P.; Huang, P. Study on fracture and stress evolution characteristics of ultra-thick hard sandstone roof in the fully mechanized mining face with large mining height: A case study of Xiaojihan Coal Mine in Western China. Adv. Civ. Eng. 2018, 2018, 1–12. [Google Scholar] [CrossRef]
  5. Fan, L.M. On coal mining intensity and geo-hazard in Yulin-Shenmu-Fugu mining area. China Coal 2014, 40, 52–55. [Google Scholar]
  6. Guo, W.B.; Bai, E.H.; Yang, D.M. Study on the technical characteristics and index of thick coal seam high-intensity mining in coalmine. J. China Coal Soc. 2018, 43, 2117–2125. [Google Scholar]
  7. Guo, W.B.; Wang, Y.G. The definition of high-intensity mining based on green coal mining and its index system. J. Min. Saf. Eng. 2017, 34, 616–623. [Google Scholar]
  8. Song, B.; Zhang, S.; Zhang, D.S.; Fan, G.W.; Yu, W.; Zhao, Q.; Liang, S.S. Inorganic cement grouting for reinforcing triangular zone of highly gassy coal face with large mining height. Energies 2018, 11, 2549. [Google Scholar] [CrossRef]
  9. Zhang, Z.Z.; Yu, X.Y.; Wu, H.; Deng, M. Stability control for gob-side entry retaining with supercritical retained entry width in thick coal seam longwall mining. Energies 2019, 12, 1375. [Google Scholar] [CrossRef]
  10. Li, B.; Liang, Y.P.; Zou, Q.L. Determination of working resistance based on movement type of the first subordinate key stratum in a fully mechanized face with large mining height. Energy Sci. Eng. 2019, 7, 777–798. [Google Scholar] [CrossRef]
  11. Zhang, D.S.; Fan, G.W.; Ma, L.Q.; Wang, X.F. Aquifer protection during longwall mining of shallow coal seams: A case study in the Shendong Coalfield of China. Int. J. Coal Geol. 2011, 86, 190–196. [Google Scholar] [CrossRef]
  12. Yin, X.W. Cutting block structure model of overburden with shallow buried coal seam and ultra-large mining height working face. J. China Coal Soc. 2019, 44, 1961–1970. [Google Scholar]
  13. Wen, Z.J.; Xing, E.R.; Shi, S.S.; Jiang, Y.J. Overlying strata structural modeling and support applicability analysis for large mining-height stopes. J. Loss Prev. Process Ind. 2019, 57, 94–100. [Google Scholar] [CrossRef]
  14. Ma, X.G.; He, M.C.; Sun, J.D.; Wang, H.H.; Liu, X.Y.; Zhen, E.Z. Neural network of roof cutting blasting parameters based on mines with different roof conditions. Energies 2018, 11, 3468. [Google Scholar] [CrossRef]
  15. Chen, X.J.; Li, L.Y.; Guo, Z.B.; Chang, T.H. Evolution characteristics of spontaneous combustion in three zones of the goaf when using the cutting roof and release pressure technique. Energy Sci. Eng. 2019, 7, 710–720. [Google Scholar] [CrossRef]
  16. Wang, Y.J.; Gao, Y.B.; Wang, E.Y.; He, M.C.; Yang, J. Roof deformation characteristics and preventive techniques using a novel non-pillar mining method of gob-side entry retaining by roof cutting. Energies 2018, 11, 627. [Google Scholar] [CrossRef]
  17. Yang, J.Z. Research on key mining technology of fully-mechanized working face with 8 m large mining height. Coal Sci. Technol. 2017, 45, 9–14. [Google Scholar] [CrossRef]
  18. Bai, E.H.; Guo, W.B.; Tan, Y.; Yang, D.M. The analysis and application of granular backfill material to reduce surface subsidence in China’s northwest coal mining area. PLoS ONE 2018, 13, e0201112. [Google Scholar] [CrossRef]
  19. Lei, S.G.; Bian, Z.F. Research progress on the environment impacts from underground coal mining in arid western area of China. Acta Ecol. Sin. 2014, 34, 2837–2843. [Google Scholar]
  20. Yang, Z.; Li, W.P.; Pei, Y.B.; Qiao, W.; Wu, Y.L. Classification of the type of ecogeological environment of a coal mine district: A case study of an ecologically fragile region in Western China. J. Clean Prod. 2018, 174, 1513–1526. [Google Scholar] [CrossRef]
  21. Fan, L.M.; Xiang, M.X.; Peng, J.; Li, C.; Li, Y.H.; Wu, B.Y.; Bian, H.Y.; Gao, S.; Qiao, X.Y. Groundwater response to intensive mining in ecologically fragile area. J. China Coal Soc. 2016, 41, 2672–2678. [Google Scholar]
  22. Saraf, A.K.; Choudhury, P.R. Integrated remote sensing and GIS for groundwater exploration and identification of artificial recharge sites. Int. J. Remote Sens. 1998, 19, 1825–1841. [Google Scholar] [CrossRef]
  23. Siemon, B.; Vhristiansen, A.V.; Auken, E. A review of helicopterborne electromagnetic methods for groundwater exploration. Near. Surf. Geophys. 2009, 7, 629–646. [Google Scholar] [CrossRef]
  24. Yang, D.; Guo, W.; Tan, Y. Application of magnetotelluric method to the detection of overburden failure height in shallow seam mining. Arab. J. Geosci. 2018, 11, 350. [Google Scholar] [CrossRef]
  25. Yang, W.Y. Integrated geophysical prospecting principle and method of explorating the water enrichment of coal mine collapse column. J. Min. Saf. Eng. 2013, 30, 45–50. [Google Scholar]
  26. Asaue, H.; Sasahara, M.; Yoshinaga, T.; Obara, Y.; Uchida, K.; Matsumoto, H. Clarifying geological structure for coal and marsh gas development using magnetotelluric method. Acta Geodyn. Geomater. 2013, 10, 155–162. [Google Scholar] [CrossRef]
  27. Hu, Z.Z.; He, Z.X.; Yang, W.C.; Hu, X.Y. Constrained inversion of magnetotelluric data with the artificial fish swarm optimization method. Chin. J. Geophys. 2015, 58, 2578–2587. [Google Scholar]
  28. Nigel, R.; Graham, H.; Lars, K. Magnetotelluric monitoring of coal seam gas depressurization. Geophysics 2016, 81, 423–432. [Google Scholar]
  29. Li, J.; Pang, Z.H.; Kong, Y.L.; Lin, F.L.; Wang, Y.L.; Wang, G.J.; Lv, L.H. An integrated magnetotelluric and gamma exploration of groundwater in fractured granite for small-scale freshwater supply: A case study from the Boshan region, Shandong Province, China. Environ. Earth Sci. 2017, 76, 163. [Google Scholar] [CrossRef]
  30. Zhang, R.Z.; Li, T.L.; Zhou, S.; Deng, X.H. Joint MT and gravity inversion using structural constraints: A case study from the Linjiang copper mining area, Jilin, China. Minerals 2019, 9, 407. [Google Scholar] [CrossRef]
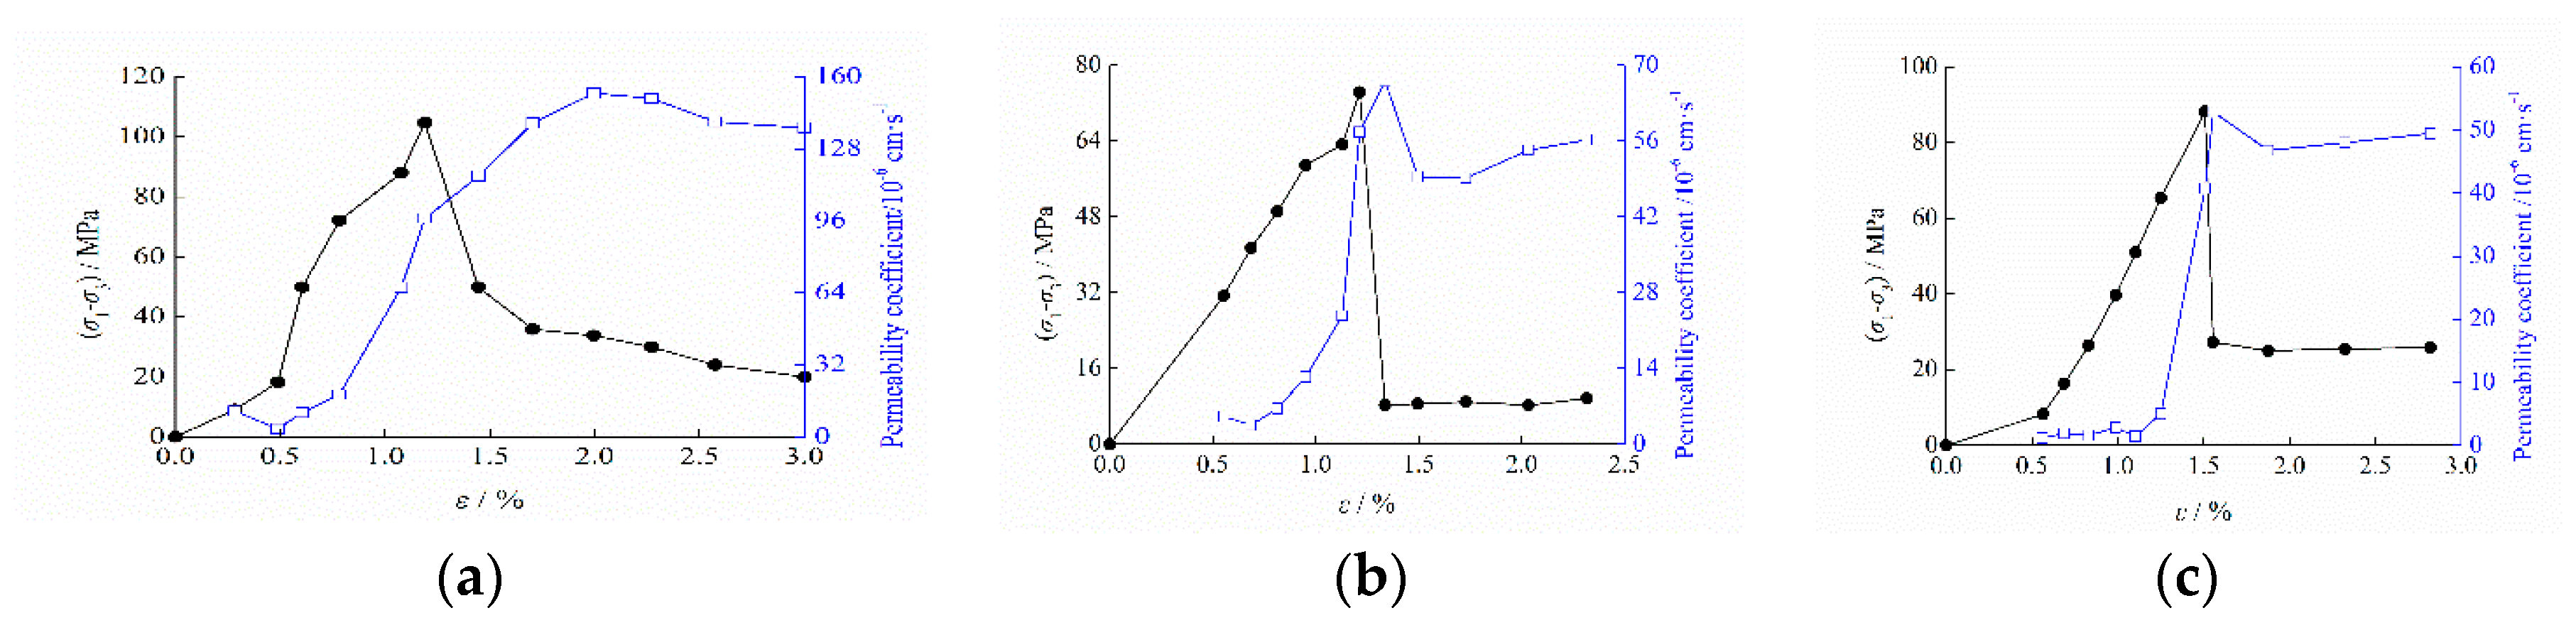
  31. Sun, Q.; Feng, Y.; Zhu, S.Y.; Yang, C.; Xue, L. Analysis on the relation between resistivity and permeability of saturated rock during loading process. Coal Geol. Explor. 2012, 40, 86–90. [Google Scholar]
  32. Wang, G.; Wu, M.M.; Wang, R.; Xu, H.; Song, X. Height of the mining-induced fractured zone above a coal face. Eng. Geol. 2017, 216, 140–152. [Google Scholar] [CrossRef]
  33. Wen, Z.J.; Jing, S.L.; Jiang, Y.J.; Tian, L.; Wen, J.H.; Cao, Z.G.; Shi, S.S.; Zuo, Y.J. Study of the fracture law of overlying strata under water based on the flow-stress-damage model. Geofluids 2019, 2019, 1–12. [Google Scholar] [CrossRef]
  34. Gao, B.B.; Liu, Y.P.; Pan, J.Y.; Yuan, T. Detection and analysis of height of water flowing fractured zone in underwater mining. Chin. J. Rock Mech. Eng. 2014, 33, 3384–3390. [Google Scholar]
  35. Wang, F.T.; Tu, S.H.; Zhang, C.; Zhang, Y.W.; Bai, Q.S. Evolution mechanism of water-flowing zones and control technology for longwall mining in shallow coal seams beneath gully topography. Environ. Earth Sci. 2016, 75, 1309. [Google Scholar] [CrossRef]
  36. Guo, W.B.; Lou, G.Z.; Zhao, B.C. Study on the height of water-conductive fracture zone in alternate overburden of soft and hard with top coal caving mining in Lugou coal mine. J. Min. Saf. Eng. 2019, 36, 519–526. [Google Scholar]
Figure 1. “Two-zone” model in overlying strata under high-intensity mining.
Energies 12 04397 g001
Figure 2. Relation between servo-controlled and stress permeability under saturated condition [29]; (a) Limestone; (b) Fine sandstone; (c) Medium sandstone.
Energies 12 04397 g002
Figure 3. Diagram of the drilling structure.
Energies 12 04397 g003
Figure 4. Leakage of drilling fluid and the water level depth measured on site. (a) Relationship between leakage of fluid and drilling depth. (b) Relationship between water depth and borehole depth.
Energies 12 04397 g004
Figure 5. Surface topography and measuring points’ layout of the 52,505 working face.
Energies 12 04397 g005
Figure 6. The apparent resistivity contour of overburden before mining.
Energies 12 04397 g006
Figure 7. Apparent resistivity (AR) contour of line A before and after mining. (a) Before mining and (b) after mining.
Energies 12 04397 g007
Figure 8. AR contours of line B under different mining conditions (a) During mining and (b) after mining.
Energies 12 04397 g008
Figure 9. Sketch drawing of overburden failure at 300 m.
Energies 12 04397 g009
Figure 10. Comparison of physical simulation and field measurement.
Energies 12 04397 g010

