1. Introduction
As the global population grows and the Earth’s natural resources diminish, electric vehicles have been rapidly developed in recent years. When used in electric vehicles, lithium-ion batteries possess advantages, such as high energy density, long lifespans, no memory effect, environmental benignity, good stability, and affordability, when compared to other battery types, such as lead-acid batteries. As such, they are quickly becoming the first choice of battery type for electric vehicles.
The state of health (SOH) of batteries can be estimated, which provides useful information for battery management systems (BMS). Accurate capacity degradation modeling plays a significant role in battery prognostics and health management (PHM), as state of charge (SOC) estimation is related to battery capacity. Capacity prediction is very important for reliable operation and reduced maintenance costs of the battery management system [
1].
Both model-based and data-based methods can be used to predict capacity fade. The data-based methods include fuzzy logic, artificial neural networks (ANN) [
2,
3], support-vector machines (SVM) [
4], particle filters (PF) [
5], unscented Kalman filters (UKF) [
6], data-driven methods based on the Wiener process [
7], and based on an autoregressive model [
8]. The data-based methods for making SOH predictions are more complex as they require large amounts of data. Therefore, these methods are more suitable for making remaining useful life (RUL) predictions than online estimations.
Model-based methods capture the long-term dependencies of battery degradation based on mathematical aging models. The aging models can be divided into three categories: empirical models [
9,
10,
11], mechanical degradation models [
12,
13], and equivalent circuit models [
14,
15]. An empirical model can be obtained through the historical data mining of accelerated aging experiments. It is most commonly used in SOH predictions due to its mathematical simplicity, wide range of validity, and good adaptability. Examples of empirical models include the NREL Model [
16], the Wang Model [
17], and the MOBICUS Model [
18]. Empirical models take into consideration the influence of factors such as temperature, SOC, depth of discharge (DOD), and discharge rate [
19,
20], but the quantitative analysis of these factors is still limited [
21,
22,
23,
24,
25,
26].
There are two different battery degradation scenarios of which to be mindful. One is calendar aging, which concerns the deterioration of battery characteristics when the battery is at storage. It is related to temperature and SOC. The other is cycle aging, which concerns the deterioration of battery characteristics with continuous use. It is related to temperature, discharge rate, and DOD [
9].
Grolleau et al. proposed a simple modeling approach under time-dependent storage conditions (SOC and temperature) for making calendar aging predictions [
18]. Experiments show that the deviation of predicted capacity based on that proposed model never exceeded 3% over 400 days and 5% over 625 days, but it is worth noting that Grolleau et al. used a calendar aging model that did not consider cycle aging. Cui et al. developed a multi-stress factor model that accounted for factors such as temperature, discharge rate, taper voltage, and depth of discharge for making battery cycle life predictions [
21]. The practical applicability of this multi-stress factor model was proven by experimental data, but as the model did not consider calendar life predictions, it is therefore only suitable for making offline batter
y cycle life predictions. In practical automotive applications, calendar aging and cycle aging occur simultaneously. Therefore, it is important that studies of battery SOH predictions account for both calendar and cycle life under actual driving conditions.
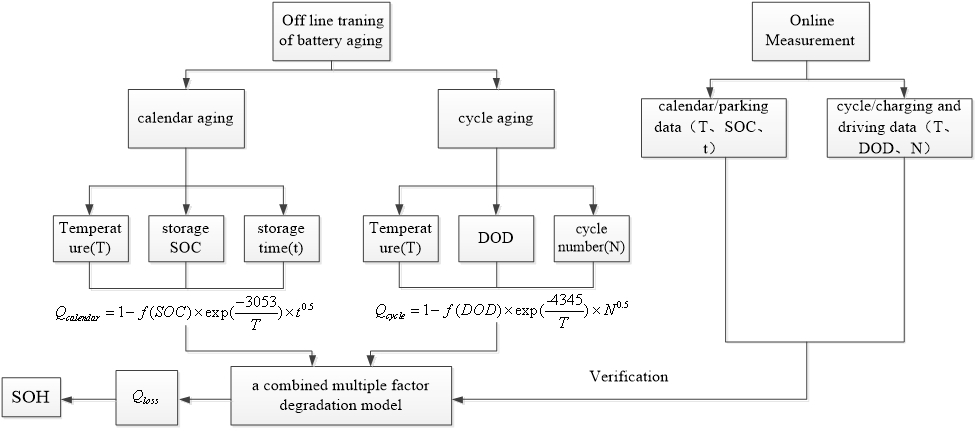
This paper focuses on the impact of stress factors on battery calendar and cycle life. The effects of four factors—temperature, discharge rate, SOC, and DOD—were analyzed. Battery degradation equations related to temperature, SOC, and DOD were formulated. A combined multiple factor model was also formed based on these battery degradation equations, considering both calendar aging and cycle aging. An online SOH prediction method on the basis of the proposed model was conducted under test conditions. The practical applicability of the model was validated by experimental data.
2. Degradation Model
An empirical calendar degradation model was set up as Equation (1) and is shown referring to the Arrhenius equation [
16].
where
is the relative capacity after calendar degradation (Ah),
A is the pre-exponential factor,
T is temperature of cell (K),
is activation energy (Jmol
−1),
R is gas constant (8.314 J/mol/K), 0.5 of
is most widely accepted as a time trend enhancement factor due to the Solid Electrolyte Interface (SEI) layer growth [
13], and
t is storage time.
The cycle degradation model is built similarly to the calendar one according to battery degradation mechanisms [
9,
16,
17].
where
is the relative capacity of cycle degradation (Ah),
B is the pre-exponential factor, and
N is the cycle number.
The parameters of the calendar and cycle degradation model were obtained by recursive least squares (RLS).
3. Experiment and Discussion
The batteries used were INR18650-33G batteries made by Samsung. Battery parameters were as shown in
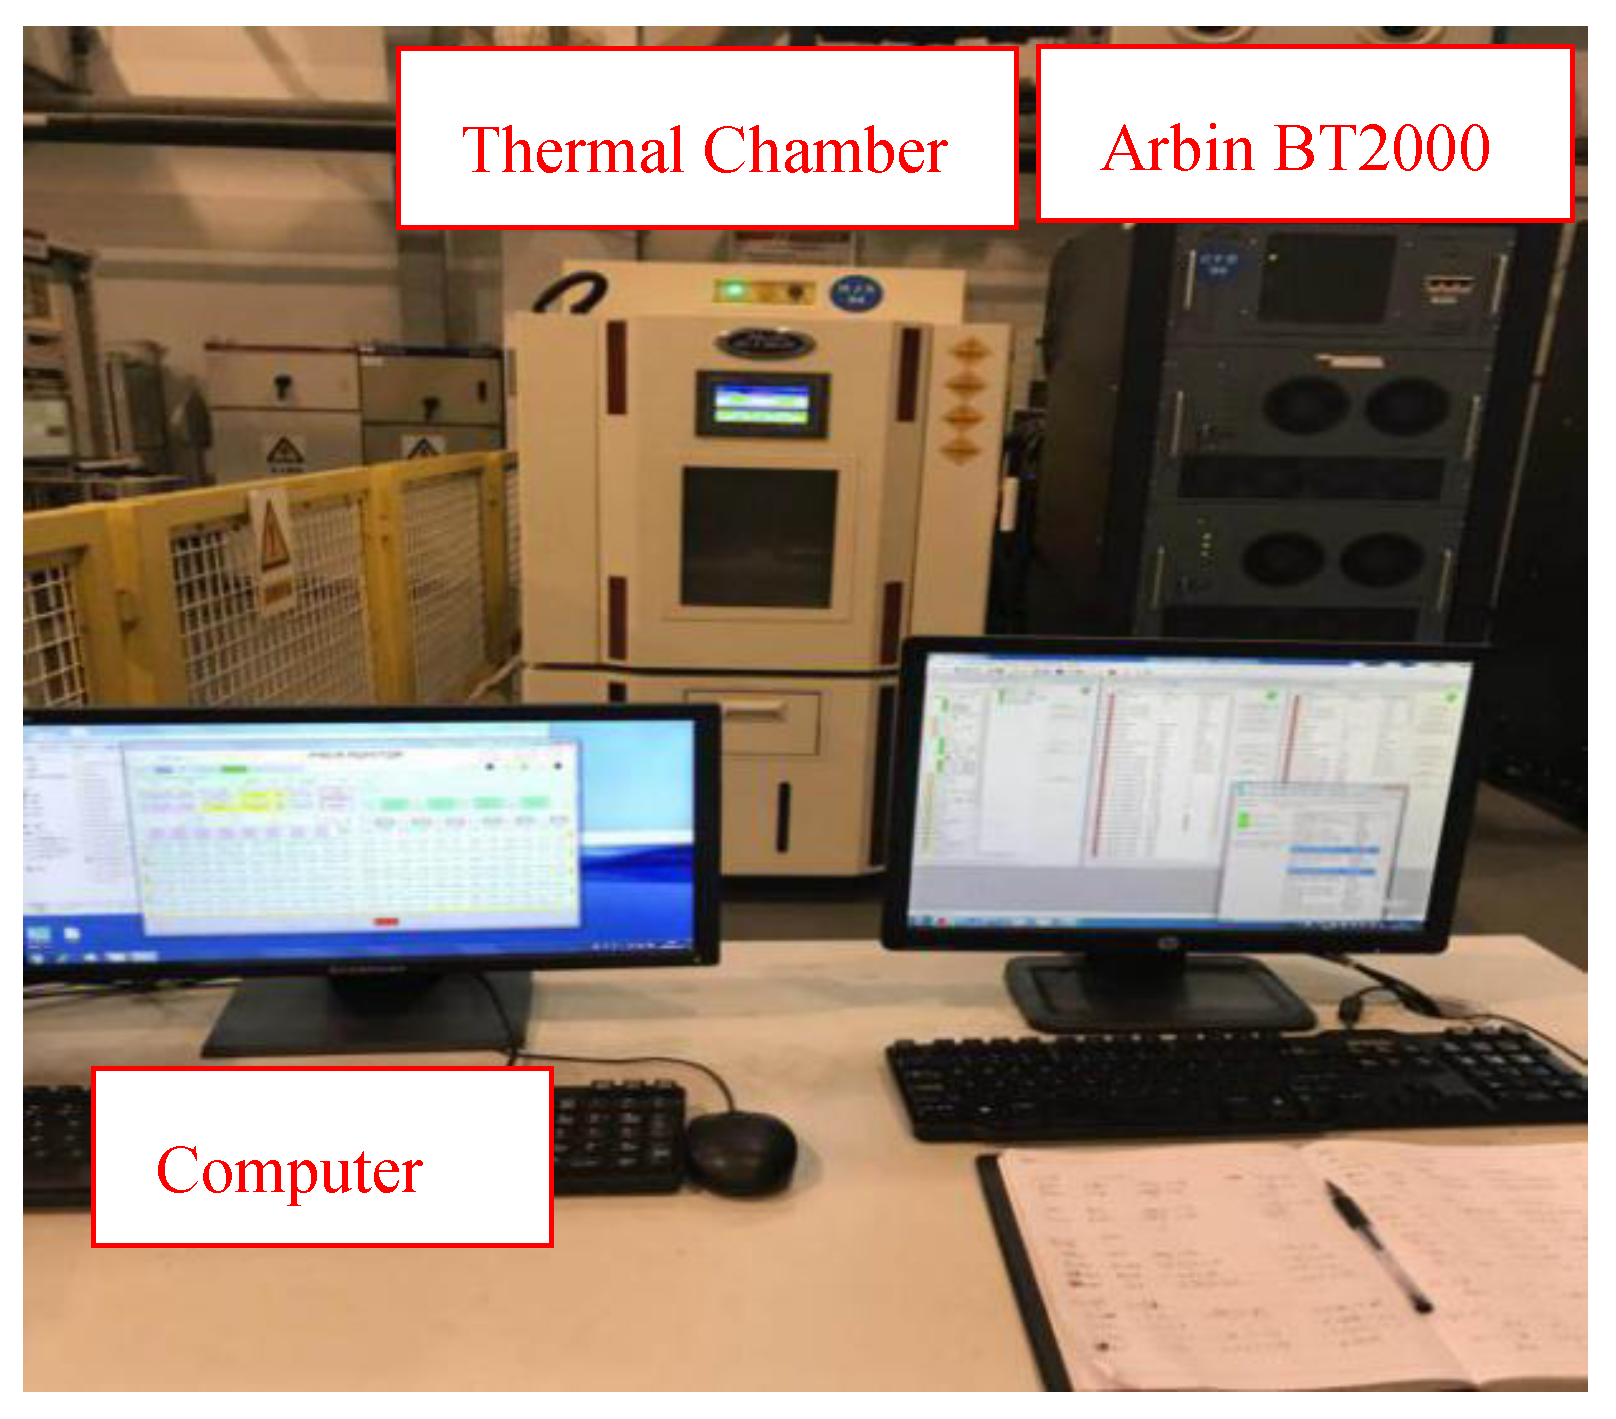
Table 1. The experimental data were collected via the battery test platform. The main test instruments, as shown in
Figure 1, were a charge and discharge test system for lithium batteries (Arbin BT2000) and a thermal chamber for environmental control (HL T402P made by Haoyuan Environmental Testing Equipment Co., Ltd in Qongqing).
Before the experiments, the static capacity test was conducted at 25°. It provided a reference for measuring the nominal capacity of a fresh cell. During the test, two cells were charged at 0.5 C in a constant-current constant-voltage mode to the upper cutoff voltage of – 4.1 V. The test would stop when the current was at 0.03 C (0.06 A). The cells were left to rest for one hour without load, in order for them to stabilize. They were then discharged at 0.5 C to the lower cutoff voltage of – 2.5 V. The cells were again left to rest for an hour without load to stabilize. This cycle was repeated twice, and the average capacity of the battery was taken as a reference.
The calendar and cycle aging experiments were conducted respectively under different conditions according to national standards of automotive applications (GBT 31484-2015).
3.1. Calendar Aging Experiments
Two parameters have been investigated in calendar aging experiments: temperature and SOC. Three groups of six 18,650 cells with a 2780 mAh nominal capacity were stored in thermal chambers at three temperatures (25°, 45°, 60°). Six cells were charged at six nominal states of charge: 20%, 40%, 50%, 60%, 80%, and 100%, respectively. The cells were stored for 270 days.
The calendar aging experiments were performed as follows:
The static capacity test was conducted as described in
Section 3;
The cells were charged with 0.5 C in a constant-current mode at 25° to reach six nominal states of charge: 20%, 40%, 50%, 60%, 80%, and 100%;
The cells were stored at 25°, 45°, and 60° for 30 days;
The battery cells were calibrated after step 3;
Steps 2–4 were repeated to test multiple cells.
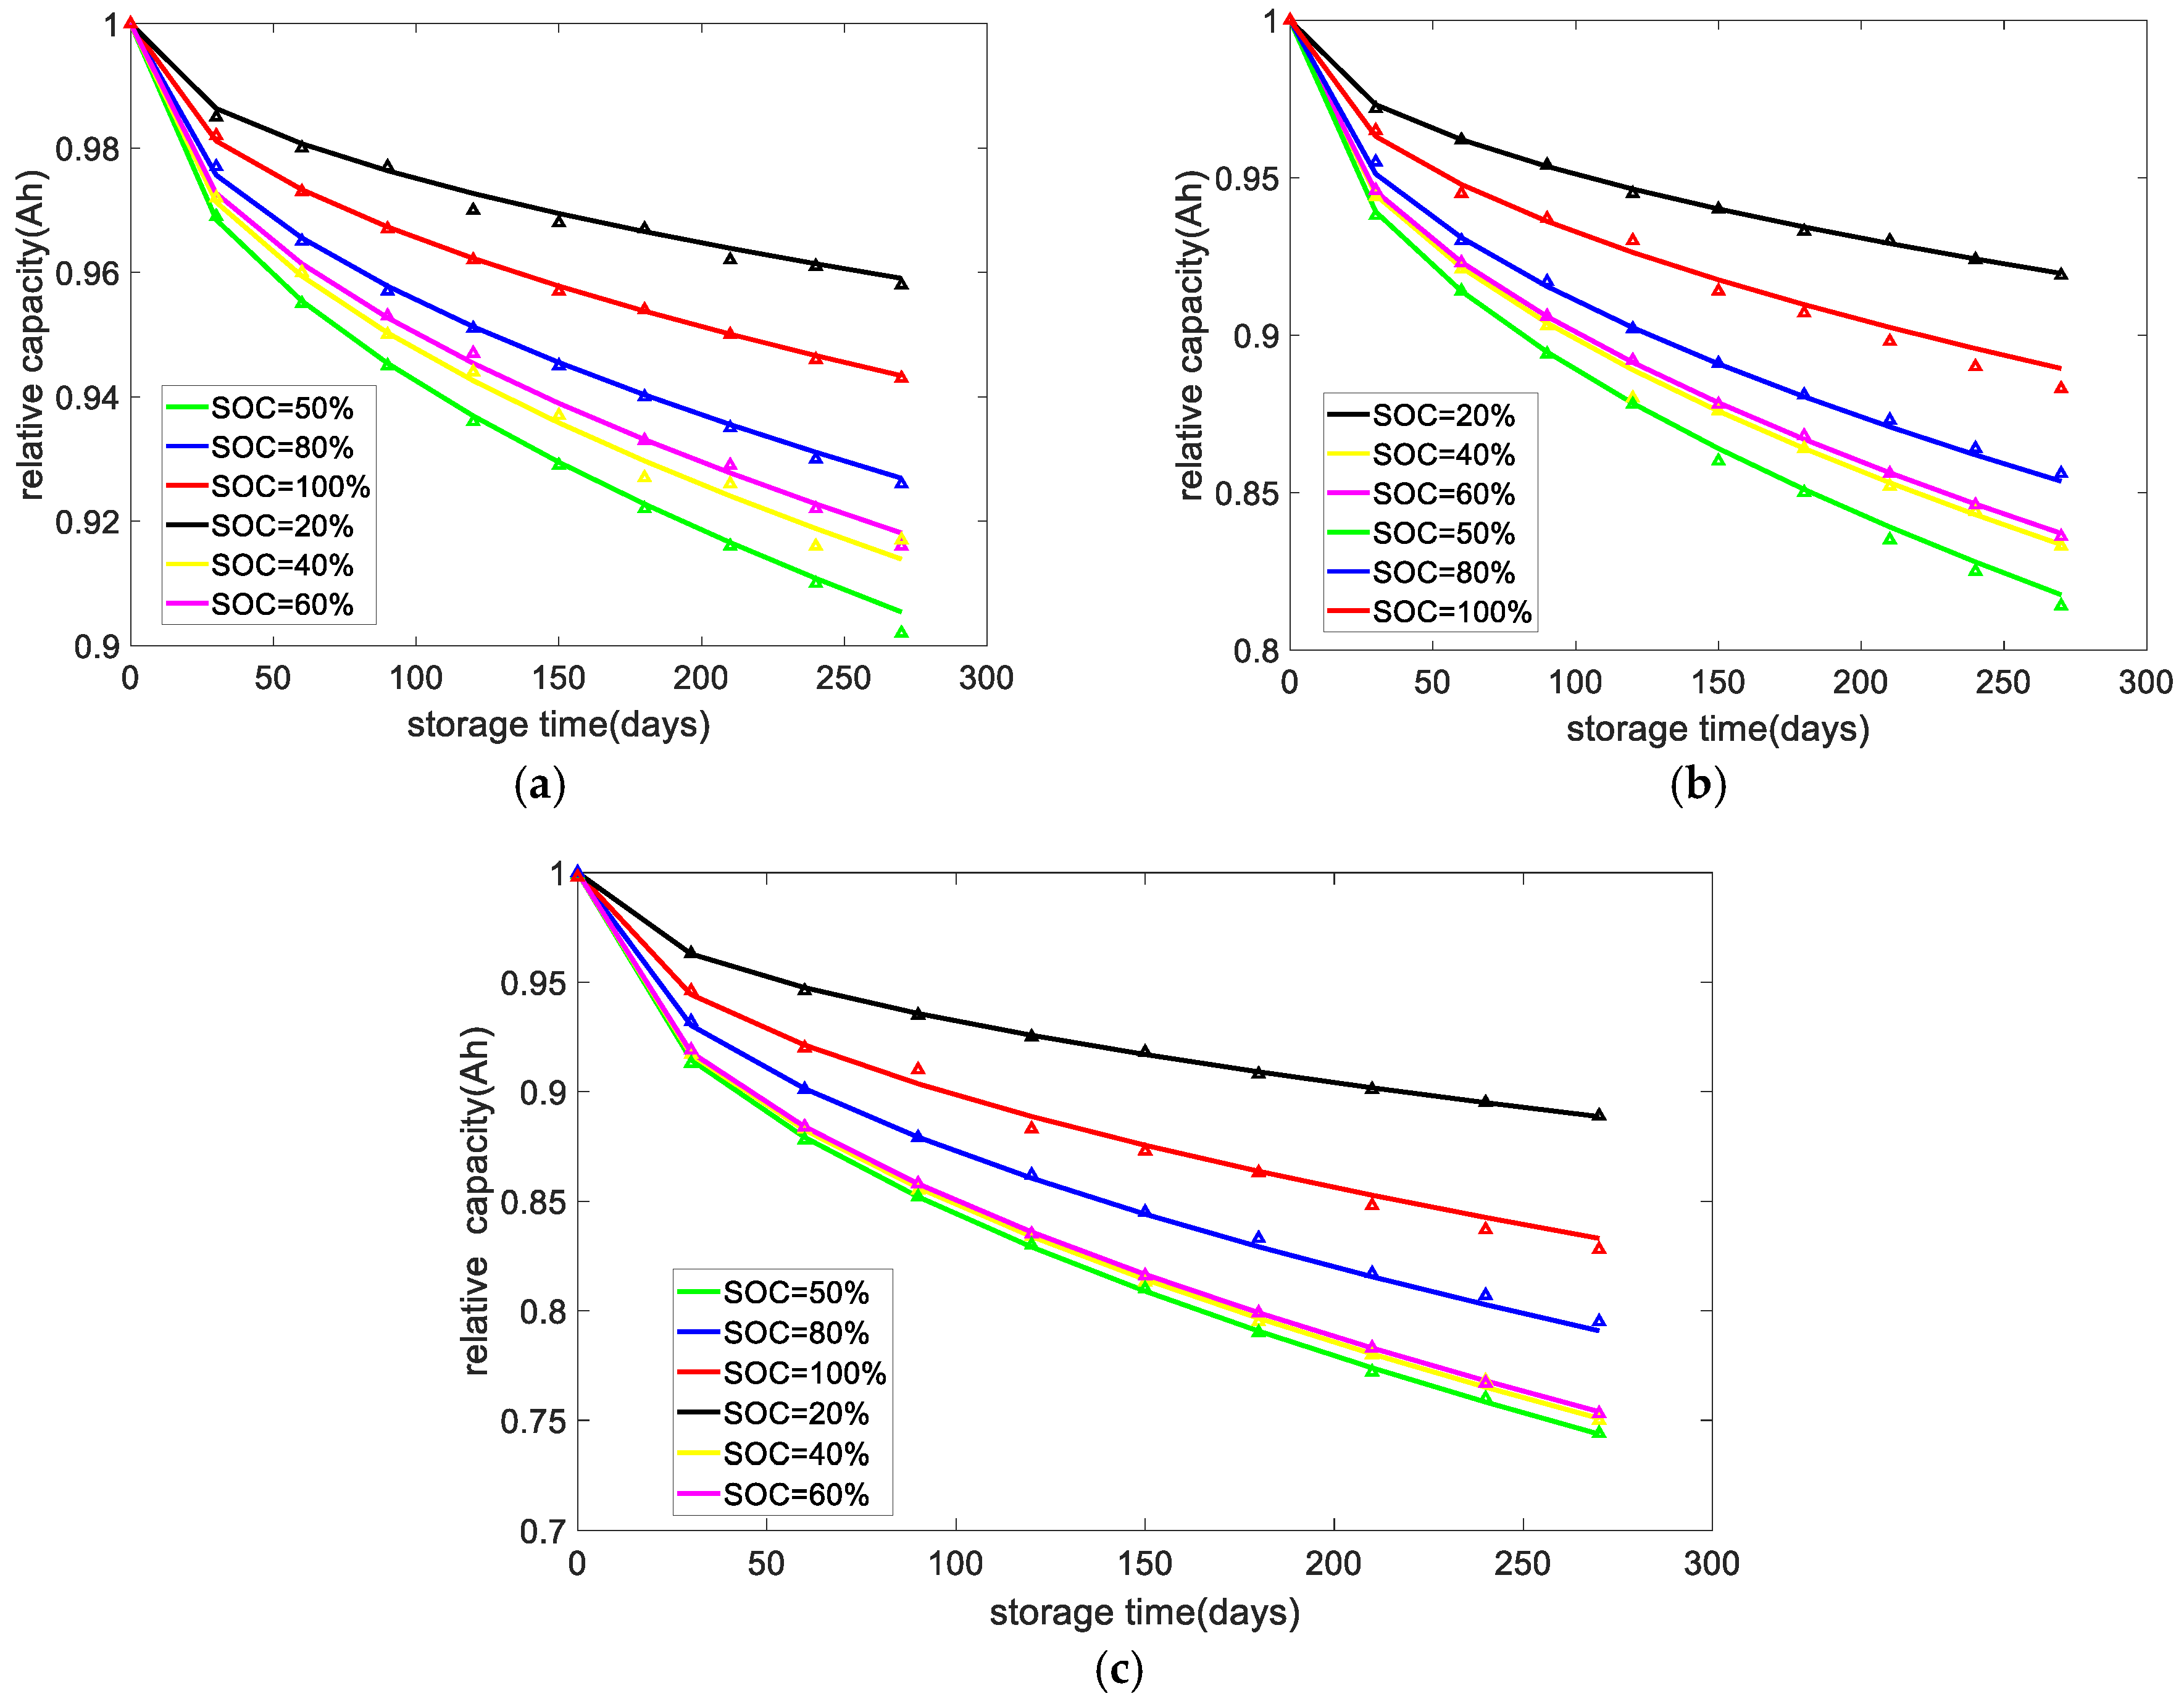
3.1.1. Capacity Fitted Curves
From the calendar aging experiments, a set of corresponding Q, T, and t can be obtained. The experimental data are substituted into the calendar degradation model, and model parameters obtained by the recursive least squares method are shown in
Table 2.
The degradation model fitted with experimental data is shown in
Figure 2. The lines are fitted curves and the triangles are the experimental data. Both the model-fitted data and experimental data agree well. At 60°, the error of capacity is slightly larger than other temperatures.
The battery degradation is mainly caused by the growth of the SEI film on the negative surface of the battery in the early stage of aging (10% before capacity decay). The SEI film is essentially a side reaction byproduct of the electrolyte and the embeddable lithium ion. Its growth rate depends on the decomposition rate of the electrolyte on the surface of the negative electrode. The decomposition belongs to a kind of chemical reaction. It is affected by temperature, anode potential, and concentration of related reactants (such as lithium ions). It can be seen from the calendar experiments that the temperature had a great influence on the battery capacity, and the storage SOC also had a certain degree of influence on it.
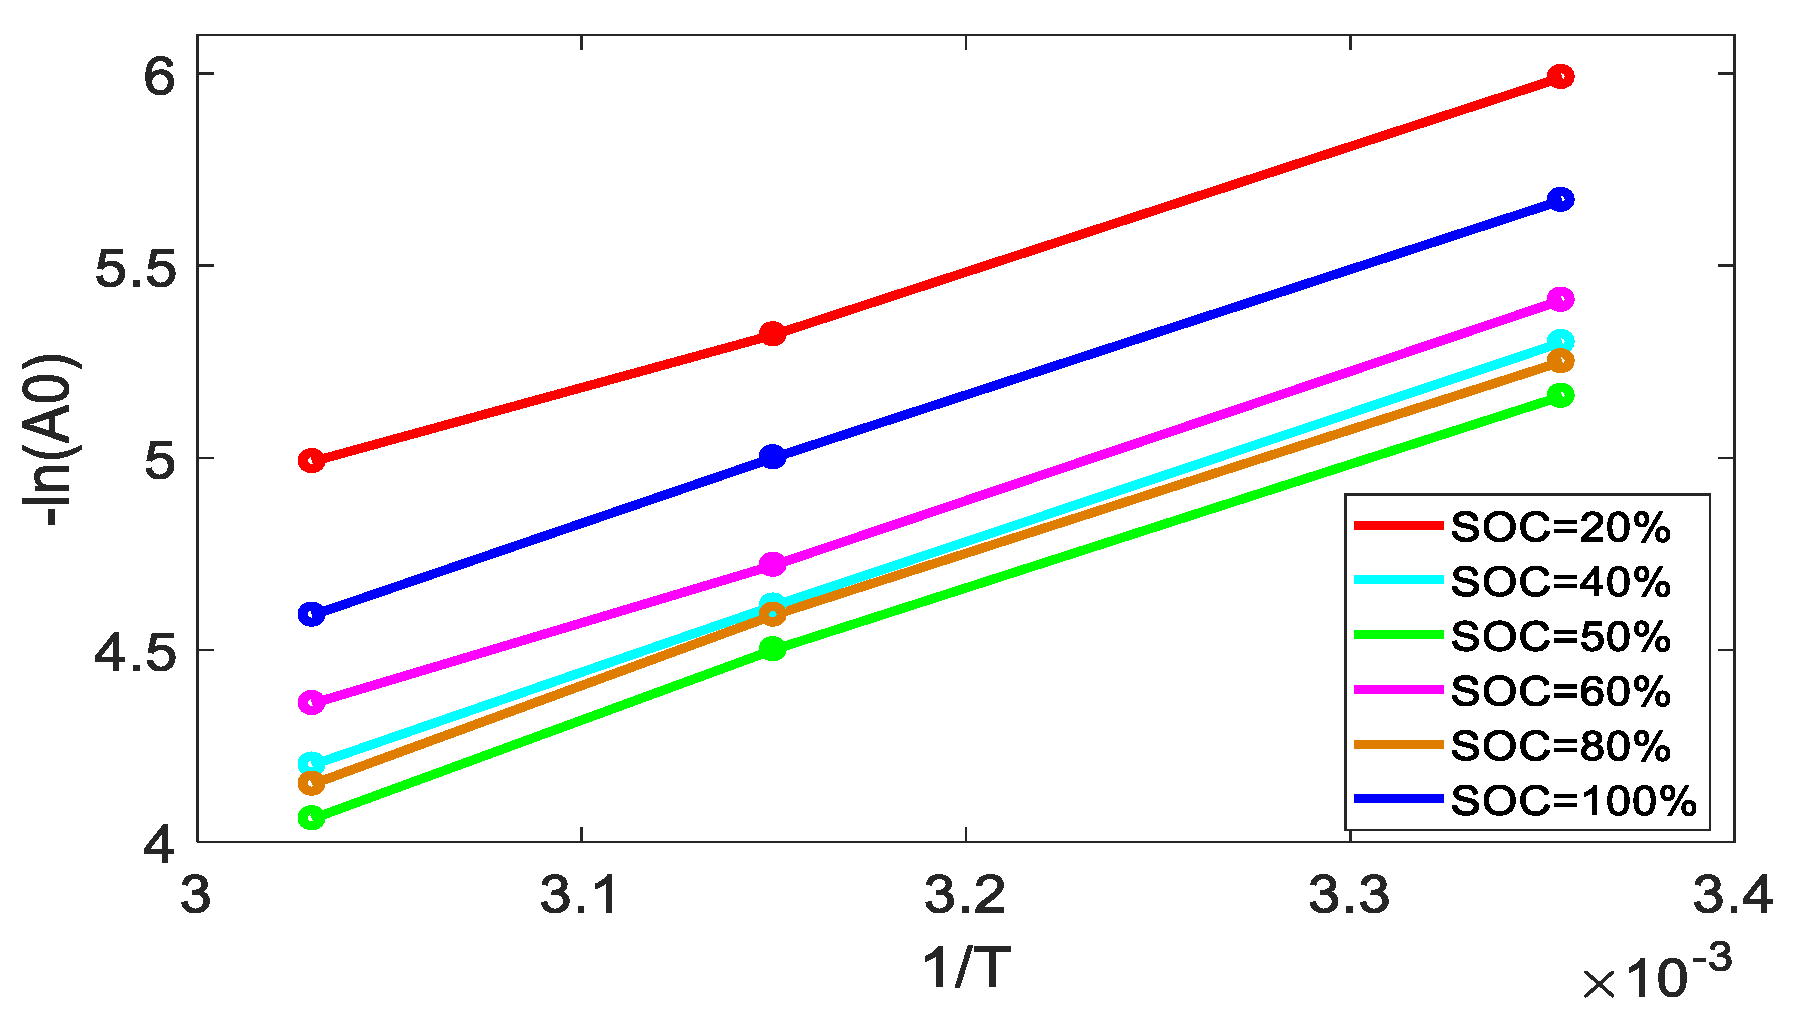
3.1.2. The Analysis of Factors
Due to the formula
, the fitting results of
and
1/T are shown in
Figure 3. On the plot,
are the values of y-intercept and
are the slopes.
can be set to 3053, as the values under different working conditions are nearly identical, which means the values are independent of
SOC and
T. The relationships between
and 1/
T are linear, which means the pre-exponential factor
A is insensitive to
T. The values of
A are determined only by
SOC. The factors of temperature and storage
SOC are irrelevant. A function can be introduced to describe the quantitative relationship of
A with
SOC change [
9].
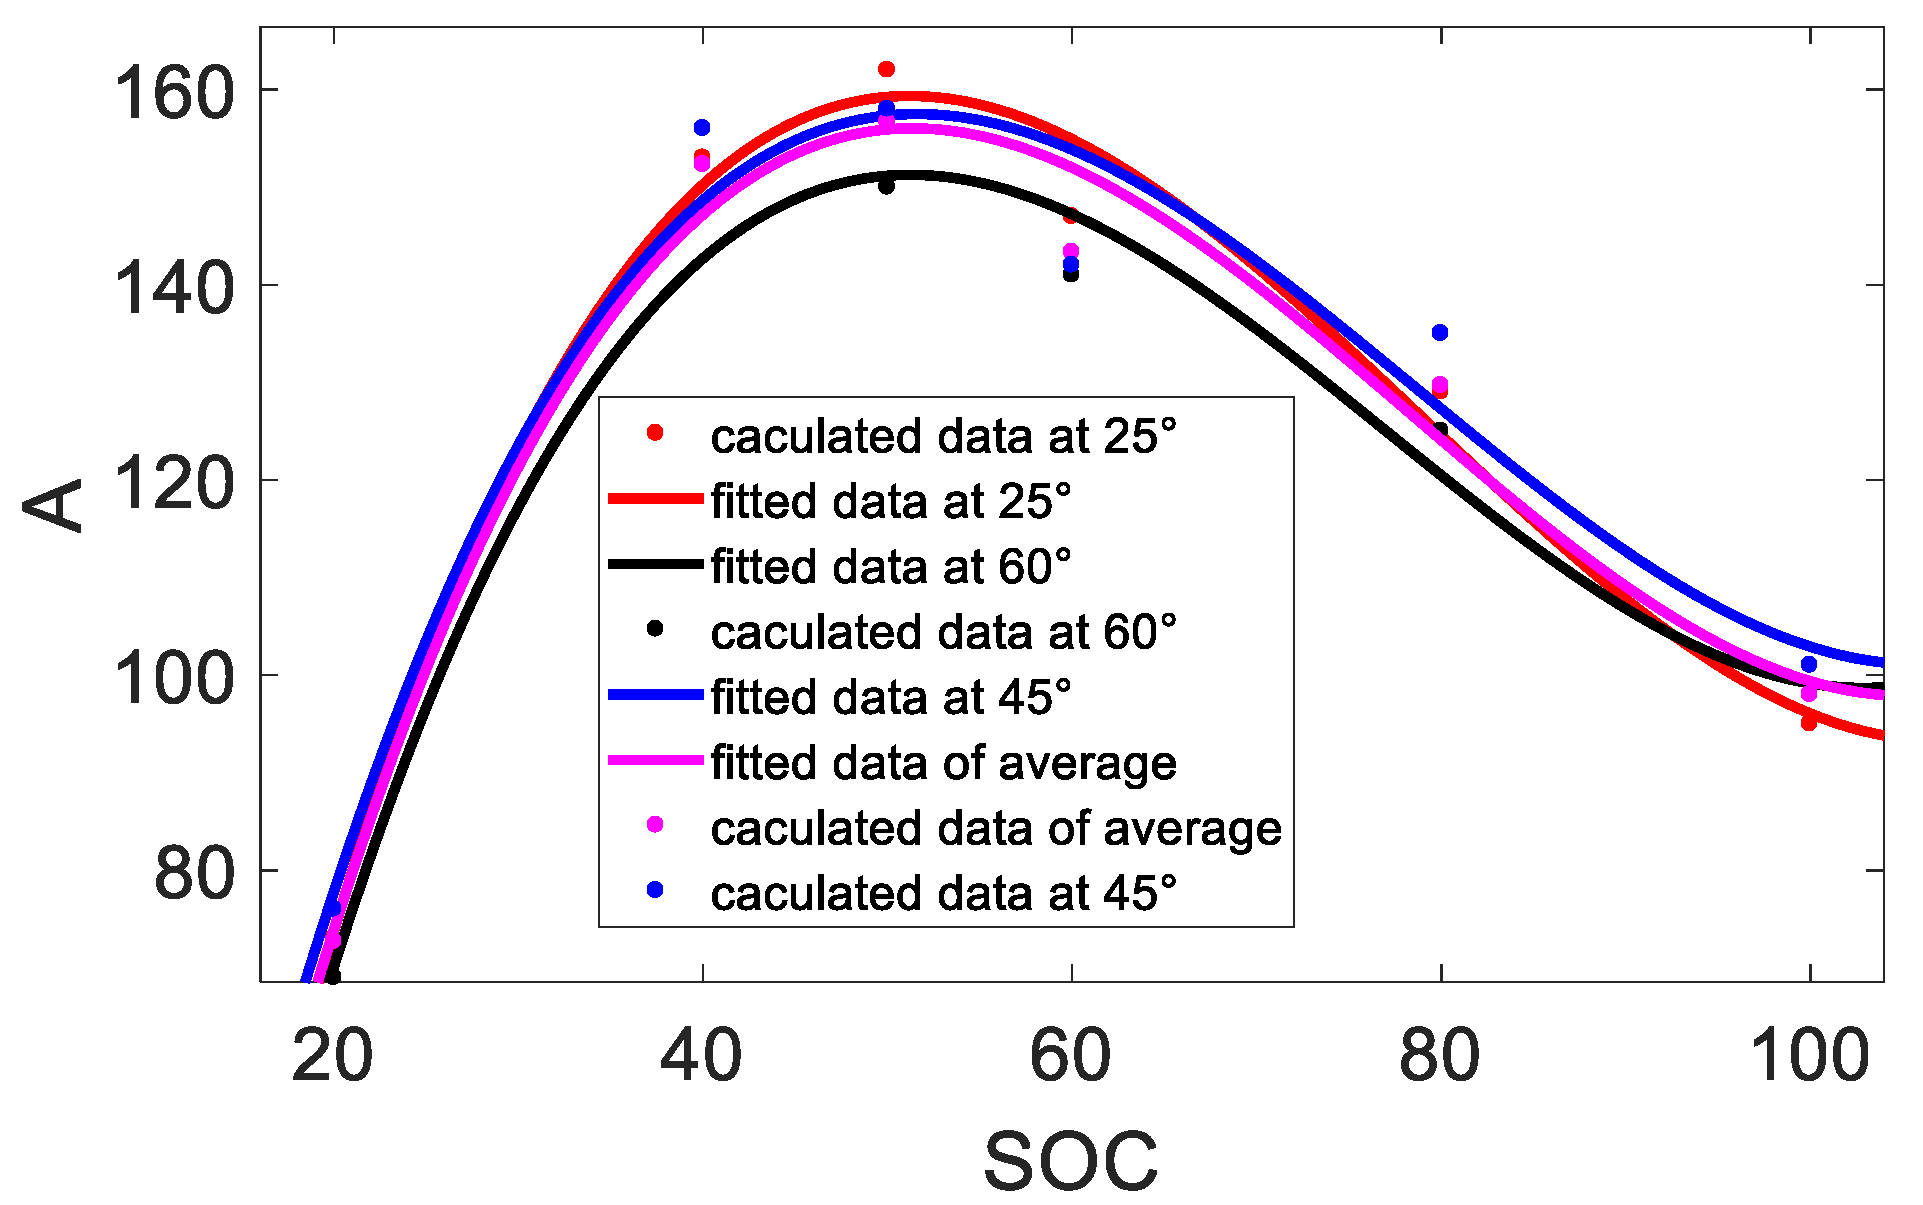
The relationship between
SOC and
A is shown in
Figure 4 using a curve fitting.
At 25°, 45° and 60°, the curves in
Figure 4 change little. Taking average of the three curves, the pre-exponential factor related to
SOC can be formulated as shown in Equation (3):
The calendar capacity can be expressed as Equation (4) by substituting Equation (3) and
into Equation (1).
3.2. Cycle Aging Experiments
Three groups of experiments (temperature aging experiments,
DOD aging experiments, and discharge rates aging experiments) were conducted within 900 cycles.
Table 3 contains all of relevant parameters (discharge rates,
T,
SoC) proposed for each experiment. The capacity data were recorded every 30 cycles.
The cycle temperature aging experiments were performed as follows:
The static capacity test was conducted as described in
Section 3;
The cell was charged with 0.5 C in a constant-current constant-voltage mode until it was fully charged to cutoff voltage;
The test would stop when the current was at 0.03 C, then the cell would be left to rest with no load for one hour to stabilize;
The cell was discharged with 0.5 C in a constant-current mode at 25° to reach 40% SOC;
The cell was then left to rest with no load for 20 minutes;
Steps 2 and 3 were repeated to test 900 cycles.
The procedures of the cycle degradation experiments at 10° and 45° were the same as described above.
The DOD and discharge rate experiments were performed with similar steps to the temperature experiments.
3.2.1. Capacity Fitted Curves
Several sets of corresponding
Q,
T, and
N can be obtained from cycle temperature experiments,
DOD experiments, and discharge rate experiments, respectively. By the RLS method, model parameters at different temperatures,
DOD, and discharge rate were calculated as shown in
Table 4,
Table 5 and
Table 6.
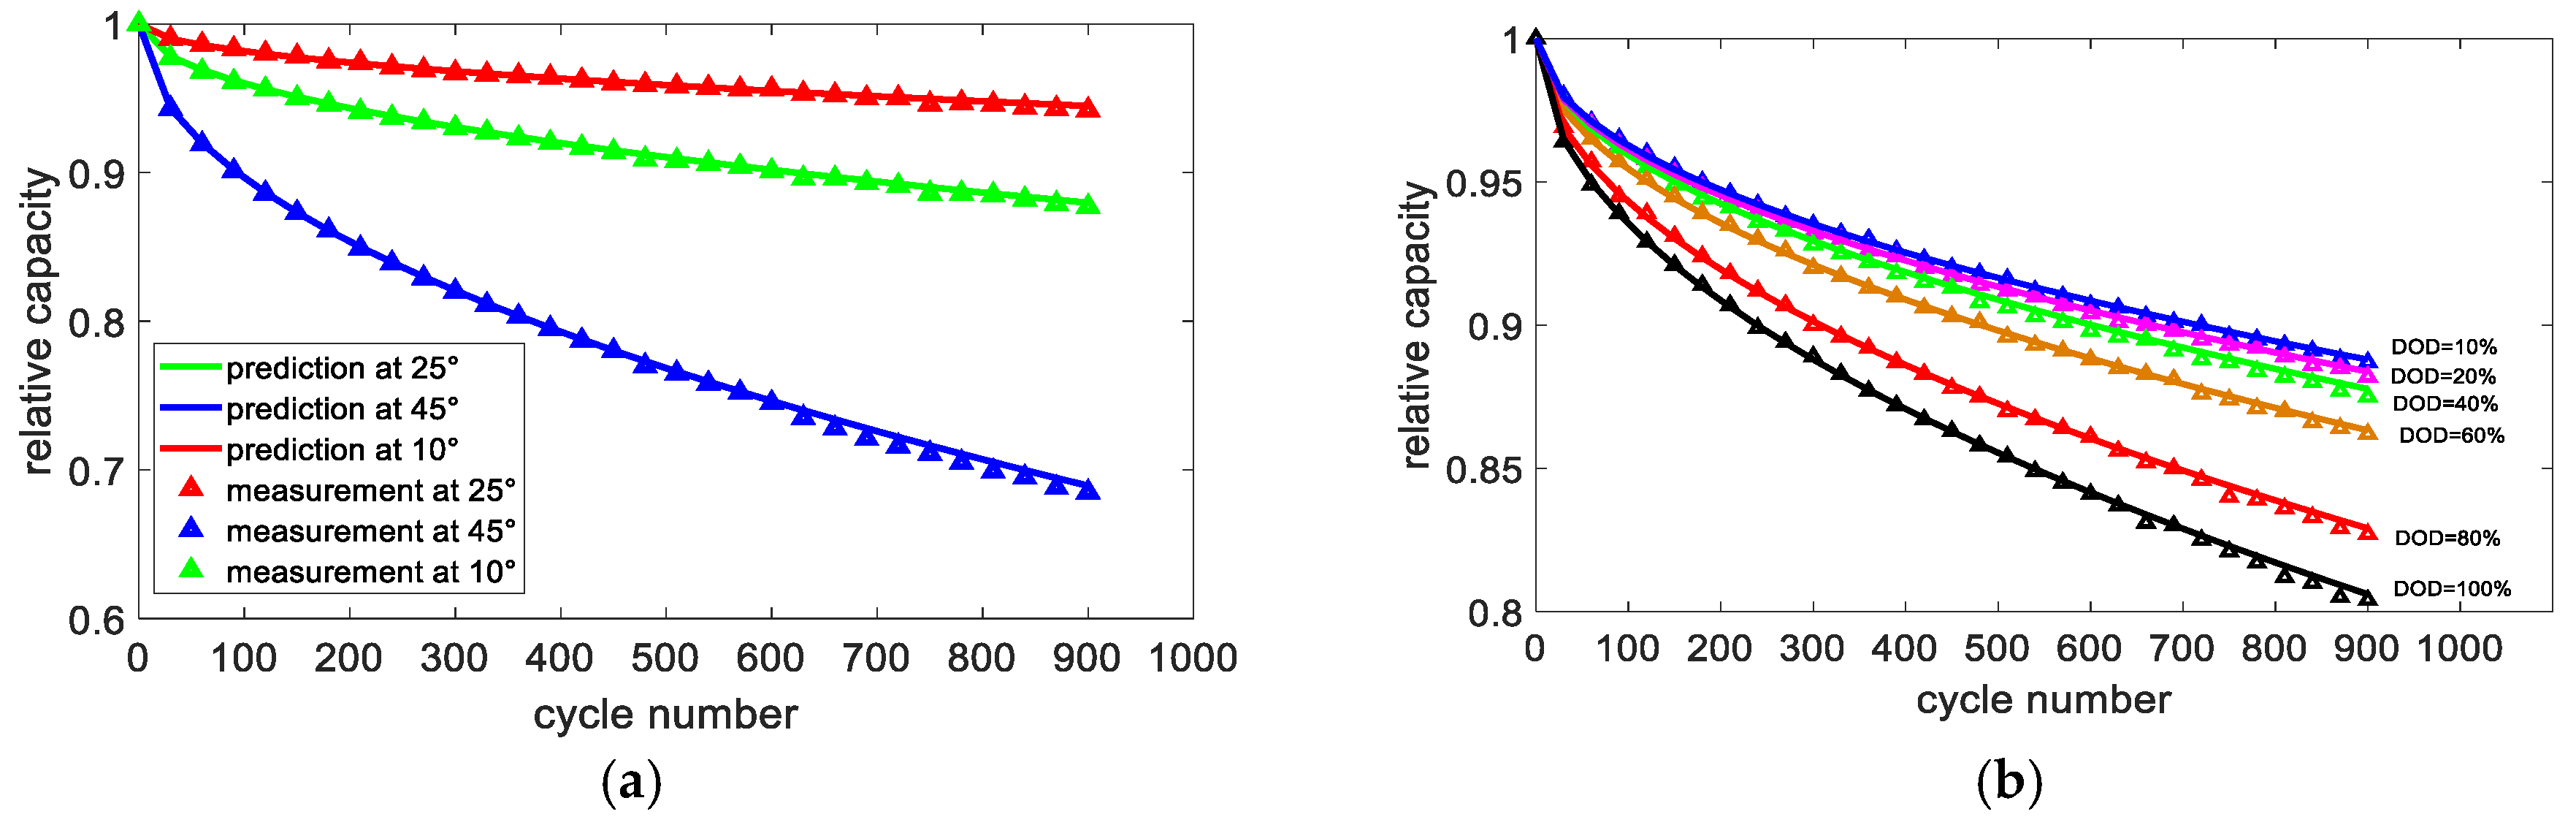
Capacity as a function of cycle number is plotted as shown in
Figure 5. The lines are fitted curves, and the triangles are the experimental data. The prediction data are in good agreement with the experimental data, demonstrating the reliability and correctness of the cycle models.
Figure 5a displays capacity experimental data and fit at different temperatures. The results indicate that as temperature increases, the aging accelerates. The degradation at 45° for 900 cycles increased nearly 20% compared to that at 25°. Temperature is perhaps the most influential factor on the impact of capacity loss, as it affects the growth of SEI film.
Capacity at different DODs at 25° is plotted in
Figure 5b. As the DOD of the battery increases, the rate of decay of the battery capacity gradually increases. The degradation under 100% DOD for 900 cycles increased about 10% compared to that under 10% DOD, illustrating that DOD is a less important factor in the model, especially at lower DODs (<60%).
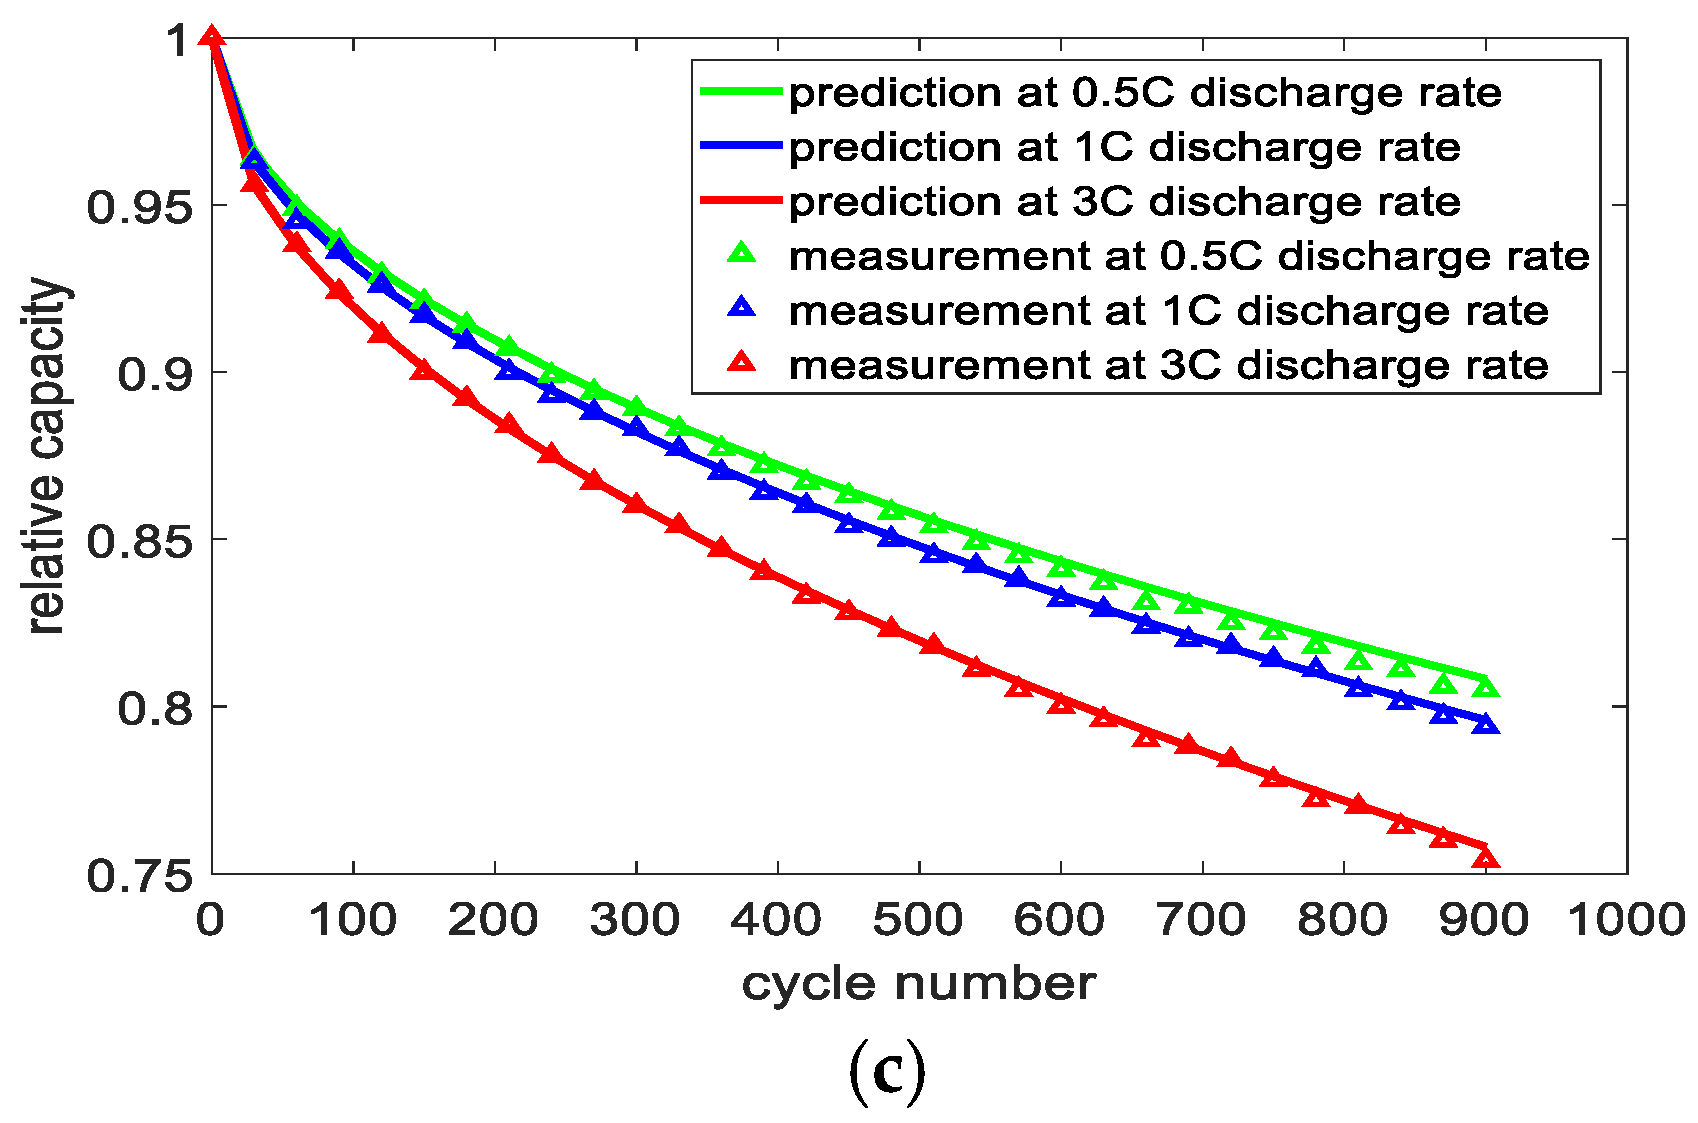
The prediction model fitted with discharge rate experimental data is shown in
Figure 5c. The degradation discharged at 3 C for 900 cycles increased about 4% compared to that at 0.5 C, indicating that the capacity loss is affected slightly by discharge rate. The SEI film is affected by the diversification of the concentration of reactants in lithium-ion batteries, which is caused by different DODs and discharge rates. The experimental results are consistent with the aging mechanism of the battery.
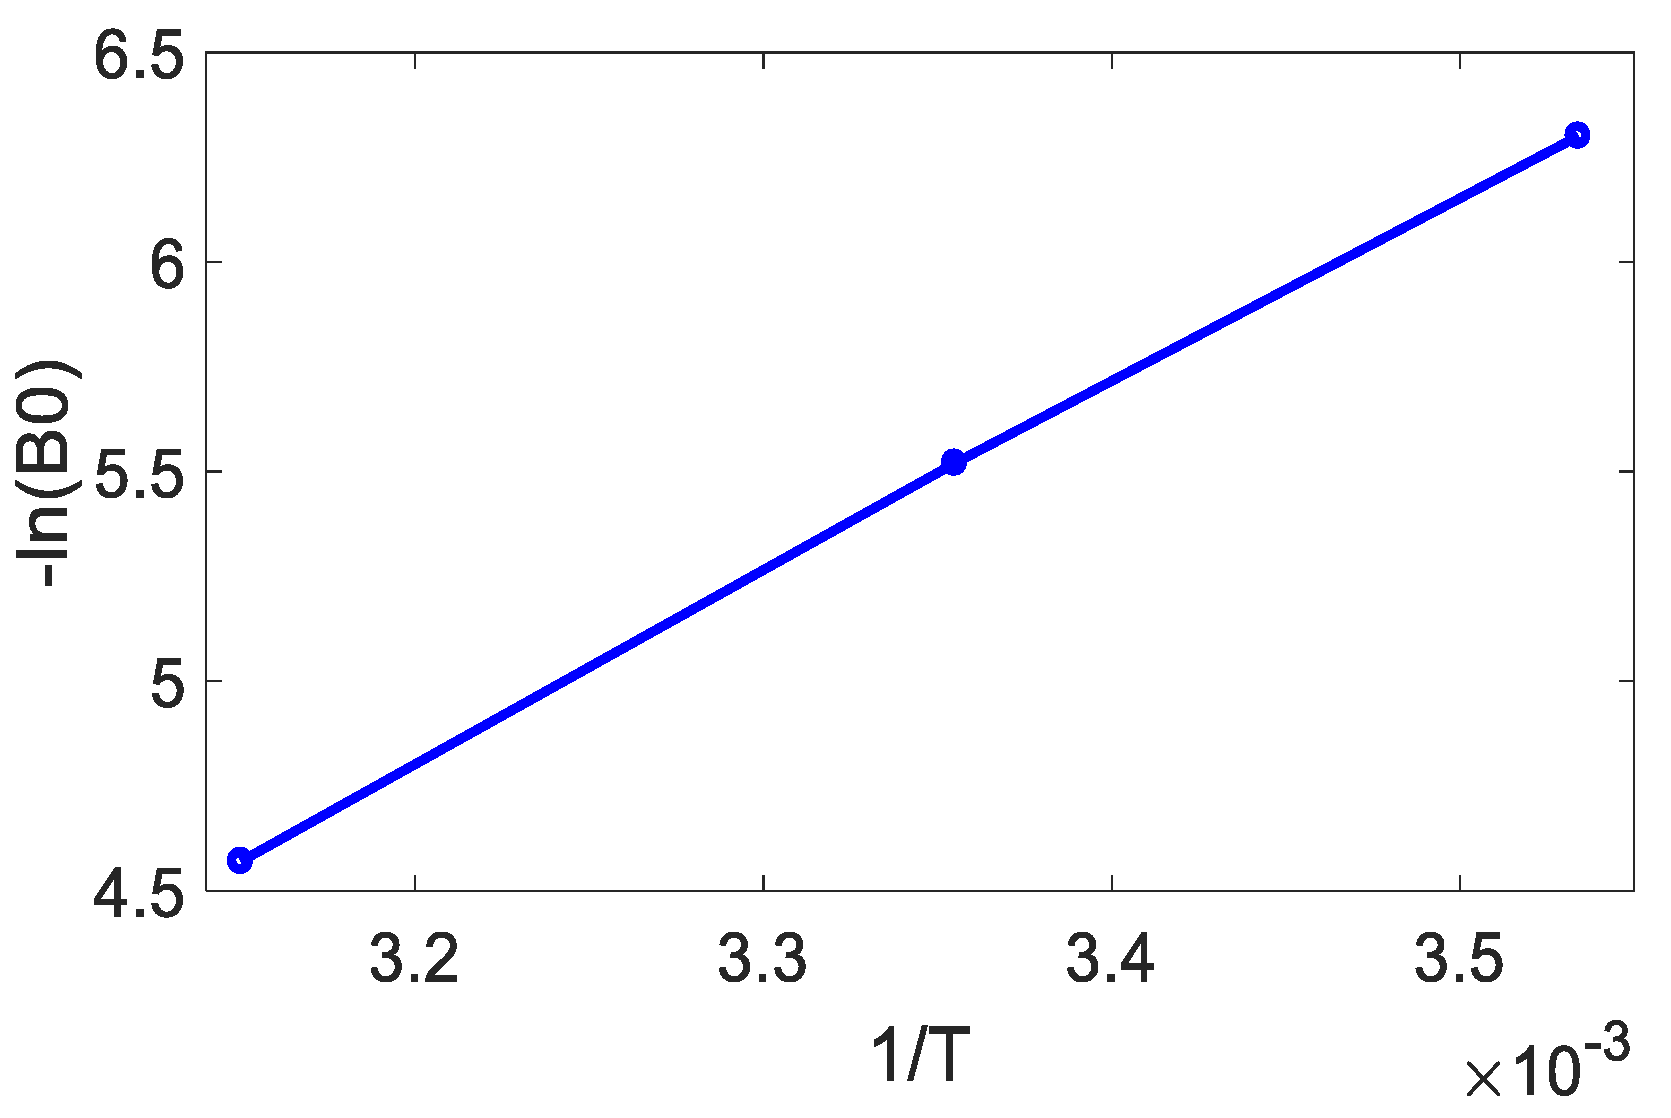
3.2.2. The Analysis of Factors
Due to the formula
, the fitting results of
and 1/
T are shown in
Figure 6.
On the plot,
are the values of y-intercept and
are the slopes. The relationship between
and
1/T is linear, which means that the pre-exponential factor
B is independent of
T.
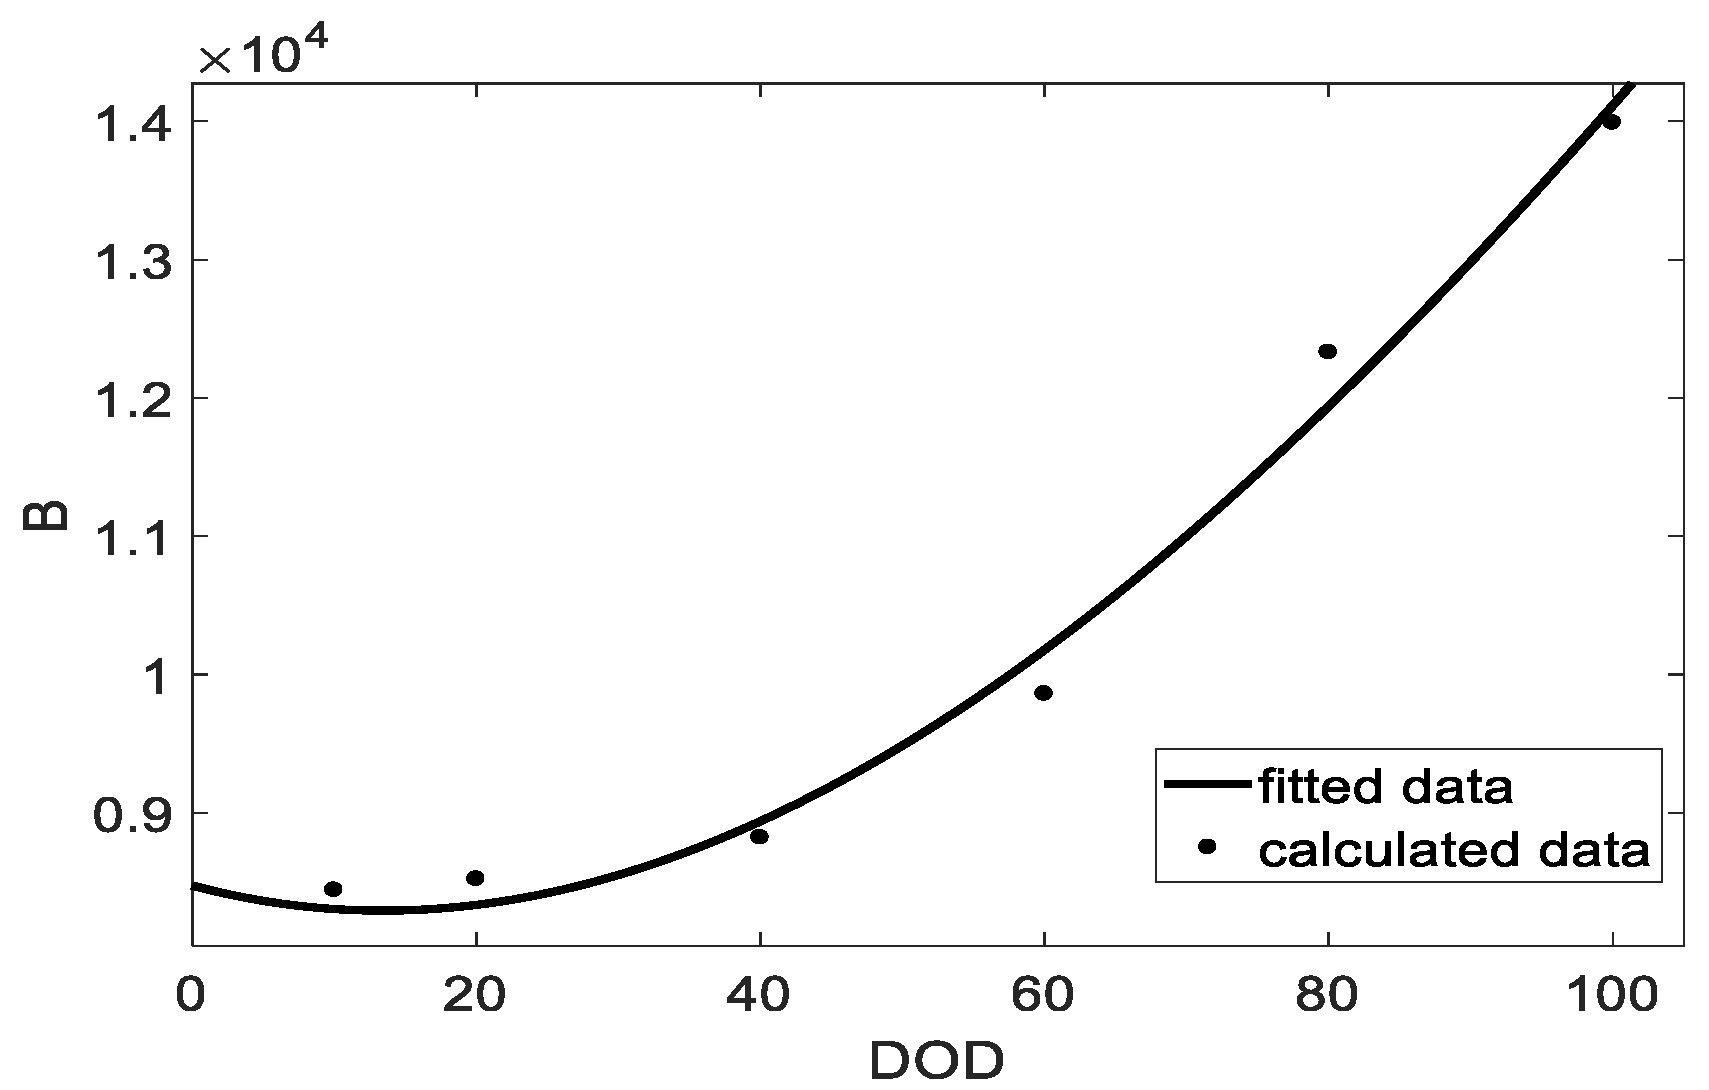
values can be set to 4345 as the values under different
DODs are nearly identical, as shown in
Table 5. The pre-exponential factor
B changes with
DOD; the factor of temperature is irrelevant. A function using third-order polynomial can be introduced to describe the quantitative relationship of B with DOD change as shown in Equation (5) [
9].
The fit between DOD and B can be seen in
Figure 7.
After a closer examination of the data in
Table 4, discharge rate was chosen not to be considered, as it was found to be less important than cycle time.
The capacity can be expressed as Equation (6) by substituting Equation (5) and
into Equation (2).
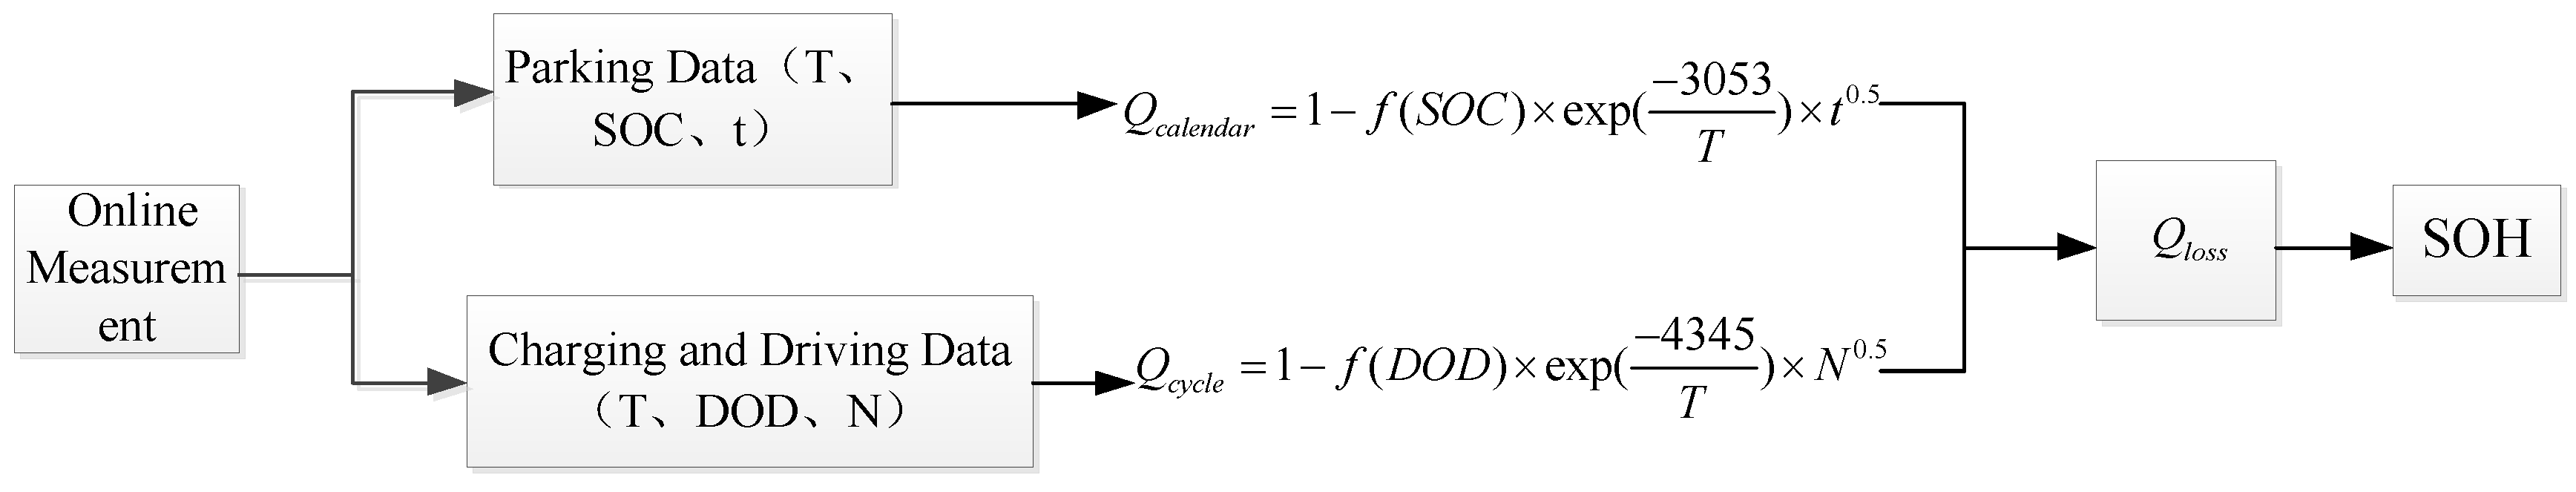
3.3. Online SOH Estimation Based on the Combined Multiple Factor Degradation Model and Verification
The degenerative effects of calendar aging and cyclic aging are considered additive, so a combined multiple factor degradation model can be built as Equation (7) by combining Equations (4) and (6).
where
t is the parking time (days) and
N is the cycle number.
In electric vehicles, cycle conditions include driving and charging conditions, while calendar conditions include parking conditions. They both occur in electric vehicle working conditions. Based on the combined multiple factor degradation model, an online SOH estimation method can be used to verify the correctness of the model.
Experiments were conducted in the battery test platform. The battery was charged and discharged once per day, and the rest of the day was for parking. The test conditions of average temperature, storage SOC, and DOD are set every two months as in
Table 7. It is a simplification and simulation of the actual working conditions of electric vehicles. The parking time can be measured in the platform shown in
Table 7.
The capacity degradation can be calculated by Equation (8).
where
is the capacity fade of cycle aging (Ah),
is the capacity fade of calendar aging (Ah),
i is the number of days,
i = 1:270.
,
,
are the SOC, DOD, and temperature at the time of day
i.
n is the cycle number one day, and
as the battery is charged and discharged once a day.
is the parking time per day.
can be calculated by Equation (9).
where
is the total capacity fade of the battery (Ah).
The diagram of the online SOH estimation is shown in
Figure 8.
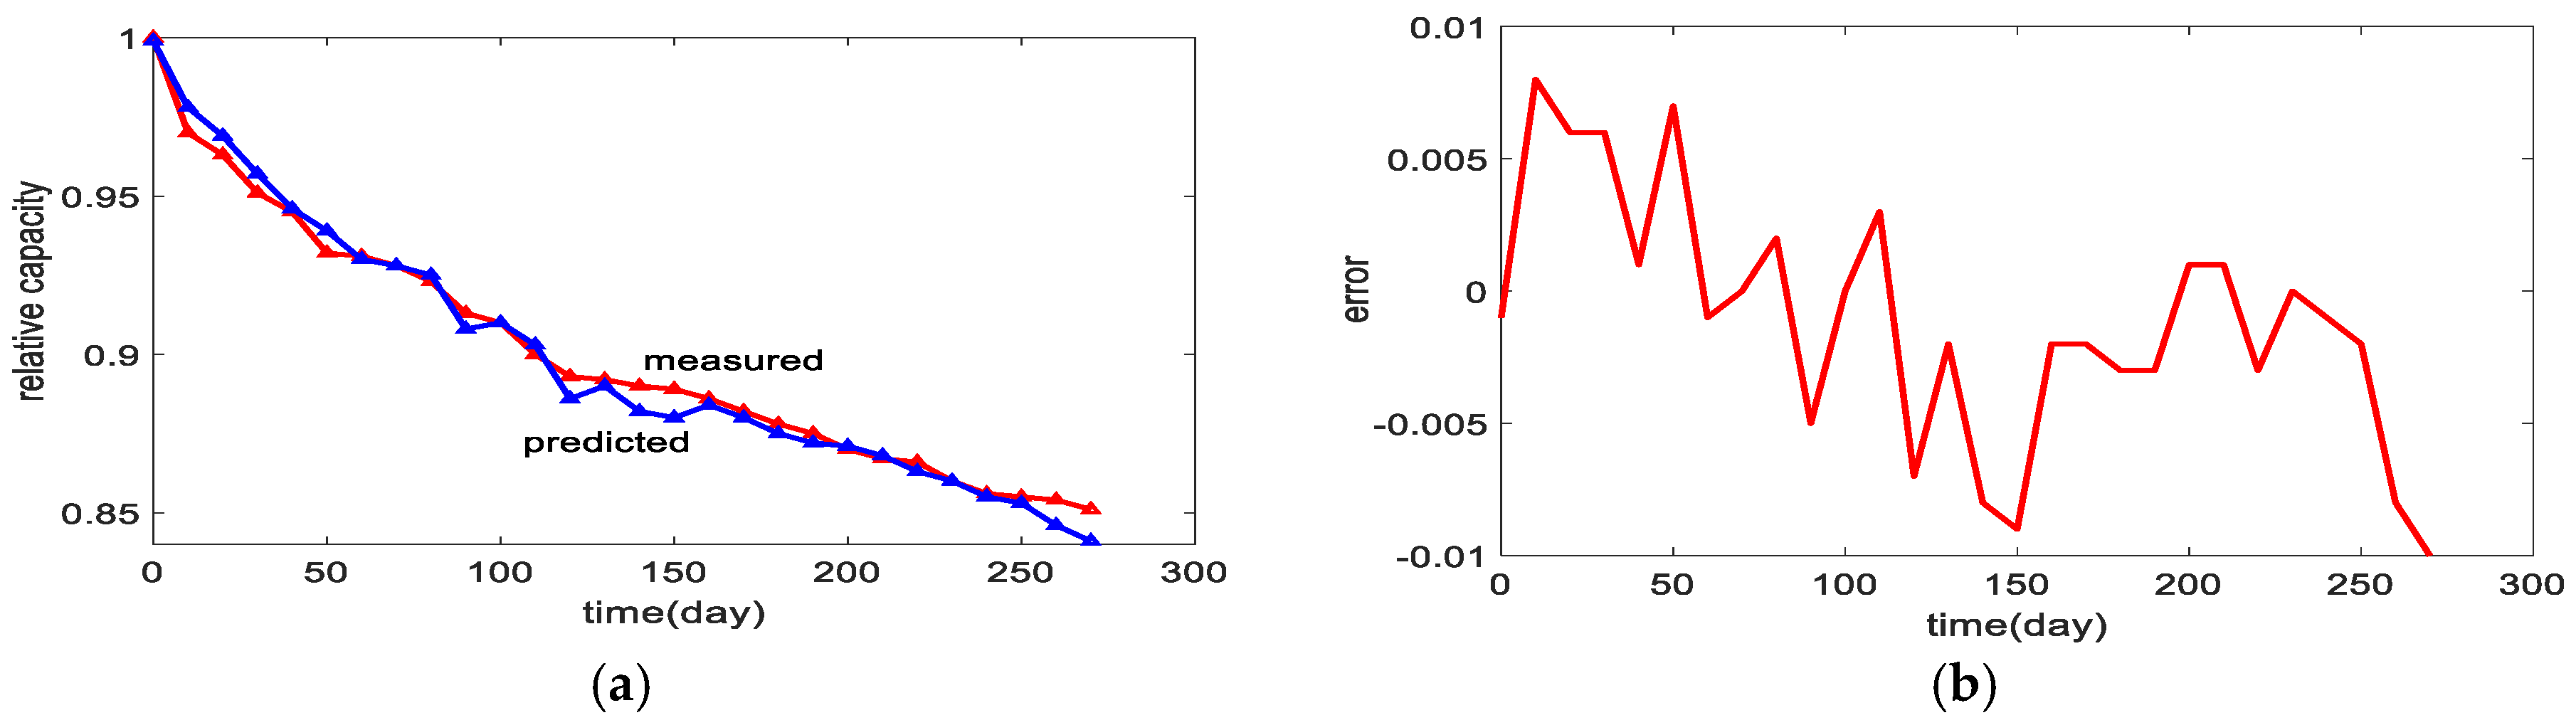
The actual capacity data are collected every 10 days in the platform. A comparison of predicted and measured data is shown as
Figure 9a,b. It can be seen from
Figure 9a,b that prediction data are in good agreement with the experimental results, to the point where the error never exceeded 1%.
The results verify the correctness of the proposed model. When the battery operating conditions change, the model can reflect the degradation of the actual capacity very well. It can be used for an actual SOH prediction during the driving of an electric car.
4. Conclusions
In this paper, a combined multiple factor degradation model consisting of temperature, SOC, and DOD was established for calendar and cycle life predictions of electric vehicle batteries. Calendar and cycle aging experiments were conducted. Model pre-exponential factors, which reflect degradation reaction velocity depend only on SOC in calendar aging and on DOD in cycle aging. SOC and DOD as membership factors were introduced to calendar and cycle aging respectively to describe their impact on calendar and cycle degradation.
Based on the combined multiple factor degradation model, an online SOH estimation method was proposed to verify the correctness of the proposed model. The model reflected the degradation very well, with an error margin between prediction data and experimental data within 1%.


