Energy-Saving Strategies and their Energy Analysis and Exergy Analysis for In Situ Thermal Remediation System of Polluted-Soil


Abstract
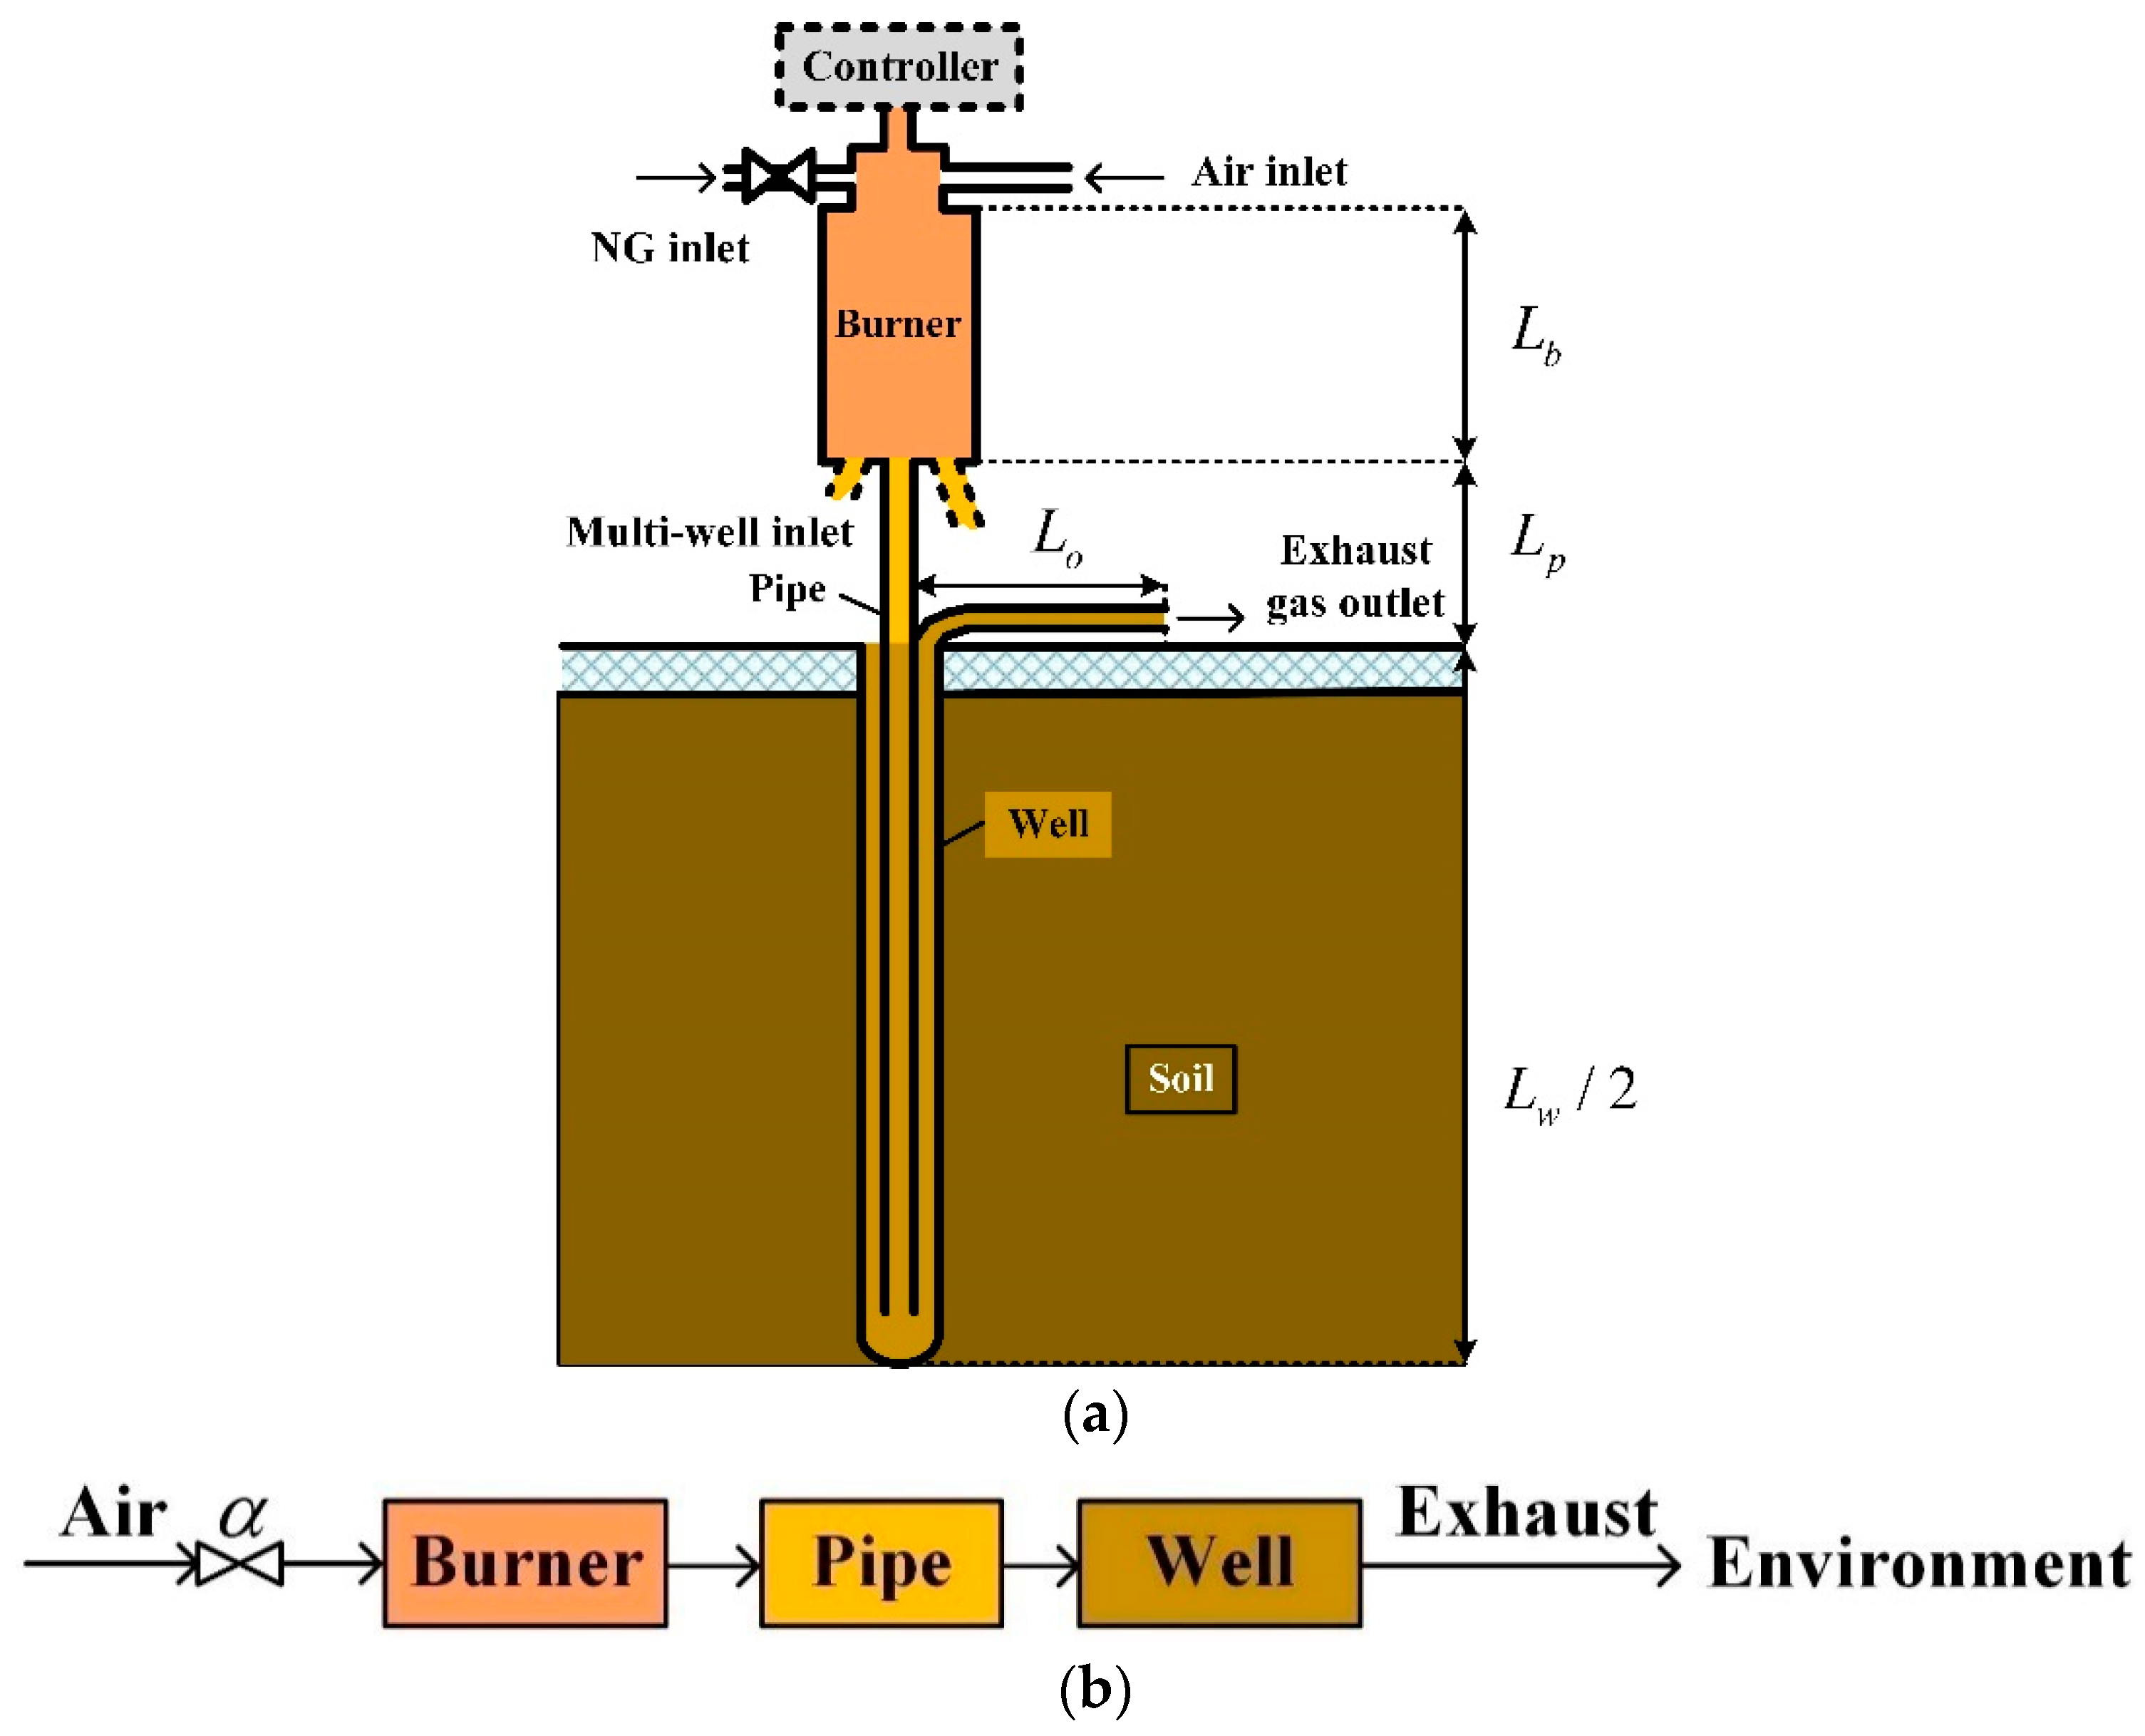
:1. Introduction
2. Idea of Energy-Saving Strategies of Polluted-Soil Thermal Remediation System
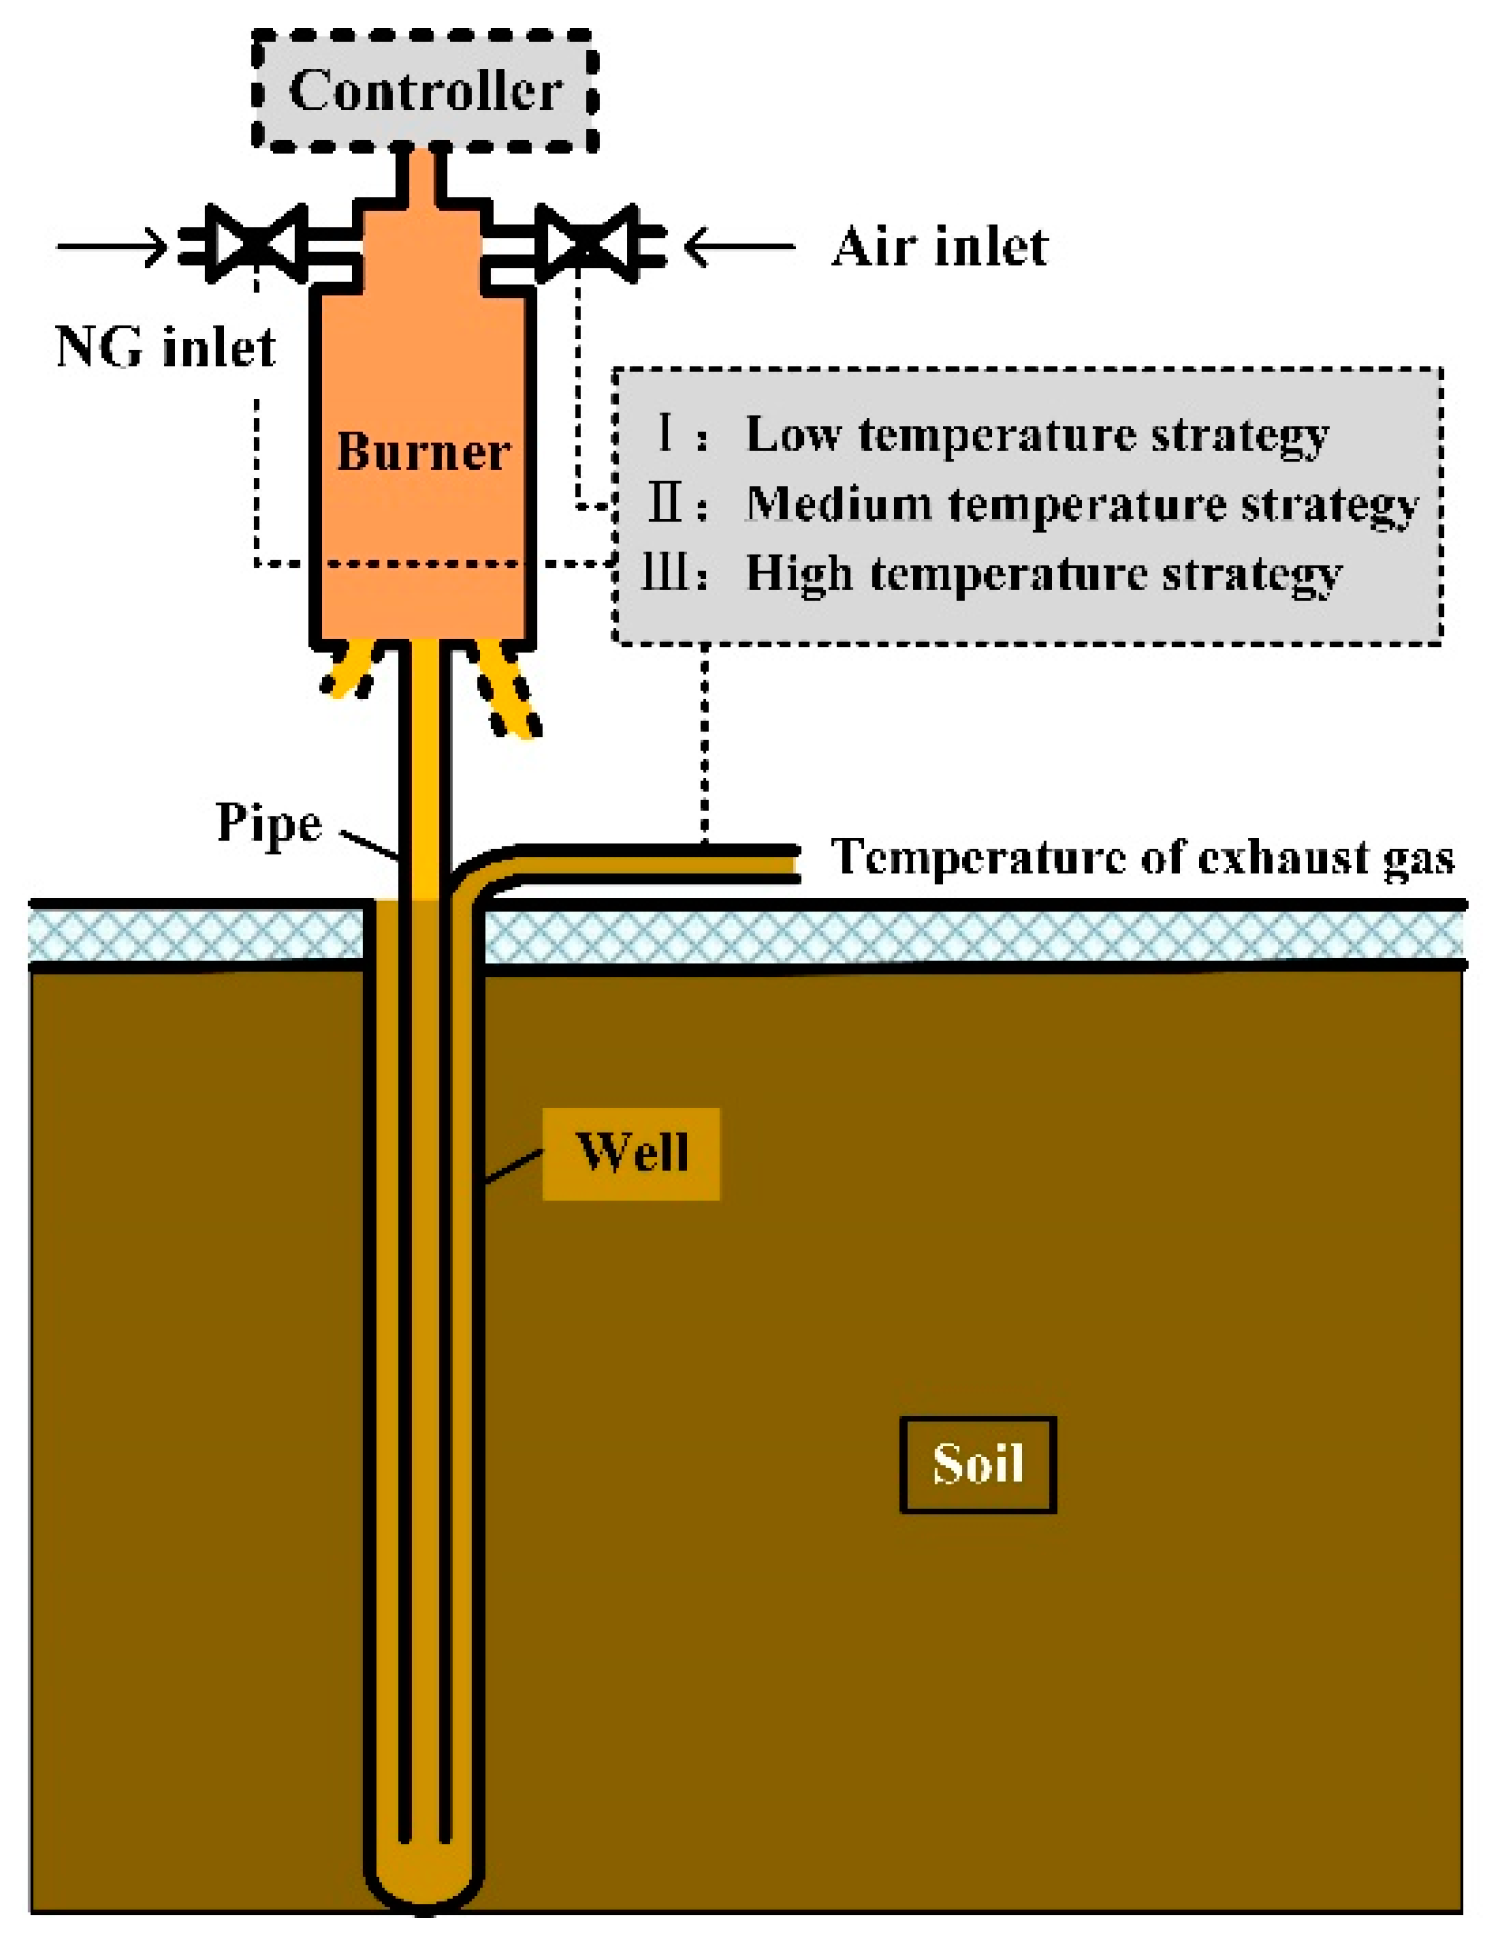
2.1. Description of Energy-Saving Strategy for Variable-Condition Mode
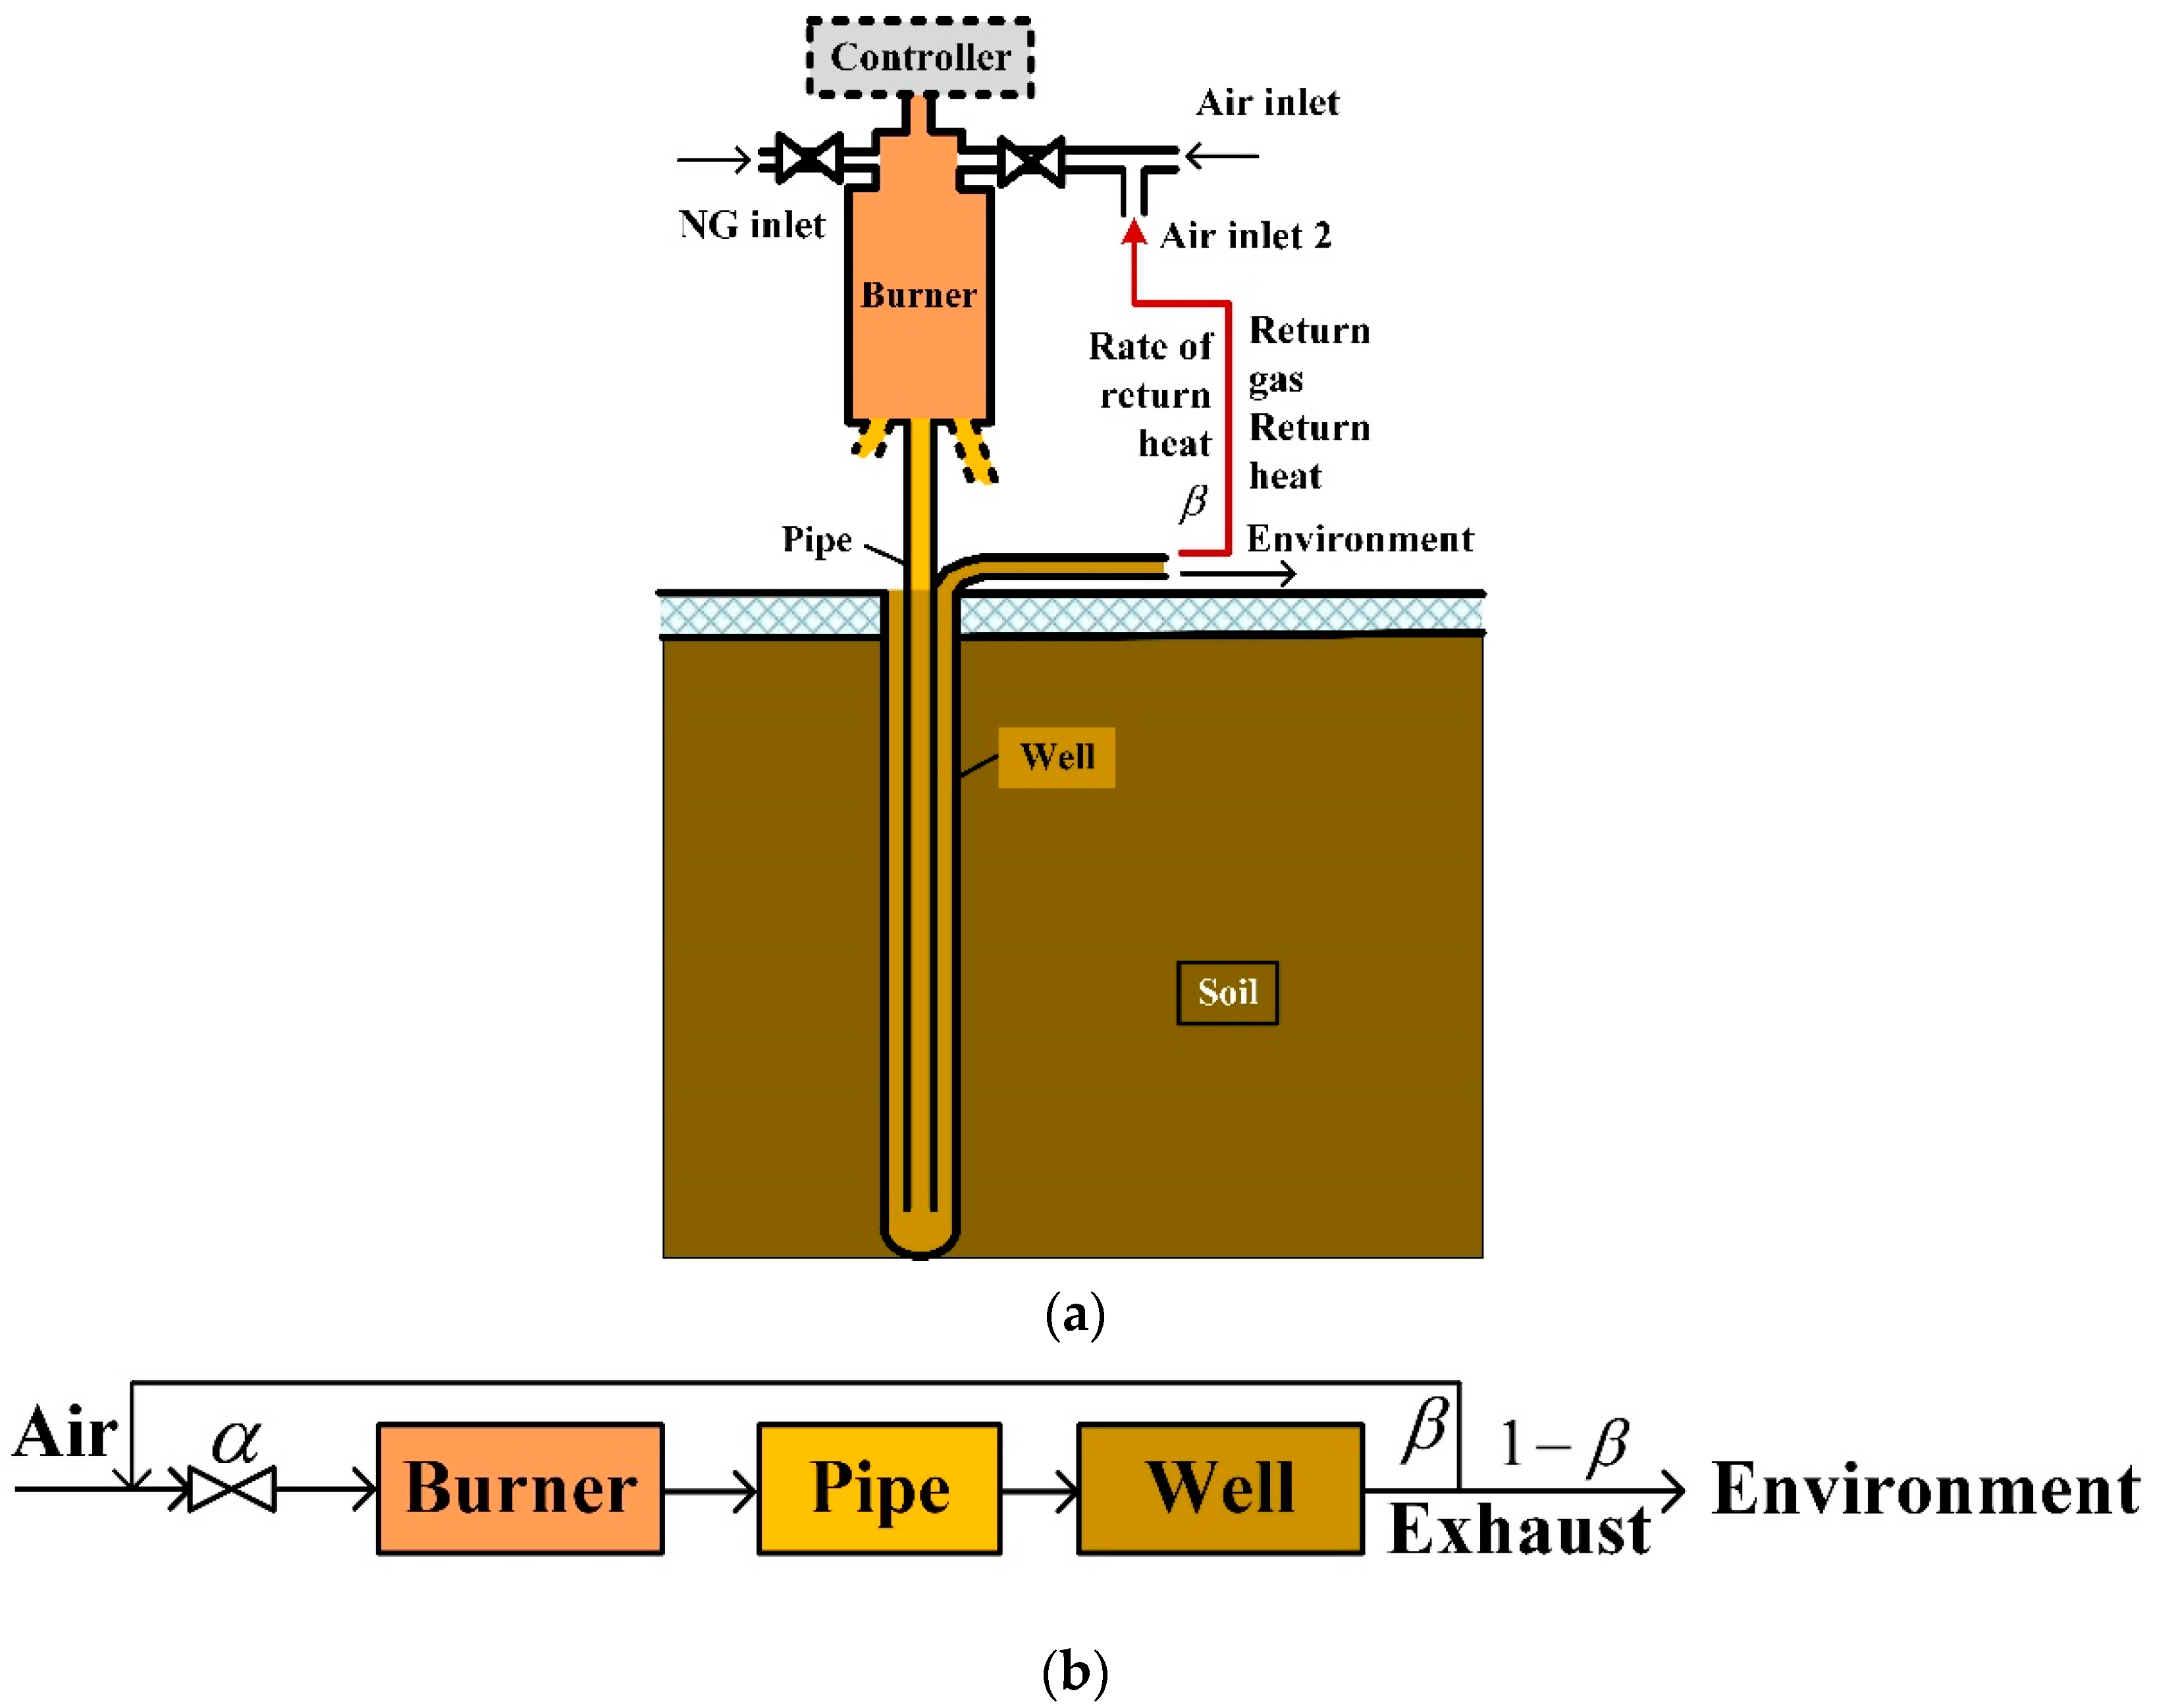
2.2. Description of Energy-Saving Strategy for Heat-Returning Mode
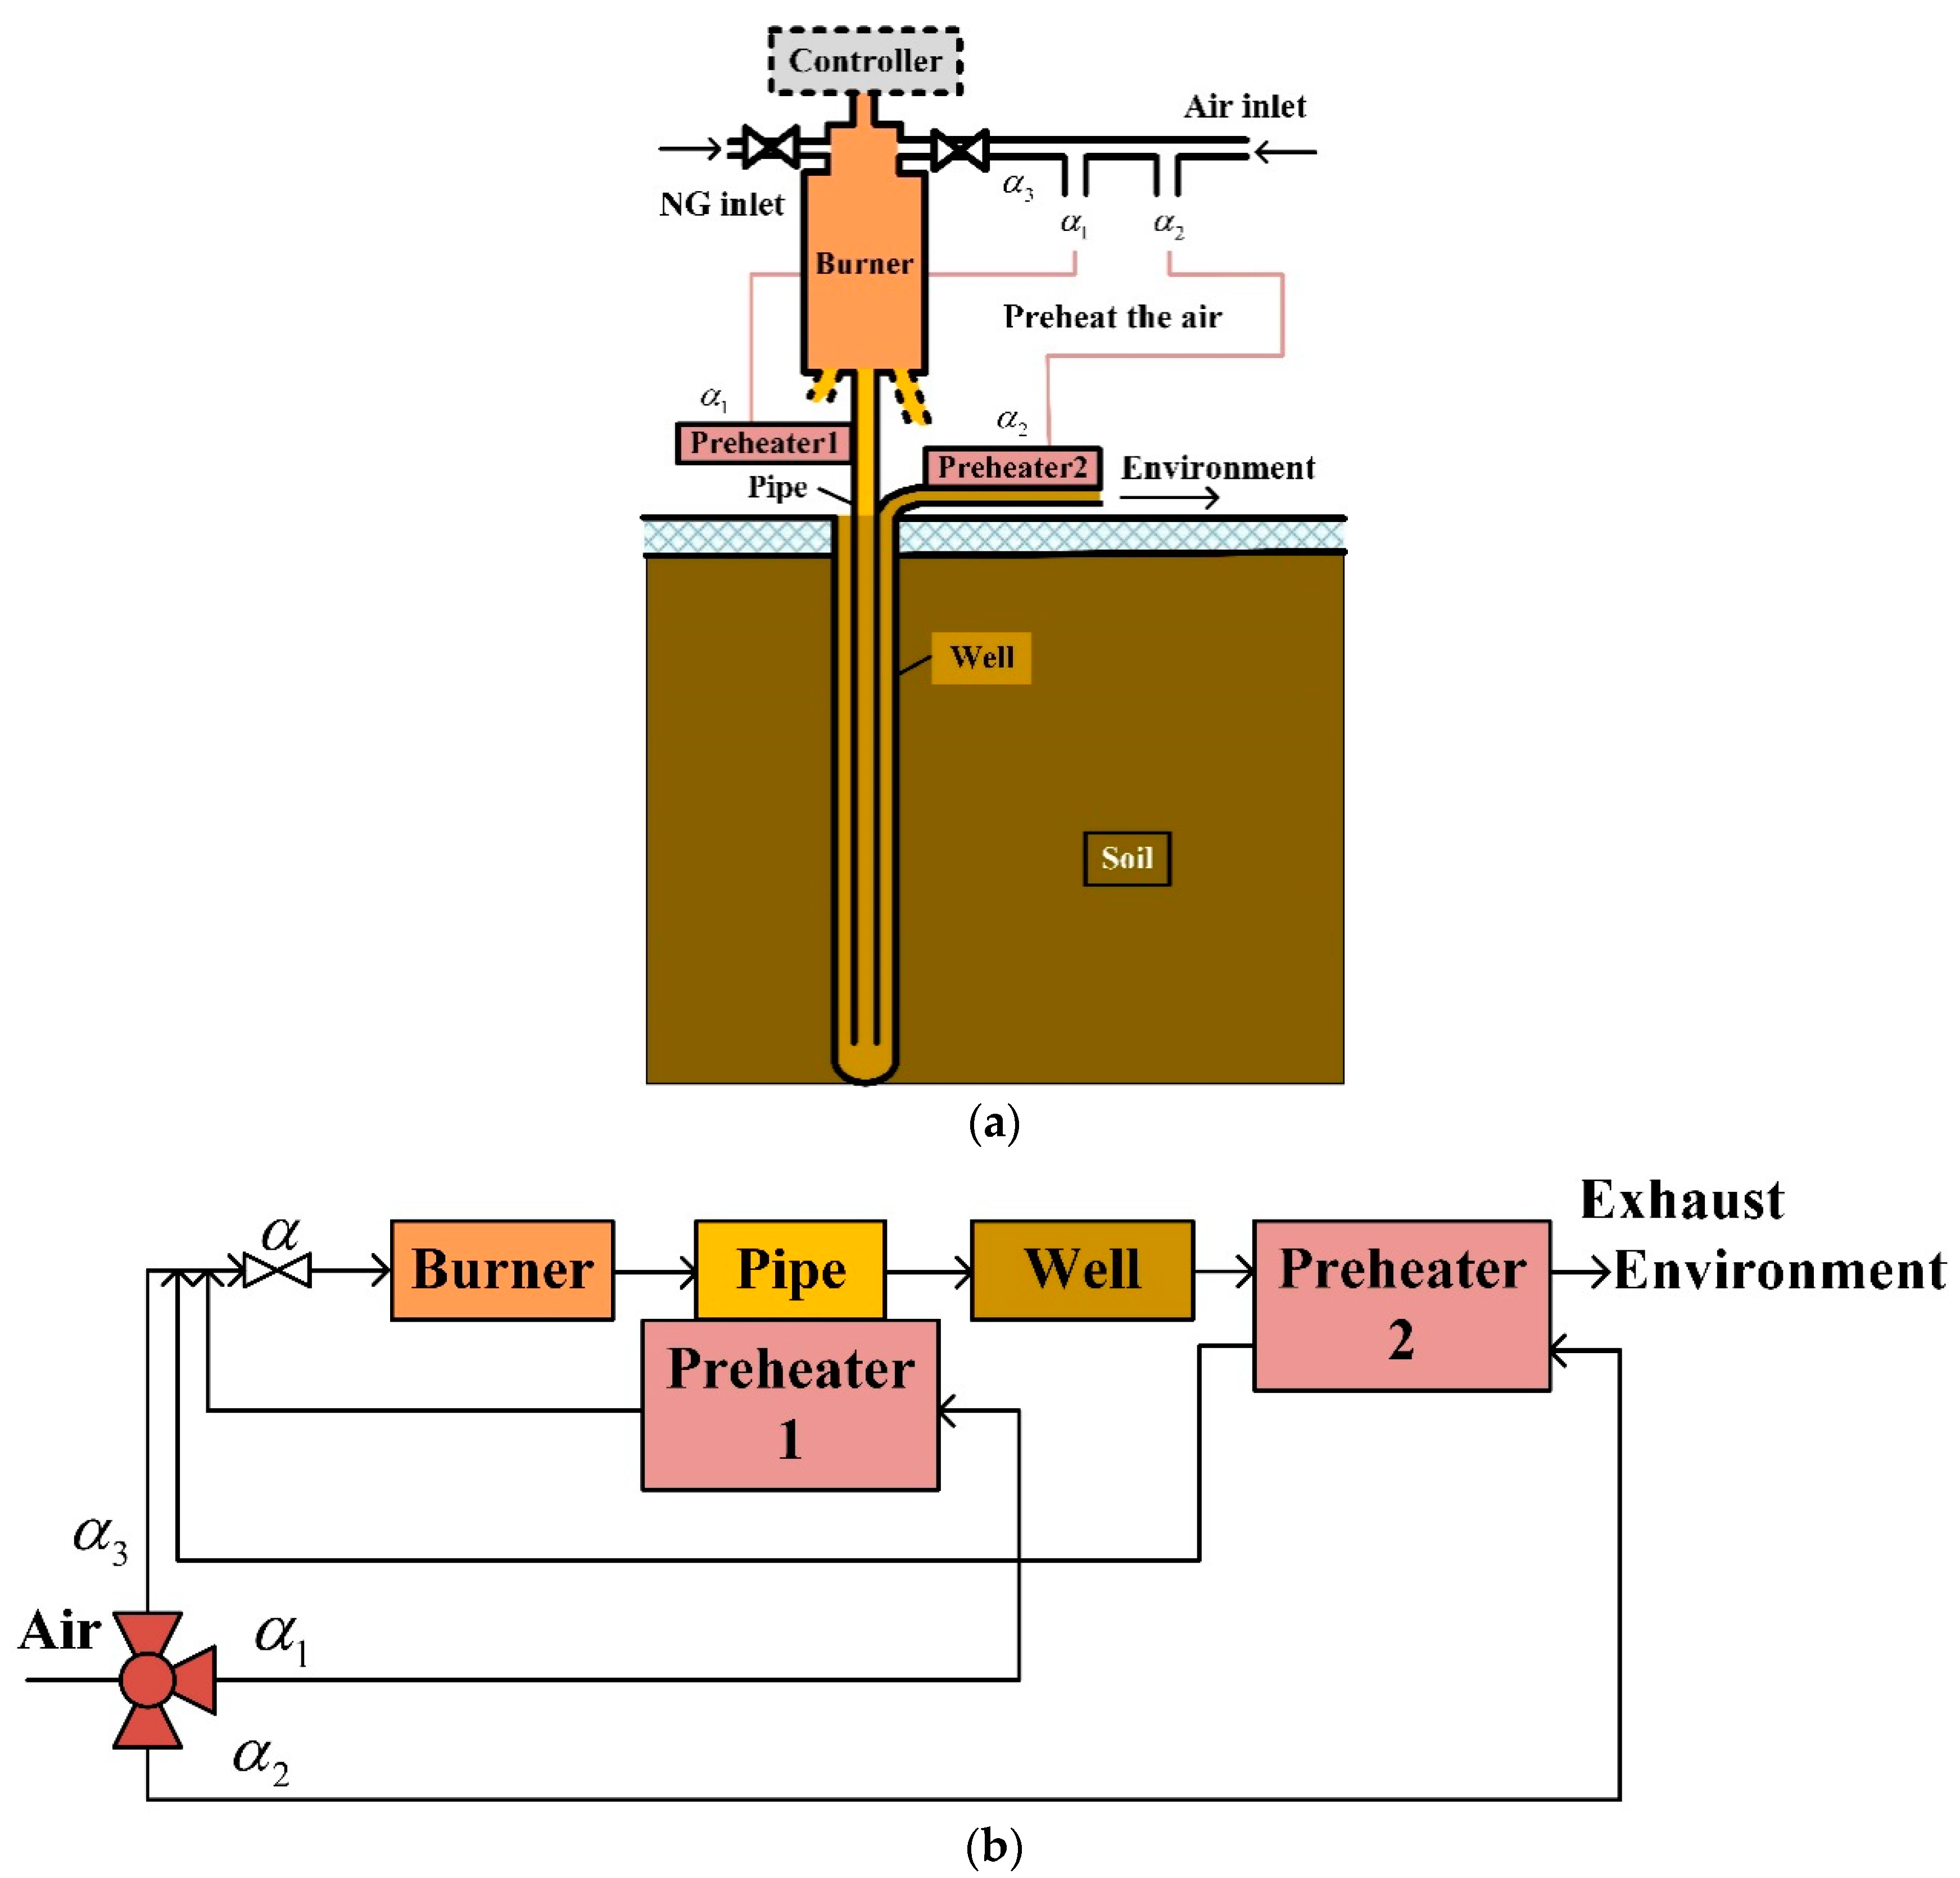
2.3. Description of Energy-Saving Strategy for Air-Preheating Mode
3. Mathematic Models and Parameters Calculation Process
- (a)
- The soil is homogeneous and values of physical parameters of the soil remain unchanged in the heat transfer process at the same stage;
- (b)
- The flow of fluid in porous media is called seepage, and the influence of seepage in soil, that is, water migration, was ignored;
- (c)
- The influence of surface temperature fluctuation and depth of buried pipe on soil temperature was ignored, and the soil temperature was considered uniform in the initial stage.
3.1. Balance Models
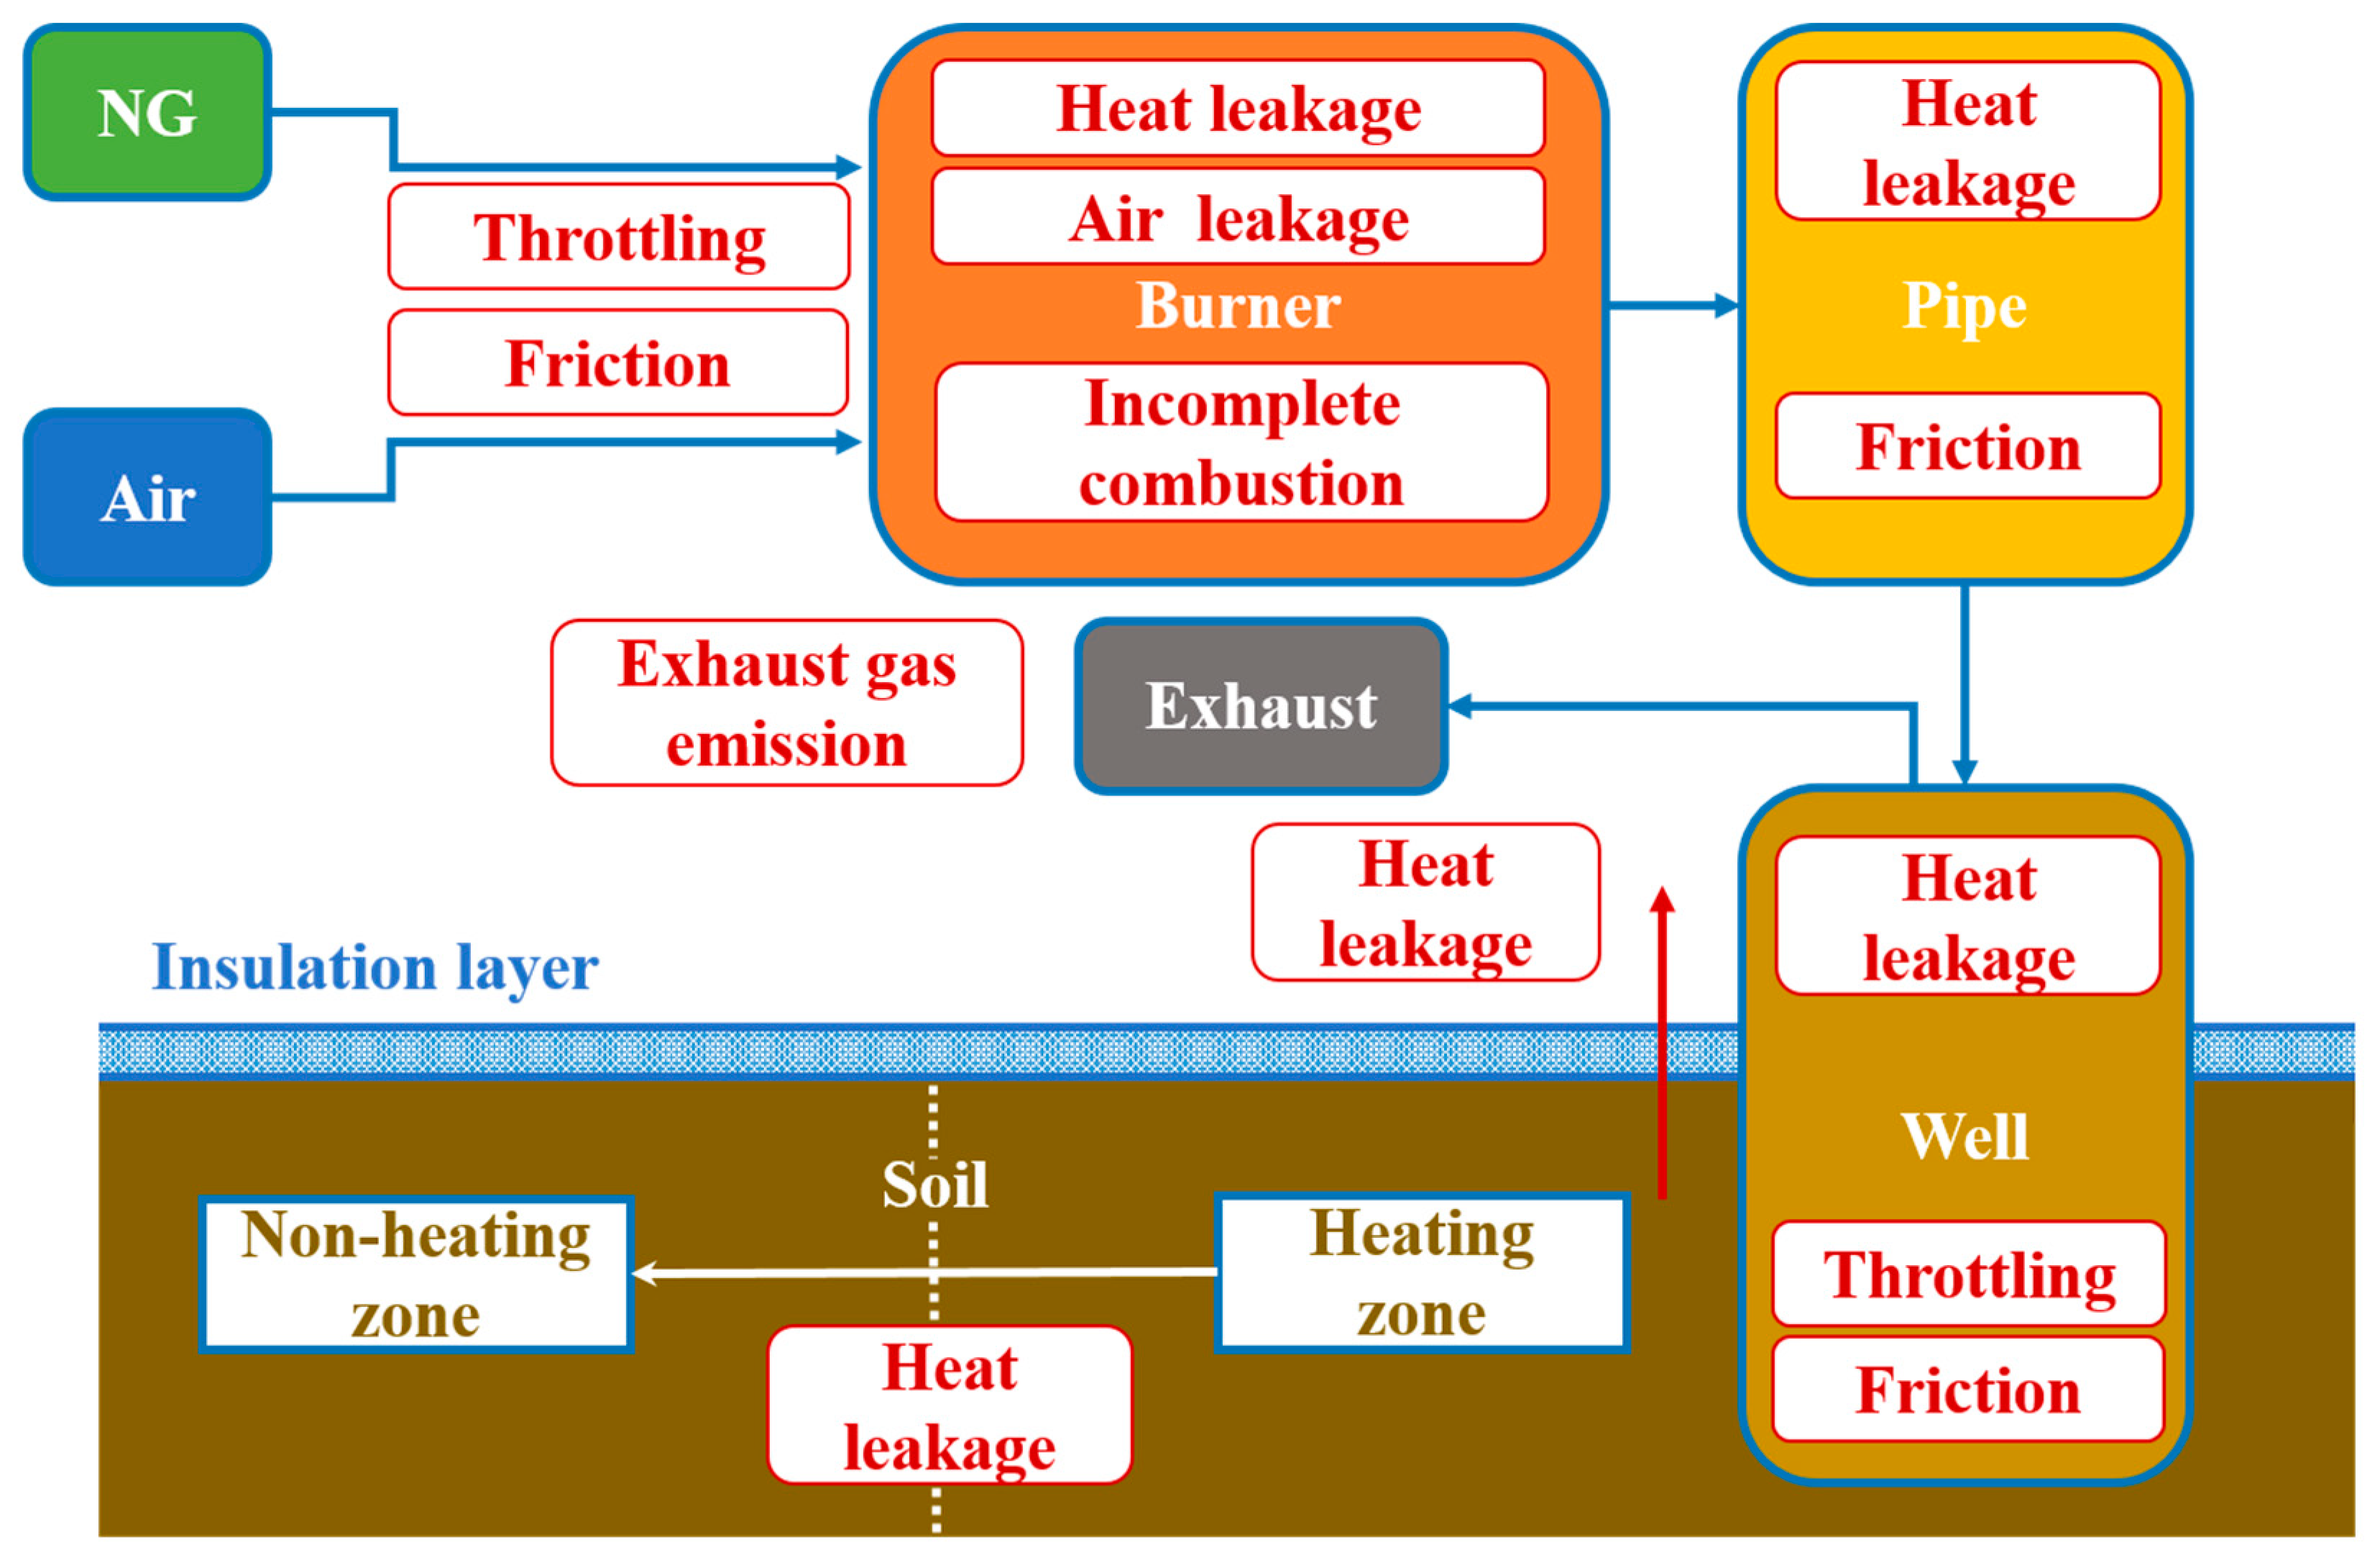
3.1.1. Energy Balance Models
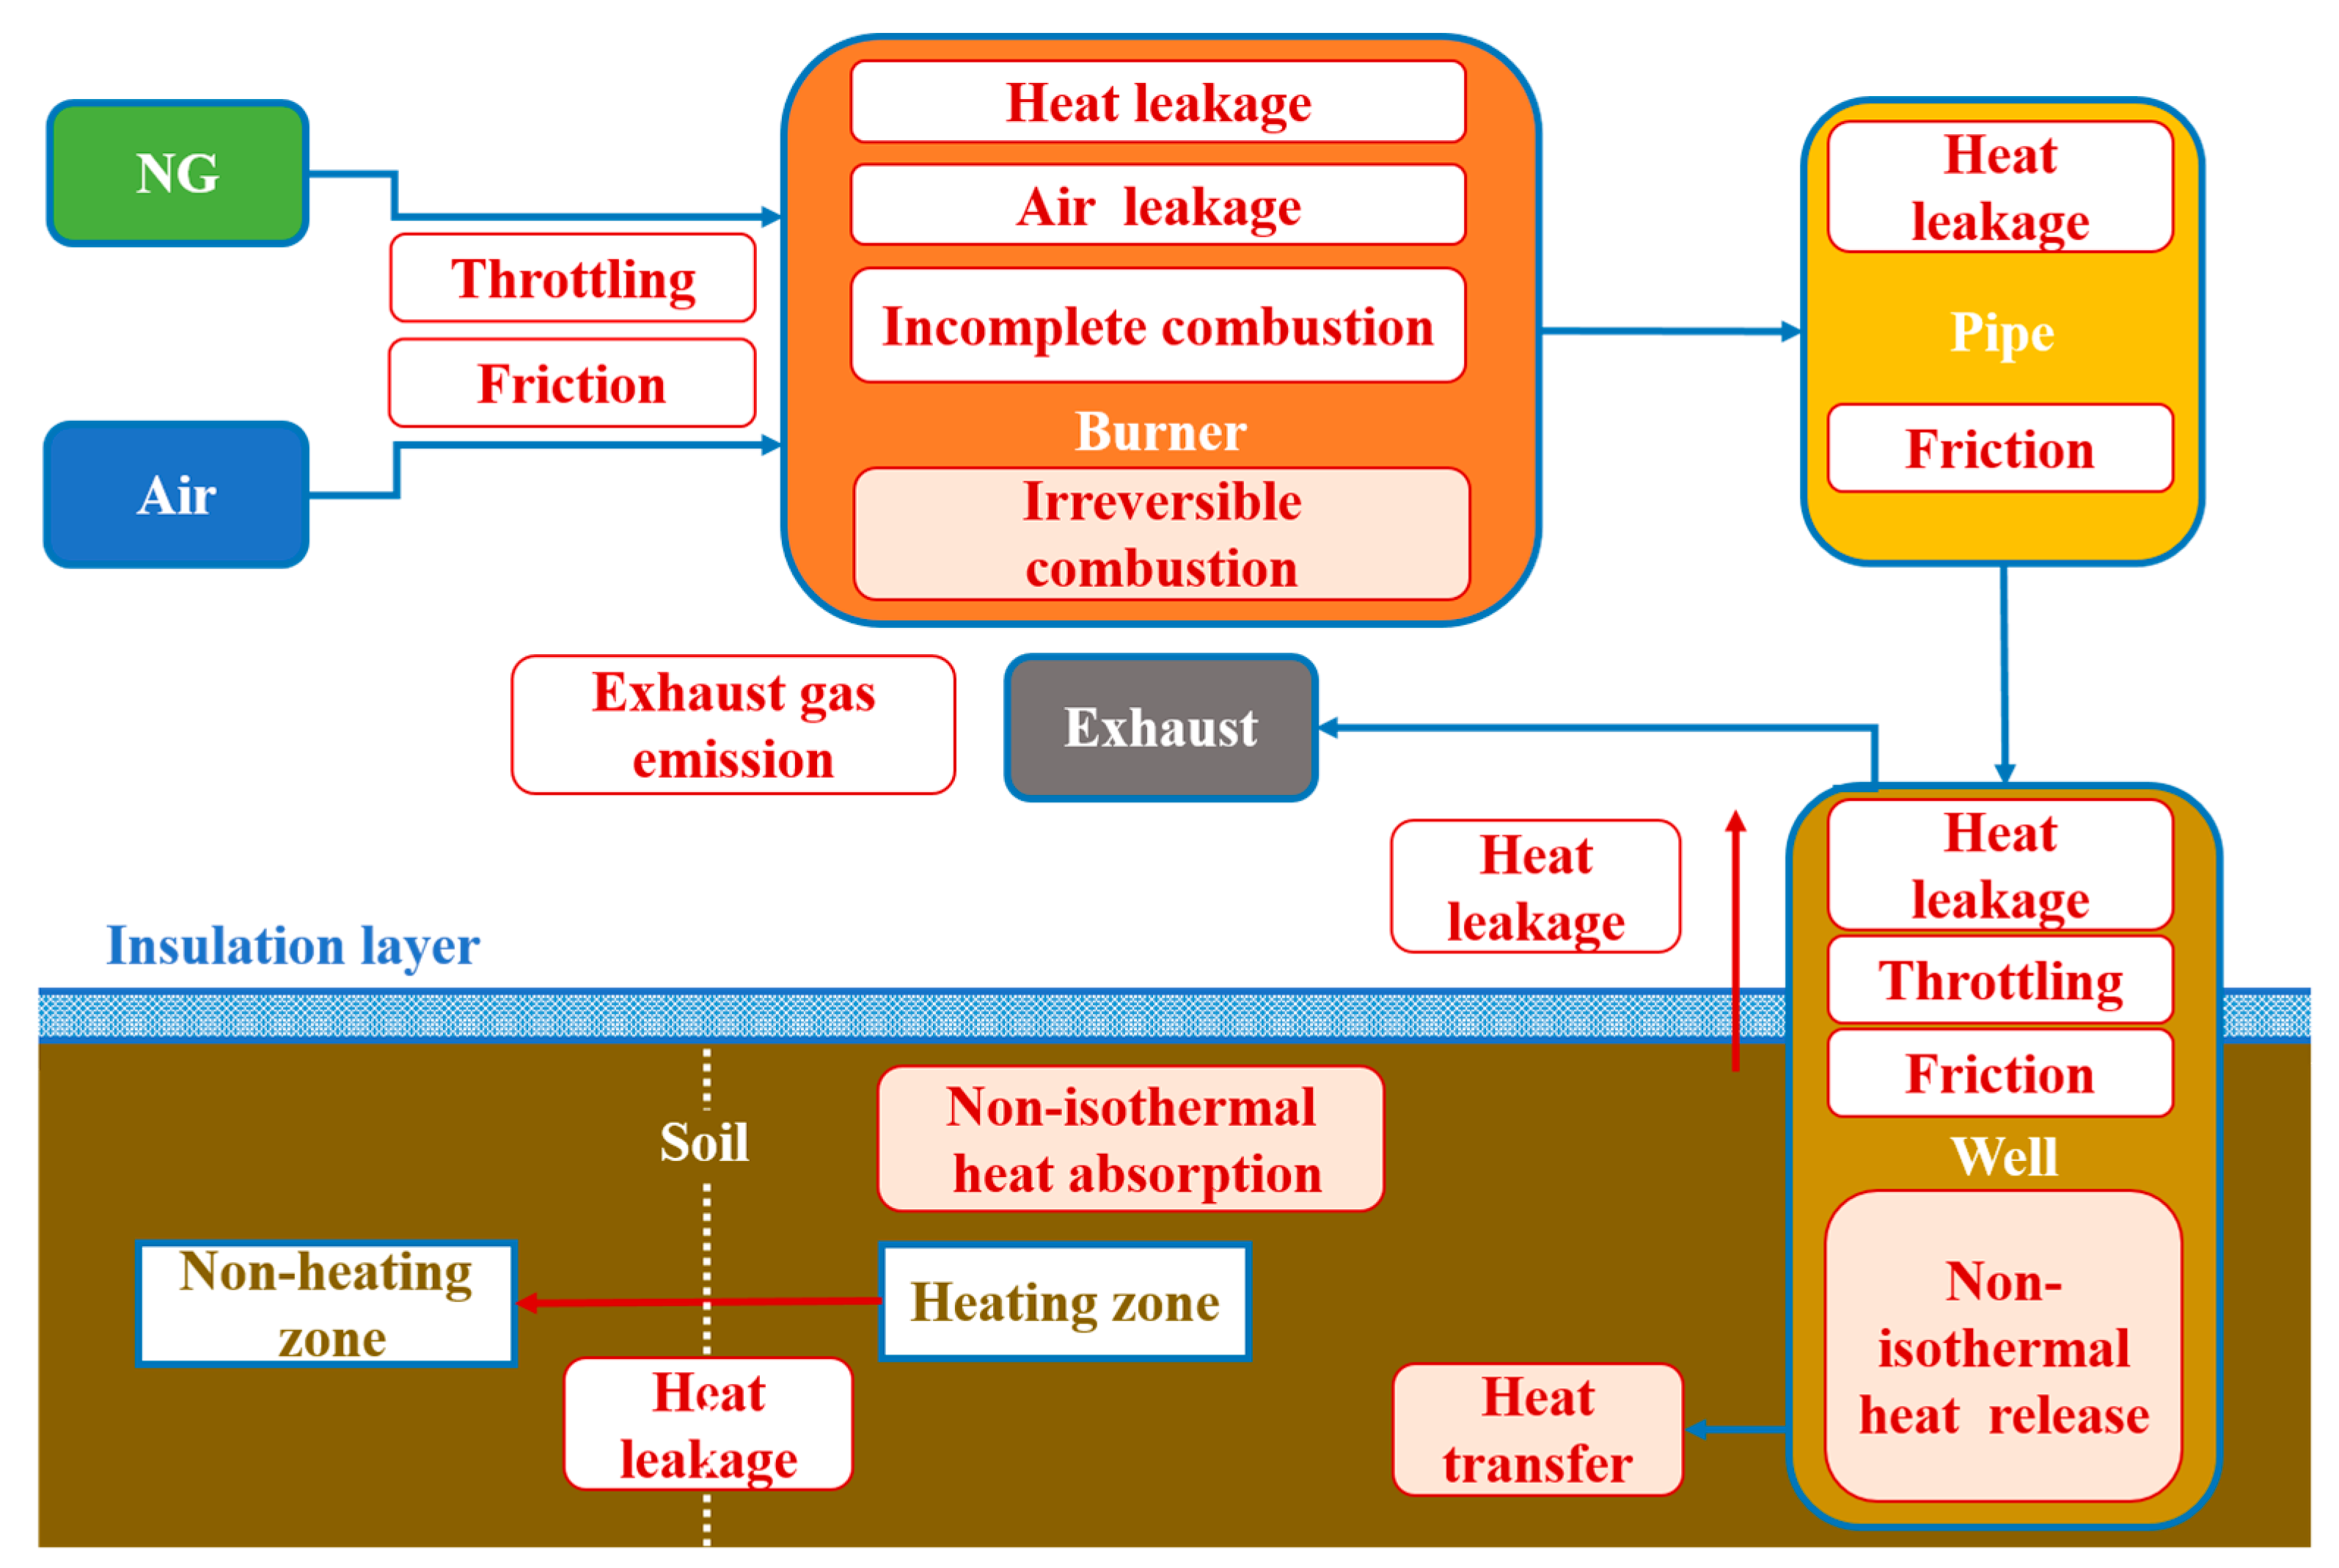
3.1.2. Exergy Balance Models
3.2. Energy Analysis Model
3.2.1. Burner
3.2.2. Pipe
3.2.3. Well
3.2.4. Soil
3.2.5. Energy Utilization Ratio
3.3. Exergy Analysis Model
3.3.1. Burner
3.3.2. Pipe
3.3.3. Well
3.3.4. Soil
3.3.5. Exergy Utilization Ratio
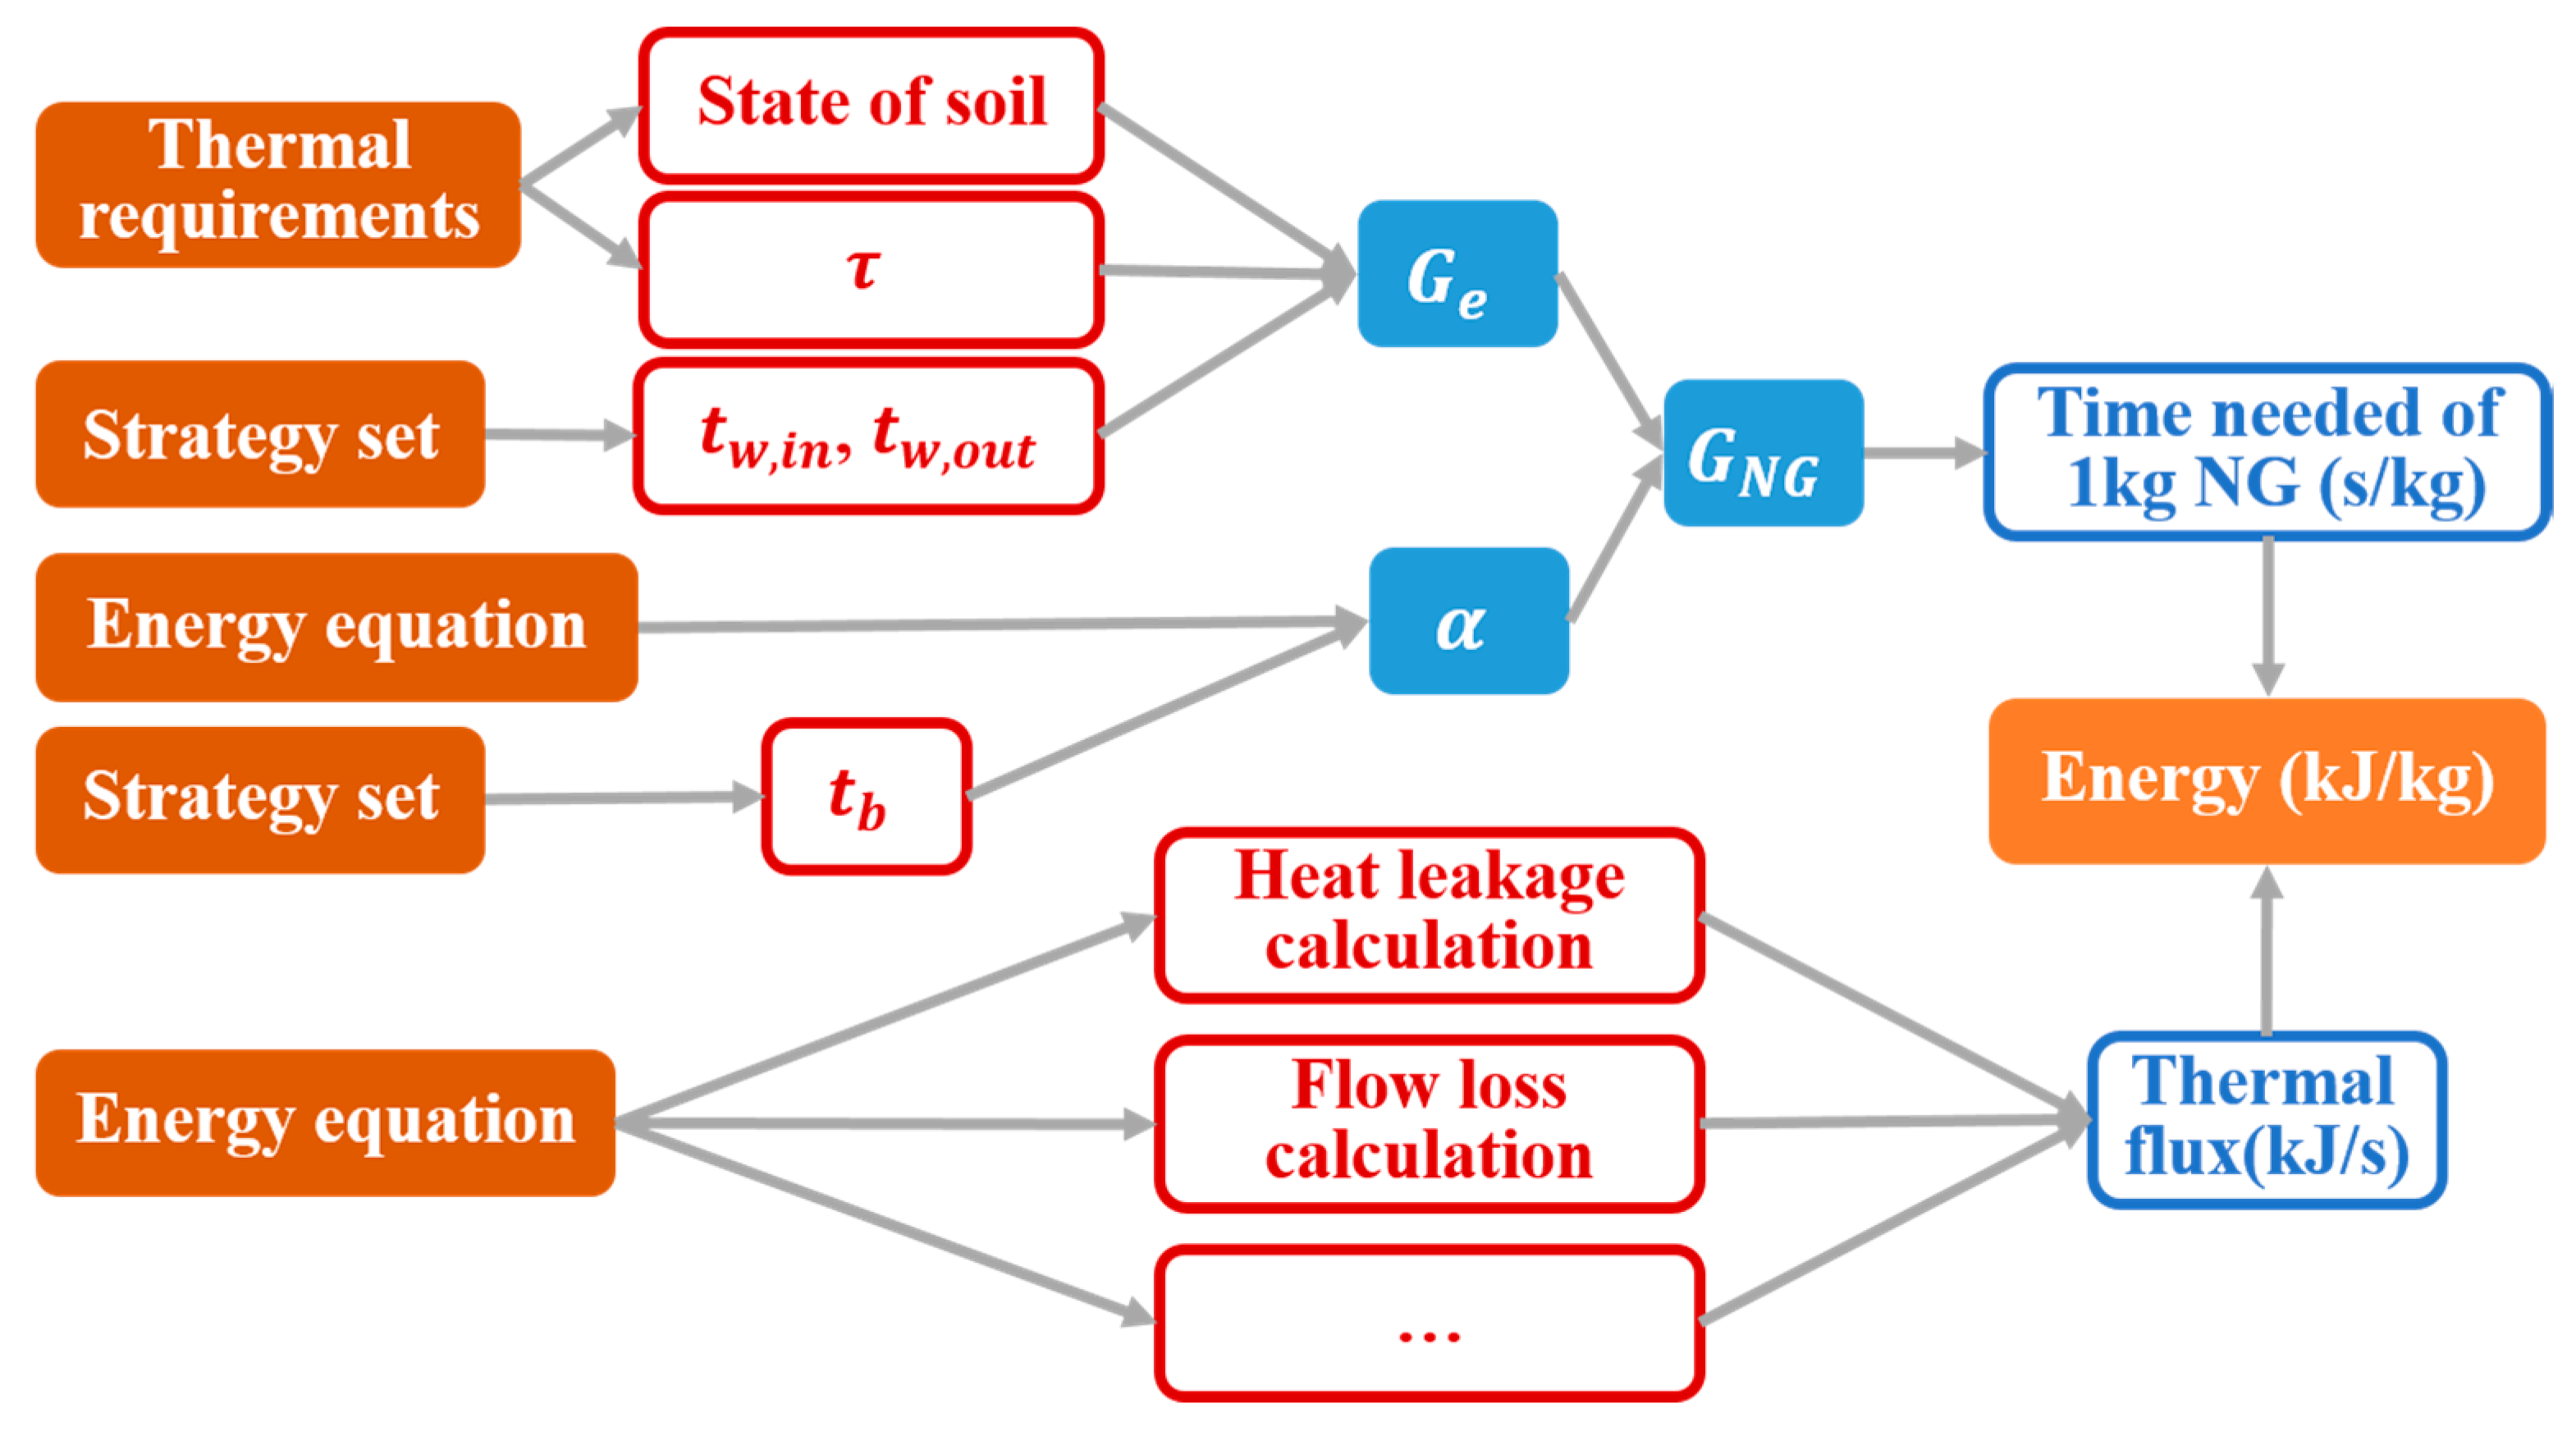
3.4. Process of Parameters Calculation in the Models
4. Results and Discussions
4.1. Energy Analysis and Exergy Anlysis of Variable-Condition Mode
4.2. Energy Analysis and Exergy Anlysis of Heat-Returning Mode
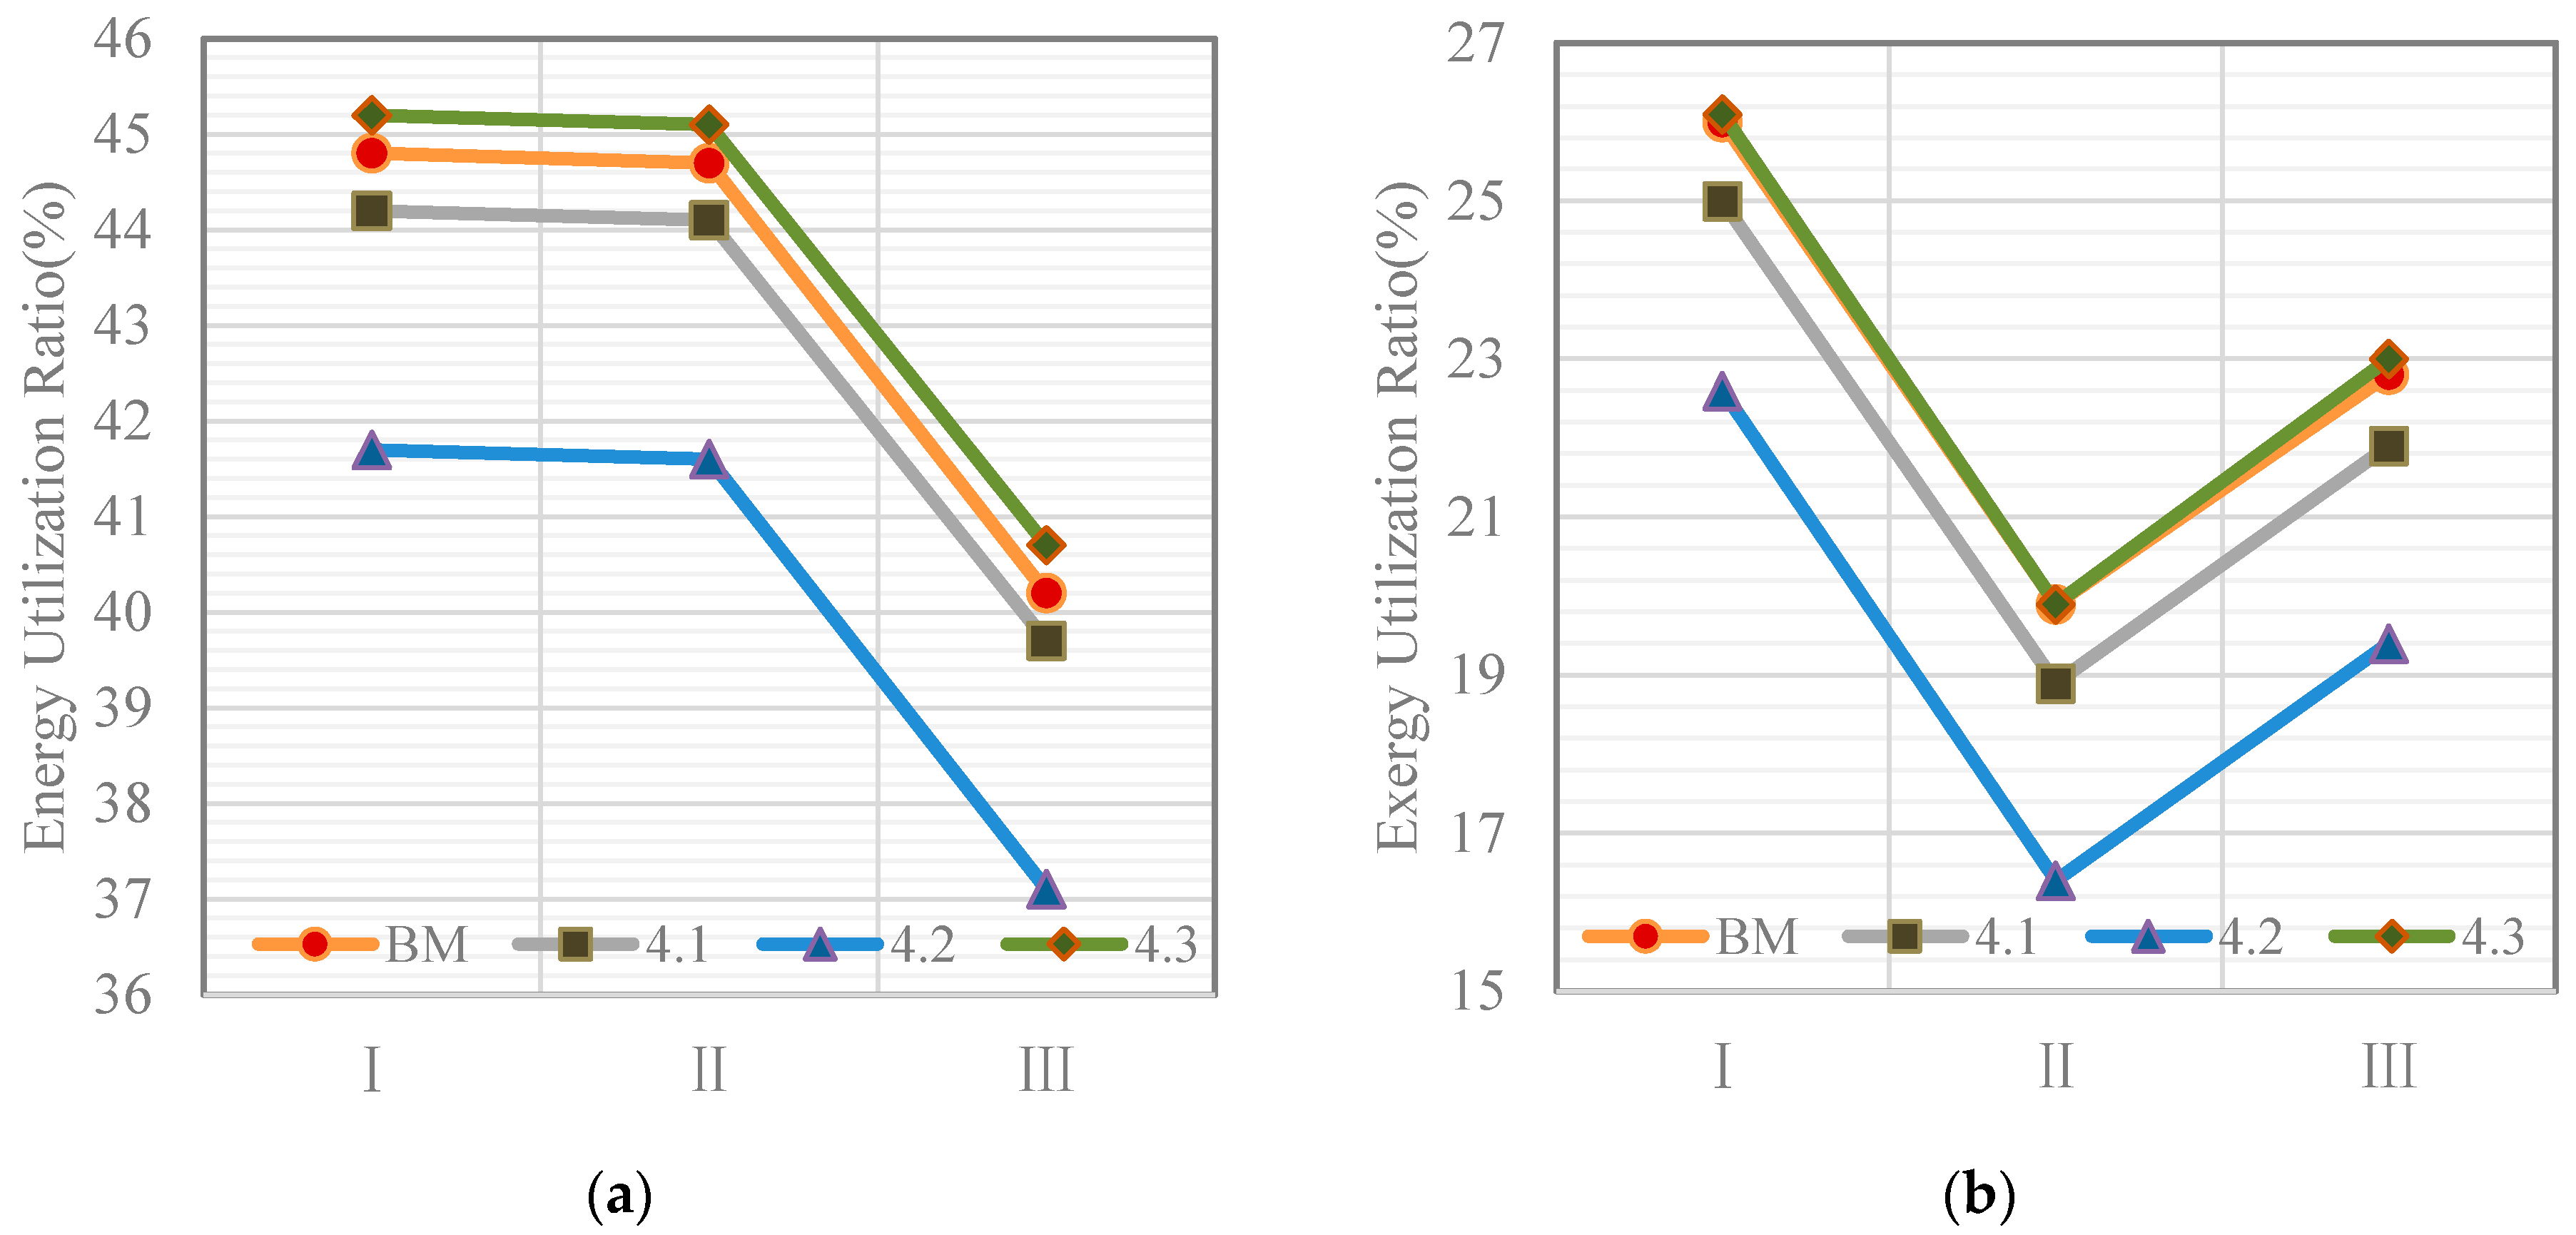
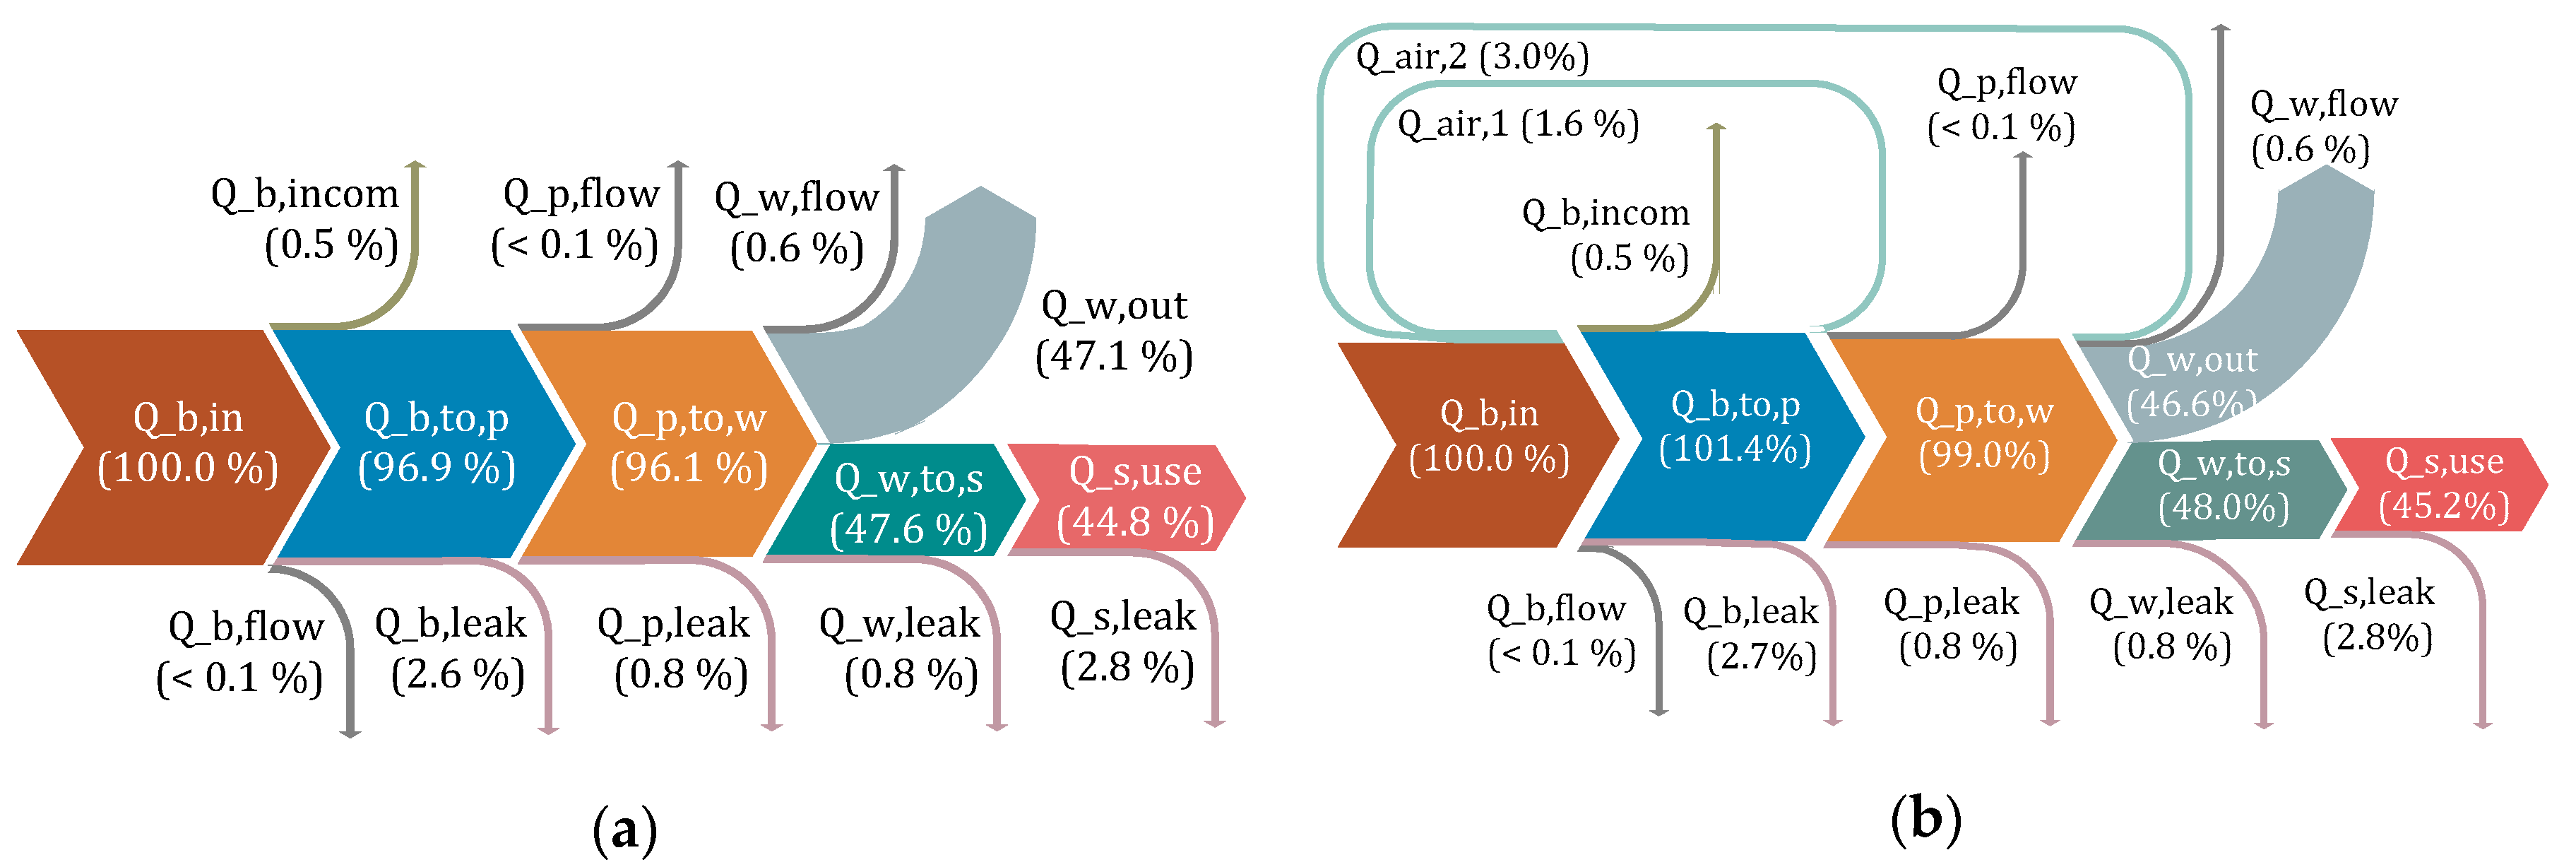
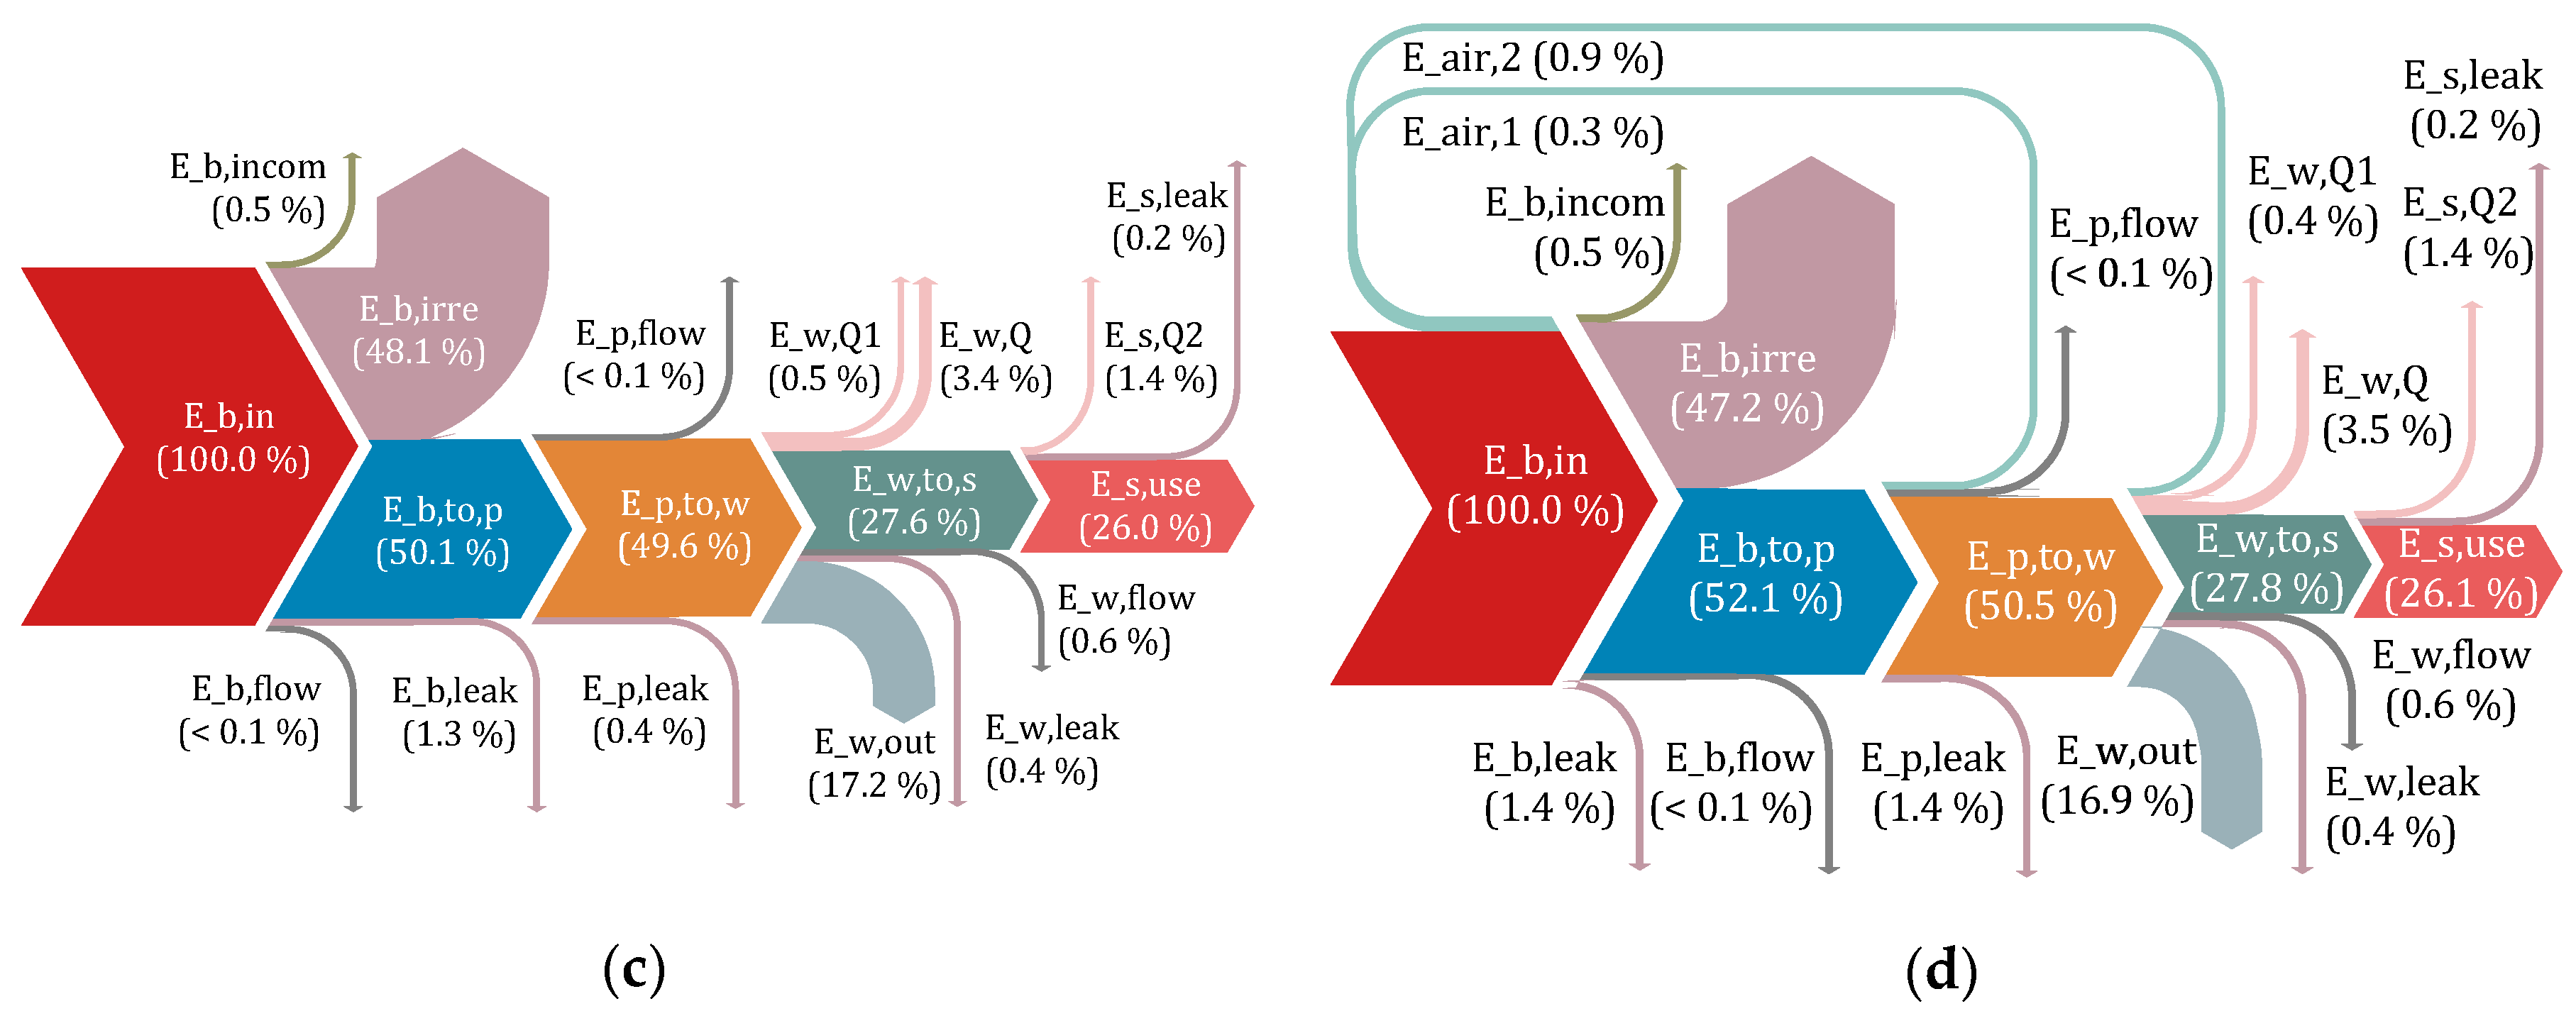
4.3. Energy Analysis and Exergy Anlysis of Air-Preheating Mode
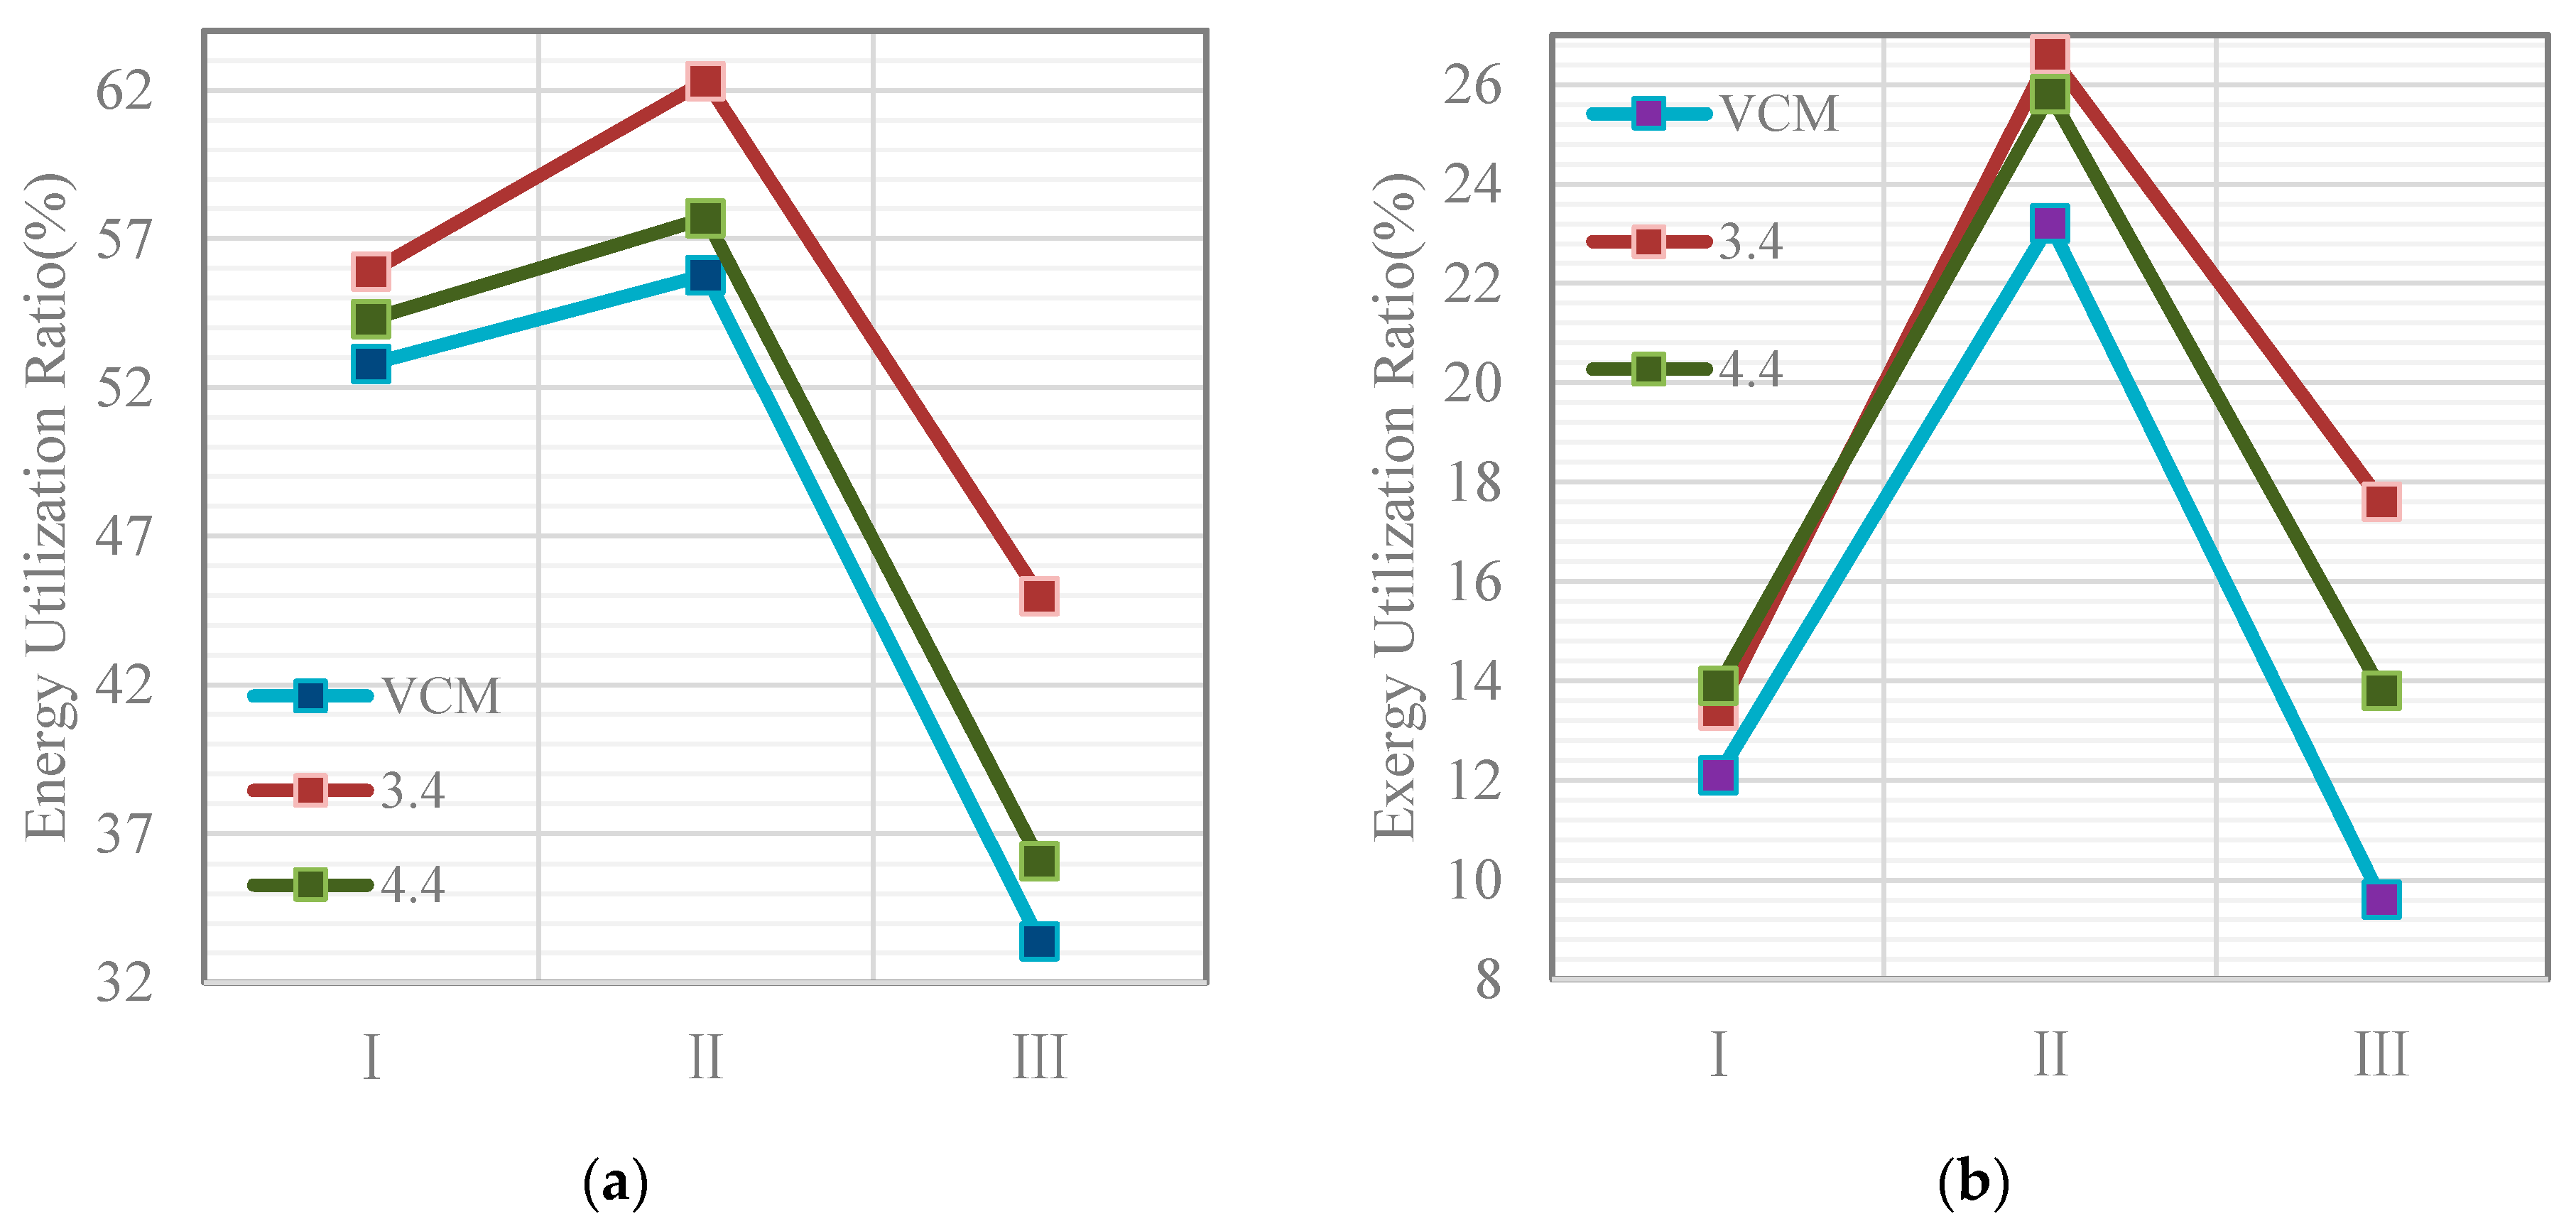
4.4. Energy Analysis and Exergy Anlysis of Comprehensive Energy-Saving Strategies
5. Conclusions
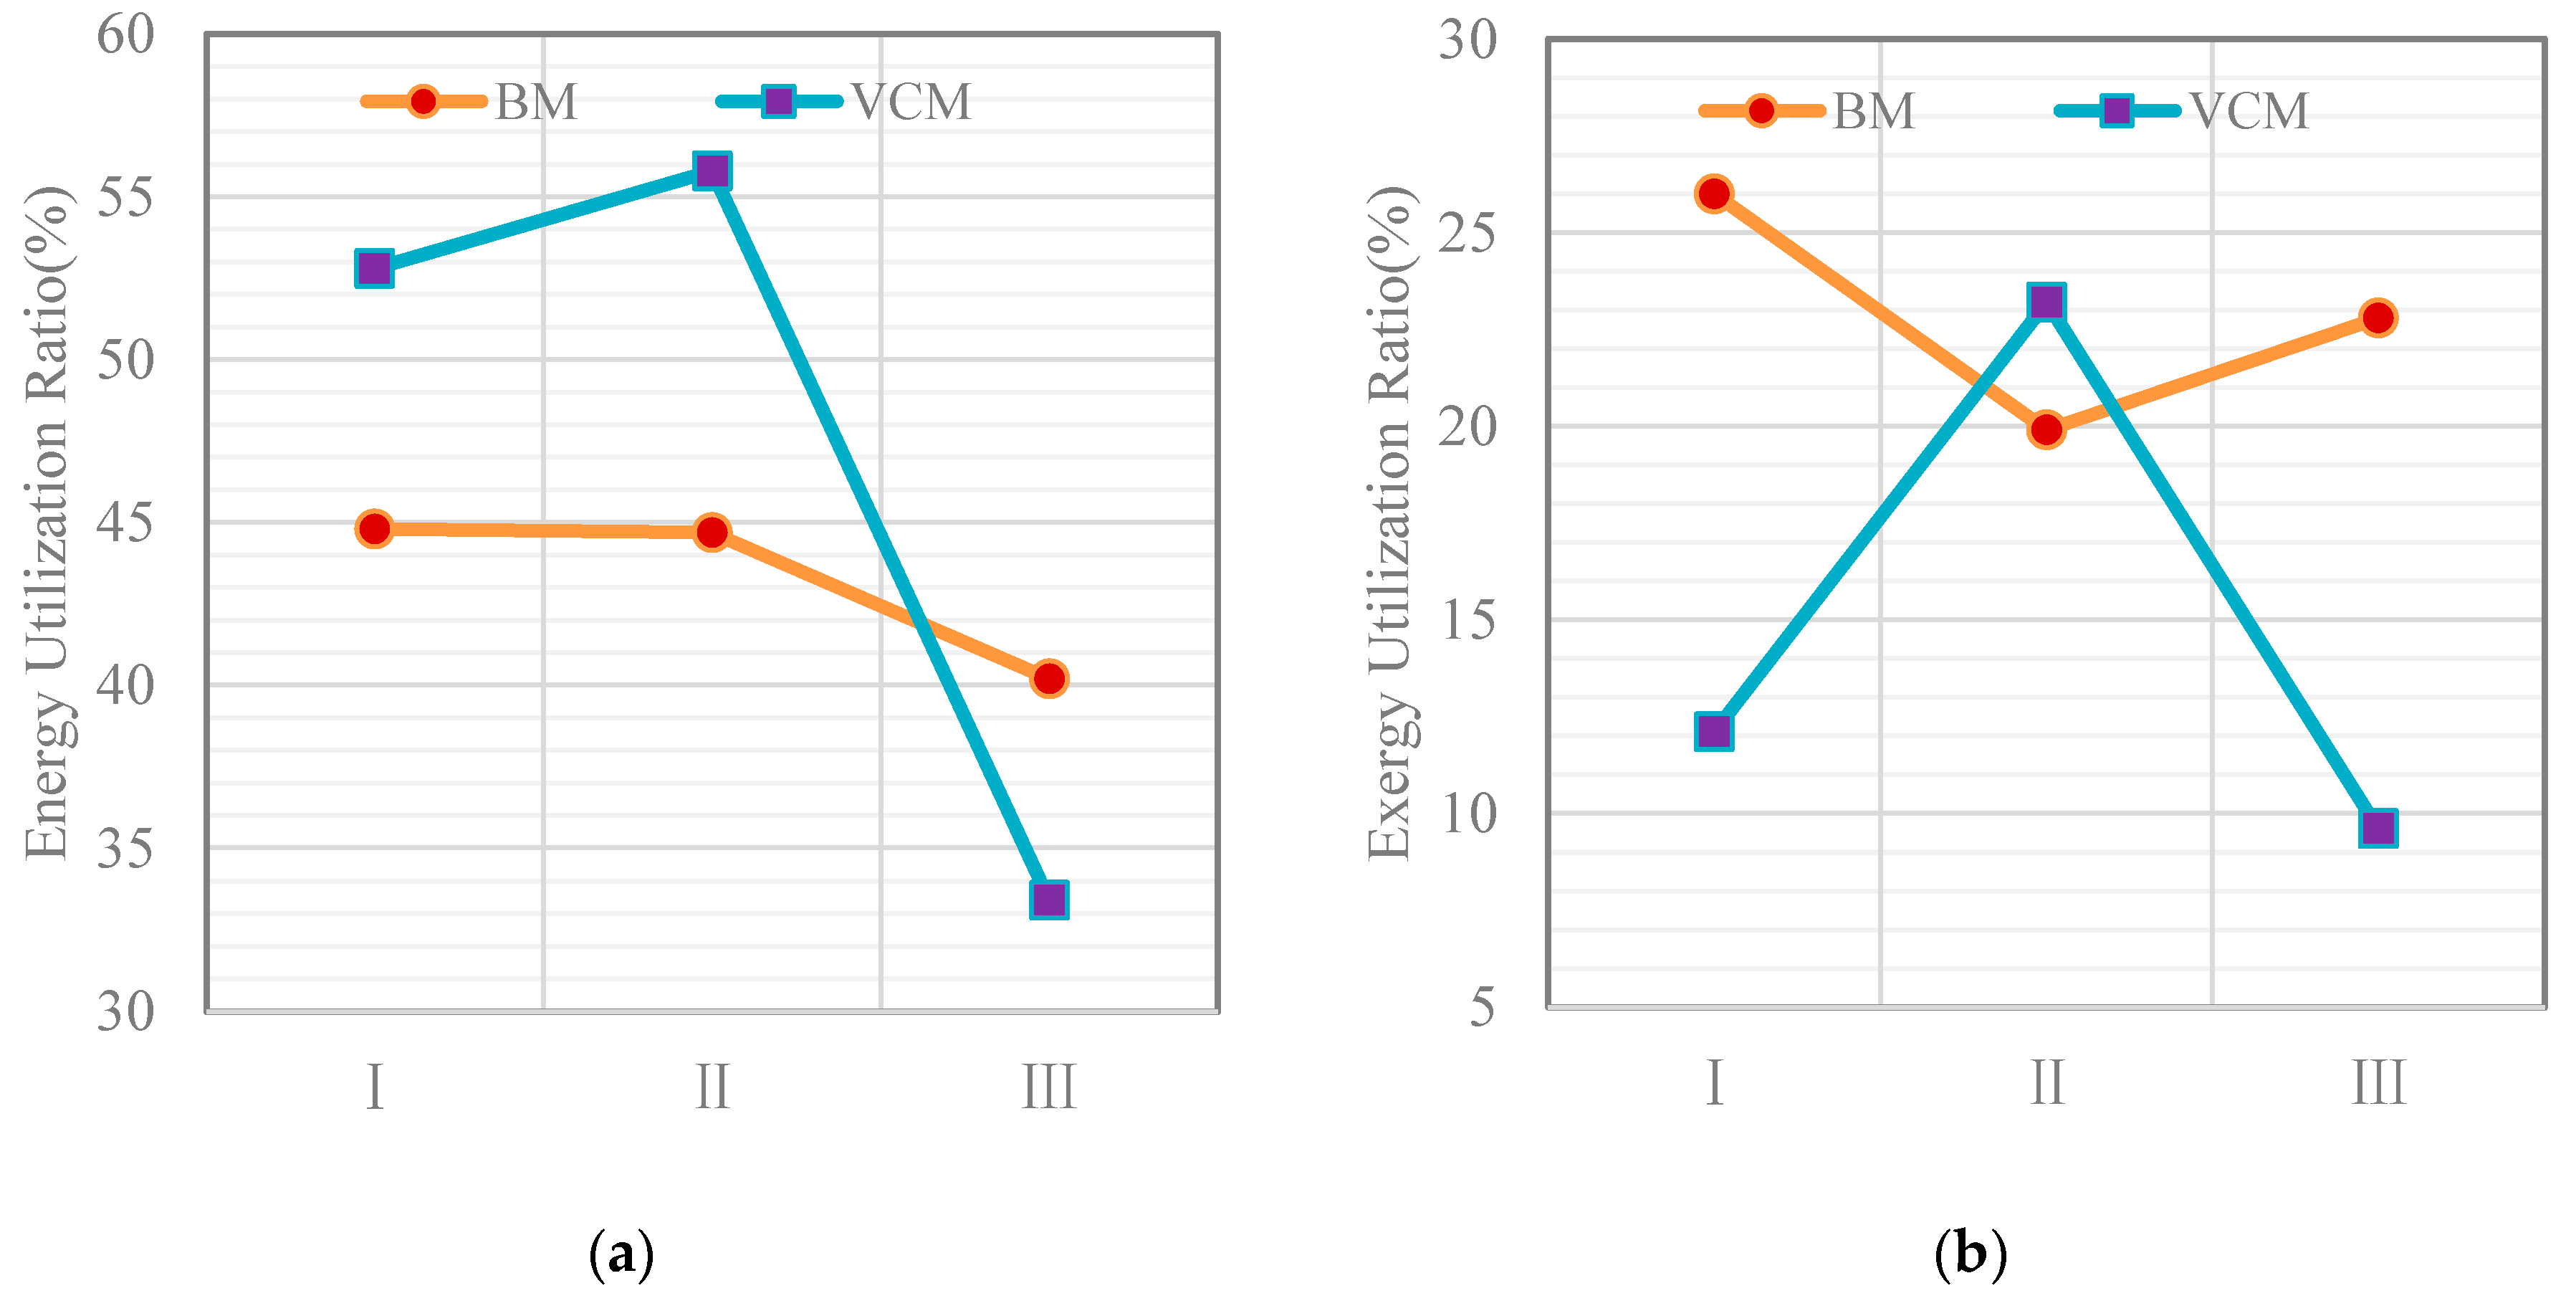
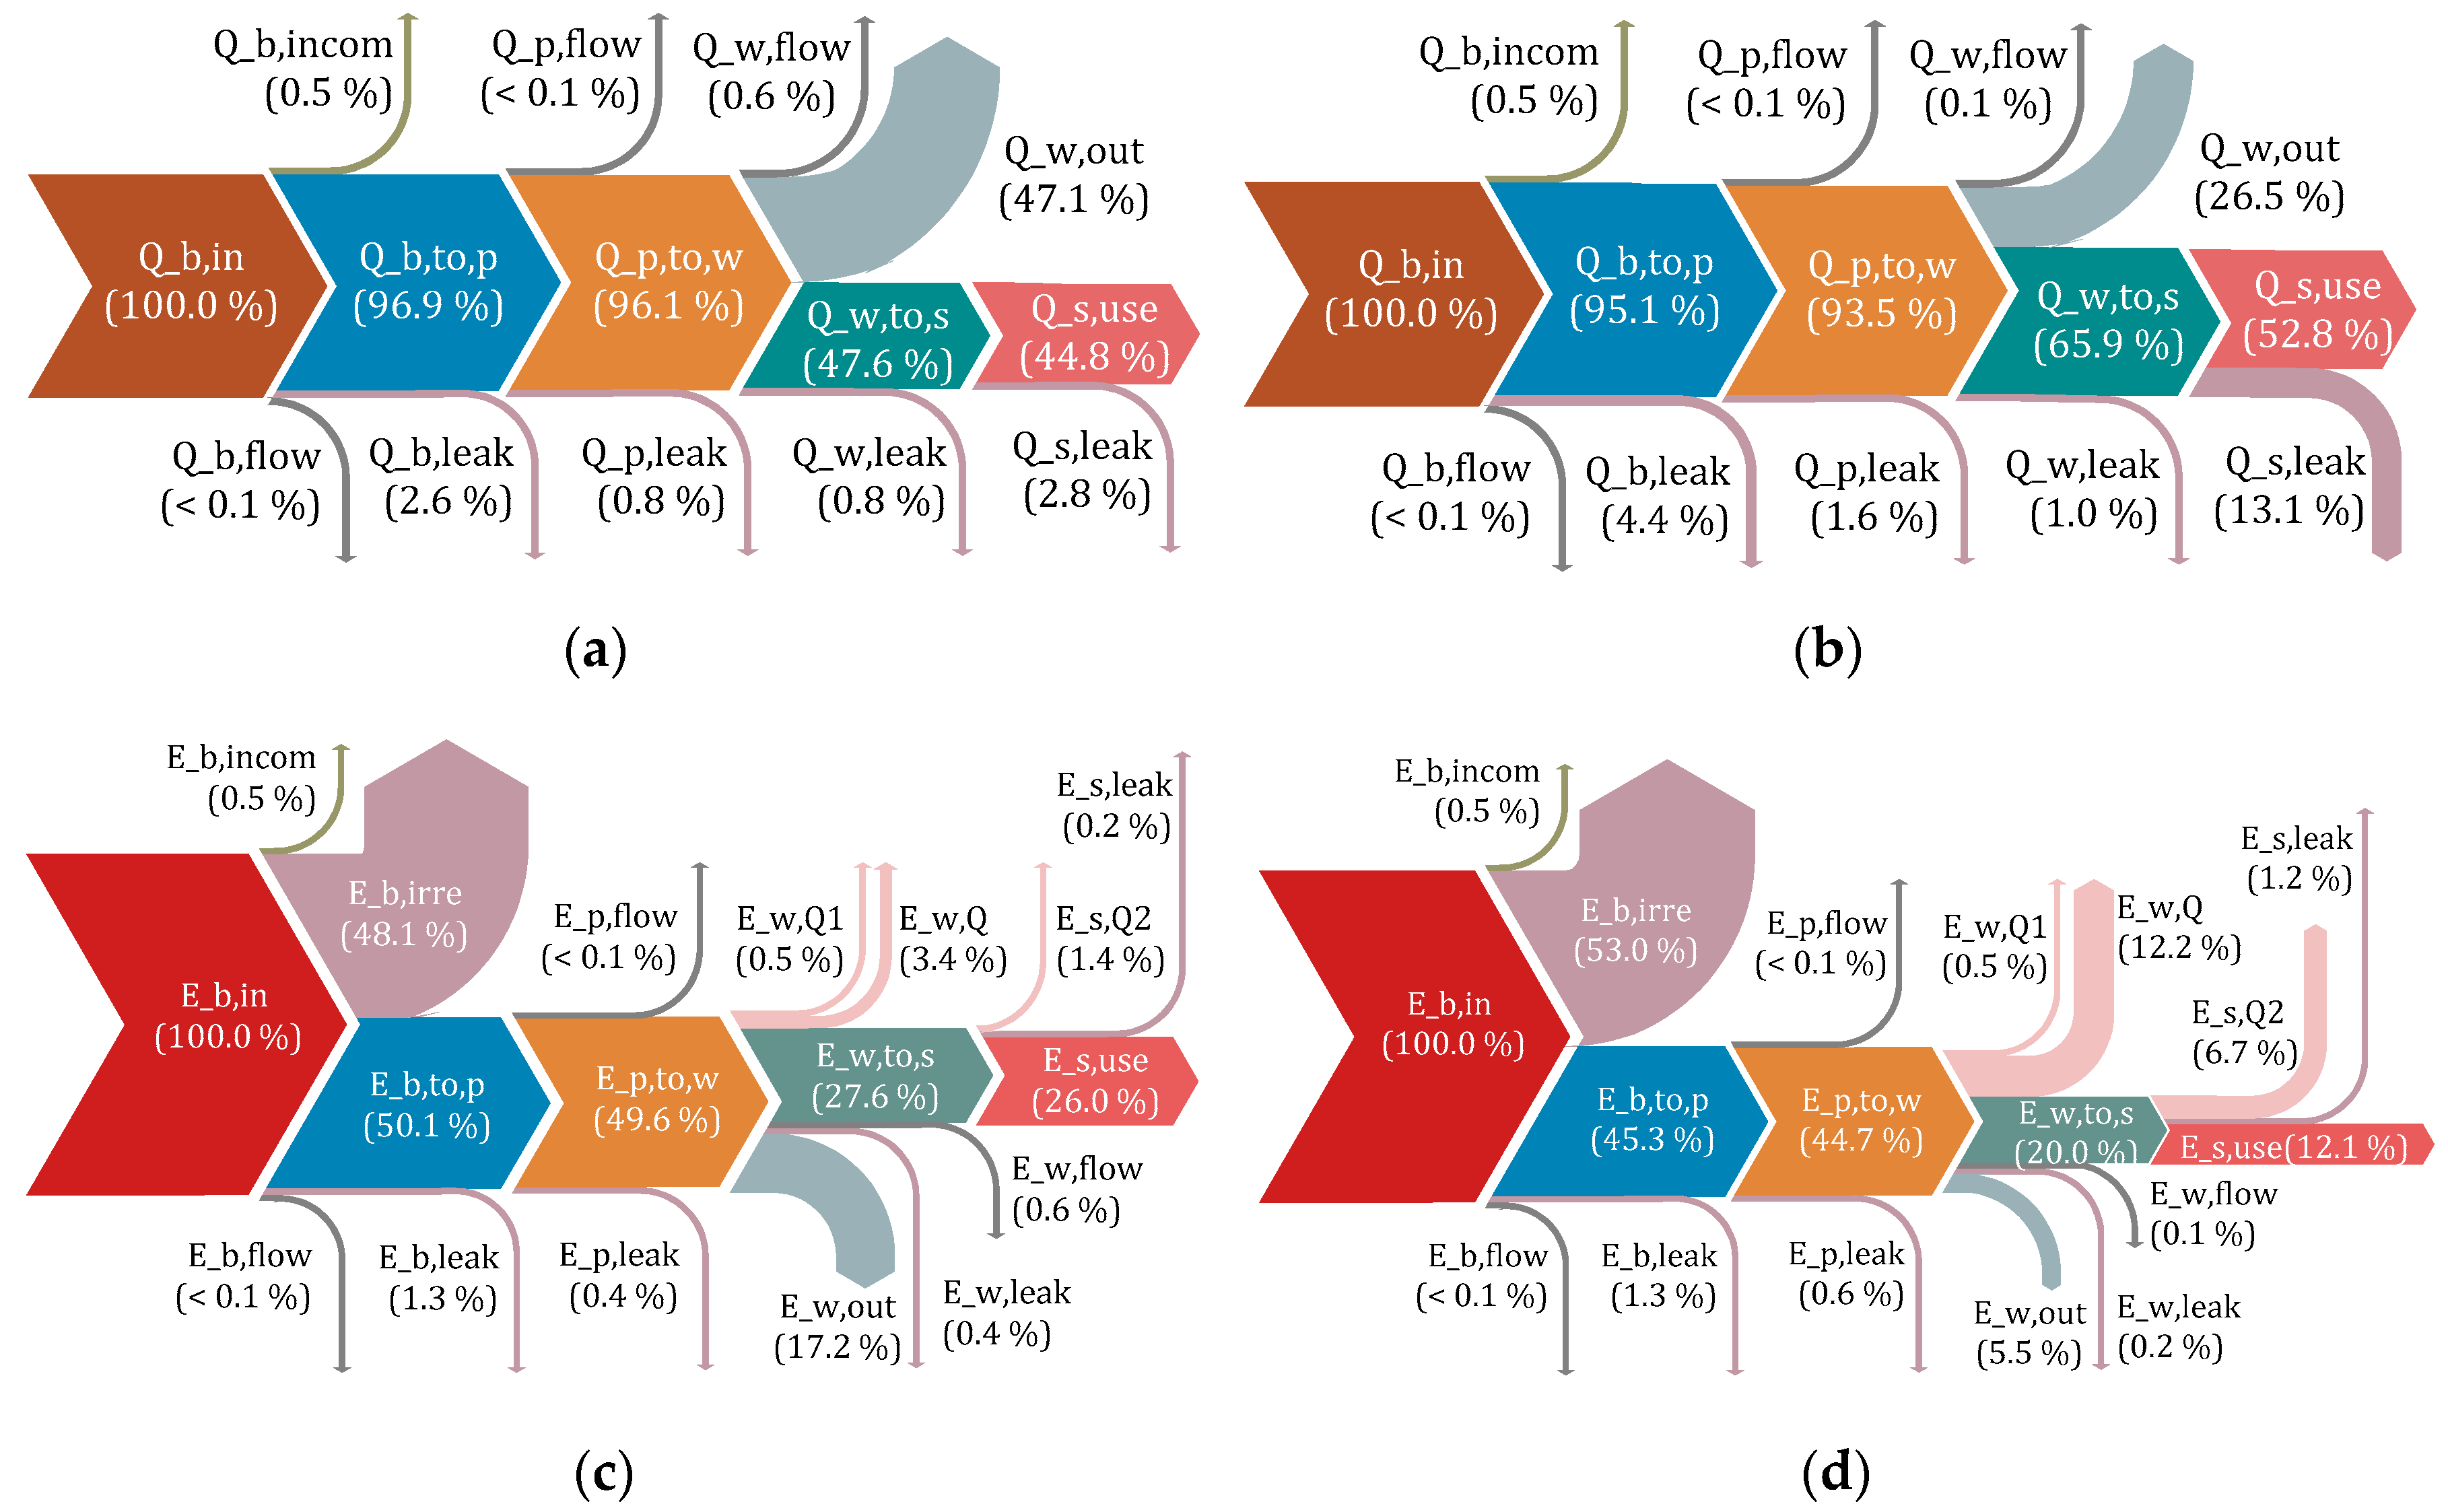
- The most effective part of the energy-saving strategy for variable-condition mode (VCM) is that under the premise of the same heating demand and heating time, the usage amount of natural gas (NG) can be saved highly. The number of mass flow rates in the first stage of variable-condition mode (VCM) is 0.0299 km per second, much smaller than 0.1124 km per second of basis method (BM). It can be observed that the energy utilization ratio of forced convection each stage is 2.6% lower than that of free convection, and exergy utilization ratio is 0.9% lower as well. In VCM, the energy utilization ratio of stage and stage is better than that of the same stage in BM.
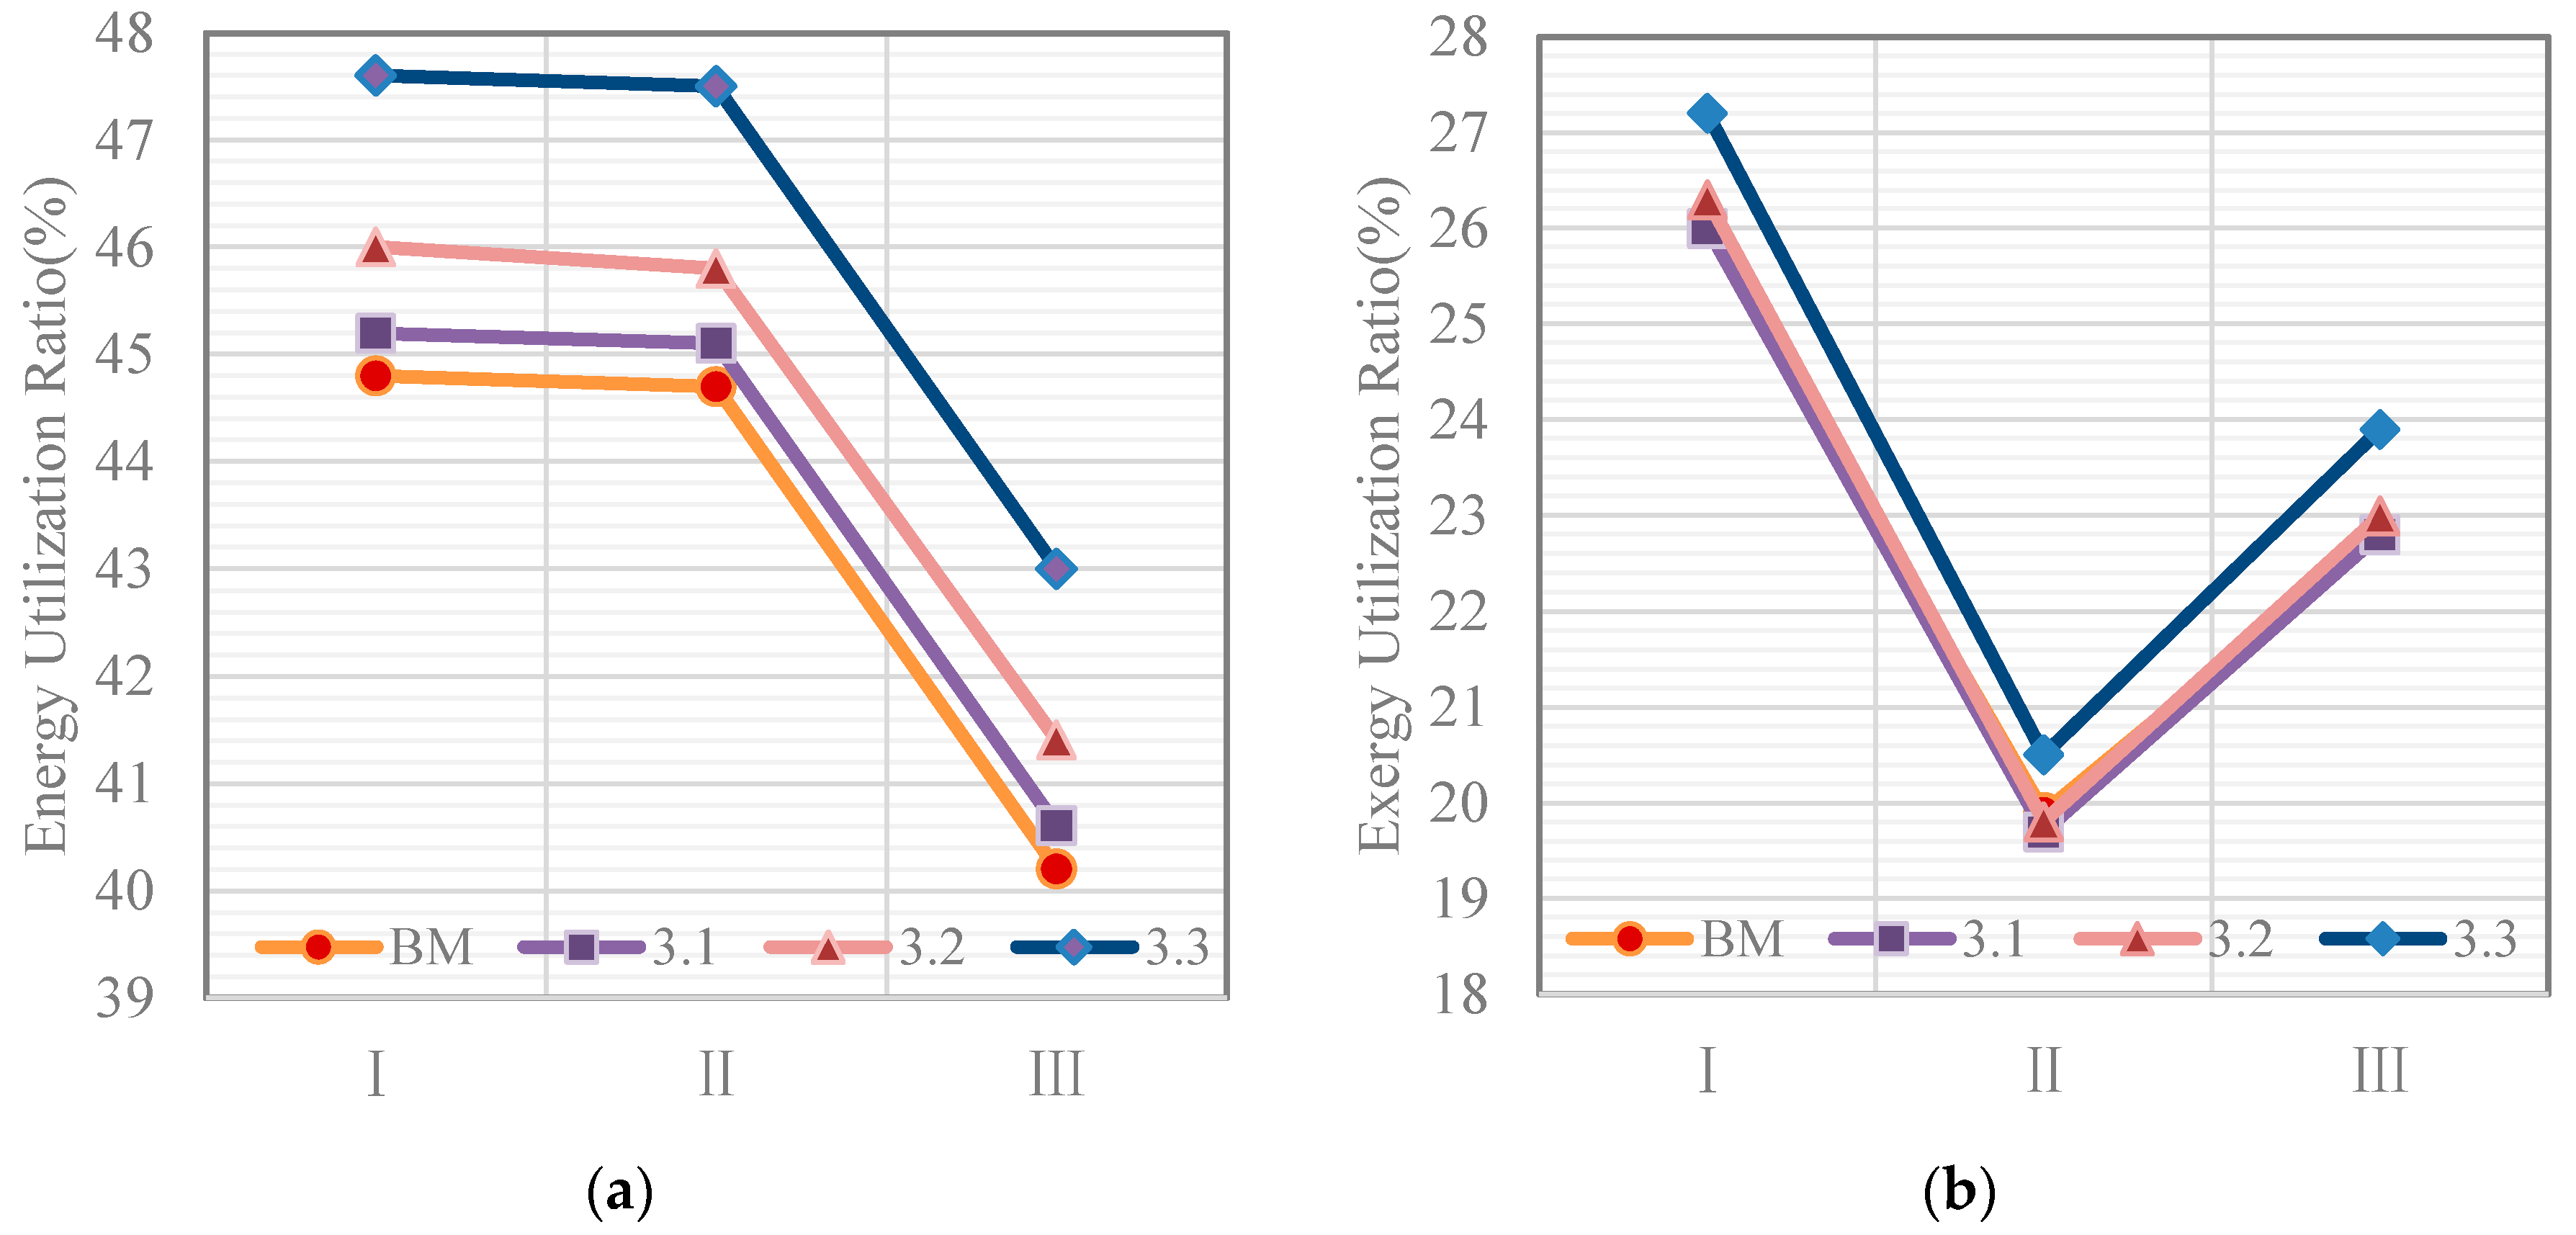
- All three energy-saving strategy cases for heat-returning mode have utilization ratios of 3% on average higher than the basic method (BM), and the utilization ratios increase with increasing rate of heat return. Case 3.3 with the largest rate of heat return has the best energy utilization ratio and exergy utilization ratio no matter what stage, which means the most significant energy-saving effect. That is because it is using the regenerative energy that to make more energy go into the system initially and it also results in more energy being used to heat the soil ultimately with an initial energy of 1 km of natural gas.
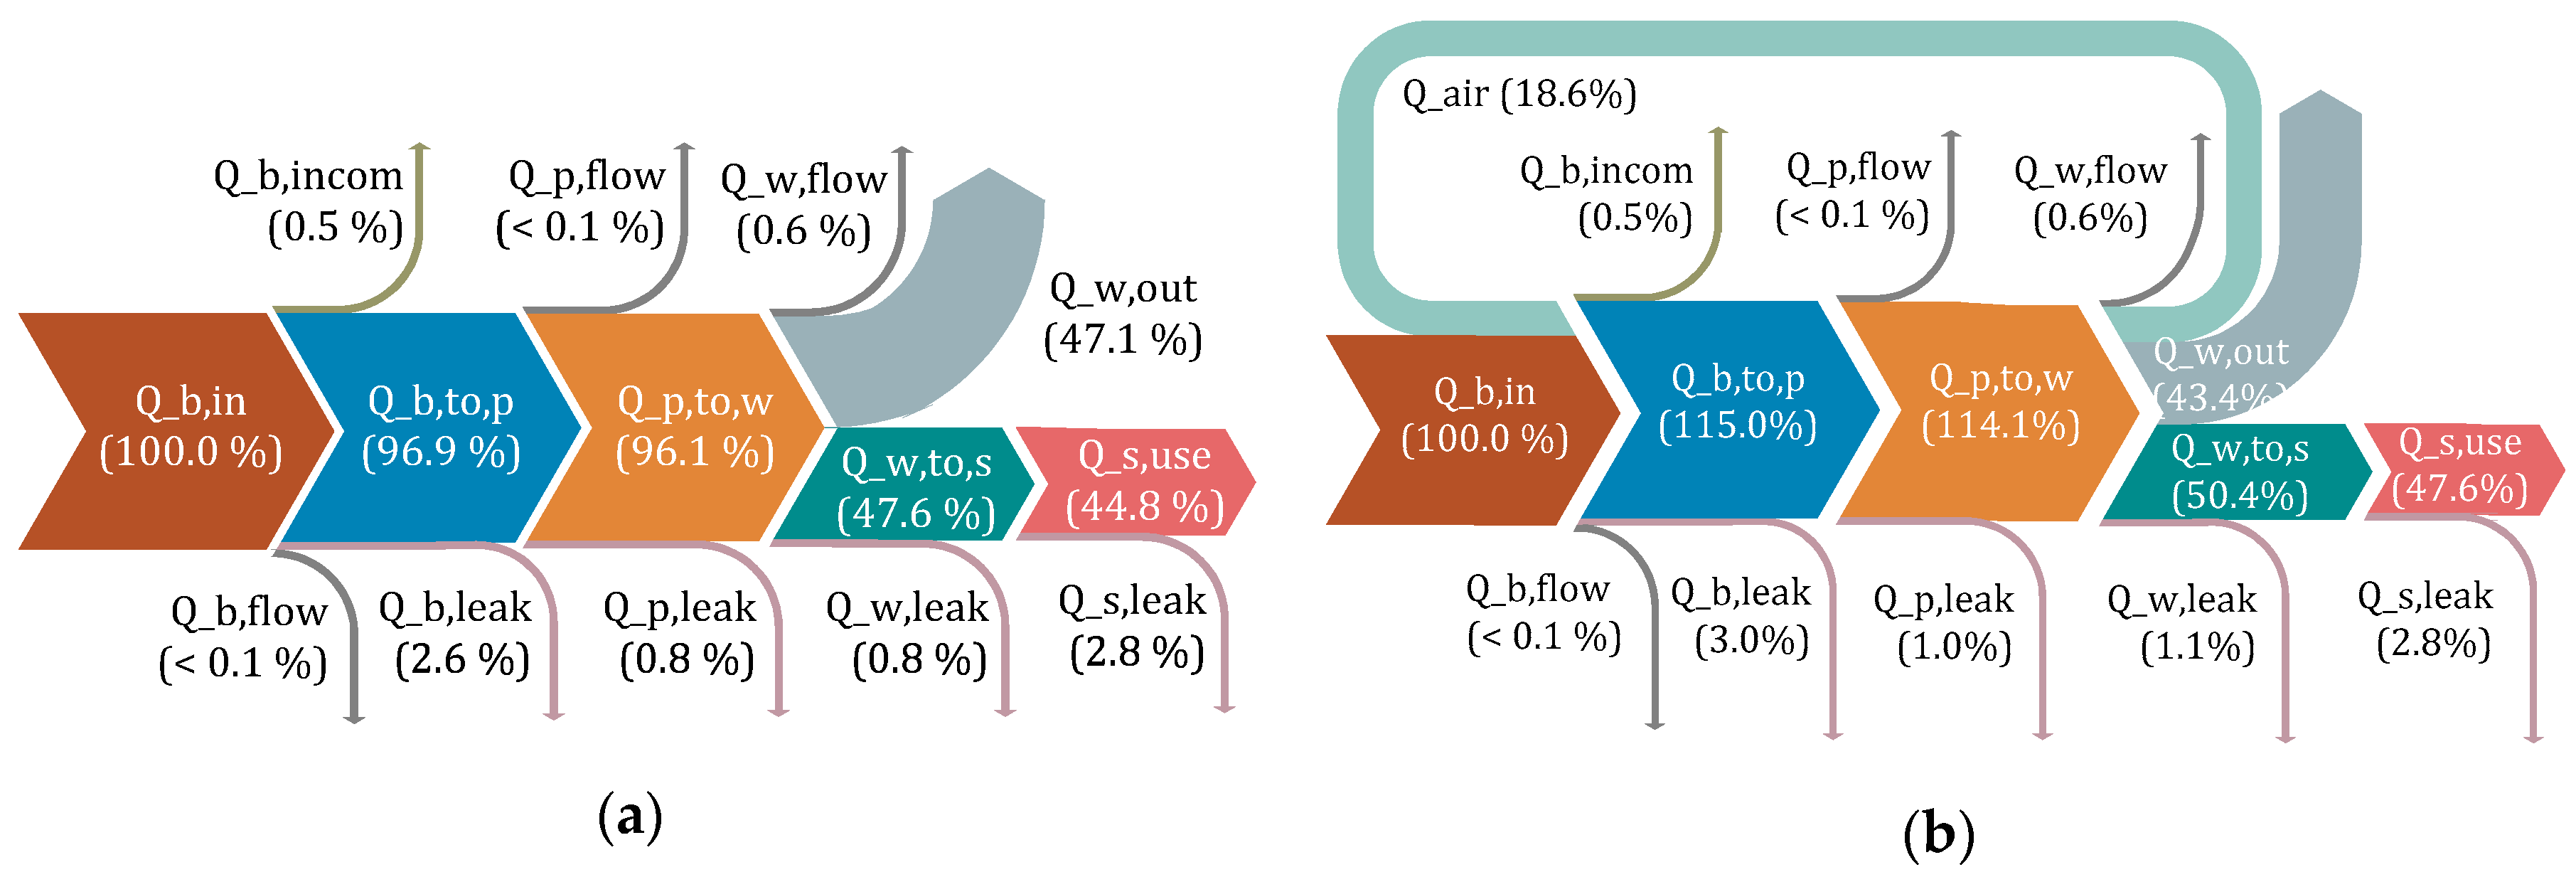
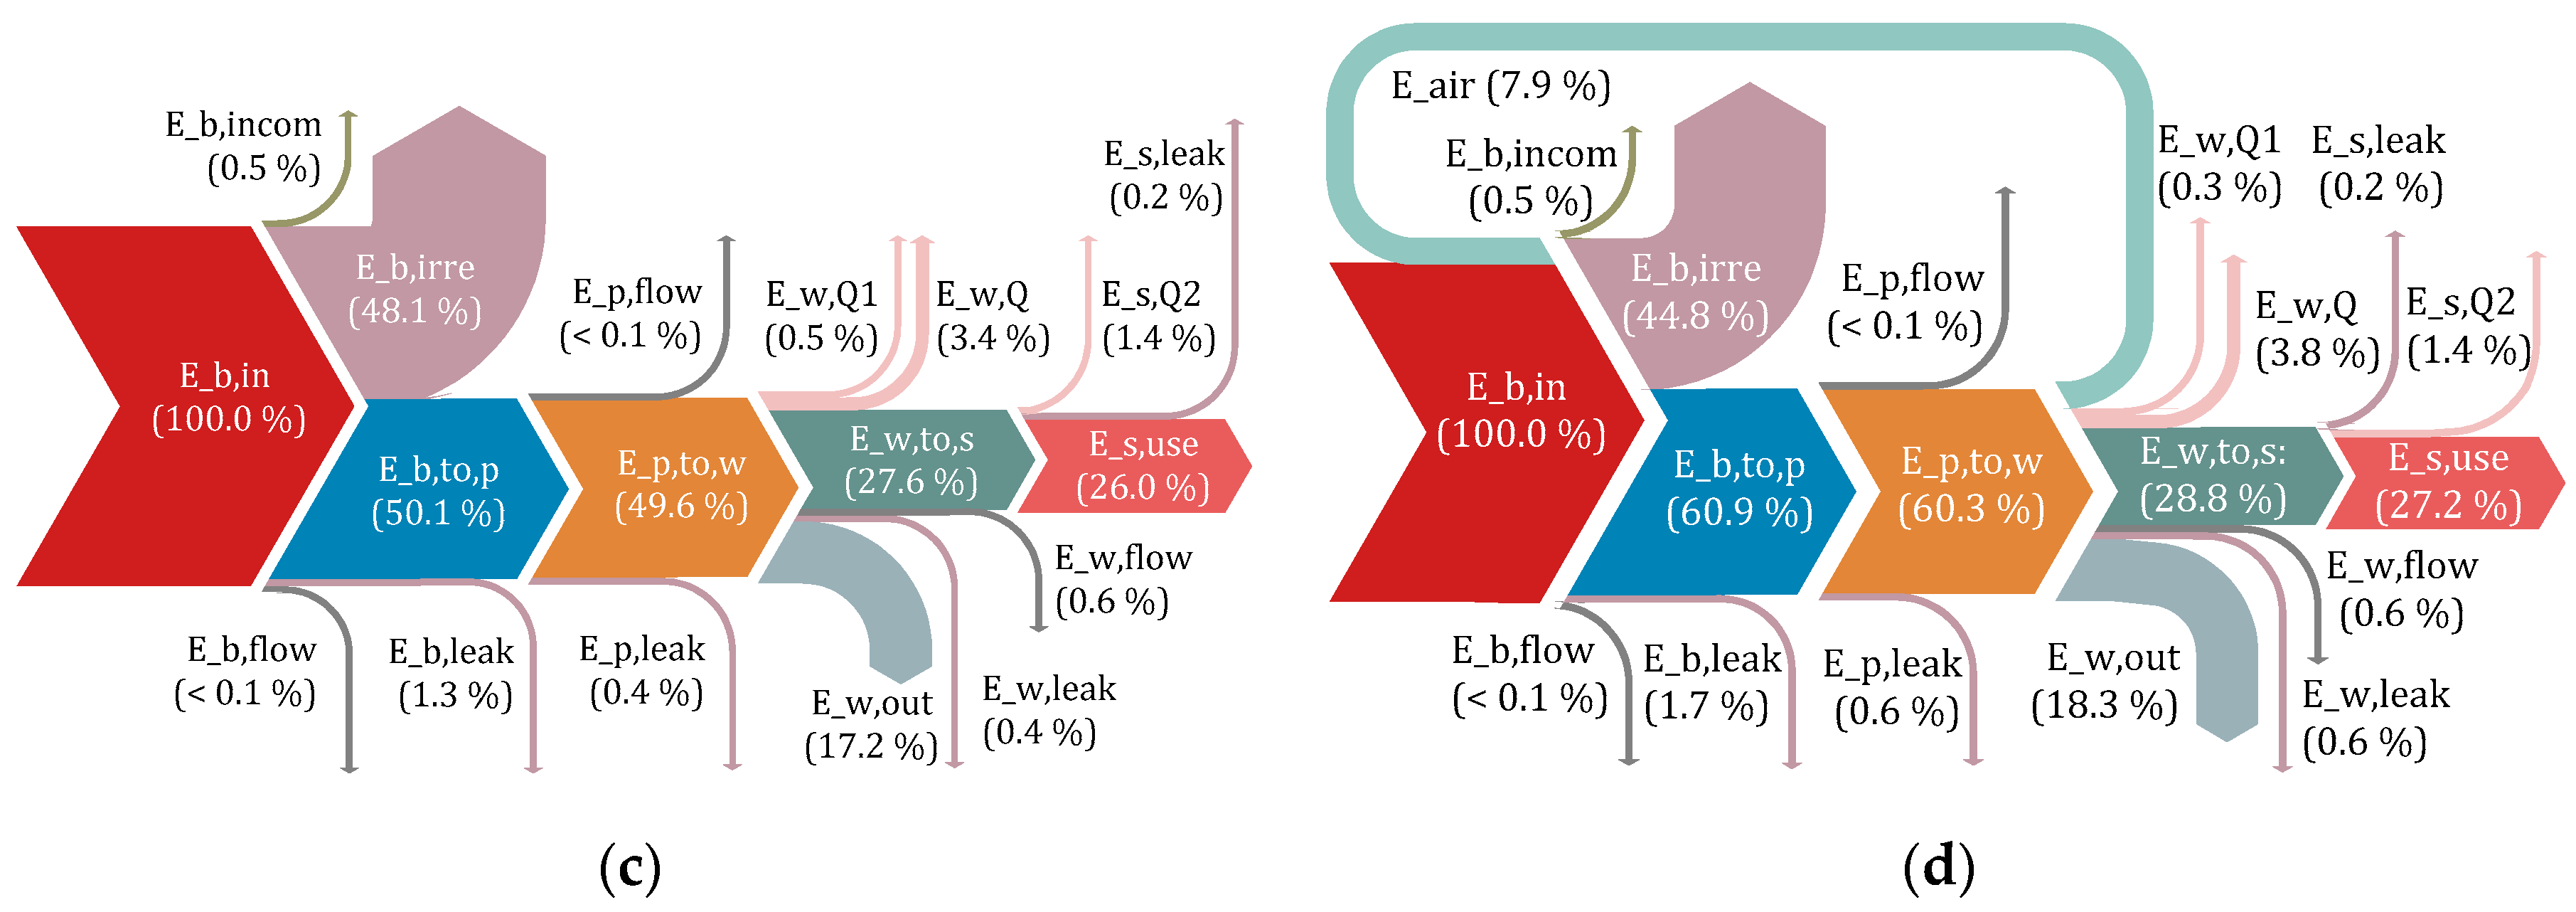
- In the analysis of energy-saving strategies for air-preheating mode, the air flowing through the preheater 1 to be preheated is not conducive to the improvement of utilization ratio and energy saving and the effect of the preheater 1 wasting energy increases with the proportion of air passing through it. While the preheater 2 performs better, the energy utilization ratio of Case 4.3 is bigger than that of BM and the exergy utilization ratio is similar to that of BM under the bad interference of preheater 1. The underlying reason is that preheater 1 uses the energy to flow to the next component, while preheater 2 uses the waste heat to be drained into the air. So making full use of waste heat is the wonderful way to save energy.
- The comprehensive energy-saving strategies are mainly to compare air-preheating mode combined with variable-condition mode (VCM) and heat-returning mode combined with variable-condition mode (VCM). The results indicate that the Case 3.4 has the best energy utilization ratio in all three stages by combining the advantages of variable-condition mode (VCM) and heat-returning mode, and the results of Case 4.4 have the same implications. That is to say, combination of two energy-saving strategies can bring the improvement of fuel saving and energy efficiency at the same time and it is recommendable.
Author Contributions
Funding
Conflicts of Interest
Nomenclature
| Area () | Thermal conductivity (W/(m*K)) | ||
| Constant, depending on the Reynolds number | Kinematic viscosity () | ||
| Diameter (m) | Coefficient of local energy loss | ||
| Exergy (kJ/kg) | Total time of the stage (days) | ||
| Reactant exergy (kJ/kg) | Subscript | ||
| Resultant exergy (kJ/kg) | Air | ||
| Exergy loss due to heat transfer process(kJ/kg) | Burner | ||
| Exergy loss due to non-isothermal heat release(kJ/kg) | Flow loss in the burner | ||
| Exergy loss due to non-isothermal absorption of heat(kJ/kg) | Incomplete combustion in the burner | ||
| Heat exergy of at (kJ/kg) | Irreversible combustion in the burner | ||
| Heat exergy of at (kJ/kg) | Thermal leakage in the burner | ||
| Gravitational acceleration () | From burner to pipe | ||
| Mass flow rate (kg/s) | The outer wall of burner | ||
| Grashof number | Interior burner | ||
| Convective heat transfer coefficient (W/(·°C) | External burner | ||
| characteristic length (m) | Exhaust | ||
| Length(m) | Fluid in the burner | ||
| Quality of dry soil (kg) | Fluid in the pipe | ||
| Quality of soil (kg) | Fluid in the well | ||
| Quality of water in the soil (kg) | Insulating layer | ||
| Constant, depending on the Reynolds number | At qualitative temperature | ||
| Nusselt number | Natural gas | ||
| Prandtl number | Extended well | ||
| Energy (kJ/kg) | Pipe | ||
| Lower calorific value (kJ/kg) | Flow loss in the pipe | ||
| Higher calorific value (kJ/kg) | Input of pipe | ||
| Reynolds number | Thermal leakage in the pipe | ||
| Temperature (°C) | From pipe to well | ||
| Adiabatic combustion temperature (°C) | The outer wall of pipe | ||
| Ambient temperature (°C) | Soil | ||
| Soil temperature at the end of stage (°C) | Absorbed by the soil | ||
| Kelvin temperature (K) | Unheated soil | ||
| Kelvin temperature of intermediate high temperature heat source (K) | Input of soil | ||
| Kelvin temperature of intermediate low temperature heat source (K) | Thermal leakage in the soil | ||
| Ambient kelvin temperature (K) | Thermal leakage from soil to soil | ||
| Velocity (m/s) | Thermal leakage from soil to air | ||
| Greek symbols | Well | ||
| Excess air coefficient | Flow loss in the well | ||
| Cubic expansion coefficient | Input of well | ||
| Latent heat of vaporization (kJ/kg) | Thermal leakage in the well | ||
| Thickness (m) | Output of well | ||
| Temperature difference (°C) | Well to soil | ||
| Incomplete combustion coefficient | The outer wall of extended well | ||
| Energy utilization ratio | The first stage | ||
| Exergy utilization ratio | The second stage | ||
| Coefficient of path energy loss | The third stage | ||
Appendix A

| Parameters | Value |
|---|---|
| Specific heat of gas in burner | 1.2390 kJ/(kg*K) |
| Specific heat of exhaust | 1.1850 kJ/(kg*K) |
| Specific heat of pure soil | 0.84 kJ/(kg*K) |
| Specific heat of soil | 1.8480 kJ/(kg*K) |
| Specific heat of well | 4.2 kJ/(kg*K) |
| Inner diameter of burner | 190 mm |
| External diameter of burner | 200 mm |
| Inner diameter of pipe | 89 mm |
| External diameter of pipe | 97 mm |
| Inner diameter of well | 89 mm |
| External diameter of well | 97 mm |
| Acceleration of gravity | 9.8 m/s2 |
| Length of burner | 0.5m |
| Length of extension of the well | 0.3 m |
| Length of pipe | 0.2 m |
| Length of well | 13 m |
| Radius of heated soil | 1.5 m |
| Radius of unheated soil | 2 m |
| Thermal conductivity of burner | 0.0311 W/(m*K) |
| Thermal conductivity of fluid | Differs from parts |
| Thermal conductivity of pipe | 0.0231 W/(m*K) |
| Thermal conductivity of soil | 1.2 W/(m*K) |
| Thermal conductivity of well | 0.0209 W/(m*K) |
| Kinematic viscosity of air | 30× |
| Parameter | Meaning | Parameter | Meaning |
|---|---|---|---|
| Energy of air to burner | Exergy of air to burner | ||
| Input energy to burner of 1kg NG | Input exergy to burner of 1kg NG | ||
| Energy from burner to pipe | Exergy from burner to pipe | ||
| Energy loss of incomplete combustion | Exergy loss of irreversible combustion | ||
| Energy loss of flow in burner | Exergy loss of incomplete combustion | ||
| Energy loss of heat leakage in burner | Exergy loss of flow in burner | ||
| Energy from pipe to well | Exergy loss of heat leakage in burner | ||
| Energy loss of flow in pipe | Exergy from pipe to well | ||
| Energy loss of heat leakage in pipe | Exergy loss of flow in pipe | ||
| Output energy of exhaust from well | Exergy loss of heat leakage in pipe | ||
| Energy from well to soil | Output exergy of exhaust from well | ||
| Energy loss of flow in well | Exergy from well to soil | ||
| Energy loss of heat leakage in well | Exergy loss of flow in well | ||
| Energy that soil use | Exergy loss of heat leakage in well | ||
| Energy loss of heat leakage in soil | Exergy loss of non-isothermal heat release | ||
| Exergy loss of non-isothermal heat absorption | Exergy loss of heat transfer | ||
| Exergy loss of heat leakage in soil | Exergy that soil use |
Appendix B. Calculation of Intermediate Parameters

References
- Yao, Z.T.; Li, J.H.; Xie, H.H.; Yu, C.H. Review on remediation technologies of soil contaminated by heavy metals. In Proceedings of the 7th International Conference on Waste Management and Technology, Beijing, China, 5–7 September 2012. [Google Scholar]
- European Environment Agency. The European Environment e State and Outlook 2010: Soil; European Environment Agency: Copenhagen, Denmark, 2010; p. 44.
- Liu, K.; Zhang, R.H.; Wang, S.J. Development and application of in situ thermal desorption for the remediation of contaminated sites. China Chlor. Alkali 2017, 12, 31–37. [Google Scholar]
- Zhou, D.M.; Hao, X.Z.; Xue, Y. Advances in remediation technologies of contaminated soils. Ecol. Environ. Sci. 2004, 13, 234–242. [Google Scholar]
- Cappuyns, V. Environmental impacts of soil remediation activities: Quantitative and qualitative tools applied on three case studies. J. Clean. Prod. 2013, 52, 145–154. [Google Scholar] [CrossRef]
- Ministry of Environmental Protection of the People’s Republic of China. Bulletin on Chinese Domestic Environmental Conditions of 2000 Year; Ministry of Environmental Protection of the People’s Republic of China: Beijing, China, 2001.
- Aresta, M.; DiBenedetto, A.; Fragale, C.; Giannoccaro, P.; Pastore, C.; Zammiello, D.; Ferragina, C. Thermal desorption of polychlorobiphenyls from contaminated soils and their hydrodechlorination using Pd- and Rh-supported catalysts. Chemosphere 2008, 70, 1052–1058. [Google Scholar] [CrossRef]
- United States Environmental Protection Agency, Office of Solid Waste and Emergency Response. A Citizen’s Guide to Thermal Desorption; 542-F-01-003; United States Environmental Protection Agency, Office of Solid Waste and Emergency Response: Washington, DC, USA, 2001; p. 2.
- Luo, Y.M. Current Research and Development in Soil Remediation Technologies. Prog. Chem. 2009, 21, 558–565. [Google Scholar]
- Araruna, J.T.J.; Portes, V.L.O.; Soares, A.P.L. Oil spills debris clean up by thermal desorption. J. Hazard. Mater. 2004, 110, 161–171. [Google Scholar] [CrossRef] [PubMed]
- Yeung, A.T. Remediation technologies for contaminated sites. In Advances in Environmental Geotechnics; Zhejiang University Press: Hangzhou, China, 2010; pp. 328–369. [Google Scholar]
- Feng, J.S.; Zhang, Q.C. A Review on the Study on Practice of Soil Remediation in situ. Ecol. Environ. Sci. 2014, 23, 1861–1867. [Google Scholar]
- Fang, X.L.; Wang, Z.Z. Advances in in situ soil remediation technology. Agric. Technol. 2015, 18, 29–30. [Google Scholar]
- Lu, L.Q.; Ye, C.M. Advances in in situ remediation of heavy metal contaminated soils. Anhui Agric. Sci. Bull. 2017, 21, 69–70. [Google Scholar]
- George, L.S.; Harold, J.V. Thermal conduction heating for in situ thermal desorption of soils. J. Hazard. Radioact. Waste Treat. Technol. Handb. 2001, 1–37. [Google Scholar]
- Soesilo, J.A.; Stephanie, R.W. Site Remediation: Planning and Management; CRC Press: Boca Raton, FL, USA, 1997. [Google Scholar]
- Saadaoui, H.; Jourdain, S.; Falcinelli, U.; Haemers, J. In situ thermal treatment in urban polluted areas: Application of thermopile. In Proceedings of the 10th Consoil Conference, Milan, Italy, 3–6 June 2008; pp. 1–10. [Google Scholar]
- Julia, E.V.; Kyriacos, Z.; Caroline, A.M.; Gabriel, S.; Pedro, J.J.A. Masiello Thermal Treatment of Hydrocarbon-Impacted Soils: A Review of Technology Innovation for Sustainable Remediation. J. Eng. 2016, 2, 426–437. [Google Scholar]
- Rada, E.C.; Andreottola, G.; Istrate, I.A.; Viotti, P.; Conti, F.; Magaril, E.R. Remediation of Soil Polluted by Organic Compounds Through Chemical Oxidation and Phytoremediation Combined with DCT. Int. J. Environ. Res. Public Health 2019, 16, 3179. [Google Scholar] [CrossRef] [PubMed]
- Sun, Y.; Guan, F.; Yang, W.; Wang, F. Removal of Chromium from a Contaminated Soil Using Oxalic Acid, Citric Acid, and Hydrochloric Acid: Dynamics, Mechanisms, and Concomitant Removal of Non-Targeted Metals. Int. J. Environ. Res. Public Health 2019, 16, 2771. [Google Scholar] [CrossRef] [PubMed]
- Geiger, E.M.; Sarkar, D.; Datta, R. Evaluation of Copper-Contaminated Marginal Land for the Cultivation of Vetiver Grass (Chrysopogon zizanioides) as a Lignocellulosic Feedstock and its Impact on Downstream Bioethanol Production. Appl. Sci. 2019, 9, 2685. [Google Scholar] [CrossRef]
- Tian, J.; Huo, Z.; Ma, F.; Gao, X.; Wu, Y. Application and Selection of Remediation Technology for OCPs-Contaminated Sites by Decision-Making Methods. Int. J. Environ. Res. Public Health 2019, 16, 1888. [Google Scholar] [CrossRef] [PubMed]
- Elyamine, A.M.; Moussa, M.G.; Afzal, J.; Rana, M.S.; Imran, M.; Zhao, X.; Hu, C.X. Modified Rice Straw Enhanced Cadmium (II) Immobilization in Soil and Promoted the Degradation of Phenanthrene in Co-Contaminated Soil. Int. J. Mol. Sci. 2019, 20, 2189. [Google Scholar] [CrossRef]
- Park, K.; Jung, W.; Park, J. Decontamination of Uranium-Contaminated Soil Sand Using Supercritical CO2 with a TBP–HNO3 Complex. Metals 2015, 5, 1788–1798. [Google Scholar] [CrossRef]
- Navarro, A.; Cañadas, I.; Rodríguez, J. Thermal Treatment of Mercury Mine Wastes Using a Rotary Solar Kiln. Minerals 2014, 4, 37–51. [Google Scholar] [CrossRef] [Green Version]
- Chonokhuu, S.; Batbold, C.; Chuluunpurev, B.; Battsengel, E.; Dorjsuren, B.; Byambaa, B. Contamination and Health Risk Assessment of Heavy Metals in the Soil of Major Cities in Mongolia. Int. J. Environ. Res. Public Health 2019, 16, 2552. [Google Scholar] [CrossRef]
- Huang, X.; Luo, D.; Chen, X.; Wei, L.; Liu, Y.; Wu, Q.; Xiao, T.; Mai, X.; Liu, G.; Liu, L. Insights into Heavy Metals Leakage in Chelator-Induced Phytoextraction of Pb- and Tl-Contaminated Soil. Int. J. Environ. Res. Public Health 2019, 16, 1328. [Google Scholar] [CrossRef] [PubMed]
- Lin, W.-C.; Lin, Y.-P.; Anthony, J.; Ding, T.-S. Avian Conservation Areas as a Proxy for Contaminated Soil Remediation. Int. J. Environ. Res. Public Health 2015, 12, 8312–8331. [Google Scholar] [CrossRef] [PubMed] [Green Version]
- Christopher, D.E.; Daniel, Z.; Kimberly, E.B.; Benjamin, T.T.; Tilottama, G.; Dee, W.P.; Edward, H.E.; Mikhail, Z. A fifteen year record of global natural gas flaring derived from satellite data. Energies 2009, 2, 595–622. [Google Scholar]
- Chen, J.; Wang, Y.-H.; Lang, X.-M.; Fan, S.-S. Energy-efficient methods for production methane from natural gas hydrates. J. Energy Chem. 2015, 24, 552–558. [Google Scholar] [CrossRef]
- Heinz, S.; Steve, H.-D.; Thomas, W.; Arne, G.; Yiyong, C.; James, W.; David, N.; Tim, B.; Manfred, L.; Anne, O. Decoupling global environmental pressure and economic growth: Scenarios for energy use, materials use and carbon emissions. J. Clean. Prod. 2016, 132, 45–56. [Google Scholar]
- Schmalensee, R.; Stoker, T.M.; Judson, R.A. World Carbon Dioxide Emissions: 1950–2050. Rev. Econ. Stat. 1998, 80, 15–27. [Google Scholar]
- Yu, H.; Zhang, Z.Y.; Hua, L.; Wei, Y.M. China’s farewell to coal: A forecast of coal consumption through 2020. Energy Policy 2015, 86, 444–455. [Google Scholar]
- Chen, S.Y. Energy Consumption, CO2 Emission and Sustainable Development in Chinese Industry. Econ. Res. J. 2009, 4, 88–96. [Google Scholar]
- Tang, D.; Dai, M. Energy-efficient Approach to Minimizing the Energy Consumption in an Extended Job-shop Scheduling Problem. Chin. J. Mech. Eng. 2015, 28, 1048–1055. [Google Scholar] [CrossRef]
- Zou, C.; Zhao, Q.; Zhang, G.; Xiong, B. Energy revolution: From a fossil energy era to a new energy era. Nat. Gas Ind. B 2016, 3, 1–11. [Google Scholar] [CrossRef] [Green Version]
- Carlos, G.M.; Alejandro, G.S.; Laurence, S.; Adisa, A. Life cycle environmental impacts of electricity from fossil fuels in Chile over a ten-year period. J. Clean. Prod. 2019, 232, 1499–1512. [Google Scholar]
- Wu, J.; Wang, J.; Wu, J.; Ma, C. Exergy and Exergoeconomic Analysis of a Combined Cooling, Heating, and Power System Based on Solar Thermal Biomass Gasification. Energies 2019, 12, 2418. [Google Scholar] [CrossRef]
- Rangel-Hernandez, V.H.; Torres, C.; Zaleta-Aguilar, A.; Gomez-Martinez, M.A. The Exergy Costs of Electrical Power, Cooling, and Waste Heat from a Hybrid System Based on a Solid Oxide Fuel Cell and an Absorption Refrigeration System. Energies 2019, 12, 3476. [Google Scholar] [CrossRef]
- Bobbo, S.; Fedele, L.; Curcio, M.; Bet, A.; De Carli, M.; Emmi, G.; Poletto, F.; Tarabotti, A.; Mendrinos, D.; Mezzasalma, G.; et al. Energetic and Exergetic Analysis of Low Global Warming Potential Refrigerants as Substitutes for R410A in Ground Source Heat Pumps. Energies 2019, 12, 3538. [Google Scholar] [CrossRef]
- Valencia, G.; Fontalvo, A.; Cárdenas, Y.; Duarte, J.; Isaza, C. Energy and Exergy Analysis of Different Exhaust Waste Heat Recovery Systems for Natural Gas Engine Based on ORC. Energies 2019, 12, 2378. [Google Scholar] [CrossRef]
- Lin, Z.H.; Xu, T.M. Utility Boiler Manual; Chemical Industry Press: Beijing, China, 1999. [Google Scholar]
- Exergy efficiency testing technical procedures for industrial boilers. DB21-T 2567—2016.


| Strategy | Stage | (°C) | (°C) | (°C) | (°C) | (°C) | (°C) |
|---|---|---|---|---|---|---|---|
| BM | I | 950 | 700 | 600 | 450 | 50 | 30 |
| II | 950 | 700 | 600 | 450 | 100 | 80 | |
| III | 950 | 700 | 600 | 450 | 250 | 200 | |
| VCM | I | 750 | 500 | 450 | 200 | 50 | 30 |
| II | 800 | 550 | 500 | 300 | 100 | 80 | |
| III | 1050 | 800 | 750 | 600 | 250 | 200 |
| Strategy | Case | Stage | Rate of Heat Return | Preheating Ratio of Air , , | ||
|---|---|---|---|---|---|---|
| 1.Basic method (BM) | Case BM | 0 | 1, 0, 0 | |||
| Energy-saving strategies | 2.Variable-condition mode (VCM) | Case VCM | 0 | 1, 0, 0 | ||
| 0 | 1, 0, 0 | |||||
| 0 | 1, 0, 0 | |||||
| 3.Heat-returning mode | Case 3.1 | 0.1 | 1, 0, 0 | |||
| Case 3.2 | 0.2 | 1, 0, 0 | ||||
| Case 3.3 | 0.3 | 1, 0, 0 | ||||
| With VCM | Case 3.4 | 0.3 | 1, 0, 0 | |||
| 0.3 | 1, 0, 0 | |||||
| 0.3 | 1, 0, 0 | |||||
| 4.Air-preheating mode | Case 4.1 | 0 | 0.1, 0, 0.9 | |||
| Case 4.2 | 0 | 0.3, 0, 0.7 | ||||
| Case 4.3 | 0 | 0.1, 0.1, 0.8 | ||||
| With VCM | Case 4.4 | 0 | 0, 0.3, 0.7 | |||
| 0 | 0, 0.3, 0.7 | |||||
| 0 | 0, 0.3, 0.7 | |||||
| Strategy | Stage | |||
|---|---|---|---|---|
| BM | I II III | 0.1124 | 0.0025 | 1.5510 |
| VCM | I | 0.0299 | 0.000533 | 2.2470 |
| II | 0.1251 | 0.0024 | 1.9664 | |
| III | 0.0837 | 0.0022 | 1.1549 |
| Forced Convection | Free Convection | |||||
|---|---|---|---|---|---|---|
| I (%) | II (%) | III (%) | I (%) | II (%) | III (%) | |
| BM | 44.8 | 44.7 | 40.2 | 47.1 | 47 | 42.5 |
| VCM | 52.8 | 55.8 | 33.4 | 55.5 | 57.6 | 35.3 |
| Forced Convection | Free Convection | |||||
|---|---|---|---|---|---|---|
| I (%) | II (%) | III (%) | I (%) | II (%) | III (%) | |
| BM | 26 | 19.9 | 22.8 | 26.9 | 20.8 | 23.8 |
| VCM | 12.1 | 23.2 | 9.6 | 12.1 | 23.9 | 10.4 |
© 2019 by the authors. Licensee MDPI, Basel, Switzerland. This article is an open access article distributed under the terms and conditions of the Creative Commons Attribution (CC BY) license (http://creativecommons.org/licenses/by/4.0/).
Share and Cite
Li, T.-T.; Li, Y.-Z.; Zhai, Z.-Z.; Li, E.-H.; Li, T. Energy-Saving Strategies and their Energy Analysis and Exergy Analysis for In Situ Thermal Remediation System of Polluted-Soil. Energies 2019, 12, 4018. https://doi.org/10.3390/en12204018
Li T-T, Li Y-Z, Zhai Z-Z, Li E-H, Li T. Energy-Saving Strategies and their Energy Analysis and Exergy Analysis for In Situ Thermal Remediation System of Polluted-Soil. Energies. 2019; 12(20):4018. https://doi.org/10.3390/en12204018
Chicago/Turabian StyleLi, Tian-Tian, Yun-Ze Li, Zhuang-Zhuang Zhai, En-Hui Li, and Tong Li. 2019. "Energy-Saving Strategies and their Energy Analysis and Exergy Analysis for In Situ Thermal Remediation System of Polluted-Soil" Energies 12, no. 20: 4018. https://doi.org/10.3390/en12204018