Article

Experimental Study of the Influence of Natural Gas Constituents on CO Emission from Chinese Gas Cooker

Gas Institute, School of Mechanical Engineering, Tongji University, Shanghai 201804, China
*
Author to whom correspondence should be addressed.
Energies 2019, 12(20), 3997; https://doi.org/10.3390/en12203997
Submission received: 30 August 2019 / Revised: 23 September 2019 / Accepted: 18 October 2019 / Published: 21 October 2019

Abstract

:
In China, it has become a more common practice to introduce natural gases from different sources into the same distribution system to improve supply security and reliability. Variable gas constituents may cause a negative impact on the performance of domestic gas appliances. This paper aims to study the CO emission of a Chinese gas cooker under different constituents of natural gas. A typical Chinese gas cooker with two burners, each of which has a nominal heat input of 3.8 kW, was selected. One of the burners was modified to a forced-mixed mode to replace primary air injection. Within operational ranges corresponding to the permissible Wobbe index—namely, primary air coefficients and heat inputs—the equivalence between original gas and the CH4/C3H8/N2 three-component mixture in terms of CO emission was experimentally validated. Then, different three-component mixtures were input into the other unmodified burner, which operates under injected primary air, to investigate how the CO emission changed with different gas constituents. It was found that the CO emission of a natural gas and a CH4/C3H8/N2 three-component mixture, in terms of CO emission, were equivalent. The combination of the two indexes, W and PN, can describe the CO emission from a gas cooker accurately. By means of a three-component mixture, the empirical formula, which can correlate CO and the gas property parameters, was proposed. A set of equal-CO lines was revealed for a given initial primary air adjustment. Finally, a feasible approach to manage gas quality management in China was put forward, and the conclusion can help control the CO emission of gas cookers and improve indoor air quality.

1. Introduction

The Chinese gas industry witnessed an unprecedented rapid increase over the past decade, with annual consumption soaring to 237.3 billion cubic meters (BCM) in 2017 in comparison with 60 BCM in 2007. It was estimated that annual consumption would account for up to 600 BCM by 2025 [1]. In order to improve supply security and reliability, more and more provincial and cities’ network operators began to introduce gases from different sources, including pipeline natural gas (PNG), offshore gas, liquefied natural gas (LNG), coal-based synthesized natural gas, or even bio-natural gas into the same distribution network [2]. However, variable gas constituents may have a negative impact upon end-users’ equipment.
The domestic gas cooker ranks first in terms of popularity, and annual production was maintained to be 30 million in recent years [3]. CO emission from a gas cooker when fueled with a specific gas depends upon two kinds of factors: structural parameters such as port shape, burner clearance from surface being heated, etc.; and operational parameters including heat input, primary air, gas constituents, and initial adjustment of primary air. When gas constituents change from adjustment gas for some reasons, CO emission may increase to an intolerable high level, directly posing a potential hazard to the safety of end-users. How the CO emission of gas cookers, as one of the safety indexes, responds to variable gas constituents is critical to cooker design and gas quality management.
Historically, the performance of gas appliances (including CO emission), fueled with variable gas constituents, was a research topic of gas interchangeability. From 1950 to the 1980s, some prediction methods have been established through a large amount of experiments and analysis, including the American Gas Association indexes (AGA indexes), Delbourg diagram, Weaver indexes, Dutton diagram, etc. All these predictions were validated by means of experimenting with combustion equipment and gas constituents that were popular at that time [4]. Halchuk-Harrington et al. [5,6] began to pay attention to new “interchangeability” after the introduction of shale gas and LNG. In 2005, it was officially decided that LNG must be blended with N2 prior to connecting to the British distribution network, after experiments following Dutton’s approach [7]. Honus et al. [8,9] explored the possibility of applying the diagram method and AGA indexes to interchangeability between plastic cracking gas and natural gas/propane. Lee [10,11] experimentally measured the flame propagation speed of LPG–LFG (landfill gas)–propane. The flame stability and possibility of replacing natural gas in domestic appliances was studied. Karavalakis and Hajbabaei [12,13] researched the impact of gas constituents upon vehicle emissions. Lee [14] discussed the influence of different gas constituents upon the combustion characteristics of domestic burners. After studying the combustion response of different equipment, the conclusions obtained by several researchers are different. The methods and conclusions of gas interchangeability research are closely related with those of combustion equipment.
The structure, heat input, and evaluation method of Chinese gas cookers differ a lot from cookers in Europe or the US. For example, the heat input of a burner of a gas cooker must be higher than 3.5 kW [15]. In addition, the thermal efficiency and CO emission must be evaluated simultaneously during measurement. Only when thermal efficiency is higher than 50% (or 55%) and CO emission (air-free) is lower than 500 ppm can a gas cooker be certified to be “qualified”. Undoubtedly, more constraints must be imposed upon the Chinese gas cooker, compared to its foreign counterparts with smaller heat input. Very often, the clearance between the burner and the surface being heated is a compromise between efficiency and CO emissions. However, research on gas interchangeability, especially CO emissions, has not been systematically performed for current gas cookers. Zhang et al. [16] concluded that AGA indexes are not applicable to Chinese gas appliances. They revised the indexes range to be “interchangeable” by experiment. Chen et al. [17] experimentally researched flame stability for PNG and LNGs. Ko et al. [18] performed research on the emissions and efficiency of domestic gas appliances under variable gas constituents. Lin et al. [19] experimentally studied the combustion characteristics of a premixed gas appliance, and concluded that combination of Wobbe index and lower heating value should be used to determine interchangeability. The researchers above found that when the equipment changed, the applicability of all kinds of interchangeability methods needed to be reconfirmed through the experiment. Therefore, the exiting methods mentioned above cannot be directly applied to predict the CO emission of Chinese gas cookers.
In this paper, a typical gas cooker with two burners was selected. One burner was modified to a forced-mixed mode in place of primary air injection and was tested with six sets of gases, containing different constituents and their equivalent mixtures. CO emission under different heat inputs and primary air coefficients were measured. It was concluded that a three-component mixture can give the same CO emission as its original gas. This work leads to a significant reduction of gas-blending experiments. Meanwhile, it can be concluded that there is a mapping relationship between natural gases and the gas quality parameters W and PN. The natural gas with different constituents can be represented on the two-dimensional diagram with W and PN as the axis. Then, experiments were performed in which primary air is entrained by an injector to measure CO under different three-component mixtures for a given initial primary air and heat input. To systematically investigate the influence of W and PN upon CO emission, the input mixture was deliberately designed to remain constant W or constant PN. It is concluded that the combination of the two indexes W and PN can calculate the CO emission from a gas cooker. By means of a three-component mixture, the empirical formula that can correlate CO and parameters describing gas properties, namely W and PN, was established. Finally, a set of equivalent CO curves related to gas quality indexes was derived and experimentally validated. A method of gas quality management in China based upon the WPN diagram was discussed on this basis. The conclusion can be used to predict the CO emission of a gas cooker under different gas constituents and to control the quality of indoor environments.

2. Experimental System

2.1. Dutton’s Approach

Dutton put forward a three-component mixture approach to simplify experiments for interchangeability research. A gas consisting of CH4, C2H6, C3H8, C4H10, N2, and CO2 was equivalently reduced to a mixture of CH4, C3H8, and N2 only, which was termed the “equivalent mixture”. He set up a diagram with the PN number (volumetric percentage of C3H8 plus N2) as the abscissa and the Wobbe index (W) as the vertical coordinate. The equivalent mixture was input into some gas appliances to determine the boundary limits beyond which unstable combustion phenomena such as lift, sooting, CO emission, etc. could occur. Therefore, Dutton established a CO limit for water heaters, sooting limit for infrared radiators, and lift limit for on-top cookers through elaborately designed experiments. The gas quality system following his approach remains valid in Britain today [20]. The principle for equivalent mixture was different for different unstable combustion phenomena. For the CO emission of a water heater, two conditions should be met. First, the ratio of C/H atoms for a “three-component mixture” should be equal to that of the original gas. For example, C2H6 = 0.5 CH4 + 0.5 C3H8, and C4H10 = 1.5 C3H8 − 0.5 CH4. Second, the mixture should have the same Wobbe index as that of the original gas. Dutton’s approach significantly reduced the number of experiments and much was easier to follow in comparison with the Delbourg diagram, AGA indexes, etc. [21,22,23].
For an original gas containing CH4, C2H6, C3H8, C4H10, N2, and CO2, the volumetric percentage of which is expressed as r1, r2, r3, r4, r5, and r6, respectively, the percentage of CH4, C3H8, and N2 can be expressed as x1, x2, and x3. Mathematically x1, x2, and x3 can be determined by solving Equations (1)–(3):
x 1 x 2 = r 1 + 0.5 r 2 0.5 r 4 0.5 r 2 + r 3 + 1.5 r 4
( x i H hi ) ( x i s i ) = ( r i H hi ) ( r i s i )
x 1 + x 2 + x 3 = 100
where Hhi is the higher calorific value for individual constituent, MJ/m3; and si is the specific gravity of an individual constituent.
For a water heater, Dutton measured CO emissions changing with heat inputs when operated at 100–120% nominal heat input. He found that the slopes for different gases tend to be the same, implying a group of parallel lines on the ln(CO)-Q diagram. Therefore, he defined the ICF (incomplete combustion factor) [21], shown in Equation (4), as the average distance between a specific gas and 12T-0. This index can be used to predict the CO emission of a water heat with the change of gas constituents, as shown in Equation (5):
I C F = 0.64 ( W 50.73 + 0.03 P N )
E CO = e ICF · E CO - CH 4
where ICF is the incomplete combustion factor; W is the Wobbe index, MJ/m3; PN is the volumetric percentage of C3H8 plus N2 of the three-component mixture; ECO is CO emission under a certain gas, ppm; and ECO-CH4 is CO emission under reference gas, methane, ppm.
Some obvious differences exist between water heaters and gas cookers, if measured in terms of structure and combustion method involved. For gas cookers, the flame always directly contacts the cold surface being heated, while for water heaters, a combustion chamber is usually provided for the combustion process to fulfill. More importantly, initial adjustment is essential for a gas cooker to provide suitable primary air and flame length accordingly. Therefore, a gas cooker may operate under different heat input and primary air coefficients, while primary air variation is seldom considered when predicting the performance of water heater operation under different gas constituents. Whether Dutton’s approach could be adopted for Chinese gas cookers today depends heavily upon whether an equivalent mixture corresponding to a specific original gas constituent can reproduce the same CO emission.

2.2. Test Rig

The gas appliance to be tested was a typical embedded-type cooker with two burners, each of which has a nominal heat input of 3.8 kW. The numbers, diameters, and arrangement of ports for the two burners were the same. The atmospheric burner on the left side remained unchanged, and primary air was delivered by an injector, as shown in Figure 1a. Corresponding to a specific initial primary air, the injector would automatically adjust to another primary air when operated under another gas constituent. The CO emission characteristics were experimentally studied on the left-side burner. The atmospheric burner on the right side was modified to a forced-mixed mode, as illustrated in Figure 1b. The primary air to the burner was supplied by compressed air. The gas flow rate and air flow rate can be independently controlled and metered. The measurement to determine “equivalence” between the original gas and the three-component mixture was done on the modified burner.
Compared to the left-side original burner, only the primary air supply was changed. The resulting flame shape and resistance of the downstream burner were not influenced. Through modification, the primary air and the heat input can be adjusted artificially to simulate the possible working condition of an injector. However, the combustion process would not be affected.
The test rig was designed strictly according to Chinese National Standard GB 16410-2007 [24]. As shown in Figure 2, three sub-systems were included: a continuous gas-blending sub-system, flue gas analysis sub-system, and gas cooker performance measurement sub-system.
The continuous gas-blending sub-system consists of five sets of mass flow rate controllers (MFC), four of which are fed by high-pressure gas cylinders, and one of which relates to pipeline natural gas (PNG), which is available in the lab. The gas constituents to be tested and their flow rates can be preset and controlled through the computer. Two wet-type gas meters were added to accurately measure the gas flow rates of the outer ring and the inner ring of the gas cooker. Compressed air was introduced to provide the primary air. It can also be controlled and metered through MFC and wet-type gas meters. The tested cookers with a round-port burner represent the typical structures of cookers in the Chinese market. There was a vacuum pump inside the flue gas analyzer. The flue gas was sampled through the sampling ring. The concentrations of the combustion product components are measured by the flue gas analyzer. The tested data are recorded by the computer including O2, CO2, and CO. The instrumentation involved in the test is listed in Table 1.

2.3. Test Gas

Listed in Table 2 are tested original gas constituents and their equivalent mixtures, where the former are coded as E and N, and the latter are coded as ET and NT.

2.4. Test Procedure

First, measurements were made to determine the “equivalence” between original gases and three-component mixtures.
The CO emission of a gas cooker changes with the heat input and primary air coefficient. According to GB/T13611-2006 [25], the permissible W fluctuates between 90%–110% that of CH4. Therefore, the heat input range to be tested was set to be 90%–110% of nominal heat input, and the primary air coefficient range to be tested was 0.4–0.6. Apparently, such a range was broad enough to cover all the possible operation points of a gas cooker.
For a specific primary air, heat input of a gas-blending sub-system was preset through a computer. The flow rates of primary air and gas were metered by MFC and a wet-type gas meter, respectively. The precise primary air coefficient was determined by comparing detailed constituents of a gas–air mixture with that of gas by means of gas chromatography. When combustion became stable, a flue gas analyzer began to sample for 10 min at a frequency of 1 Hz. Then, CO emission was repeatedly measured for another primary air. Afterwards, the above-mentioned procedures were repeated for other heat inputs, and CO changing with primary air and heat input can be determined.
Secondly equivalent CO lines were measured on the left-side atmospheric burner. 12T-0 was input into the burner to make an initial adjustment, as follows: To maintain gas pressure at the cooker inlet of 2 kPa so that the burner operated under a nominal heat input (3.8 kW); and to adjust the air shutter so that a suitable flame shape can be achieved. Then, we recorded the flue gas components. Afterwards, different three-component mixtures were successively input into the burner, and the flue gas was analyzed.

2.5. Uncertainty Analysis

The uncertainties come from two respects: uncertainty of instruments, and uncertainty of measured data. As to the calculation of instrument uncertainty, the precision of the instruments involved is listed in Table 1. The uncertainties come from the flow-rate measurement of gas and primary air by the wet flow meter, the temperature and pressure measurement, and the CO measurement by the flue gas analyzer. As for the calculation of measured data uncertainty, the data were measured several times, and the standard deviations were derived to calculate the uncertainty [26].
The relative uncertainties can be calculated according to equation given by Ref. [25], and the results are shown in Table 3.

3. Results and Discussion

3.1. Validation of Dutton’s ICF Index

When gas constituents change, the operation of gas cookers, namely the primary air coefficient α′ and heat input Q, will be changed from (α′,Q)1 to (α′,Q)2. When investigating if a three-component mixture can reproduce the same amount of CO as that fueled with original gas containing CH4, C2H6, C3H8, C4H10, C5H12, CO2, and N2, the “equivalence” should be evaluated for all possible primary air coefficients and heat inputs corresponding to gas constituents’ variations. Hence, the relationship between CO emission and heat input, together with the primary air coefficient of a gas, was studied first.
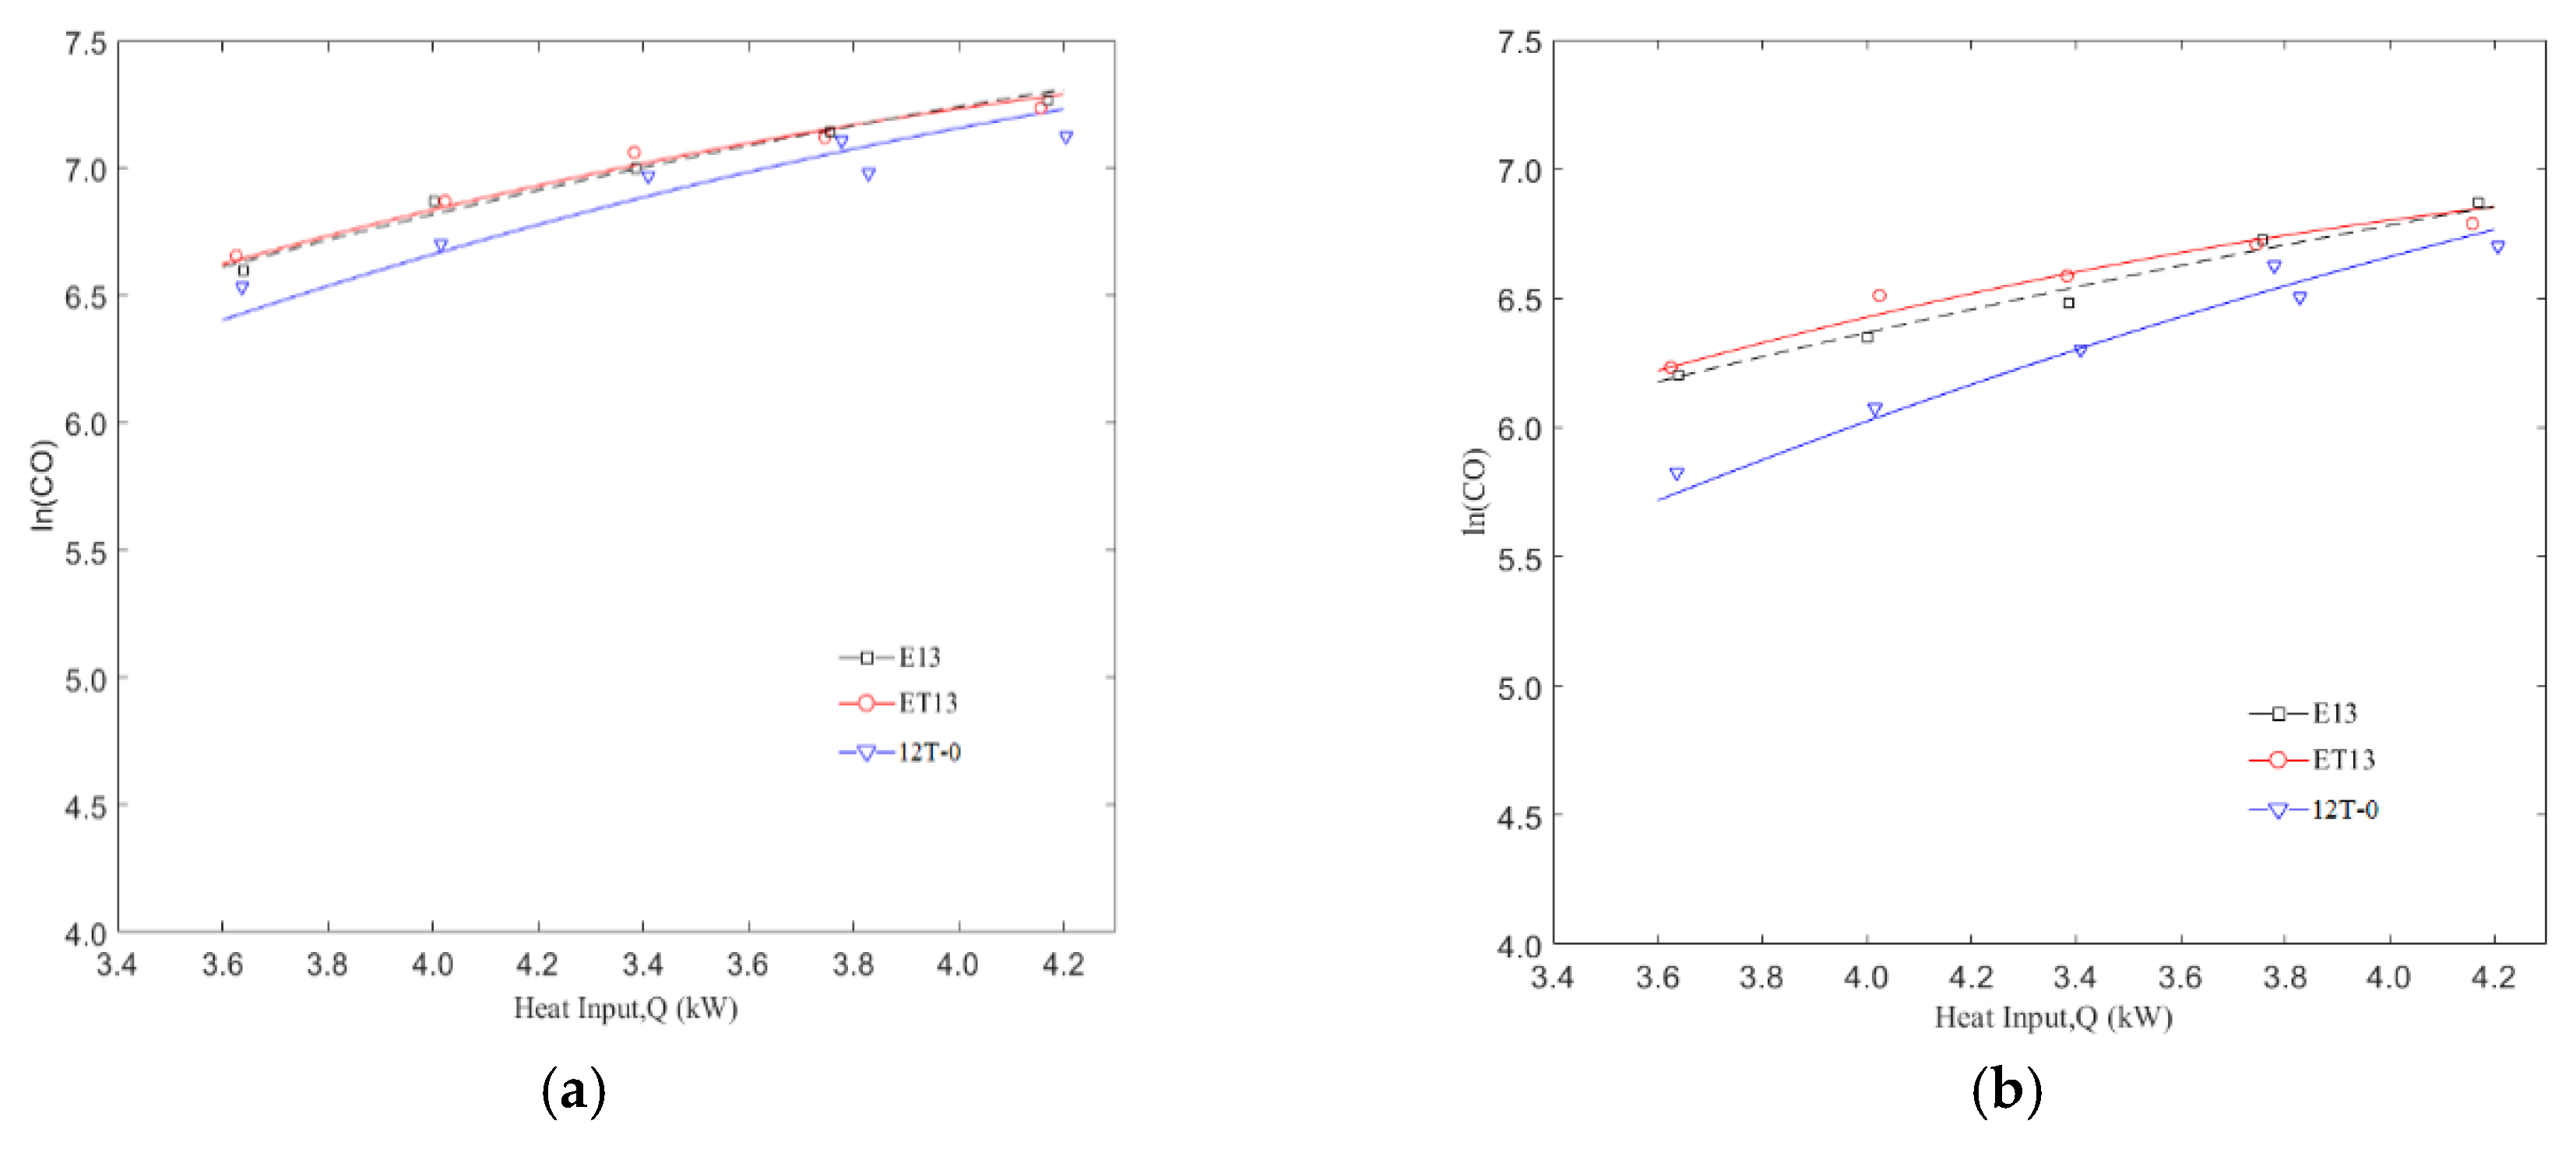
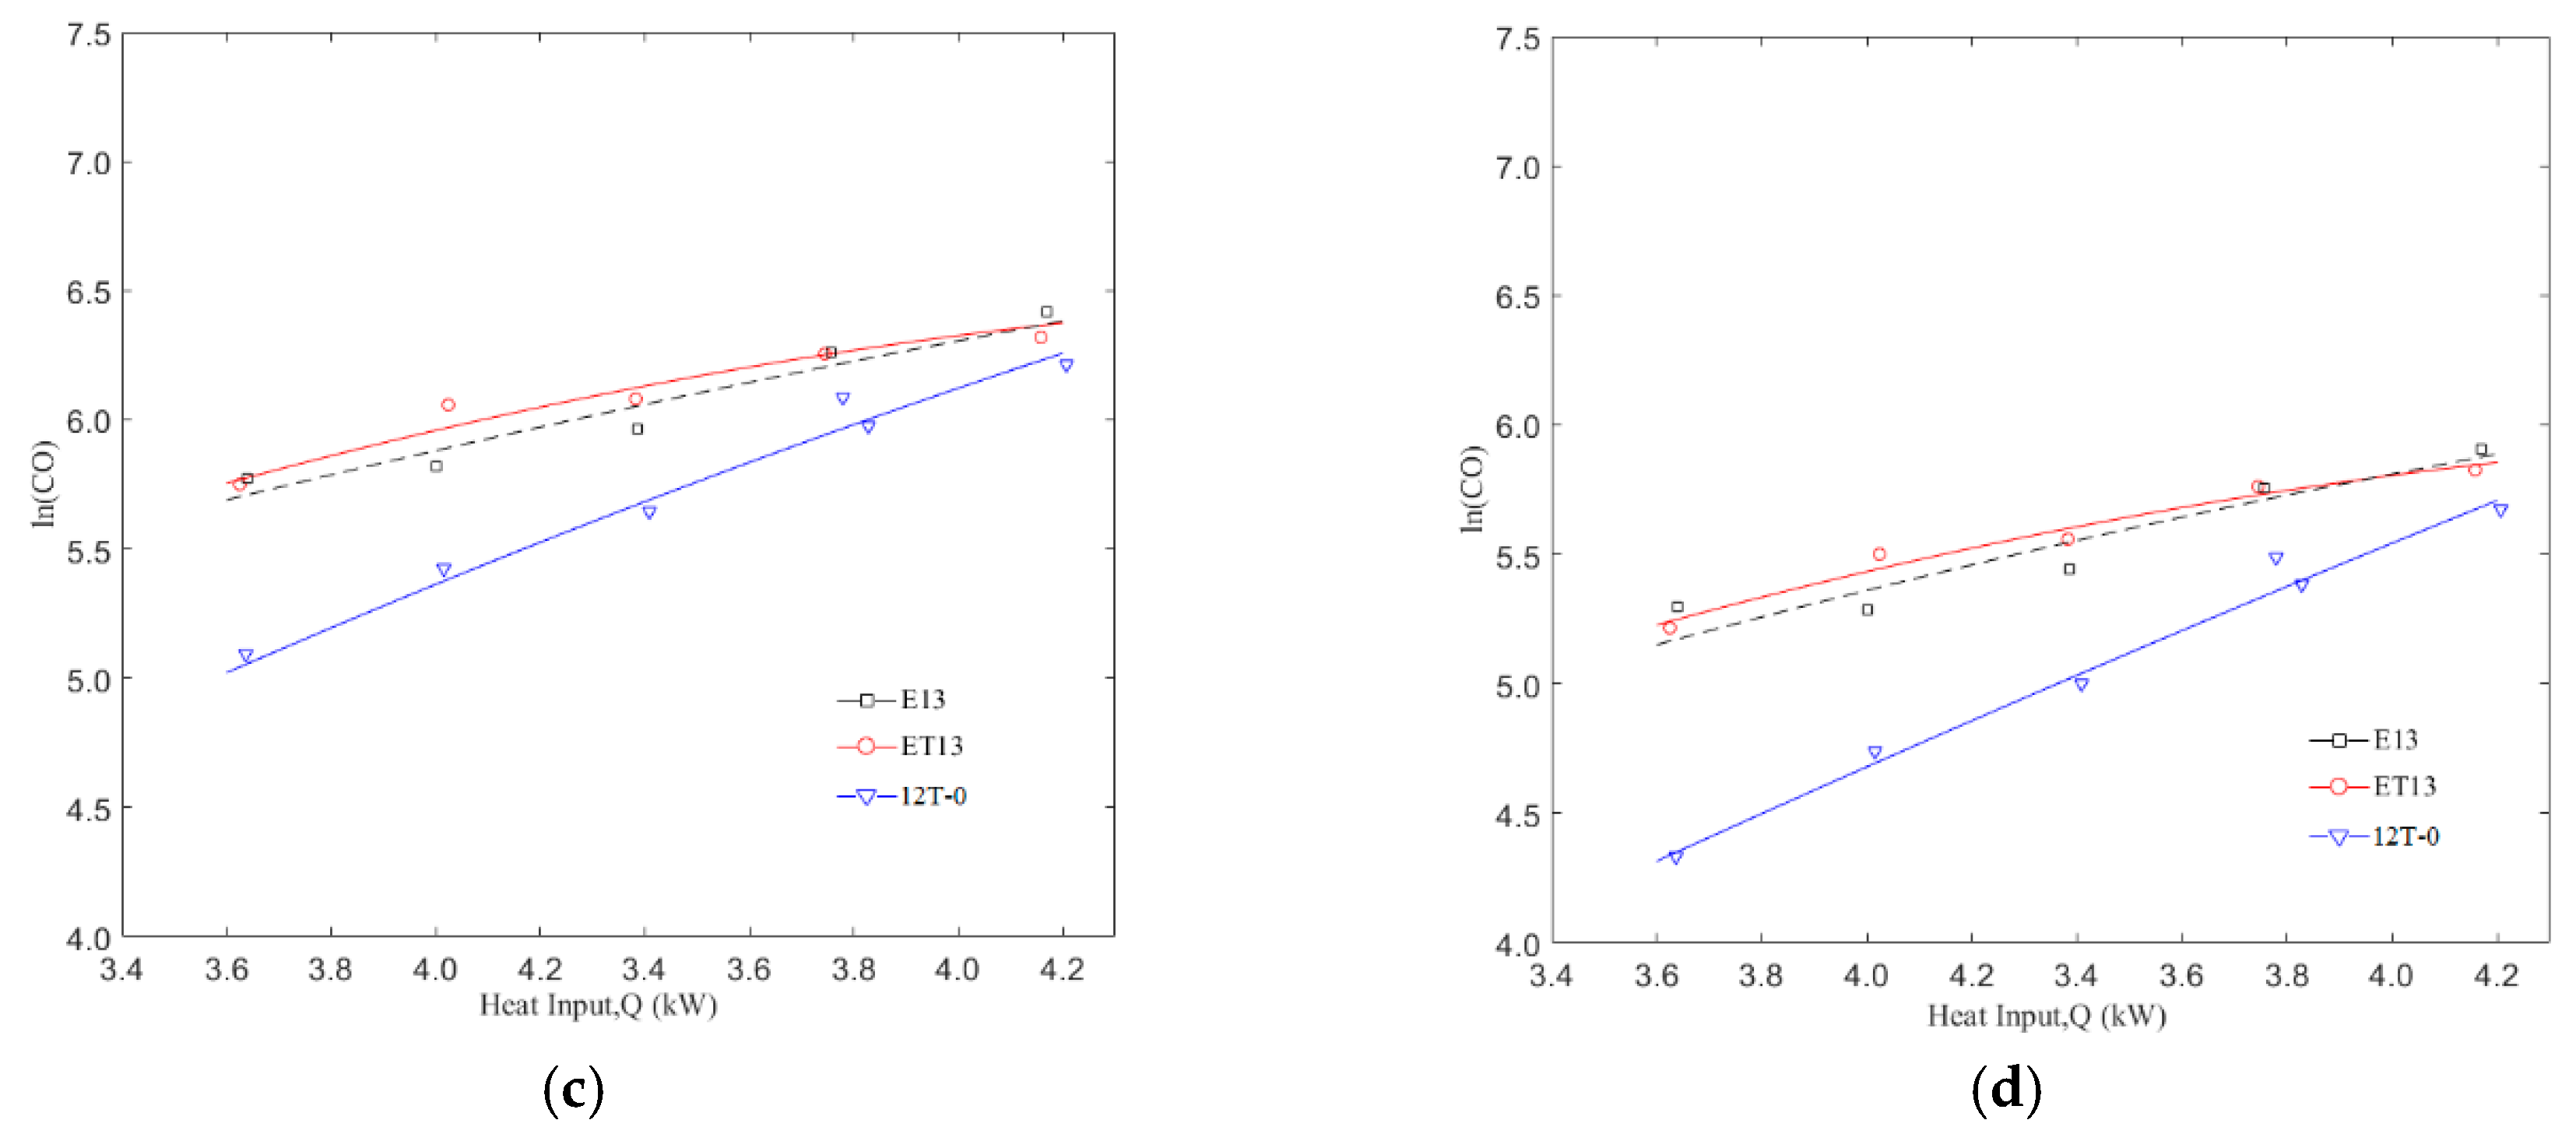
For different gas constituents, CO emission was found to change in an exponential pattern. Figure 3 shows the relationship between ln(CO) emissions from E13/ET13 and reference gas CH4 under different primary air coefficients as an example. The “equivalence” of some groups of E13/ET13 test points is not satisfactory. Inevitably, there are some errors existing in all the measured data. To minimize the influence of these errors, it is more reasonable to build up a function and check the trend of CO changing with α′ and Q than to compare measured COs directly. When comparing CO curves of E13/ET13, it can be found that the two functions tend to overlap each other. Both E13/ET13 have similar emissions under the same working conditions (α′,Q). Intuitively, the distance between the E13/ET13 function and CH4 function increases gradually with the increasing primary air coefficient. Due to the difference in the combustion equipment investigated, Dutton did not need to consider the effect of the primary air coefficient. For the water heaters in Dutton’s research, a unique ICF number could be calculated for each three-component mixture and used in the gas quality management. However, for the Chinese cooker, a different ICF number can be calculated under a different primary air coefficient. Table 4 shows the comparison of Dutton’s ICF index with the calculated ICF based on experimental data. Hence, the ICF index cannot be applied to the Chinese gas cooker discussed herein.

3.2. Validation of Three-Component Mixture

Within the operation range (heat input Q and primary air coefficient α′) investigated, the CO emission increases exponentially with heat input Q and decreases with the primary air coefficient 
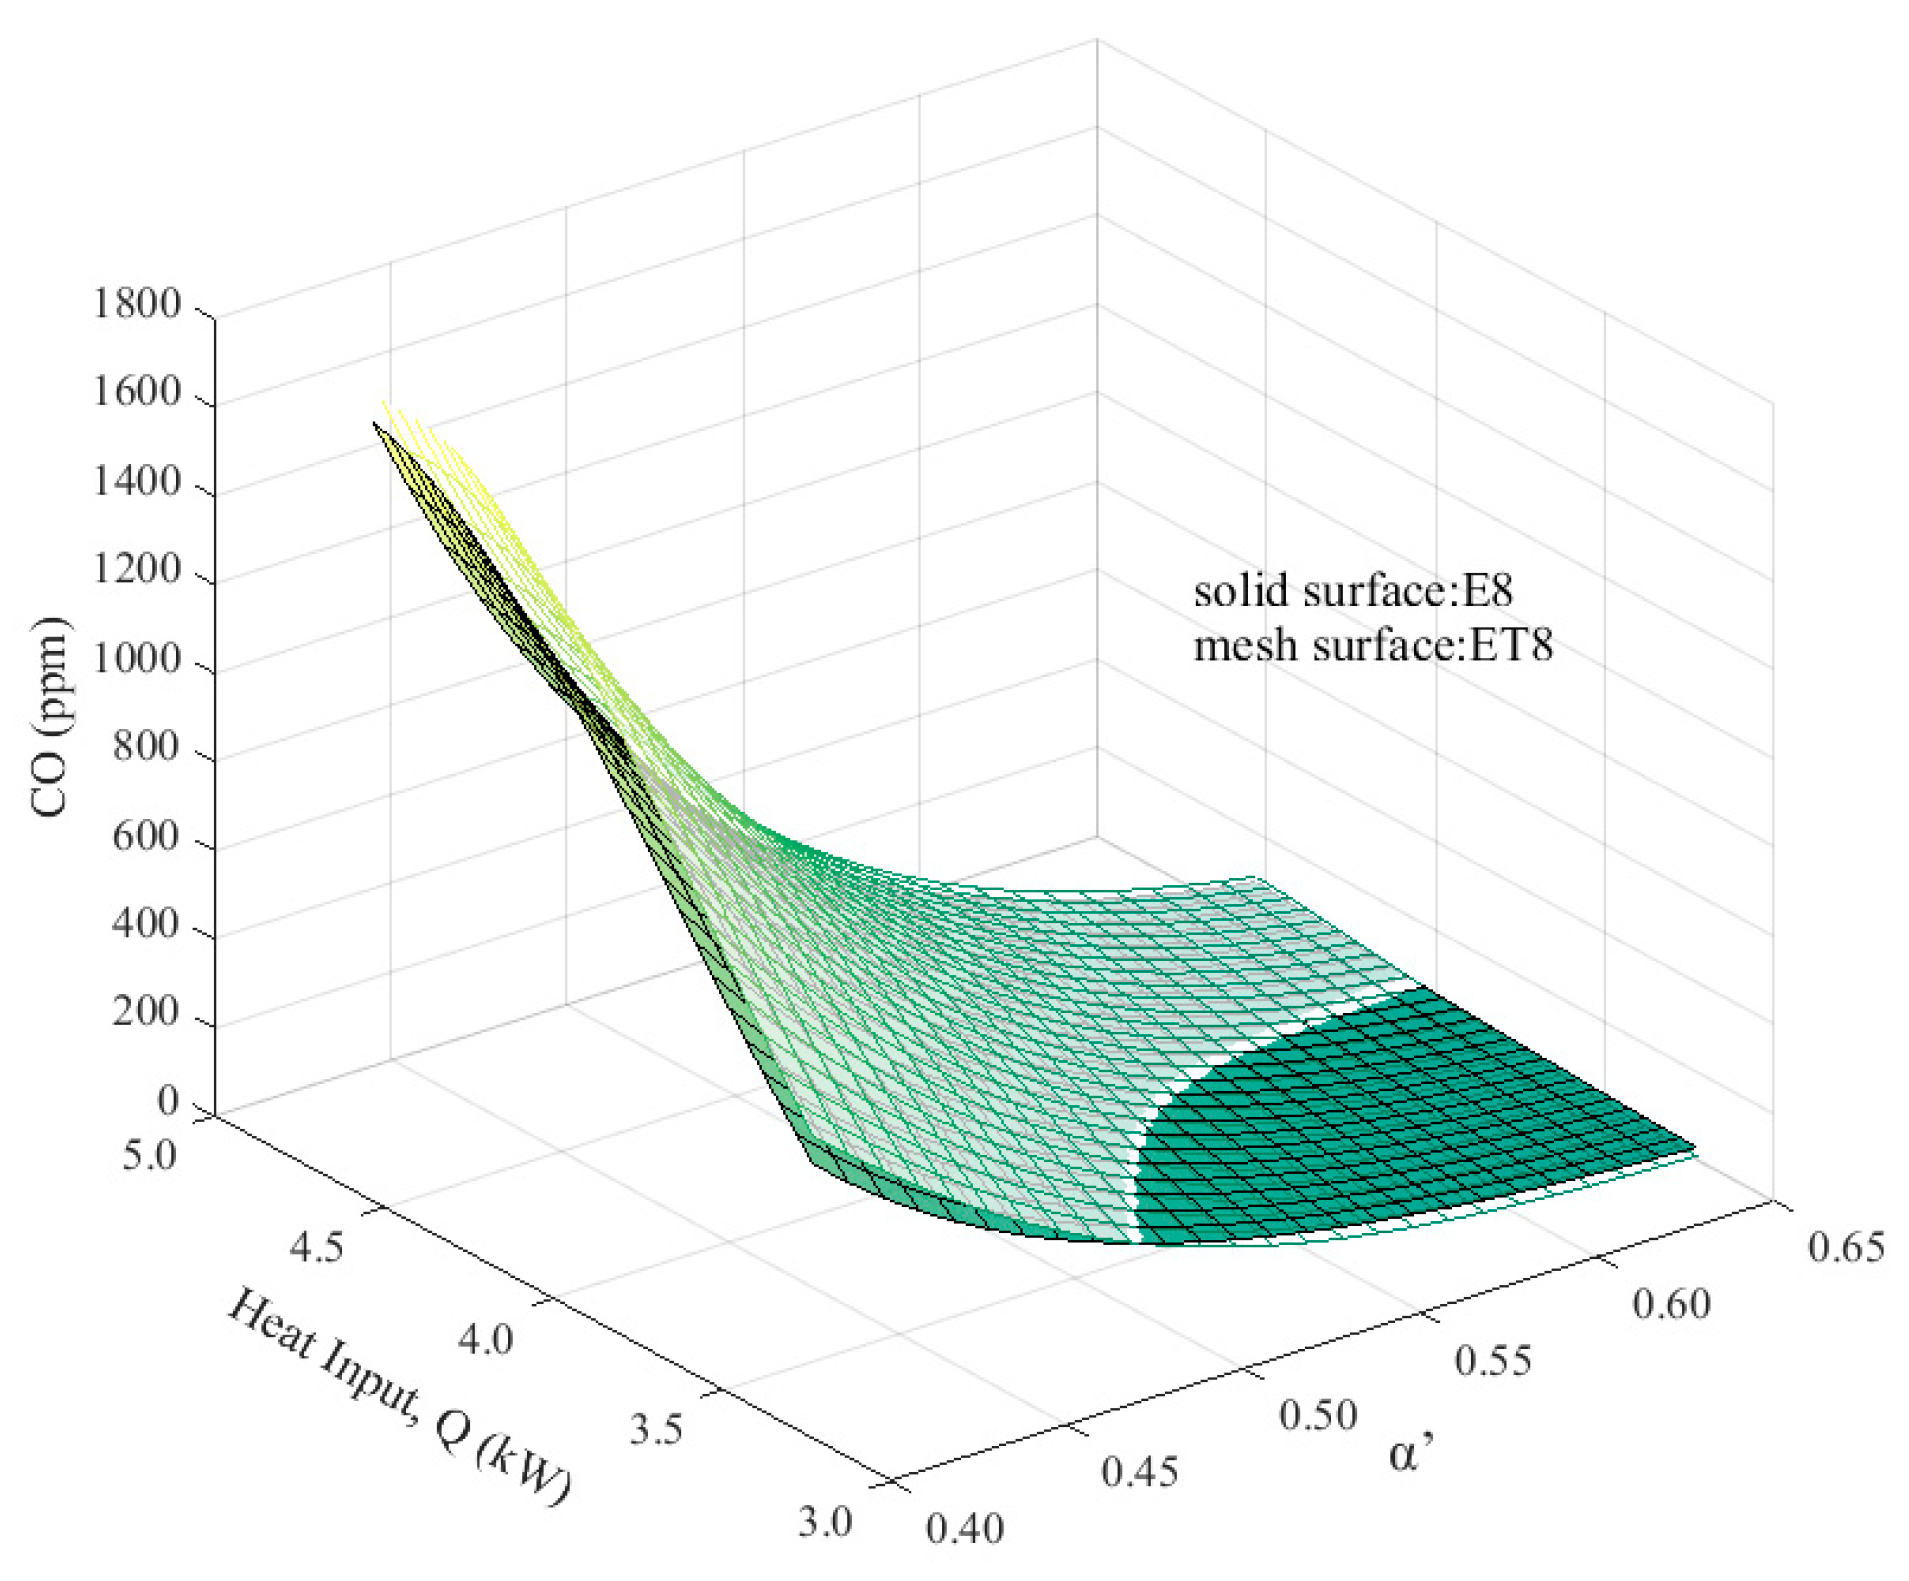
α′. Three-component mixtures tend to give similar CO emissions. Furthermore, comparison between CO fueled by the other five sets of original gases and their three-component mixtures can lead to similar conclusions. To quantitatively evaluate the difference between CO emission fueled by an original gas and that by a three-component mixture under different heat input and primary air, a characteristic curved surface can be configured as shown in Equation (6). Given a test gas, such a surface can be fitted by 30 measured data. For different gas constituents, the coefficient matrix A is different. Figure 4 is a three-dimensional view of CO under the three-component mixture ET8 and CO under the original gas E8. It can be found that the maximum CO appears at highest heat input and minimum primary air, while the minimum CO appears at the lowest heat input and maximum primary air. Meanwhile, it can be found that the CO surface for original gas and its corresponding three-component mixture are comparatively close to each other.
ln ( C O ) = ( Q 2 Q 1 ) ( A 1 A 4 A 7 A 2 A 5 A 8 A 3 A 6 A 9 ) ( α 2 α 1 )
where CO is the CO emission of the gas cooker, ppm; Q is the heat input of the cooker, kW; and α′ is the primary air coefficient.
To quantitatively assess how “equivalently" CO emission from an original gas can be reproduced by a three-component mixture, a parameter I can be defined as the mathematical expectation of the absolute value of difference between two functions, as shown in Equation (7). Within the range of (α′,Q) measured experimentally, namely α′ = 0.4–0.6, Q = 3.42–4.18, several points of (α′,Q) are selected. The value of |COO-COT| on each point of (α′,Q) are calculated. The parameter I equals the arithmetic mean value of |COO-COT| on each point. Apparently, its physical meaning is the average distance between two surfaces.
I = E V ( | ( C O O ) ( C O T ) | ) = α , Q | C O O C O T | d α d Q α , Q d α d Q
where COO is the CO emission function of original gas, ppm; and COT is the CO emission function of the three-component gas, ppm.
If I < σ + σT, it can be concluded that a three-component mixture can give “equivalent” CO as that from original gas. Table 5 lists the calculated values of I, σ, and σT for six sets of original gases and their three-component mixtures. For all sets of gases, the calculated I’s are small enough. It can be concluded that the selected three-component mixtures can equivalently represent their original gases, viz., if a certain gas is input into a gas cooker, the CO emission would be the same as that from its three-component mixture operating at the same heat input Q and primary air coefficient α′.

3.3. Influence of Gas Constituents on CO Emission

All gases falling into the category 12T in Chinese standard GB 13611-2007 could be reduced to a three-component mixture. It was found that all natural gas fell within an area: W = 45–55 and PN = 0–15. Compared to the range within which Dutton established his prediction method (W = 45–55, PN = 0–100) [21], the exploration range in this paper was narrowed down a lot.
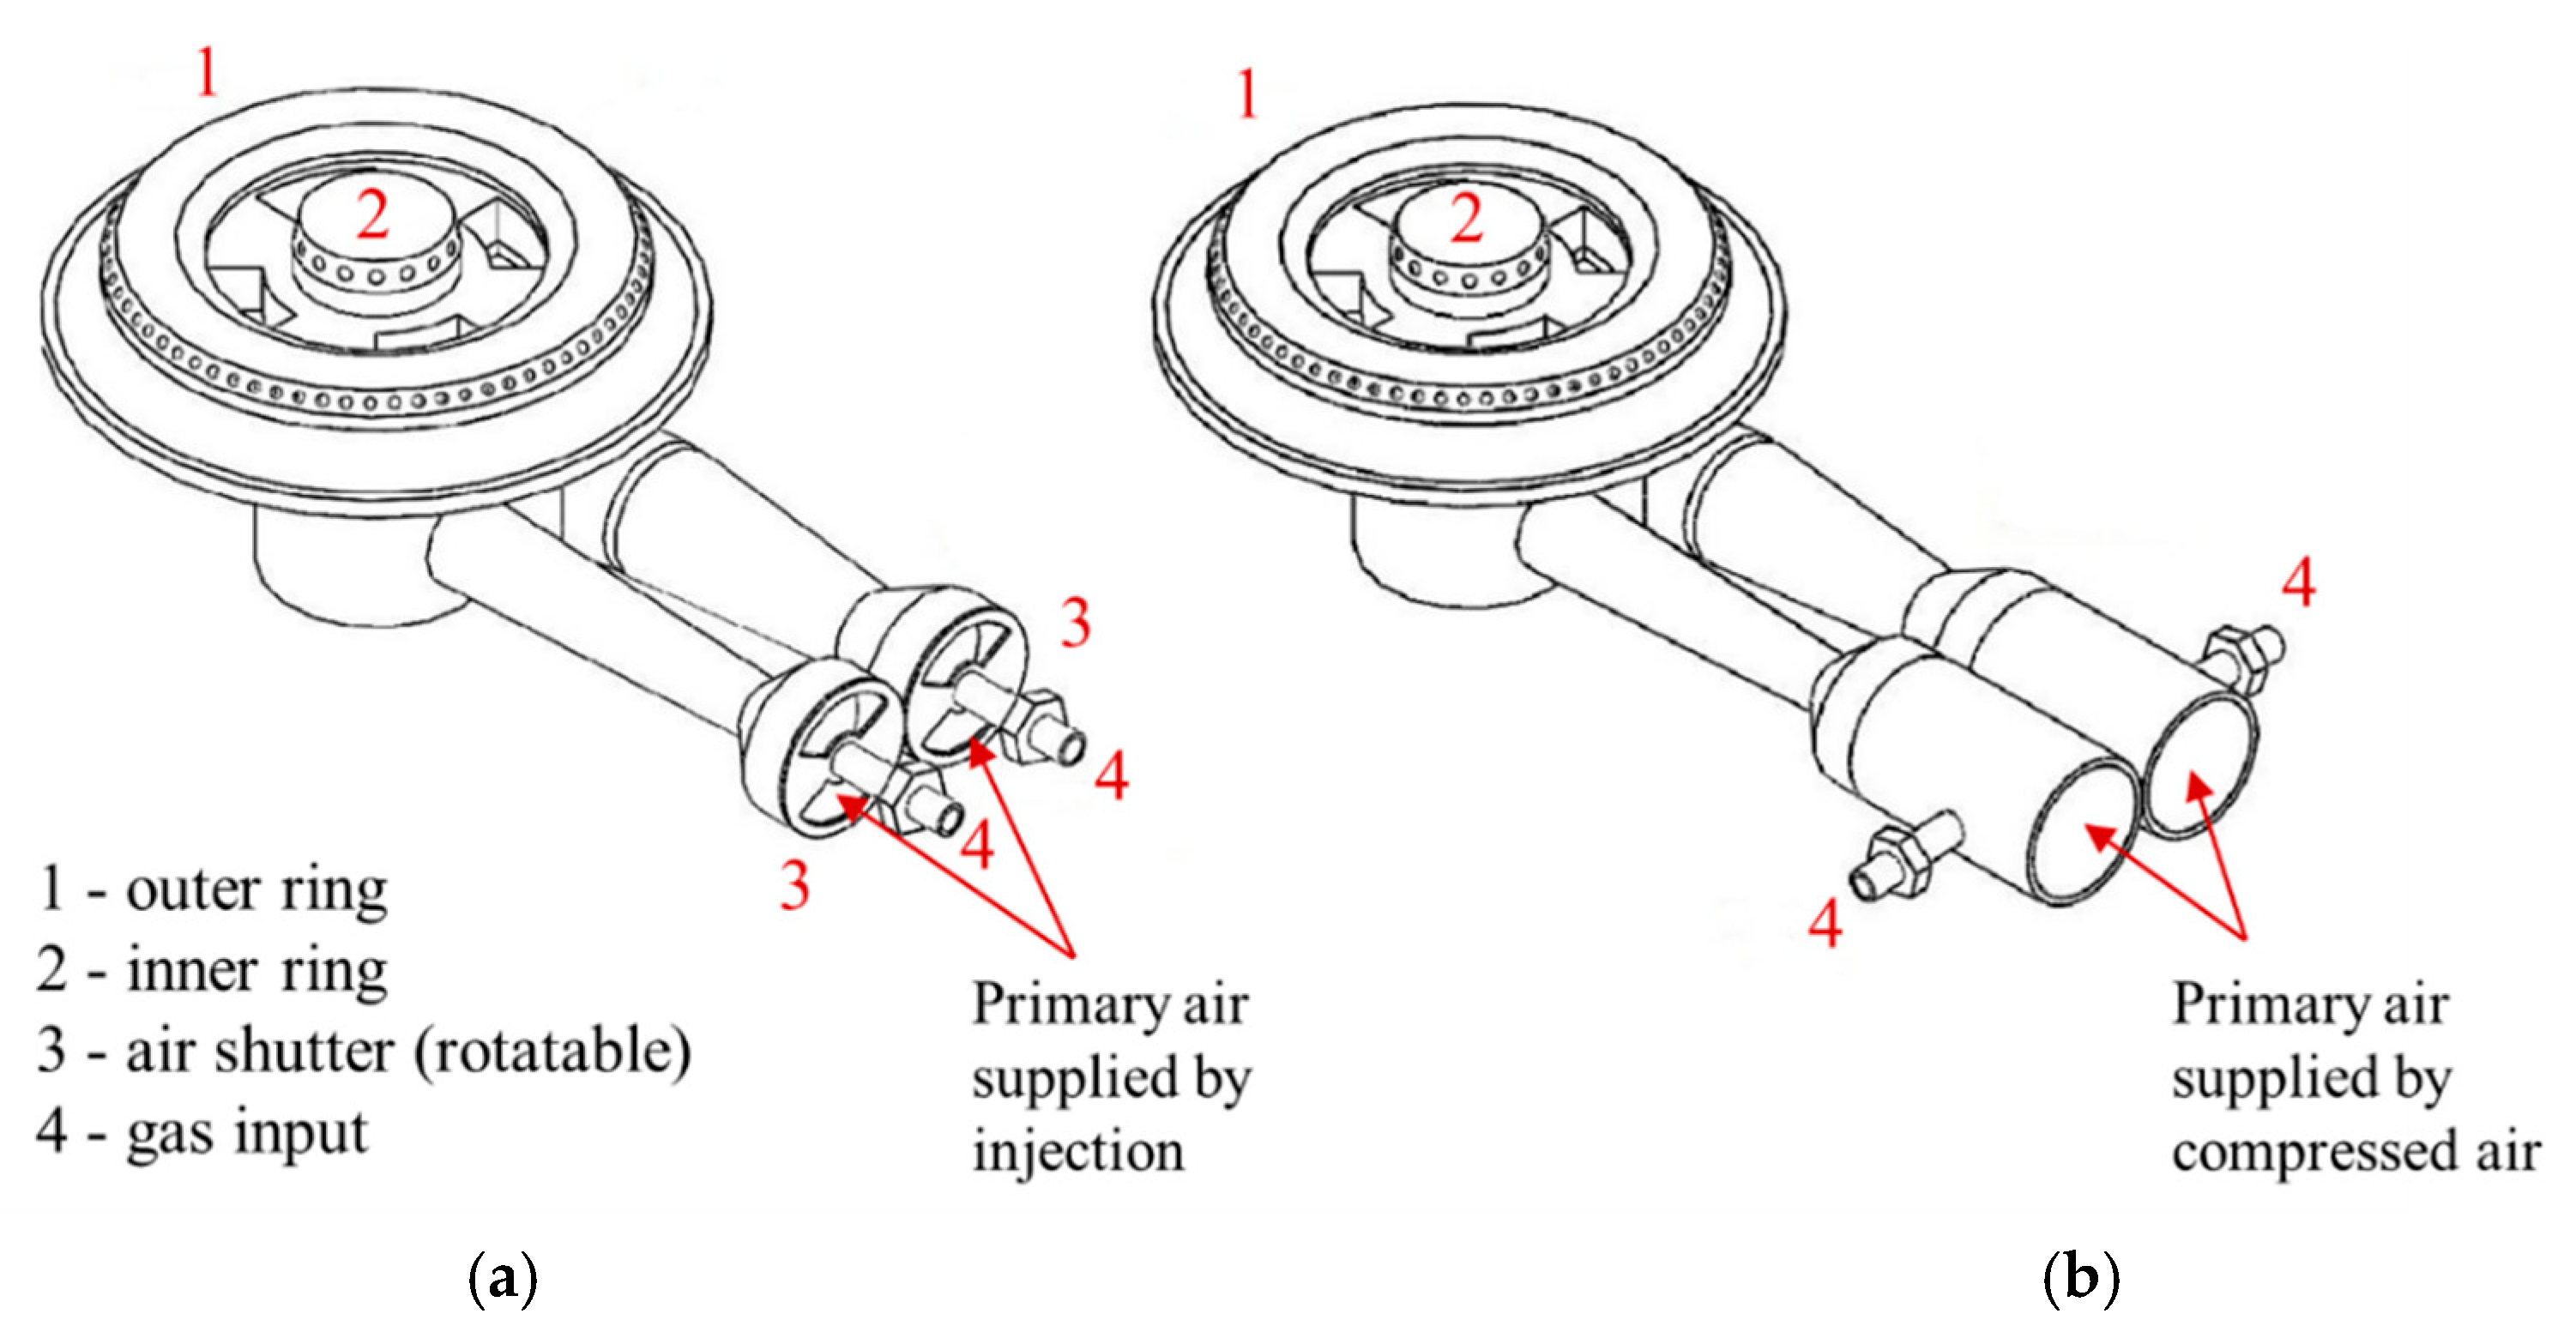
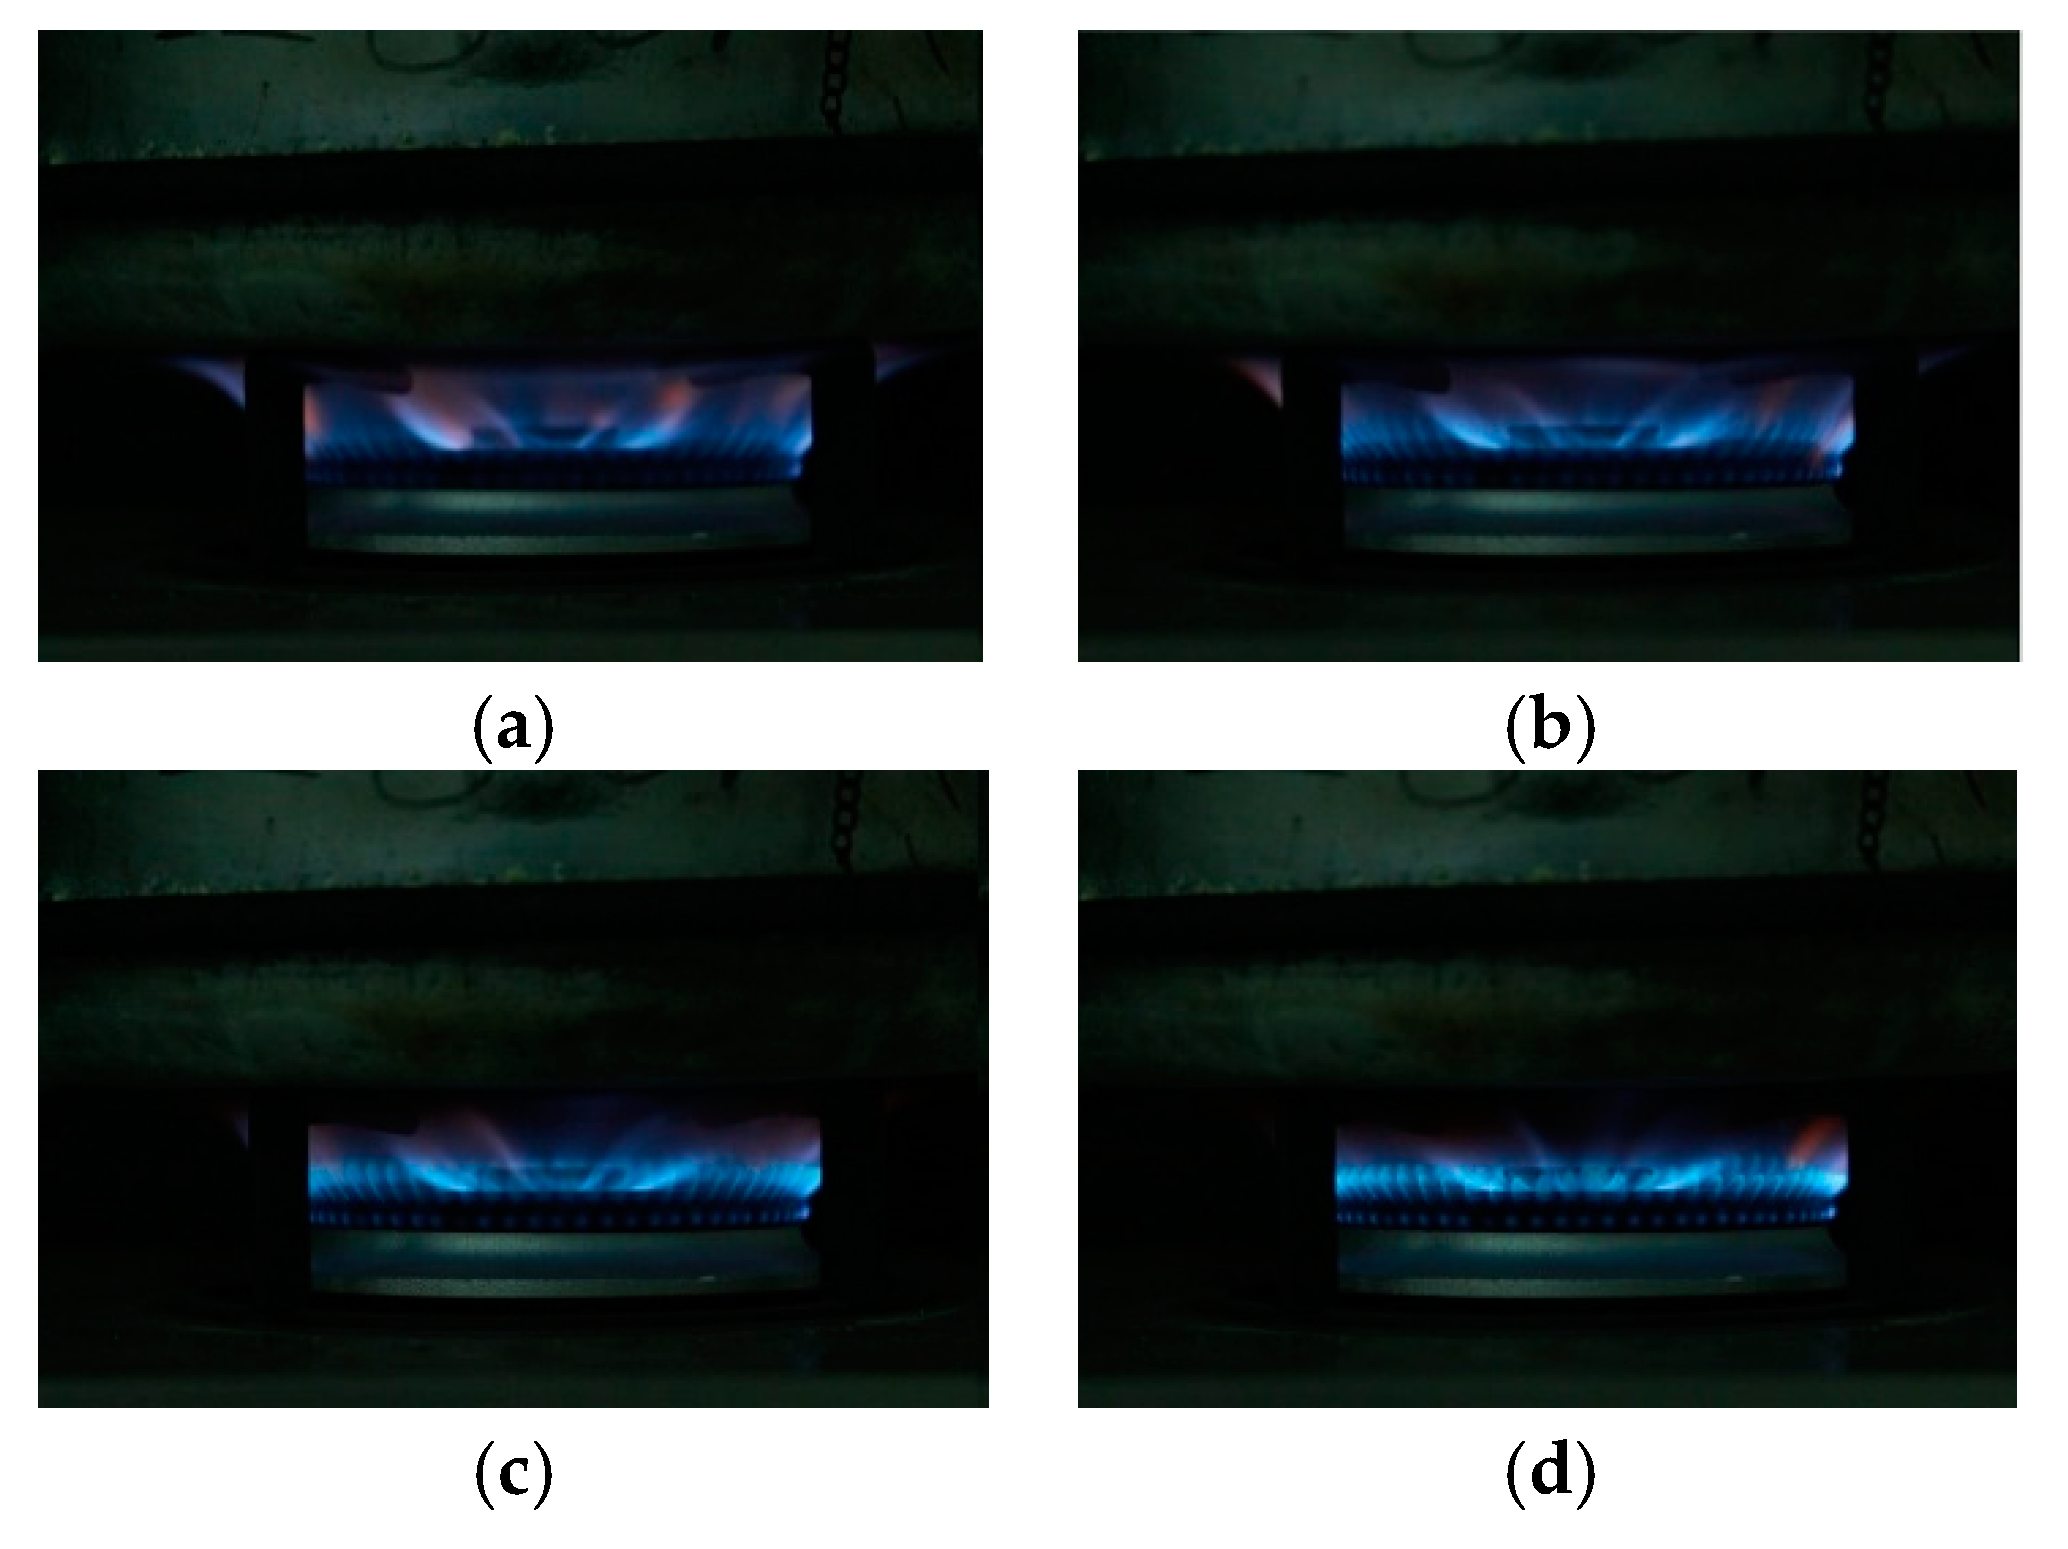
In order to input 12T-0 into the left-side burner of tested cooker, first, we adjusted the primary air shutter until a satisfactory flame appeared. Figure 5 shows flame shapes under different primary air coefficients. Figure 5a is a result of smaller primary air, which is usually called a “soft” flame, and would lead to excessive CO emission. Figure 5d corresponds to a higher primary air coefficient. The flame is “hard” and tends to lift when substituted by other gas rather than adjustment gas. Figure 5b,c show a satisfactory flame. The primary air coefficient is properly moderate and results in a quite acceptable flexibility to changing gas constituents. The adjustment of the flame above was set according to the report published by the Gas Research Institute (GRI) [27]. Unstable combustion phenomena, such as lift and excessive CO emission, will not occur when gas constituents fluctuate. The underlying principle for initial adjustment when fueled with 12T-0 is that the satisfactory flame shape in 
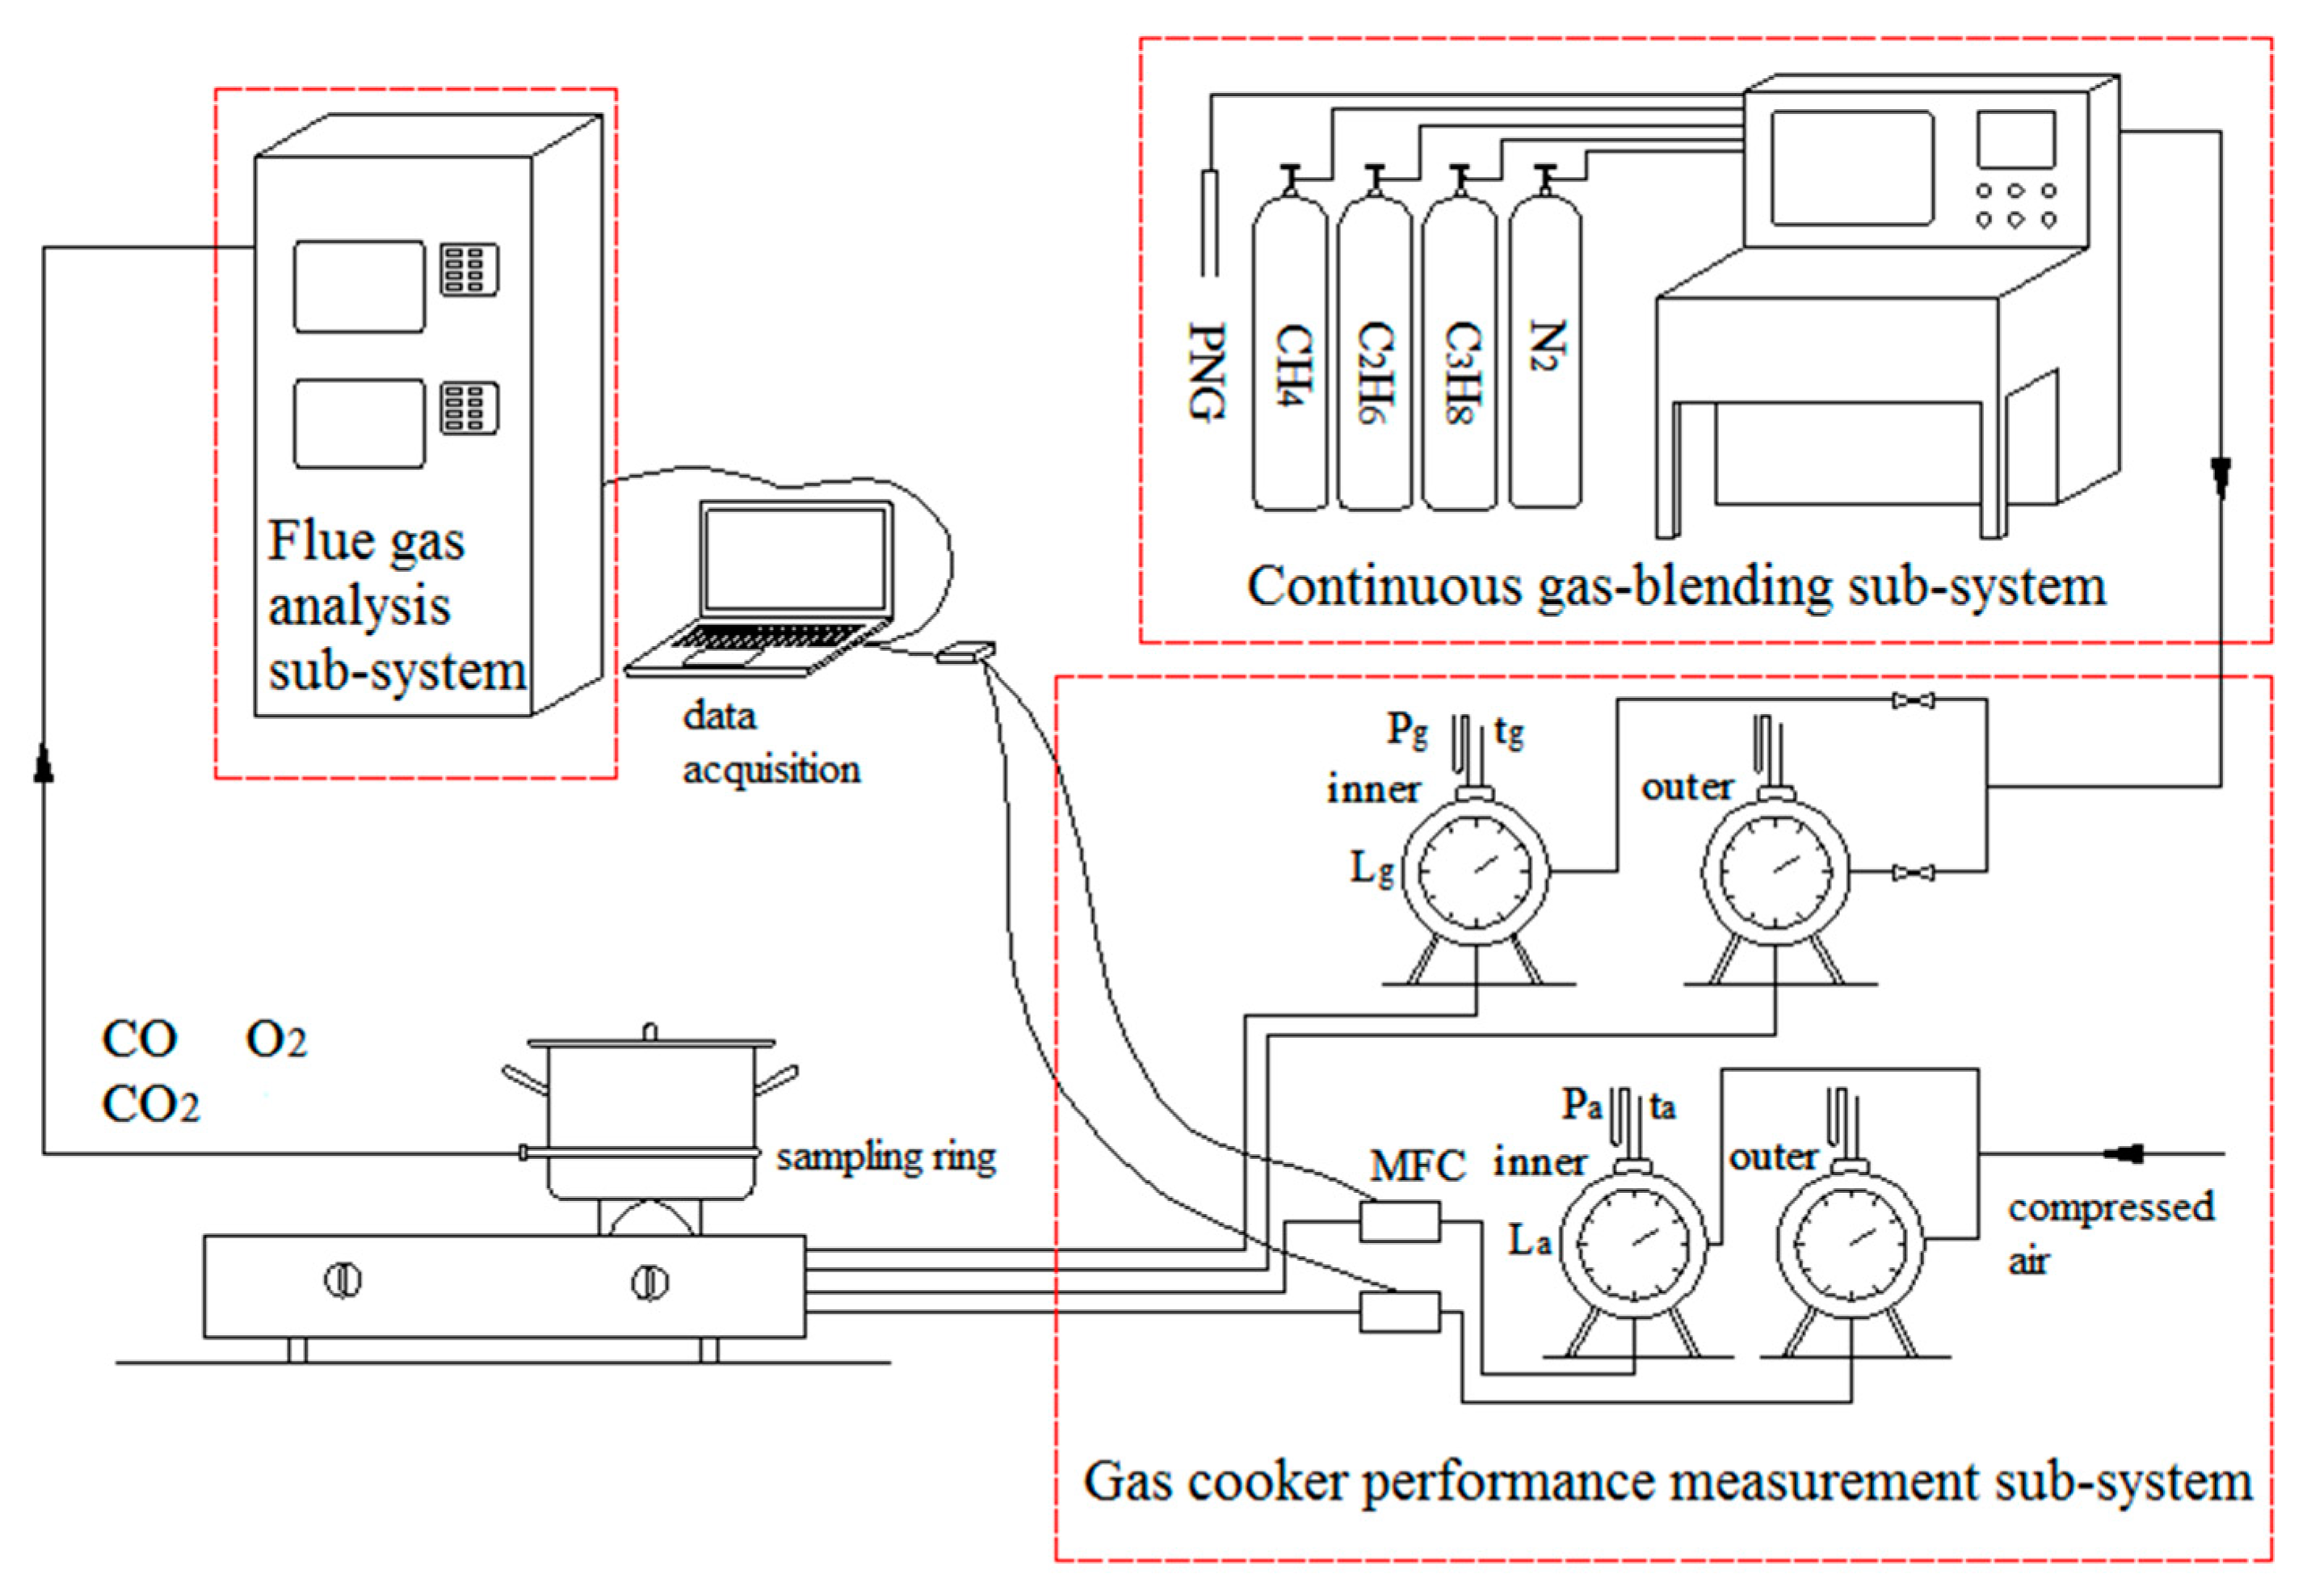
Figure 5b,c appears to ensure maximum flexibility. The flame shape gave an intuitionistic determination of the initial primary air coefficient. However, it could not be quantitatively analyzed. In practice, the gas–air mixture was extracted from the gas separator of the cooker by an injector and sent into gas chromatography to analyze the molar volume fraction of various components. Then, the primary air coefficient could be calculated. Therefore, it was possible to make the same condition for combustion under different gases. All the combustion cases were measured under the same initial air coefficient.
After the primary air shutter was fixed, we let the burner that injected primary air operate at a nominal heat input of 3.8 kW. Then, the burner remained unchanged, and different three-component mixtures were input into the burner to record CO emissions. To systematically investigate the influence of W and PN upon CO emission, the input mixture was deliberately designed to remain constant W or constant PN. 
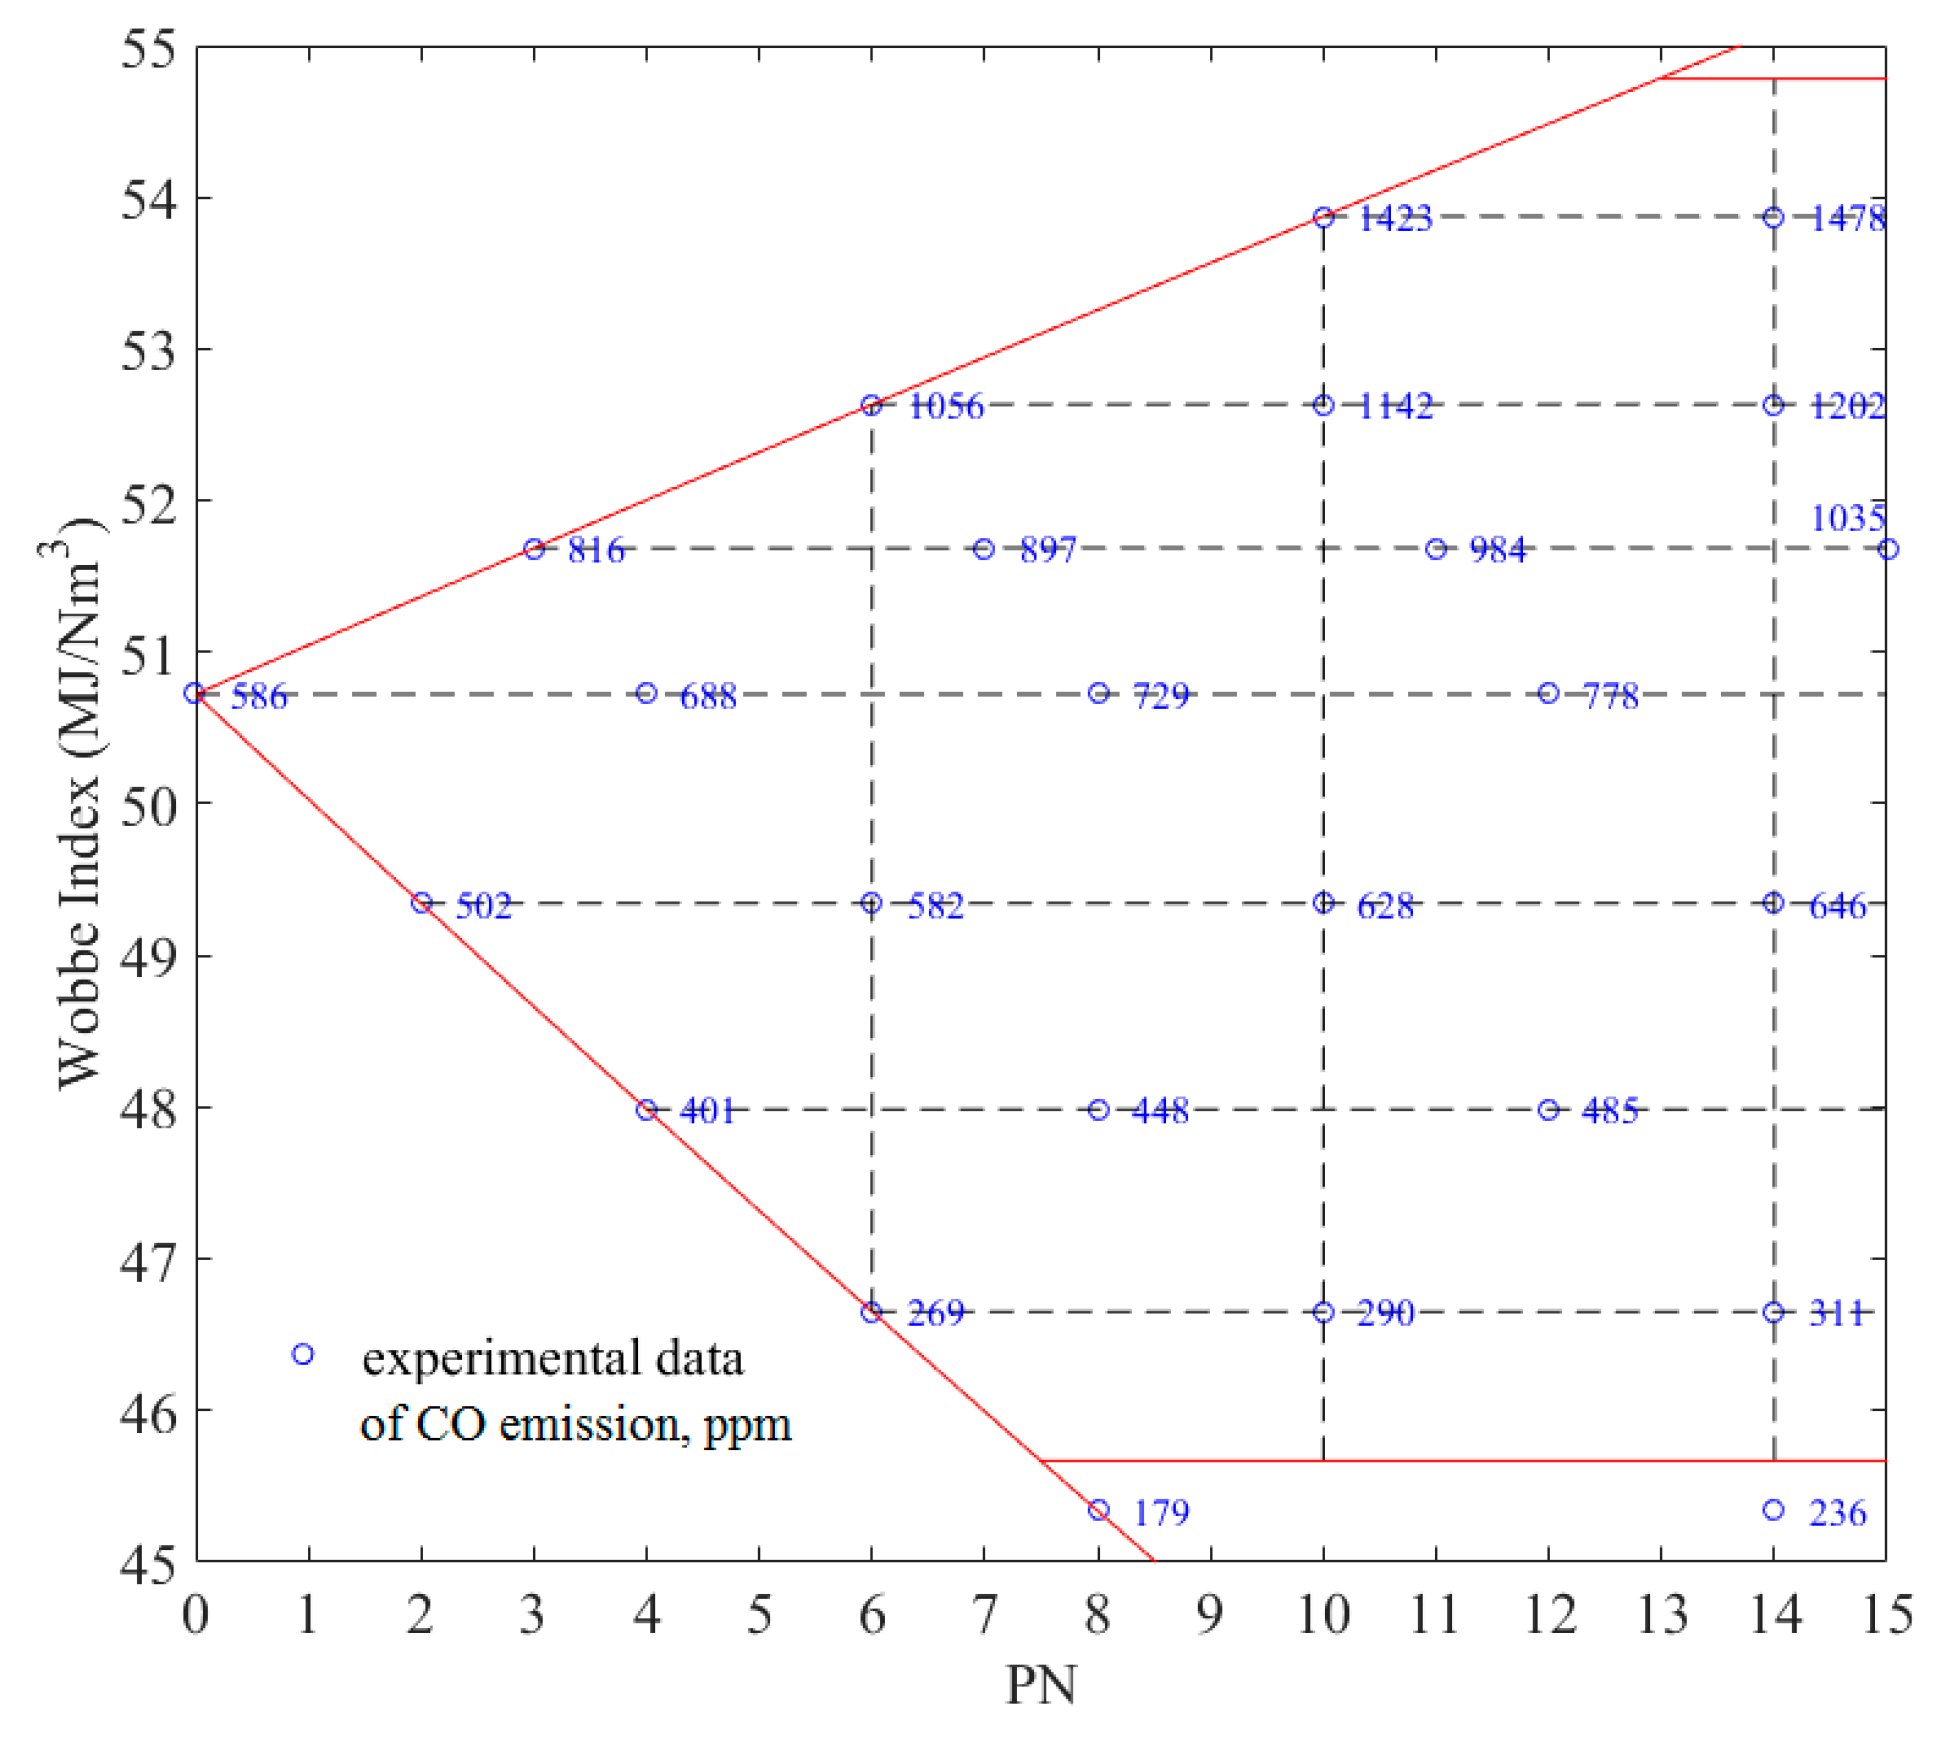
Figure 6 shows the measurement result, in which all blue figures donate CO emission in ppm.
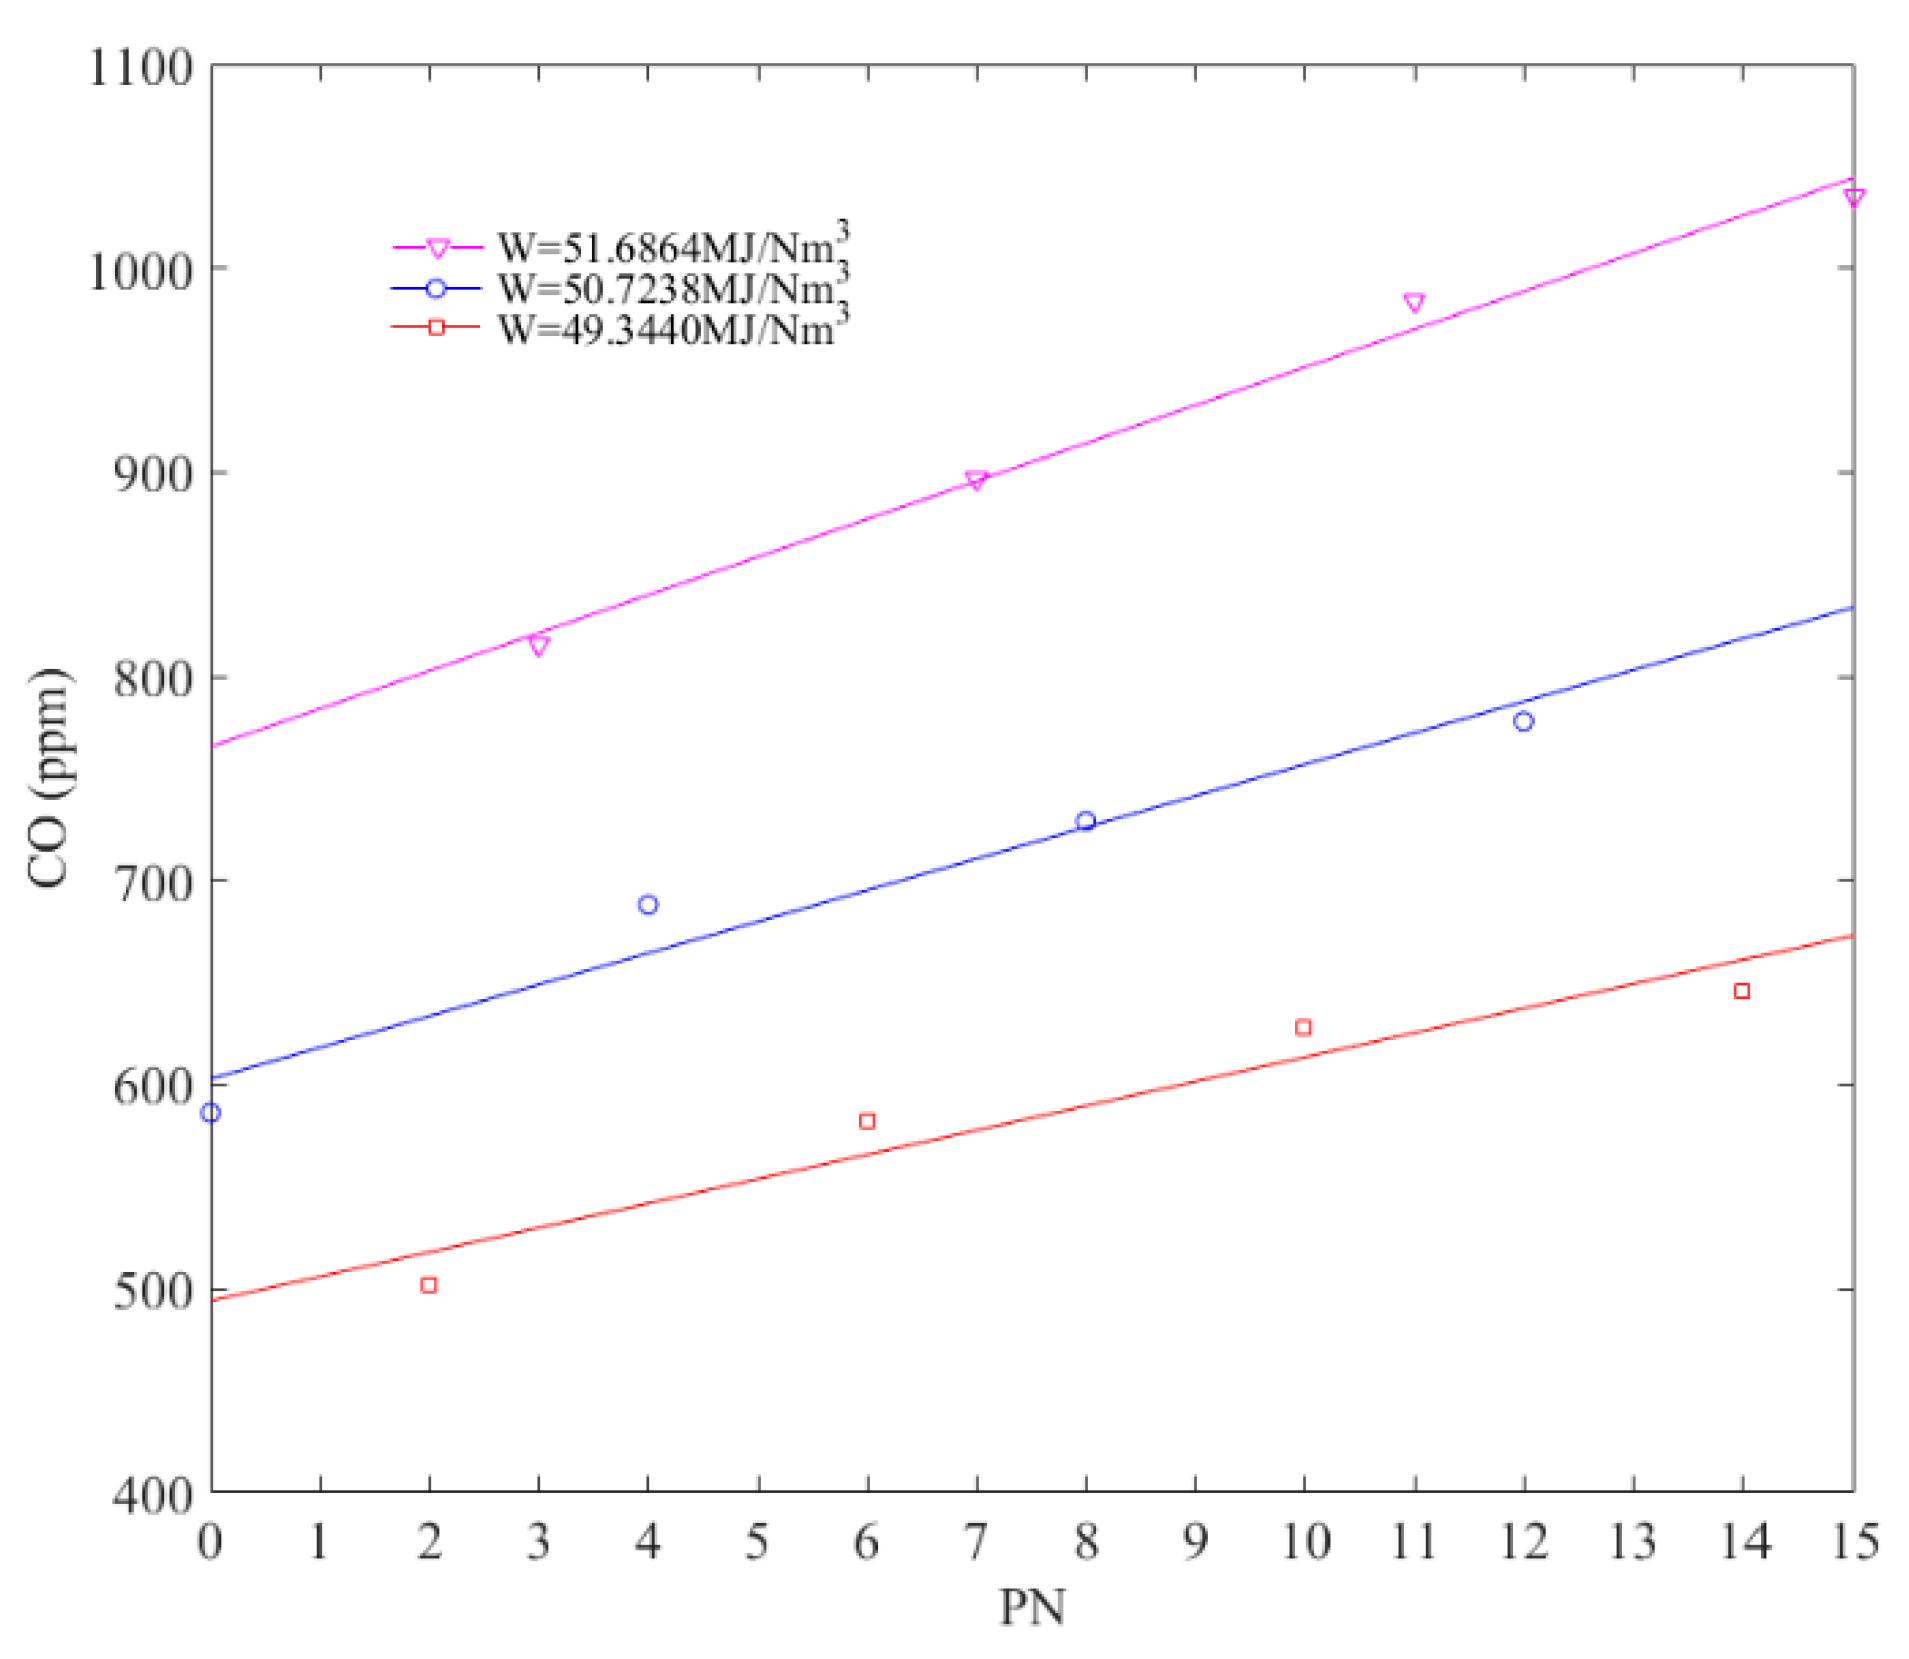
Figure 7 shows the CO emission changing with PN for a constant W index. When the Wobbe index was kept unchanged, the observed increase of CO emission could be attributed to an increasing tendency for incomplete combustion resulting from increasing propane, and to an increase of contact time between the flame and cold bottom being heated because of increasing N2. Meanwhile, when the PN index increased, the port intensity (kW per square meter of burner port area) decreased because the heating value decreased, leading to a decreasing of secondary air. All these factors cause the CO emission to increase with increasing PN, in a linear manner.
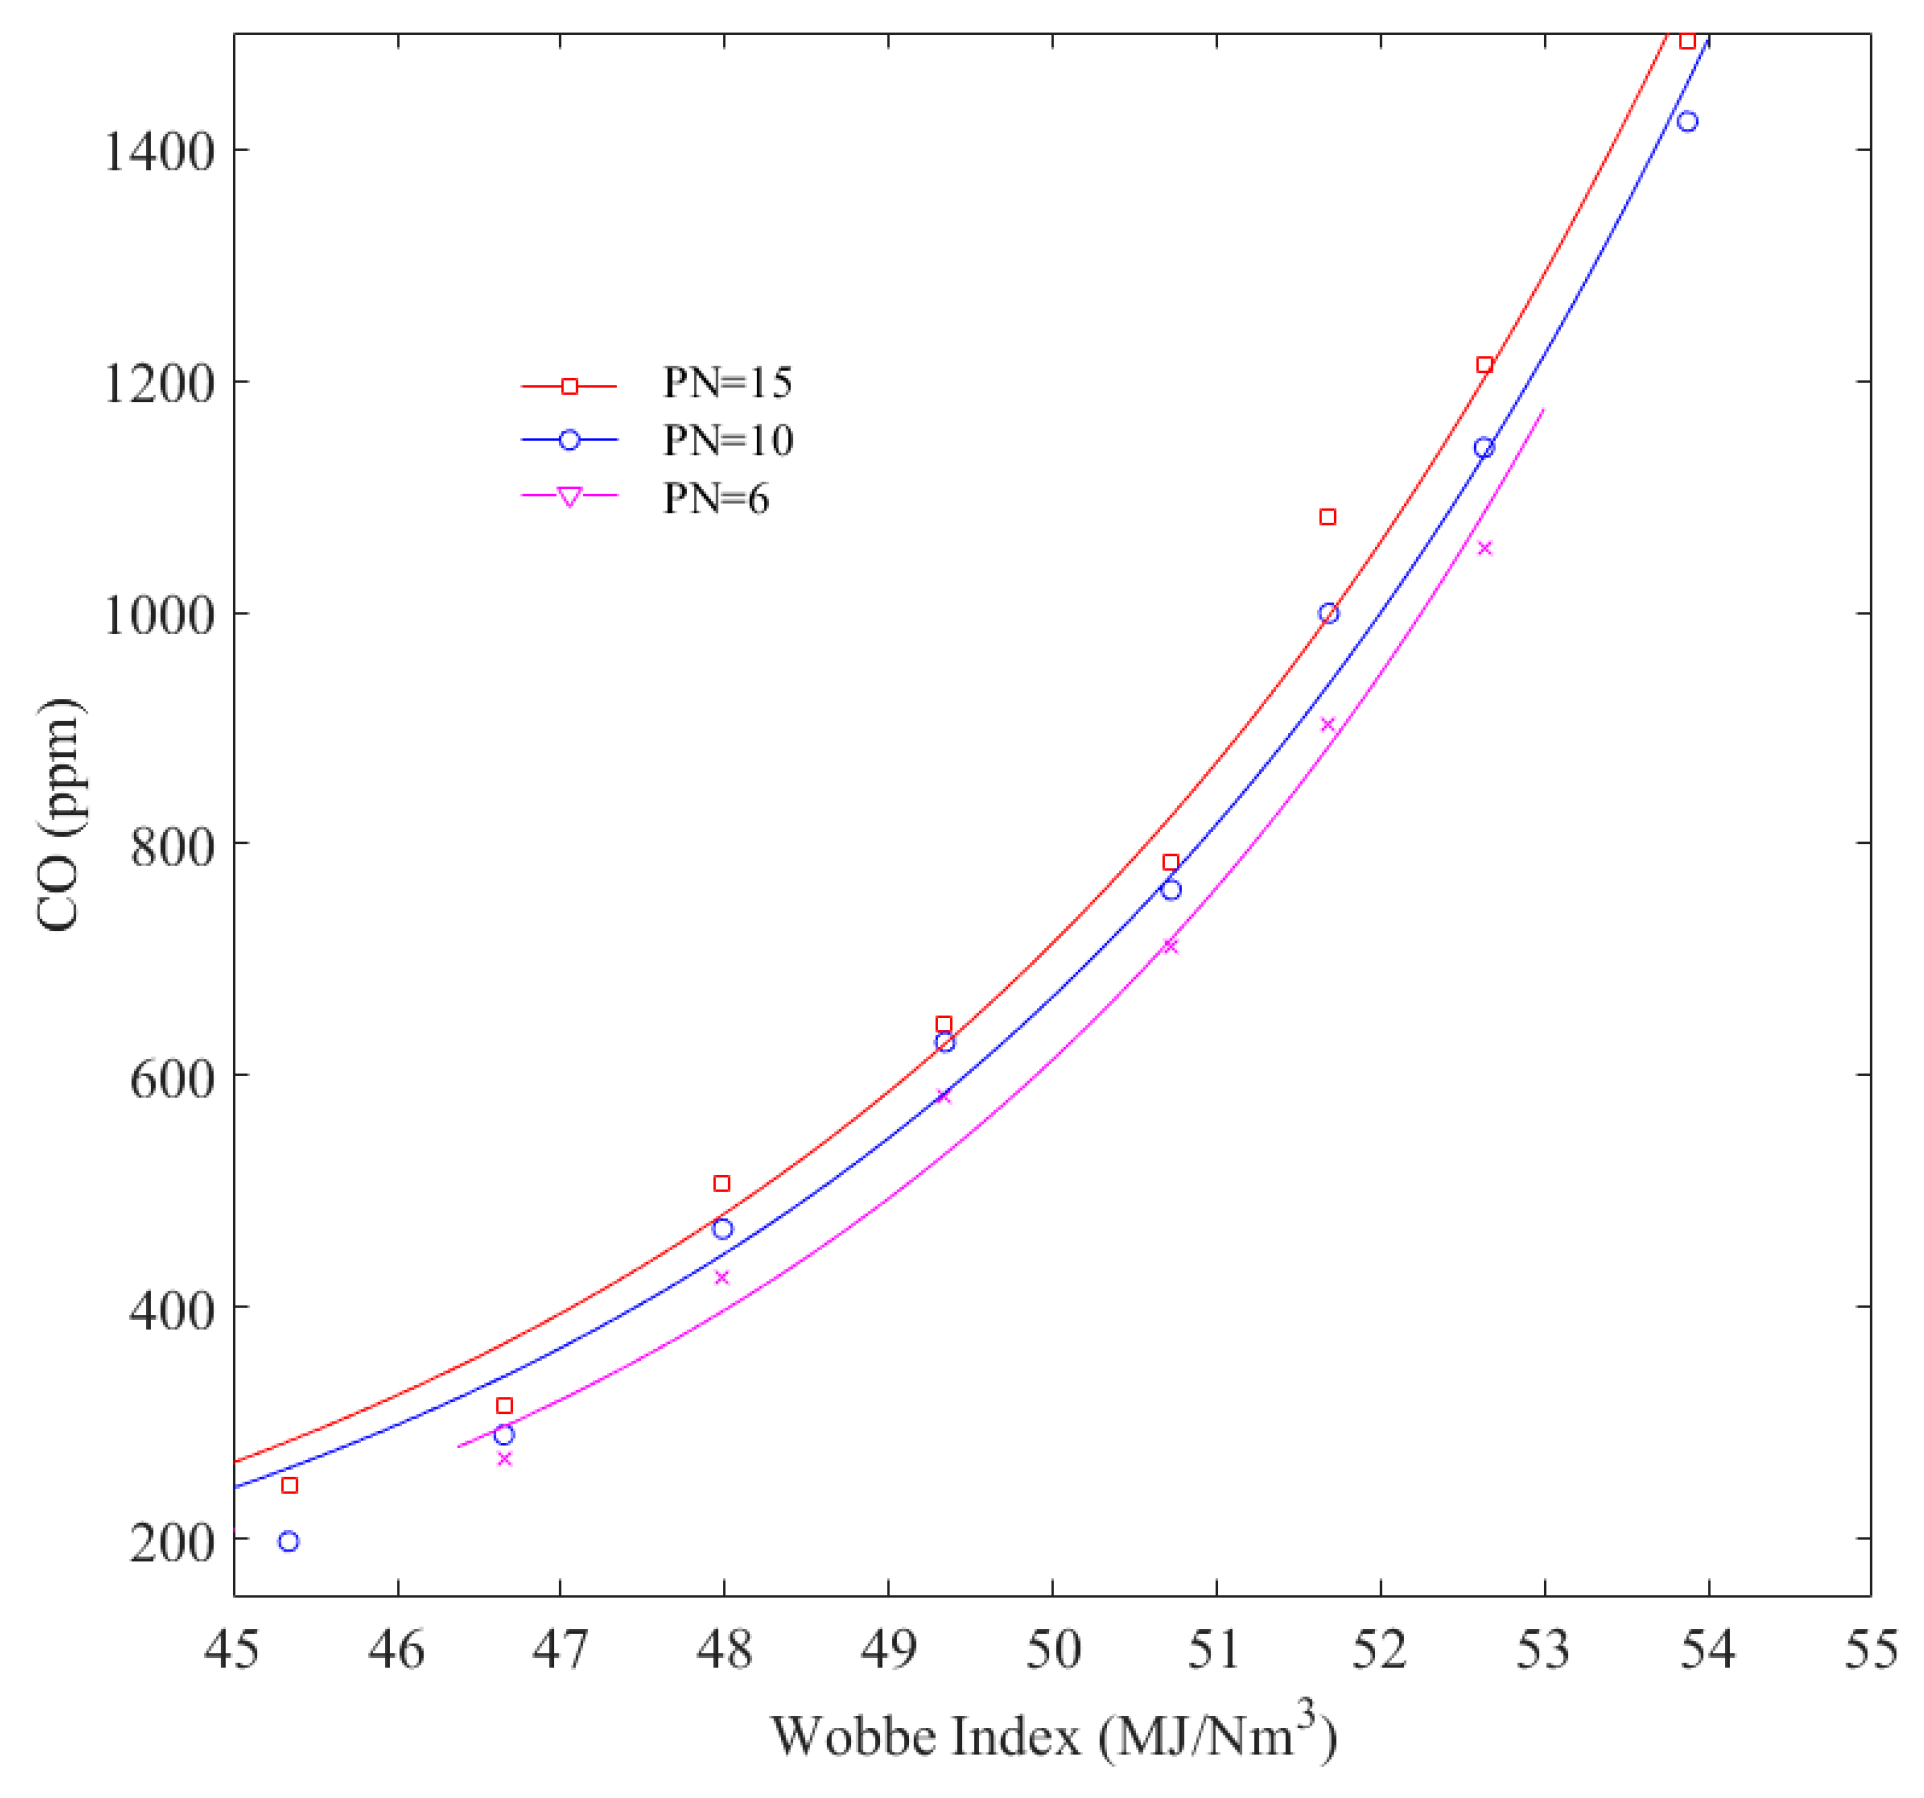
To obtain the relationship between CO emission and gas quality parameter, it is necessary to investigate the influence of the Wobbe index on the formation of CO. Figure 8 shows the CO emission changing with W under a constant PN number. Due to the change of the Wobbe index, the operation point of the cooker changed accordingly. Given a fixed PN number, increasing the W index means a higher heat input and lower primary air. Both factors enhanced the CO formation in an exponentially increasing pattern. Therefore, CO tends to increase exponentially with W. The change of the Wobbe index affects the formation of CO in two aspects: the gas properties and the operation condition of the burner.
CO emission was found to be increasing monotonically with both W and PN. Equation (8) can describe the relationship between CO and W, PN quite accurately.
C O = ( w 1 × P N + w 2 ) e w 3 × W = ( 3.797 × 10 4 × P N + 0.02 ) e 0.2045 × W
where CO is the CO emission of the gas cooker, ppm; w1, w2, and w3 are the coefficients; W is the Wobbe index, MJ/m3; and PN is the volumetric percentage of C3H8 plus N2 of the three-component mixture.
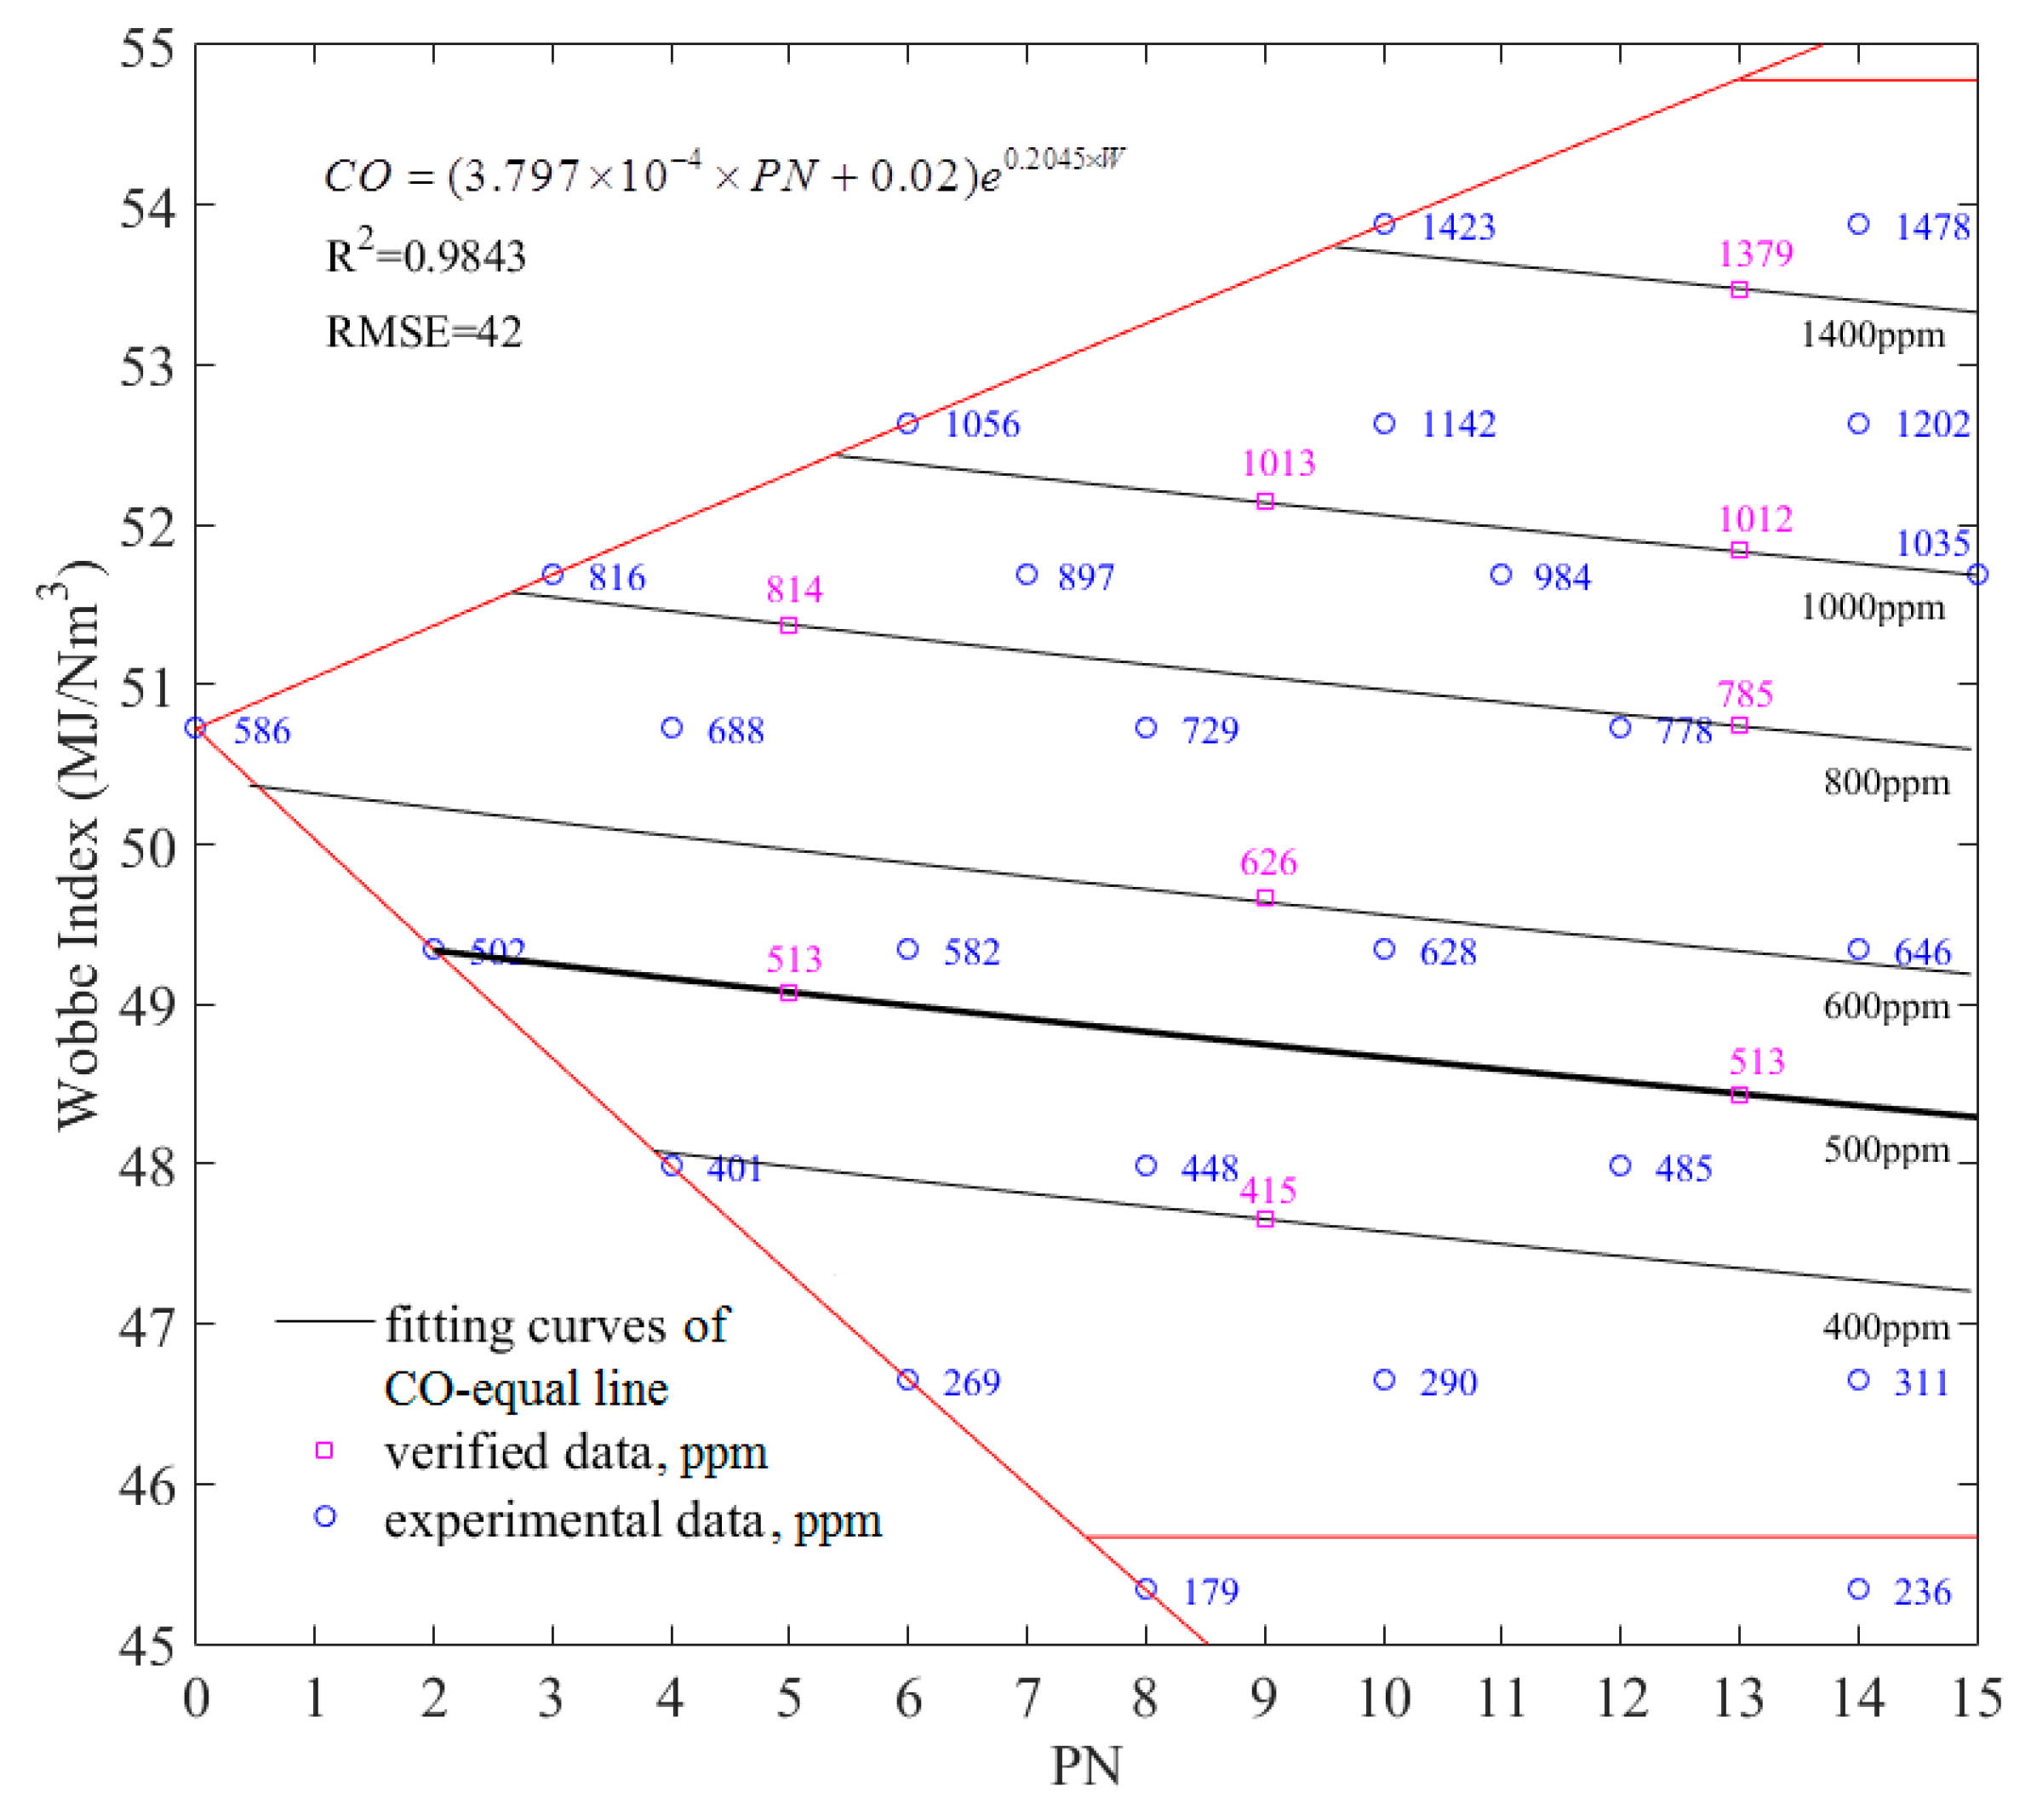
Let CO be equal to a constant value, e.g., 500; then, an equation depicting CO = 500 can be derived, as shown in Equation (9). In similar manner, a set of equal-CO lines for the tested cooker corresponding to initial primary air can be derived, as shown in Figure 9.
W = 4.890 × ln ( 3.797 × 10 4 × P N + 0.02 ) + 30.39
To examine the precision of Equation (8), some supplemental measurements were made to compare the predicted CO emission and measured data. Several deliberately designed three-component mixtures, as listed in Table 6, were input into the burner. Measured CO emission were given as well (in carmine square), as shown in Figure 9. From the difference between the predicted equal-CO lines and measured values, the derived equation can be precise enough. In addition, for a gas cooker that was initially adjusted under 12T-0, its CO emission can be predicted by the formula CO = (w1 × PN + w2)ew3×W.
It is stipulated in Chinese National Standard GB16410-2007 [24] that the CO emission from a cooker under test gas should not exceed 500 ppm. Figure 9 shows that the CO emission of the tested cooker will not exceed 500 ppm when fueled with three-component mixtures that fall below a 500 ppm equal-CO line (thickening line). It can be found that the range of gas to ensure a qualified emission is not large, and the choice of gases are quite limited. However, the national standard does not specify what the CO emission from a gas cooker should be when the gas constituents change. In fact, the Gas Safety (Management) Regulations (GS(M)R) of the UK stipulated that the CO emission from combustion equipment should not exceed the national standard of 20.48 = 1.4 times [20] under the varying gas composition. Therefore, the highest CO emission COmax can be set after a safety survey to expand the range of selectable gas sources.
The gas cooker geometry affects the CO emission significantly [28,29,30]. As for a cooker with different geometry, its CO emission can be predicted by the approach proposed above. To adopt the above conclusion to manage gas quality in China, all gas cookers in the market should be classified according to their structure, including the shape, angle of the ports, clearance from the surface being heated, etc. For each type of cooker, the following procedures can be applied step by step. (1) Adjust primary air with 12T-0 so that a nominal heat input and satisfactory flame shape can be achieved. (2) Measure CO emission under different three-component mixtures while maintaining the burner as unchanged, so that a series of equal-CO lines can be obtained. (3) After a safety investigation, the maximum CO emission of a gas cooker under various gas constituents is adopted. For each type of gas cooker, there would be a line corresponding to CO = COmax. Apparently, the public area enveloped by different types of gas cookers’ CO = COmax would define the gas quality, which can ensure that the CO emission will not exceed the National Standard. For gas quality outside this public area, some additional measures such as blending must be so as to ensure that the natural gas entering the network can meet the safety standards.

4. Conclusions

To predict the CO emission of gas cookers under different gas constituents and to improve gas quality management in China, CO emission from a gas cooker were measured with reference to Dutton’s approach. A typical cooker was tested with six sets of original gas constituents and their three-component mixtures. CO emission under different heat inputs and primary air coefficients were measured. Then, experiments were performed with a series of three-component mixtures. The CO emission changes with W and PN were studied systematically.
The main conclusions of this paper are as follows:
  • The CO emission from a gas cooker fueled by a specific gas is a function of the heat input and primary air coefficient, which can be described by a formula such as ln(CO) = f(Q2,Q,α′2,α′). Considering the influence of primary air coefficient, the traditional index ICF cannot be used to describe and predict the CO emission from a gas cooker.
  • The “equivalence” between a natural gas and its CH4/C3H8/N2 three-component mixture in terms of CO emission from gas cooker was experimentally validated.
  • The CO emission of a gas cooker was systematically studied by fueling three-component mixtures. It was found that the combination of two indexes W, PN, which are related to gas quality, can be used to describe the CO emission from a gas cooker.
  • Corresponding to a specific initial adjustment, the CO emission was found to increase linearly with increasing PN and to increase exponentially with increasing W. A function of CO = (3.397 × 10⁻⁴ × PN + 0.02)e0.2045 × W can be used to predict the CO emission of the tested cooker. In the WPN diagram, there exists a cluster of equal-CO lines for each type of gas cooker. The public area, enveloped by CO = COmax lines corresponding to each type of cooker, determines the range of natural gas permissible into the pipeline network.

Author Contributions

C.Q. and P.D. conceived and designed the experiments; P.D. and Z.C. performed the experiments; P.D. analyzed the data; P.D. wrote the paper; C.Q. and Z.C. edited the paper.

Funding

This work was supported by the research center for the efficient utilization of natural gas in HVAC and Gas Institute, Tongji University. This research received no external funding.

Conflicts of Interest

The authors declare no conflict of interest.

Nomenclature

Abbreviations
AGA American Gas Association
BCMbillion cubic meters (106m3)
GRIGas Research Institute
MFCmass flowrate controller
LNGliquefied natural gas
Symbol
12Tgroup 12T of natural gas in accordance with to GB/T 13611-2006, equivalent to group H in accordance with BS EN 437-2003
12T-0reference gas of 12T, 100% CH4
Acoefficients matrix
ethe Euler’s constant, which is the base of natural logarithms
EVthe mathematical expectation
E, Ncode for original gas tested
ET, NTcode for a three-component mixture corresponding to certain original gas
G20reference gas of Group H, 100%CH4
Hhihigher calorific value for individual constituent (MJ/m3)
Ithe mathematical expectation of absolute value of difference between two functions
ICFincomplete combustion factor
Lflow rate (Nm3/h)
Ppressure (kPa)
PNPN index, sum of C3H8 and N2 within equivalent three-component mixture (%)
Qheat input (kW)
r1,2,3,4,5,6the volumetric percentage of CH4, C2H6, C3H8, C4H10, N2, and CO2 in original gas (%)
sispecific gravity of individual constituent
x1,2,3the volumetric percentage of CH4, C3H8, N2 in the three-component mixture (%)
w1,2,3coefficients for data fitting
WWobbe index (MJ/Nm3)
αprimary air coefficient, defined as ratio of primary air (in volume) injected to air theoretically required for complete combustion (in volume), dimensionless
σthe root mean square error, RMSE
Subscript
aair
ggas
Tthree-component mixture
Ooriginal gas

References

  1. BP Company. BP Statistical Review of World Energy June 2017. Available online: Bp.com/statisticalreview (accessed on 5 July 2017).
  2. Guo, J.F.; Gao, S.J. The 2014 Report on the Development of China’s Clean Energy-Gases; Petroleum Industry Press: Beijing, China, 2014; Volume 182. (In Chinese) [Google Scholar]
  3. Qin, C.K.; Chen, N.N. Impact of gas constituents upon pollutant emissions of domestic gas cookers. Urban Gas 2015, 11, 11–18. (In Chinese) [Google Scholar]
  4. Harsha, P.T.; Edelman, R.B.; France, D.H. Catalogue of Existing Interchangeability Prediction Methods; Final Report-Phase II, GRI-80/0021; Gas Research Institute: Chicago, IL, USA, 1980. [Google Scholar]
  5. Halchuk-Harrington, R.; Wilson, R. AGA bulletin 36 and weaver interchangeability methods: Yesterday’s research and today’s challenges. In AGA Gas Operations Conference Paper; Unpublished work; 2006. [Google Scholar]
  6. NGC+ Interchangeability Work Group. White Paper on Natural Gas Interchangeability and Non-Combustion End Use; NGC+ Interchangeability Work Group: Washington, DC, USA, 2005.
  7. Programme Committee D. Liquefied natural gas. In Proceedings of the World Gas Conference, Amsterdam, The Netherlands, 5–9 June 2006. [Google Scholar]
  8. Honus, S.; Kumagai, S.; Němček, O.; Yoshioka, T. Replacing conventional fuels in USA, Europe, and UK with plastic pyrolysis gases—Part I: Experiments and graphical interchangeability methods. Energy Convers. Manag. 2016, 126, 1118–1127. [Google Scholar] [CrossRef]
  9. Honus, S.; Kumagai, S.; Toshiaki, Y. Replacing conventional fuels in USA, Europe, and UK with plastic pyrolysis gases—Part II: Multi-index interchangeability methods. Energy Convers. Manag. 2016, 126, 1128–1145. [Google Scholar] [CrossRef]
  10. Lee, C.E.; Hwang, C.H.; Lee, H.Y. A study on the interchangeability of LFG–LPG mixed fuels with LFG quality in domestic combustion appliances. Fuel 2008, 87, 297–303. [Google Scholar] [CrossRef]
  11. Lee, C.E.; Hwang, C.H.; Hong, S.C. Proposal and validation of a new type of flame stability diagram for partially premixed flames. Fuel 2008, 87, 3687–3693. [Google Scholar] [CrossRef]
  12. Karavalakis, G.; Hajbabaei, M.; Durbin, T.D.; Johnson, K.C.; Zheng, Z.; Miller, W.J. The effect of natural gas composition on the regulated emissions, gaseous toxic pollutants, and ultrafine particle number emissions from a refuse hauler vehicle. Energy 2013, 50, 280–291. [Google Scholar] [CrossRef]
  13. Hajbabaei, M.; Karavalakis, G.; Johnson, K.C.; Lee, L.; Durbin, T.D. Impact of natural gas fuel composition on criteria, toxic, and particle emissions from transit buses equipped with lean burn and stoichiometric engines. Energy 2013, 62, 425–434. [Google Scholar] [CrossRef] [Green Version]
  14. Lee, K.; Kim, J.M.; Yu, B.; Lee, C.E.; Lee, S. Effect of various gas compositions on gas interchangeability and combustion characteristics for domestic appliances. J. Mech. Sci. Technol. 2013, 27, 1191–1201. [Google Scholar] [CrossRef]
  15. Zhou, Y.; Huang, X.; Peng, S.; Li, L. Comparative study on the combustion characteristics of an atmospheric induction stove in the plateau and plain regions of China. Appl. Therm. Eng. 2017, 111, 301–307. [Google Scholar] [CrossRef]
  16. Zhang, Y.; Gao, W.; Yu, Y.; Wang, M.; Chen, C. Primary air ratio change and gas interchangeability index correct for domestic gas cooker burning multi-source natural gas. J. Nat. Gas Sci. Eng. 2016, 35, 276–282. [Google Scholar] [CrossRef]
  17. Chen, Z.G.; Qin, C.K.; Zhang, Y.J. Flame stability of partially premixed combustion for PNG/LNG interchangeability. J. Nat. Gas Sci. Eng. 2014, 21, 467–473. [Google Scholar] [CrossRef]
  18. Ko, Y.C.; Lin, T.H. Emissions and efficiency of a domestic gas stove burning natural gases with various compositions. Energy Convers. Manag. 2003, 44, 3001–3014. [Google Scholar] [CrossRef]
  19. Lin, X.Y.; Ma, H.T.; Liu, C.F.; Zhang, J.Y.; Zhang, Y.F.; Miao, Z.Z. Experimental research on gas interchangeability indices for domestic fully premixed burners. Fuel 2018, 233, 695–703. [Google Scholar] [CrossRef]
  20. International Gas Union (IGU). Guidebook to Gas Interchangeability and Gas Quality; IGU: Oslo, Norway, 2011; pp. 23–26. [Google Scholar]
  21. Dutton, B.C.; Souchard, R.J. Gas interchangeability: Prediction of incomplete combustion. J. Inst. Energy 1985, 12, 210–212. [Google Scholar]
  22. Dutton, B.C.; Gimzewski, E. Gas interchangeability: Prediction of flame lift. J. Inst. Energy 1983, 6, 107–108. [Google Scholar]
  23. Dutton, B.C.; Wood, S.W. Gas interchangeability: Prediction of soot deposition on domestic gas appliances with aerated burners. J. Inst. Energy 1984, 9, 381–382. [Google Scholar]
  24. General Administration of Quality Supervision, Inspection and Quarantine of the People’s Republic of China (AQSIQ). GB 16410-2007 Domestic Gas Stove; China Standard Press: Beijing, China, 2007. (In Chinese)
  25. General Administration of Quality Supervision, Inspection and Quarantine of the People’s Republic of China (AQSIQ). GB/T 13611-2006 Classification and Essential Property of City Gas; China Standard Press: Beijing, China, 2006. (In Chinese)
  26. General Administration of Quality Supervision, Inspection and Quarantine of the People’s Republic of China (AQSIQ). JJF 1059.1-2012 Evaluation and Expression of Uncertainty in Measurement; China Standard Press: Beijing, China, 2012. (In Chinese)
  27. Johnson, F.; Rue, D.M. Gas Interchangeability Tests Evaluating the Range of Interchangeability of Vaporized LNG and Natural Gas; GRI-03/0159; Gas Research Institute: Des Plaines, IL, USA, 2003. [Google Scholar]
  28. Hou, S.S.; Lee, C.Y.; Lin, T.H. Efficiency and emissions of a new domestic gas burner with a swirling flame. Energy Convers. Manag. 2007, 48, 1401–1410. [Google Scholar] [CrossRef]
  29. Zhen, H.S.; Leung, C.W.; Wong, T.T. Improvement of domestic cooking flames by utilizing swirling flows. Fuel 2014, 119, 153–156. [Google Scholar] [CrossRef]
  30. Li, H.B.; Wong, T.T.; Leung, C.W.; Probert, S.D. Thermal performances and CO emissions of gas-fired cooker-top burners. Appl. Energy 2006, 83, 1326–1338. [Google Scholar] [CrossRef]
Figure 1. Two burners to be tested. (a) original atmospheric burner with injectors; (b) modified forced-mixed burner.
Energies 12 03997 g001
Figure 2. Schematic illustration of test rig; the three sub-systems are shown in the red dash boxes.
Energies 12 03997 g002
Figure 3. Comparison of CO emission fueled by ET13, E13, and 12T-0 under several primary air coefficients (a) α′ = 0.40, (b) α′ = 0.44, (c) α′ = 0.48, and (d) α′ = 0.52.
Energies 12 03997 g003aEnergies 12 03997 g003b
Figure 4. Three-dimensional view of CO emission of E8 and ET8.
Energies 12 03997 g004
Figure 5. Images of the flame: (a) “soft” flame; (b) satisfactory flame; (c) satisfactory flame; (d) “hard” flame.
Energies 12 03997 g005
Figure 6. Distribution of testing three-component gases and experimental data of CO emission.
Energies 12 03997 g006
Figure 7. CO emission changing with PN under constant Q.
Energies 12 03997 g007
Figure 8. CO emission changing with W under constant PN number.
Energies 12 03997 g008
Figure 9. Equal-CO lines of tested cooker, the thickening line is a 500-ppm equal-CO line, and the Chinese National Standard [24] stipulates that CO emission from cooker should not exceed 500 ppm.
Energies 12 03997 g009
Table 1. Instrumentation involved in the test. MFC: mass flow rate controllers.
Parameter to be MeasuredInstrumentMeasuring RangeAccuracy/Minimum Scale
Burner systemAir flow rate to outer burnerWet flow meter and MFC20–6000 L/h0.15% full scale
Air flow rate to inner burnerMFC0–20 L/min<0.5% full scale
Gas flowWet flow meter and MFC0–25 L/min<0.5%
Gas flow rate to burnerWet flow meter20–600 L/h0.2%
Atmospheric pressureMercury barometer81–107 kPa0.01 kPa
Gas pressureU-type gauge0–5000 Pa10 Pa
Air pressureU-type gauge0–5000 Pa10 Pa
Gas temperatureMercury thermometer 0–50 °C0.1 °C
Air temperatureMercury thermometer0–50 °C0.1 °C
Flue gas analysisCO concentrationFlue gas analyzer0–2500 ppm<5 ppm
CO2 concentration0–25%<0.05%
NOx concentration0–2500 ppm<5 ppm
Table 2. Gas constituents and equivalent mixtures following Dutton’s approach.
CodeVolumetric Components (%)Wobbe Index (MJ/Nm3)
CH4C2H6C3H8i-C4H10n-C4H10C5H12CO2N2
12T-0100000000050.72
E493.674.240.420.060.070.030.481.0350.49
ET495.5802.7400001.6850.47
E888.938.470.540.100.090.040.671.1551.02
ET892.7305.1800002.0951.00
E1383.7613.610.500.080.090.040.711.2251.75
ET1390.2607.6000002.1451.76
N293.822.060.340.050.070.030.732.948.62
NT294.5001.6100003.8948.62
N591.072.540.420.060.080.030.675.1247.35
NT592.0401.9500006.0147.34
N686.325.820.410.060.080.030.76.5946.96
NT688.9203.5800007.5046.97
Table 3. The relative uncertainty of the measured value.
αQCOα′ = 1
Relative uncertainty<0.5%<0.2%<5%
Table 4. Comparison of Dutton’s incomplete combustion factor (ICF) index with calculated ICF based on experimental data.
ET13NT2NT6
α′ = 0.40α′ = 0.50α′ = 0.40α′ = 0.50α′ = 0.40α′ = 0.50
ICF-Dutton0.840.84−1.25−1.25−2.37−2.37
ICF-Experiment0.220.970.080.190.180.37
Table 5. Calculated I’s for some sets of gas constituents.
E4 vs. ET4E8 vs. ET8E13 vs. ET13N2 vs. NT2N5 vs. NT5N6 vs. NT6
I392333153833
σ525259343936
σT413241293472
Table 6. Several designed three-component mixtures and measured CO emission.
CodeVolumetric Components (%)Wobbe Index (MJ/Nm3)PNCO Emission, Predicted (ppm)CO Emission, Measured (ppm)
CH4C3H8N2
195.001.743.2649.085500513
295.004.040.9651.375800814
391.002.936.0747.669400415
491.004.944.0649.649600626
591.007.511.4952.14910001013
687.006.316.6948.4413500513
787.008.694.3150.7413800785
887.009.843.1651.831310001012
987.0011.591.4153.481314001379

