Article

The Impact of Substrate–Enzyme Proportion for Efficient Hydrolysis of Hay

Water Research Laboratory, Riga Technical University, P. Valdena 1-303 Riga, Latvia
*
Author to whom correspondence should be addressed.
Energies 2019, 12(18), 3526; https://doi.org/10.3390/en12183526
Submission received: 23 July 2019 / Revised: 19 August 2019 / Accepted: 4 September 2019 / Published: 13 September 2019
(This article belongs to the Special Issue Renewable energy solutions for the Baltic–Nordic region)

Abstract

:
Fuel alcohol production yields can be influenced by lignocellulosic biomass loading. High solid loadings (>20 wt%) are suggested to have the potential to produce more products. However, most often, low substrate loadings (<5% solids, w/w) are used to ensure good wetting and enzyme accessibility, and to minimize any inhibitory effect on the hydrolysis products. Here, we analyzed the effect of substrate loading on the enzymatic hydrolysis of hay with non-commercial enzyme products obtained from white-rot fungi. A significant negative effect on hydrolysis was observed when 10 wt% hay loading was used with the commercial enzyme, however, non-commercial enzyme products from white-rot fungi had no impact on hydrolysis in biomass loading rates from 1 to 10 wt%. Moreover, it was estimated that enzymes extracted from white-rot fungi could be used at a concentration of 0.2 FPU/mL at a biomass loading from 1–10 wt%, resulting in 0.17–0.24 g of released reducing carbohydrates per gram of biomass. Higher concentrations did not result in any significant conversion increase. A mixing impact was only observed in test runs at a substrate loading of 10 wt%. The apparently positive features of the non-commercial enzyme mixes give rise to their future use. The combination and upgrade of existing technologies, e.g., efficient pre-treatment, membrane purification, and concentration and efficient product recovery, should result in even higher conversion yields.

Graphical Abstract

1. Introduction

In 2016, conventional biofuels accounted for around 4% of the world’s road transport fuel. However, proposals for the revised Renewable Energy Directive (RED), of 2020–2030 in the European Union, included a decrease in food crop-originating biofuels from 7% to 3.8% (by energy) of the 2030 renewable energy target [1]. Despite the fact that lignocellulosic biomass represents a great source of sugars, with a huge availability on Earth [2] and an estimated productivity of around 2.3 billion L of biofuel by 2020 [1], high production costs, fragmented fuel markets, and lack of technical standards hamper the market development [3] yielding only ~1.5% of total forecasted biofuel production from biomass resources [1]. At the same time, technological developments, a low-to-zero conversion approach, replacement of chemical hydrolysis with biological enzyme-based hydrolysis, and biorefinery concept introduction has enabled breakthroughs for some of the technologies. However, the main drawback of the lignocellulosic biomass is still in its recalcitrance, which sets numerous challenges to the scientific and global community [2], especially in the enzymatic conversion of cellulose to glucose. The most often encountered problems are related to enzyme accessibility, inhibition from pre-treatment chemicals, and byproducts of the sugars, following the need for the introduction of various biomass pre-treatment steps and knowledge-intense hydrolysis to have high enough conversion rates. Moreover, lack of value for money is an often-seen issue in scientific research.
The current lignocellulosic biomass hydrolyzing enzyme market is highly competitive and technology-intensive, and it is estimated that by 2020, it will reach 10 billion USD [4]. Nowadays, the market is regulated by 12 major producers and 400 minor suppliers, where top biotech companies produce nearly 75% of all enzymes [5]. Due to the growing demand and limited supplier alternatives, the energy manufacturer is strongly dependent on the supplier. At the same time, it has been estimated that the cost of lignocellulosic ethanol could be reduced by simultaneous pentose/hexose fermentation, production of other materials (e.g., waxes or furfural) [6,7], or conversion of lignin fractions to other fuels, aromatics, carbon fiber, or various other price-competitive polymers [8]. Thus, many of the issues remain open.
To minimize the production costs and increase the conversion efficiency, it has been suggested to increase the solid concentration in the stream, entering hydrolysis [9]. As shown, a minimum wheat straw loading of ~20 wt% is required in order to reach the desired final ethanol concentration [7] of 4 wt% that is typically necessary for an efficient distillation step [10]. Solid loadings of up to 25 wt% have been demonstrated for corncob [11] and cellulose [12]. Nevertheless, the main drawbacks of this approach are the need for specific reactor systems and low-liquid pre-treatment/hydrolysis conditions. The effort in optimizing various pre-treatment options for high solids is evident and widely described; still, many questions require answers before the full power of utilizing high solids is recognized. Jorgensen et al. [9] have suggested a specific system for hydrolysis of wheat straw with loadings up to 40 wt%. However, they still concluded that there is a problem with liquefaction at solid loadings above 15–20 wt%. Moreover, it appears that there is a decrease in the conversion yield with increasing dry matter content; thus, the discussions about the inhibition of hydrolysis by the products at high solid loading rates remain unsolved.
Use of straw in lignocellulosic ethanol production is now expanding due to the developments in the conversion technology [13,14] and the general abundance of the resource. Nevertheless, the cost of pre-treatment and hydrolytic enzymes, land de-carbonization, and generally low conversion rates set certain limits of this approach. Along with agricultural crops, permanent grasslands covered over 57 million hectares (2007) of EU territory and temporary grasslands about 10 million hectares. Together, they made up about 39% of the European utilized agricultural area [15]. The productivity ranges from 1 to 12 t of dry matter/ha per year [16]. At the same time, around 146,067 kt of biomass yearly are available as agricultural residues [17]. This makes a huge amount of free resource that is currently used mostly for animal grazing, composting, or heating. The use of grassland and agricultural waste biomass for lignocellulosic fuel production is generally regarded as inferior due to the low yields per ha and high variability in species content that often makes the technology unstable. In the meantime, the potential of this feedstock was demonstrated in the production of biogas [18] and fermentable sugars required for alcohol production [19]. The aim of this study was to evaluate the impact of substrate loading on enzymatic hydrolysis of hay biomass obtained from natural grasslands as a substitution to straw with non-commercial enzyme preparations produced from fungi. The efficiency was performed at a batch and reactor scale, and simple mechanical and thermal pre-treatment was selected to favor the simplicity of the technology. To ensure more precise carbohydrate measurements, a modification in the standard reducing sugar analysis [20] was introduced, where multiple calibration curves were generated and selected based on the absorbance measurements (representing reducing sugar concentration) in each particular sample.

2. Materials and Methods

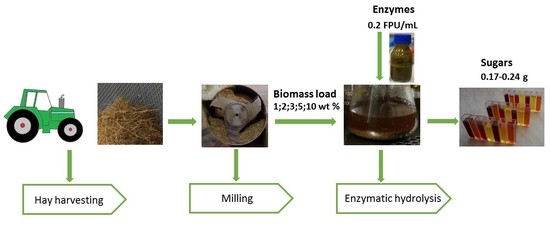
2.1. Biomass Pre-Treatment

Hay (dry weight (DW): 92.8% ± 1.3%) harvested in Latvia in June 2017 and 2018 from semi-natural grassland was milled by a mechanical cutting mill (Retsch SM100, Haan, Germany) with 1.5 kW drive and a parallel section rotor with a peripheral speed of 9.4–11.4 m/s. Particle size was controlled by a sieve with 10 mm square holes to obtain fractions <0.5 cm. After milling, all material was stored in a separate unit over the analysis period. Chemical composition of the biomass from grasslands was adopted for this study as 22–26% cellulose, 14–25% hemicellulose, and 1–13% lignin for hay [21]. Biomass load of 1, 2, 3, 5, and 10 wt% was diluted in a 0.05 M sodium citrate buffer (mono-sodium citrate pure, AppliChem, Darmstadt, Germany, pH 5.0) and boiled for 5 min (1 atm) to eliminate any indigenous microorganisms. Immediately after cooling to 37 °C, enzymatic hydrolysis was performed.

2.2. Enzymatic Hydrolysis in Batch and Reactor Scale

Batch scale hydrolysis tests were performed in 10 mL and 100 mL glass flasks. After cooling, 0.1–0.2% v/v of Viscozyme (cellulolytic enzyme mix, Sigma-Aldrich, Germany) or 20 FPU/mL (adjusted with sodium citrate) of laboratory-made unpurified enzyme mix was produced and precipitated from Irpex lacteus IBB 104 or Trichoderma reesei ATCC 13631 fungal cultures according to a protocol described by Mezule et al. [19] (2015), and was added to the samples of standardized volume to obtain a final enzyme concentration in the ranges of 0.1–0.4 FPU per mL of reaction liquid. Biomass hydrolysis was performed on an orbital shaker (150 rpm) at 30 °C (non-commercial preparations) or 37 °C for 24 h. Samples for sugar analyses were collected after dilution with the buffer, before enzyme addition, and after incubation. They were immediately treated or stored at −18 °C. All batch hydrolysis tests were repeated three times, and at least 2 samples from each test were collected for reducing carbohydrate measurements.
Reactor scale tests were performed in a glass bioreactor (Biotechnical Centre, Riga, Latvia) with a working volume of 2–4.5 L and with a diameter 150 mm equipped with one speed-controlled standard Rushton turbine type agitator with 6 blades. The temperature within the bioreactor was controlled with a programmable logic controller. The temperature in the bioreactor was maintained at 36.8–37 °C and the agitator speed was set up as 100 rpm. Before each run, the bioreactor was mechanically washed with sodium bichromate and autoclaved (121 °C, 20 min). For reactor scale testing, only Viscozyme was used. Biomass proportion was maintained irrespective of the working volume.

2.3. Carbohydrate Analyses

Reducing sugar analysis for all biomass samples after hydrolysis was performed using the dinitrosalicylic acid (DNS) method [20]. Before testing, all samples were centrifuged (6600× g, 5 min) to remove solids. Further to 0.1 mL of the supernatant 0.1 mL of 0.05 M sodium citrate buffer and 0.6 mL of 3,5-dinitrosalicylic acid (DNS, Sigma-Aldrich, Darmstadt, Germany) was added. Distilled water was used as the blank control. Then, all samples were boiled for 5 min and cooled by placing in cold water. Then, 4 mL of distilled water was added to the tube. Absorption was measured with spectrophotometer M501 (Camspec, Leeds, UK) at 540 nm. To obtain absolute concentrations, a set of standard curves against various glucose concentration ranges (0–5, 5–10, 10–15, and 15–20 mg/L) were constructed. D-glucose standard solutions (Sigma-Aldrich, Darmstadt, Germany) were used as stock and quality control.
Glucose measurements were performed by the Analox GL6 analyzer according to the manufacturer’s instructions (Analox, UK). Process control was evaluated by control measurements of hydrolyzed samples with UPLC (Waters Acquity H-Class) equipped with an RI detector and BEH Amide column with a flow rate of 0.15 mL/min.

2.4. Statistical Analyses

MS Excel 2013 t-test (two-tailed distribution) and ANOVA single parameter tool (significance level α ≤ 0.05) were used for the analysis of variance on data from various sample setups. Data variation was represented by standard deviation from at least 3 individual measurements.

3. Results and Discussion

3.1. Adjustment of Reducing Sugar Measurements

Sugar concentration in liquids, e.g., lignocellulosic hydrolysates, is usually assessed with high-performance liquid chromatography (HPLC), however, it has been shown that low separation of sugars in the peaks of the chromatograms might occur [22], especially during characterization of structurally similar sugars in a hydrolysis matrix. Moreover, it has been observed that there is a low correlation of these sugars with spiked samples and measurements obtained with the DNS method that determines the overall concentration of reducing sugars [22]. To generally assess the quality of the hydrolysates and presence of potential inhibitors, analyses with UPLC were performed with both commercial and laboratory-made enzyme preparations. The results indicate the presence of hexoses (when calibrated against glucose), other non-pentose monosaccharides, or disaccharides that could result from incomplete hydrolysis. Due to the potential presence of oligosaccharides, glucose measurements were introduced together with the reducing sugar analyses.
The standard methodology in reducing sugar analyses is based on the linearity where the produced results are directly proportional to the concentration of the analyte in samples a known range of concentrations [23]. In the DNS method, the relation is defined through the relation between glucose concentration and absorbance. Since the method has initially been used for sugar measurements in foods, it must be adjusted for the specific samples and concentrations [24]. In previous studies [19], the standard approach of constructing one calibration curve was used. However, it was observed that in certain cases, blind controls demonstrated inconsistent results with a tendency to be concentration-dependent. Thus, for further evaluation of measurement quality, reducing the sugar concentration estimated with the DNS method was calculated with the standard protocol and compared with a slightly modified version. All measured absorption values were directly correlated with the respective standard curve of the following concentration ranges: 0–5, 5–11, 11–15, and <15 mg/mL. The obtained calibration curve equations were y = 0.3198x − 0.0412 (R2 = 0.9997), y = 0.289x + 0.1668 (R2 = 0.9927), y = 0.3444x − 0.582 (R2 = 0.9833), y = 0.3474x − 0.7788 (R2 = 0.9272), respectively. The obtained linearities were further tested with known glucose standards and showed that it is possible to obtain more consistent results with the new approach (Table 1). This approach was used in all further hydrolysis tests.

3.2. Impact of Solid Loading on Hydrolysis Efficiency

Processing of pre-treated biomass at high solid loading is essential for the economic viability of the biofuel production and biorefinery concept as such. At the same time, the use of a fixed enzyme load simplifies day-to-day process operations when only approximate biomass weighing is available. Mass transfer at solid loadings above 20 wt% are suitable [25] and could generate ethanol concentration above 4 wt% that is necessary to substantially reduce the energy demand in the distillation step [10]. However, this typically comes with an increase in enzyme loads, and hence, the overall economic value is low. Low substrate loadings (<5% solids, w/w) is favored in biomass biological conversion technologies to ensure good wetting, enzyme accessibility, and to minimize any inhibitory effect of the hydrolysis products [11,12,19]; still, the enzyme load is recalculated based on the biomass added to the system. In this study, initial batch scale tests with hay and commercial enzyme preparation demonstrated that the amount of released reducing sugar tends to decrease (0–30%) with each biomass wt%. To confirm the results, biomass-free hydrolysis tests were performed. These demonstrated that commercial enzyme products could have a certain amount of carbohydrates in their formulations, including glucose, even at levels 30–50 g/L. This, in turn, can lead to false-positive evaluation of the hydrolysis efficiency. At the same time, carbohydrates (both glucose and reducing sugars) were not observed in any of the non-commercial products.
Further tests with a commercial product without carbohydrate content demonstrated a completely different tendency—at low biomass load (below 2 wt%), low ability to release sugars (Figure 1 black bars) was obtained. With the increase in biomass load, the amount of sugar that was released per gram of dry biomass increased to about 0.25 g sugar per gram of dry biomass. A certain increase in the conversion efficiency at 5 wt% loading was observed, with a further decrease (p < 0.05) for 10 wt%. Inhibition of enzyme adsorption by hydrolysis products is mentioned as one of the causes for efficiency decrease [26].
From the two fungi preparations, higher reducing sugar yields (10–28%) were observed with I. lacteus (p < 0.05) than for enzymes from T. reesei. The assessment of optimal hay loading with constant enzyme concentration showed that there is an optimal peak at 3 wt% for the T. reesei enzyme mix, however, no significant advantage was recorded (p > 0.05). Furthermore, substrate loadings below 10 wt% had no impact on I. lacteus enzyme mix at all (p > 0.05), indicating the high potential of these enzyme preparations for use in high substrate loading hydrolysis technologies.
The overall efficiency of hydrolysis with fungal enzymes was around 0.2–0.25 g/g of biomass used and ranged from 5 g/L (2 wt%) to 20 g/L (10 wt%) in liquid with around 70–75% of the yield originating from enzymatic hydrolysis and 25–30% from mechanical milling and heat treatment. Thus, the potential use of fungal enzymes with a high substrate loading rate and efficient production of fermentable sugars can be upgraded, especially by technological modifications to produce sugar concentrates. Nevertheless, the results demonstrated that certain variations in substrate loading, especially during industrial processing, do not have a significant impact on the yield per volume.

3.3. Impact of Mixing and Enzyme Loading on Hydrolysis Efficiency

To evaluate the impact of wetting quality and mixing on hydrolysis yields, the tests were transferred from batch to the reactor scale while keeping the same approach of using a constant enzyme load (0.2 FPU/mL final concentration). Mixing is essential for the generation of contact between the enzymes and biomass. Moreover, it decreases the number of zones with a high concentration of hydrolysis products and, thus, minimizes the potential inhibition of enzymes with hydrolysis products [26]. Contrary observations were made within this study (Figure 2). The mixing generated 20–32% less carbohydrates than batch at biomass yields <5 wt%, demonstrating that technological variations (water evaporation at flasks during pre-treatment, parameter control, sampling system) can affect the reported result. At the same time, at 10 wt% substrate load a 10% higher carbohydrate concentration was observed and indicated that at certain biomass concentrations mixing is essential. Thus, the accessibility of enzymes to the substrate showed to have a higher impact than the inhibition of hydrolysis products.
To evaluate the importance of enzyme concentration on hydrolysis efficiency, fungal enzymes at various concentration levels were tested with variable solid loading (Table 2). The results demonstrated that the impact of enzyme concentration is lower at low solid loadings. As previously stated, higher conversion rates are obtained at a lower solid load which attributes to the traditional approach of adjusting enzyme load solely on biomass quantity [27]. The observed upswing in productivity rates with additional enzyme concentration was low, contrary to previous observations where the results demonstrated a significant increase in saccharification with an increase in enzyme concentration [28]. No variation was observed in measurements of reducing sugars or glucose.
The effect of solids is apparent in the hydrolysis of hay. Increases in solid loadings above 5 wt% have a negative effect on the overall conversion rate and, thus, other technological approaches or commonly practiced increases in enzyme load should be used to increase the conversion rate and generate higher amounts of fermentable sugars necessary to fuel alcohol production. Suggestions related to potential hydrolysis product inhibition [9] were not shown to be essential in the conversion of hay to fermentable sugars. In the meantime, one of the potential explanations for the effect of solids could be linked to the interaction of water with the substrate—leaving less available water for the enzymes [29]. The introduction of other solvents and more efficient mixing at higher solid loading rates could be possibilities for future developments.

4. Conclusions

Biomass loadings from 1–10 wt% demonstrated no significant impact on hydrolysis efficiency when non-commercial enzyme preparations obtained from I. lacteus or T. reesei were used at the same enzyme loading rates. At the same time, commercial products showed a decrease in efficiency at substrate loadings of 10 wt%. The mixing effect was seen only at high substrate loadings, whereas at concentrations below 5 wt% higher hydrolysis yields were obtained in samples with no apparent mixing. The increase in enzyme concentration is not proportional to an increase in fermentable sugar concentration.
The results of the study demonstrated that non-commercial enzyme products obtained from fungi could be an efficient alternative to commercial preparations in technologies which use elevated substrate loadings or where an accurate loading is impossible due to practical limitations. The combination of these products with modern technological approaches, e.g., membrane technologies, will significantly increase the application of grassland biomass into valuable products.

Author Contributions

Conceptualization, experiment planning, and writing, L.M.; experiment performance and data analysis, L.M., I.B., and M.S.

Funding

This work has been funded by IPP3: INNO INDIGO Programme Project B-LIQ ‘Development of an Integrated Process for Conversion of Biomass to Affordable Liquid Biofuel’, No. ES/RTD/2017/18 (PVS ID 2802).

Acknowledgments

We thank Kristina Tihomirova for support in providing HPLC data.

Conflicts of Interest

The authors declare no conflict of interest.

References

  1. International Energy Agency. Tracking Clean Energy Progress 2017; IEA Publications: Paris, France, 2017; pp. 1–116. [Google Scholar]
  2. Sanchez, O.J.; Montoya, S. Production of bioethanol from biomass: An overview. In Biofuel Technologies; Gupta, V.K., Tuohy, M.G., Eds.; Springer: Berlin/Heidelberg, Germany, 2013; pp. 397–441. [Google Scholar]
  3. European Commission. Communication from the Commission to the European Parliament, the Council, the European Economic and Social Committee and the Committee of the Regions: A European Strategy for Low-Emission Mobility; SWD (2016) 244 Final; European Commission: Brussels, Belgium, 20 July 2016.
  4. King, D. The Future of Industrial Biorefineries; World Economic Forum: Geneva, Switzerland, 2010. [Google Scholar]
  5. Jaramillo, P.M.D.; Gomes, H.A.R. Chapter 6. Lignocellulose-degrading enzymes: An overview of the global market. In Fungal Biomolecules: Sources, Applications and Recent Developments; Gupta, V.K., Mach, R.L., Sreenivasaprasad, S., Eds.; Wiley-Blackwell: Chichester, UK, 2015; pp. 75–86. [Google Scholar]
  6. Ghosh, D.; Dasgupta, D.; Agarwal, D.; Kaul, S.; Adhikari, D.K.; Kurmi, A.K.; Arya, P.K.; Bangwal, D.; Negi, M.S. Fuels and chemicals from lignocellulosic biomass: An integrated biorefinery approach. Energy Fuels 2015, 29, 3149–3157. [Google Scholar] [CrossRef]
  7. Talebnia, F.; Karakashev, D.; Angelidaki, I. Production of bioethanol from wheat straw: An overview on pre-treatment, hydrolysis and fermentation. Bioresour. Technol. 2010, 101, 4744–4753. [Google Scholar] [CrossRef] [PubMed]
  8. Wang, H.; Pu, Y.; Ragauskas, A.; Yang, B. From lignin to valuable products-strategies, challenges, and prospects. Bioresour. Technol. 2019, 271, 449–461. [Google Scholar] [CrossRef] [PubMed]
  9. Jorgensen, H.; Vibe-Pedersen, J.; Larsen, J.; Felby, C. Liquefaction of lignocellulose at high-solids concentrations. Biotechnol. Bioeng. 2007, 96, 862–870. [Google Scholar] [CrossRef] [PubMed]
  10. Hahn-Hagerdal, B.; Galbe, M.; Gorwa-Grauslund, M.F.; Liden, G.; Zacchi, G. Bio-ethanol—The fuel of tomorrow from the residues of today. Trends Biotechnol. 2006, 24, 549–556. [Google Scholar] [CrossRef] [PubMed]
  11. Guo, H.; Su, R.; Huang, R.; Qi, W.; He, Z. Co-optimization of sugar yield and input energy by the stepwise reduction of agitation rate during lignocellulose hydrolysis. Food Bioprod. Process. 2015, 95, 1–6. [Google Scholar] [CrossRef]
  12. Lou, H.; Zeng, M.; Hu, Q.; Cai, C.; Lin, X.; Qiu, X.; Yang, D.; Pang, Y. Nonionic surfactants enhanced enzymatic hydrolysis of cellulose by reducing cellulase deactivation caused by shear force and air-liquid interface. Bioresour. Technol. 2018, 249, 1–8. [Google Scholar] [CrossRef]
  13. Ghosh, S.; Chowdhury, R.; Bhattacharya, P. Sustainability of cereal straws for the fermentative production of second generation biofuels: A review of the efficiency and economics of biochemical pretreatment processes. Appl. Energy 2017, 198, 284–298. [Google Scholar] [CrossRef]
  14. Tutt, M.; Kikas, T.; Olt, J. Influence of different pre-treatment methods on bioethanol production from wheat straw. Agron. Res. 2012, 1, 269–276. [Google Scholar]
  15. Ketzer, D.; Rösch, C.; Haase, M. Assessment of sustainable grassland biomass potentials for energy supply in Northwest Europe. Biomass Bioenergy 2017, 100, 39–51. [Google Scholar] [CrossRef]
  16. Leclère, D.; Valin, H.; Frank, S.; Havlík, P. Assessing the Land Use Change Impacts of Using EU Grassland for Biofuel Production. Task 4b of Tender ENER/C1/2013; Project Number: BIENL15199; ECOFYS: Utrecht, The Netherlands, 2016; pp. 1–55. [Google Scholar]
  17. Monforti, F.; Lugato, E.; Montola, V.; Bodis, K.; Scarlat, N.; Dallemand, J.F. Optimal energy use of agricultural crop residues preserving soil organic carbon stocks in Europe. Renew. Sustain. Energy Rev. 2015, 44, 519–529. [Google Scholar] [CrossRef]
  18. Herrman, C.; Prochnow, A.; Heiermann, M.; Idler, C. Biomass from landscape management of grassland used for biogas production: Effects of harvest date and silage additives on feedstock quality and methane yield. Grass Forage Sci. 2013, 69, 549–566. [Google Scholar] [CrossRef]
  19. Mezule, L.; Dalecka, B.; Juhna, T. Fermentable Sugar Production from Lignocellulosic waste. Chem. Eng. Trans. 2015, 43, 619–624. [Google Scholar]
  20. Ghose, T.K. Measurement of cellulose activities. Pure Appl. Chem. 1987, 59, 257–268. [Google Scholar] [CrossRef]
  21. French, K.E. Assessing the bioenergy potential of grassland biomass from conservation areas in England. Land Use Policy 2019, 82, 700–708. [Google Scholar] [CrossRef]
  22. Tihomirova, K.; Dalecka, B.; Mezule, L. Application of conventional HPLC RI technique for sugar analysis in hydrolysed hay. Agron. Res. 2016, 14, 1713–1719. [Google Scholar]
  23. Gonçalves, C.; Rodriguez-Jasso, R.M.; Gomes, N.; Teixeira, J.A.; Belo, I. Adaptation of dinitrosalicylic acid method to microtiter plates. Anal. Methods 2010, 2, 2046–2048. [Google Scholar] [CrossRef] [Green Version]
  24. Garriga, M.; Almaraz, M.; Marchiaro, A. Determination of reducing sugars in extracts of Undaria pinnatifida (Harvey) algae by UV-visible spectrophotometry (DNS method). Actas Ing. 2017, 3, 173–179. [Google Scholar]
  25. Hodge, D.B.; Karim, M.N.; Schell, D.J.; McMillan, J.D. Soluble and insoluble solids contributions to high-solids enzymatic hydrolysis of lignocellulose. Bioresour. Technol. 2008, 99, 8940–8948. [Google Scholar] [CrossRef]
  26. Kristensen, J.B.; Felby, C.; Jorgensen, H. Yield-determining factors in high-solids enzymatic hydrolysis of lignocellulose. Biotechnol. Biofuels 2009, 2, 1–11. [Google Scholar] [CrossRef]
  27. Kadić, A.; Palmqvist, B.; Lidén, G. Effects of agitation on particle-size distribution and enzymatic hydrolysis of pretreated spruce and giant reed. Biotechnol. Biofuels 2014, 7, 1–10. [Google Scholar] [CrossRef] [PubMed]
  28. Mussatto, S.; Dragone, G.; Fernandes, M.; Milagres, A.; Roberto, I. The effect of agitation speed, enzyme loading and substrate concentration on enzymatic hydrolysis of cellulose from brewer’s spent grain. Cellulose 2008, 15, 711–721. [Google Scholar] [CrossRef]
  29. Modenbach, A.A.; Nokes, S.E. Enzymatic hydrolysis of biomass at high-solids loadings—A review. Biomass Bioenergy 2013, 56, 526–544. [Google Scholar] [CrossRef]
Figure 1. The effect of hay substrate solid loading on fermentable reducing sugar yield in batch-scale tests with enzymes from Irpex lacteus (light grey), enzymes from Trichoderma reesei (grey), and commercial enzymes without the presence of a non-biomass associated carbohydrate (black). All enzymes were added at 0.2 FPU/mL. Standard deviation represents the average from three separate test repetitions.
Energies 12 03526 g001
Figure 2. The impact of mixing and the overall reactor system setup on hydrolysis efficiency at various substrate and constant enzyme loading rates. Standard deviation represents the average from three separate test runs.
Energies 12 03526 g002
Table 1. The impact of standard calculation methodology on fermentable reducing sugar yields in practical systems.
Glucose Standard, mg/mLSingle Calibration Curve Approach, mg/mLMultiple Calibration Curve Approach, mg/mL
2.52.292.47 *
5.04.895.05 *
7.06.246.62 *
10.08.9969.82 *
13.011.6913.08 *
18.016.0217.74 *
*—closer to theoretical value.
Table 2. Fermentable sugar yields (g reducing sugar per g dry biomass) at systems with variable solid loadings and variable final enzyme concentrations.
Solid Loading, wt%0.5 × Enzyme Concentration, 0.1 FPU/mLStandard Concentration, 0.2 FPU/mLDouble Enzyme Concentration, 0.4 FPU/mL
I. lacteusT. reeseiI. lacteusT. reeseiI. lacteusT. reesei
20.230.150.240.170.250.21
30.210.200.230.200.240.20
50.200.150.220.190.260.19
100.170.140.190.170.210.19

