Article

Experimental and Numerical Investigation of Wake Interactions of Marine Hydrokinetic Turbines

1
Hydraulic and Environmental Engineering Department, Pontificia Universidad Católica de Chile, Av. Vicuña Mackenna 4860, Santiago 7820436, Chile
2
Marine Energy Research and Innovation Center (MERIC), Av. Apoquindo 2827, Santiago 7550268, Chile
3
St. Anthony Falls Laboratory, Civil, Environmental, & Geo-Engineering Department, College of Science & Engineering, University of Minnesota, 2 Third Ave. SE, Minneapolis, MN 55414, USA
*
Author to whom correspondence should be addressed.
Energies 2019, 12(16), 3188; https://doi.org/10.3390/en12163188
Submission received: 30 July 2019 / Revised: 12 August 2019 / Accepted: 14 August 2019 / Published: 20 August 2019
(This article belongs to the Special Issue Fluid Dynamics in Marine and Hydrokinetic Energy System)

Abstract

:
To study the performance and environmental impacts of marine hydrokinetic (MHK) turbine arrays, we carry out an investigation based on laboratory experiments and numerical models able to resolve the dynamics of turbulent wake interactions and their effects on the river bed. We investigate a scaled Sabella D10 mounted on a mobile bed for a single and two aligned turbines, measuring the flow velocity, the rotor angular velocity, and the scour on the sediment bed. Numerical simulations are performed using a detached-eddy simulation (DES) turbulence model coupled with the blade-element momentum (BEM) approach, which can capture the mean flow and resolve the dynamics of turbulent coherent structures in the wakes. The simulations show a good agreement on the velocity statistics obtained experimentally. Power and thrust coefficients for the downstream turbine show an average decrease and a larger variability due to the turbulent intensity produced by the upstream turbine, as compared to the single turbine case. Results of this investigation also provide a framework to assess the predictive capabilities, scope, and applicability of computational models parameterizing the turbines using BEM, for testing different turbine designs and siting strategies within the MHK array.

1. Introduction

Tidal currents have a significant potential to contribute to the global energy supply in the near future. Large velocity magnitudes and turbulence intensities that develop in tidal channels are, for the most part, periodic and easily predictable [1], and they have the capacity of providing clean and sustainable energy through the installation of multiple submerged in-stream converters.
Marine hydrokinetic (MHK) turbines that are designed to harness energy from tidal channels are still at an early stage of development [2], but promising new technologies are being deployed in testing facilities and in the field, where single turbines are already providing energy to isolated or off-grid sites [3].
In future commercial developments, however, the most effective energy extraction deployments will have to consider multiple turbines installed in arrays, whose relative position will be defined to optimize their performance subject to other human activities along the coast, and to environmental, operational, and maintenance costs constraints. Therefore, future advances of MHK technologies will require studying in detail the turbulent wakes downstream of turbines, their interactions within arrays, and the impacts on the environment for a wide range of temporal and spatial scales [4].
Investigations of turbine arrays need an integral perspective, combining laboratory research and numerical models with field observations to characterize the sites and optimize the array for the specific MHK turbine design under consideration. However, since MHK technologies have not yet converged, many different turbine designs will likely co-exist and compete in the next decades.
The most common design of MHK devices is horizontal-axis tidal turbines (HATTs), where also most of the research and investments in the sector are concentrated [5,6]. Some of the large-scale HATT technologies have already reached megawatt-level power capacity, for flow velocities in the range of 2.6–4.0 m/s, and maximum power coefficients C p estimated between 0.34 and 0.45 [2].
Many innovative HATT designs, currently in the testing phase, exhibit very different geometries of the turbine rotors and support structures that can change significantly the dynamics of the wakes and their effects on the surrounding environment [7]. These design conditions and their influence on the flow hydrodynamics pose a significant challenge for experiments and numerical models aimed at understanding the dynamics of wake interactions and determining the fundamental mechanisms that control bed erosion and sediment transport [8].
In recent years, several experimental studies have been performed by different authors, mostly on single turbine installations, to improve the understanding of device–flow interactions. Chamorro et al. [9,10] studied the effect of ambient turbulence on the performance of the turbine and the wake dynamics and recovery. Their results showed that turbulence has effects on the performance of turbines for rotational frequencies below a critical value and that for higher values, there are no effects. Furthermore, they showed that the wake recovery was related to the breakdown of the tip vortex structures favoring large-scale meandering motions and mixing downstream (see also Kang et al. [11] and Howard et al. [12]). Maganga et al. [13] analyzed the effects of ambient turbulence intensity over turbines and found that for incoming flows with a greater ambient turbulence intensity, there are significantly higher loading fluctuations on the turbine blades. Mycek et al. [14,15] studied the turbulence intensity effects on MHK devices for two different turbine arrays. They showed that turbulent intensity has effects on performance fluctuations and the shape and length of wakes. Recent investigations have also focused on the local impacts of turbines on mobile beds, studying erosion and interactions with sediment bed morphology [16,17,18,19].
Numerical simulations can provide simultaneous information in the spatial and temporal domain. However, there are multiple alternatives to model the flow and MHK devices, which differ in the demand of computational resources, offering also a wide range of precision. Current modeling strategies range from simpler computationally-inexpensive models that solve the flow in steady-state conditions and consider turbines as uniformly-loaded disks, to more complex, highly-accurate, and computationally-expensive models that employ large-eddy simulations (LES) for solving the flow with a detailed turbine geometry representation [11].
Models based on LES have proven useful for simulating near-field wake flows, while unsteady Reynolds-averaged Navier–Stokes (URANS) methods, based on isotropic turbulence models, are typically not suitable due to the anisotropy of the Reynolds stresses in flows around MHK devices [20]. Full resolution simulations of the rotor geometry, however, are case-specific to the turbine design, and they have a high computational cost [21], especially in cases that involve multiple devices. Alternative strategies are thus used to parameterize the turbines, such as the actuator disk models (ADM) [22,23,24], blade element momentum models (BEM) [25,26,27], or actuator lines models (ALM) [28,29]. It is thus important to define the scientific question that motivates the development of the model to determine the level of detail required for the specific modeling approach.
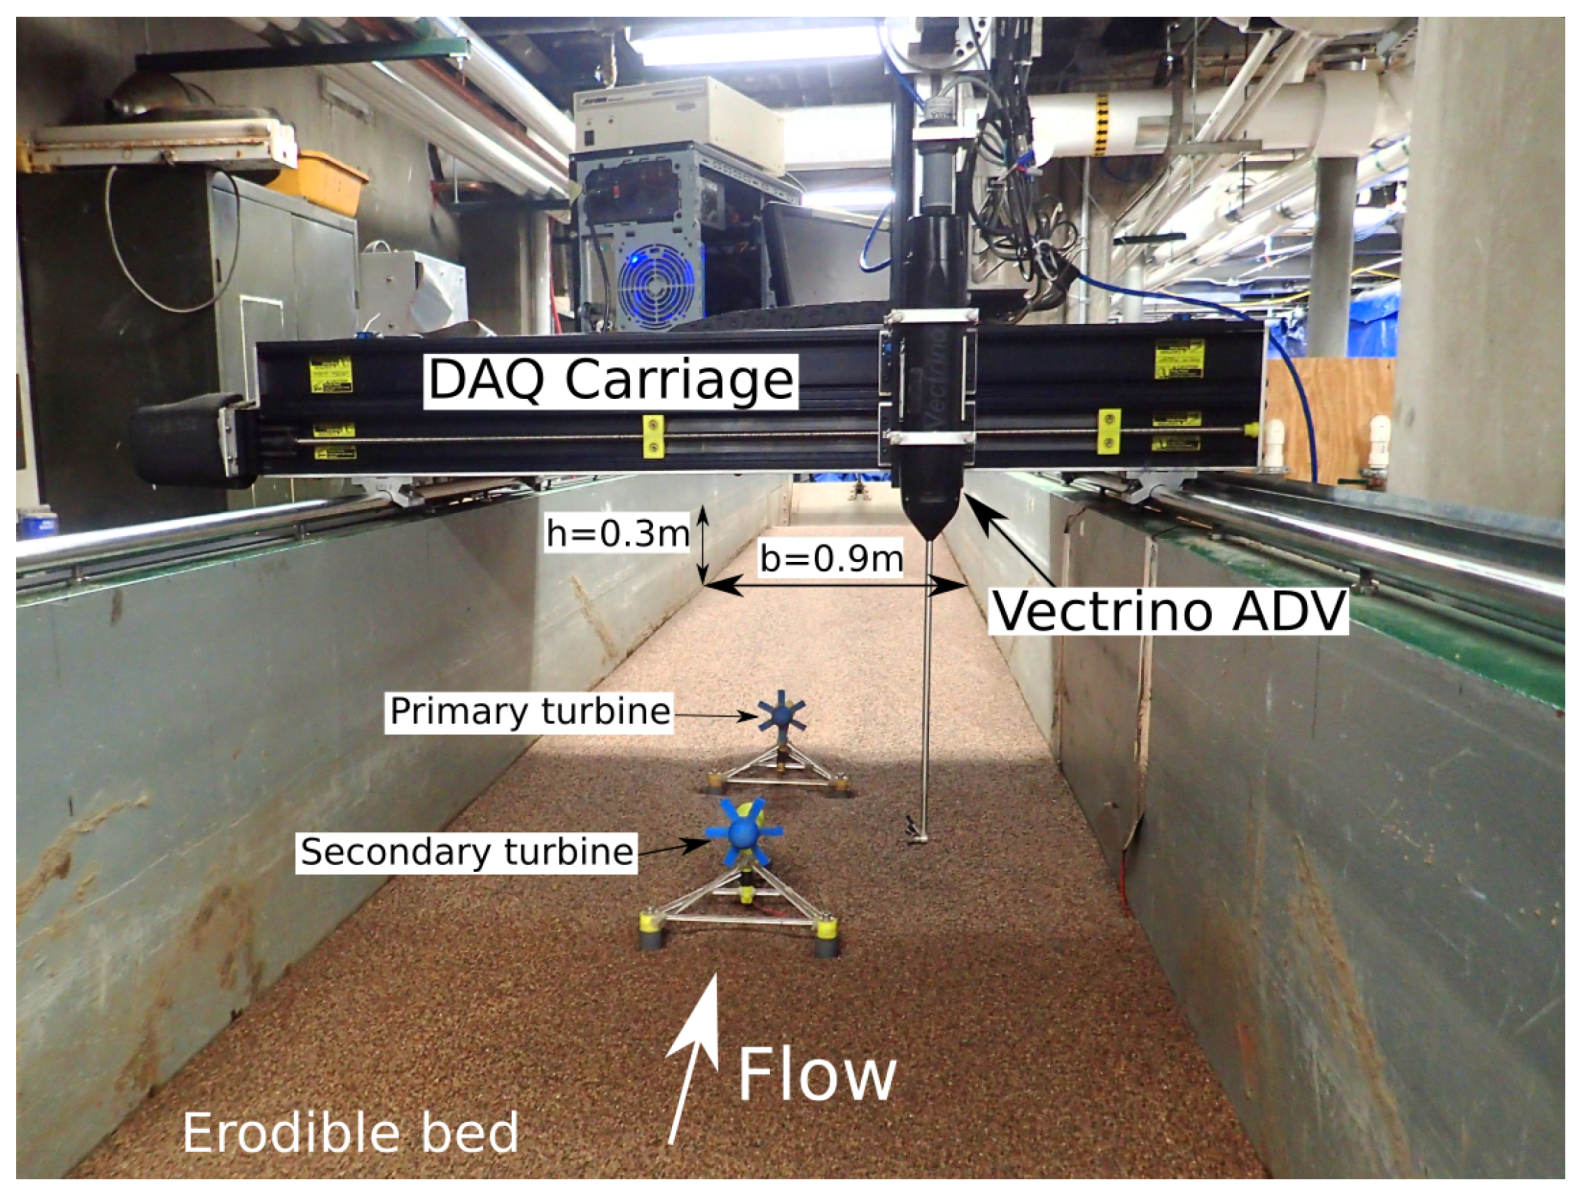
In this investigation, we carry out an experimental study coupled with numerical simulations of a Sabella D10 MHK turbine. The Sabella D10 is a six-blade bidirectional HATT device with a blunt hub and nacelle that has already been installed in the ocean, providing energy to the island of Ouessant, in western France. We carry out laboratory experiments of the flow past a single-scaled turbine, and two aligned turbines mounted on an erodible bed in an open channel.
We also perform numerical simulations of these flows, using the model of Gajardo et al. [30] that couples the BEM approach with detached-eddy simulations (DES). DES is a coherent-structure-resolving hybrid turbulence model that employs URANS near wall boundaries and LES in the rest of the domain [31].
Gajardo et al. [30] used the DES-BEM model to simulate the experiments of Stallard et al. [32], for arrays of three-bladed turbines. In all cases, the model showed better agreement with the experimental results, compared to an RANS model employed to simulate the flows with a more detailed description of the rotor and blades. It is important to point out that these turbines have a very different geometry compared to the Sabella D10, with elongated blades and a relatively small section occupied by the hub and the nacelle.
Here, we combine the analysis of experiments and simulations with two main objectives: (1) characterizing the flow fields in the wakes downstream of Sabella D10 turbines, for a single device and two devices installed in tandem, analyzing the hydrodynamic features of the wake generated by these HATTs, which are characterized by a large hub and nacelle and six symmetrical blades; and (2) evaluating the advantages, accuracy, and scope of the DES-BEM model for these turbines, identifying under which conditions we can consider this approach to simulate turbine arrays accurately.
The paper is organized as follows: In Section 2, we summarize the materials and methods utilized for the experimental and numerical investigations. Section 3 includes the laboratory measurements and the numerical simulation results, showing the time-averaged flow field, turbulence statistics, and the dynamics of turbulent wakes downstream of the turbines. Finally, in Section 4, we present the conclusions, summarizing our findings and outlining topics for future research.

2. Materials and Methods

The prototype used for this study was the D10 model of Sabella, a six-bladed turbine, with a 10-m rotor diameter and a 0.5–1.1-MW power capacity at flow velocities of 3.0–4.0 m/s [33]. Recently, one of these turbines was deployed for the second time at the Fromveur passage (near Brest) in France at 55 m deep [2]. For the experiments, the device was scaled to 1:108 from the original prototype.

2.1. Experimental Setup

We carried out the experimental measurements in the tilting bed flume at the Saint Anthony Falls Laboratory (SAFL) at the University of Minnesota. The channel has dimensions of 14.6 m long and 0.9 m wide, a slope set at 0.1%, quartz sediment moving bed ( d 50 = 0.0018 m), and a 3-axis flume-traversing data acquisition (DAQ) carriage, shown in Figure 1. We set the water height, h, at 0.3 m in order to have a similarity of the Froude number ( F r ) between the scale model and the operation conditions of the turbine prototype, and the other main dimensionless parameters (e.g., Reynolds and tip speed ratio (TSR)) stayed in similar ranges. Under these conditions, the values of local shear stress were below the critical value according to the Shields curve [34]. Therefore, all experiments were made with clear water conditions.
The turbines were equipped with an isolated miniature DC motor for instantaneous voltage measurement. The proper torque of the DC motor allowed us to have values of the tip-speed ratio (TSR) near those indicated by the design of the prototype. The turbine produced a cross-section blockage of 2.5%, so blocking effects were negligible according to previously-reported blockage studies [9,35]. Table 1 summarizes the main turbine and flow characteristics.
We performed velocity, scour, and voltage measurements for two different installations of turbines centered in the channel: a single turbine (ST) and two turbines (TT) aligned with a streamwise spacing of 6 turbine diameters ( 6 D = 55 cm) measured from the hub end of the upstream turbine to the nacelle of the downstream turbine. In the ST case, the turbine was located 7 m downstream of the channel flow inlet. For the TT case, the downstream turbine (referred to as the primary turbine) was kept in the same place, while the secondary turbine was located 6D upstream. We selected the position of the turbines to be within a section with fully-developed flow, where the topography is not influenced by the channel edge conditions. We defined the origin of the coordinate system ( X , Y , Z ) = ( 0 , 0 , 0 ) at the hub end of the primary turbine, coincident with the rotor center.
We used two Nortek Vectrino ADV devices to measure velocity at different flume positions. Before each measurement, we positioned the Vectrino 2 m (approximately 20 D ) upstream of the secondary turbine to obtain the inflow profile without the perturbation caused by the turbine presence. The velocity deficit caused by the turbine was registered in the longitudinal direction within the first ten diameters of distance from the device. We measured the velocity at each point for 3 min at a sample rate of 200 Hz at all points where the average velocity was needed. The flow energy spectra were obtained from velocity measurements taken for 15 min at hub height in two different locations: 2 m upstream and 10D downstream of the primary turbine. We filtered all the instantaneous velocity data obtained on these measurements using the spike-removal technique proposed by Parsheh et al. [36]. A schematic representation of the turbine model deployment and the flow measurement locations in the experiments are shown in Figure 2.
Voltage measurements were used to estimate the angular velocity of the rotor as performed in [17]. In both case studies, the voltage was recorded at a rate of 200 Hz for the primary turbine for the whole duration of the experiments. By means of a fast Fourier transform (FFT) analysis of the instantaneous voltage record, the power spectra were estimated and the identified peaks used to evaluate the turbine rotation frequency [17]. This procedure was checked through a calibration procedure based on high-speed video recording of the rotor by a submerged camera.
MHK turbines were anchored on the river bed, and their wake may induce local alterations on the wall shear stress and thus on the dynamics of sediment transport and deposition [17,37]. We thus recorded the channel bathymetry, using a laser mounted on the DAQ carriage, ensuring a spatial resolution of 2 mm × 2 mm, after each experiment. We used the shear velocity u * estimated by the measured free surface profile as a sediment transport capacity indicator. From the simulations, we estimated the shear velocity u * = τ ρ , where τ is the calculated bed shear stress [34], to identify possible zones of sediment erosion or deposition caused by turbines’ interaction with the bed, and to compare with experimental bathymetry observations.

2.2. DES-BEM Model

To simulate turbines and their local effects on the environment, we used a numerical model that solves the flow using the detached-eddy simulation (DES) approach [31], coupled with the blade element momentum (BEM) model for the devices. DES is a hybrid turbulence model that combines the Reynolds-averaged Navier–Stokes (RANS) approach with large-eddy simulations. The RANS mode was only active near the channel walls, to reduce the computational cost of resolving the turbulent boundary layer. Turbines were represented by a volume V inside the mesh (see Figure 2b). The turbine forces were calculated from BEM theory and applied to all nodes located within this volume, and the inlet considered the ambient turbulence by using a random flow generator proposed by Smirnov et al. [38], using the measured turbulence intensity in the experiments. For details on the numerical model and coupling between the flow solver and BEM, the reader is referred to the recent work of Gajardo et al. [30].
For the simulations, we employed structured non-staggered grids and generalized curvilinear coordinates. In both simulations, we used rectangular meshes with the same number of nodes in all directions. The node distribution changed between both cases to give a better grid resolution in critical zones where the flow fields had abrupt changes. Sections of the channel near the volume V containing the turbines had a higher node density, and within this zone, the nodes were equally distributed, while outside the turbine volume, the grid spacing varied in such a way as to reach the walls with a distance of 30 y + . The size of the grid was selected based on our previous work for similar Reynolds numbers, as the DES model resolved the large-scale coherent structures that account for most of the turbulent kinetic energy. The size of the BEM element was defined by the size of the space occupied by the nacelle and blades of the turbine. Table 2 lists the most important parameters for both grids of the numerical simulations.

3. Results and Discussion

In this section, we present the results for the two cases of study. From the experimental measurements, we report the mean velocity field, turbulent statistics of the wake, and the net scour at the bed. We also study the effects of inflow turbulence on the angular velocity of the turbine rotor, by analyzing the voltage output. From the numerical simulations, we obtain the bed shear stresses and the turbine performance coefficients.

3.1. Flow Field Downstream of the Turbines

We studied the streamwise wake development through the velocity deficit at the turbine rotor center height, which is defined as follows:
U d e f = 1 U U
where U is the upstream bulk velocity and U is the time-averaged streamwise velocity. 
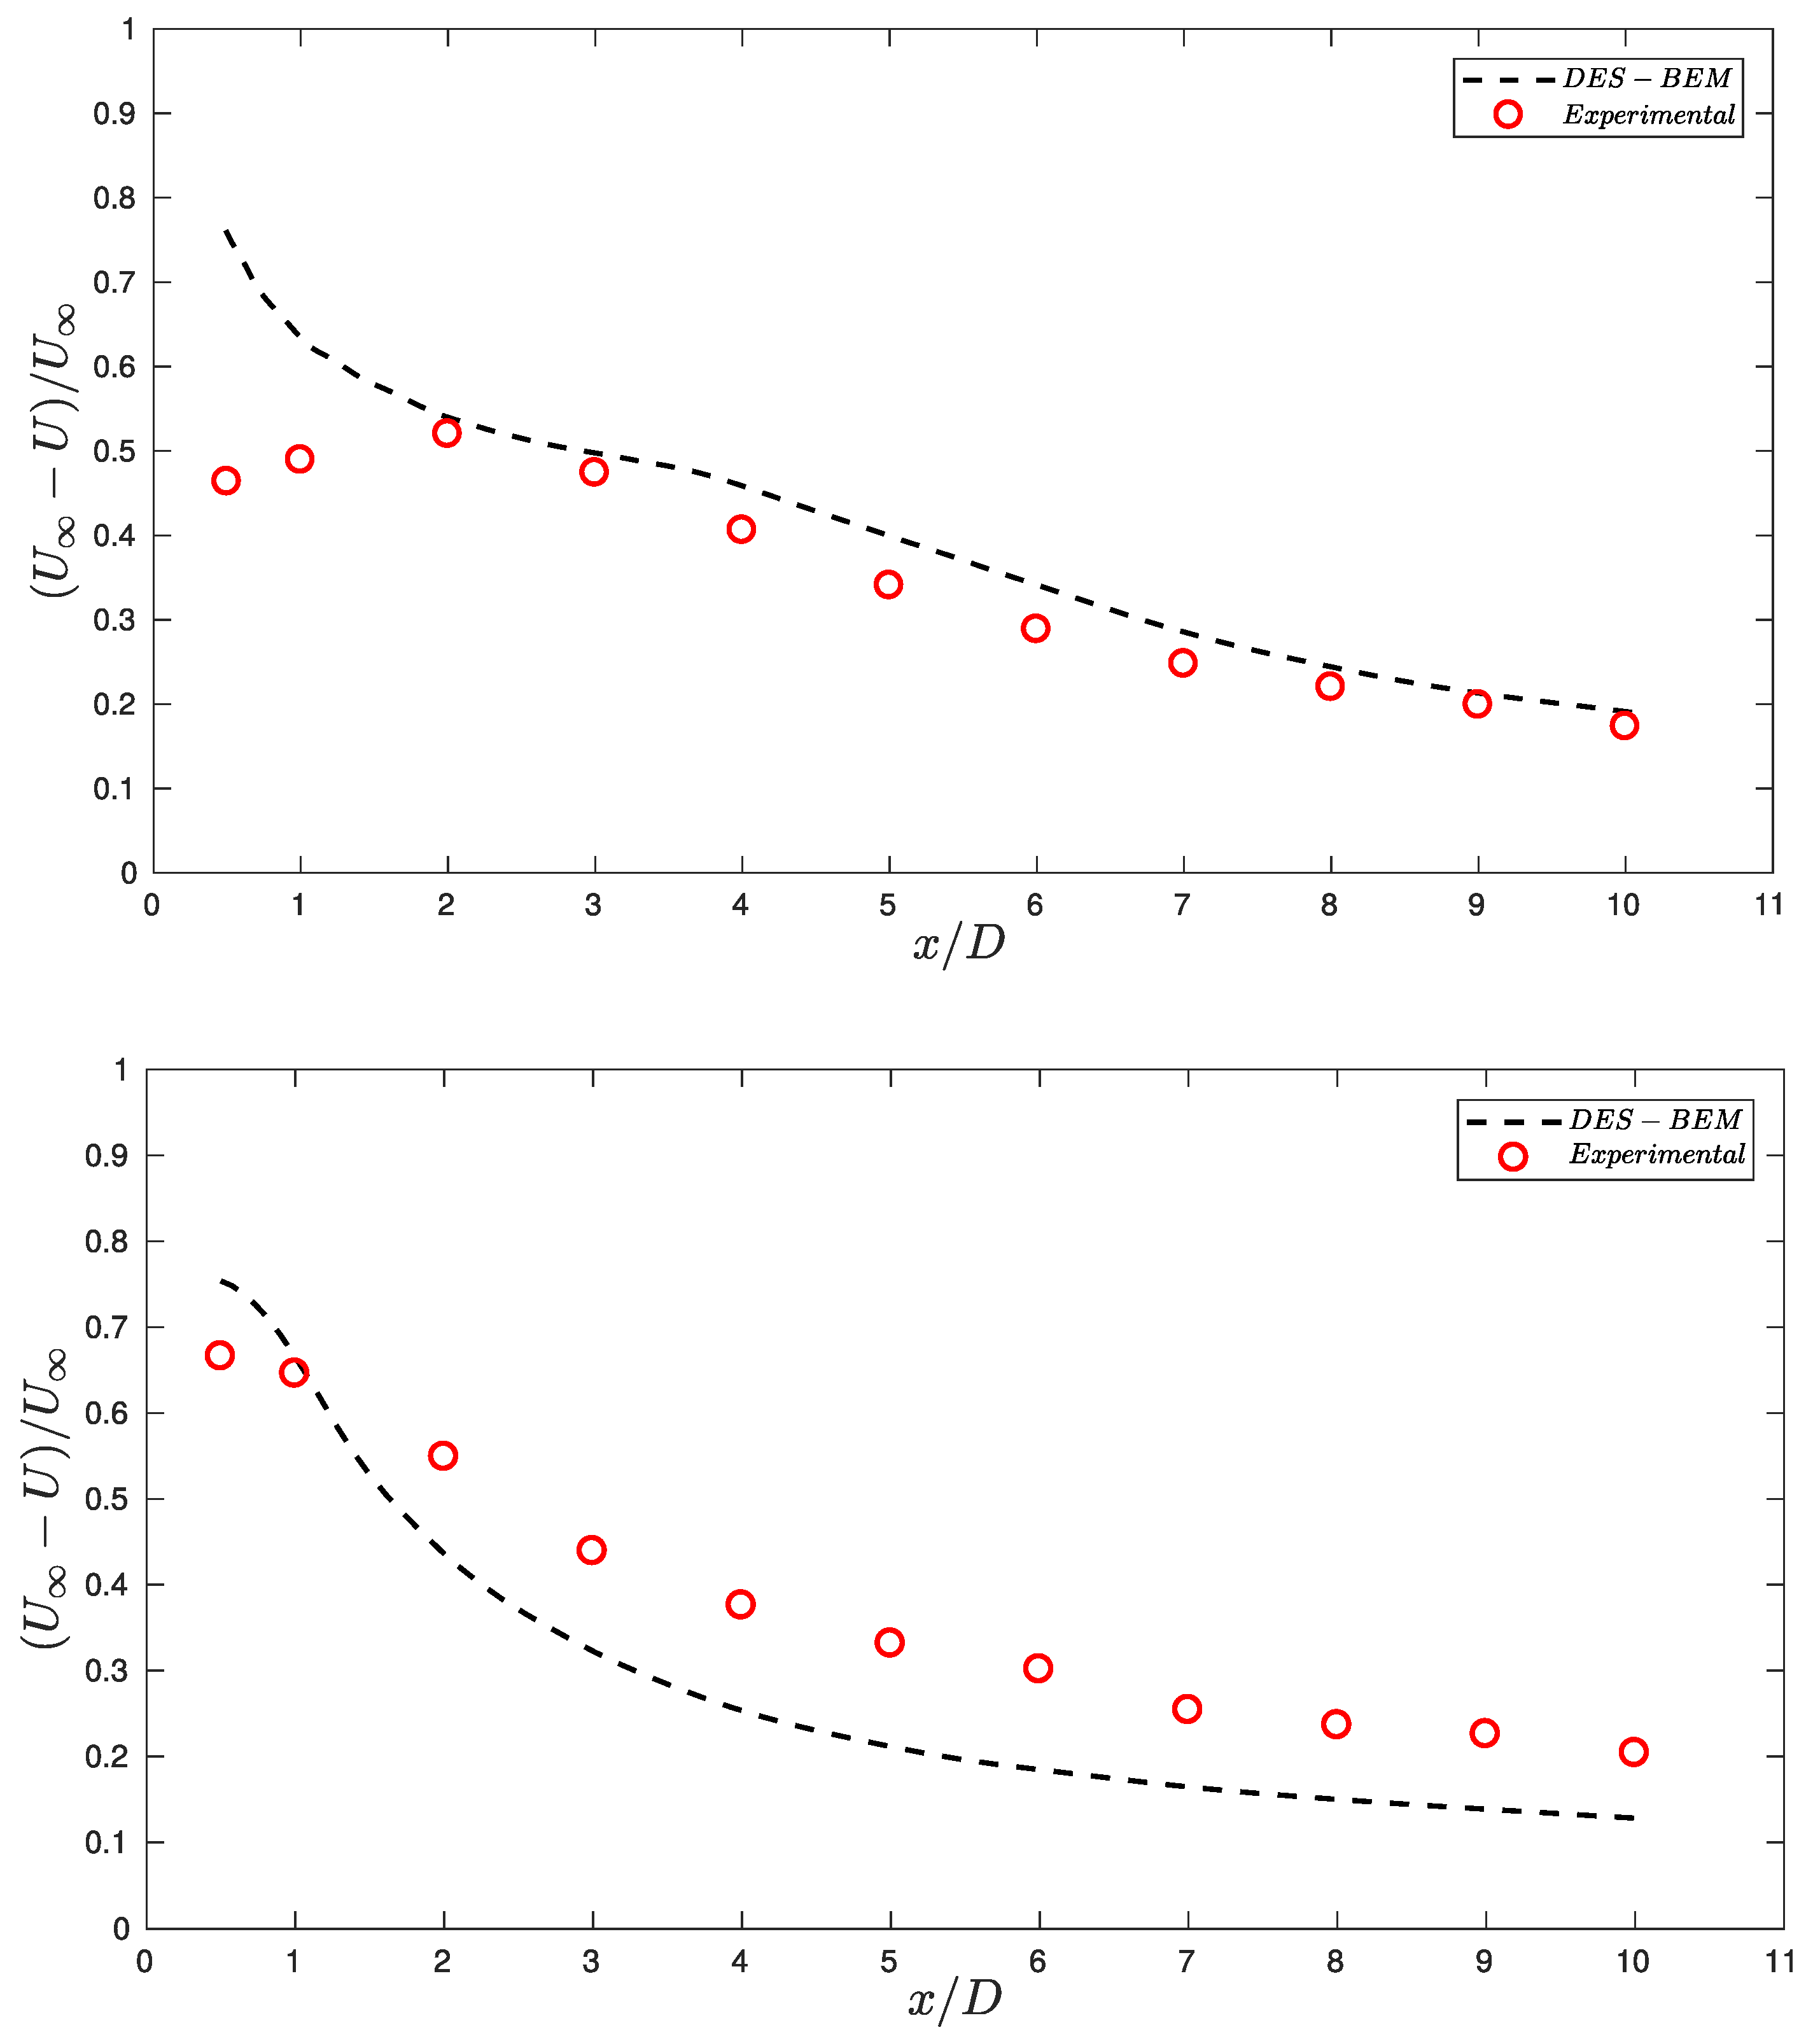
Figure 3 displays the downstream evolution of this variable for the first three downstream diameters.
For the ST case (see Figure 3a), the simulations showed a difference of 30% and 14.4% compared to the experimental values in the near field, i.e., two points located at 0.5D and 1D, respectively. This difference was due to the inability of the BEM approach to reproduce the near wake [39]. From a distance of three diameters downstream of the turbine, the values obtained showed an excellent agreement with the experimental measurements, even though we did not represent the hub, nacelle, or support structure in the BEM approach. The shape of this curve also coincided with results obtained in previous investigations [32,40].
For the TT case (Figure 3b), the simulations exhibited a larger discrepancy compared to the ST case. Even though the deficit differences within the first two diameters were smaller, the wake-recovery showed a discrepancy with the experimental values of approximately 5% on average. The model overestimated the deficit after 1D downstream, and the curve slope in the far wake showed a convergent trend downstream. Upstream obstacles can significantly change the characteristics of the turbine wake [10]; we thus speculated that the first turbine wake, defining the incoming flow felt by the downstream unit, was also responsible for altering the wake of the downstream unit. Since the turbine supporting structures were not resolved in the simulation, we believe that the the turbine-turbine case was more prone to display numerical-experimental discrepancies
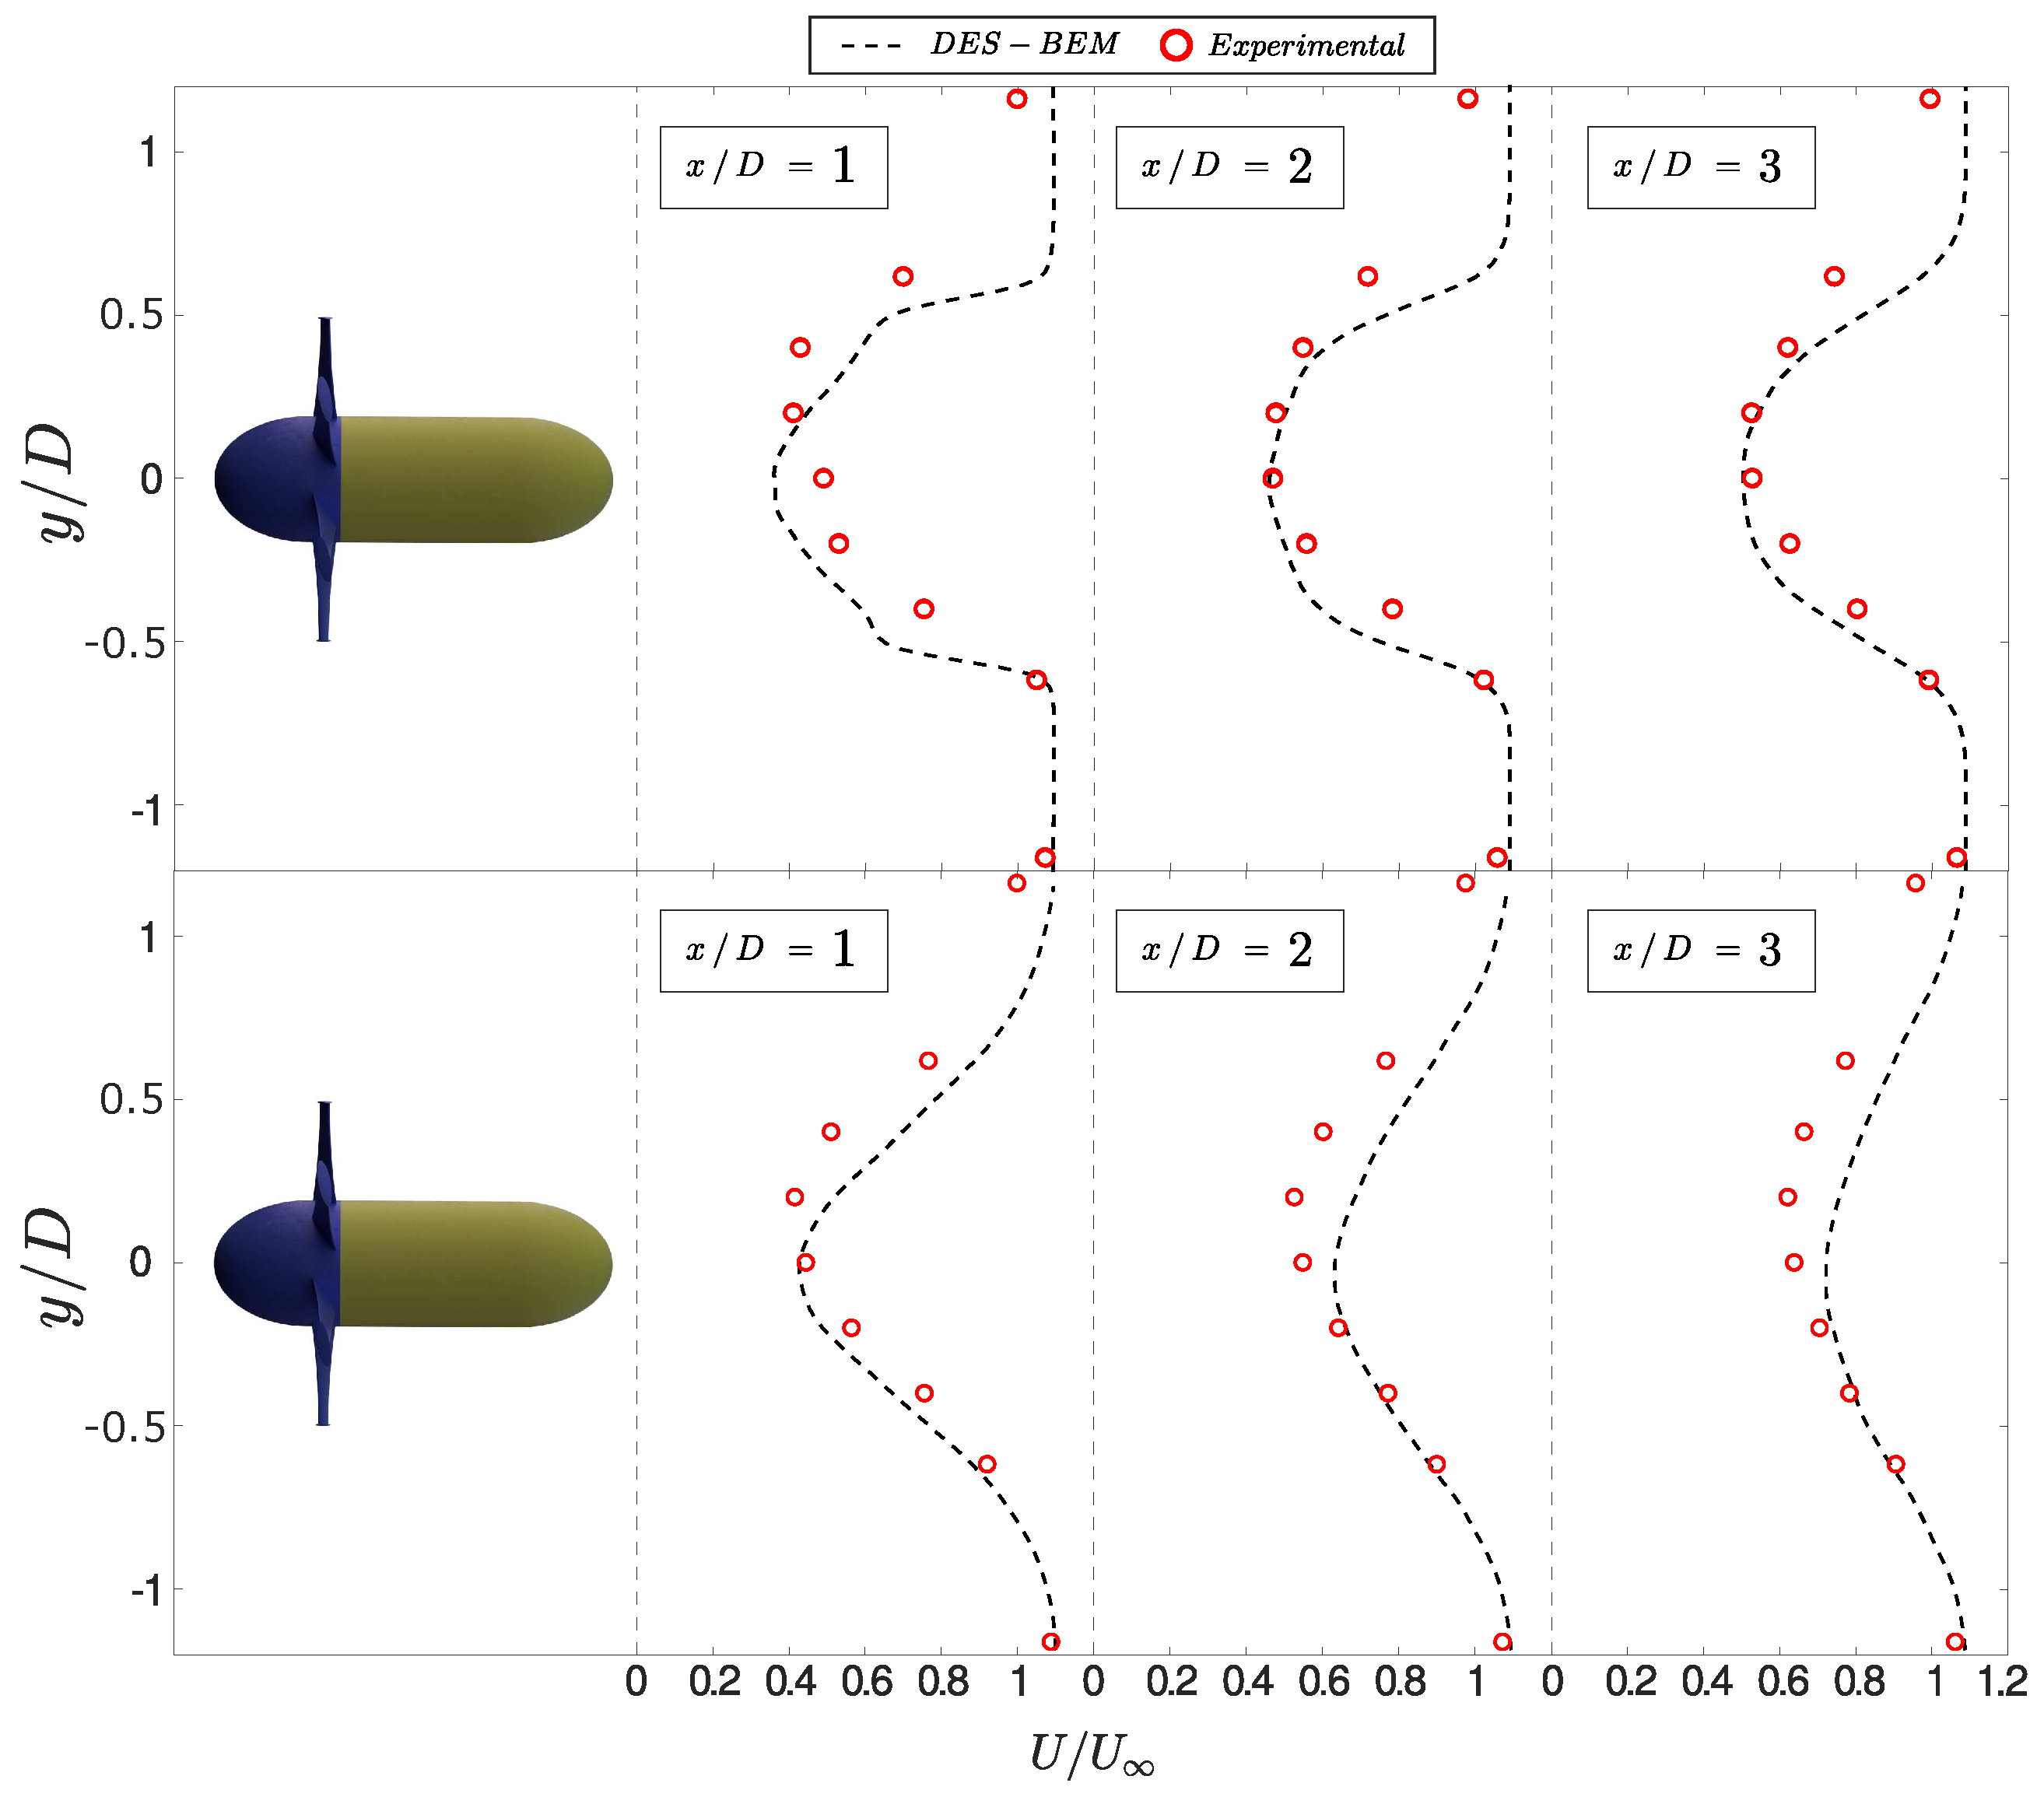
Spanwise profiles of the mean streamwise velocity ( U ( y ) ) downstream of the primary (downstream) turbine are shown in Figure 4 for both cases. The ST case showed a completely symmetrical wake, as reported in simulations with the BEM method [41,42]. At a distance of 1D downstream, the transition between the inner and outer wake showed an abrupt change on the longitudinal velocity, which indicated a low momentum transfer capacity between these two zones. For x / D = 2 and 3, the transition became smoother, showing a stronger interaction between the wake and its surrounding flow. The results obtained showed a good agreement between the DES-BEM model and experimental results. However, the model was not able to reproduce the wake asymmetry present in the velocity profile, likely associated with the hub vortex structure. We observed similar results in the TT case. The simulated streamwise velocities were consistent with the experimental measurements, but the wake asymmetry was not captured. The increase on turbulent intensity in the incoming flow of the primary turbine, now located in the wake of the secondary turbine, enhanced the momentum transfer in the wake and induced a less noticeable transition between the inner and outer rotor areas.
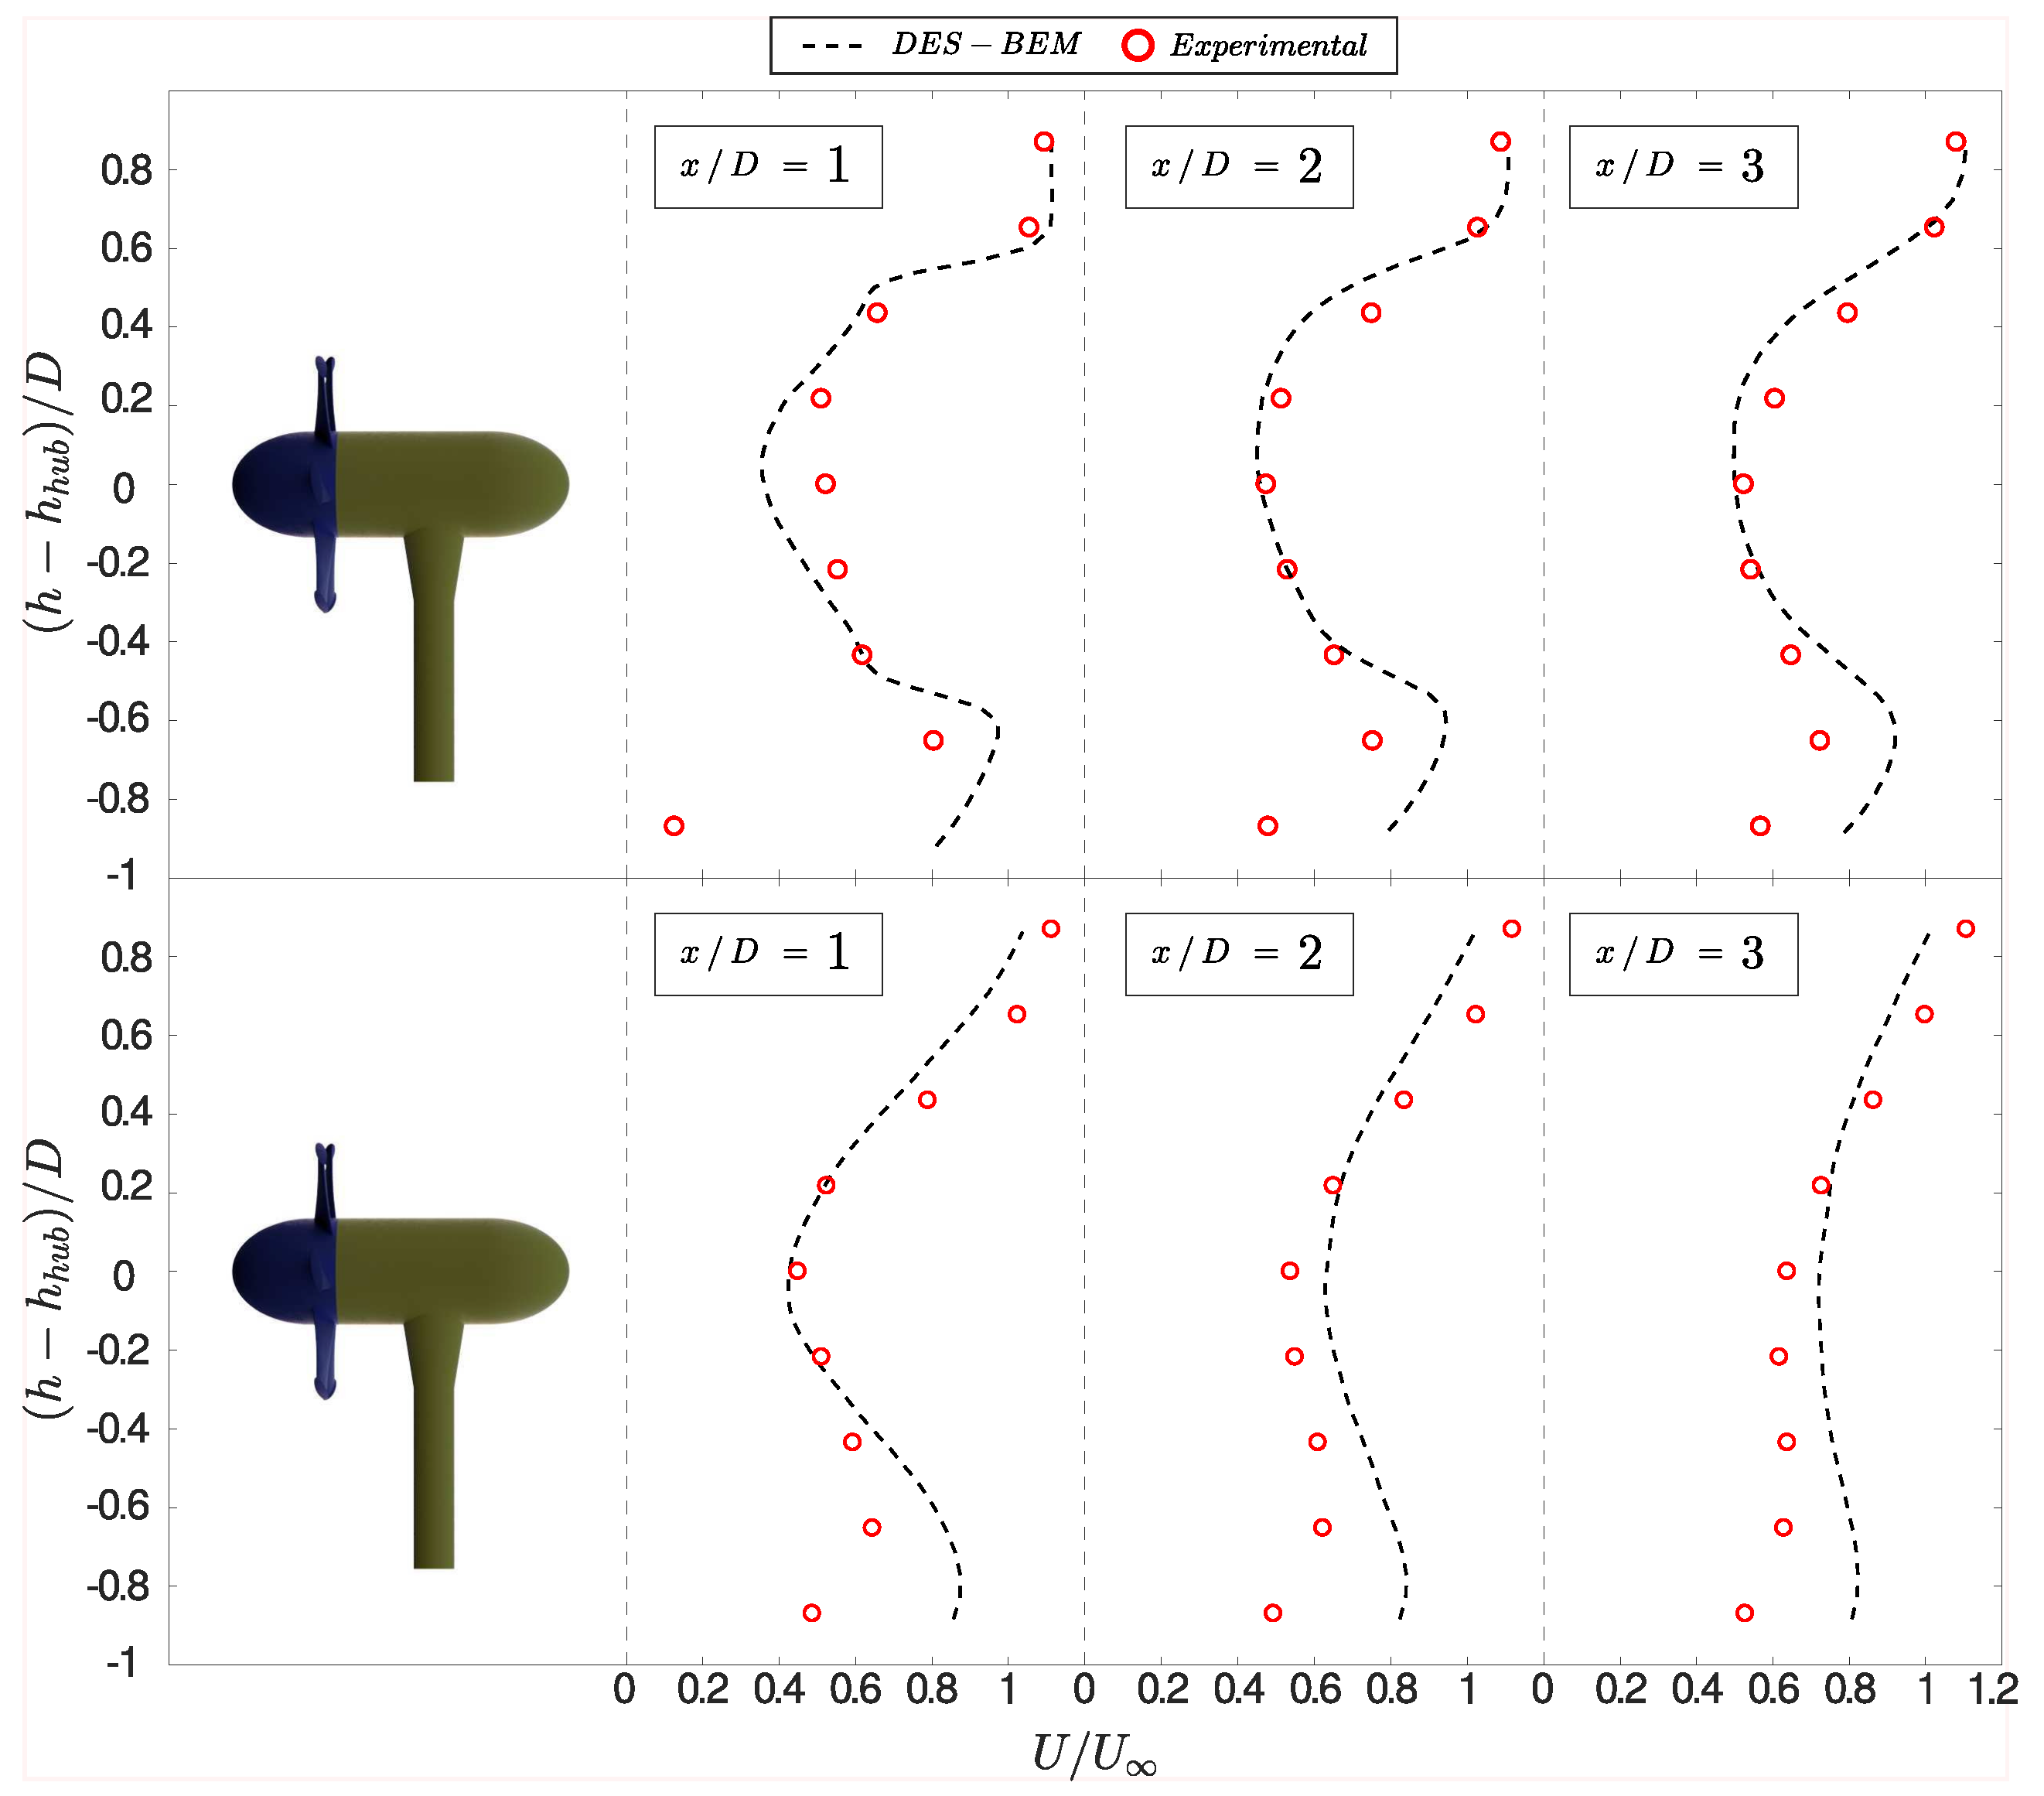
In Figure 5, the vertical profiles of the mean streamwise velocity manifested a significant influence of the support structure. As observed in the transverse profiles for x / D = 1 –3, the transition between inner and outer rotor regions was abrupt. Within the a distance of one diameter from the turbine, the simulations showed a symmetric wake, and further downstream, the wake gradually lost symmetry due to the bed effects, causing an acceleration of the flow in the upper area of the turbine and lower velocities near the bottom. As can be anticipated, our model could not capture the effects of the support structure, in particular the ballast located at the turbine rear zone, whose axis was coincident with the measurement plane. The effect of this structure can be seen to decrease gradually as x / D increased. As shown in Figure 4, the larger turbulent intensity in the flow facing the primary turbine caused a milder transition of the wake between the inner and outer rotor area in the TT case, as compared to the ST case. This is also observed in the vertical profiles of Figure 5, where the influence of the support structure rear the ballast contributed to homogenizing the streamwise velocity distribution towards the bed and reducing the signature of the rotor.
In order to visualize the instantaneous dynamics of the three-dimensional coherent structures, we employed the so-called q criterion [43], where q is defined as:
q = 1 2 Ω 2 S 2
where · is the Euclidean matrix norm and Ω and S are the anti-symmetric and symmetric parts of the velocity gradient tensor. It assumes that regions where the magnitude of rotation is larger than the rate-of-strain (i.e., q > 0 ) are occupied by vortical structures [43].
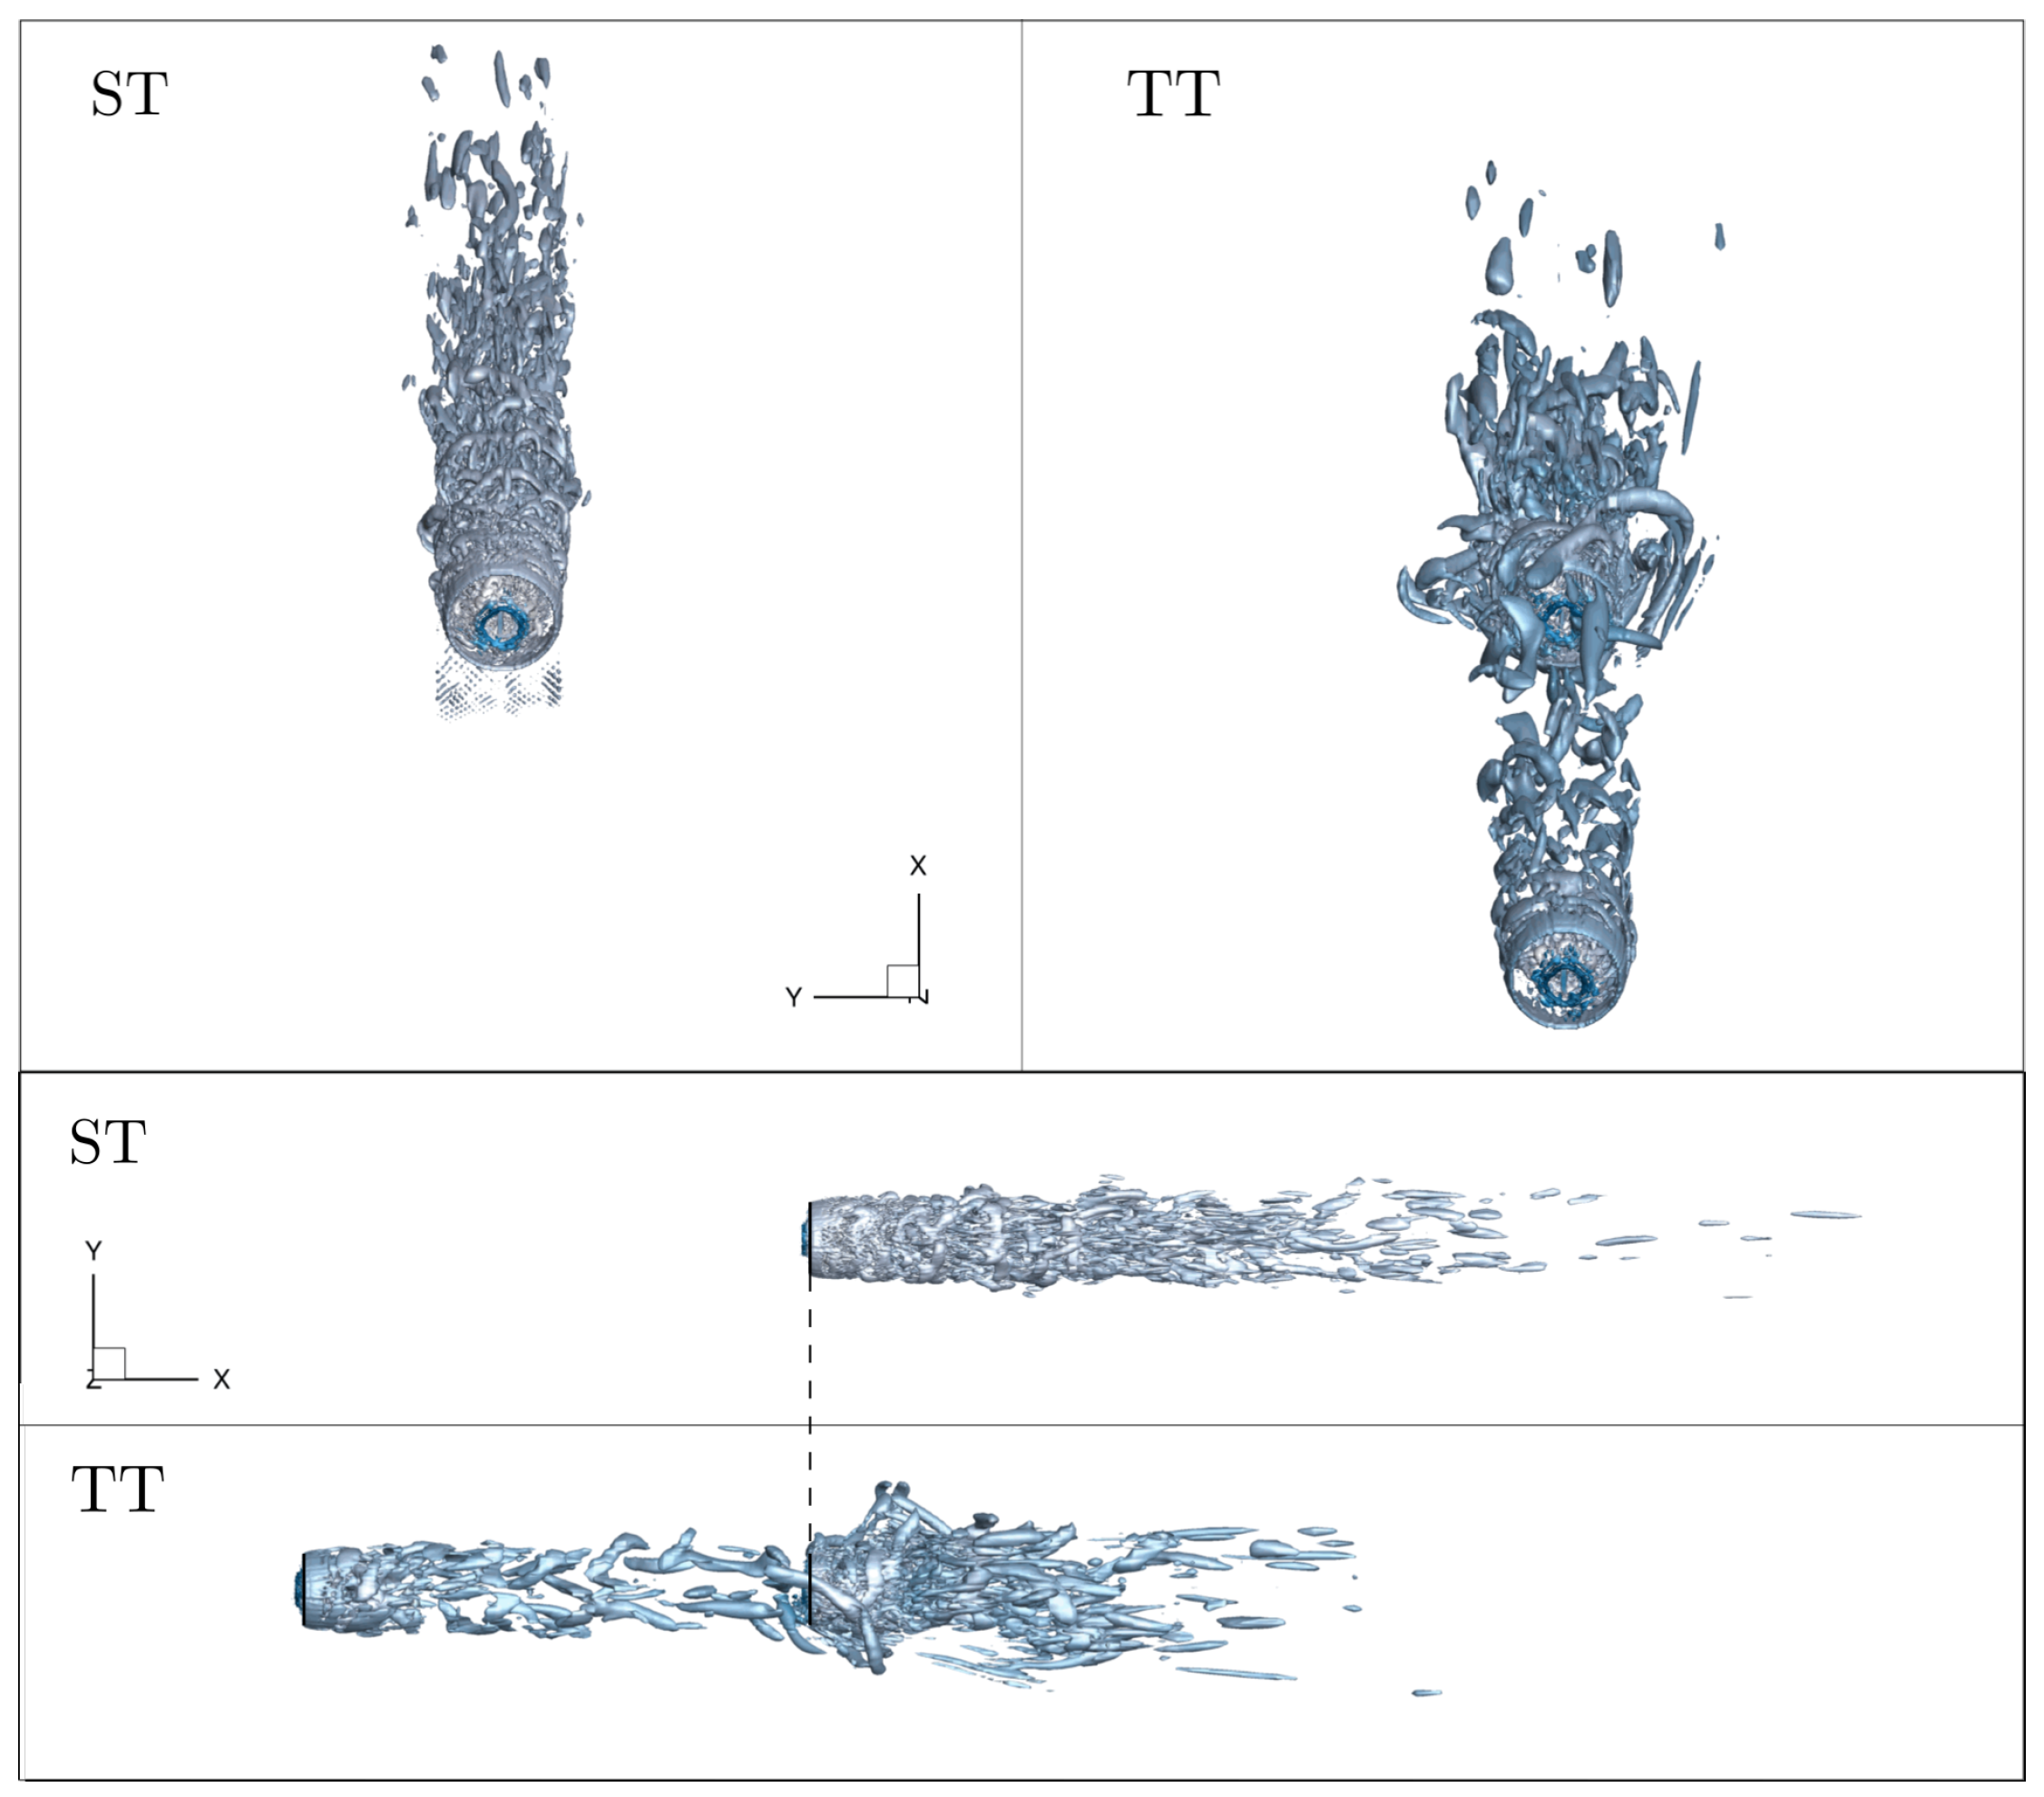
Figure 6 shows instantaneous q iso-surfaces in the wakes, for the ST and TT simulations. The BEM approach generated annular vortices that emerged periodically from the spatially-averaged blade tips and propagated downstream, interacting with the flow and favoring momentum exchange, which eventually contributed to the wake expansion downstream. The nacelle was represented as a section of zero velocity and high pressure at the rotor center, from which periodic vortical structures were also generated downstream and interacted with the annular vortices produced by the blade tips in the external part of the disks.
Comparing the instantaneous analysis of the coherent structures produced by the downstream turbine in both cases, we saw a shorter wake in the TT case that coincided with the mean velocity field of Figure 3, Figure 4 and Figure 5. As reported by Blackmore et al. [44], the wake length was smaller when there was a structure that increased the turbulent intensity upstream of the MHK device, since it favored turbulent momentum transport that made the longitudinal velocity recover at a shorter distance.
The results presented in this section for the mean and instantaneous flow field yielded quantitative information of the turbine-flow interactions and wake development and merging. Our model by itself was not capable of reproducing the wake asymmetry and other flow characteristics in the near field, due to BEM approach simplifications. At a distance of 3D, the DES-BEM was a reliable tool that could be used to study wake interactions, even for this turbine geometry with shorter blades and large hub and nacelle. Scale model experiments performed in the laboratory could provide information that complements the data obtained from the DES-BEM model. Both techniques were necessary to understand fully the wake dynamics of turbine arrays and to be able to apply these results for design purposes.

3.2. Turbine Performance

To characterize the turbine performance, we used the power C P and thrust coefficients C T 
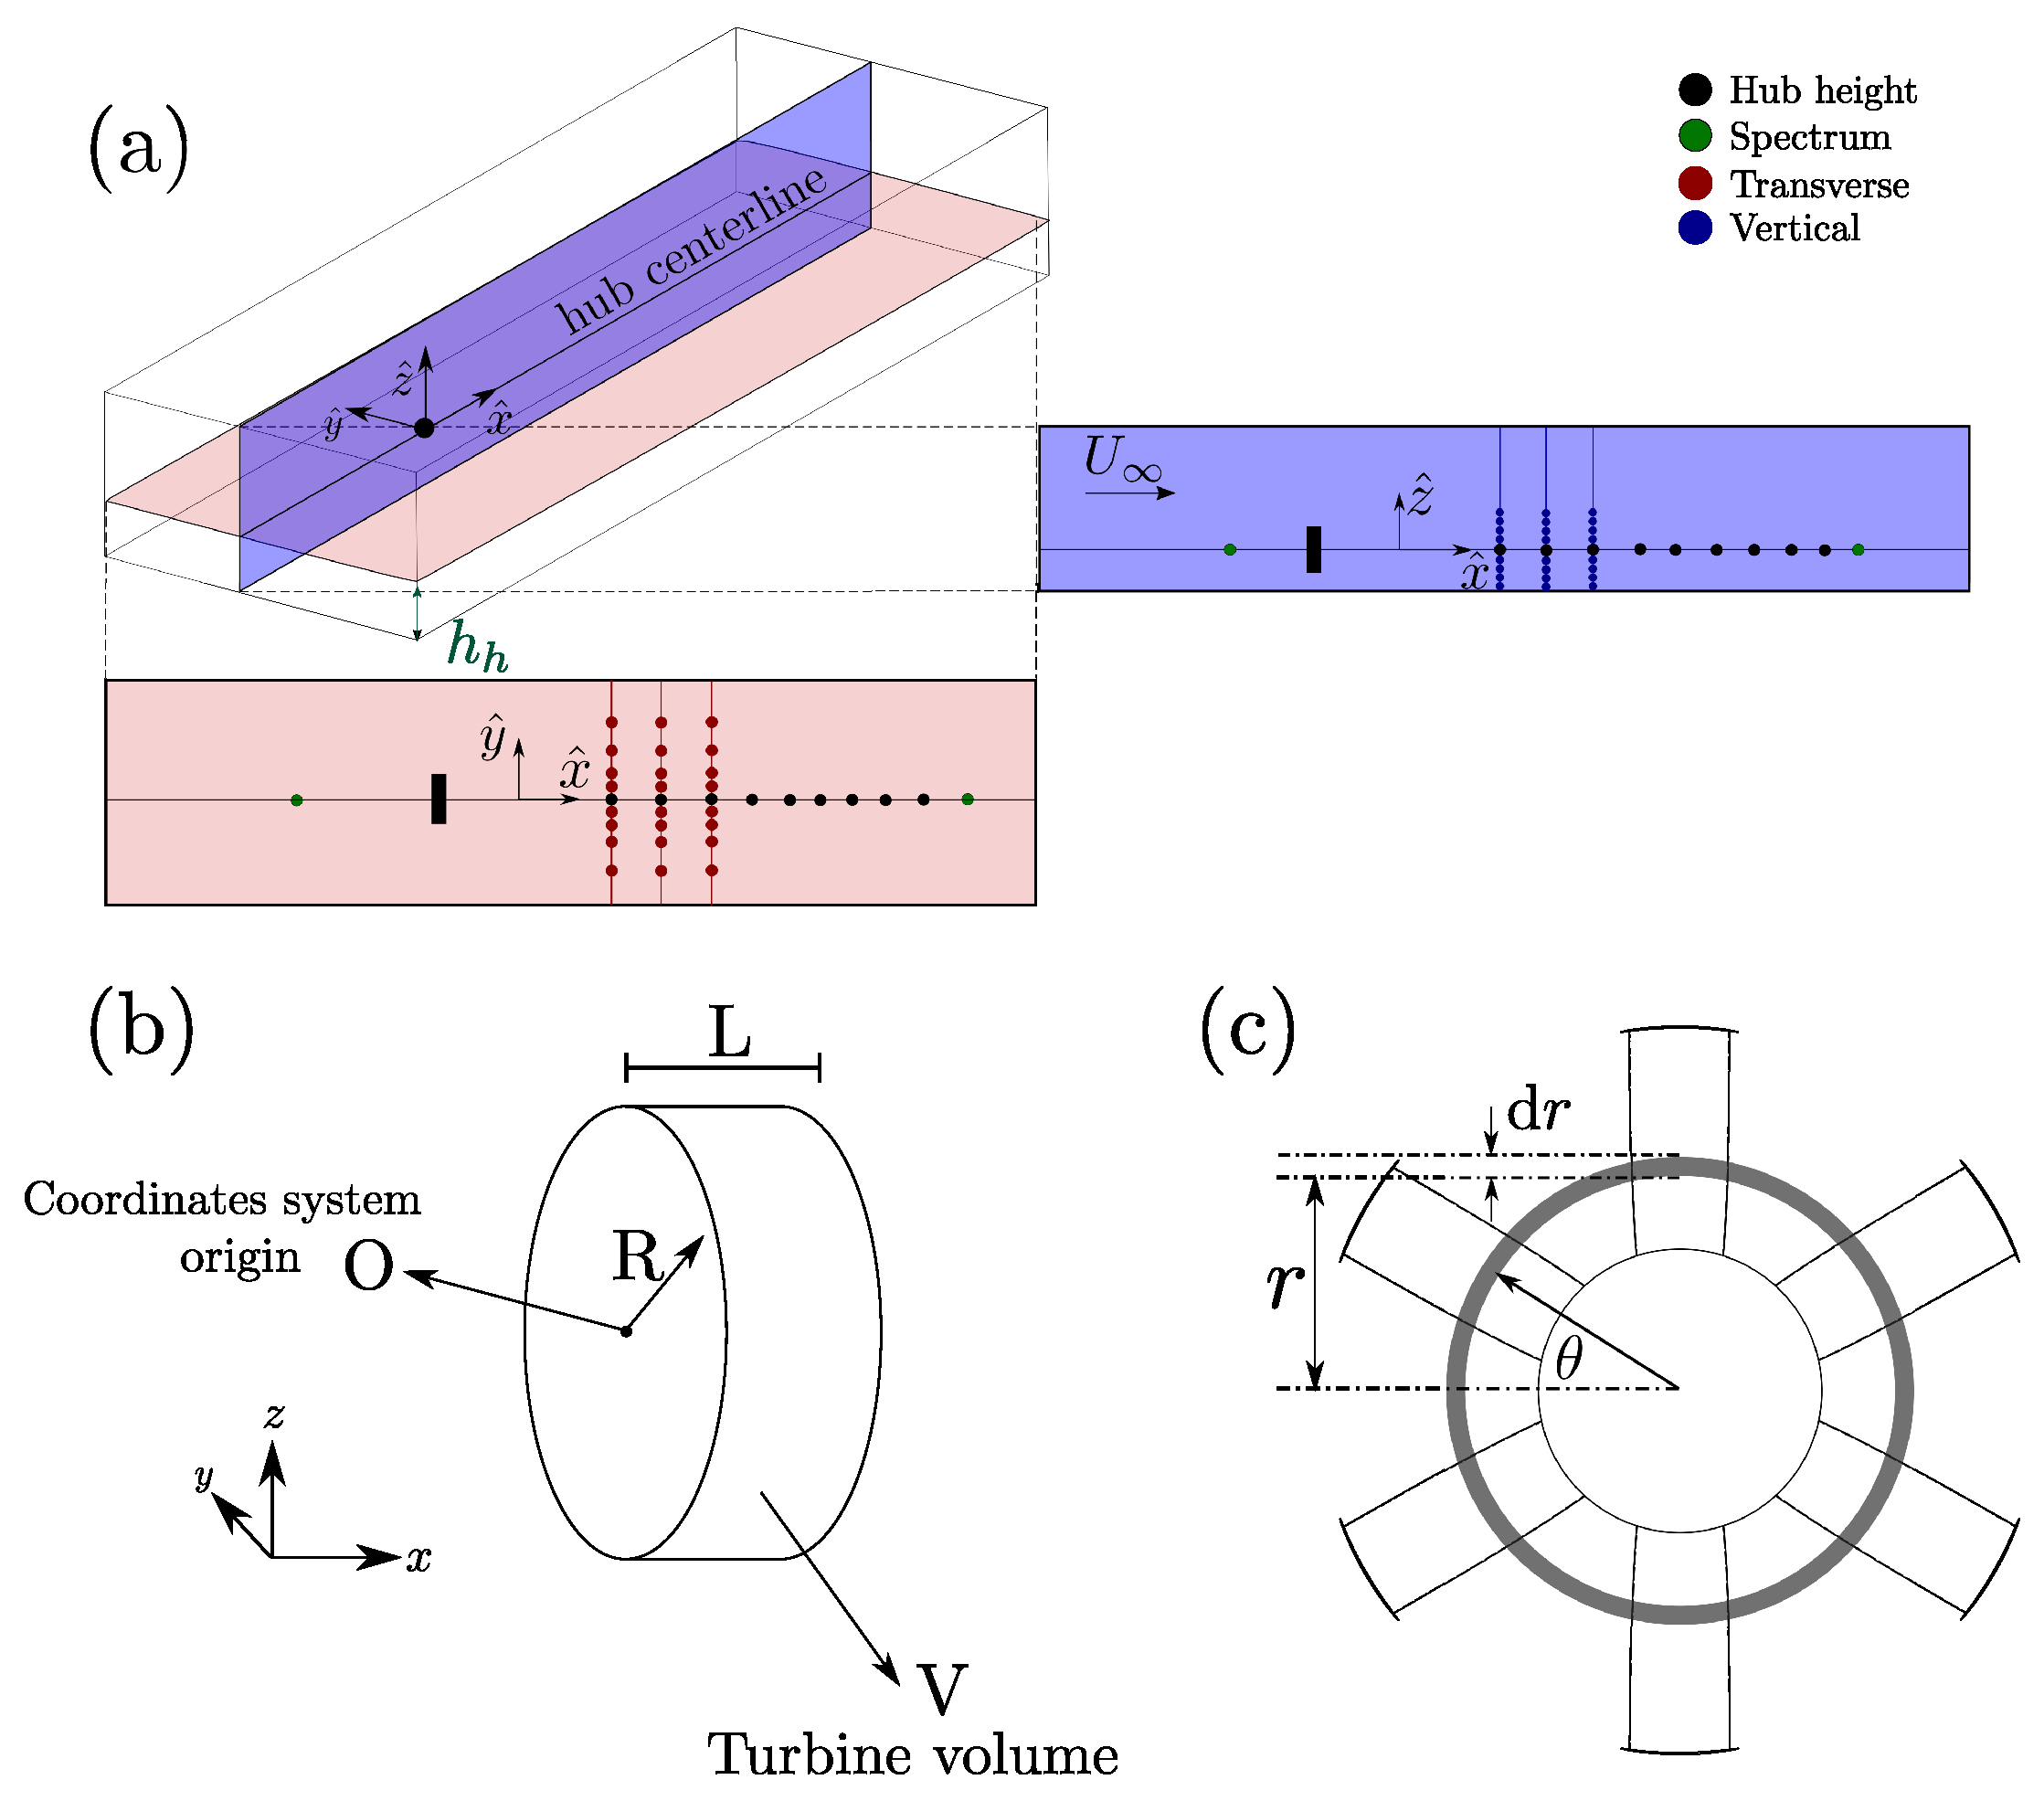
to compare the devices installed at different locations in the channel. The power coefficient was defined as the ratio between power extracted from the flow by the turbine blades and the theoretical maximum power available in the upstream flow. This non-dimensional parameter is defined as follows:
C P = P 0 . 5 ρ U 3 A d
where U is the free stream velocity upstream of the devices, A d is the frontal area swept by the blades, and P is the power obtained by integrating the contribution of every node inside the turbine volume V:
P = V Ω r F a z i m d V
where Ω is the turbine rotational velocity and F a z i m is the azimuthal component of the force acting on each blade.
The thrust coefficient is defined as the ratio between the axial force acting over the turbine in flow direction, and the kinetic energy of the upstream flow field, such that:
C T = T 0 . 5 ρ U 2 A d
where the total thrust on the turbine, T, is obtained using the same procedure described for P:
T = V F x d V
where F x is the longitudinal force component acting on the turbine blades.
The power coefficient for the ST case was equal to C P = 0.28 ; meanwhile, for the TT case, it reduced by almost by half ( C P = 0.15 ). This decay in turbine performance was the effect of the secondary turbine installed upstream, which caused a reduction of 20% of the mean streamwise velocity upstream of the primary turbine. This effect was a consequence of the spacing (6D) and alignment of the MHK devices, which did not allow a complete wake recovery. To characterize the turbine performance variability, we computed the coefficient of variation C V , a standardized measure of data series dispersion calculated as the ratio between the standard deviation σ and the mean μ of each parameter. For the TT case, the coefficient of variation of C P was five-times larger, as compared with the ST case. The thrust coefficient C T is an indicator of the total thrust force that the turbine will experience under operation conditions. For the ST case, the mean C T was equal to 0.47, which decreased to 0.32 for the TT case, showing a total decrease of 33%. The coefficient of variation C V in this case increased by almost six times between the study cases. Note that the standard deviation of both turbine operating parameters C P and C T was estimated using the time history of the instantaneous values of the force and mechanical power provided by the simulation.
The increasing turbulent fluctuations upstream of the primary turbine in the TT case not only decreased the average performance, but also increased the variability of both coefficients, C P and C T . This variability is an important outcome that must be taken into account when planning array layouts of MHK turbines. The parameter C P should be considered for the connection to the electric grid, while C T is relevant for unsteady loads on the turbine components and possible blade material fatigue that might affect the lifespan of turbines.
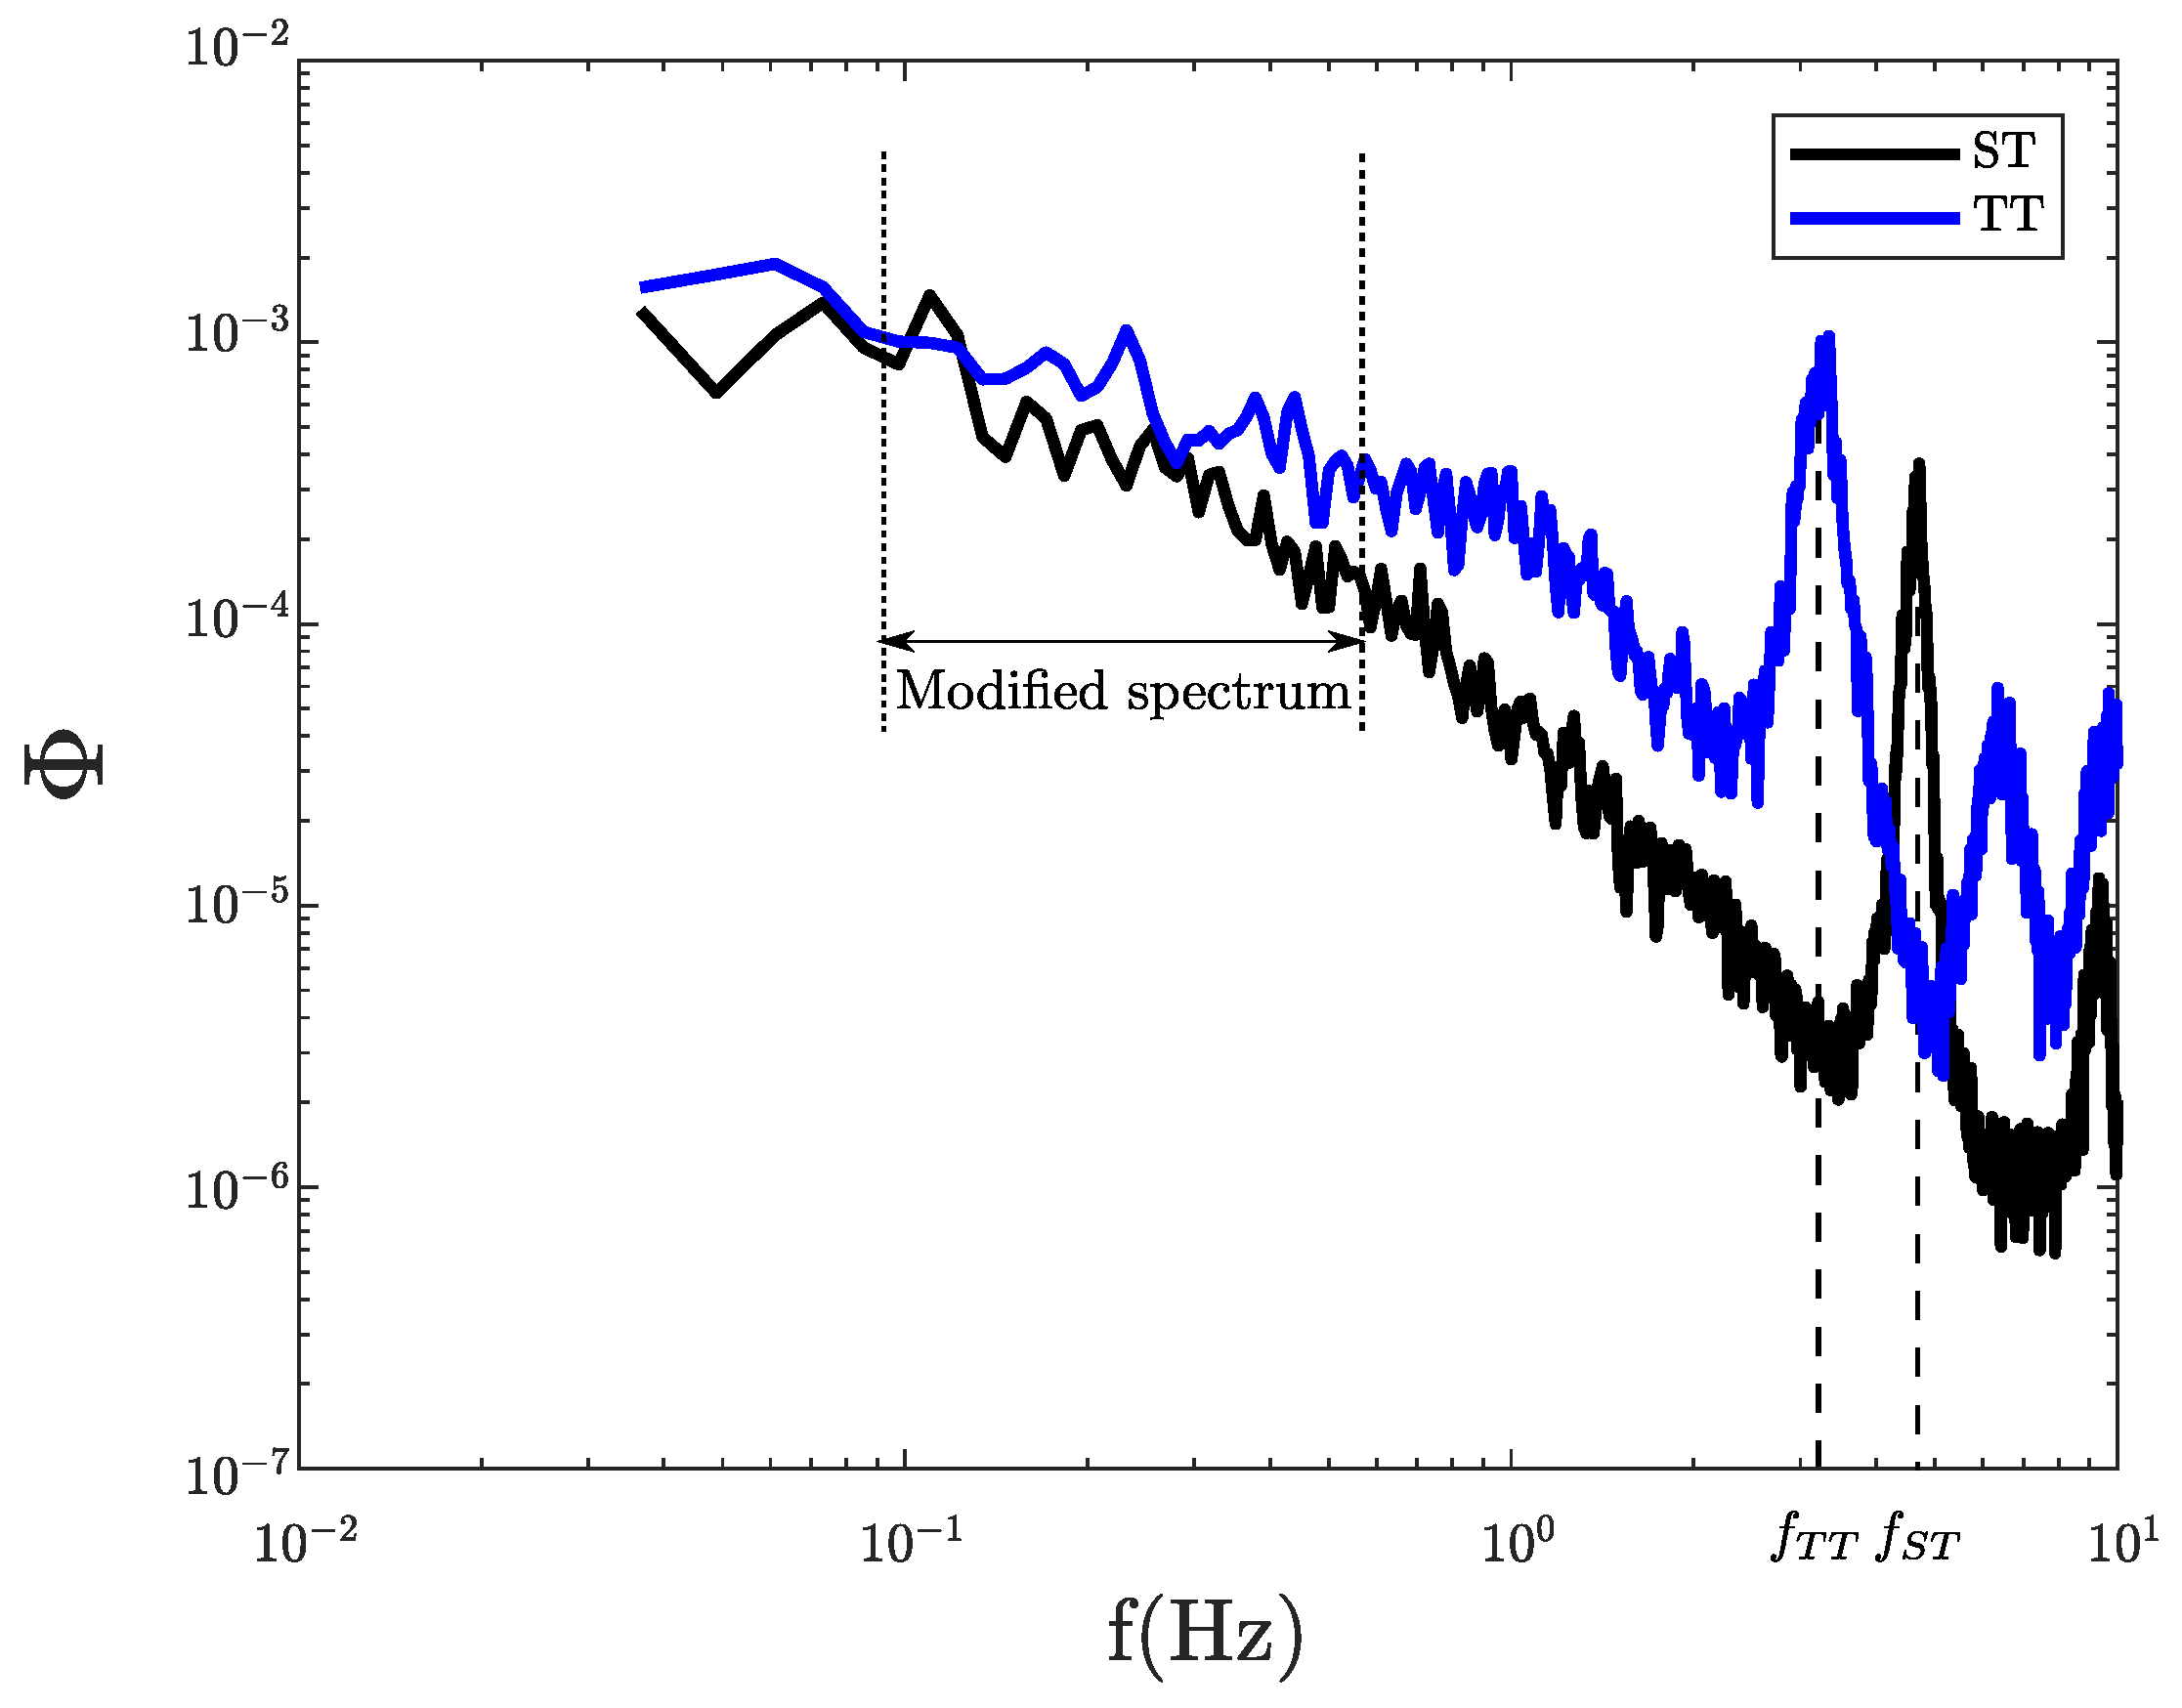
The spectra of instantaneous voltage measurements provided additional insights into the turbine operating characteristics. Even though the voltage obtained in our experiments was not properly scaled to prototype conditions, voltage spectrum fluctuations were used as a proxy to understand how MHK devices would respond to different flow conditions (see [17] for details). From our experiments, we calculated the voltage spectra of the measurements obtained from the primary turbine for both cases, as shown in Figure 7. The first peak of both curves coincided with the corresponding turbine frequency ( f S T , f T T ), showing additional harmonic peaks. At lower frequencies, there were consistent differences between the spectra, which were explained by the influence of the upstream flow field of the secondary turbine, which were not perceived at higher frequencies [9].
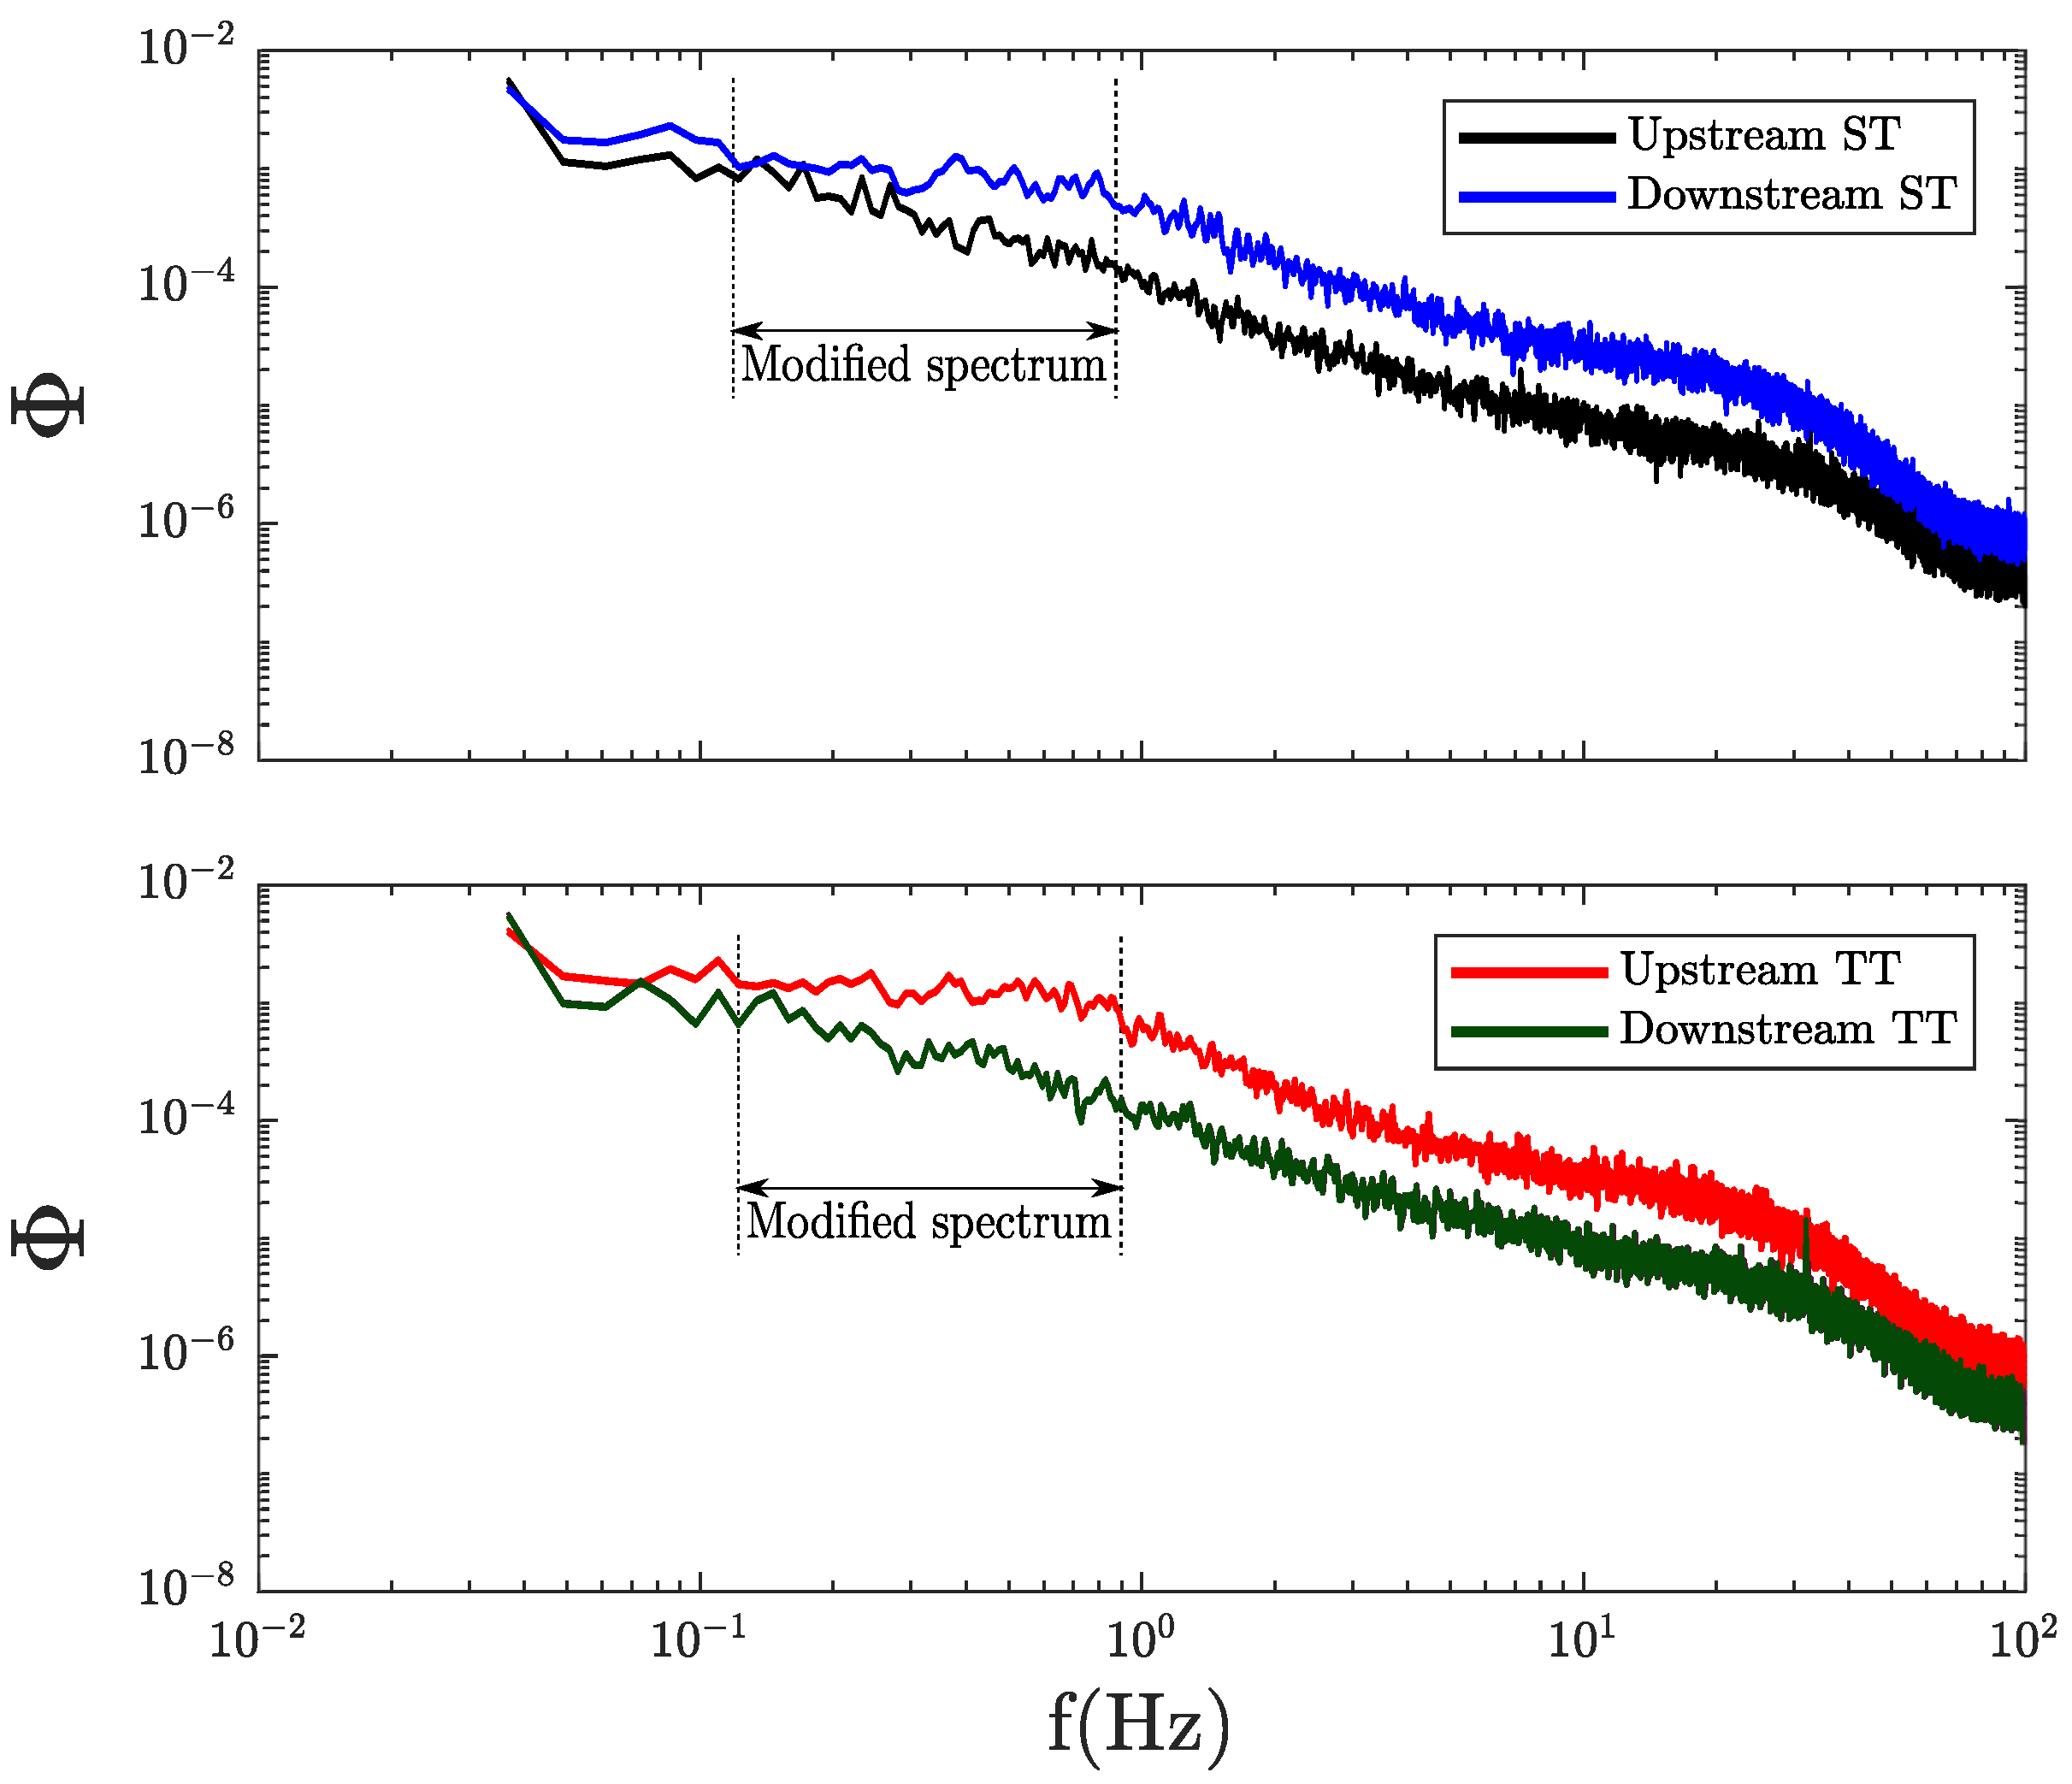
To characterize the turbine influence on the flow hydrodynamics, we calculated the longitudinal velocity spectra showed in Figure 8 for a point located upstream of both turbines and a second point located at a distance of 10 D downstream of the primary turbine, both at the hub height and at the flume centerline. We observed that at lower frequencies, there were significant changes between the upstream and downstream spectra, highlighting the influence of the upstream turbine on the low frequency region, consistent with the voltage spectrum. For both cases, the areas under the plot are larger for the downstream point, which suggests a greater performance variability for the TT case, as expected.

3.3. Turbine–Bathymetry Interactions

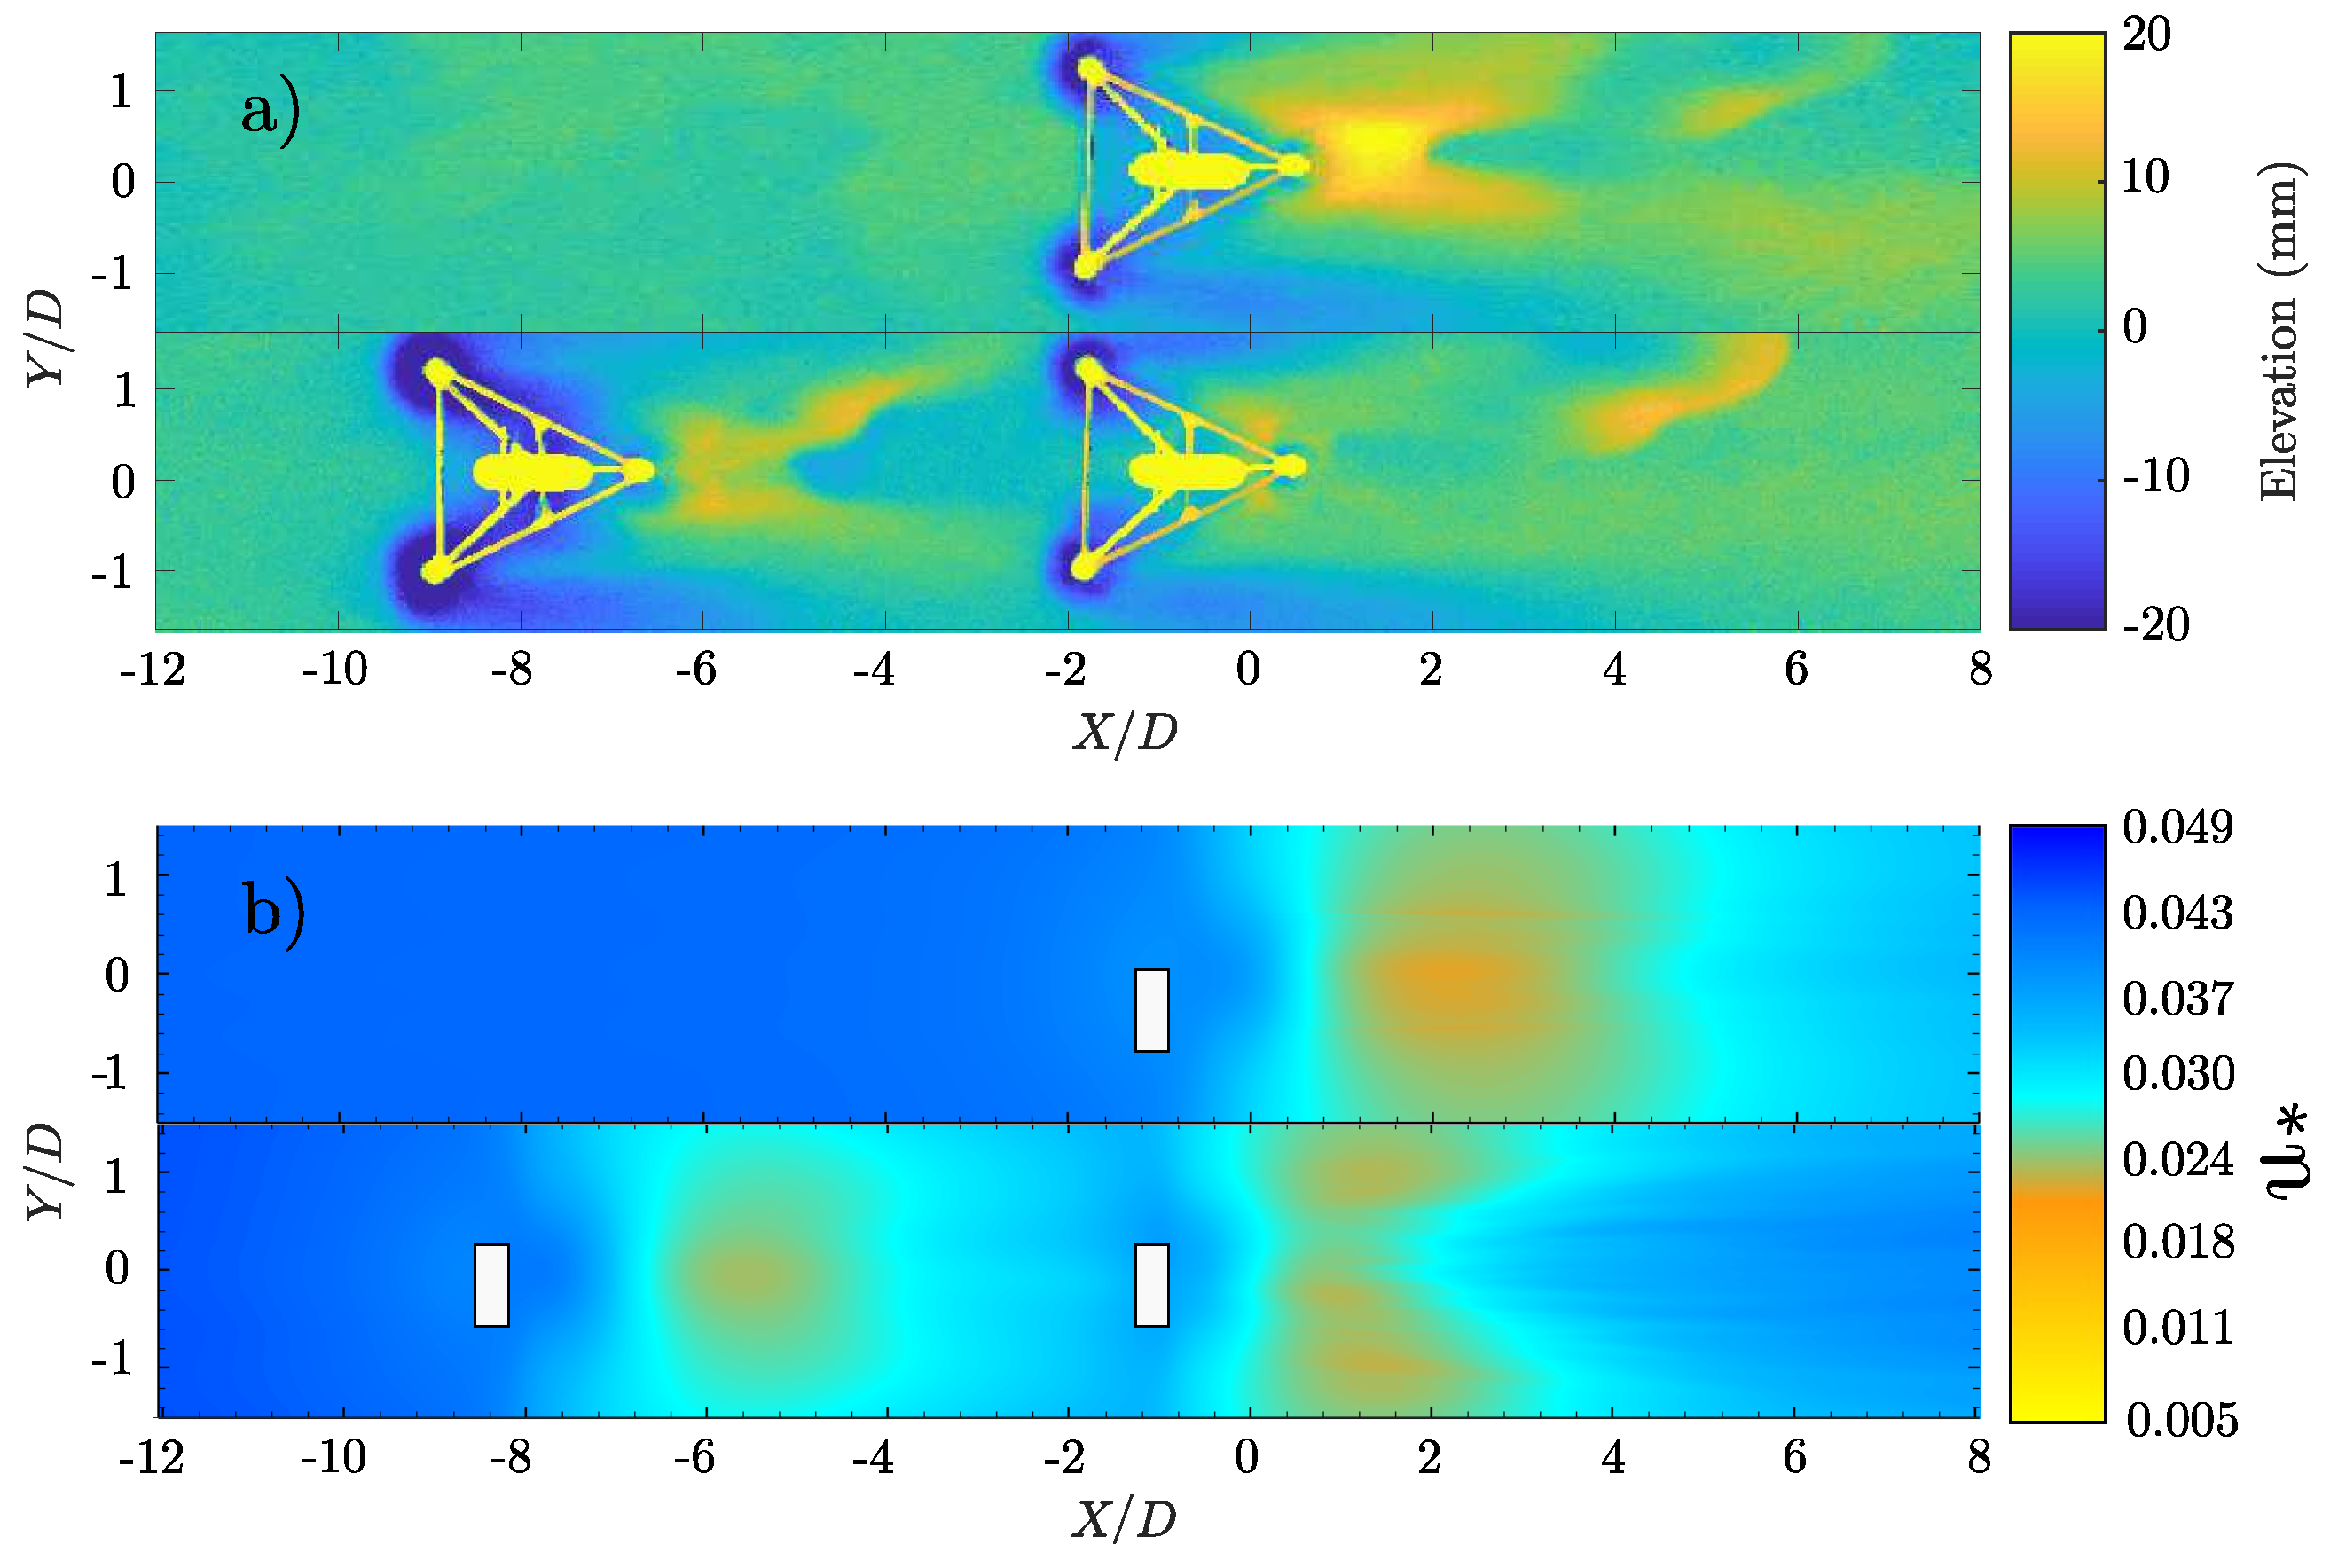
With the experiments performed in clear water conditions, sand particles at the river bed were in critical equilibrium conditions, implying that any alteration in the shear stress distribution, e.g., due to the turbine wake or its supporting structure, would generate a localized scour and a consequent downstream deposit. In Figure 9a, we show the changes of bed elevation after the experiments with respect to the original horizontal bed level. The support structure contributed to scour, producing erosion right next to the ballasts, while downstream of the turbine, we observed a deposition region highlighting a recovered shear stress approaching again critical conditions. This deposition was less evident downstream of the primary turbine for the TT case, due to the smaller velocity deficit between devices (see Figure 3) and thus a smaller localized erosion. From 4–6 diameters of distance downstream from the turbine, there was a clear deposition zone over the left bank, which coincided with the asymmetry observed in the transverse longitudinal velocity profile shown in Figure 4. This phenomena, not reproduced by the DES-BEM simulations, might be caused by the turbine geometry that was not represented in the model, i.e., hub and support structure.
If we compared the primary turbine wake in the ST case and the secondary turbine wake in the TT case, both facing an undisturbed flow with a streamwise bulk velocity equal to U , we still observed differences in the maximum deposition height. The cause of these differences were not entirely clear, though several possible mechanisms might be responsible: (1) the presence of another turbine located downstream produced an effect on the flow dynamics of the upstream turbine wake that changed the deposition patterns; (2) the TSR difference between both turbines (3.65 for ST and 2.0 for TT) dampened the wake flow–bathymetry interactions. These effects could be observed in the simulation, specifically in the contours of the shear velocity showing a reduced u * for the TT case downstream of the secondary turbine, in comparison with the corresponding region of the ST primary device. Note that reduced shear stress in the scour region provided a weaker mass flux and overall less particles to deposit downstream.
The shear stress, represented by the spatial distribution of u * , is shown in Figure 9b. The magnitude of the time-averaged shear velocity indicated a portion of the bed where scouring or deposition was favored. In the ST simulations, we observed a low u * zone between 1D and 4D downstream of the primary turbine, which coincided with the experimental results. However, the shape of this zone differed from measurements, since the V-shaped deposition observed in the experiments downstream of the turbines was not present in the patterns of u * , due to the absence of the support structure in the model. For the TT case, between the rotor and x / D = 3 , the results were similar.
The results obtained from the simulations suggested that some characteristics of the turbine interaction could be represented by DES-BEM model, while the bed elevation asymmetry in the wake, coincident with the skewed location of the maximum velocity deficit shown in Figure 4, suggested including the support structure in the simulation to better capture the effects of the turbine on the bathymetry.

4. Conclusions

In this investigation, we studied the D10 Sabella turbine using laboratory experiments and numerical simulations to characterize the flow dynamics in the wake produced by the turbine, the power performance, and the turbine–bathymetry interaction for two different cases in clear water conditions: a single turbine and two turbines aligned and separated by six diameters of distance. Simulations were performed using a DES-BEM model implemented by Gajardo et al. [30].
The comparison of the simulation results with the experimental data showed that our model was capable of reproducing the mean values of streamwise velocity and the dynamic characteristics of the turbulent wakes using moderate computational resources. This simplified approach has the potential of analyzing large-scale arrays, as it has been tested for very different turbine geometries [30] and yielded acceptable agreement with experimental observations.
The near wake zone, however, had a larger influence of the hub, the support structure, and the nacelle. The model could not capture the asymmetry of the velocity profile and the emergence of tip vortices and wake meandering. Depending on the research question, these factors might not be critically important, since turbines are typically located in arrays with separations significantly larger than the near wake zone ( x / D < 3 ), in this particular case, corresponding to a wake velocity deficit of about 50%.
The flow complexity in front of the turbine, when it was located in the wake of another device, grew proportionally with the turbulent intensity [13,45] and was reflected in the variability of the turbine performance. The turbine rotational frequency dependence on the incoming flow characteristics was evident in the voltage spectra and in the spectra of the incoming velocity, for both deployment cases.
The experiments also provided additional detailed information on the turbine–flow–bathymetry interaction. Our experimental results showed a relationship between the scouring and deposition of sediments and the dynamics of the wake, with the asymmetry observed in the velocity measurements reflected in the evolution of the channel bed in the wake zone. As wake characteristics can also depend on the geometrical characteristics of the turbine hub, the support structure, and the TSR, it is important to further explore systematically these parameters to identify their specific impact on the sediment transport dynamics.
Laboratory experiments coupled with numerical simulations are seen as a powerful combination to reach a deep understanding of how MHK turbines interact in arrays and with the local environment. Future work will include characterization of different turbine arrays aligned or staggered, controlling lateral and longitudinal separation, setting TSR to those indicated as design parameters, and using different turbine–flow orientations. Additional experimental techniques such as particle image velocimeter (PIV) will be employed to get synoptical views of the velocity field and analyze the different vortical structures produced in the wake. Mesh refinement studies and their effects on the C P and C T estimations were not considered here, as they will be part of future research. Finally, the implementation of other turbine representation strategies, such as actuator lines (AL), in the DES approach, will be explored to improve the representation of the near wake in future analyses.

Author Contributions

Conceptualization, C.E., C.G., M.M., and M.G.; data curation, C.G. and M.M.; formal analysis, C.E., C.G., M.M., and M.G.; funding acquisition, C.E.; investigation, C.E., C.G., M.M., and M.G.; methodology, C.E., C.G., M.M., and M.G.; project administration, C.E. and C.G.; resources, C.E. and M.G.; software, C.E. and C.G.; supervision, C.E., M.M., and M.G.; validation, C.E., C.G., M.M., and M.G.; visualization, C.G.; writing, original draft, C.E., C.G., M.M., and M.G.; writing, review and editing, C.E., C.G., M.M. and M.G.

Funding

This work was supported by Chile’s Marine Energy Research & Innovation Center (MERIC) CORFOproject 14CEI2-28228. The funders had no role in the design of the study; in the collection, analyses, or interpretation of data; in the writing of the manuscript; nor in the decision to publish the results.

Acknowledgments

Powered@NLHPC: This research was also supported by the supercomputing infrastructure of the NLHPC (ECM-02). We thank Sabella for the data of the D10 turbine provided for this investigation.

Conflicts of Interest

The authors declare no conflict of interest.

Abbreviations

The following abbreviations are used in this manuscript:
MHKmarine hydrokinetic
BEMblade element momentum
ADMactuator disk model
ALMactuator lines model
DESdetached-eddy simulation
HATThorizontal-axis tidal turbines
URANSunsteady Reynolds-averaged Navier–Stokes
DAQdata acquisition
TSRtip-speed ratio
STsingle turbine
TTtwo turbines

References

  1. Vazquez, A.; Iglesias, G. Device interactions in reducing the cost of tidal stream energy. Energy Convers. Manag. 2015, 97, 428–438. [Google Scholar] [CrossRef]
  2. Zhou, Z.; Benbouzid, M.; Charpentier, J.F.; Scuiller, F.; Tang, T. Developments in large marine current turbine technologies—A review. Renew. Sustain. Energy Rev. 2017, 71, 852–858. [Google Scholar] [CrossRef]
  3. Paboeuf, S.; Yen Kai Sun, P.; Macadré, L.M.; Malgorn, G.; Yen, P.; Sun, K.; Quimper, S.; Laura, F.; Macadré, M.; Malgorn, G. Power Performance Assessment of the Tidal Turbine Sabella D10 Following IEC62600-200; Volume 6: Ocean Space Utilization; Ocean Renewable Energy; ASME: New York, NY, USA, 2016; Volume 6, p. V006T09A007. [Google Scholar] [CrossRef]
  4. Nash, S.; Phoenix, A. A review of the current understanding of the hydro-environmental impacts of energy removal by tidal turbines. Renew. Sustain. Energy Rev. 2017, 80, 648–662. [Google Scholar] [CrossRef]
  5. Magagna, D.; Uihlein, A. Ocean energy development in Europe: Current status and future perspectives. Int. J. Mar. Energy 2015, 11, 84–104. [Google Scholar] [CrossRef]
  6. Yuce, M.I.; Muratoglu, A. Hydrokinetic energy conversion systems: A technology status review. Renew. Sustain. Energy Rev. 2015, 43, 72–82. [Google Scholar] [CrossRef]
  7. Yang, X.; Khosronejad, A.; Sotiropoulos, F. Large-eddy simulation of a hydrokinetic turbine mounted on an erodible bed. Renew. Energy 2017, 113, 1419–1433. [Google Scholar] [CrossRef]
  8. Martin-Short, R.; Hill, J.; Kramer, S.; Avdis, A.; Allison, P.; Piggott, M. Tidal resource extraction in the Pentland Firth, UK: Potential impacts on flow regime and sediment transport in the Inner Sound of Stroma. Renew. Energy 2015, 76, 596–607. [Google Scholar] [CrossRef] [Green Version]
  9. Chamorro, L.P.; Hill, C.; Morton, S.; Ellis, C.; Arndt, R.E.; Sotiropoulos, F. On the interaction between a turbulent open channel flow and an axial-flow turbine. J. Fluid Mech. 2013, 716, 658–670. [Google Scholar] [CrossRef]
  10. Chamorro, L.; Hill, C.; Neary, V.; Gunawan, B.; Arndt, R.; Sotiropoulos, F. Effects of energetic coherent motions on the power and wake of an axial-flow turbine. Phys. Fluids 2015, 27, 055104. [Google Scholar] [CrossRef]
  11. Kang, S.; Yang, X.; Sotiropoulos, F. On the onset of wake meandering for an axial flow turbine in a turbulent open channel flow. J. Fluid Mech. 2014, 744, 376–403. [Google Scholar] [CrossRef]
  12. Howard, K.B.; Singh, A.; Sotiropoulos, F.; Guala, M. On the statistics of wind turbine wake meandering: An experimental investigation. Phys. Fluids 2015, 27, 075103. [Google Scholar] [CrossRef]
  13. Maganga, F.; Germain, G.; King, J.; Pinon, G.; Rivoalen, E. Experimental characterisation of flow effects on marine current turbine behaviour and on its wake properties. IET Renew. Power Gener. 2010, 4, 498. [Google Scholar] [CrossRef]
  14. Mycek, P.; Gaurier, B.; Germain, G.; Pinon, G.; Rivoalen, E. Numerical and experimental study of the interaction between two marine current turbines. Int. J. Mar. Energy 2013, 1, 70–83. [Google Scholar] [CrossRef] [Green Version]
  15. Mycek, P.; Gaurier, B.B.B.; Germain, G.G.G.; Pinon, G.G.G.; Rivoalen, E. Experimental study of the turbulence intensity effects on marine current turbines behaviour. Part II: Two interacting turbines. Renew. Energy 2014, 66, 729–746. [Google Scholar] [CrossRef]
  16. Hill, C.; Musa, M.; Chamorro, L.P.; Ellis, C.; Guala, M. Local Scour around a Model Hydrokinetic Turbine in an Erodible Channel. J. Hydraul. Eng. 2014, 140, 04014037. [Google Scholar] [CrossRef]
  17. Hill, C.; Musa, M.; Guala, M. Interaction between instream axial flow hydrokinetic turbines and uni-directional flow bedforms. Renew. Energy 2016, 86, 409–421. [Google Scholar] [CrossRef]
  18. Musa, M.; Heisel, M.; Guala, M. Predictive model for local scour downstream of hydrokinetic turbines in erodible channels. Phys. Rev. Fluids 2018, 3, 1–20. [Google Scholar] [CrossRef]
  19. Musa, M.; Hill, C.; Sotiropoulos, F.; Guala, M. Performance and resilience of hydrokinetic turbine arrays under large migrating fluvial bedforms. Nat. Energy 2018. [Google Scholar] [CrossRef]
  20. Tedds, S.C.; Owen, I.; Poole, R.J. Near-wake characteristics of a model horizontal axis tidal stream turbine. Renew. Energy 2014, 63, 222–235. [Google Scholar] [CrossRef] [Green Version]
  21. Bowman, J.; Bhushan, S.; Thompson, D.S.; O’Doherty, D.; O’Doherty, T.; Mason-Jones, A. A Physics-Based Actuator Disk Model for Hydrokinetic Turbines. In 2018 Fluid Dynamics Conference; AIAA: Reston, VA, USA, 2018; pp. 1–20. [Google Scholar] [CrossRef]
  22. Batten, W.M.J.; Harrison, M.E.; Bahaj, A.S. Accuracy of the actuator disc-RANS approach for predicting the performance and wake of tidal turbines. Philos. Trans. R. Soc. A 2013, 371, 20120293. [Google Scholar] [CrossRef] [Green Version]
  23. Shives, M.; Crawford, C. Adapted two-equation turbulence closures for actuator disk RANS simulations of wind & tidal turbine wakes. Renew. Energy 2016, 92, 273–292. [Google Scholar] [CrossRef]
  24. Koh, W.X.; Ng, E.Y. A CFD study on the performance of a tidal turbine under various flow and blockage conditions. Renew. Energy 2017, 107, 124–137. [Google Scholar] [CrossRef]
  25. Malki, R.; Masters, I.; Williams, A.J.; Nick Croft, T. Planning tidal stream turbine array layouts using a coupled blade element momentum—Computational fluid dynamics model. Renew. Energy 2014, 63, 46–54. [Google Scholar] [CrossRef]
  26. Abutunis, A.; Hussein, R.; Chandrashekhara, K. A Neural Network Approach to Enhance Blade Element Momentum Theory Performance for Horizontal Axis Hydrokinetic Turbine Application. Renew. Energy 2018. [Google Scholar] [CrossRef]
  27. Rahimian, M.; Walker, J.; Penesis, I. Performance of a horizontal axis marine current turbine: A comprehensive evaluation using experimental, numerical, and theoretical approaches. Energy 2018, 148, 965–976. [Google Scholar] [CrossRef]
  28. Ahmadi, M.H. Influence of upstream turbulence on the wake characteristics of a tidal stream turbine. Renew. Energy 2018, 132, 989–997. [Google Scholar] [CrossRef] [Green Version]
  29. Apsley, D.D.; Stallard, T.; Stansby, P.K. Actuator-line CFD modelling of tidal-stream turbines in arrays. J. Ocean. Eng. Mar. Energy 2018. [Google Scholar] [CrossRef]
  30. Gajardo, D.; Escauriaza, C.; Ingram, D.M. Capturing the development and interactions of wakes in tidal turbine arrays using a coupled BEM-DES model. Ocean Eng. 2019, 181, 71–88. [Google Scholar] [CrossRef] [Green Version]
  31. Spalart, P.R. Detached-Eddy Simulation. Annu. Rev. Fluid Mech. 2009, 41, 181–202. [Google Scholar] [CrossRef]
  32. Stallard, T.; Collings, R.; Feng, T.; Whelan, J. Interactions between tidal turbine wakes: Experimental study of a group of three-bladed rotors. Philos. Trans. R. Soc. A 2013, 371, 20120159. [Google Scholar] [CrossRef]
  33. Zhou, Z.; Scuiller, F.; Charpentier, J.F.; Benbouzid, M.; Tang, T. An up-to-date review of large marine tidal current turbine technologies. In Proceedings of the 2014 International Power Electronics and Application Conference and Exposition, Shanghai, China, 5–8 November 2014; IEEE PEAC: Piscataway, NJ, USA, 2014; pp. 480–484. [Google Scholar] [CrossRef]
  34. Van Rijn, L.C. Sediment Transport, Part II: Suspended Load Transport. J. Hydraul. Eng. 1984, 110, 1613–1641. [Google Scholar] [CrossRef]
  35. Nishino, T.; Willden, R.H.J. The efficiency of an array of tidal turbines partially blocking a wide channel. J. Fluid Mech. 2012, 708, 596–606. [Google Scholar] [CrossRef]
  36. Parsheh, M.; Sotiropoulos, F.; Porté-Agel, F. Estimation of Power Spectra of Acoustic-Doppler Velocimetry Data Contaminated with Intermittent Spikes. J. Hydraul. Eng. 2010, 136, 368–378. [Google Scholar] [CrossRef]
  37. Musa, M.; Hill, C.; Guala, M. Interaction between hydrokinetic turbine wakes and sediment dynamics: array performance and geomorphic effects under different siting strategies and sediment transport conditions. Renew. Energy 2019, 138, 738–753. [Google Scholar] [CrossRef]
  38. Smirnov, A.; Shi, S.; Celik, I. Random flow generation technique for large eddy simulations and particle-dynamics modeling. J. Fluids Eng. 2001, 123, 359–371. [Google Scholar] [CrossRef]
  39. Creech, A.; Früh, W.G.; Maguire, A.E. Simulations of an Offshore Wind Farm Using Large-Eddy Simulation and a Torque-Controlled Actuator Disc Model. Surv. Geophys. 2015, 36, 427–481. [Google Scholar] [CrossRef] [Green Version]
  40. Gebreslassie, M.G.; Sanchez, S.O.; Tabor, G.R.; Belmont, M.R.; Bruce, T.; Payne, G.S.; Moon, I. Experimental and CFD analysis of the wake characteristics of tidal turbines. Int. J. Mar. Energy 2016, 16, 209–219. [Google Scholar] [CrossRef] [Green Version]
  41. Olczak, A.; Stallard, T.; Feng, T.; Stansby, P.K. Comparison of a RANS blade element model for tidal turbine arrays with laboratory scale measurements of wake velocity and rotor thrust. J. Fluid Struct. 2016, 64, 87–106. [Google Scholar] [CrossRef]
  42. Bai, G.; Li, W.; Chang, H.; Li, G. The effect of tidal current directions on the optimal design and hydrodynamic performance of a three-turbine system. Renew. Energy 2016, 94, 48–54. [Google Scholar] [CrossRef]
  43. Hunt, J.C.R. Studying turbulence using direct numerical simulation: 1987 Center for Turbulence Research NASA Ames/Stanford Summer Programme. J. Fluid Mech. 1988, 190, 375–392. [Google Scholar] [CrossRef]
  44. Blackmore, T.; Myers, L.E.; Bahaj, A.S. Effects of turbulence on tidal turbines: Implications to performance, blade loads, and condition monitoring. Int. J. Mar. Energy 2016, 14, 1–26. [Google Scholar] [CrossRef] [Green Version]
  45. Blackmore, T.; Batten, W.M.; Bahaj, A.S. Influence of turbulence on the wake of a marine current turbine simulator. Proc. R. Soc. A 2014, 470. [Google Scholar] [CrossRef] [PubMed]
Sample Availability: All data is available from the authors.
Figure 1. Flume setup for the TT case. Both turbines are aligned and centered. The side-looking Nortek ADV velocimeter is mounted on the DAQ Carriage.
Energies 12 03188 g001
Figure 2. (a) Points measured for both cases. Black: hub height ( h h ) for the deficit at the centerline, green: long exposure for the energy spectrum, red: transverse profiles, blue: vertical profiles. The disk on this image represents primary turbine. (b) Schematic view of the cylindrical volume V that represents turbines. Forces calculated from BEM theory are only applied over nodes inside this volume. (c) Schematic view of the turbine rotor and differential radius d r used on BEM.
Energies 12 03188 g002
Figure 3. Longitudinal mean velocity U deficit for both study cases normalized by upstream velocity. The ST deficit (top) fits better to experiments than the TT case (bottom). At 10 D downstream, the wake recovered 80% of the mean streamwise velocity.
Energies 12 03188 g003
Figure 4. Transverse velocity profiles for the first three diameters of distance downstream of the primary turbine for the (top) ST and (bottom) TT cases. The DES-BEM model shows agreement with the experimental profiles, but the model is not capable of representing the asymmetry observed in the measurements.
Energies 12 03188 g004
Figure 5. Vertical longitudinal velocity profiles for the ST (top) and TT (bottom) cases. In this case, the model cannot reproduce the asymmetry of the experiments either.
Energies 12 03188 g005
Figure 6. Instantaneous q-iso surfaces from two different perspectives. Both cases show the annular vortex produced by the averaged blade tips and the high pressure point at the nacelle area. Wake vortical structures are shorter for the TT case due to the larger turbulent intensity that faces the primary turbine in that case. The dashed line indicates the position of the downstream turbine.
Energies 12 03188 g006
Figure 7. Voltage spectra for both study cases. The first peaks indicate the primary turbine rotational frequency for each case. At lower frequencies, surrounding flow effects are perceived.
Energies 12 03188 g007
Figure 8. Velocity spectrum upstream and downstream of the primary turbine for the ST (top) and TT (bottom) cases. Surrounding flow effects are perceived in the same frequency range of the voltage spectrum.
Energies 12 03188 g008
Figure 9. (a) Experimental elevation after experiments and (b) average shear stress calculated from the DES-BEM model. The DES-BEM model results show a similar low-shear zone after the turbines, which is coincident with experimental measurements.
Energies 12 03188 g009
Table 1. Primary turbine and flow characteristics for both study cases.
ParameterDefinitionSTTTUnit
DDiameter0.0920.092m
D h Hub diameter0.020.02m
h h Hub height0.0100.010m
N b Number of blades66-
R e Reynolds number1.26 × 10 3 1.26 × 10 3 -
F r Froude number0.240.24-
U Upstream velocity0.420.42m·s 1
Ω Rotor rotational velocity16.612.4rad·s 1
T S R Tip-speed ratio3.652.01-
Table 2. Main grid characteristics used in both cases.
ParameterValue
N x × N y × N z 282 × 325 × 101
Total number of nodes9,256,650
Number of nodes inside turbine volume164,125
Inlet boundary conditionRandom flow
Outlet boundary conditionZero gradient
Wall boundary conditionWall function
Bottom boundary conditionNon-slip condition

