Article

Control Strategy for MGT Generation System Optimized by Improved WOA to Enhance Demand Response Capability

1
School of Electronic Information and Electrical Engineering, Shanghai Jiao Tong University, Shanghai 200240, China
2
Department of Electronic and Electrical Engineering, University of Bath, Bath BA2 7AY, UK
*
Author to whom correspondence should be addressed.
Energies 2019, 12(16), 3101; https://doi.org/10.3390/en12163101
Submission received: 1 July 2019 / Revised: 4 August 2019 / Accepted: 8 August 2019 / Published: 13 August 2019
(This article belongs to the Special Issue Operation and Control of Power Distribution Systems)

Abstract

:
The grid-connected micro gas turbine (MGT) generation system is playing an important role in power systems because of its demand response capability and application in combined heat and power (CHP) systems. When applied to promote demand response, the generation system is expected to respond to follow instructions quickly, but a rapid response harms the safety and is not conducive to the benefits of customers, which leads to a contradiction. In this paper, a closed-loop power control is introduced for the MGT to improve demand response capability. The rate of fuel valve opening is limited so as to protect the equipment from thermal fatigue threats. An optimization method is developed for identifying the control parameters, balancing the response time and unrealized energy in the regulation process. An improved whale optimization algorithm (IWOA) is proposed to implement the optimization. Results of the algorithm performance verify that WOA is competitive with other heuristic algorithms, and IWOA is more suitable for parameter optimization problems than WOA because of better efficiency and exploitation capability. Results of power response further indicate that the proposed control strategy can achieve expected aims and is suitable for the MGT generation system.

Graphical Abstract

1. Introduction

Micro gas turbine (MGT) generation systems have become very promising in the power system because of the performance of quick start, load following ability, voltage regulation, peak-load shaving and black-start [1]. An important application for the MGT generation system is to form the combined heat and power (CHP) system with the exhaust heat recovery system. The CHP system is an efficient form of energy utilization, saving a substantial amount of primary energy compared to traditional energy generation [2].
A number of scholars have studied the optimized operation of CHP systems. Reference [3] extensively studies the demand response capability of CHP and quantifies the potential energy cost savings. Reference [4,5] propose multi-objective models for optimal energy management of grid-connected CHP systems respectively, in which Reference [4] considers real-time prices through prediction models, while Reference [5] is more concerned with carbon emissions. The economic efficiency of CHP systems can be further improved because of the value of heat storage units for improving highly renewable generation-dominated power systems [6,7]. Moreover, in real-world operation conditions, the uncertainty of operational parameters [8] and advanced gas turbine cycles [9] may also have an influence on the optimized operation.
The CHP optimization operation is a multi-timescale problem, which depends on the coordination between the dispatch instructions at the system level and the control system at the equipment level. Reference [3,4,5,6,7] mainly focuses on the optimal operation of the steady state, but most of them ignore the transient process and the important characteristics of the equipment. It is also significant to study a smaller time-scale optimal problem, which mainly focuses on the control system and the regulation. On the other hand, compared to wind turbines and photovoltaic systems, MGT generation systems are more flexible in the sense that the output power can be much easily controlled [3]. Thus, following the demand response is a feasible operation mode for the MGT-based CHP system, which has been proven to be more economical than the traditional heat-led approach in Reference [3]. Therefore, this paper aims to enhance demand response capability by improving the performance of MGT generation system during the dynamic regulation period.
The modeling of the micro gas turbine (MGT) is essential in this study because it largely determines whether the dynamic response of the model matches that of the actual CHP system. Currently, methods for modelling MGT can be roughly divided into two major categories: Mechanism modeling and black box modeling, where the former is more commonly used in simulation research. A number of studies have investigated the optimization of different micro gas turbine technologies with various demand based on static models [10,11,12], which are not suitable for transient study. Dynamic models can be described in the form of multi-differential algebraic equations, such as the differential algebraic equations model established by Schobeiri [13] and the small gas turbine differential algebraic equations established by Perez [14]. Different models are used for different research purposes. To fully quantify the potential of cycle humidification, the model in Reference [15] focus more on the complex chemical kinetics in the combustion chamber. Reference [16] proposed a model described in the form of transfer functions, which is widely used in the simulation of MGT generation system. Systems in Reference [17,18,19] are all based on the gas turbine model in Reference [16], but the speed control system cannot follow the order with a zero steady error so that the economic efficiency is unsatisfactory when applied to follow the power demand response.
Since the control parameters have a decisive impact on the performance of the controller, it is another key issue for studying a suitable control parameter optimization method. Currently, meta-heuristic algorithms have gradually replaced the traditional methods based on amplitude-frequency characteristics and engineering debugging in terms of PI parameter optimization. The particle swarm optimization algorithm (PSO) [20,21] and its improved versions [22,23] are among the most popular approaches, due to simplicity and flexibility. There have been many novel swarm-based optimization algorithms developed in recent years [24,25,26,27], and the whale optimization algorithm (WOA) is one of them [27]. From Reference [27], compared with other four typical optimization algorithms, including PSO, Gravitational Search Algorithm (GSA), Differential Evolution Algorithm (DE) and Fast Evolutionary Programing (FEP), WOA is very competitive in both local search capability and global search capability. WOA has also been applied to solve engineering problems in power systems [28,29]. Thus, it is foreseeable that WOA has good application prospect in PI parameter optimization problems.
When applied to demand response, the MGT generation system is expected to respond to dispatch instructions quickly and effectively. From the economic aspect, however, the signals are largely decided by energy consumption and energy prices, which vary according to the change of settlement. On the one hand, the generation system needs to improve its dynamic performance to follow the dispatch instructions as soon as possible. On the other hand, during this period, it also needs to ensure its security and reduce its energy loss to a minimum level. In order to achieve the balance between response time and energy loss with the consideration of security, a better control strategy is desirable for the MGT generation system.
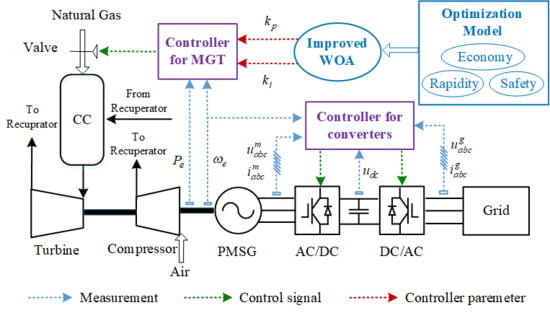
This paper focuses on the performance in the transient process of power regulation from the perspective of the MGT control system. Speed and power control is introduced to the MGT to realize a zero steady error. An optimization method is developed for identifying the control parameters, combining economy, safety and rapidity. The optimization objective for the controller is to minimize the comprehensive electricity error considering both electricity quantity error and the integral of absolute error (IAE) of power. The constraints on the rate of fuel valve opening and the simulation model are included. An improved whale optimization algorithm (IWOA) with adaptive weights is proposed to resolve the optimization problem. The new model is built in MATLAB/Simulink and studied in different operational scenarios to testify its capability and effectiveness. Results show that the proposed control strategy is able to enhance the demand response capability of the MGT generation system.
The rest of this paper is structured as follows: Section 2 introduces the dynamic model of the MGT generation system. Section 3 builds the optimization model for control parameters of the MGT control. Details of the improved whale optimization algorithm are illustrated in Section 4. An extensive case study is investigated in Section 5, and Section 6 concludes the paper.

2. Dynamic Modelling of the MGT Generation System

The basic structure of the grid-connected MGT generation system used for the CHP application is shown in Figure 1. The process of energy conversion can be expressed as follows: First, the natural gas and the compressed air enter the combustion chamber. They are mixed and combusted to generate high-temperature gas carrying thermal energy. Then the high-temperature gas enters the turbine, and part of the thermal energy is converted to mechanical energy and generates electricity. The exhaust gas of the turbine further enters the exhaust heat recovery system (EHRS) and becomes the heat available to customers.
The power generation unit is mainly composed of a permanent magnetic synchronous generator (PMSG) connected with the MGT turbine and a bidirectional back-to-back converter. The motor-side converter (AC/DC converter) and the grid-side converter (DC/AC converter) respectively control the electric power generated by the PMSG and the voltage and the frequency fed into the grid, which are the core components of the electric energy conversion process. This section mainly introduces two parts: The improved MGT model and the control model for the back-to-back converter, and the rest of the system is similar to Reference [30].

2.1. Improved MGT Model

The MGT model of this paper comes from Reference [16], and we have improved the control model to enhance power regulation capability and reduce the risk of rapid regulation on the health of MGT. This section mainly introduces the improved parts: The integrated speed and power control and the fuel control system. Other parts of the model can be found in Reference [16], and, thus, are not covered here.

2.1.1. Integrated Speed and Power Control

The traditional MGT mainly adjusts the load change through the pure speed control, which is inherently a type of droop control with a generally non-zero steady-state error. Thus, when applied to demand response, a zero-droop control strategy is expected to enhance economic efficiency.
The block diagram of the integrated speed and power control is shown in Figure 2. In Figure 2, ω r e f and P r e f are speed reference value and the power instruction respectively; ω and P e are the measured speed and the output power respectively. W , X , Y and Z are parameters for the speed controller; k p and k i are parameters for the power controller. As shown in Figure 2, power control is added to the system, forming a double-loop control: The outer loop of the speed and the inner loop of the power. The former is modeled by a proportional lead-lag transfer function, while the latter is realized by a PI controller. With such power control, not only zero error of rotor speed and power can be realized, but also the quantity power error can be compensated to a considerable extent, which will be introduced in detail in the following section. In addition, it is noted that the PI parameters have a great impact on system response and performance. When the PI parameters are set as k p = 1 k i = 0 , the integrated speed and power control are equivalent to pure speed control.

2.1.2. Fuel Control System

In practice, it is essential to ensure the operation safety of the MGT, which is normally realized by restricting the temperature under an upper limit. The temperature is the most important safety indicator which is related to the speed and the fuel quantity. In this paper, besides the traditional temperature control, a rate limit of valve opening is added to the fuel control system. In this way, thermal fatigue damage caused by drastic changes in temperature can be alleviated.
The fuel control system, including the fuel rate change limit, is shown in Figure 3. In Figure 3, K 1 and C 1 are the gain of the fuel limiter and the constant for compensating the consumption of the compressor respectively; a , b , and c are parameters of the valve positioner; τ F is the time delay of the fuel regulator. The output of the least value gate passes through the limit function to constrain its magnitude within the maximum and minimum range. The maximum limit is enabled when the turbine is overheating, which is determined by the maximum acceptable temperature in the MGT. By contrast, the minimum limit is chosen to maintain that sufficient fuel flows into the gas turbine combustion system to ensure the flame maintained. It is a “hard” constraint and typically set at approximately 10% of a torque deficiency [16]. The fuel control system consists of a valve positioner and a fuel regulator. The input to the integrator represents the rate of valve opening, where a limit is imposed to constrain the rate of power change. The fuel flow of the fuel system is decided by the inertia of the fuel system regulator, and the equivalent transfer function is shown in Figure 3.

2.2. Control Model for Back-to-Back Converter

The vector control based on the coordinate transformation is considered for both converters, which is the most popular control strategy for various types of grid-connected distribution systems [30]. Trigger pulses are generated by space vector pulse width modulation (SVPWM). The basic structure is shown in Figure 4.

2.2.1. Control Model for Motor-Side Converter (AC/DC Converter)

The motor side converter mainly controls the motor speed and electromagnetic torque. In the power generation operation, the motor side converter also needs to maintain the speed and output power stable. id = 0 control is considered in this paper for two main reasons: First, id = 0 control is the least computational vector control scheme. Under this strategy, the magnetic potential generated by the stator armature current is orthogonal to the magnetic potential generated by the rotor permanent magnet. Since there is no coupling between the two types of flux linkages, the equation of the permanent magnet synchronous motor can be greatly simplified. Moreover, the efficiency of id = 0 control is also the best because all electricity is used to generate electromagnetic torque. Based on this strategy, the double closed-loop control is considered, where the outer loop is the speed loop, and the inner loop is the current loop. The control block diagram is shown in Figure 5a.

2.2.2. Control Model for Grid-Side Converter (DC/AC Converter)

The grid-side converter mainly controls the active and reactive power of the grid-connected point, and ensures the stability of the DC bus voltage. In this paper, the decoupling control strategy based on the DC bus voltage is considered for the grid-side converter. The decoupling control can effectively control the active and reactive power, and the converter voltage can be realized through the phase-locked loop so that the frequency and phase are strictly synchronized with the grid. Based on this strategy, another double closed-loop control is considered, in which the outer loop is the DC voltage loop, and the inner loop is the current loop. The control block diagram is shown in Figure 5b.

3. Optimization Model for Control Parameter Identification

Based on the model proposed in the previous section, another important issue is how to determine the parameters of the MGT control. This section briefly analyzes the response of the control system in the dynamic process of power regulation and then establishes an optimization model for control parameter identification, including the objective function and constraint conditions.

3.1. Objective Function

From the customers’ perspective, their benefits are measured by the quantity of electricity production. If the electricity from the MGT is less than the required amount, they must buy more energy from the upstream grid, which could cost much higher. If the electricity generated by the MGT is greater than the required amount, it is not economical either because the customer will be punished for breach of the contract. Thus, from the economic perspective, PI parameters have to be optimized to minimize the difference between required electricity and actual output from the MGT. This concept is illustrated in Figure 6.
The X-axis represents the operation time, and the Y-axis represents the electricity output of CHP. Supposing the power instruction change from P r e f 1 to P r e f 2 and the regulation process proceeds from t = 0 to t = T . With some PI parameters, the power response curve could be Curve1 in which the electricity error between the reference and actual value is the area of ABFEA. With some PI parameters, however, the response curve could be Curve2, and the electricity error can be compensated by the overshoot from T 1 to T . The objective is to minimize the difference between area ABGA and area GHFIG, which is equivalent to making (1) holding during the period T.
S 1 S 2 = 0
It can be expressed in the form of integral:
0 T ( P r e f P e ) d t = 0
where P r e f is the power reference, P e is the power measured from the turbine, and T is the period from the generation system receiving the order to reaching the required output.
The electricity quantity error can be defined as Equation (3):
E e r r o r = | 0 T ( P r e f P e ) d t |
Therefore, if we only consider the economy of electricity, then the objective function can be described in Equation (4).
min { E e r r o r }
It is noted that Equation (4) can guarantee that during the operation period T, the total power error is minimized. However, it cannot avoid potential power oscillations along with the reference power, which is harmful to the MGT. For instance, if the power response is an oscillating signal with a fixed amplitude, E e r r o r of the signal will be 0 according to Equation (4). However, such a result is unacceptable, due to stability reasons.
Different types of error functional integral evaluation index, including IE, ISE, IAE, ITAE, etc. have been widely applied to control systems, due to good practicability and selectivity [31]. In order to improve the stability and match the physical dimension of Eerror, the integral of the absolute error (IAE) is added to the optimization model in this paper.
E I A E = 0 T | P r e f P e | d t
The objective is then transformed into Equation (6).
min { β E e r r o r + ( 1 β ) E I A E }
where β is the weight between (4) and (5) to reflect the relationship between electricity output error and response time. If electricity out error is more important, β should be between 0 and 0.5. By contrast, if the response time is to be considered more, it should be between 0.5 and 1.
By submitting (3), (5) into (6), the objective function in Equation (7) is finally obtained.
f ( k p , k i ) = β | 0 T [ P r e f P e ( k p , k i , t ) ] d t | + ( 1 β ) 0 T | P r e f P e ( k p , k i , t ) | d t

3.2. Constraint Conditions

In this paper, the power response of the system is obtained by the time domain simulation. The simulation system can be described as an equality constraint of the optimization model in the form of a state space model, which is shown in Equation (8).
{ X ˙ s s = A s s ( k p , k i ) X s s P e = C s s X s s
where X s s is a vector containing state variables in the state space model of the MGT generation system; A s s and C s s are the corresponding system matrix and output matrix of the state space model.
The rate of fuel regulation r f is limited to a safety range, and the PI parameters are also restricted to a feasible domain to keep the system stable, forming the inequality constraints of the optimization model described in Equations (9)–(11).
r lim r f r lim
where r lim is the rate limit of the diagram of Figure 3, which is set according to the safety requirement of the MGT.
k p , min k p k p , max
k i , min k i k i , max
where k p , min and k i , min are the lower limits of the PI parameters that can complete the power following process within the specified time, while k p , max and k i , max are the upper limits of the PI parameters that can ensure the stability of the system. Actually, kp,min and ki,min are related to each other because the feasible domain is determined by several simulations in which kp and k i vary in a step of 0.1. k p , max and k i , max are also such a relationship.

4. An Improved Whale Optimization Algorithm

From the perspective of optimization, the problem of control parameter optimization can be regarded as a nonlinear multimodal function with strong complexity. It is difficult to solve such kind of optimization problems with traditional algorithms based on the calculation of gradients [32]. Heuristic algorithms represented by the Particle Swarm Optimization (PSO) algorithm have been applied to such problems and achieved satisfactory results [22,23].
The Whale Optimization Algorithm (WOA) was proposed by Mirjalili S and Lewis A in 2016 [27]. It is assumed that whales are the most intelligent animals containing motion and WOA is a swarm-based optimization method motivated by the specific hunting behavior of humpback whales. According to Reference [27], WOA is more competitive than PSO in both exploration capability and exploitation capability.
Therefore, the WOA algorithm is used in this paper to solve the optimization problem, and its global search capability is further improved to escape from local extremums. This section mainly introduces the original WOA algorithm and the basic idea of the improved WOA.

4.1. The Original WOA

The basic idea of WOA is to perform optimization by simulating the unique predation and social behavior of whale. It describes the spiral bubble-net feeding maneuver through three mathematical models, simulating the process of encircling prey, bubble-net attack and searching for prey [27].

4.1.1. Encircling Prey

In this stage, one search agent is selected and defined as the optimal candidate solution in the current generation. Other search agents try to stay away from the optimal agent to implement a global search, which can be described as follows:
D = | C · X * ( t ) X ( t ) | ,
X ( t + 1 ) = X * ( t ) A · D ,
where t represents the current number of iterations; A and C are coefficient vectors; X ( t ) is in the current position vector in this generation; X * ( t ) is the optimal position vector which needs to be updated in every generation.
The coefficient vectors A and C are calculated as follows:
A = 2 a r a ,
C = 2 r ,
a = 2 t 2 I t e max ,
where r is a random vector with a value in [ 0 ,   1 ] ; I t e max is the upper limit of the iteration number. From Equation (14), it is noticed that A [ 2 ,   1 ] [ 1 ,   2 ] , which realizes the goal of updating the search agent away from the best candidate position, thereby avoiding falling into local optimum.

4.1.2. Bubble-Net Attack

In this stage, two methods (shrinking encircling and spiral updating position) are discussed. The mechanism of shrinking encircling is similar to that of the global search stage, except that the range of A is set to [ 1 ,   1 ] . The other method, spiral updating position, constructs a logarithmic spiral curve based on the current position and the optimal agent so that the search agent can gradually approach the optimal position. This is described in Equations (17)−(19).
D = | X * ( t ) X ( t ) | ,
X ( t + 1 ) = X * ( t ) + e b l cos ( 2 π l ) D ,
X ( t + 1 ) = { X * ( t ) A · D , p < 0.5 X * ( t ) + e b l cos ( 2 π l ) D , p 0.5 ,
where b is a constant that defines the shape of the logarithmic spiral; l is a random number between [−1, 1]; p is a probability factor used to determine whether to select shrinking encircling or spiral updating positions.

4.1.3. Search for Prey

In addition to the bubble-net search strategy, the random se arch for prey is also a feasible solution. If A exceeds the range of [−1, 1], the distance D is updated randomly. Search agents deviate from the original target to find the prey, which gives WOA certain global search capability. This is described in Equations (20) and (21).
D = | C · X r a n d X ( t ) | ,
X ( t + 1 ) = X rand A · D .
It is noted that X rand in Equations (20) and (21) is the position of a random agent in the current population instead of a simple random position.

4.2. The Improved WOA with Adaptive Weights

Although WOA is very competitive, it is insufficient in balancing the exploration and exploitation [33,34], which is similar to other swarm-based algorithms. In WOA, the exploration search is implemented by Equation (21) and the exploitation search is implemented by Equation (19). Whether to choose Equation (21) or Equation (19) is determined by the coefficient vector A . In fact, the total probability of performing Equation (19) is P ( | A | < 1 ) = 0.5 + 0.5 ln 2 0.847 under the precondition p < 0.5 . Therefore, Equation (19) dominates Equation (21) and the unbalance may lead to premature convergence to local extremums in some conditions [33].
It is noted that for various agents with different fitness values, A is generated in the same way. If agents with lower fitness values focus on global search, while agents with higher fitness values pay more attention to local development, the performance of WOA may be improved. Adaptive inertia weights have been applied to PSO algorithms to balance the global exploration ability and the local optimization ability [23]. Based on this idea, the adaptive weight is added to the WOA in this paper, forming an improved WOA with adaptive weights (IWOA). Unlike PSO, weights are added to the optimal whale instead of the simulation step. Specific operations are as follows: In the iteration process, all search agents are divided into two halves according to their fitness values f j , which are determined by their distance away from the optimal agent. Agents with lower fitness values are assigned to Group 1, while those with higher values are assigned to Group 2. Denote the average fitness values of Group 1 and Group 2 as f a v g 1 and f a v g 2 respectively, where f a v g 1 < f a v g 2 . On this basis, the inertia weights are classified to 3 cases as follows:
Case 1: If   f j f a v g 1 ,   then   ω ( 0.8 ,   1.2 )
The current individual’s fitness is better than the average fitness of the better group, indicating that the individual is dominant in the population. In this case, it is beneficial to explore the local optimal value by making the optimal whale individual shake in a small range, so the value of ω is set as a random number from 0.8 to 1.2.
Case 2: If   f j f a v g 2 ,   then   ω ( 0.3 ,   0.6 ) ( 1.3 ,   1.6 )
The current individual’s fitness is worse than the average fitness of the worse group, indicating that the position is not ideal. In order to broaden the overall optimization ability, ω is set as a random number between 0.3 and 0.6 or a random number between 1.3 and 1.6, which is conducive to the individual to find the prey in other locations, enhancing the overall searchability.
Case 3: If   f a v g 1 f j f a v g 2 ,   then   ω = 1
In this case, the current individual is in the general position of the group, so that it can approach the optimal position according to the original algorithm with the value of ω set as 1.
In this way, Equation (19) can be improved to Equation (22).
X ( t + 1 ) = { ω * X * ( t ) A · D , p < 0.5 ω * X * ( t ) + e b l cos ( 2 π l ) D , p 0.5 .
The flowchart of the IWOA is shown in Figure 7.

5. Case Study

Two tests are carried out in this section. The algorithm performance test aims to compare the search capabilities of WOA and IWOA, and the power response test is to verify the feasibility of the improved MGT control.

5.1. Algorithm Performance Test

The computational performance of the improved WOA with adaptive weights is analyzed in this section in Matlab (Version 2012a). To control variates, all algorithms discussed in this section contain 30 populations with the number of iterations set as 500, and 50 experiments are performed for each algorithm to test the stability.
A total of 6 standard test functions, including unimodal functions, multimodal functions and fixed-dimensional multimodal functions are selected as the optimization problems of the test, which is described in Table 1. f 1 ( x ) , f 2 ( x ) and f 3 ( x ) are unimodal functions with only one global optimum. These functions allow evaluating the exploitation capability of the investigated algorithms. f 4 ( x ) , f 5 ( x ) and f 6 ( x ) are all multimodal functions used to evaluate the exploration capability of the algorithms in this test. The coefficients c i , a i j and p i j of f6 are set as Reference [27].
Test results of the original whale optimization algorithm (WOA) and the improved whale optimization algorithm (IWOA) are shown in Table 2. Average values (denoted as ‘avg’ in the table) and standard deviations (denoted as ‘std’ in the table) are calculated to reflect accuracy and stability, respectively. The convergence capabilities of the two algorithms are also tested by comparing the least number of iterations (denoted as ‘itr’ in the table) with a given error threshold (denoted as ‘err’ in the table).
It is shown in Table 2 that adaptive weights improve the WOA in almost all aspects. Compared with the original WOA, in all of the six optimization problems, IWOA obtains more accurate average values and smaller standard deviations. It can be concluded that WOA enjoys better exploitation capability and better exploration capability with the help of adaptive weights. It is also noted that the average value of WOA with reference to f2 is obviously different from the ideal result, but this problem does not make any difficulty for IWOA. This is easy to explain because adaptive weights allow individuals with lower fitness to broaden the range of optimization, making IWOA more capable of escaping from local optimums. Moreover, it is also shown in Table 2 that in all of the six optimization problems, IWOA obtains fewer iterations than WOA with the same error threshold, indicating that IWOA is a better algorithm in convergence. Considering that the parameter optimization problem contains a number of local optimums, the improvement here has great significance for the application of WOA to the problem.

5.2. Power Response Test

In this part, the feasibility of the proposed control method is tested through time-domain simulation in Matlab/Simulink. The generation system based on a 100 kW-MGT is considered. The simulation model is shown in Figure 8, and the MGT model in Figure 8 is shown in Figure 9, in which improved parts discussed in Section 2 are colored in red. Parameters of the IWOA are set the same as the algorithm performance test.
Since this paper mainly focuses on the transient process of power regulation, power response curves for given instructions are analyzed. The scenario is set as follows: Initially, the CHP power is supposed to be 0.7 pu, i.e., 70% of capacity. Its output is required to increase to 0.9 pu within 10 s to follow the dispatch instruction. The upper limit of the rate of valve opening in the MGT model is set at 0.1 pu/s, that is 0.1   pu / s r f 0.1   pu / s .

5.2.1. Simulation Results with Optimized Parameters

To verify the control strategy of converters, simulation results with optimized parameters ( k p = 3.0 k i = 2.9 ) are analyzed. The results of speed, electric power of the motor, current of the d-axis and the DC voltage are shown in Figure 10.
The speed is measured from the motor, and it is the same as that of the MGT because they are coaxially connected. It can be observed from Figure 10a that the speed remains stable in the regulation process, indicating that the torque of the motor is well controlled. The curve of the electric power of the motor is shown in Figure 10b. It follows the power instruction and ranges from 0.7 pu to 0.9 pu, which is the expected result. The current of the d-axis i d is also shown in Figure 10 because i d = 0 control is applied to the motorside converter. The result of i d is great, indicating that the efficiency of the motor is high. The DC voltage refers to the voltage across capacitor on the DC side, which is a sign of power balance. The result of Figure 10d is also great as it is rather stable. It reflects that the power generated by the motor, and the power consumed by the load and the grid, are balanced.
Based on the above analysis, it can be concluded that the control strategies for the converter are effective in this paper.

5.2.2. Impact of the Speed and Power Control

The optimization results with pure speed control and with integrated speed and power control are shown in Table 3. As can be seen, when the speed and power control proposed in this paper is applied, the optimized parameters for the PI controller are k p = 3.0 k i = 2.9 , and the error of electricity quantity between reference and the measured value is 9.73 kJ. By comparison, electricity error escalates to 13.16 kJ when pure speed control is applied.
The power response measured from the MGT in the two cases is shown in Figure 11. In either case, the rate of power regulation is limited by the rate of valve opening and closing. The pure speed control can follow the required output instructions, but the steady-state error is non-zero, and there is an energy deficit during the whole operation process, both of which are unfavorable to the economic efficiency of the MGT generation system. By contrast, the proposed speed and power control can achieve no-difference adjustment, and the unrealized electricity is compensated. The optimization results suggest that as long as the stability is promised, which is already satisfied in this paper by the constraint conditions of PI parameters, the introduced speed and power control is effective in reducing comprehensive electricity error.

5.2.3. Impact of the Rate Limit

The impact of the rate limit of the fuel valve on the performance of the control system is further investigated in this subsection. Our proposed speed and power control are utilized, and the error weight is set at 0.5. The obtained optimization results are shown in Table 4. When the system is operated without a rate limit, the optimized parameters of the PI controller are k p = 6.3 k i = 11.1 , and the comprehensive electricity error is 5.4 kJ. When the rate limit is enabled, optimized parameters vary to 3.0 and 2.9, and the error increases to 9.73 kJ.
Whether the rate of valve opening is limited or not, the comprehensive electricity error is small, illustrating that the decrease of economic performance, due to the rate limit is acceptable. The power response performance with and without the rate limit is shown in Figure 12. Without the rate limit, the power rate of change is significantly larger, which is detrimental to the health of MGT, as illustrated in Section 2. According to the result calculated by Matlab/Simulink, if the rate limit is not applied, the maximum changing rate of the temperature measured at the turbine will be much larger than that with a rate limit.

5.2.4. Impact of the Error Weight

This subsection also studies the performance of the proposed speed and power control with the rate limit. The results in response to different error weights β are shown in Table 5 and Figure 13.
With the decrease of β , the error of electricity quantity decreases, and system regulation time increases. Especially when β = 0 , power oscillation appears as is shown by the black line. It can be foreseen that if the feasible domain of PI parameters is not set in the optimization process, the result may be unstable, which is fatal to the system.
The results indicate that the optimization results are sensitive to the value of β , and, thus, it is supposed to be properly selected by weighting the economic efficiency and the response time. When β is large, the electricity error of the system is small, but the response time becomes long. If quicker response time is required, smaller β value is desirable.

5.2.5. Comparison of WOA and IWOA

Finally, to verify whether the improvement of WOA is reflected in the parameter optimization problem in this paper, the original WOA is also applied to solve the problem. The same cases as Section 5.2.4 are considered, and the obtained results are shown in Table 6.
From Table 6, for the case of β = 0.5 and the case of β = 1 , results of WOA and IWOA obtain exactly the same result. However, the result of IWOA is better for the case of β = 0 . It is speculated that this might be the result of WOA falling into a local extremum. Thus, the improvement of WOA is valuable as it enhances the capability of escaping from local extremums, which is consistent with the result of the algorithm performance test.

6. Conclusions

An improved control strategy for the MGT generation system is proposed in this paper to enhance the demand response capability. Speed and power control is introduced to the MGT to realize a zero steady error. An optimization method is developed for identifying the control parameters, combining economy, safety and rapidity, and the improved whale optimization algorithm (IWOA) with adaptive weights is proposed to resolve the optimization problem. Through simulation results and optimization results, the key findings are observed: (i) Compared with pure speed control, the proposed speed and power control is more economical because the steady error is smaller and the electricity error in the regulation period can be reduced with suitable control parameters; (ii) The optimization method for control parameters considering both P e r r o r and P I A E is effective in improving the performance of the MGT generation system in the regulation period, and the error weight β is to be chosen carefully to reach a balance; (iii) the proposed IWOA enjoys better exploitation capability and better exploration capability than the original WOA not only in benchmark function tests, but also in solving the parameter optimization problem.
Therefore, the proposed control strategy is suitable for the MGT generation system in enhancing the power demand response capability. We will study further in later research on its application to the CHP system with consideration of more specific models of the thermal system.

Author Contributions

Conceptualization, J.Z. and X.W.; Methodology, J.Z. and X.W.; Software, J.Z.; Validation, X.W., C.G. and D.X.; Formal Analysis, J.Z.; Investigation, J.Z.; Resources, X.W. and D.X.; Data Curation, J.Z.; Writing—Original Draft Preparation, J.Z.; Writing—Review and Editing, J.Z.; Visualization, J.Z.; Supervision, X.W., C.G. and D.X.; Project Administration, X.W.; Funding Acquisition, X.W. and D.X.

Funding

This work was supported by Shanghai Science and Technology Commission (17DZ1201003).

Conflicts of Interest

The authors declare no conflict of interest.

Nomenclature

P r e f Power reference value
P e Output power of the MGT
T The period of power regulation
E e r r o r The electricity quantity error
E I A E The absolute error
β The error weight
k p The gain of proportional element
k i The gain of integral element
r f The rate of fuel regulation
f j The fitness value of the jth agent
Subscript s s The mark of the state space model
Subscript r e f The mark of reference values
Subscript d The mark of d-axis parameter
Subscript q The mark of q-axis parameter
Subscript α The mark of α-axis parameter
Subscript β The mark of β-axis parameter
Superscript m The mark of motor-side parameter
Superscript g The mark of grid-side parameter
CHPCombined Heat and Power
MGTMicro Gas Turbine
PMSGPermanent Magnetic Synchronous Generator
VSIVoltage Source Inverter
SVPWMSpace Vector Pulse Width Modulation
CCCombustion Chamber
EHRSExhaust Heat Recovery System
LVGLeast Value Gate
MSCMotor-Side Converter
GSCGrid-Side Converter
IAEIntegral of Absolute Error
ISEIntegral of Square Error
ITAEIntegral of Time and Absolute Error
ITSEIntegral of Time and Square Error
PSOParticle swarm optimization
WOAWhale optimization algorithm
IWOAImproved whale optimization algorithm
DEDifferential evolution
avgAverage value
stdStandard Deviation
errError threshold for algorithm performance test
itrLeast time of iterations

References

  1. Li, G.; Yue, W.; Zhou, M.; Lo, K.L. Modeling and simulation of a microturbine generation system based on PSCAD/EMTDC. In Proceedings of the 5th International Conference on Critical Infrastructure, Beijing, China, 20–22 September 2010. [Google Scholar]
  2. Carrero, M.; ’anchez, I.S.; de Paepe, W.; Parente, A.; Contino, F. Is there a future for small-scale cogeneration in europe? economic and policy analysis of the internal combustion engine, micro gas turbine and micro humid air turbine cycles. Energies 2019, 12, 413. [Google Scholar] [CrossRef]
  3. Houwing, M.; Negenborn, R.; de Schutter, B. Demand Response With Micro-CHP Systems. Proc. IEEE 2011, 99, 200–213. [Google Scholar] [CrossRef]
  4. Xie, D.; Lu, Y.; Sun, J.; Gu, C.; Yu, J. Optimal Operation of Network-Connected Combined Heat and Powers for Customer Profit Maximization. Energies 2016, 9, 442. [Google Scholar] [CrossRef]
  5. Gitizadeh, M.; Farhadi, S.; Safarloo, S. Multi-objective energy management of CHP-based microgrid considering demand response programs. In Proceedings of the 2014 Smart Grid Conference, Tehran, Iran, 9–10 December 2014; pp. 1–7. [Google Scholar]
  6. Haupt, A.; Müller, K. Integration of a LOHC storage into a heat-controlled CHP system. Energy 2017, 121, 66–67. [Google Scholar] [CrossRef]
  7. Vögelin, P.; Koch, B.; Georges, G.; Boulouchos, K. Heuristic approach for the economic optimisation of combined heat and power (CHP) plants: Operating strategy, heatstorage and power. Energy 2017, 121, 66–67. [Google Scholar] [CrossRef]
  8. De Paepe, W.; Coppitters, D.; Abraham, S.; Tsirikoglou, P.; Ghorbaniasl, G.; Contino, F. Robust operational optimization of a typical micro gas turbine. Energy Procedia 2019, 158, 5795–5803. [Google Scholar] [CrossRef]
  9. De Paepe, W.; Carrero, M.; Bram, S.; Contino, F.; Parente, A. Waste heat recovery optimization in micro gas turbine applications using advanced humidified gas turbine cycle concepts. Appl. Energy 2017, 207, 218–229. [Google Scholar] [CrossRef]
  10. Berta, G.L.; Prato, A.P.; Garbarino, L. Design criteria for distributed cogeneration plants. Energy 2006, 8, 1403–1416. [Google Scholar] [CrossRef]
  11. Lin, F.; Yi, J. Optimal operation of a CHP plant for space heating as a peak load regulating plant. Energy 2000, 25, 283–298. [Google Scholar] [CrossRef]
  12. Ondeck, A.D.; Edgar, T.F.; Baldea, M. Impact of rooftop photovoltaics and centralized energy storage on the design and operation of a residential CHP system. Appl. Energy 2018, 222, 280–299. [Google Scholar] [CrossRef] [Green Version]
  13. Schobeiri, M.T.; Attia, M.; Lippke, C. A generic modularly structured computer code for simulation of dynamic behavior of aero- and power generation gas turbine engines. J. Eng. Gas Turbines Power 1994, 116, 483–494. [Google Scholar] [CrossRef]
  14. Rodriguez, D.I.H.; Spitalny, L.; Myrzik, J.; Braun, M. Development of a control strategy for mini CHP plants for an active voltage management in low voltage networks. In Proceedings of the 2012 3rd IEEE PES International Conference and Exhibition on Innovative Smart Grid Technologies (ISGT Europe), Berlin, Germany, 14–17 October 2012; pp. 1–8. [Google Scholar]
  15. De Paepe, W.; Renzi, M.; Carrerro, M.M.; Caligiuri, C.; Contino, F. Micro gas turbine cycle hu-midification for increased flexibility: Numerical and experimental validation of different steam injection models. J. Eng. Gas Turbines Power 2018, 141. [Google Scholar] [CrossRef]
  16. Rowen, W.I. Simplified Mathematical Representations of Heavy-Duty Gas Turbines. J. Eng. Power 1983, 105, 865–869. [Google Scholar] [CrossRef]
  17. Zhang, J.L.; Shen, J.; Ge, B. Modeling and dynamic analysis of adjustable regenerative microturbine. In Proceedings of the 2010 Asia-Pacific Power and Energy Engineering Conference, Chengdu, China, 28–31 March 2010. [Google Scholar]
  18. Xu, X.; Jia, H.; Chiang, H.; Yu, D.; Wang, D. Dynamic Modeling and Interaction of Hybrid Natural Gas and Electricity Supply System in Microgrid. IEEE Trans. Power Syst. 2015, 30, 1212–1221. [Google Scholar] [CrossRef]
  19. Guda, S.R.; Wang, C.; Nehrir, M.H. A Simulink-based microturbine model for distributed generation studies. In Proceedings of the 37th Annual North American Power Symposium, Ames, IA, USA, 25 October 2005. [Google Scholar]
  20. Krama, A.; Zellouma, L.; Rabhi, B.; Refaat, S.; Bouzidi, M. Real-Time implementation of high performance control scheme for grid-tied PV system for power quality enhancement based on MPPC-SVM optimized by PSO algorithm. Energies 2018, 11, 3516. [Google Scholar] [CrossRef]
  21. Pablo, G.; Antonio, J.; Francisco, L.; Carlos, A.; Luis, M.; Francisco, J. Power control based on particle swarm optimization of grid-connected inverter for hybrid renewable energy system. Energy Convers. Man. 2015, 91, 83–92. [Google Scholar]
  22. Pati, S.; Sahu, B.K.; Panda, S. Hybrid differential evolution particle swarm optimisation optimised fuzzy proportional–integral derivative controller for automatic generation control of interconnected power system. IET Gener. Transm. Distrib. 2014, 8, 1789–1800. [Google Scholar]
  23. Zhang, L.; Tang, Y.; Hua, C. A new particle swarm optimization algorithm with adaptive inertia weight based on Bayesian techniques. Appl. Soft Comput. 2015, 28, 138–149. [Google Scholar] [CrossRef]
  24. Yang, X. A new metaheuristic bat-inspired algorithm. In Proceedings of the Workshop on Nature Inspired Cooperative Strategies for Optimization (NICSO 2010); Springer: Berlin/Heidelberg, Germany, 2010; pp. 65–74. [Google Scholar]
  25. Yang, X. Firefly algorithm, stochastic test functions and design optimization. Int. J. Bio-Inspired. Comput 2010, 2, 78–84. [Google Scholar] [CrossRef]
  26. Kaveh, A.; Farhoudi, N. A new optimization method: Dolphin echolocation. Adv. Eng. Softw. 2013, 59, 53–70. [Google Scholar] [CrossRef]
  27. Mirjalili, S.; Lewis, A. The whale optimization algorithm. Adv. Eng. Softw. 2016, 95, 51–67. [Google Scholar] [CrossRef]
  28. Medani, K.; Sayah, S.; Bekrar, A. Whale optimization algorithm based optimal reactive power dispatch: A case study of the Algerian power system. Electr. Power Syst. Res. 2018, 163, 696–705. [Google Scholar] [CrossRef]
  29. Sahu, P.; Hota, P.; Panda, S. Power system stability enhancement by fractional order multi input SSSC based controller employing whale optimization algorithm. J. Electr. Syst. Inf. Technol. 2018, 5, 326–336. [Google Scholar] [CrossRef]
  30. Grillo, S.; Massucco, S.; Morini, A.; Pitto, A.; Silvestro, F. Microturbine Control Modeling to Investigate the Effects of Distributed Generation in Electric Energy Networks. IEEE Syst. J. 2010, 4, 303–312. [Google Scholar] [CrossRef] [Green Version]
  31. Xu, F.; Li, D.; Xue, Y. Comparing and optimum seeking of PID tuning methods based on ITAE index. Proc. CSEE 2003, 8, 207–211. [Google Scholar]
  32. Gharehchopogh, F.; Gholizadeh, H. A comprehensive survey: Whale Optimization Algorithm and its applications. Swarm Evolut. Comput. 2019, 48, 1–24. [Google Scholar] [CrossRef]
  33. Xiong, G.; Zhang, J.; Shi, D.; He, Y. Parameter extraction of solar photovoltaic models using an improved whale optimization algorithm. Energy Convers. Manag. 2018, 174, 388–405. [Google Scholar] [CrossRef]
  34. Bozorgi, S.; Yazdani, S. IWOA: An improved whale optimization algorithm for optimization problems. J. Comput. Des. Eng. 2019, 6, 243–259. [Google Scholar]
Figure 1. Structure and energy flow of the grid-connected combined heat and power (CHP) system.
Energies 12 03101 g001
Figure 2. Integrated speed and power control.
Energies 12 03101 g002
Figure 3. Fuel control system with the rate limit.
Energies 12 03101 g003
Figure 4. Structure of the converter control system.
Energies 12 03101 g004
Figure 5. Control diagram of back-to-back converter (a) motor-side; (b) grid-side.
Energies 12 03101 g005
Figure 6. Power response of the CHP.
Energies 12 03101 g006
Figure 7. Flow chart of improved whale optimization algorithm (IWOA).
Energies 12 03101 g007
Figure 8. Simulation model of the micro gas turbine (MGT).
Energies 12 03101 g008
Figure 9. Simulation model of the grid-connected CHP.
Energies 12 03101 g009
Figure 10. Simulation results with optimized parameters: (a) Speed; (b) electric power; (c) current of d-axis; (d) DC voltage.
Energies 12 03101 g010aEnergies 12 03101 g010b
Figure 11. Power response of different control types.
Energies 12 03101 g011
Figure 12. Power response of different rate limits.
Energies 12 03101 g012
Figure 13. Power response of different error weights.
Energies 12 03101 g013
Table 1. Benchmark functions of the algorithm performance test.
FunctionTypeRangeOptimum
f 1 ( x ) = i = 1 n x i 2 Unimodal [ 100 , 100 ] 0
f 2 ( x ) = max { | x i | , 1 i n } Unimodal [ 100 , 100 ] 0
f 3 ( x ) = i = 1 n ( [ x i + 0.5 ] ) 2 Unimodal [ 100 , 100 ] 0
f 4 ( x ) = i = 1 n x i sin ( | x i | ) Multimodal [ 500 , 500 ] −418.98 n
f 5 ( x ) = 20 e ( 0.2 1 n i = 1 n x i 2 ) e 1 n i = 1 n cos ( 2 π x i ) + 20 + e Multimodal [ 32 , 32 ] 0
f 6 ( x ) = i = 1 4 c i e ( j = 1 3 a i j ( x j p i j ) 2 ) Fixed-Dimensional Multimodal [ 0 , 1 ] −3.32
Table 2. Results of whale optimization algorithm (WOA) and IWOA.
FunctionsWOAIWOA
avgstderritravgstderritr
f1001 × 10−50294001 × 10−50 261
f24.1912.7431 × 10−50N/A001 × 10−50 318
f 3 3.6 × 10−52.3 × 10−511202.6 × 10−51.5 × 10−5169
f 4 −110241664.12000368−119271101.9200033
f 5 4.4 × 10−152.4 × 10−151 × 10−101791.0 × 10−157.0 × 10−161 × 10−10 153
f 6 −3.8550.01330.01248−3.8590.0030.01106
Table 3. Optimization results of different control types.
Control Type β kp k i Comprehensive Error (kJ)
Speed and power control0.53.02.99.73
Pure speed control0.5NANA13.16
Table 4. Optimization results with and without the rate limit.
Rate Limit β kp k i Comprehensive Error (kJ)
Applied0.53.02.99.73
Not applied0.56.311.15.40
Table 5. Optimization results under different error weights.
Rate Limit β kp k i Comprehensive Error (kJ)
Applied06.715.828.86
Applied0.53.02.99.73
Applied15.70.90
Table 6. Optimization results of WOA and IWOA.
β = 0 WOAIWOA β = 0.5 WOAIWOA β = 1 WOAIWOA
kp5.26.7kp3.03.0kp5.75.7
k i 9.815.8 k i 2.92.9 k i 0.90.9
Optimized Result33.0228.86Optimized Result9.739.73Optimized Result00

