Article

Life Cycle Assessment of Fuel Cell Vehicles Considering the Detailed Vehicle Components: Comparison and Scenario Analysis in China Based on Different Hydrogen Production Schemes

1
School of Automobile, Chang’an University, Xi’an 710064, China
2
School of Mechanical Engineering, Beijing Institute of Technology, Beijing 100081, China
*
Author to whom correspondence should be addressed.
Energies 2019, 12(15), 3031; https://doi.org/10.3390/en12153031
Submission received: 16 July 2019 / Revised: 1 August 2019 / Accepted: 5 August 2019 / Published: 6 August 2019
(This article belongs to the Section B: Energy and Environment)

Abstract

:
Numerous studies concerning the life cycle assessment of fuel cell vehicles (FCVs) have been conducted. However, little attention has been paid to the life cycle assessment of an FCV from the perspective of the detailed vehicle components. This work conducts the life cycle assessment of Toyota Mirai with all major components considered in a Chinese context. Both the vehicle cycle and the fuel cycle are included. Both comprehensive resources and energy consumption and comprehensive environmental emissions of the life cycles are investigated. Potential environmental impacts are further explored based on CML 2001 method. Then different hydrogen production schemes are compared to obtain the most favorable solution. To explore the potential of the electrolysis, the scenario analysis of the power structure is conducted. The results show that the most mineral resources are consumed in the raw material acquisition stage, the most fossil energy is consumed in the use stage and global warming potential (GWP) value is fairly high in all life cycle stages of Toyota Mirai using electrolyzed hydrogen. For hydrogen production schemes, the scenario analysis indicates that simply by optimizing the power structure, the environmental impact of the electrolysis remains higher than other schemes. When using the electricity from hydropower or wind power, the best choice will be the electrolysis.

Graphical Abstract

1. Introduction

Nowadays fuel cell vehicles (FCVs) are recommended as a critical technical path to reduce energy consumption and pollutant emissions in road transport sector due to their no pollutant emissions during the use phase. However, from the perspective of life cycles, the introduction of FCVs will lead to higher greenhouse gas (GHG) emissions if the pathways of hydrogen generation are not clean enough [1]. Therefore, numerous studies concerning the life cycle energy consumption and emissions of FCVs were conducted.

1.1. Literature Review

One of these research topics is the comparison of the energy consumption and emissions in FCVs and other alternative fuel vehicles, including gasoline vehicles [2,3,4,5,6], diesel vehicles [3], compressed natural gas (CNG) vehicles [2,3,4], hybrid electric vehicles (HEVs) [3,7,8], methanol vehicles [9], plug-in hybrid electric vehicles (PHEVs) [10], and battery electric vehicles (BEVs) [3,7,8,9,10]. Particularly, Bauer et al. proposed a comprehensive life cycle assessment method based on a new vehicle simulation framework. They carried out a comparative analysis of the life cycle environmental impacts of conventional and hybrid gasoline, diesel and CNG cars as well as BEVs and FCVs [3].
Besides the comparison of the life cycle environmental impact, some studies further conduct the economic comparison of FCVs, electric vehicles (EVs) and traditional vehicles. For example, Granovskii et al. conducted economic comparisons between traditional vehicles, hybrids, EVs and FCVs [11], while Miotti et al. compared the economy of FCVs, EVs, and traditional vehicles manufactured on different dates and at different yields [12].
Moreover, some studies conduct the comparison emphasizing the manufacturing stage. Evangelisti et al. proposed a comprehensive assessment method for FCVs that emphasizes the production process, and they compared FCVs with BEVs and internal combustion engine vehicles (ICEVs) in terms of the production [13].
Many scholars have also studied the costs and environmental impacts of different hydrogen production schemes using the life cycle assessment method [14,15,16,17,18,19]. For instance, Yoo et al. provided a (well-to-wheel) WTW GHG analysis method and collected data for various H2 productions for FCVs in Korea [20], while Huang et al. conducted a WTW analysis about the H2 route in Shanghai considering that different H2 routes have very different energy and emission effects [21]. Hwang et al. carried out the sustainability study of six potential hydrogen pathways using renewable and non-renewable energy sources, including steam reforming of natural gas and corn ethanol, water electrolysis using grid generation and solar electricity, and coal gasification with and without carbon sequestration [22].
For the detailed hydrogen production, some research is focused on the electrolysis. Kong et al. conducted an in-depth study on the influence of different power generation modes on the life cycle of FCVs with regard to electrolysis [23]. Bhandari et al. found that the main environmental problem of the electrolysis is the power supply [24]. Zhao et al. performed a comprehensive environmental performance study of hydrogen production in an isolated territory. The hydrogen is produced on-site by polymer electrolyte membrane water electrolysis based on electricity from wind turbines [25].
Some studies also pay attention to the life cycle analysis of only FCVs or fuel cell systems. Ally et al. carried out analysis on the environmental footprint and energy requirements of a fuel cell bus in Perth, Australia using a life cycle assessment methodology with regard to the infrastructure, vehicle manufacturing, vehicle service and scrap recycling [26]. Simons et al. analyzed the production and end-of-life processes of current and future proton exchange membrane fuel cell systems, and they conducted a sensitivity analysis in order to assess influences on the results from the key fuel cell parameters [27].
There are some studies conducting the life cycle analysis of FCVs from other perspectives. Thomas compared the social benefits of replacing traditional gasoline vehicles with FCVs through a dynamic computer simulation model [28]. Hao et al. used the life cycle assessment method to analyze the GHG emissions from nineteen FCV use routes and reviewed the unique advantages for China to deploy FCVs [29].

1.2. Contribution of This Work

Distinguished from the existing studies, this work conducts a life cycle assessment of an FCV from the perspective of the detailed vehicle components. In detail, all major components (especially the fuel cell stack) of an FCV are considered in the life cycle assessment. All life cycles including both the vehicle cycle (especially the scrap recycling stage) and the fuel cycle are included in this work. Both comprehensive resources and energy consumption and comprehensive environmental emissions of the life cycles are investigated. Potential environmental impacts are further explored based on CML 2001 method.
In addition, different hydrogen production solutions are compared in order to obtain a more ideal hydrogen production scheme. Especially, to explore the development potential of the electrolysis method, we carry out a single factor sensitivity analysis (or scenario analysis) of the power structure. We also further analyze the impact of the electrolysis on the environment when using a single clean energy power generation method.
The remainder of this paper is organized as follows. Section 2 illustrates the method for the life cycle assessment of the FCV. In particular, the assessment objects and data sources are presented in Section 2.1. The system boundaries and functional units are shown in Section 2.2. The impact assessment indicators are introduced in Section 2.3. The life cycle assessment model considering the detailed vehicle components, including the vehicle cycle and the fuel cycle, is described in Section 2.4. Section 3 presents research results including: the energy consumption and emission results in Section 3.1 and the characterization results of the life cycle energy consumption and emissions in Section 3.2. The comparison of the life cycle energy consumption and emissions of four hydrogen production schemes and the scenario analysis are discussed in Section 3.3 and Section 3.4, respectively. Section 4 provides the concluding remarks.

2. Methods

2.1. Assessment Objects and Data Sources

In 2016, Toyota Mirai became the most popular FCV on the market with 2039 registrations or a market share of 88% [30]. At the same time, as the world’s first mass-produced FCV, Toyota Mirai’s technology is relatively mature, and a large amount of real vehicle test data about Mirai is available. Therefore, this work takes Toyota Mirai as the assessment object. The vehicle performance parameters of Toyota Mirai [31,32] are shown in Table 1.
The data about Toyota Mirai are mainly sourced from literature [12,13,33] and partly sourced from enterprise investigations. The upstream process data are mainly sourced from the 2017 GaBi7 (GaBi ts) database.

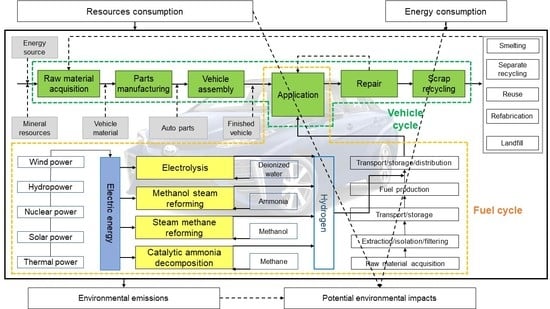
2.2. System Boundaries and Functional Units

The life cycle of Toyota Mirai is divided into six stages including raw material acquisition, parts manufacturing, vehicle assembly, use, maintenance, and scrap recycling. For the energy consumption, crude oil, raw coal, and natural gas consumption are considered. For the emissions, only the substances with large emissions are considered, such as CO2, CO, NOx, SOx, nonmethane volatile organic compound (NMVOC), CH4, PM10 and PM2.5. The system boundaries are shown in Figure 1.
A functional unit is a quantified product function or performance characteristic [34]. For comparison with existing studies [16,35,36], this paper takes a general working condition of 250,000 km of Toyota Mirai as the functional unit.

2.3. Impact Assessment Indicators

An impact assessment is a process of transforming inventory analysis results into potential environmental impacts based on selected impact indicators and assessment models [37]. According to the CML2001 life cycle assessment method [38], seven types of indicators including mineral resource consumption (ADP (e)), fossil energy consumption (ADP (f)), global warming potential (GWP), acidizing potential (AP), eutrophication potential (EP), photochemical ozone creation potential (POCP), and ozone depletion potential (ODP) are selected for assessment.

2.4. Assessment Model

According to the Greenhouse Gases, Regulated Emissions, and Energy Use in Transportation (GREET) model [39], there are two independent cycles in the automobile life cycle, the vehicle cycle and fuel cycle (or WTW process). The vehicle cycle can be divided into three stages including pre-use, use, and post-use. In this study, the vehicle cycle is specifically divided into six stages: the acquisition of raw materials, parts manufacturing, vehicle assembly, use, maintenance, and scrap recycling. The fuel cycle can be divided into three stages, i.e., the crude oil stage (crude oil extraction and transportation), the fuel stage (fuel production, transportation, storage and distribution), and the application stage (combustion, evaporation, etc.).

2.4.1. Assessment Model for the Vehicle Cycle

Comprehensive Resources and Energy Consumption of the Vehicle Cycle

The vehicle cycle comprises six stages, raw material acquisition, parts manufacturing, vehicle assembly, maintenance, and recycling. Note that the transportation logistics stage is considered in the vehicle assembly and maintenance stages when establishing the model. The input matrix Ai of the material, energy and transportation logistics for stage i of the life cycle is established as:
A i = [ ( m i j ) p × r ; ( e i j ) q × r ; ( l i j ) k × r ]
where i = 1, 2, 3, 4, 5, and 6 indicates the stage of raw materials acquisition, parts manufacturing, vehicle assembly, transportation logistics, maintenance, and end-of-life recycling, respectively. mij, eij, and lij are the input values of the type j material, energy and transportation logistics of stage i, respectively. p, q, and k are the numbers of types of materials, energies and transportation logistics in this stage.
During the transformation from mineral resources into vehicle materials, there is a certain amount of loss and the conversion rate is assumed to be η . Then the conversion rate of type j material consumed in stage i can be represented by the conversion rate matrix η i j . The resource consumption matrix excluding the use stage is established as shown in Equation (2).
B i = A i [ ( m i j ) p × r ; 0 ; 0 ] ( η i j ) p × r
Because no mineral resources are consumed in the use stage, Bi is the total amount of mineral resources consumed by the FCV life cycle.
Then we establish the six-stage energy consumption matrix C i = ( e i s j ) p × q , where Ci is the energy consumption matrix for stage i. eisj is the amount of type j energy consumed in stage i in process s. Hence, the comprehensive life cycle energy consumption of the FCV can be obtained as shown in Equation (3).
D = ( B i C i = 1 ) + C i
where D is the total energy consumption, B i C i = 1 is the upstream energy consumption of the vehicle cycle, and Ci is the direct energy consumption in each stage.

Comprehensive Environmental Emissions of the Vehicle Cycle

It is assumed that the pollutant emission intensity matrix for type j pollutant during the acquisition of type i material is P o = ( p o i j ) n × c . During the material manufacturing stage, we assume that the pollution emission intensity matrix for type j pollutant during the preparation of type i material is P B = ( p b i j ) n × d , and then, the comprehensive environmental emission matrix for the life cycle of the FCV excluding the vehicle use stage is given by Equation (4).
P T Q = [ B i ( P o × P B ) ] i = 1 + ( D P G ) i = 2 , 3 , 4 , 5
where PG is the pollutant emission intensity matrix of the upstream section of energy.

2.4.2. Assessment Model for the Fuel Cycle

Comprehensive Resources and Energy Consumption of the Fuel Cycle

The fuel cycle of the FCV consumes only hydrogen, and therefore, the resource and energy consumption matrix of the vehicle fuel cycle is given by Equation (5).
D u = L × ( C u C o )
where L is the total mileage of the life cycle, Cu is the amount of hydrogen consumed in a unit of mileage, and C o = ( m i j , e i j ) is the amount of resources and energy consumed for the preparation of a unit of hydrogen by electrolysis.

Comprehensive Environmental Emissions of the Fuel Cycle

The pollutant emission intensity matrix of the fuel cycle of the FCV is established as shown in Equation (6).
P F = [ p 1 , p 2 , , p n ]
where pn is the type n pollutant emissions after the FCV is driven for a unit of mileage.
Then, the comprehensive environmental emission matrix of the fuel cycle of FCV is available, as shown in Equation (7).
P T F = L × P F

2.4.3. Life Cycle Assessment Model of Toyota Mirai

Based on the data of domestic and foreign literature [12,13,33] and official websites, we establish a life cycle assessment GaBi model of Toyota Mirai. To simplify the modeling process, we classify Toyota Mirai into five major parts: the vehicle body, fuel cell, energy storage battery, hydrogen storage tank, and balance device. The vehicle body consists of the body, powertrain, chassis, electric motor, and electronic controller. Fluids are present in small masses but play important roles, and in this study we consider fluids such as lubricant, brake fluid, coolant, wiper liquid, and additives. The mass of each part is shown in Table 2.

Raw Material Acquisition Stage

Processing mineral resources into automotive raw materials is the main task in the raw material acquisition stage. After knowing the type, mass and materials of the five parts above [12,40], we establish the GaBi model for each of the five parts. For certain schemes not given in the GaBi database, we consider only the energy consumed and the contaminants produced by the input and output of the substances. The inventory data are shown in Table 3.

Parts Manufacturing Stage

The main aim of the parts manufacturing stage is to transform the vehicle raw materials into various types of parts. When conducting a life cycle assessment, we must determine the electricity consumed during the parts manufacturing process of each product. However, because we only have the data of the actual manufacturing process of Chinese plants [38,41,42,43], it is assumed that the manufacturing process of Toyota Mirai is the same as that of the Chinese factories. Furthermore, we select fifteen types of automotive parts to explicate the energy consumption and emission details of this stage, and the inventory data are shown in Table 3.

Vehicle Assembly Stage

In the assembly stage, the energy consumption of the assembly plant mainly comes from the coating, air conditioning and lighting, heating, material handling, welding, and compressed air in the workshop [40,44]. The energy consumption per unit mass of the schemes above is shown in Table 4.

Use Stage

An FCV only consumes hydrogen in the use stage. Currently, there are four fairly mature hydrogen production schemes in the industry: steam methane reforming, electrolysis, methanol steam reforming and catalytic ammonia decomposition. The electrolysis is selected first to conduct the life cycle analysis. Other hydrogen production schemes will be further discussed on Section 3.3.
The electric energy used in hydrogen production has multiple sources such as thermal power, hydropower, wind power, nuclear power, and solar power. The energy consumption of each power generation mode is different, and therefore, the energy consumption of an FCV during the use stage mainly depends on its hydrogen consumption, i.e., the range of the FCV. The main raw materials for the production of hydrogen from electrolysis and the consumption for the production of a unit hydrogen are shown in Table 5. We calculate the energy consumption and emission of the life cycle of the FCV (250,000 km) based on the daily mileage travelled by private cars in Beijing and the data are adopted from the literature [40].

Maintenance Stage

To simplify the modeling process, for replacing automotive parts, we consider the environmental impact of the manufacturing process of the replaced automotive parts. For an FCV, the components that need to be frequently replaced include the energy storage batteries, tires, and fluids. The lifetime of the energy storage battery is approximately 2000 charging cycles [49]. Based on the assumption of 1 charge per day, the service life of the battery is approximately five years. Therefore, the energy storage batteries are replaced three times in the full life cycle. According to literature [40,43], we obtain the number of tire and fluid replacements and the total mileage of the vehicle throughout the full life cycle. The service duration and replacement times of parts during the maintenance stage are shown in Table 6.

Scraping Recycling Stage

Since there is currently no professional solution for the recycling of FCVs, we refer to the literature [50,51] and other new energy vehicles for modeling. The differences between the recycling of FCVs and that of other new energy vehicles include the recycling of the valuable platinum in the fuel cell stack and carbon fiber coatings in the hydrogen storage tank. For carbon fiber recycling process, the related data are not available, and thus, this part is ignored in this study.

3. Results and Discussion

3.1. Energy Consumption and Emissions

In this section we discuss the consumption of nonrenewable energies such as raw coal, crude oil and natural gas and the discharge of major emissions. The energy consumption in each stage of the life cycle of Toyota Mirai is shown in Figure 2. It is found that the consumption of raw coal is much higher than the sum of the consumption of other two fossil fuels. The consumption of coal in the use stage and the end-of-life recycling stage accounts for 93.8% of the total consumption of raw coal. In addition, the consumption of raw coal is the largest component consumed in each stage. The main source of electricity in China is coal thermal stations, and electricity is consumed in all the stages. Additionally, a large amount of electricity is needed during the use stage for hydrogen production and during the scrap recycling stage for the recycling of metals. Therefore, the coal consumption in these two stages is much higher than those of other stages.
To further study the energy consumption ratio of each component in the raw material acquisition stage and the parts manufacturing stage and to find the key parts affecting the energy consumption of these two stages, we divide the FCV into nine major parts (body, Ni-MH battery, fuel cell stack, fluid, balance device, electric motor, controller, hydrogen storage tank, and chassis) during the raw material acquisition stage. The statistics of the energy consumption ratio during the raw material acquisition stage are shown in Figure 3. It shows that the most energy-intensive parts in terms of crude oil, raw coal, and natural gas consumption, respectively, are the vehicle body followed by the chassis. These two parts have relatively large masses, and large amounts of raw materials are needed. Therefore, energy conservation in an FCV can start with reducing the raw materials needed for these two parts.
In the parts manufacturing stage, eighteen main parts (body, glass, seat, dashboard, fuel cell stack, motor, hydrogen storage tank, controller, balance device, brackets, drive shaft, differential, suspension system, braking system, wheels, tires, steering system, and Ni-MH battery) are selected for statistical analysis. The results of the analysis are shown in Figure 4. It indicates that the fuel cell stack is the part that consumes the most energy in the parts manufacturing stage due to a total of seventeen processes in the manufacture of a fuel cell stack. Each process is fairly complex beyond simple manual assembly. Moreover, the fabrication of the uniform coating of platinum on the proton exchange membrane is especially complex, where a platinum-covered catalytic layer with a thickness of only a few microns is formed. This process consumes a large amount of energy.
The emissions at all stages of the life cycle are shown in Figure 5. The data suggest that CO2 is the largest emission at all stages, which is related to China’s heavy dependence on thermal power generation (coal combustion produces large amounts of CO2). During the use stage and scrap recycling stage, the CO2 emissions are extraordinarily high, which is due to the consumption of large amounts of electricity. The NMVOC emissions are fairly high during the raw material acquisition stage because dozens of tons of ore and approximately 100 refining processes are needed to obtain the platinum for the fuel cell stack, in which significant amounts of NMVOC are generated. In the scrap recycling stage, the SOX and NVMOC emissions are negative, mainly because the recycling reduces the use of certain new raw materials and results in positive benefits.
In order to identify key parts affecting the environmental emissions during the raw material acquisition and parts manufacturing stages, we further study the proportions of environmental emissions of the automotive parts.
The statistics of the environmental emissions for various parts during raw material acquisition are shown in Figure 6. It is found that the CO, NOX, CH4, PM10, and PM2.5 emissions of the vehicle body are the highest of the parts considered. The SOX and NMVOC emissions of the fuel cell stack are the highest of the parts considered. The main body accounts for a large proportion of the mass and mainly consumes iron ore, which results in relatively lower emissions of SOX and NMVOC. The fuel cell stack contains dozens of grams of platinum, which requires dozens of tons of ore to be processed. Although the mass of platinum is small, large amounts of SOX and NMVOC are generated due to approximately 100 refining processes.
In the parts manufacturing stage, the environmental emissions from eighteen main parts of the FCV are shown in Figure 7. It is found that the fuel cell stack has higher proportion than other parts in all the considered emissions, especially the proportion of NMVOC from the fuel stack is up to 96%.

3.2. Characterization Results

Based on the seven impact assessment indicators introduced in Section 2.3, we analyze the life cycle environmental impact of Toyota Mirai, and the characterization results are shown as following.

3.2.1. Mineral Resource Consumption

The results of the mineral resource consumption (ADP (e)) for the life cycle of Toyota Mirai are presented by Figure 8. It shows that large amounts of mineral resources are consumed during the raw material acquisition stage. Therefore, the characterization results of the mineral resource consumption are fairly high at this stage. Because the material is recycled in the scrap recycling stage, the characterization result is negative. The consumption of mineral resources in other stages is relatively low, so the characterization values are very small.

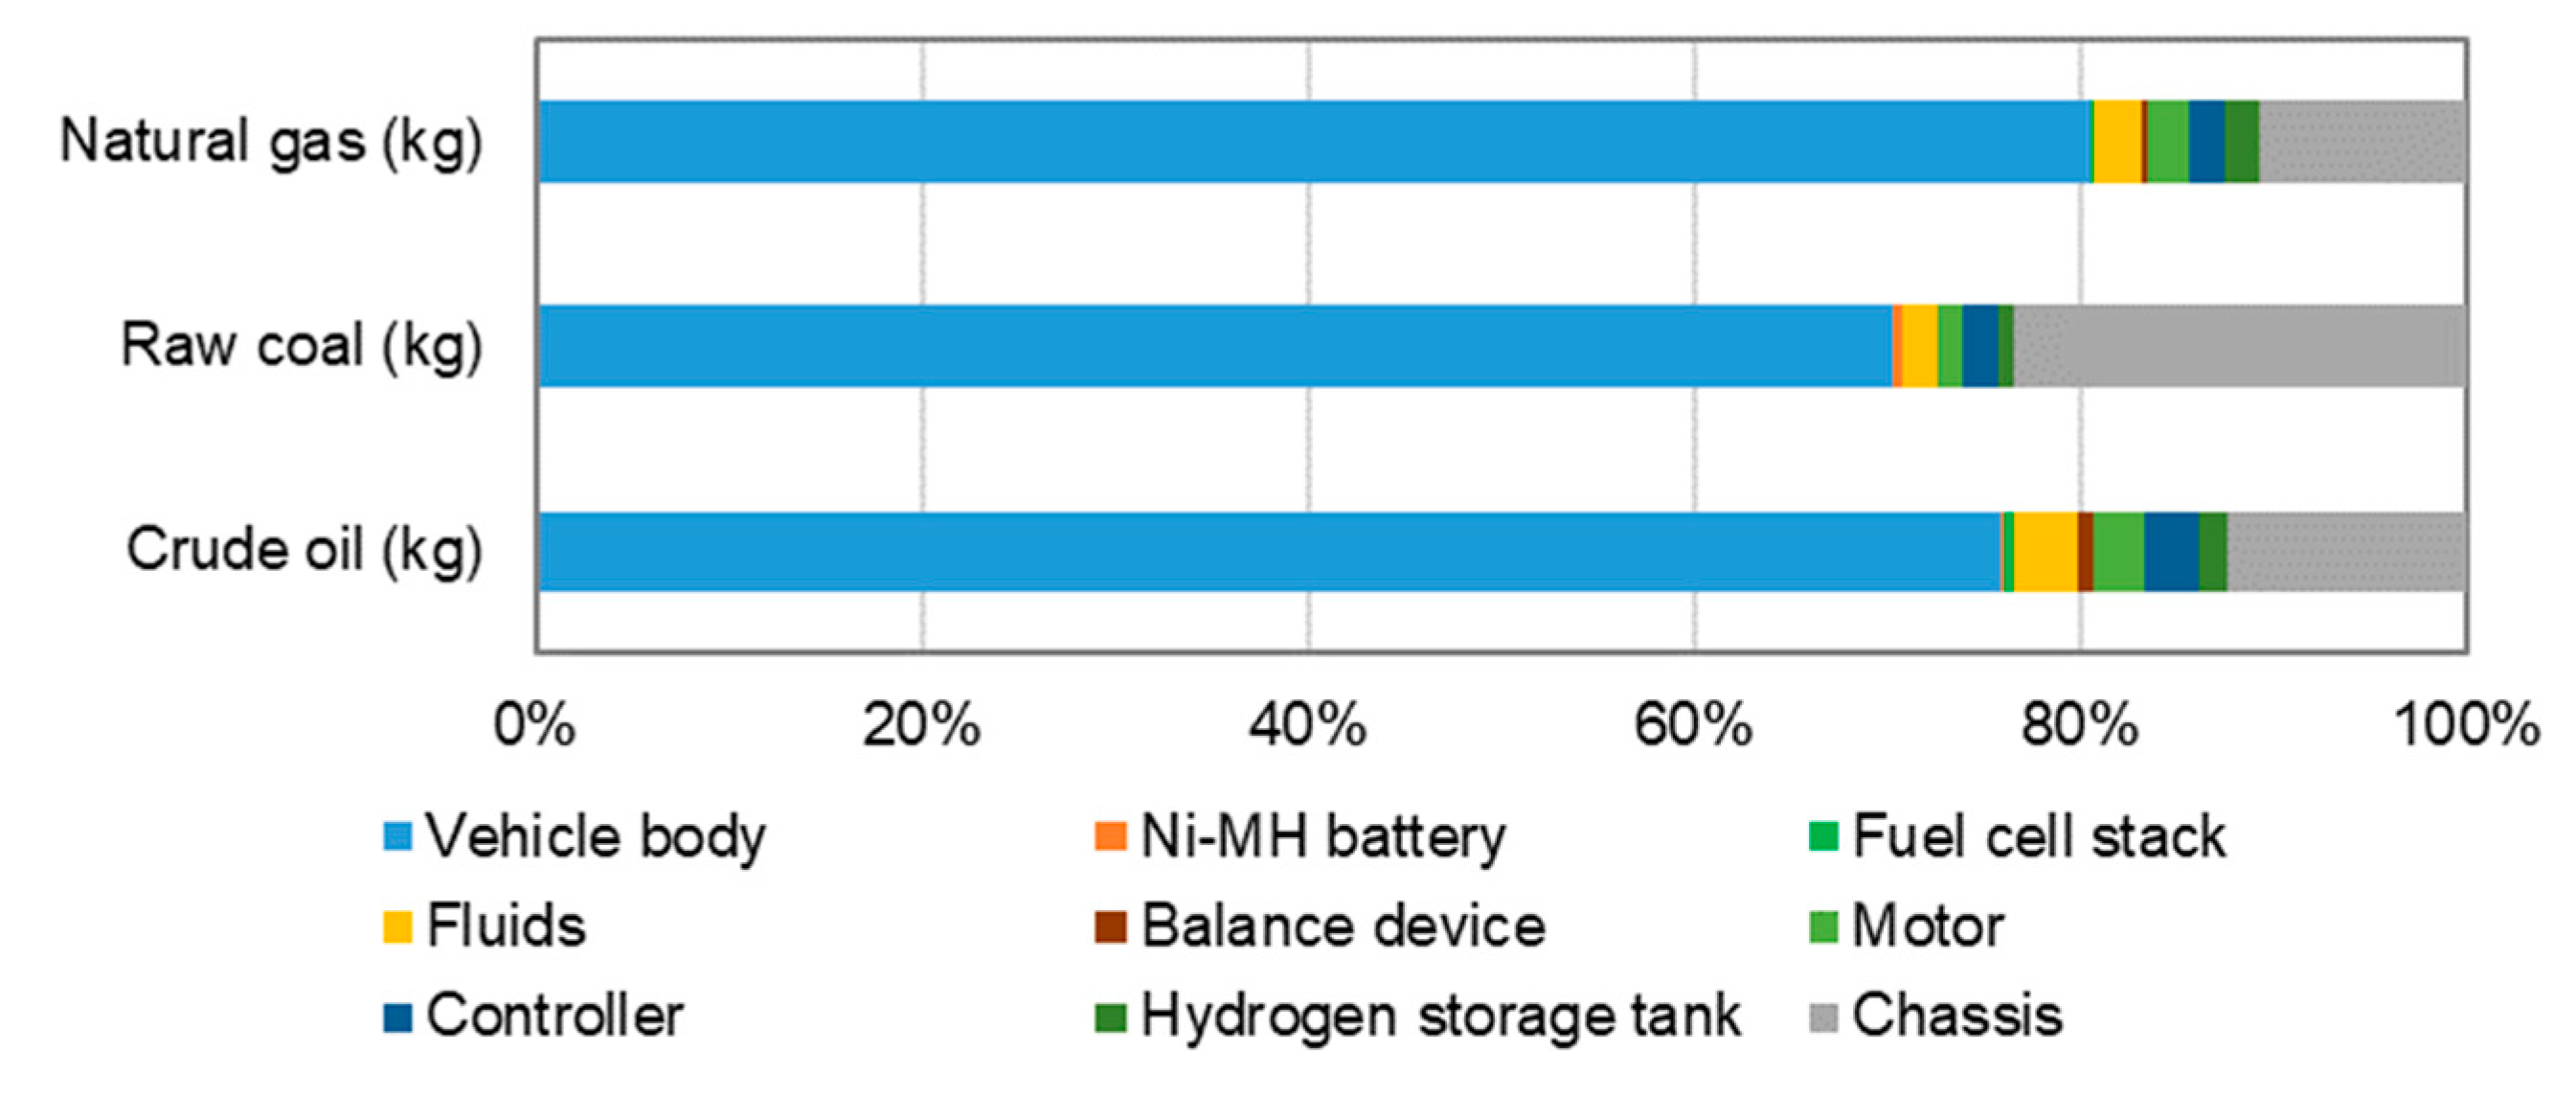
3.2.2. Fossil Energy Consumption

The results of the fossil energy consumption (ADP (f)) for the life cycle of Toyota Mirai are depicted in Figure 9. We find that the dependence on electric power is fairly high during the life cycle of Toyota Mirai. Since the power in China is mainly generated from thermal coal, a large amount of raw coal is consumed and results in the high fossil fuel energy consumption characterization results for all the life cycle stages. This is the main reason why the characterization results of the use and scrap recycling stages are the first highest and the third highest of the six stages, respectively. The power consumption in the raw material acquisition stage is relatively low, but a lot of crude oil is consumed in ore and coal mining, which is the reason why the characterization result of this stage is the second highest of the six stages.

3.2.3. Environmental Emissions

The environmental emissions for the life cycle of Toyota Mirai, including GWP, AP, EP, POCP, and ODP, are presented by Figure 10. It shows that the GWP values are large in the use, recycling and raw material acquisition stages because of the significant CO2 emissions in these three stages. The GWP of the use stage is hundreds of times higher than those of other stages, which is inextricably linked to the "unclean" power structure in China.
Contrary to the original intention of environmental friendliness, the resource consumption and pollutant emissions in the use stage are not ideal for Toyota Mirai that uses hydrogen from the electrolysis. The main problem is that the electrolysis consumes a large amount of electricity. Additionally, the current production efficiency is not high [51]. Therefore, it is necessary to compare different hydrogen production solutions in order to obtain a more ideal hydrogen production scheme.

3.3. Comparison of Four Hydrogen Production Schemes

3.3.1. Inventory Analysis and Data Collection

Based on actual industrial hydrogen production, four reasonably mature hydrogen production schemes are selected for life cycle comparison, i.e., steam methane reforming, methanol steam reforming, electrolysis and catalytic ammonia decomposition. Then we carry out the inventory analysis and data collection.
The inventory data of hydrogen production by electrolysis have already been described in Table 5 (Section 2.4). The main material input inventory data for 1000 Nm3 hydrogen production by other three hydrogen production schemes are shown in Table A1. Note that the data about the energy consumption for the synthesis of ammonia, methane, and methanol are sourced from the 2017 GaBi7 (GaBi ts) database.

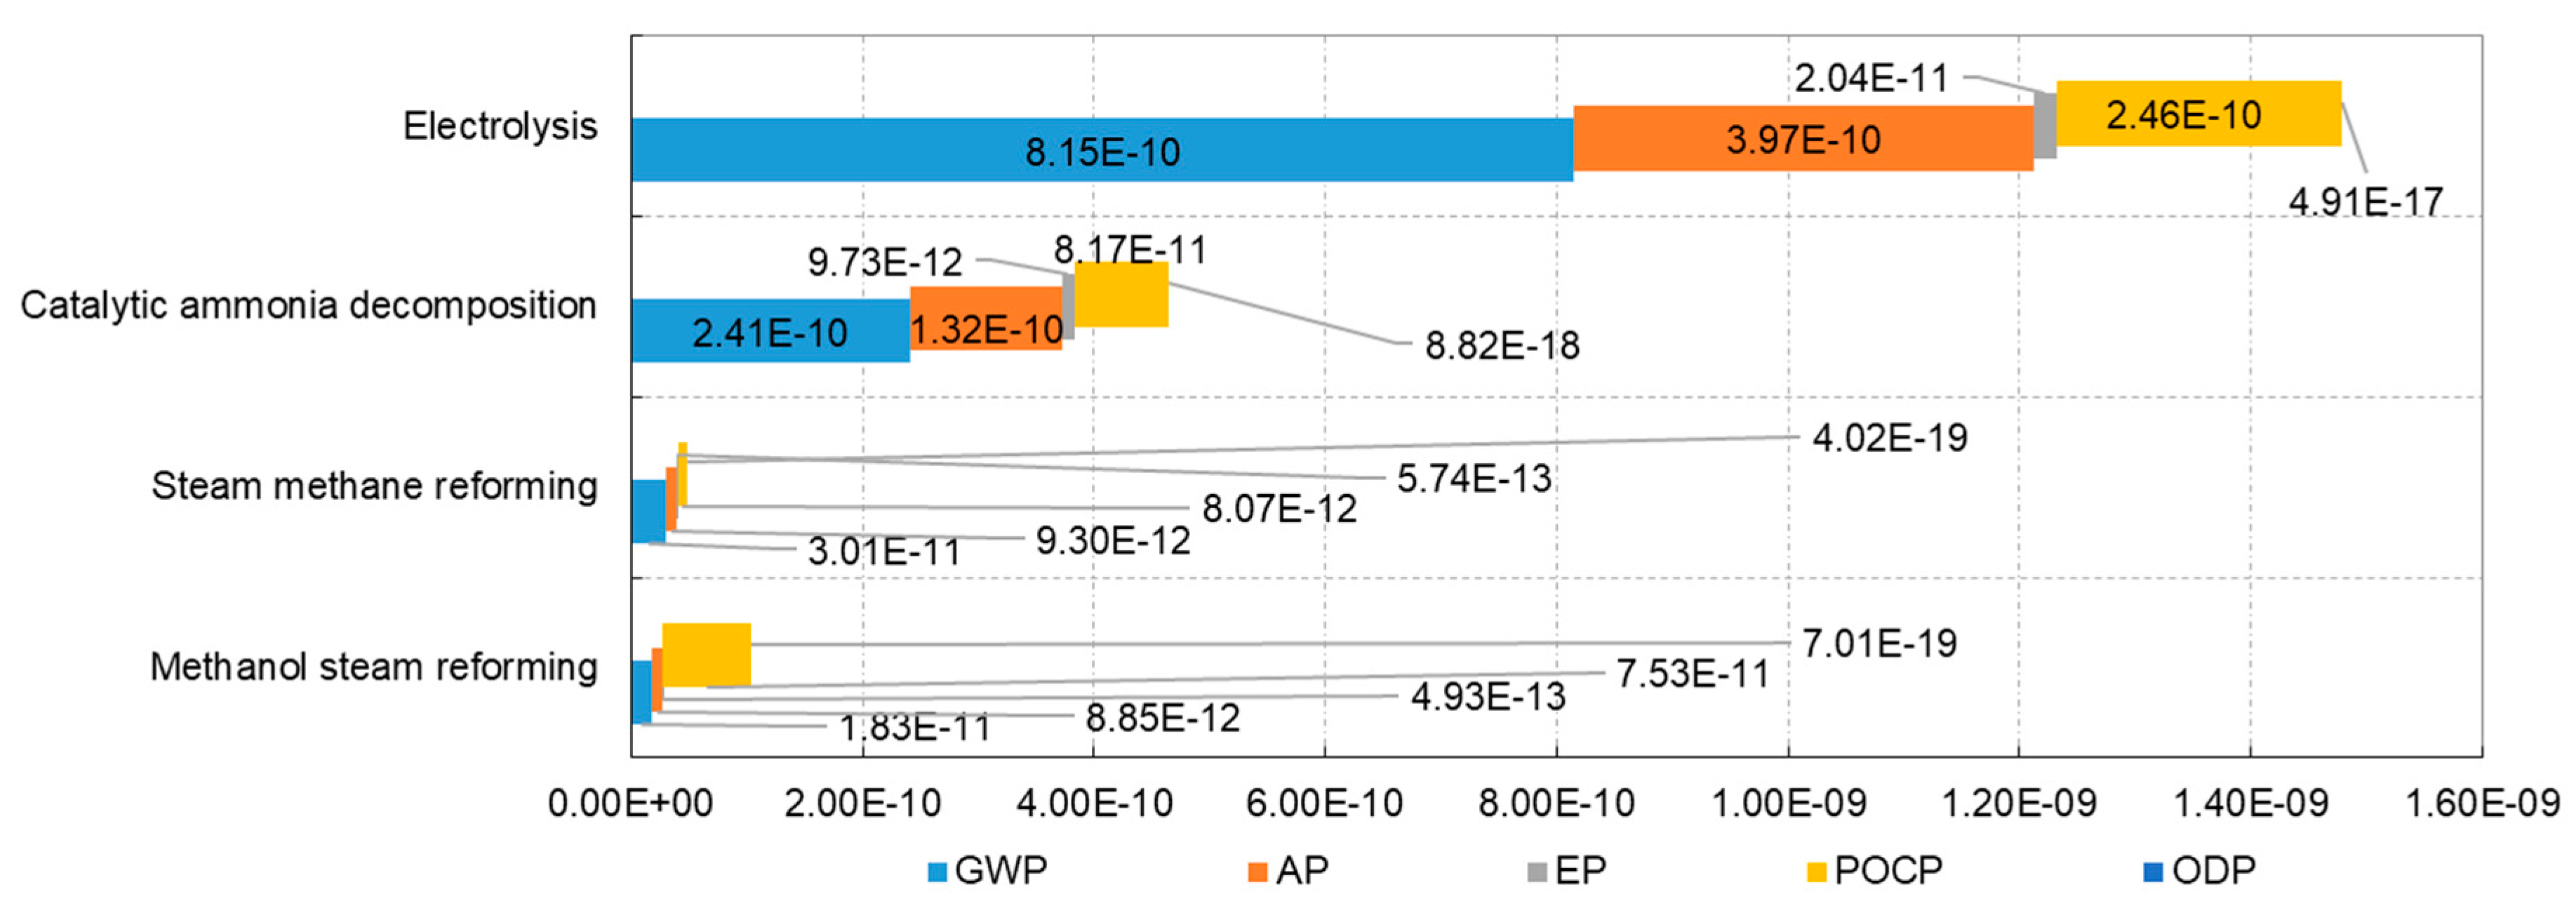
3.3.2. Impact Assessment and Result Analysis

Similar to the electrolysis, we calculate the energy consumption and emissions of the hydrogen production by methanol steam reforming, steam methane reforming and catalytic ammonia decomposition. Likewise, we characterize seven environmental impact indicators of the hydrogen production schemes based on the CML2001 impact assessment method.
The characterization results obtained are shown in Table 7. We find that the electrolysis consumes the most mineral resource (ADP (e)), which is 64.8 times that of methanol steam reforming, 9.1 times that of steam methane reforming and 5.2 times that of catalytic ammonia decomposition. The main reason for these differences is the low hydrogen production efficiency of the electrolysis, which consumes large amounts of mineral energy resources. In terms of fossil energy consumption (ADP (f)), the electrolysis consumes the most fossil energy, i.e., 44.4 times, 3.2 times, and 3.5 times those of methanol steam reforming, steam methane reforming and catalytic ammonia decomposition, respectively. The main reason for these differences is that the electrolysis consumes a large amount of electricity. In China, the proportion of thermal power generation dominated by coal has reached 71.6% [48], and large amounts of oil are consumed during coal mining.
Regarding the environmental impact, to evaluate the four hydrogen production schemes uniformly, we use the normalized datum value in the GaBi database and the weight coefficient from the literature [49] and obtain the normalized and quantitative results of the five environmental impact types of the four hydrogen production schemes (Figure 11). It is found that the impact of the electrolysis on the environment is the highest of the four hydrogen production schemes, 30.83 times that of steam methane reforming that has the lowest environmental impact. The GWP of the electrolysis even exceeds the sum of the environmental impacts of other three hydrogen production schemes.

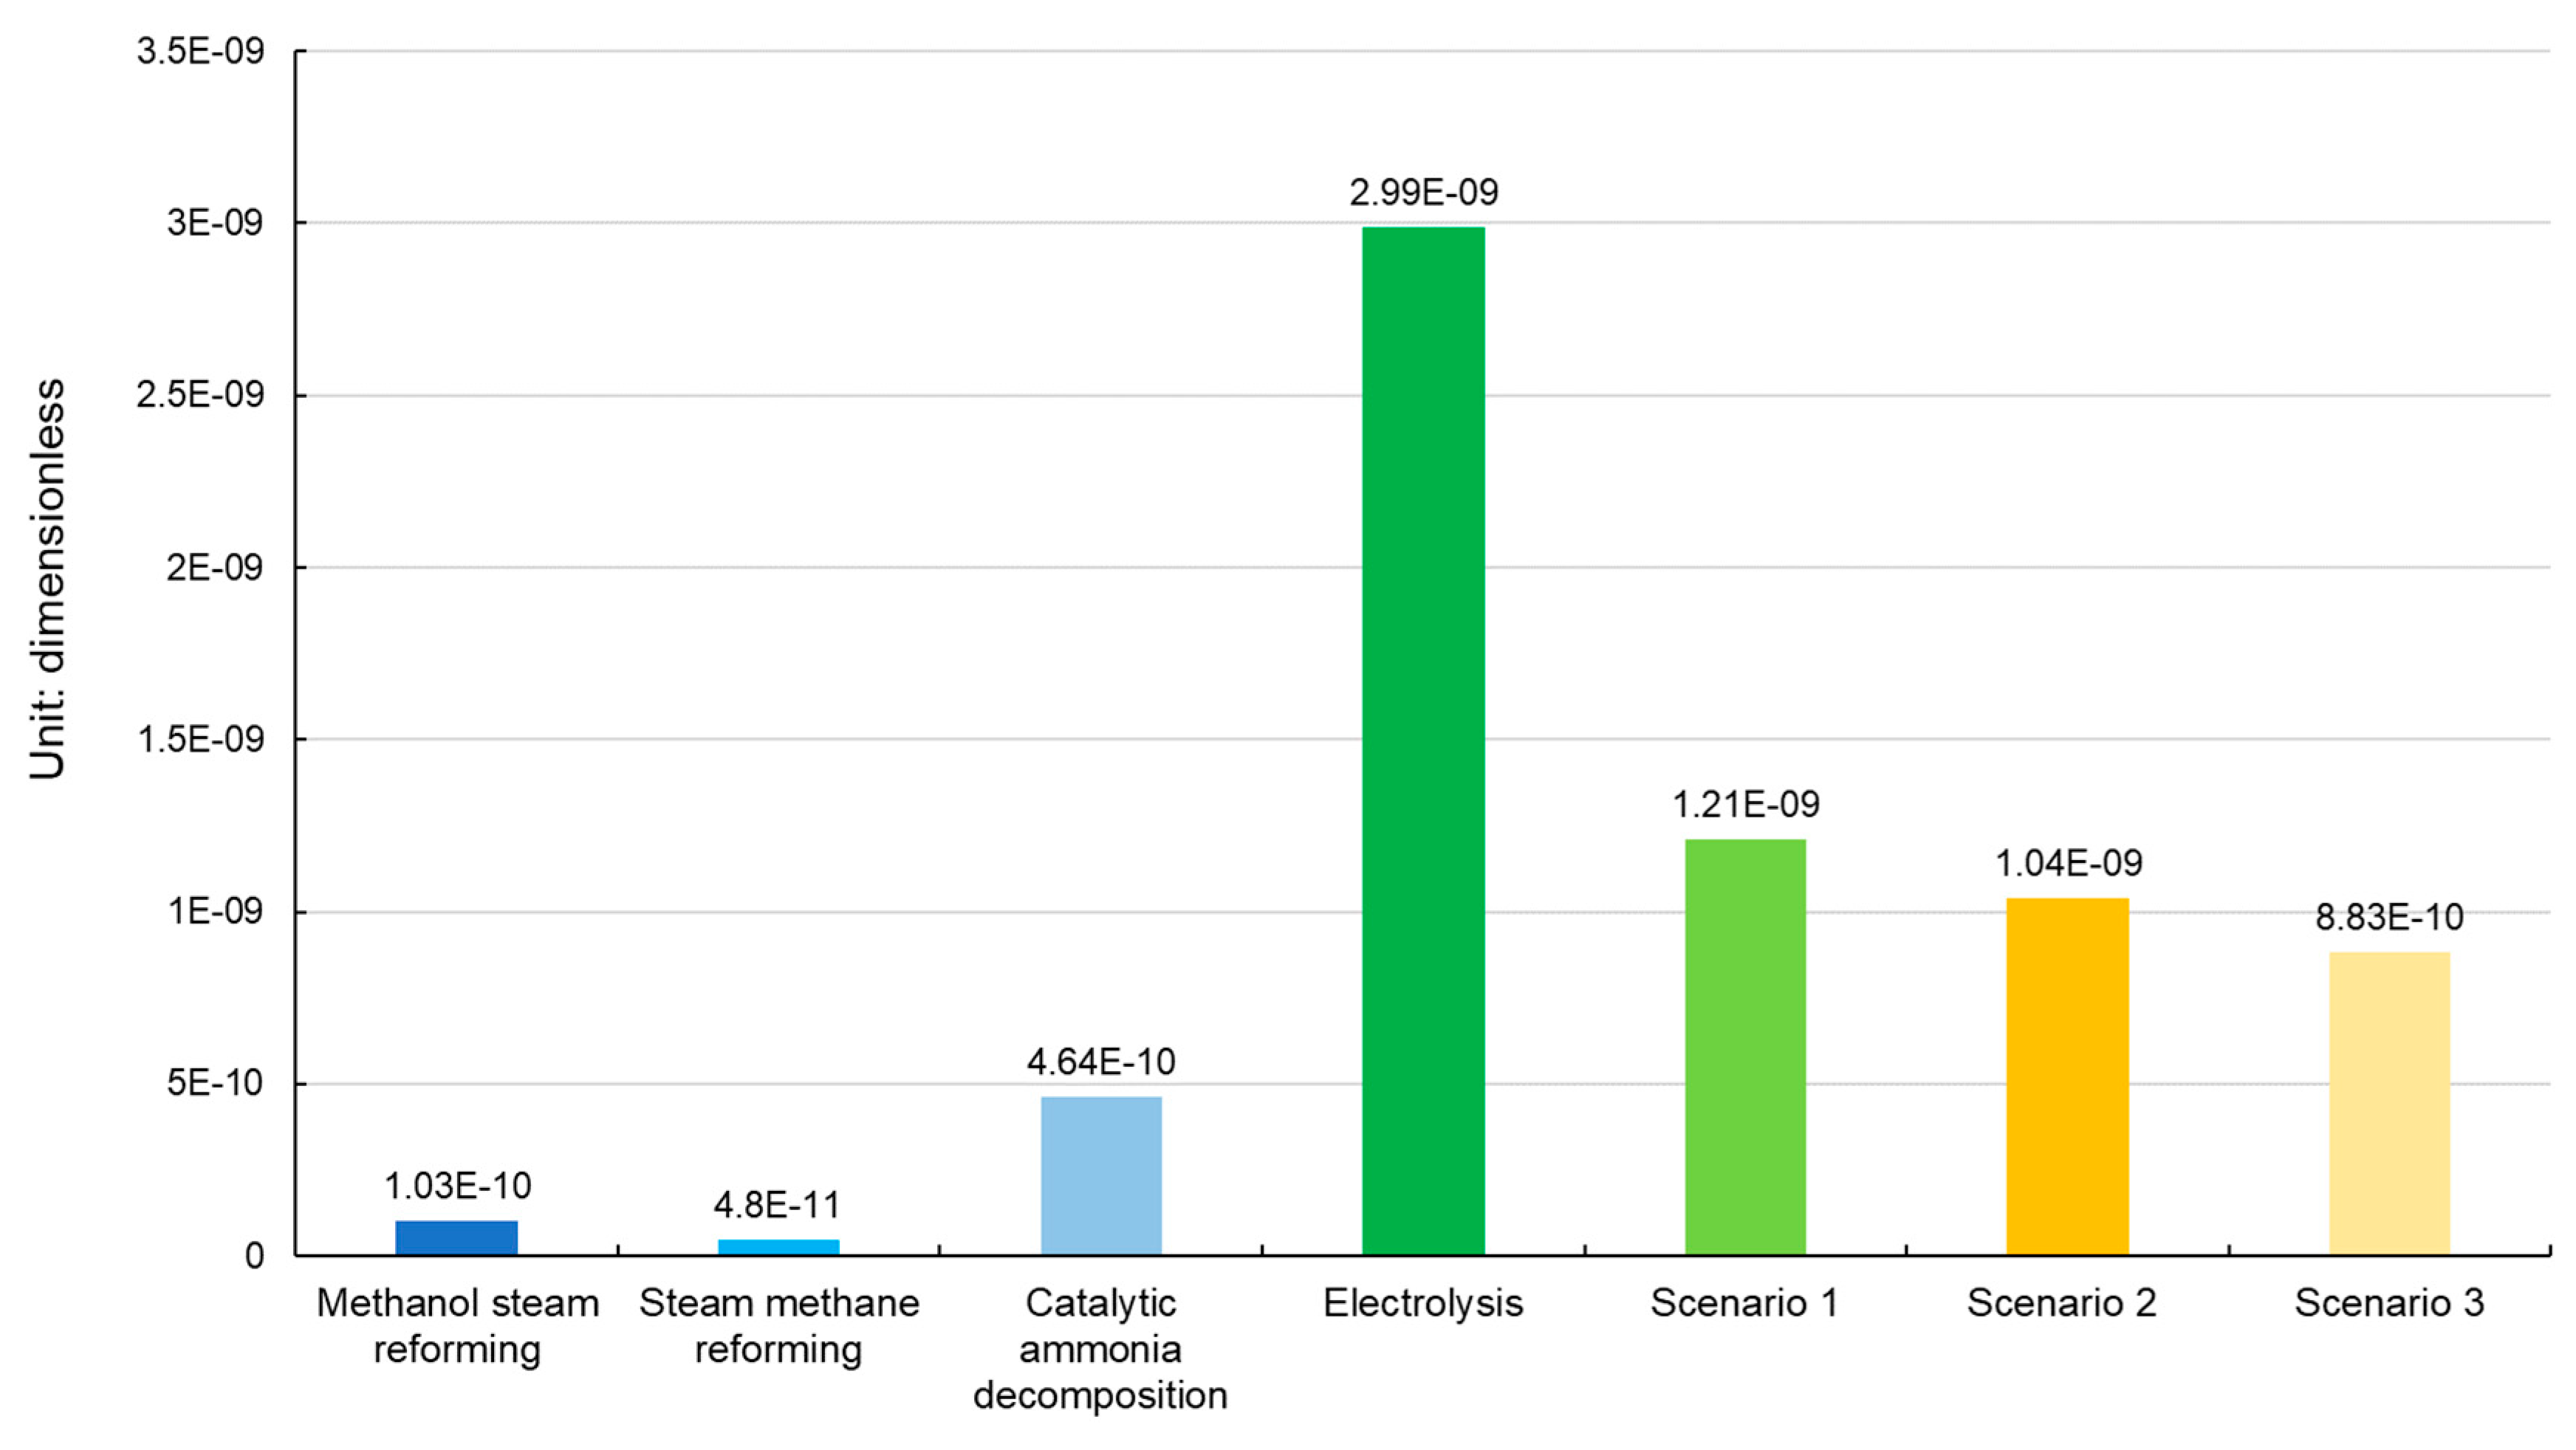
3.4. Scenario Analysis

The results above indicates that the electrolysis consumes large amounts of fossil fuel energy and emits a large amount of CO2, causing the greatest environmental impact of the four hydrogen production schemes. However, with the increasing environmental protection, the proportion of high-emission thermal power generation in the power structure is decreasing. Therefore, it is necessary to take the "power structure" as a variable for optimization to analyze the feasibility of the electrolysis in the future.
The data of China’s current power structure is from the 2016 National Power Industry Statistics Bulletin [48]. The ratio of thermal power is selected as the key factor, and the improvement scenarios of three types of electric structures are provided based on decreasing the proportion of thermal electricity by 10% each time. Since the regional distribution of water resources in China significantly varies and the large-scale construction of hydropower stations poses a negative impact on the ecological environment, it is not realistic to greatly increase the proportion of hydropower, and therefore, there is no adjustment to hydropower in this study. In addition, given the potential dangers of nuclear power generation, we do not adjust nuclear power generation in this study. The current and improved power structures are shown in Table 8.
By substituting the power structure data of various scenarios into the assessment model, we obtain the pollutant emission data under different power structure scenarios. By introducing the CML2001 normalized datum value and weight coefficient, we obtain the results of the comprehensive environmental impacts of the four hydrogen production schemes and the three improved scenarios (Figure 12). It shows that the improvement of the power structure makes the electrolysis method more friendly to the environment. However, even in Scenario 3 that has the lowest environmental impact, the comprehensive environmental impact value of the electrolysis is still two times that of hydrogen production by catalytic ammonia decomposition, while methanol steam reforming and steam methane reforming have even lower impacts on the environment.
After the power generation structure is improved in three steps according to Table 8, the impact of the electrolysis on the environment gradually becomes lower, but the impact of the electrolysis is still higher than other three schemes. However, with the increased environmental awareness and the rise of clean energy power generation, the proportion of thermal power generation is likely to reach an ideal zero in the future. Therefore, we further analyze the impact of the electrolysis on the environment when using a single clean energy power generation.
The modeling data for various single clean energy power generation are adopted from the literature [43]. The comparison results of the environmental impacts of various clean energy power generation for the electrolysis are shown in Table 9.
The environmental impact comparison between the electrolysis from single clean electrical energy and other hydrogen production schemes is shown in Figure 13. It indicates that the order of the comprehensive environmental impacts of various hydrogen production schemes is electrolysis (hydropower) < electrolysis (wind power) < steam methane reforming < methanol steam reforming < electrolysis (solar power) < electrolysis (nuclear power) < electrolysis method (Scenario 3). Hydropower electrolysis has the lowest impact on the environment, followed by wind power electrolysis. Solar and nuclear power electrolysis impose higher impacts on the environment than steam methane reforming and methanol steam reforming.

4. Conclusions

(1) During the life cycle of Toyota Mirai using the hydrogen produced by the electrolysis, the most mineral resources are consumed in the raw material acquisition stage. The most fossil energy is consumed during the use stage as the hydrogen production using the electrolysis consumes a large amount of electricity and has a low production efficiency. In China, the proportion of thermal coal power generation accounts for over 70% of the power structure, and the coal mining consumes large amounts of crude oil. The GWP emissions are fairly high in all the stages, because large amounts of electricity are consumed in all life cycle stages and China’s power structure is not "clean" characterized by large amounts of CO2 emissions during the power generation.
(2) For four commonly used hydrogen production schemes, in China, the electrolysis has the highest environmental impact. Steam methane reforming has the lowest environmental impact, which is only 3.24% that of the electrolysis. The electrolysis has a far greater impact on global warming than other hydrogen production schemes due to China’s power structure dominated by thermal power generation.
(3) Even after the power generation structure is in three steps, i.e., the proportion of thermal power generation is reduced from 71.6% to 41.6%, the environmental impact of the electrolysis is still much higher than that of other three hydrogen production schemes. These findings suggest that if there is no breakthrough in the manner and technology of the upstream energy sources, the electrolysis will be unlikely to be the first choice for an environmentally friendly hydrogen production process.
(4) When a single clean energy source is used for the electrolysis, the environmental impact of hydropower electrolysis is lower than those of other hydrogen production schemes, followed by wind power electrolysis. The environmental impacts of the electrolysis using solar and nuclear power are more than 2.5 times higher than that of steam methane reforming and are slightly higher than that of methanol steam reforming. Note that this work aims at obtaining the most favorable hydrogen production solution based on the environmental impact’s perspective, and thus other pros and cons of these hydrogen production methods are not further discussed.
In summary, if local conditions allow, it will be better for the governmental authorities to carry out pilot projects on the promotion of FCVs using hydro or wind power electrolysis for producing hydrogen. If environment-friendly hydrogen production is widely employed in Chinese transport, the environmental benefits will not only contribute to China but also have a positive effect on world.

Author Contributions

Conceptualization, Y.C.; funding acquisition, Y.C.; investigation, Y.C.; methodology, Y.C.; writing—original draft, Y.C., X.H. and J.L.; writing—review and editing, X.H. and Y.C.

Funding

This research is supported by the National Nature Science Foundation of China (No. 71173072); Shaanxi natural science basic research project (No. 2017JQ7003); Youth Fund for Humanities and social sciences of the Ministry of Education of China (No. 16YJCZH008); Shaanxi Social Science Fund (No. 2016R027); Funding for basic research business fees in Central Universities of China (No. 310822171001 and No. 310822170661).

Acknowledgments

Highly grateful thanks to the anonymous referees for the very valuable comments.

Conflicts of Interest

The authors declare they have no conflict of interest. The funders had no role in the design
of the study, in the collection, analysis or interpretation of data, in the writing of the manuscript or in the decision to publish the results.

Appendix

Table A1. Main consumption by other three hydrogen production schemes (1000 Nm3 hydrogen) [47,52].
Steam Methane ReformingMethanol Steam ReformingCatalytic Ammonia Decomposition
Consumption DescriptionSpecificationConsumption qty.Consumption DescriptionSpecificationConsumption qty.Consumption DescriptionSpecificationConsumption qty.
Natural gas processCH4 >90%520 Nm3Refined methanolGB338-92 first grade580 kgLiquid ammonia/600 kg
Catalyst and desulfurizer/0.625 kgDesalted waterBoiler water standard and Cl- < 3 ppm350 kgCatalyst/0.1 kg
Fuel gas/480 Nm3Catalyst/0.4 kgElectricity380/220 V, 50 Hz1400 kWh
Low pressure vapor/1.27 kgConduction oilMax heating temperature: 320 °C0.35 kgCirculating cooling waterPressure: 0.3~0.4 MPa, Temp.: 27~32 °C75 t
Soft waterBoiler water standard1.67 tHydrogenH2 ≥ 99.5%800 Nm3/
Electricity380/220 V, 50 Hz166 kWhNitrogenO2 ≤ 0.2%400 Nm3
Circulating cooling waterPressure: 0.3~0.4 MPa, Temp.: 27~32 °C27 tElectricity380/220 V, 50 Hz90 kWh
Instrument air/42 Nm3Circulating cooling waterPressure: 0.3~0.4 MPa, Temp.: 27~32 °C30 t
/Fuel coal/0.25 kg
Instrument air (Nm3)/200

References

  1. Liu, F.; Zhao, F.; Liu, Z.; Hao, H. The impact of fuel cell vehicle deployment on road transport greenhouse gas emissions: The China case. Int. J. Hydrogen Energy 2018, 43, 22604–22621. [Google Scholar] [CrossRef]
  2. Yamada, Y.; Ariyama, Y.; Ino, H. Energy consumption and CO2 emissions in fuel cell vehicles: Comparison of gasoline and natural gas. J. Jpn. Inst. Met. Mater. 2005, 69, 237–240. (In Japanese) [Google Scholar] [CrossRef]
  3. Bauer, C.; Hofer, J.; Althaus, H.J.; Del Duce, A.; Simons, A. The environmental performance of current and future passenger vehicles: Life Cycle Assessment based on a novel scenario analysis framework. Appl. Energy 2015, 157, 871–883. [Google Scholar] [CrossRef]
  4. Tong, F.; Jaramillo, P.; Azevedo, I.M.L. Comparison of Life Cycle Greenhouse Gases from Natural Gas Pathways for Light-Duty Vehicles. Energy Fuel 2015, 29, 6008–6018. [Google Scholar] [CrossRef]
  5. Hussain, M.M.; Dincer, I.; Li, X. A preliminary life cycle assessment of PEM fuel cell powered automobiles. Appl. Therm. Eng. 2007, 27, 2294–2299. [Google Scholar] [CrossRef]
  6. Granovskii, M.; Dincer, I.; Rosen, M.A. Life cycle assessment of hydrogen fuel cell and gasoline vehicles. Int. J. Hydrogen Energy 2006, 31, 337–352. [Google Scholar] [CrossRef]
  7. Lin, T.; Wu, Y.; He, X.; Zhang, S.; Hao, J. Well-to-Wheels Fossil Energy Consumption and CO2 Emissions of Hydrogen Fuel Cell Vehicles in China. Environ. Sci. 2018, 39, 3946–3953. (In Chinese) [Google Scholar]
  8. Xu, S.; Dong, C. Research on Energy Consumption and Emission of Vehicle in the Whole Life Cycle Based on GREET. Automob. Technol. Mat. 2014, 02, 10–13. (In Chinese) [Google Scholar]
  9. Bicer, Y.; Dincer, I. Comparative life cycle assessment of hydrogen, methanol and electric vehicles from well to wheel. Int. J. Hydrogen Energy 2017, 42, 3767–3777. [Google Scholar] [CrossRef]
  10. Offer, G.J.; Howey, D.; Contestabile, M.; Clague, R.; Brandon, N.P. Comparative analysis of battery electric, hydrogen fuel cell and hybrid vehicles in a future sustainable road transport system. Energy Policy 2010, 38, 24–29. [Google Scholar] [CrossRef] [Green Version]
  11. Granovskii, M.; Dincer, I.; Rosen, M.A. Economic and environmental comparison of conventional, hybrid, electric and hydrogen fuel cell vehicles. J. Power Sources 2006, 159, 1186–1193. [Google Scholar] [CrossRef]
  12. Miotti, M.; Hofer, J.; Bauer, C. Integrated environmental and economic assessment of current and future fuel cell vehicles. Int. J. Life Cycle Assess. 2017, 22, 94–110. [Google Scholar] [CrossRef]
  13. Evangelisti, S.; Tagliaferri, C.; Brett, D.J.L.; Lettieri, P. Life cycle assessment of a polymer electrolyte membrane fuel cell system for passenger vehicles. J. Clean Prod. 2017, 142, 4339–4355. [Google Scholar] [CrossRef]
  14. Song, Y.; Wang, X.; Bi, S.; Wu, J.; Qiu, S. Assessment of fuel cell bus hydrogen energy system. Acta Energ. Sol. Sin. 2018, 39, 651–658. (In Chinese) [Google Scholar]
  15. Ahmadi, P.; Kjeang, E. Comparative life cycle assessment of hydrogen fuel cell passenger vehicles in different Canadian provinces. Int. J. Hydrogen Energy 2015, 40, 12905–12917. [Google Scholar] [CrossRef]
  16. Li, Q.; Yang, J.; Li, Q.; Zhang, L.; Wang, L. Life Cycle Assessment of Hydrogen Sources of Fuel Cell Vehicles. Res. Environ. Sci. 2003, 03, 59–61. (In Chinese) [Google Scholar]
  17. Zhu, H.; Yu, Z. Life Cycle Assessment of Hydrogen Pathways for Fuel Cell Vehicles. J. Tongji Univ. 2017, 45, 138–143, 151. (In Chinese) [Google Scholar] [CrossRef]
  18. Suleman, F.; Dincer, I.; Agelin-Chaab, M. Comparative impact assessment study of various hydrogen production methods in terms of emissions. Int. J. Hydrogen Energy 2016, 41, 8364–8375. [Google Scholar] [CrossRef]
  19. Hajjaji, N.; Pons, M.N.; Renaudin, V.; Houas, A. Comparative life cycle assessment of eight alternatives for hydrogen production from renewable and fossil feedstock. J. Clean Prod. 2013, 44, 177–189. [Google Scholar] [CrossRef]
  20. Yoo, E.; Kim, M.; Song, H.H. Well-to-wheel analysis of hydrogen fuel-cell electric vehicle in Korea. Int. J. Hydrogen Energy 2018, 43, 19267–19278. [Google Scholar] [CrossRef]
  21. Huang, Z.; Zhang, X. Well-to-wheels analysis of hydrogen based fuel-cell vehicle pathways in Shanghai. Energy 2006, 31, 471–489. [Google Scholar] [CrossRef]
  22. Hwang, J.J. Sustainability study of hydrogen pathways for fuel cell vehicle applications. Renew. Sustain. Energy Rev. 2013, 19, 220–229. [Google Scholar] [CrossRef]
  23. Kong, D.; Tang, W.; Liu, W.; Wang, M. Energy Consumption, Emissions and Economic Evaluation of Fuel Cell Vehicles. J. Tongji Univ. 2018, 46, 498–503, 523. (In Chinese) [Google Scholar]
  24. Bhandari, R.; Trudewind, C.A.; Zapp, P. Life cycle assessment of hydrogen production via electrolysis—A review. J. Clean Prod. 2014, 85, 151–163. [Google Scholar] [CrossRef]
  25. Zhao, G.; Pedersen, A.S. Life Cycle Assessment of Hydrogen Production and Consumption in an Isolated Territory. Procedia CIRP 2018, 69, 529–533. [Google Scholar] [CrossRef]
  26. Ally, J.; Pryor, T. Life-cycle assessment of diesel, natural gas and hydrogen fuel cell bus transportation systems. J. Power Sources 2007, 170, 401–411. [Google Scholar] [CrossRef] [Green Version]
  27. Simons, A.; Bauer, C. A life-cycle perspective on automotive fuel cells. Appl. Energy 2015, 157, 884–896. [Google Scholar] [CrossRef]
  28. Thomas, C.E. Fuel Cell and Battery Electric Vehicles Compared. Int. J. Hydrogen Energy 2009, 34, 6005–6020. [Google Scholar] [CrossRef]
  29. Hao, H.; Mu, Z.; Liu, Z.; Zhao, F. Abating transport GHG emissions by hydrogen fuel cell vehicles: Chances for the developing world. Front. Energy 2018, 12, 466–480. [Google Scholar] [CrossRef]
  30. Toyota Mirai Block Diagram: Detailed Fuel Cell Technology. Available online: https://wenku.baidu.com/view/16164da4a32d7375a41780cf.html (accessed on 5 January 2019). (In Chinese).
  31. Toyota Mirai Major Tables. Available online: https://toyota.jp/pages/contents/mirai/001_p_002/pdf/spec/mirai_spec_201801.pdf (accessed on 11 January 2019). (In Japanese).
  32. Lane, B.; Shaffer, B.; Samuelsen, G.S. Plug-in fuel cell electric vehicles: A California case study. Int. J. Hydrogen Energy 2017, 42, 14294–14300. [Google Scholar] [CrossRef]
  33. Universiteit Leiden. CML-IA Characterisation Factors. Available online: http://www.leidenuniv.nl/cml/ssp/databases/cmlia/cmlia.zip (accessed on 10 December 2018).
  34. Zackrisson, M.; Avellan, L.; Orlenius, J. Life cycle assessment of lithium-ion batteries for plug-in hybrid electric vehicles—Critical issues. J. Clean Prod. 2010, 18, 1519–1529. [Google Scholar] [CrossRef]
  35. Li, X. Research on Life Cycle Assessment of Scrapped Vehicle Based on GaBi Software. Master’s Thesis, Nankai University, Tianjin, China, 2011. (In Chinese). [Google Scholar]
  36. Li, J. Life Cycle Assessment and Analysis between Power System of Gas Car and Battery Electric Vehicles. Master’s Thesis, Hunan University, Changsha, China, 2014. [Google Scholar]
  37. Vehicle-IA. Available online: http://cdmd.cnki.com.cn/Article/CDMD-10532-1016309978.htm (accessed on 25 May 2019). (In Chinese).
  38. Chen, Y.; Yang, Y.; Li, X.; Dong, H.; Bai, R. Life Cycle Resource Consumption of Automotive Power Seats. Int. J. Environ. Stud. 2014, 71, 449–462. [Google Scholar] [CrossRef]
  39. Li, S. Life Cycle Assessment and Environmental Benefits Analysis of Electric Vehicles. Ph.D. Thesis, Jilin University, Changchun, China, 2014. [Google Scholar]
  40. Hu, X. Research on Performance Evaluation of Energy-saving and Emission Reduction of Plug-in Hybrid Electric Vehicle Based on Vehicle-IA and GaBi Platform. Bachelor’s Thesis, Chang’an University, Xi’an, China, 2017. [Google Scholar]
  41. Zhang, L.; Xu, G.; Zhang, W.; Zhang, C.; Wei, C. Life Cycle Assessment of Vice Dashboard Assembly of Automobile. J. Automot. Eng. 2015, 5, 263–269. (In Chinese) [Google Scholar]
  42. Yang, D.; Liu, J.; Yang, J.; Ding, N. Carbon footprint analysis of passenger car radial tires. China Popul. Resour. Environ. 2014, 24, 110–114. (In Chinese) [Google Scholar]
  43. Burnham, A.; Wang, M.; Wu, Y. Development and Application of GREET 2.7—The Transportation Vehicle-Cycle Model; Argonne National Laboratory: Chicago, IL, USA, 2006. [Google Scholar]
  44. Papasavva, S.; Kia, S.; Claya, J.; Gunther, R. Life Cycle Environmental Assessment of Paint Processes. J. Coat. Technol. 2002, 74, 65–76. [Google Scholar] [CrossRef]
  45. Yang, S. Ways to ensure successful drawing process for automobile panel. Die Mould Technol. 2014, 02, 44–48. (In Chinese) [Google Scholar]
  46. Hu, W. Study on the Characterization Method for Ni-MH Batteries Performance. Master’s Thesis, Tianjin University, Tianjin, China, 2006. [Google Scholar]
  47. Chen, S.; Chen, M. A Review on the Economy, Environmental Impact and Energy Efficiency Assessment for Clean-Energy Based on Life Cycle Analysis. J. Automot. Eng. 2008, 30, 465–469. (In Chinese) [Google Scholar]
  48. Electric Power Industry Statistics Compiled 2016. Available online: http://www.chinabookshop.net/electric-power-industry-statistics-compiled-2016-p-25839.html?osCsid=fchmcncjr6msrr7e746oplv421 (accessed on 25 May 2019). (In Chinese).
  49. Gao, Y.; Wang, J.; Zhu, Y.; Zhou, W. Research on Environmental Impact of Vehicle Power Battery Recycling. Automob. Parts 2014, 20, 41–43. (In Chinese) [Google Scholar]
  50. Cao, D.; Chu, C. Life Cycle Assessment and Its Application in Automotive Exhaust Emission Field. Automob. Technol. 2006, 2, 43–46. (In Chinese) [Google Scholar]
  51. Jiang, S.; Hao, H.; Chen, Y. Research on Carbon Emissions in Manufacturing Process of Lithium Ion Battery for Vehicles. In Proceedings of the 7th Annual Conference on Energy Economics and Management, Nanjing, China, 14–16 October 2016. [Google Scholar]
  52. Liu, Y. Comparison and Selection of Process of Hydrogen Production. Chem. Bioeng. 2007, 24, 72–74. (In Chinese) [Google Scholar]
Figure 1. System boundaries.
Energies 12 03031 g001
Figure 2. Energy consumption at all stages of the life cycle.
Energies 12 03031 g002
Figure 3. Component-wise energy consumption in the raw material acquisition stage for the FCV.
Energies 12 03031 g003
Figure 4. Component-wise energy consumption during the parts manufacturing stage for the FCV.
Energies 12 03031 g004
Figure 5. Emissions of various stages in the life cycle.
Energies 12 03031 g005
Figure 6. Statistics of environmental emissions for various parts during raw material acquisition.
Energies 12 03031 g006
Figure 7. Environmental emissions from the manufacturing stage of major parts of the FCV.
Energies 12 03031 g007
Figure 8. Results of the mineral resource consumption for the life cycle of Toyota Mirai.
Energies 12 03031 g008
Figure 9. Results of the fossil fuel energy consumption for the life cycle of Toyota Mirai.
Energies 12 03031 g009
Figure 10. Environmental emissions for the life cycle of Toyota Mirai.
Energies 12 03031 g010
Figure 11. Normalized and quantitative results of five types of environmental impacts of the four hydrogen production schemes.
Energies 12 03031 g011
Figure 12. Comprehensive environmental impact of four hydrogen production schemes and the three improved scenarios.
Energies 12 03031 g012
Figure 13. Environmental impact comparison between the electrolysis from single clean electrical energy and other hydrogen production schemes.
Energies 12 03031 g013
Table 1. Main parameters of Toyota Mirai.
Main ParametersVehicle MassBattery Type0–100 km/h AccelerationMax. SpeedDriving RangeHydrogen Consumption per 100 km
Value1850 kgNi-MH battery9.6 s175 km/h486 km0.85 kg
Data sources[32][31][31][32][31][31]
Table 2. Mass of vehicle parts and fluids (kg).
Vehicle bodyFuel cellEnergy storage batteryHydrogen storage tankBalancing deviceTotal mass
1568.5773.522.1106.5679.271850
Fluid
LubricantBrake fluidCoolantWiper liquidAdditiveTotal
3.90.910.42.713.631.5
Table 3. Summary of inventory data for raw material acquisition and parts manufacturing.
(a)
(a)
Body
Mass (kg)
Body822.85
Glass35
ComponentEnergy consumption (electric power) (MJ/kg)ComponentEnergy consumption (electric power) (MJ/kg)
Hood assembly1.47870Front side door assembly1.97488
Hood external panel0.41143Front door external panel0.36142
Hood internal panel0.41142Front door internal panel0.94754
Hood welding0.65585Welding0.66592
Top cover assembly1.19360Rear side door assembly1.97488
Top cover0.35897Engine compartment assembly2.05793
Front and rear cover beams0.75953Parts processing1.82428
Top cover welding0.07509Welding0.23365
Fender and lateral assembly5.07587Front battery bracket assembly1.00612
Fender0.94252Rear battery bracket assembly1.00612
L&R outer panel1.56238Cowl panel assembly1.14528
Pillar A0.94756Back panel assembly1.14528
Pillar B0.94754Floor assembly4.28929
Welding0.67588Front floor assembly2.07985
Trunk cover assembly3.17803Rear floor assembly2.07985
Outer decklid1.34565Assembly0.12959
Inner decklid1.10479Body assembly0.73594
Welding0.72760//
(b)
(b)
InteriorPowertrainBatteryChassis
Power seat27.01 (kg)Motor29 (kg)Energy storage battery22.1 (kg)Bracket29.9 (kg)
Dashboard3.7 (kg)Controller21.5 (kg)Fuel cell73.5 (kg)Drive shaft84.25 (kg)
Energy consumption (kWh)Energy consumptionElectric energy
(MJ/kg)
Thermal energy
(MJ/kg)
Energy consumptionElectricity
(MJ/kg)
Thermal energy
(MJ/kg)
Differential 35.25 (kg)
Motor/Stator6.56472.0300Energy storage battery5.48 (kg)3.64 (kg)Suspension system51.15 (kg)
Skeleton/Armature winding5.33052.0300Fuel cellElectricity
(MJ/kg)
Thermal energy
(MJ/kg)
Brake system48.45 (kg)
Headrest/Iron core0.54640Proton exchange membrane1.150.71Wheels51.65 (kg)
Slideway/Stator assembly0.68790Gas diffusion layer239.4589.176Tires40.8 (kg)
Angle adjuster/P-m rotor56.15096.7784Catalyst coating0.60070.0905Steering system32.55 (kg)
Memory device/Motor shaft3.83872.7712Catalyst membrane512.50Electricity
(MJ/kg)
Thermal energy
(MJ/kg)
Horizontal actuator/Electromotor shell4.15772.0881MEA assembly5.510
Seat cushion assembly/assembly0.51670Bipolar plate22.24860Spring0.2142292.771318
Skin assembly/Energy consumption (kWh)Energy consumption (kWh)
Decorative plastic/Wiring harness/Rims2.6825710Assembly0.0840270
Switch box/Total100Spokes1.2581920Tires2.34950
(c)
(c)
Other partsMass (kg)Electric energy (MJ/kg)Other partsMass (kg)Electric energy (MJ/kg)Other partsMass (kg)Electric energy (MJ/kg)
Decorative and blocking parts22.233 00Powertrain cooling system24.042.00Emission control element9.984.40
Heating ventilation and air conditioning (HVAC)19.960 65Discharge system44.914.50Chassis electric system9.984.40
Internal electric system9.984.40Power assembly electric system9.984.40///
Hydrogen storage tank
ComponentsElectric energy (MJ/kg)Thermal energy (MJ/kg)
Composite coating16.20
Carbon fiber resin12.870
Aluminum foil lining16.4220
Table 4. Electricity and thermal energy consumption in the vehicle assembly stage [45,46] (MJ/kg).
CoatingAir Conditioning and LightingHeatingMaterial HandlingWeldingWorkshop Compressed Air
Energy 2.722.18/0.450.610.9
Thermal energy//2.03///
Table 5. Main consumption of hydrogen production by electrolysis (1000 Nm3 hydrogen) [47,48].
ItemSpecificationConsumption
Desalinated water (kg)Suitable for boiler and Cl- < 3 ppm820
Electricity (kWh)380/220 V, 50 Hz5500
Table 6. Service duration and replacement times of parts during the maintenance stage [40,43].
Tires
(km)
Fluids
(km)
Wiper Fluid
(km)
Brake Fluid
(km)
Coolant
(km)
Battery
(Number of Cycles)
Service duration 62,500625012,50062,50062,5002000
Replacement times43924443
Table 7. Characterization results of environmental impact of four hydrogen production schemes.
Methanol Steam ReformingSteam Methane Reforming (SMR)Catalytic Ammonia DecompositionElectrolysis
ADP (e) (kg Sb-Eq)2.44E-41.73E-33.07E-30.0158
ADP (f) (MJ)2.79E+43.85E+53.52E+51.24E+6
GWP (kg CO2-Eq)2.78E+34.58E+33.66E+41.24E+5
AP (kg SO2-Eq)11.712.3175525
EP (kg phosphate-Eq)0.8761.0217.336.3
POCP (kg ethene-Eq)15.31.6416.650
ODP (kg R11-Eq)5.79E-103.32E-107.29E-94.06E-8
Table 8. Current and improved power structures (%).
CurrentScenario 1Scenario 2Scenario 3
Thermal power71.6061.6051.6041.60
Hydropower19.7119.7119.7119.71
Nuclear power3.563.563.563.56
Wind power4.029.0214.0219.02
Solar power1.116.1111.1116.11
Total100100100100
Table 9. The environmental impacts of electrolysis with different single clean electricity (dimensionless). GWP: global warming potential; AP: acidizing potential; EP: eutrophication potential; POCP: photochemical ozone creation potential; ODP: ozone depletion potential.
Electrolysis
(Wind Power)
Electrolysis
(Hydropower)
Electrolysis
(Solar Power)
Electrolysis
(Nuclear Power)
GWP2.08E+31.24E+31.06E+4789
AP6.320.75942.56.18
EP0.6840.1133.420.795
POCP0.2560.04553.860.454
ODP3.04E-91.02E-105.75E-81.1E-6
Comprehensive value2.01E-119.01E-121.23E-101.25E-10

