Fundamental Evaluation of Thermal Switch Based on Ionic Wind


Department of Electric and Electronic Systems Engineering, Osaka Institute of Engineering, Osaka 535-8585, Japan
Energies 2019, 12(15), 2963; https://doi.org/10.3390/en12152963
Submission received: 20 June 2019
/
Revised: 28 July 2019
/
Accepted: 30 July 2019
/
Published: 1 August 2019
(This article belongs to the Special Issue Plasma Processes for Renewable Energy Technologies)
Abstract
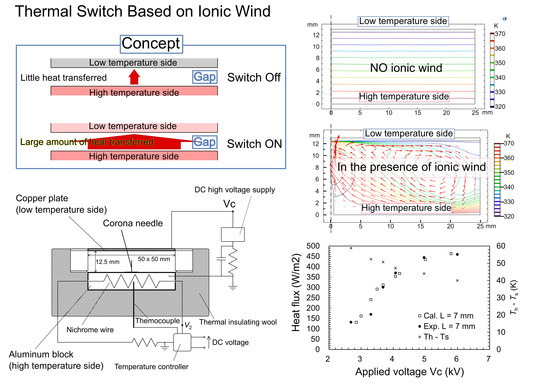
:A significant amount of thermal energy (mainly under 200 °C) is wasted in the world. To utilize the waste heat, efficient heat management and thermal switching is required. The basic characteristics of a thermal switch that controls the flow of heat by switching on/off the ionic wind is discussed in this study. The study was conducted through experiments and numerical simulations. A heater made of aluminum block maintained at 100 °C was used as a heat source, and the rate of heat flow to a copper plate placed over it was measured. Ionic wind was induced by corona discharge with a needle placed on the heater. The ratio of heat transfer coefficients was obtained in the range of 3–4, with an energy efficiency of around 10. The heat flux at this condition was approximately 400 W/m2. The numerical simulations indicate that the heat transfer is enhanced by ionic winds, and the results were found to corroborate well with the experimental ones.
1. Introduction
The global thermal energy waste amounts to a significant fraction of the total energy consumption. For instance, only the industrial sector in Japan is discharging around 3.3 × 10¹⁸ J/y heat as waste [1], despite the enormous efforts that have been put for waste heat recovery since the oil crisis in 1973. In fact, the amount corresponds to approximately 40% of the total energy consumption in Japan [2], indicating that efficient waste heat recovery is crucial to save fossil fuels and reduce CO2 emission.
Therefore, a thermal switch that controls the flow of heat is essential. Literature shows that a thermal switch could stabilize the high temperature at the hot end of a thermoelectric element and improve the electrical output [3]. Further, the low energy conversion efficiency of thermoelectric devices limit their use in a low temperature range (<200 °C, waste heat in this range contributes to 60% of the waste heat from the Japanese industry [1]), and heat energy has to be utilized as heat if possible. However, a thermal switch enables the thermoelectric device to operate in low temperature ranges.
Various thermal switch technologies have been studied in the literature including mechanical control of the contact between two surfaces [3], the phase transition of VO2 between electrical conductor and insulator [4], the use of liquid–vapor phase transition of working fluid [5], and electrowetting of liquid [6,7,8,9]. Nonetheless, the devices are desired to be simple without any moving parts and should be able to control the flow of heat at any temperature to have precise and long-term thermal management for an effective heat recovery. The reported techniques fail to meet all of these requirements in one. Thus, the present author proposes a simple method that uses ionic wind. In this method, the ionic wind induced by corona discharge between two surfaces controls convective heat transfer. The device has a simple structure and can control heat flow at any temperature without any moving part.
It is worth mentioning that heat transfer enhancement by using ionic wind devices has been studied for decades [10,11,12,13,14,15,16,17,18,19]. For example, [18] showed that ionic wind induced by a wire-type discharge electrode enhanced the heat transfer between two of the surfaces that face each other of a rectangular duct (the duct had a primary airstream). Reference [19] showed numerical simulation results that represent the heat transferred by the ionic wind induced by a wire-type corona electrode from heat sources attached on the outer surface of a circular duct to the air inside the duct. However, as for now, those studies have been simply aimed at the enhancement of cooling objects and lack either of the following two requirements as the thermal switch base on ionic wind: (1) the device has both heat emitter and heat receptor surfaces, and (2) heat flow should be as small as possible when corona wind is off (i.e., it has no primary airstream). In this study, a device that met the above-mentioned conditions was prepared, and the basic characteristics of a thermal switch that uses ionic wind were investigated. Particularly, (a) the ratio of heat transfer coefficient between the surfaces in the presence and absence of corona discharge, and (b) the ratio of controlled rate of heat flow to the power consumed by corona discharge were evaluated through experiments and numerical simulations.
2. Materials and Methods
2.1. Experimental Methods
Figure 1 shows the schematic of the setup for thermal switch tests. The temperature of the 10 mm thick and 50 mm square aluminum block was maintained at 100 °C using an embedded nichrome-wire heater and a temperature controller. This configuration supposed a minimum unit that is taken out of a thermal switch which has multiple discharging electrodes in a regular pattern. The electric current and driving voltage of the heater were obtained using voltages V1 and V2 (refer to Figure 1). A 0.5 mm thick copper plate was placed at a vertical distance of 12.5 mm from the block. The heat transfer happened between upper surfaces of the aluminum block and the copper plate. Corona needles with 1 mm diameters and different heights (L = 6–9 mm) were placed at the center on the block. The needles were made from brass and polished with an abrasive compound before use. When high positive DC voltage, Vc, was applied to the copper plate with respect to the aluminum block (connected to the ground), negative ions were generated at the vicinity of the needle tip and ionic wind was induced in the gap. The electric current due to the corona discharge was calculated by measuring the voltage across a 10 kΩ resistor (refer to Figure 1).
The copper plate and the aluminum block were separated with acrylic spacers. To minimize unintended heat conduction (a) the acrylic spacers were placed on an aluminum plate (t = 1 mm) that was connected only at four corners of the square, and (b) 1 mm gaps were provided between the edges of the block and the spacer unit (shown in detailed illustration presented in Figure 1). The set was thermally insulated by using ceramic wool. Because the ceramic wool is permeable to air, the gap space was not strictly sealed, but probably air slightly entered and exited through the 1 mm gap. The complete setup was enclosed in a plastic mesh to restrict any wind from the surrounding without affecting the natural convection over the copper plate.
The temperature at the top surface of the copper plate was measured using a thermographic camera. This temperature could not be measured with contacting probes such as thermocouples because of the high voltage applied to the copper plate. The top surface of the copper plate and the electrode holder was painted with a black paint (suspension of graphite particles, F-142 manufactured by Fine Chemicals Japan Co., Ltd., Tokyo, Japan) to avoid the measurement errors caused by emissivity less than one. Although the Infrared camera can observe the temperature distribution, the standard deviations of the temperature over the copper surface were approximately found to be 0.3 °C. The heat transfer coefficient (K) is defined as,
where Q is the rate of heat flow (in Watt) from the surface of the aluminum block to the copper plate, A is the area of the surfaces between which heat is transferred (equal to the surface area of the aluminum block and the copper plate in the present case), Th is the temperature of the top surface of the aluminum block, and Ts is the average temperature of the top surface of the copper plate. Q was determined by the power supplied to the heater to maintain Th at 100 °C. Further details to determine Q are discussed in the results section.
2.2. Numerical Simulation
Airflow and transfer of heat induced by corona discharge were numerically simulated using finite element method in COMSOL Multiphysics 5.3. The calculations were performed on an axisymmetric region having 25 mm radius, as illustrated in Figure 2. The region was vertically divided into two parts—one part had air (12.5 mm), and the other had copper (0.5 mm). A needle was placed in the air gap such that its axis aligned with the axis of the region and its base touched the bottom surface. The needle consisted of a conical tip (with 2 mm height and 0.05 mm radius of curvature of the tip) and a cylindrical base of 0.5 mm radius. The radius of curvature of the tip was determined from the needle typically used in such experiments (Figure 3). Henceforth, “the tip” indicates the surface that has a radius of curvature of 0.05 mm. The sizes of the elements (for finite element method) at the surface of the needle tip were kept less than 2 μm × 2 μm to calculate ionic flow correctly.
To simulate the corona discharge, electrical potential (V) and negative ion density (Nn) in the air-filled region were estimated using Poisson’s Equation (2) and continuity Equation (3). Further, the space charge was assumed to consist of negative ions of molecular oxygen (O2−) only. Due to two orders of magnitude higher speed of ions than airstream in corona discharge (in general), the effect of airflow on the transportation of ions was neglected.
Here e is the elementary charge, μn is the mobility of the negative ions, and Dn is the diffusion coefficient of the negative ions. Mobility μn was calculated by multiplying Tg/293.15 with the value at 293.15 K (1.69 × 10⁻⁴ m2/V·s) [20,21], where Tg (=(Th + Ts)/2) is the average temperature in the air-filled region. Further, the Einstein’s relation was used to determine Dn using μn at temperature Tg.
The simulations were performed under the following boundary conditions. The boundary conditions for the potential (V) were determined using the Dirichlet conditions (Equations (4) and (5)) at the top surface and the bottom surface including the needle and the Neumann condition (Equation (6)) at the sidewall. Likewise, Neumann boundary condition (Equation (7)) was used for ion density Nn at the top surface of the air-filled region. The ion flux was set to zero at the sidewall (Equation (8)). Further, the ion density at the bottom surface except for the tip of the needle was set to zero (Equation (9)), while the ion density at the tip was set to Nn0 (Equation (10)). The following procedure was followed to determine Nn0: i) first, the corona onset voltage (Vo) was determined for each needle length (L) through experiments, ii) second, the maximum electric field strength (Emax) at the tip of the needle (the field strength when Vo is applied to the needle without the corona discharge) was calculated, and iii) third, Nn0 was adjusted so that the maximum field strength at the tip became Emax when Vc was applied to the needle. This procedure is based on Katpzov’s hypothesis [22] and validated through numerical simulation, e.g., by Umezu et al. [23].
The velocity field (u) of the laminar flow induced by the corona discharge was determined by the Navier–Stokes Equation (11) at a stationary state. The equation uses volume force () exerted by the ion movement and buoyancy force () to determine u. To solve the equation, the wall was considered to have zero slip (Equation (12)). However, the thin opening between the acrylic spacer and the aluminum block (see the experimental setup section) was represented by setting stress normal to the bottom 1 mm part of the sidewall to zero (Equation (13)).
Here ρa is the density of air, p is a static pressure, η is the viscosity of air, and g is the acceleration due to gravity. Air density and viscosity are the functions of temperature and were determined as discussed below.
The temperature field (T) in the air-filled region and at the copper plate was calculated to determine the rate of heat flux. Dissipation Equations (14) and (15) govern the temperature field in the air-filled and the copper-filled regions, respectively. Boundary condition (16) was used at the surface of the heater block and the needle. The experimentally measured value of Ts was used in boundary condition (17). The temperature gradient in the normal direction at the bottom 1 mm opening of the sidewall was set to zero (Equation (18)).
In the above equations, Cp,a is the isobaric specific heat of air, ka and kc are the thermal conductivity of air and copper, respectively. ka approximated by Equation (19) (Reference [24]) at Tg (= (Ts + Th)/2) was used.
3. Results and Discussion
3.1. The Heat Transfer by Natural Convection and Analysis of the Rate of Heat Flow (Q)
In the absence of a needle in the gap, the heat is transferred by natural convection from the heater surface to the copper plate. This section discusses the rate of heat flow (Q) by natural convection. Figure 4 shows the variation of heater powers with respect to elapsed time in two cases: (a) when the copper plate is exposed to the atmosphere, as illustrated in Figure 1, and (b) when the copper plate is insulated from the atmosphere by using ceramic wool. Since a significant amount of heat leaks from the sidewalls and the bottom surface of the heater, the difference in the heater powers in two cases is expected to be equivalent to the rate of heat flow from heater to copper plate by natural convection. The average difference in the heater powers in two cases is 0.36 W (the stabilized heater powers are 6.17 and 5.81 W). The average temperature of the top surface of the copper plate (Ts) is 46.8, while the temperature of the heater (Th) is 101 °C. With this temperature difference, only the thermal conduction provides approximately 0.33 W heat flow. That implies most of the heat is transferred by thermal conduction alone.
Figure 5 shows the result of numerical simulation in the absence of ionic wind in the gap. The temperature gradient is almost uniform, with no influence of the opening at the bottom of the sidewall. The result supports the claim that heat was transferred mainly by conduction in the absence of ionic wind. The simulated value of Q (0.258 W) is less than the experimental value because the surface area of the heater is smaller in numerical simulation.
In the purview of the above results, herein, Q in the absence of ionic wind can be approximated as 0.33 W. Accordingly, the heat flow rate in the presence of ionic wind can be given by
where Ph0 is the heater power upon stabilization before the corona discharge, and Ph1 is that 30 min after the beginning of the corona discharge.
3.2. The Effect of Ionic Wind
3.2.1. The Corona Onset Voltages (Vo)
Figure 6 shows the experimental results of corona discharge current (Ic) as a function of applied DC voltage (Vc) for needle length L ranging from 6 mm to 9 mm. In most of the cases, Equation (21) with a constant C [25] very closely approximates Ic (Vo in the equation is the corona onset voltage). However, for L = 9 mm some outliers against the fitting curve at lower voltages (less than 3 kV) can be observed, probably because of oxidation of the needle tip.
Table 1 summarizes Vo as obtained by fitting Ic vs. Vc data using Equation (21). It is observed that the onset voltage decreases with decrease in the gap between the needle tip and the copper plate.
Figure 7 shows Ic as a function of Vc, as obtained from numerical simulations. Like the experimental results, the relationship between Vc and Ic can be expressed by Equation (21), and Ic is larger for larger L. However, the magnitudes of the corona discharge currents are significantly smaller than that in the experiment. Interestingly, the difference between the simulated and the experimental Ic values increases with L, e. g., the numerically simulated values are around one-fifth of the experimental values for L = 6 mm, while the same are one-tenth of the experimental values for L = 9 mm. It may be due to high local electric field around the nonspherical tip of the needle causing easier breakdown of air; however, the exact reason is not known at this stage.
3.2.2. The Relationship Between Applied Voltage and the Rate of Heat Transfer
Figure 8a–d show the experimental and simulated (a) rate of heat flow (Q) normalized by the heat transfer area (A), and (b) temperature difference between the heater and the top surface of the copper plate (Th − Ts) for each L. The area (A) used in experiments and simulations are 2.5 × 10⁻³ m2 and 1.963 × 10⁻³ m2, respectively. For every L, the average heat flux, Q/A, increases with increase in Vc, while the surface temperature of the copper plate Ts approaches the heater temperature Th. The numerical simulations reproduced the experimental trend between the applied voltage and Q/A. The following discussion further justifies the accuracy of the simulated airstream. In the experiment, an increase in Q causes a decrease in the temperature difference between Th and Ts, which in turn decreases Q (negative feedback for Q works). Here, Ts obtained from the experiment was used as a boundary condition in the simulation. Accordingly, if the simulated convection were (a) less active than that in the experiment, Q would not have increased with Vc, and (b) more active than that in the experiment, Q would have increased more rapidly with Vc than was observed in the experiment. The best agreement between experimental and simulated results was observed for L = 7 mm, which could be attributed to the status of the tip of the needle (although any deviation was not apparent). In addition, a few calculations were performed for the Vc that were not tested in the experiment. In such cases, the boundary value Ts was linearly interpolated from the experimental values.
Table 2 summarizes the heat transfer coefficient K. The ratio Kon/Koff defines the ability of the device to control the flow of heat. Kon/Koff can be increased by applying higher voltages. The maximum value for the same in the present study is 5.12 (Vc = 6.0 kV and L = 7 mm). At 4.0–4.1 kV, K increases with L (experimentally as well as in the simulation), except for L = 7 mm. The result is an outcome of the smaller gap between the needle tip and copper plate resulting in higher electric field and larger discharge current. However, the optimum L in the context of energy efficiency is discussed in the next section.
Figure 9a–f shows the simulated distributions of temperature and air flow velocity for L = 6 mm. It is evident that an increase in the speed of flow with the applied voltage increases the temperature gradient on the copper plate right above the needle and on the peripheral area of the heater; hence, enhances the rate of heat transfer. Three types of ionic wind patterns appeared depending on the applied voltages. At the lowest voltage (3.5 kV), when the airstream above the needle reached the copper plate it turned outward, descended, cooled down, reached the sidewall, and then returned to the axis. Thus, the wind circulated clockwise. Regardless, a slight clockwise circulation occurred at a peripheral region due to natural convection. At Vc = 4.0 kV, the circular flow at the center region induced a counterclockwise circulation at the peripheral region. At the highest V (5.0 kV), the discharge-induced flow at the axis went outward along the copper plate and reached the sidewall, then descended before being cooled. It resulted in the formation of a high-speed flow layer near the center of the upper surface which grows with increase in Vc. Further, the flow layer breaks down the temperature boundary layer and results in an enhanced rate of heat transfer. Additionally, for the other values of L, the same orders of flow pattern were observed including a single circulation localized to the central region, twin circulation, and a global single circulation, as it was for L = 6 mm.
Figure 10 shows the Nusselt number (Nu) as a function of the Reynolds number (Re) based on the numerical simulation results. The gap height d = 12.5 mm is adopted as the representative length d. The representative velocity is the average airstream speed in the radial direction at 1 mm below the upper surface of the gap (|u|ave defined by Equation (23)). There is a significant correlation between Nu and Re. It should be noted that this correlation does not depend on L and this correlation means that the effect of the change in the convection regime (twin or single circulation) can be reduced to Re. It can be understood that the flow in the radial direction induces the circulating flows in the gap, which transfer heat.
3.2.3. Energy Efficiencies
In the present study, energy efficiency (η) can be defined as the ratio of the increased rate of heat flow (ΔQ) to the input discharge power Pc (= Ic × Vc) (see Equation (25)). The experimental and simulated values of the same are shown in Figure 11 and Figure 12, respectively.
where ΔQ = Qon − Qoff (Qon is Q in the presence of corona discharge, and Qoff is Q in the absence of corona discharge). As evident from Figure 11, the efficiency is extremely high if Q/A is less than 200 W/m2, then it decreases rapidly with increase in the voltage. As can be found in Figure 10, in the almost absence of convection, only a small radial flow has a large enhancement effect for heat transfer, which is the reason for high η at low Q/A region. The decrease in η with higher Q/A is attributed to decrease in conversion efficiency from electrical energy to the kinetic energy of airstream. In the range of Q/A larger than 250 W/m2, the needle with L = 7 mm resulted in the highest η, followed by 6, 8, and 9 mm (the order is hard to determine in the range less than 250 W/m2). The reason of the low efficiencies for larger values of L is the less amount of air in the space above the needles, which reduces the effect of the discharge on the rate of heat transfer. Further, L = 6 mm did not give the highest efficiency because of the weaker outward flow compared with that of L = 7 mm that resulted due to the lower velocity at the axis. However, the reason of larger variation in η in the experiment than in the numerical simulation is not fully understood in this study. Among the reasons would be that the incomplete spherical shape of the needle tips might have increased current that did not contribute to creation of the air flow, especially in cases of L = 8 and 9 mm (see Section 3.2.1). The energy efficiency is more than one for all the conditions in the range of this study. For example, it is ~10 when L is 7 mm and Q/A is ~400 W/m2 (Kon/Koff = 3–4). In a viewpoint of energy consumption, these results mean that transferring thermal energy from where waste heat is exhausted has an advantage compared with newly creating heat at the site. The simulations’ results (Figure 12) show the same trend as the experiment, with the highest η for L = 7 mm. However, the much larger efficiencies obtained from simulations are due to smaller discharge current compared with that of the experiment. Analysis indicates that for Vc = 4.1 kV and L = 7 mm, Q/A and η are 370 W/m2 and 12.0, respectively, in the experiment, while the corresponding simulated values are 353 W/m2 and 58.0. Very large values of efficiency obtained from simulation show a great potential of the ionic wind-based thermal switches.
Although this device is promising from the energy efficiency point of view, the heat flux needs to be 2–3 orders of magnitude higher for practical purposes. Accordingly, while keeping in mind the advantage of ionic wind that it can be generated in a small region (like the heat transfer gap in this study), the future studies should identify the optimum arrangement of multiple needles that could generate mutually driving winds, causing a very strong circulating flow.
3.2.4. The Influence of the Heat Generation by Corona Discharge in the Gap
The numerical simulation results discussed until now did not include the heating effect of the corona discharge. All of the energy from the corona discharge was dissipated in the gap. Since it is difficult to identify the distribution of such a heat source, heat transferred was calculated by assuming a volume heat source distributed uniformly throughout the gap. Heating power per unit volume was determined using Equation (21) at various applied voltages for the case of L = 6 mm. It should be noted that experimental values of the discharge power were used in the calculation. The simulated values of the rate of heat transfer after considering the volume heat sources are shown in Figure 13. Due to a little temperature rise in the gap, the rate of heat flow from the heater surface decreased, while the heat received by the upper surface of the gap increased. The difference (between black triangles and circles in the graph) in the rates of heat flow correspond to the discharge power. The introduction of a volume heat source has less effect on the rate of heat flow at the heater surface as compared with the upper surface (copper plate). This result suggests that the experimental values of Q are hardly affected by the discharge power dissipated in the gap because Q is determined as the heater power in the experiment.
4. Conclusions
To summarize, the basic characteristics of the thermal switch using ionic wind were investigated in this study. The ionic wind-based thermal switches could control the rate of heat flow, with energy efficiencies (the ratio of controlled heat flow rate to input discharge power) more than 10. Further, the ratio of heat transfer coefficients between two surfaces in the presence and absence of corona discharge ranged from 3 to 4, and the heat flux was around 400 W/m2. The future study should focus to enhance the heat flux in a controlled manner.
Funding
This research received no external funding.
Acknowledgments
The author thanks undergraduate students, Yoshiki Chayama, Ryoya Moriguchi, and Seiichiro Kitano, very much for their help in conducting the experiments.
Conflicts of Interest
The author declares no conflict of interest.
References
- Kato, Y.; Suzuki, H.; Shikazono, N. Heat storage, transportation, and transfer. In Energy Technology Roadmaps of Japan: Future Energy Systems Based on Feasible Technologies Beyond 2030; Kato, Y., Koyama, M., Eds.; Springer: Cham, Switzerland, 2016; pp. 135–146. [Google Scholar]
- Key World Energy Statics; International Energy Agency: Paris, France, 2018; Available online: https://www.iea.org/ (accessed on 1 June 2019).
- Gou, X.; Ping, H.; Ou, Q.; Xiao, H.; Qing, S. A novel thermoelectric generation system with thermal switch. Appl. Energy 2015, 160, 843–852. [Google Scholar] [CrossRef]
- Gu, W.; Tang, G.-H.; Tao, W.-Q. Thermal switch and thermal rectification enabled by near-field radiative heat transfer between three slabs. Int. J. Heat Mass Transf. 2015, 82, 429–434. [Google Scholar] [CrossRef]
- Velson, N.V.; Tarau, C.; Anderson, W.G. Two-Phase Thermal Switch for Spacecraft Passive Thermal Management. In Proceedings of the 45th International Conference on Environmental Systems, Bellevue, WA, USA, 12–16 July 2015. [Google Scholar]
- Cha, G.; Kim, C.-J.; Ju, Y.S. Thermal conductance switching based on the actuation of liquid droplets through the electrowetting on dielectric (EWOD) phenomenon. Appl. Therm. Eng. 2016, 98, 189–195. [Google Scholar] [CrossRef] [Green Version]
- Gong, J.; Cha, G.; Ju, Y.S.; Kim, C.-J. Thermal Switches Based on Coplanar EWOD for Satellite Thermal Control. In Proceedings of the 2008 IEEE 21st International Conference on Micro Electro Mechanical Systems (MEMS), Wuhan, China, 13–17 January 2008. [Google Scholar]
- McLanahan, A.L.R.; Richards, C.D.; Richards, R.F. A Dielectric Liquid Contact Thermal Switch with Electrowetting Actuation. In Proceedings of the ASME 2010 International Mechanical Engineering Congress & Exposition IMECE2010, Vancouver, BC, Canada, 12–18 November 2010; pp. 61–66. [Google Scholar]
- Tasaki, Y. Present status and approach to a room-temperature magnetic refrigerator with thermal switches. J. Cryog. Supercond. Soc. Jpn. 2015, 50, 53–59. [Google Scholar] [CrossRef]
- Velkoff, H.R.; Godfrey, R. Low-velocity heat transfer to a flat plate in the presence of a corona discharge in air. J. Heat Transf. 1979, 101, 157–163. [Google Scholar] [CrossRef]
- Franke, M.E.; Hutson, K.E. Effect of corona discharge on free-convection heat transfer inside a vertical hollow cylinder. J. Heat Transf. 1984, 106, 347–351. [Google Scholar] [CrossRef]
- Tada, Y.; Takimoto, A.; Hayashi, Y. Heat transfer enhancement in a corona field by applying ionic wind. Enhanc. Heat Transf. 1997, 4, 71–86. [Google Scholar] [CrossRef]
- Kawamoto, H.; Umezu, S. Electrostatic micro-ozone fan that utilizes ionic wind induced in pin-to-plate corona discharge system. J. Electrostat. 2008, 66, 445–454. [Google Scholar] [CrossRef]
- Zhang, J.; Lai, F.C. Heat transfer enhancement using corona wind generator. J. Electrostat. 2018, 92, 6–13. [Google Scholar] [CrossRef]
- Tsui, Y.-Y.; Huang, Y.-X.; Lan, C.-C.; Wang, C.-C. A study of heat transfer enhancement via corona discharge by using a plate corona electrode. J. Electrostat. 2017, 87, 1–10. [Google Scholar] [CrossRef]
- Deylami, H.M.; Amanifard, N.; Dolati, F.; Kouhikamali, R.; Mostajiri, K. Numerical investigation of using various electrode arrangements for amplifying the EHD enhanced heat transfer in a smooth channel. J. Electrostat. 2013, 71, 656–665. [Google Scholar] [CrossRef]
- Mahmoudi, A.R.; Pourfayaz, F.; Kasaeian, A. A simplified model for esitmating heat transfer coefficient in a chamber with electohydrodynamic effect (corona wind). J. Electrostat. 2018, 93, 125–136. [Google Scholar] [CrossRef]
- Lakeh, R.B.; Molki, M. Enhancement of convective heat transfer by electrically-induced swirling effect in laminar and fully-developed internal flows. J. Electrostat. 2013, 71, 1086–1099. [Google Scholar] [CrossRef]
- Lakeh, R.B.; Molki, M. Targeted heat transfer augmentation in circular tubes using a corona jet. J. Electrostat. 2012, 70, 31–42. [Google Scholar] [CrossRef]
- Takahashi, K. The Foundation of Aerosol Science; Morikita Publishing Co., Ltd.: Tokyo, Japan, 2003. [Google Scholar]
- Chen, J.; Davidson, J.H. Model of the negative dc corona plasma: Comparison to the positive dc corona plasma. Plasma Chem. Plasma Process. 2003, 23, 83–102. [Google Scholar] [CrossRef]
- Farnoosh, N.; Adamiak, K.; Castle, G.S.P. 3-D numerical analysis of EHD turbulent flow and mono-disperse charge particle transport and collection in a wire-plate EHD. J. Electrostat. 2010, 68, 513–522. [Google Scholar] [CrossRef]
- Kanamoto, H.; Yasuda, H.; Umezu, S. Flow distribution and pressure of air due to ionic wind in pin-to-plate corona discharge system. J. Electrostat. 2006, 64, 400–407. [Google Scholar] [CrossRef]
- Tokyo Japan Society of Mechanical Engineers. JSME Data Book: Heat Transfer, 3rd ed.; Japan Society of Mechanical Engineers: Tokyo, Japan, 1976. [Google Scholar]
- Cobine, J.D. Gaseous Conductors: Theory and Engineering Applications; Dover Publications Inc.: New York, NY, USA, 1957; p. 606. [Google Scholar]
Figure 1.
Schematics of the thermal switch test setup.

Figure 2.
Calculation region and boundary conditions.

Figure 3.
The tip of a corona needle.

Figure 4.
Heater powers in the cases with and without thermal insulation over the copper plate. (No corona discharge was applied in the gap).
Figure 4.
Heater powers in the cases with and without thermal insulation over the copper plate. (No corona discharge was applied in the gap).

Figure 5.
Temperature distribution in the gap when only natural convection occurs (numerical simulation).
Figure 5.
Temperature distribution in the gap when only natural convection occurs (numerical simulation).

Figure 6.
Discharge currents (Ic) vs. applied voltage (Vc) (experiment).

Figure 7.
Applied voltage (Vc) vs. discharge currents (Ic) (numerical simulation).

Figure 8.
(a–d) Average heat flux (Q/A) and temperature difference (Th − Ts).

Figure 9.
(a–f) Temperature and velocity distributions in the gap (numerical simulation, L = 6 mm; arrows are velocity vector indicating relative strength of the flow with logarithmic scale).
Figure 9.
(a–f) Temperature and velocity distributions in the gap (numerical simulation, L = 6 mm; arrows are velocity vector indicating relative strength of the flow with logarithmic scale).


Figure 10.
The Nusselt number as a function of the Reynolds number based on the numerical simulation.
Figure 10.
The Nusselt number as a function of the Reynolds number based on the numerical simulation.

Figure 11.
Energy efficiency vs. heat transfer rate (experiment).

Figure 12.
Energy efficiency vs. heat transfer rate (numerical simulation).

Figure 13.
Heat transfer rates with and without the discharge power dissipated in the gap (numerical simulation using the discharge powers that were determined experimentally).
Figure 13.
Heat transfer rates with and without the discharge power dissipated in the gap (numerical simulation using the discharge powers that were determined experimentally).


Table 1.
Corona onset voltage (Vo) vs. the length of corona needle (L).
| L (mm) | Vo (kV) |
|---|---|
| 6.0 | 3.46 |
| 7.0 | 2.85 |
| 8.0 | 2.65 |
| 9.0 | 2.38 |
Table 2.
Heat transfer coefficients (K) and the ratio of K between with and without corona discharge (Kon/Koff).
Table 2.
Heat transfer coefficients (K) and the ratio of K between with and without corona discharge (Kon/Koff).
| Vc (kV) | K (W/(K·m2)) | Kon/Koff | ||
|---|---|---|---|---|
| Experiment | Calculation | Experiment | Calculation | |
| L = 6 mm | ||||
| 0 | 2.32 | 2.31 | - | - |
| 3.5 | 2.32 | 3.25 | 1 | 1.41 |
| 4.1 | 5.36 | 5.77 | 2.31 | 2.50 |
| 4.5 | 6.58 | 6.88 | 2.84 | 2.98 |
| 5.0 | 7.16 | 8.41 | 3.08 | 3.64 |
| L = 7 mm | ||||
| 0 | 2.32 | 2.31 | - | - |
| 3.3 | 3.24 | 4.60 | 1.45 | 2.06 |
| 3.7 | 5.94 | 6.14 | 2.65 | 2.75 |
| 4.1 | 7.85 | 7.49 | 3.50 | 3.35 |
| 5.0 | 10.1 | 9.90 | 4.50 | 4.43 |
| 6.0 | 11.5 | 11.7 | 5.12 | 5.25 |
| L = 8 mm | ||||
| 0 | 2.32 | 2.31 | - | - |
| 2.7 | 2.32 | 4.01 | 1.0 | 1.78 |
| 3.1 | 4.38 | 5.32 | 1.93 | 2.36 |
| 3.6 | 5.26 | 6.30 | 2.32 | 2.79 |
| 4.0 | 6.39 | 7.62 | 2.82 | 3.37 |
| 4.5 | 7.74 | 9.02 | 3.41 | 4.00 |
| L = 9 mm | ||||
| 0 | 2.32 | 2.31 | - | - |
| 2.8 | 2.33 | 4.11 | 1.01 | 1.79 |
| 3.1 | 3.59 | 5.42 | 1.55 | 2.36 |
| 3.5 | 5.23 | 6.06 | 2.26 | 2.63 |
| 4.1 | 6.79 | 8.06 | 2.93 | 3.50 |
© 2019 by the author. Licensee MDPI, Basel, Switzerland. This article is an open access article distributed under the terms and conditions of the Creative Commons Attribution (CC BY) license (http://creativecommons.org/licenses/by/4.0/).
Share and Cite
MDPI and ACS Style
Yoshida, K. Fundamental Evaluation of Thermal Switch Based on Ionic Wind. Energies 2019, 12, 2963. https://doi.org/10.3390/en12152963
AMA Style
Yoshida K. Fundamental Evaluation of Thermal Switch Based on Ionic Wind. Energies. 2019; 12(15):2963. https://doi.org/10.3390/en12152963
Chicago/Turabian StyleYoshida, Keiichiro. 2019. "Fundamental Evaluation of Thermal Switch Based on Ionic Wind" Energies 12, no. 15: 2963. https://doi.org/10.3390/en12152963
Note that from the first issue of 2016, this journal uses article numbers instead of page numbers. See further details here.