1. Micro-Hydro Turbines
1.1. Introduction
Due to the increasing of the technical progress facilitating the emergence of new concepts and innovations in the water sector, the demand for micro hydro energy systems have grown considerably, with a generalized acceptance of promoting renewable energy sources to ensure a suitable environmental and sustainable development [
1]. The emergence of renewable energies and decentralized production of small scale has activated flexibility mechanisms by encouraging the storage and management of demand [
2,
3]. Wind and solar power are getting most attention nowadays, but hydropower has another ability in less obvious areas, such as small-scale decentralized production and hybrid energy solutions for the integration of intermittent sources [
4].
The interest in micro-hydropower, with installed power below 100 kW, is increasing since this is a solution with low environmental impacts and potential for energy recovery in different types of water systems [
5]. This type of power is expected to increase, as a consequence of the increase of the share of energy supply technologies coming from renewables [
6]. A micro-hydropower scheme, also referred to as unconventional hydropower, uses small heads or small flow discharges to generate electricity. These small-scale hydropower devices are cheap, clean, and reliable, one of the most environmentally positive ways of power generation available today. Moreover, small and micro hydropower have a massive and yet unexploited potential around the world, creating a critical commitment for future energy needs with a viable way to bring energy security to poor communities in rural or isolated areas [
7,
8] or for electric devices charge in urban zones.
In low-headed systems, several hydropower techniques are presently being used. The water wheels, the Archimedes screw in reverse mode, the cross-flow turbine and pump working as turbines (PAT) are the most frequently used. Propeller turbines are generally suitable for low heads and higher flowrates operation [
9,
10,
11], mostly applied in large and small hydro schemes. In fact, its implementation as micro-hydro is still at the beginning [
12]. However, scaling down from a large turbine cannot be applied directly in this case due to associated scale effects as verified by [
13], but also because the financial and manufacturing limitations are not the same [
14], as the aim is to develop a cheap and economically feasible single turbine [
12].
Computational fluid dynamic (CFD) methods became a dominant tool in the design process of turbomachines [
15]. However, physical models are still an important requisite, in the characterization of flow conditions and for the validation and calibration of computational results [
16,
17]. During the experiments, performance data collection (i.e., mechanical power, efficiency, flow rate and head) were carried out. Therefore, the main objective is to review the hydrodynamic procedures for the performance analysis of a propeller turbine with five blades tested in the HES-SO Valais. Firstly, the paper reviewed the model tested for
D = 85 mm and then applied new modified affinity laws to determine the power extraction for
D = 170 mm without a fixed efficiency as the classical theory advices. These approaches were applied on the existing micro axial turbine and extrapolated for a larger one using CFD numerical simulations.
Efficiency values over a wide range of operating conditions were obtained by conducting intensive campaigns over the propeller turbine followed by hill chart comparisons between experimental and numerical results. Comparisons between flow conditions, scale effects and structure of losses within the prototype and the CFD model were also investigated.
1.2. Principle of Similarity
Similarity conditions on hydrodynamic devices are an effort to describe a specified machine’s efficiency compared to the experimentally recognized performance of another under altered working operations, such as a change of head, diameter, speed, or flow [
18]. The performance of one machine can be predicted from experimental trials on a geometrically similar device and its behavior can be predicted under distinct conditions than those tested. If two devices are kinetically similar, the inlet and outlet velocity vectors of the rotor must be comparable to those of the other machine [
19]. Therefore, the kinetic similarity of the inlet and outlet velocity profiles is a needed condition for the dynamic resemblance [
18]. Thus, the similarity laws can be obtained by expressing the geometrical similarity of shape sizes and profiles, the kinetic similitude expressed as the same shapes for the velocity triangles, and the dynamic similitude expressing the forces acting on the runner [
20]:
where
,
,
and
are variables for nominal conditions, and
,
,
and
are the estimative conditions.
The validation of these conditions gives a scientific approach to select the turbine that best fits the project conditions. If both machines have different diameters but operate under similar conditions, then they can verify the equivalence of Equation (1) [
18]. Additionally, a second classification of a similar axial turbine can be defined according to the impeller shape and the specific speed [
21], as:
where
= specific speed in rpm (m, kW);
= rotational speed (rpm);
= shaft power (kW); and
= net head (m w.c.).
For turbomachines with same impeller’s size, the hydraulic parameters (i.e., flow, power and head) can be correlated based on affinity laws, where the efficiency can be estimated for various speeds. Based on this assumption, and according to expert references [
21,
22,
23] Equation (1) can be simplified and modified as:
where
are fitted functions proposed by [
21] for axial machines, that depend on the error between experimental data and empirical methods. Since these functions present smaller mean errors compared to Sarbu-Borza’s method [
24], they were applied in this research work to predict the real behavior of the propeller turbine.
2. Experimental Setup
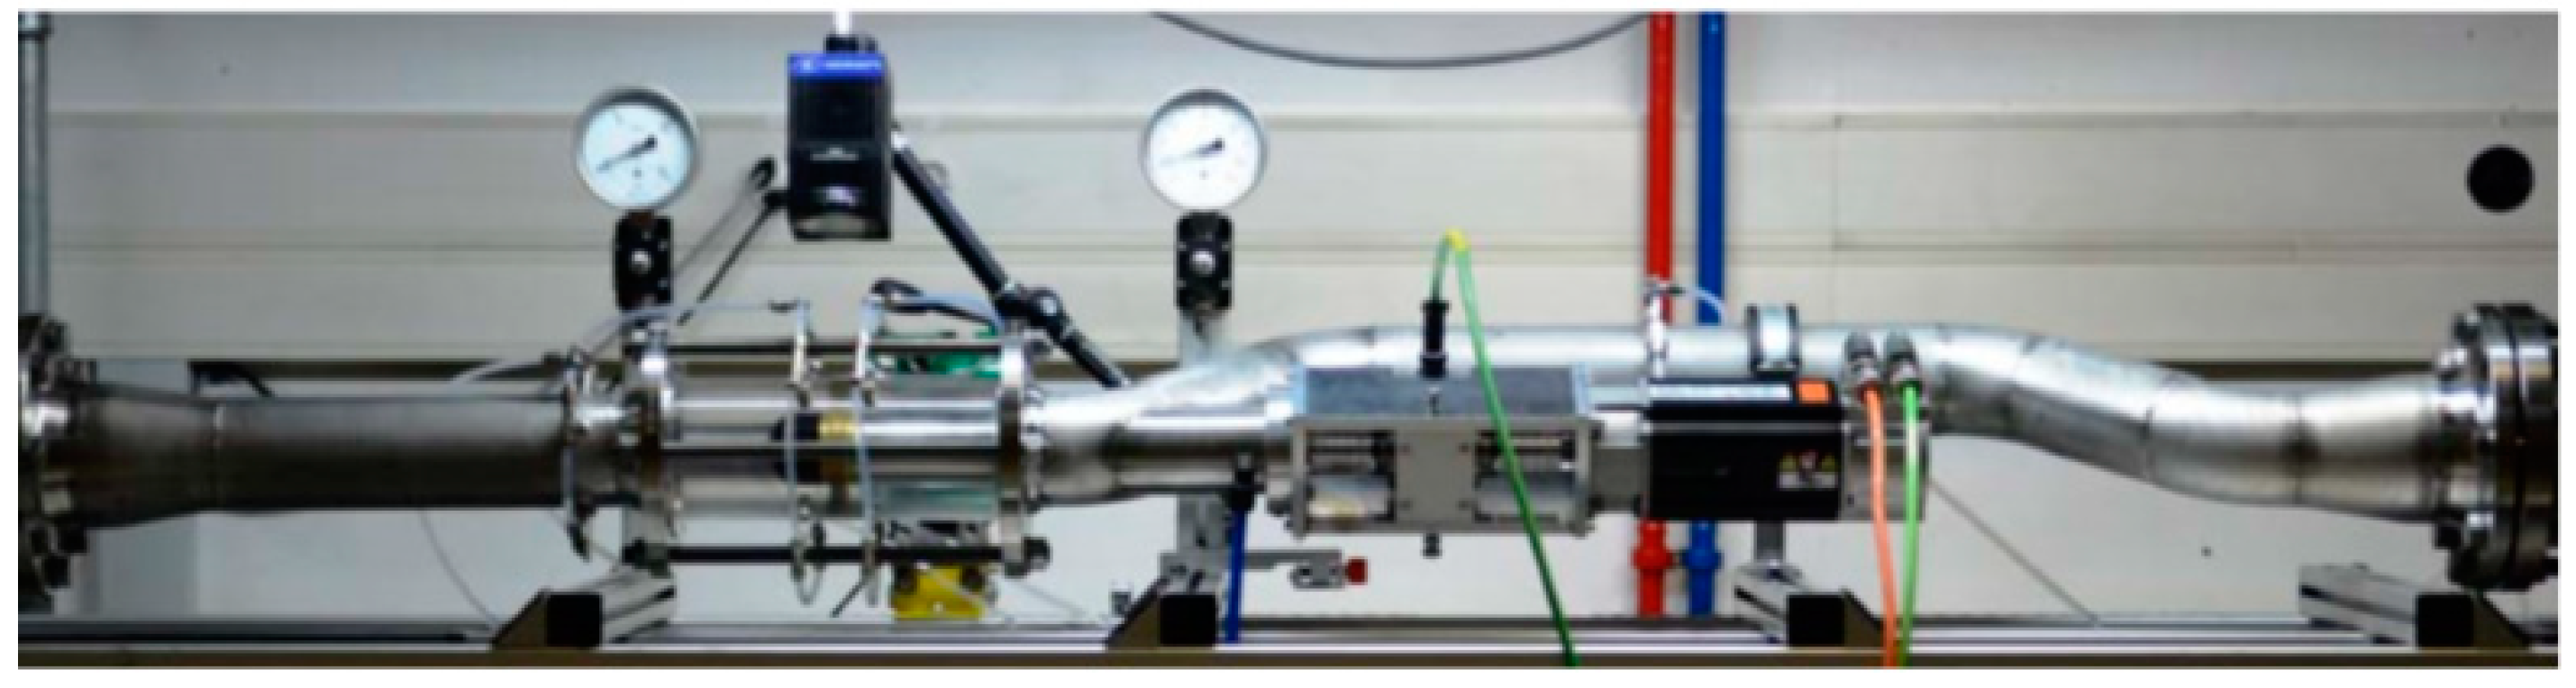
The prototype of the axial inline propeller turbine with 85 mm of diameter was redesigned and tested in the lab facility of HES-SO Valais (
Figure 1). To guarantee a consistent distribution of the upstream flow velocity and consequently reducing the frictions losses, the turbine was located upstream from the curve. Four pressure transducers with accuracies between 0.05%, and 0.5% were installed 1 upstream of the curve, two upstream and downstream of the runner and the last one at downstream the curve. The flow was measured using an electromagnetic flowmeter with 0.5% of accuracy. A permanent magnet generator of 1.23 kW was used with a peak speed of 4880 rpm [
18]. The torque was evaluated with a sensor operating between −4 to 4 Nm with accuracy precision of 1%. Before these experiments, all instrumentation was calibrated.
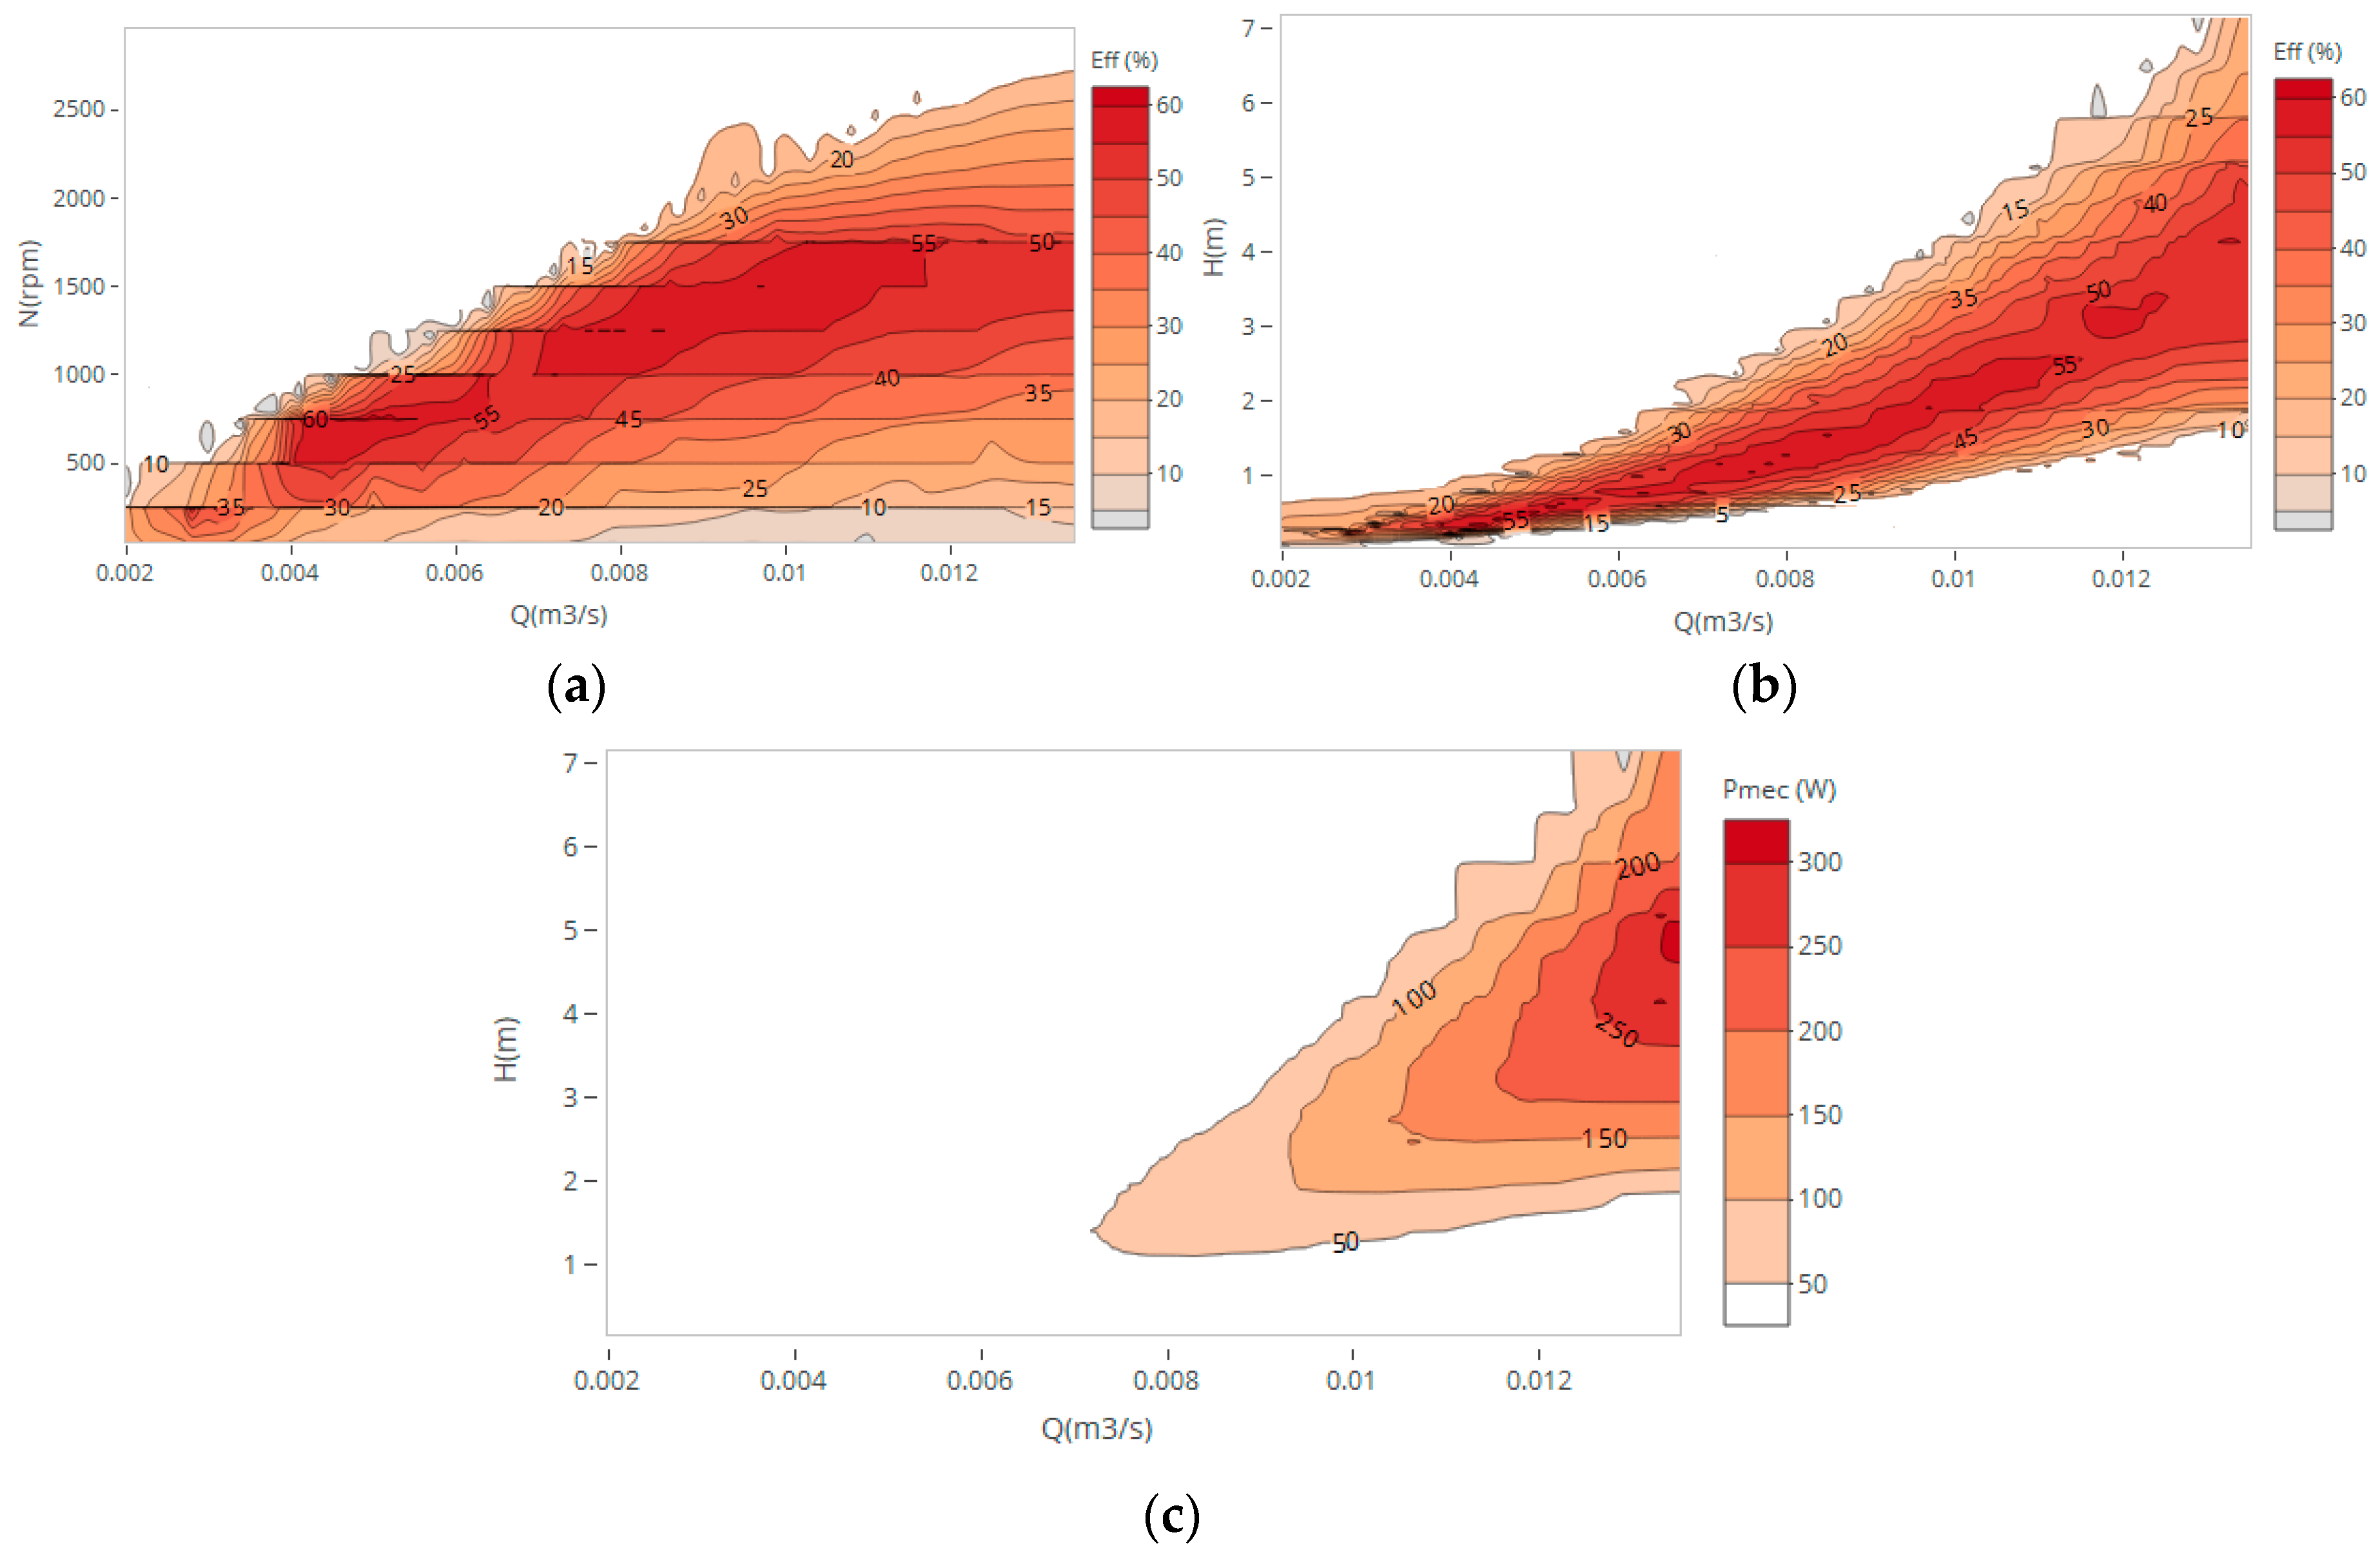
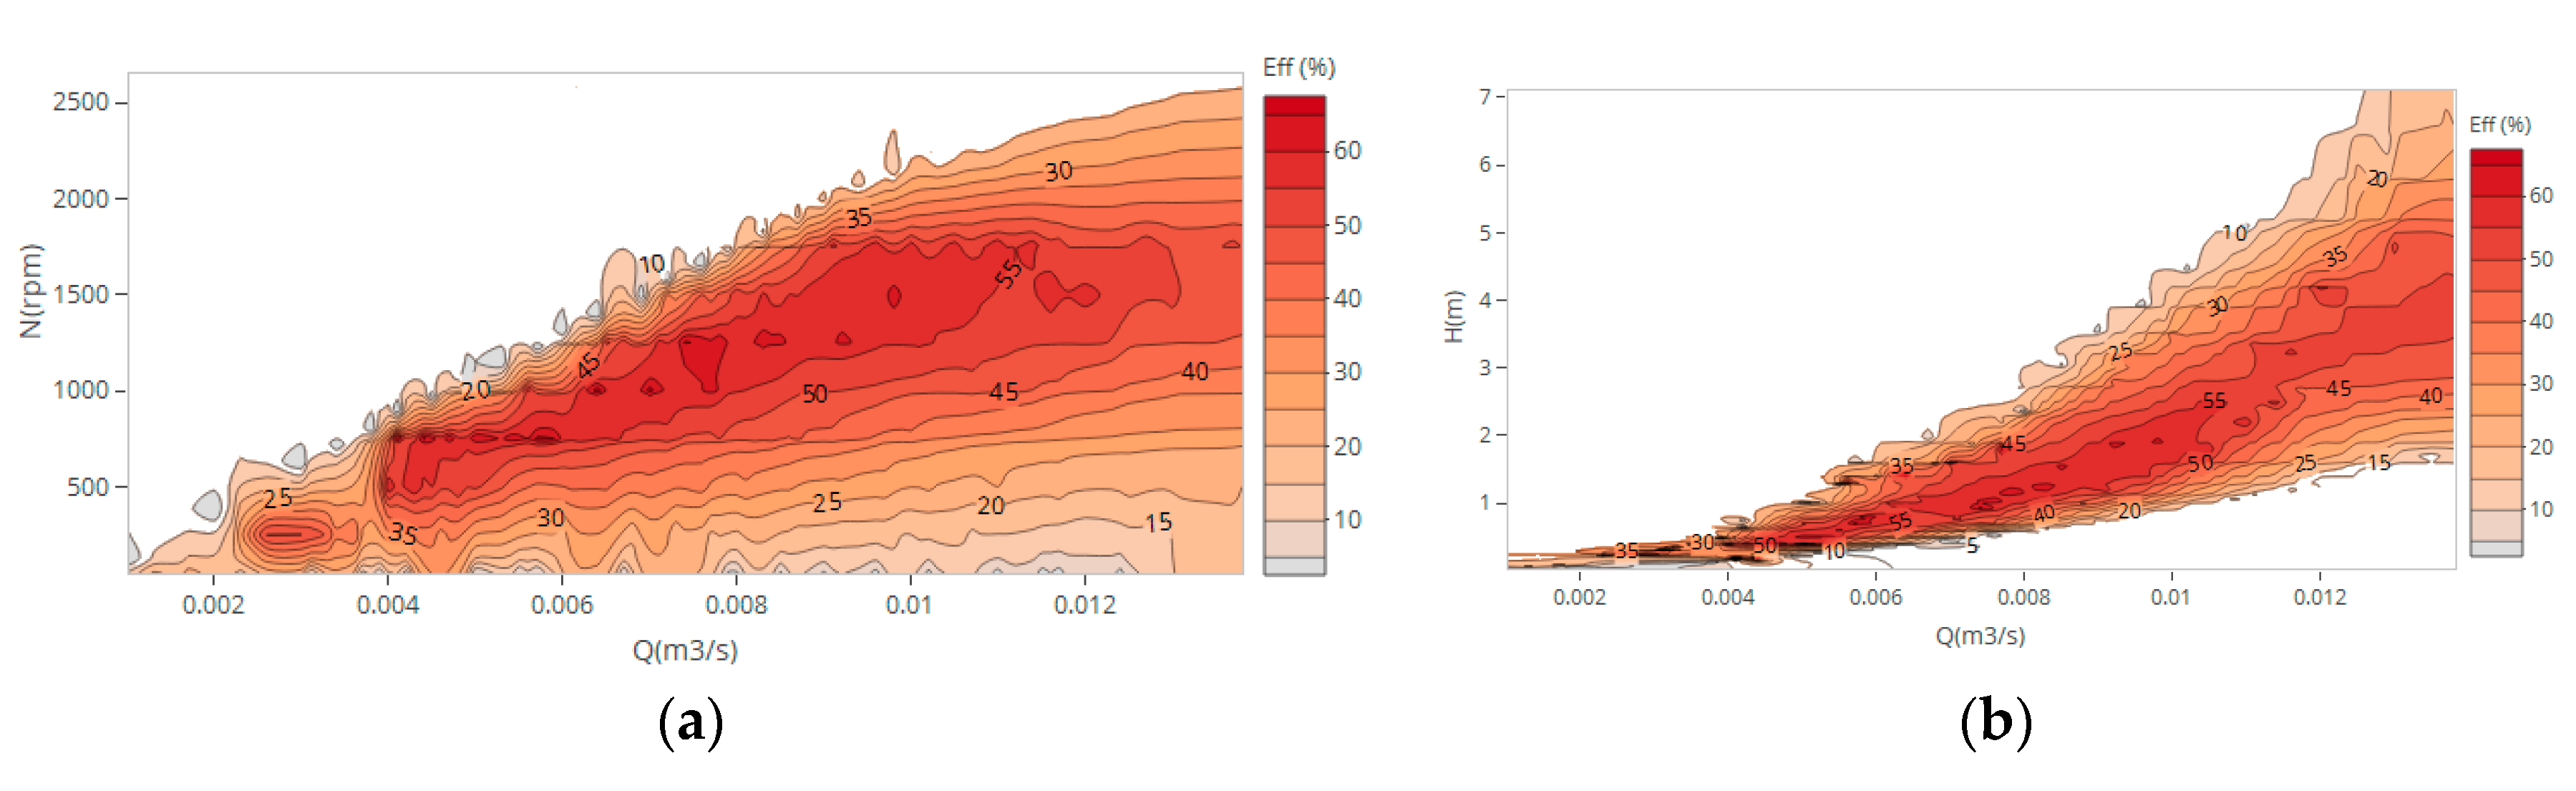
Hill charts of the propeller turbine were obtained for different operating conditions based on measured data. In
Figure 2, three different hill charts are presented displaying the efficiency peak between 750 and 1000 rpm for flows between 15 and 25 m
3/h and heads below 2 m. The best efficiency point (BEP) corresponds to an efficiency around 65% and 10 W, at a rotation speed of 750 rpm, for 0.0044 m
3/s and head with 0.34 m. For a maximum flow of 0.013 m
3/s, 4.8 m of head and 1500 rpm of rotational speed, the maximum mechanical power measured was approximately 330 W.
According to the affinity law, the specific speed is described as the speed of a geometrically similar turbine that produces a unit power under a unit head Equation (4), given by the turbine’s BEP:
where
= power,
= rotational speed and
= head of the BEP.
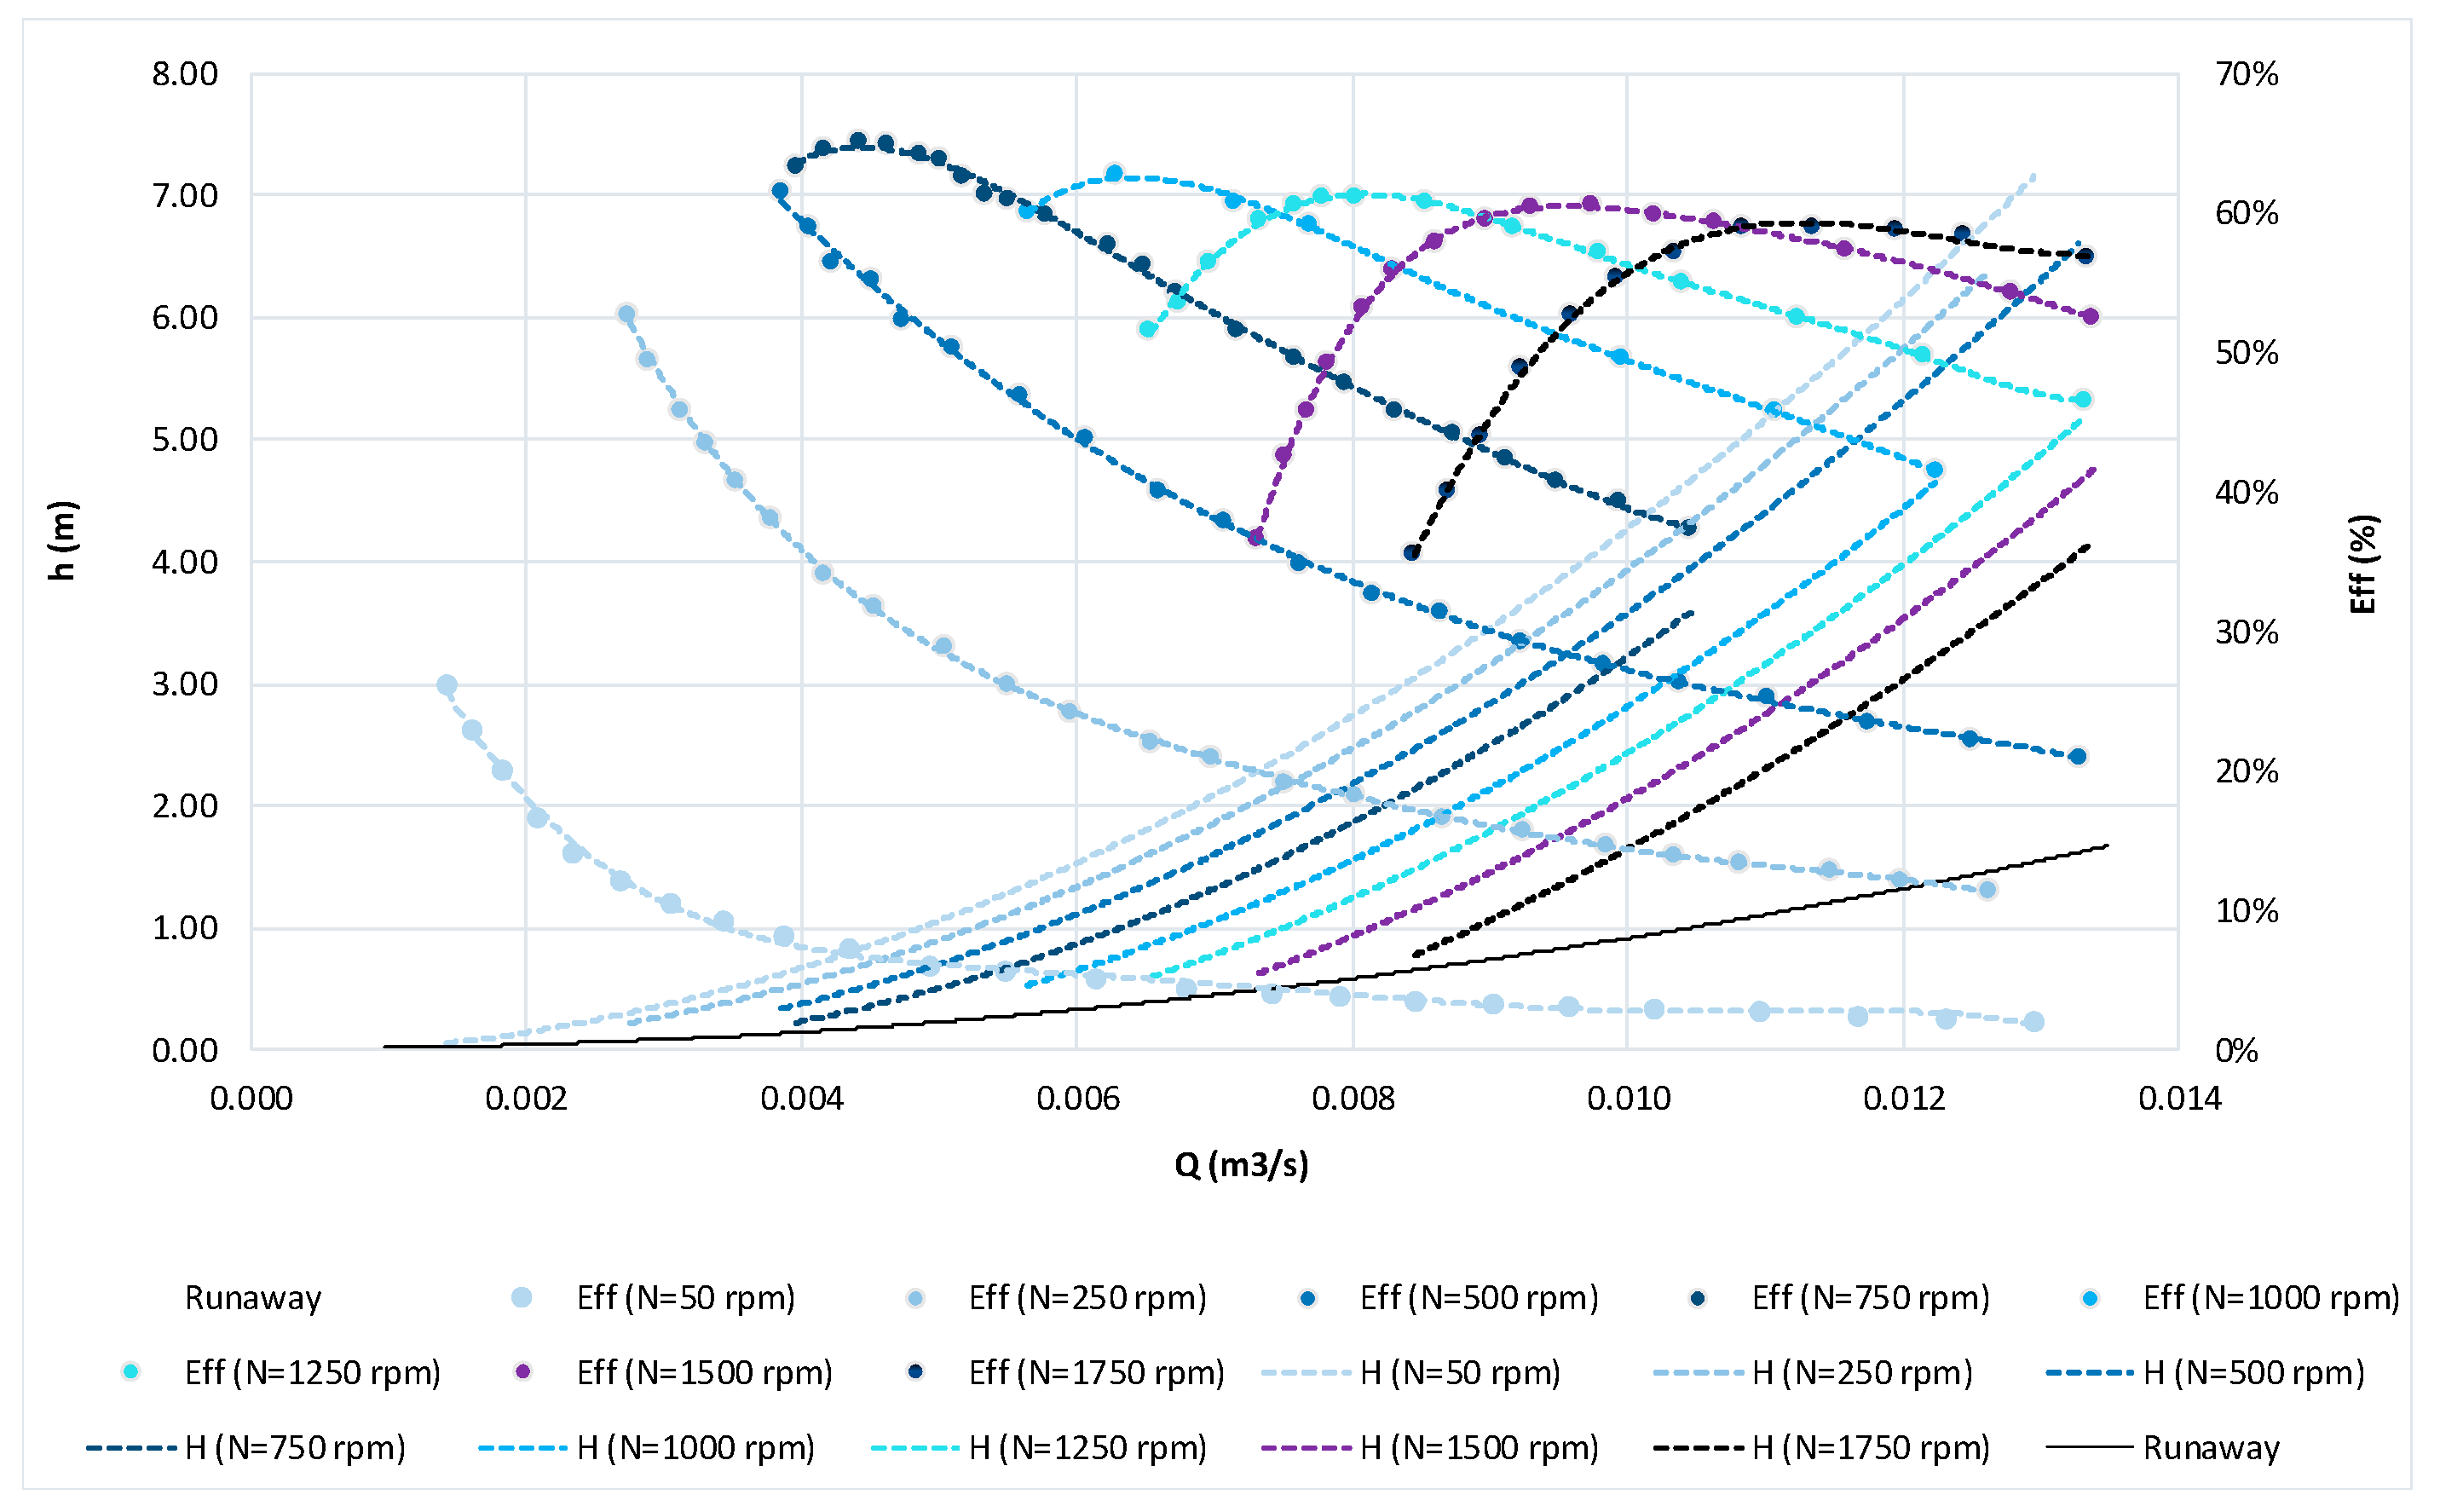
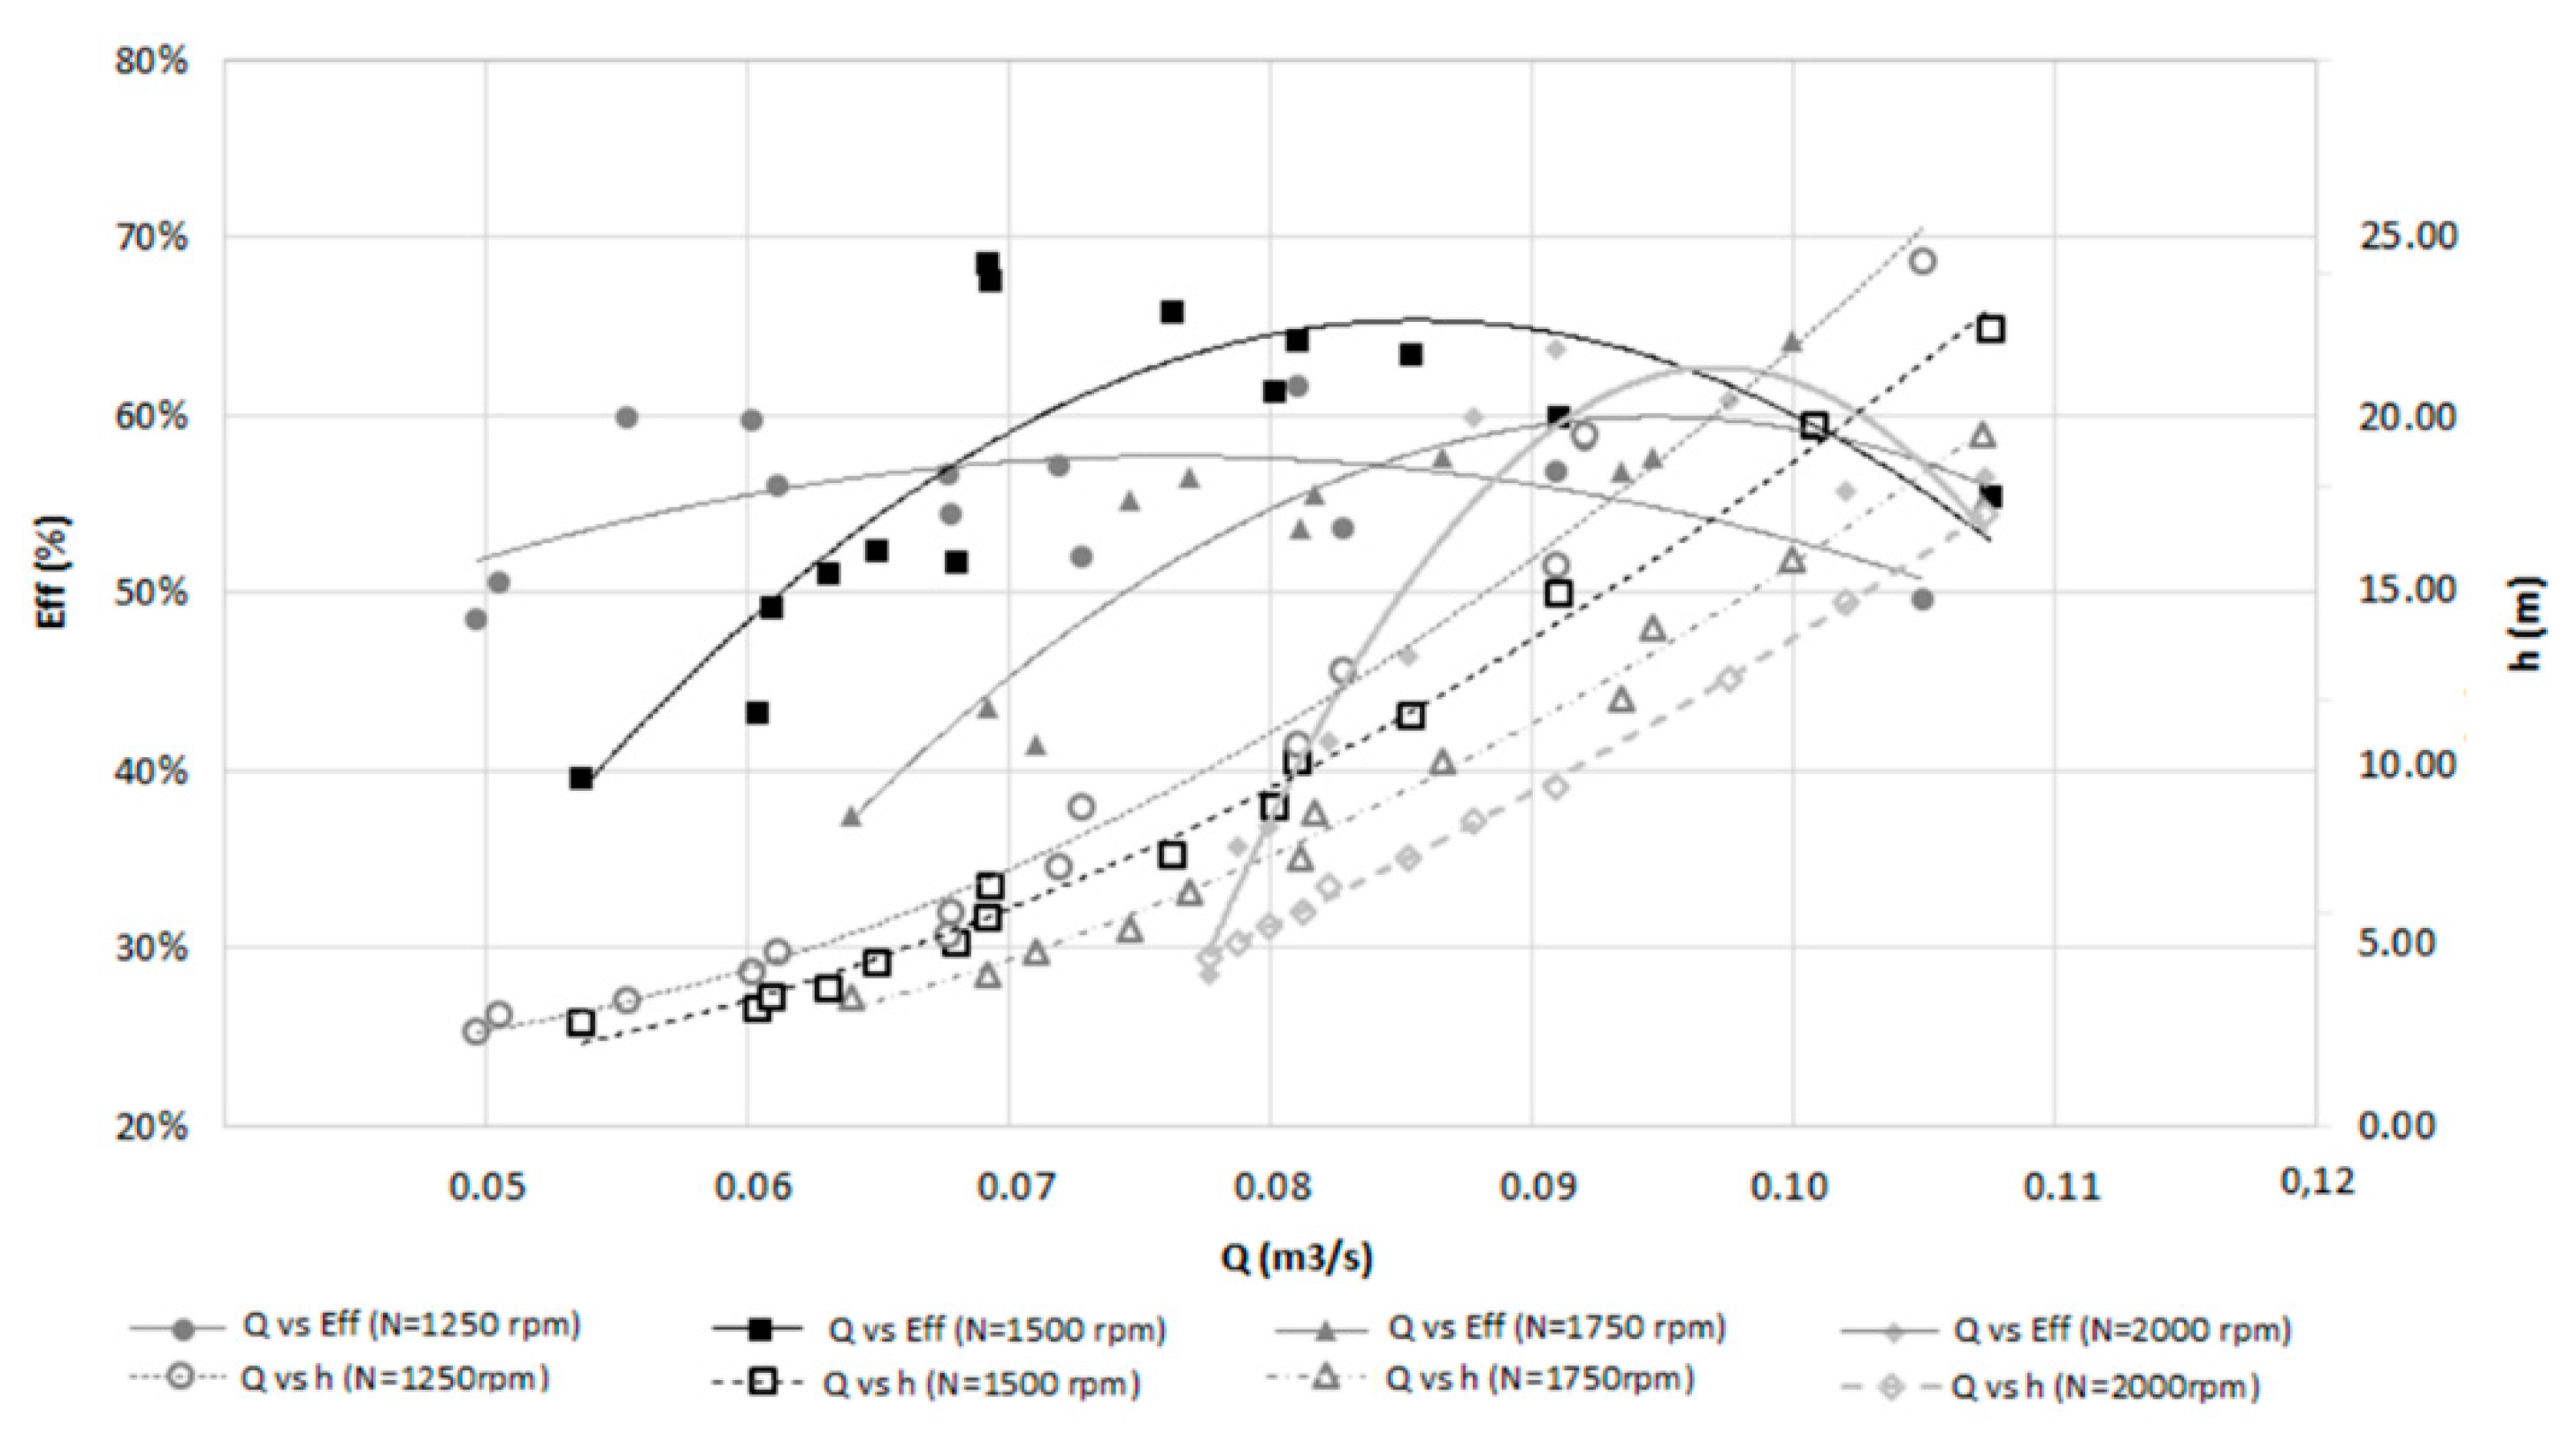
The experimental results of the performance evaluation curves are shown in
Figure 3, where the total head is plotted as a function of the flow between the upstream and downstream pressure transducers, the efficiency, the rotational speed and the mechanical power. A total of 150 operating points was evaluated for eight set rotational velocity values [
18].
There are two operating limit lines, the no-load and the overspeed. In a no-load condition, the flow rate is too low for producing any power. On contrary, in an overspeed situation, the turbine is fully flow absorption but disconnected from the generator, which leads to the runaway speed of the impeller, i.e., without any constrain, where no power is produced, and the rotational speed rises with the head. This last one curve can be seen in
Figure 3.
For a fixed rotational speed above 1000 rpm, the efficiency increases rapidly with the increase of the discharge until it reaches the maximum, starting to decrease gradually. Yet, the mechanical power continues to increase with the discharge, demonstrating that the increase of the head balances the decrease in effectiveness.
3. Numerical Simulations
3.1. Geometry and Boundary Conditions
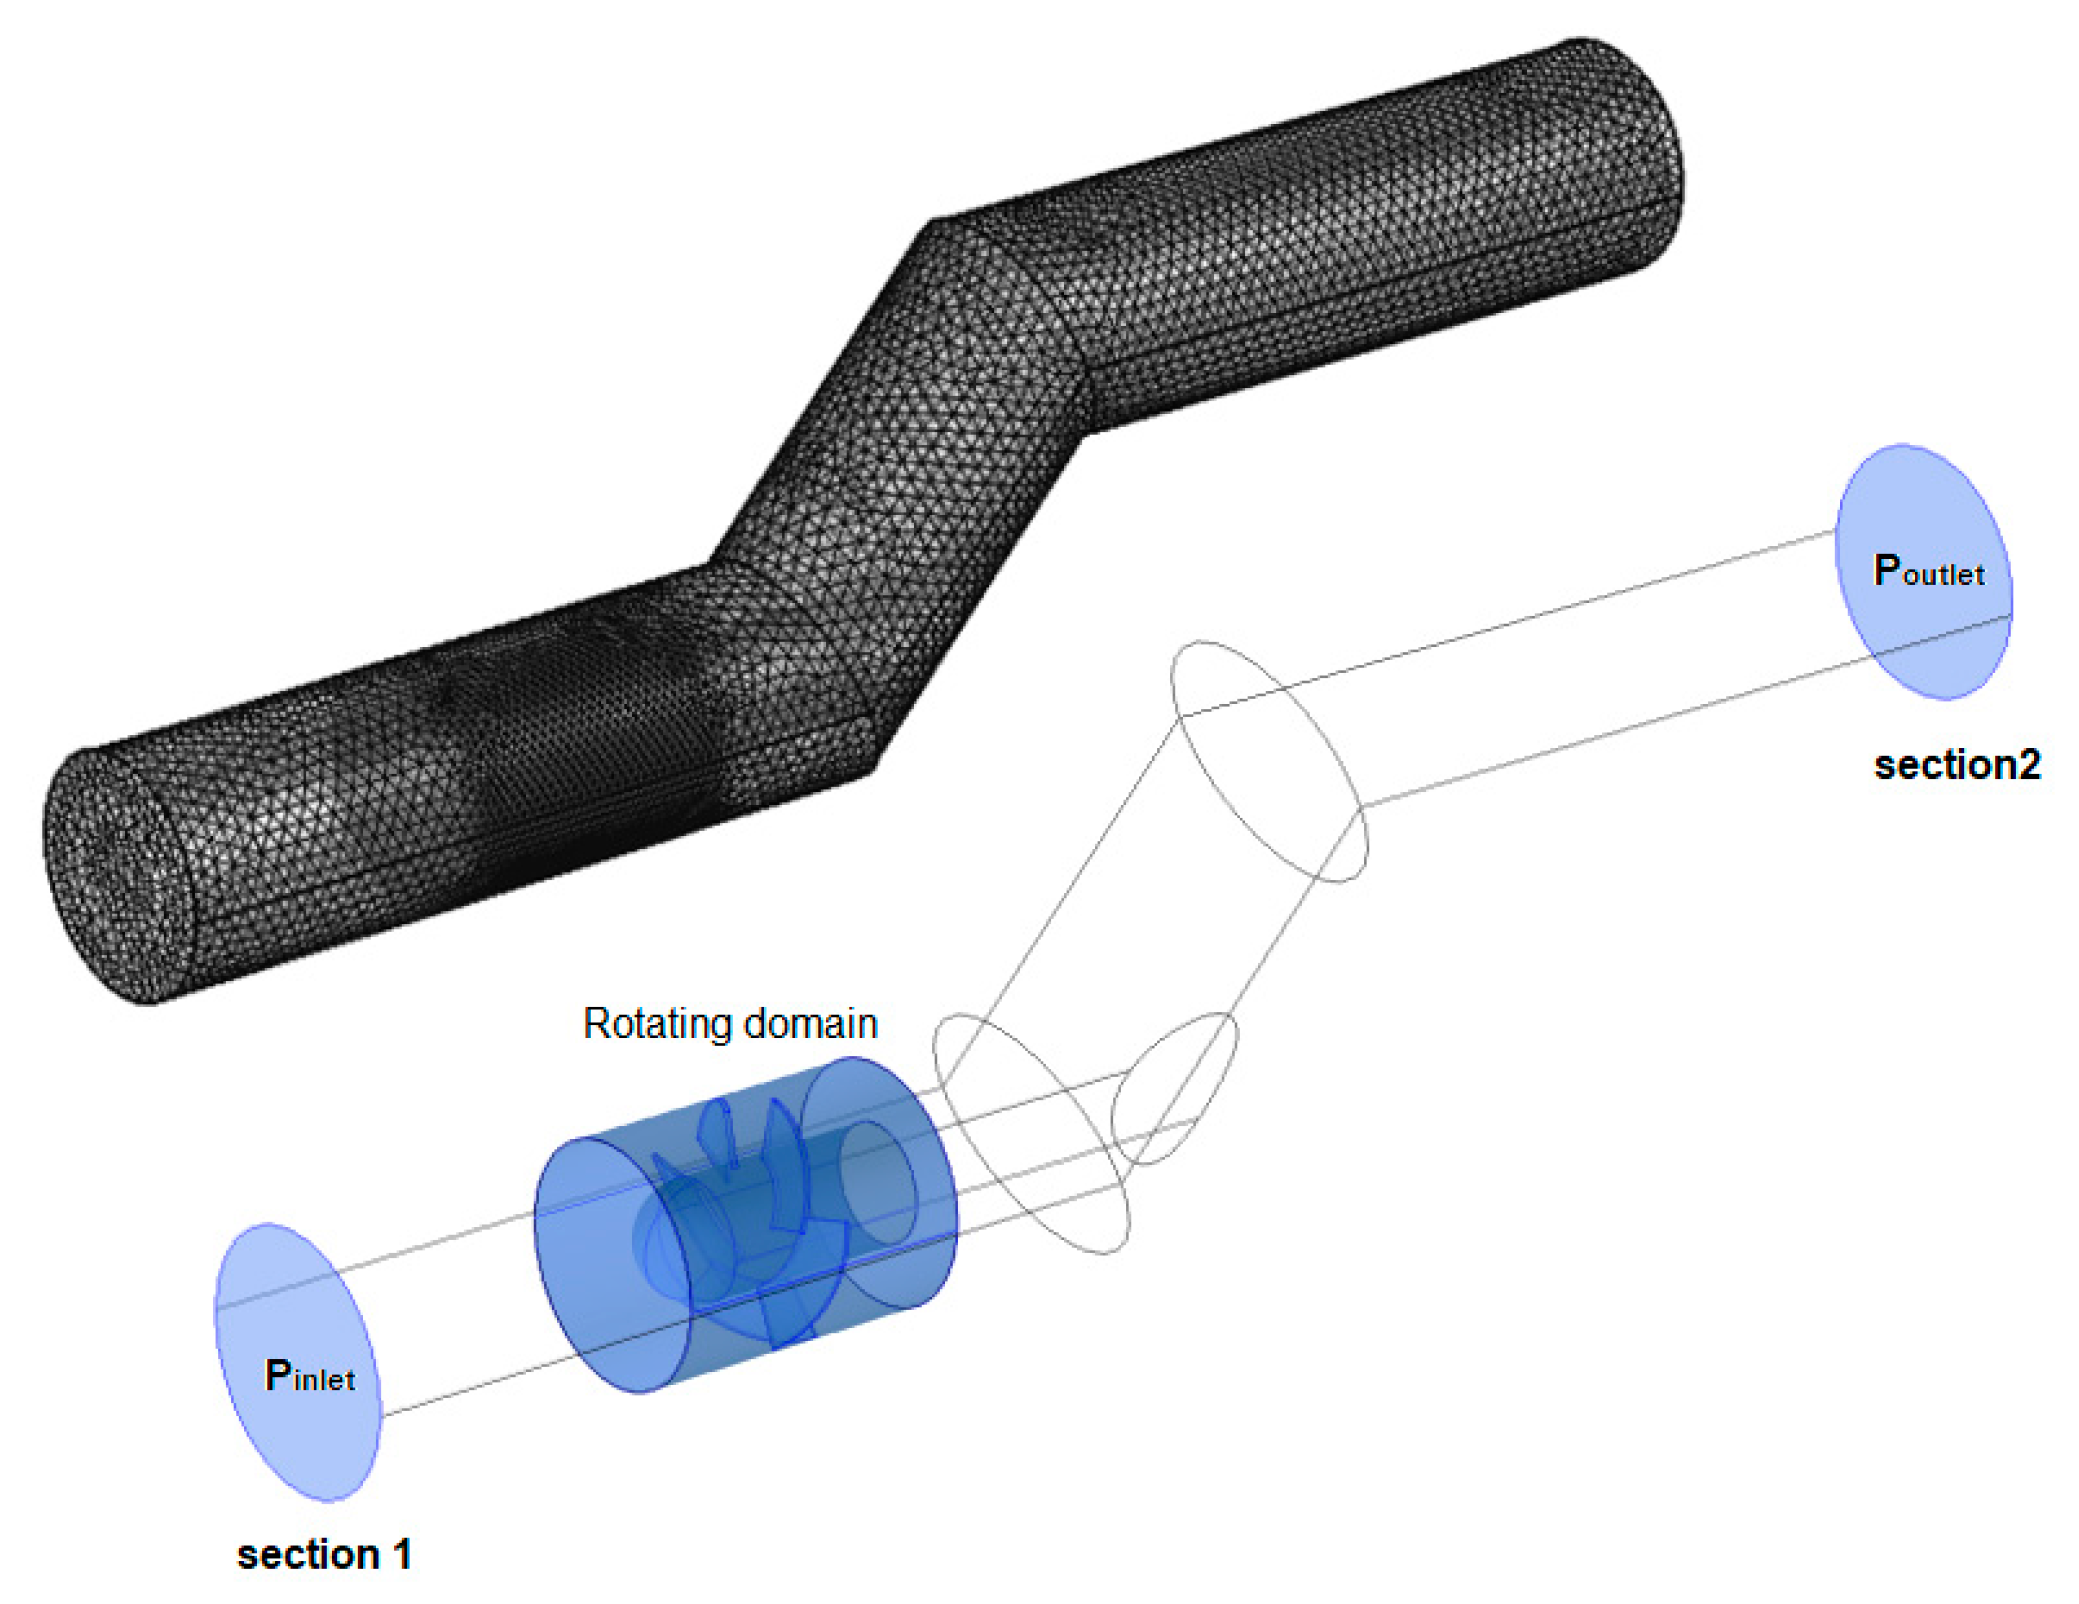
The 3D geometric model of the turbine propeller was designed in CAD and imported to the CFD model (COMSOL–Multiphysics 4.3b), where all necessary components such as, number of blades, blade thickness, blade angle, were properly defined and created. The simulations were conducted using the k-ε model as the turbulent model applied (20,850 < Reynolds < 209,000), the properties of water as the incompressible fluid, and a steady-state regime. An automatic mesh generation was performed after defining the geometric model by specifying values for the parameters used to control the mesh resolution [
25]. These parameters must be appropriate to geometric model features in order to achieve outcomes with adequate level of accuracy and at the same time without significant computational resources. Herein, the mesh near the blade’s surface needed to be refined with an extra fine mesh for solving turbulence equations [
26]. A mesh convergence analysis was checked by observing the accuracy of the computed maximum pressure, with the use of a finer mesh and thereby a higher number of degrees of freedom (DOF). By using adaptive mesh refinement, the mesh elements based on an error criterion (smaller than 5%) was defined. The convergence process analysis showed that the computed pressure value increased from the original 0.1 bar for a mesh of approximately 50,000 DOF to 1.81 MPa for a mesh of approximately 1,000,000 DOF, showing that 750,000 DOF give the same precision as 1,000,000 DOF. Thus, the fluid domain was built by 265,103 tetrahedral elements, with a good element quality (
Figure 4).
The boundary conditions set to
Section 1 and
Section 2 (
Figure 4), were the turbine system inlet and outlet points measured, i.e., the recorded pressure in each transducers (located upstream and downstream the turbine and the pipe curve) was allocated to the inlet and outlet conditions. The respective rotational speeds achieved experimentally for each simulation were set for the impeller’s rotation. The rotating domain was set as a moving mesh. This definition controls the spatial frame and applies to all physics interfaces where the domains are rotating. Thus, these interfaces formulate the equations of Navier-Stokes in a rotating coordinate system, in the inner domain, and in the outer one in fixed coordinates. The Navier-Stokes equations for incompressible fluids are expressed in Equation (5):
where
is the dynamic viscosity,
the fluid velocity,
the fluid density,
the pressure and
is the external forces applied to the fluid.
Parts that are not rotating are expressed as fixed material. These fixed parts need to be coupled with the rotating ones using an identity pair, where the fluid continuity boundary condition is applied. At the walls, the no-slip condition was set. Finally, wall functions were used to define the flow at the walls in the description of rotating flows for the k-epsilon model (according to [
27]).
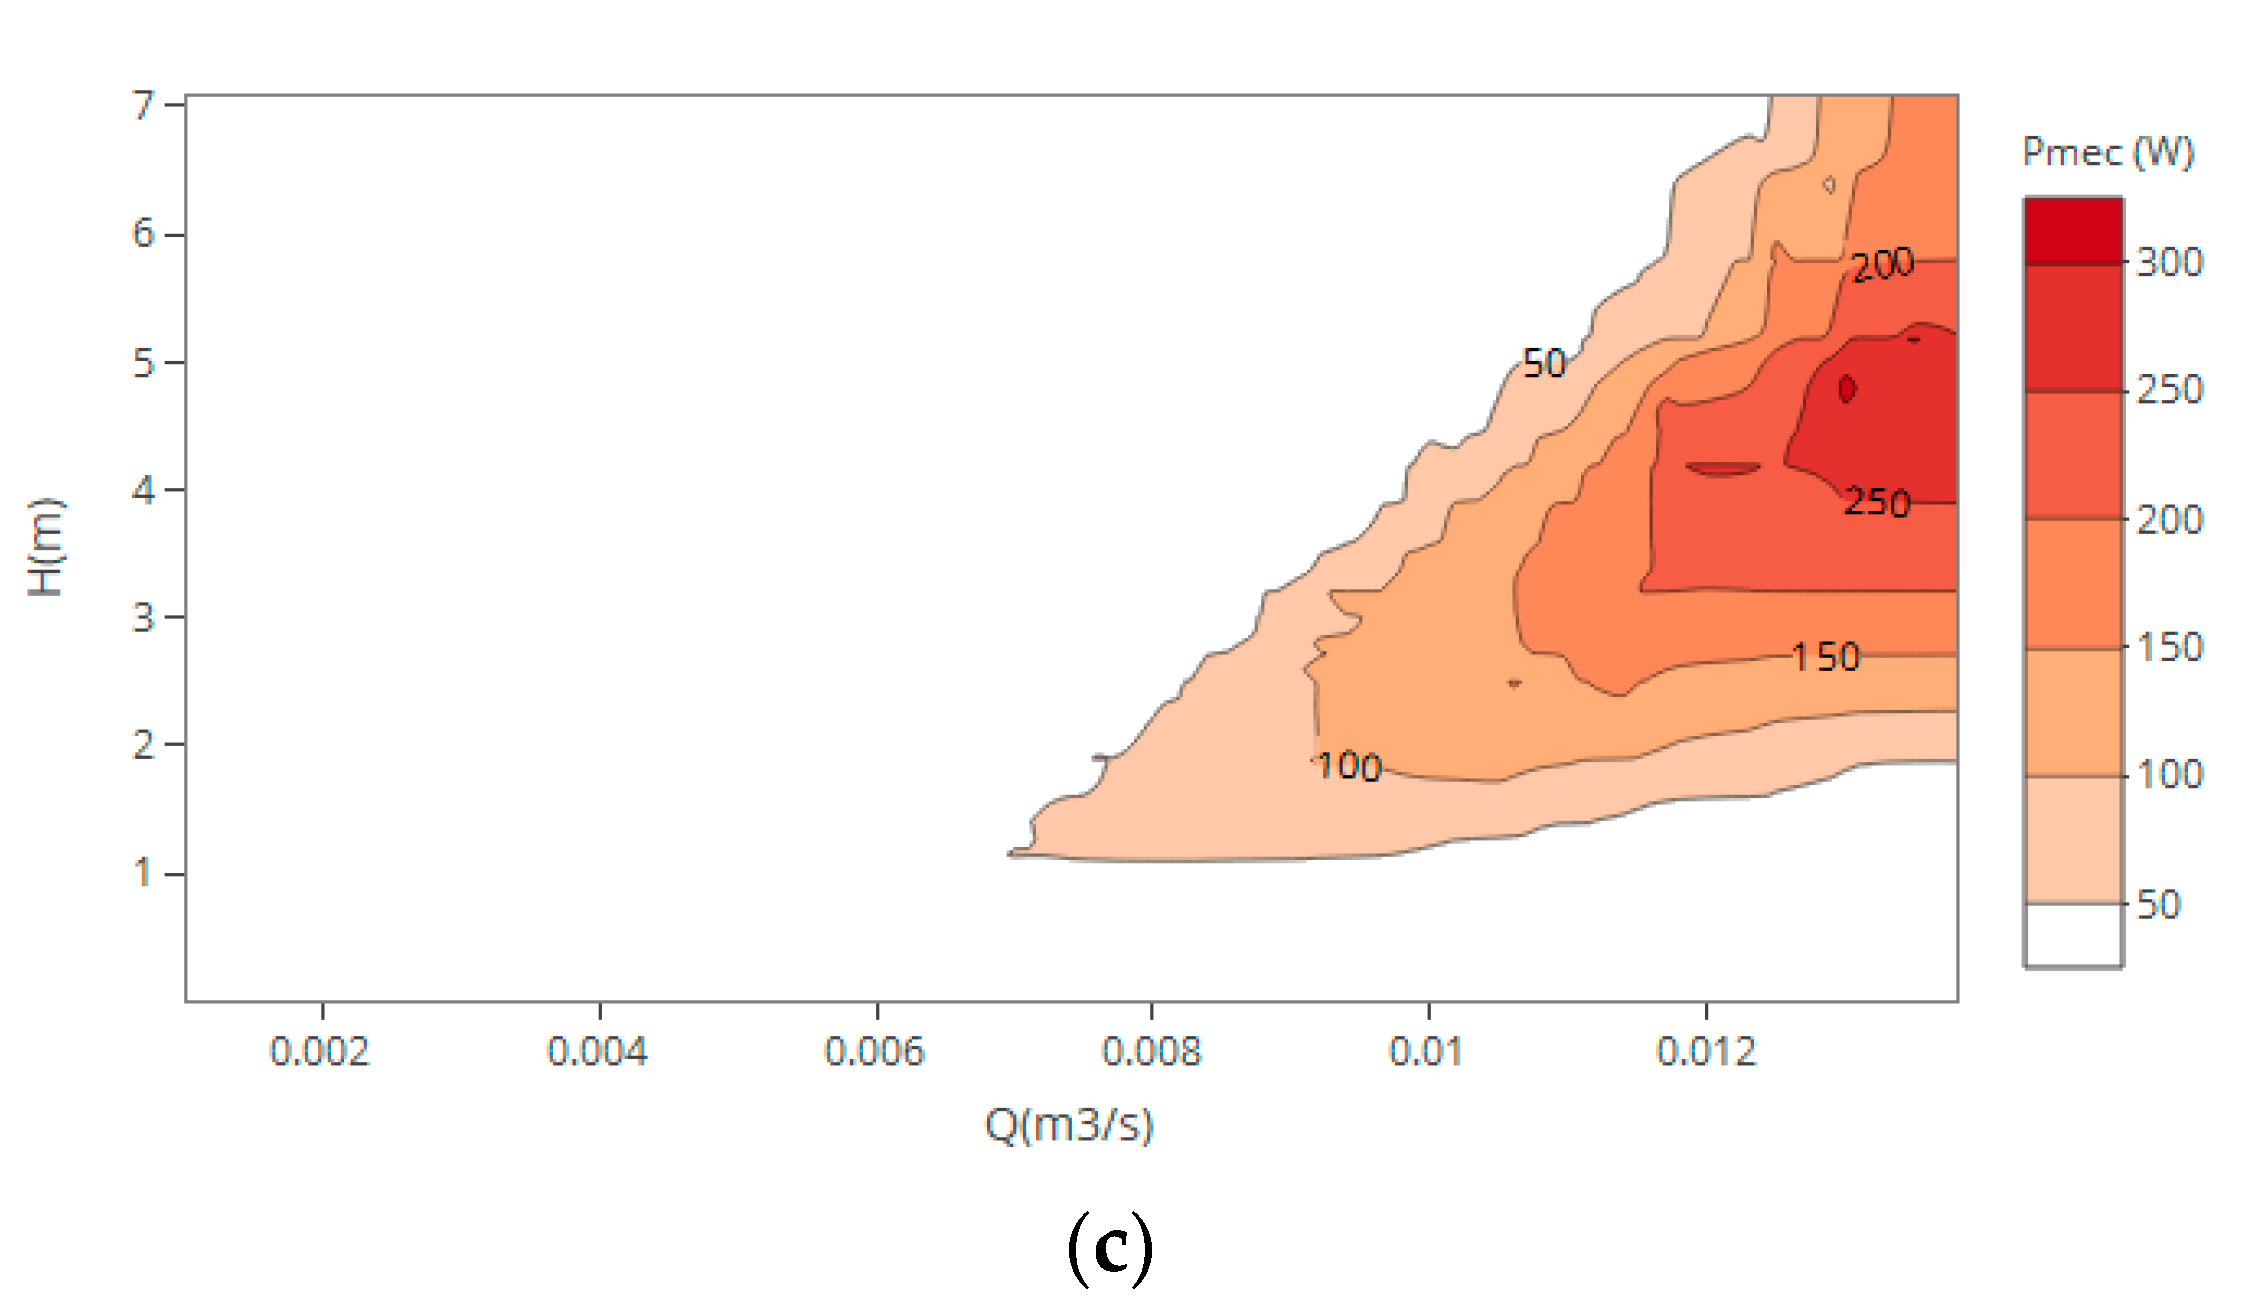
3.2. Propeller with 5 Blades–Design 1 (D = 85 mm)
After validated and calibrated the CFD model, numerical simulations were performed for flow discharges between 2 and 13 L/s for the 85 mm impeller (
Figure 5). The peak mechanical power measured for a maximum flow of 0.013 m
3/s is around 320 W, with 4.76 m of head for 1500 rpm. The results are in accordance with experimental tests presented in
Figure 2.
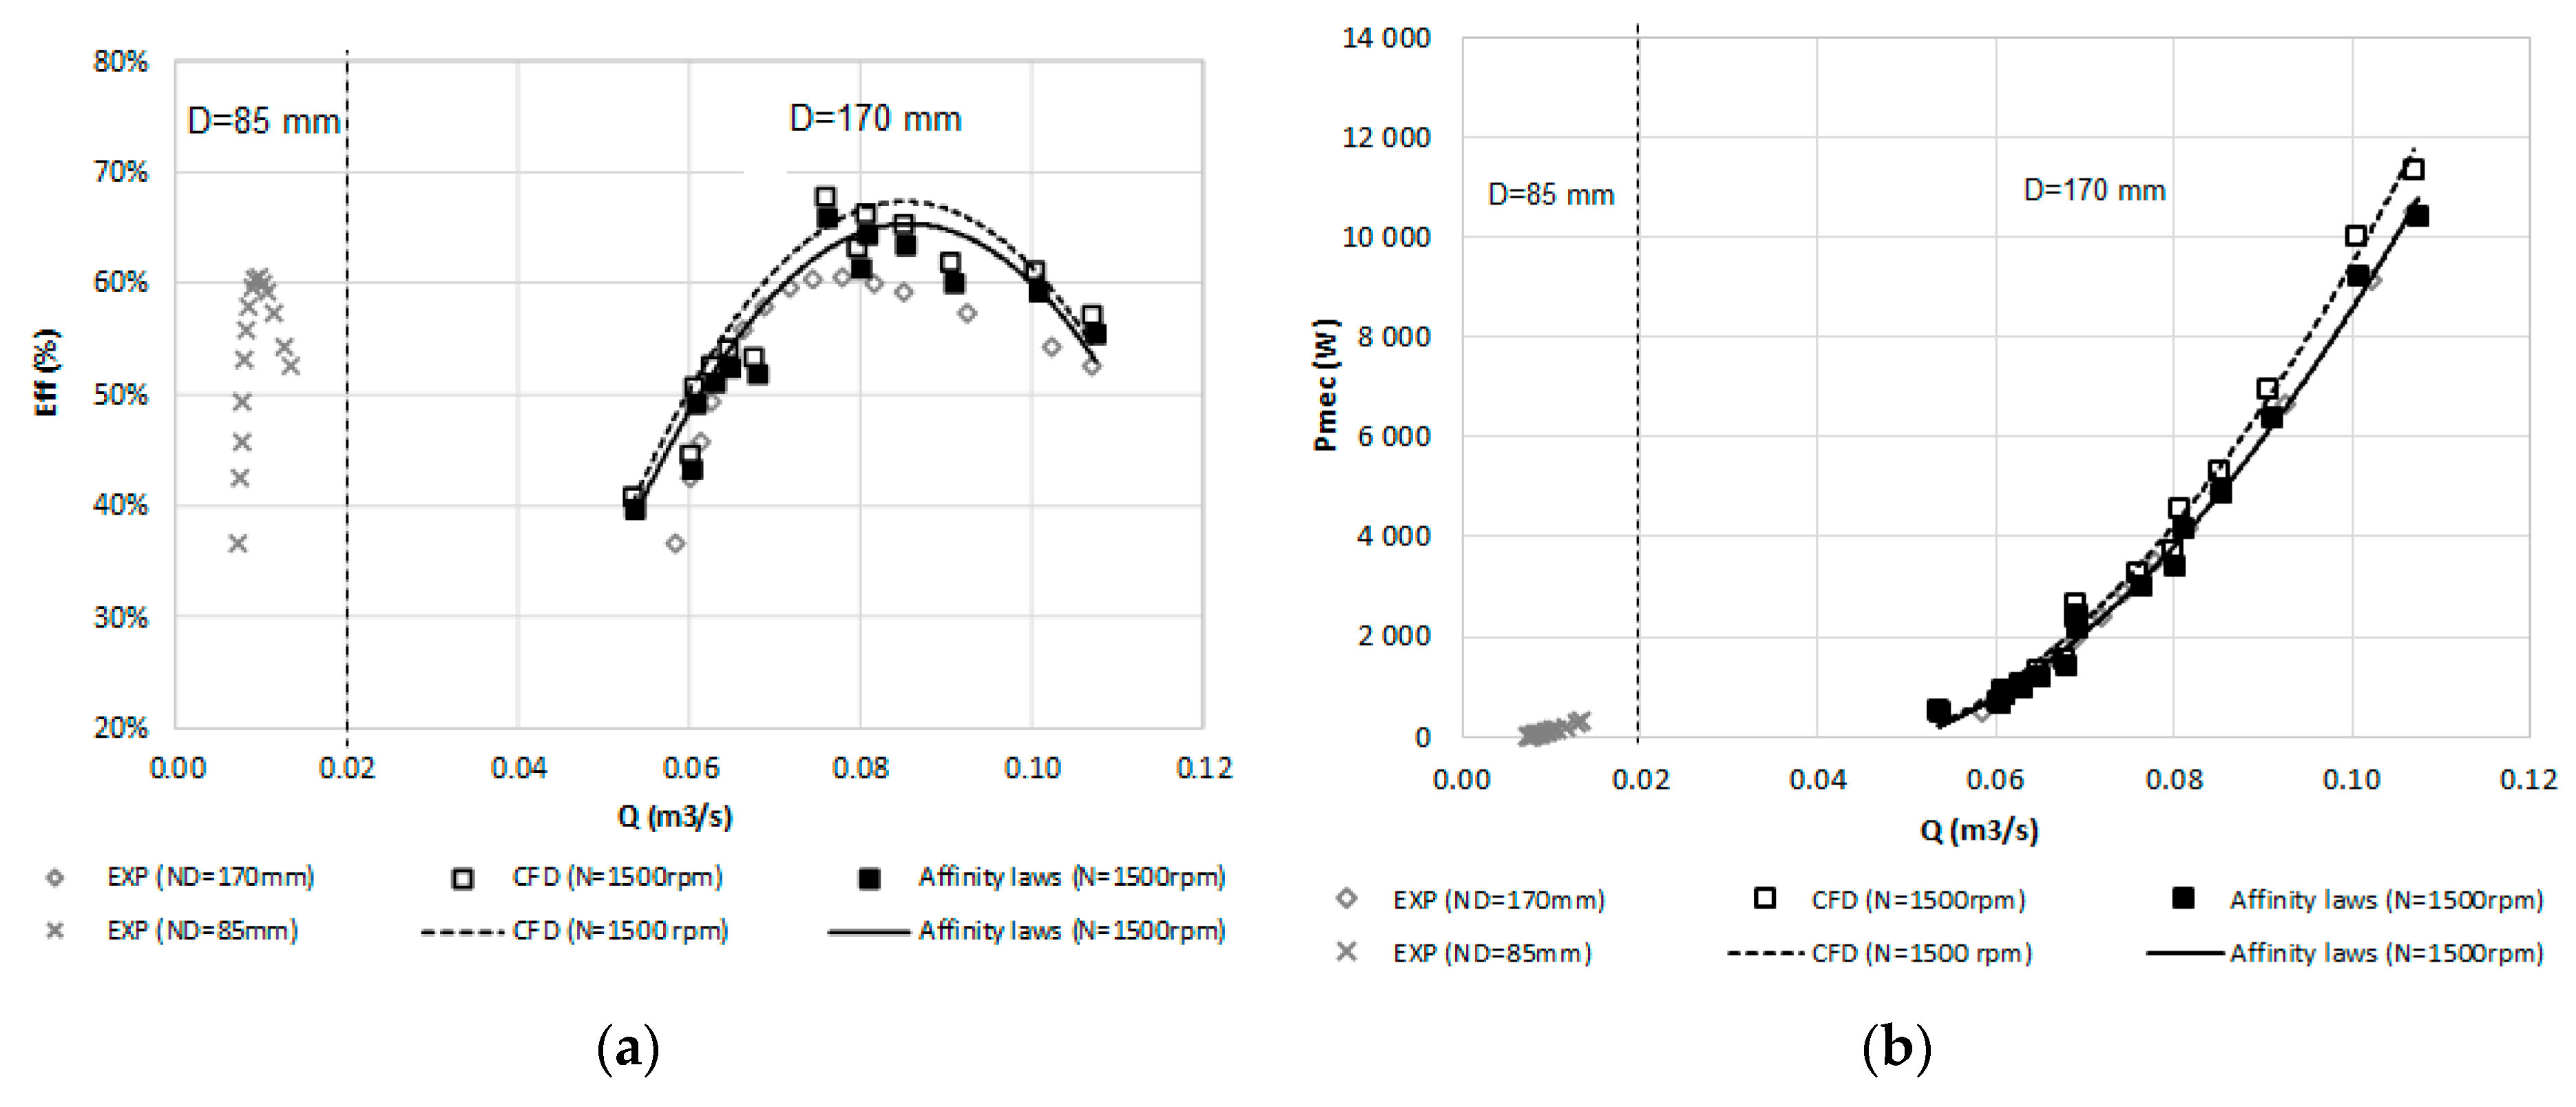
3.3. Propeller with 5 Blades–Design 2 (D = 170 mm)
Model testing requires principles of geometric, kinetic, and dynamic similarity between a model and a prototype. The values of the model turbine power, head and flow rate should not exceed the capacities of the experimental plant, but rather guarantee Equation (1). However, for two machines geometrically similar, but with different diameters, and considering the kinetic and dynamic similarities between them, Equation (1) is valid if the efficiency remains constant. As for two machines with the same diameters, the affinity laws can be modified as Equation (3) proposed by [
21], where the head loss effect (i.e., the variation of Reynolds number) is considered. Knowing these correlations and in order to evaluate the performance of the axial turbine for different diameters without assuming the condition imposed by Equation (1), the conditions of similarity described by Equations (1) and (3) were applied together with CFD models, where:
- (1)
the experimental results, obtained for D = 85 mm, were extrapolated using Equation (1) to a similar turbine with D = 170 mm;
- (2)
through the CFD model, the results associated with D = 170 mm were obtained;
- (3)
affinity laws proposed by [
21] were applied to the numerical results and compared with the previous ones.
The comparison between CFD models and the empirical formulations showed that the affinity laws proposed by [
21] properly represent axial turbomachines (
Figure 6a,b), with the exception of the fitting function related to the head loss (
Figure 6c). In this case, a new affinity function was improved with a significant reduction between the theoretical and simulation values of head (
Figure 6d).
By combining the affinity laws with numerical models, additional adjustments were implemented, where new functions and similarity conditions for axial turbines with different diameters and efficiencies were proposed:
where
is the ratio between
and
,
,
and
are the new modified fitted functions based on [
21], that depend not only in the experimental data, but also in CFD results.
Figure 7 shows the new predicted efficiencies and head for
D = 170 mm, given by Equation (6). The BEP achieved was 69% for a mechanical power of 2 kW, 0.069 m
3/s of flow, 4.92 m of head and 1500 rpm using the new proposed affinity laws.
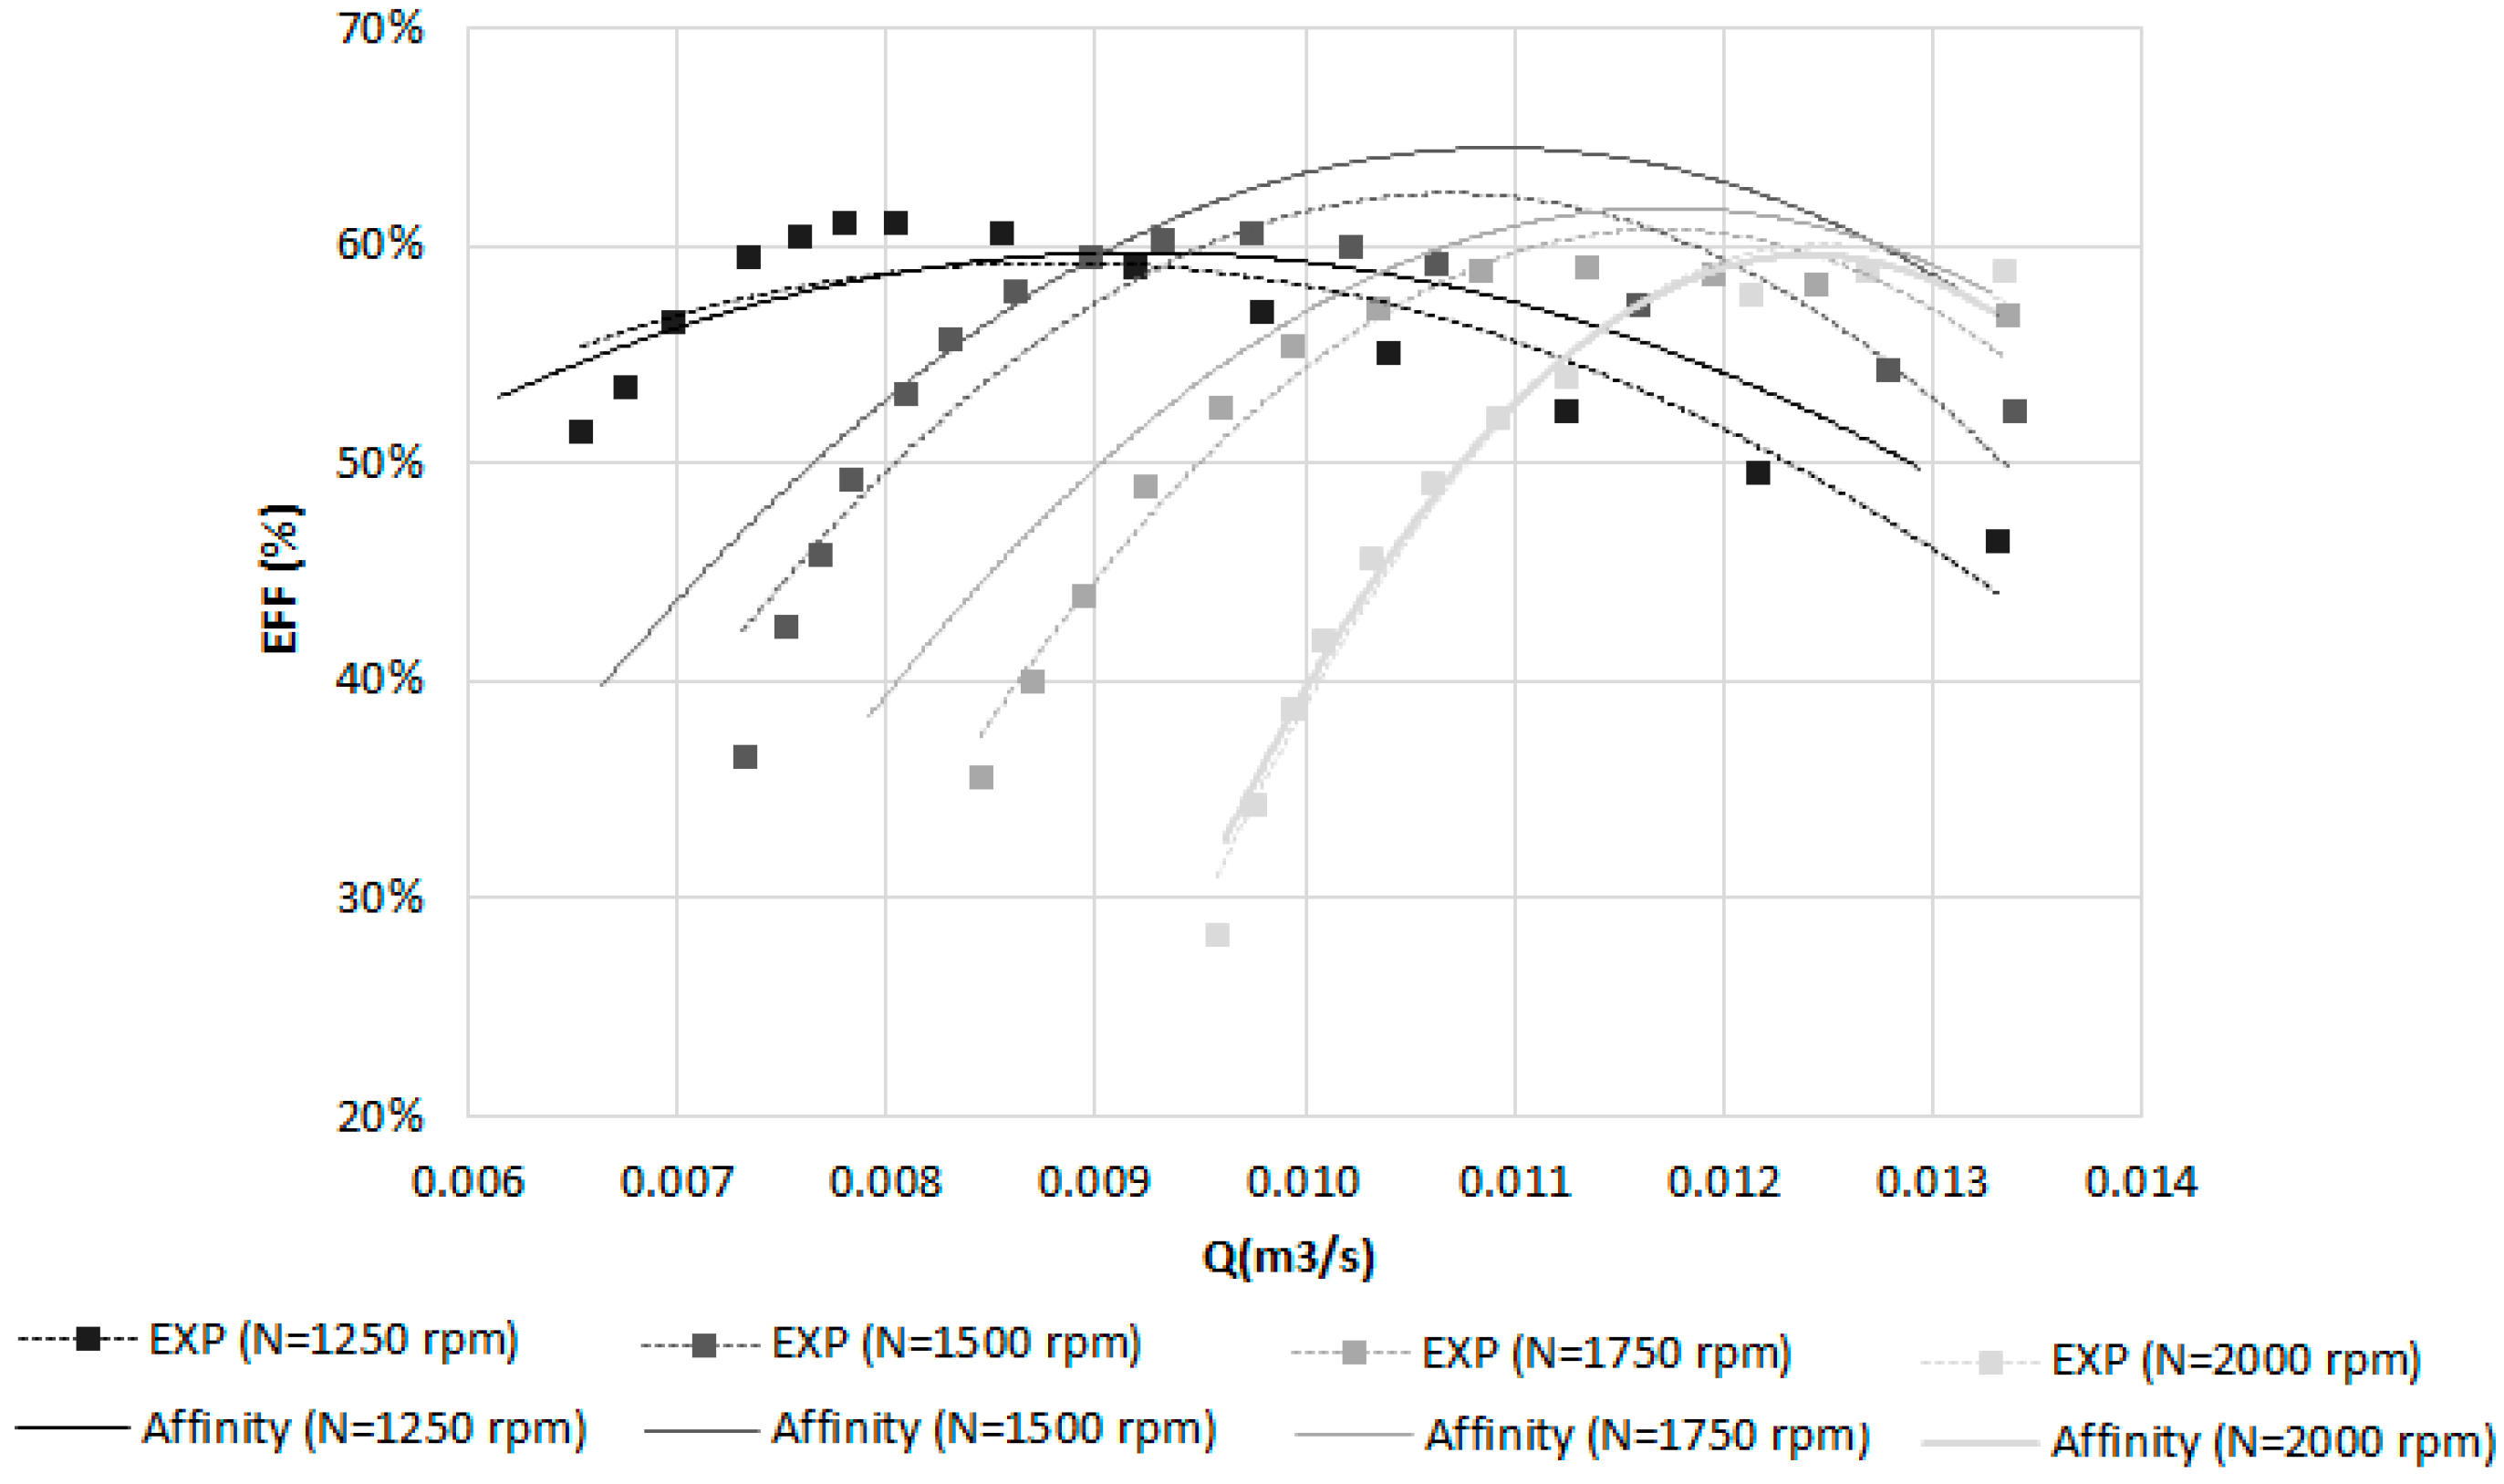
To validate the new proposed formulations in predicting the performances of the machines for different diameters without remaining constant efficiency, Equation (6) was applied for the propeller turbine with 85 mm and compared to the experimental curves (
Figure 8). According to
Figure 8, the prediction of the performances of different machines suggests that the new proposed affinity laws can be considered reliable, with mean errors less than 12%.
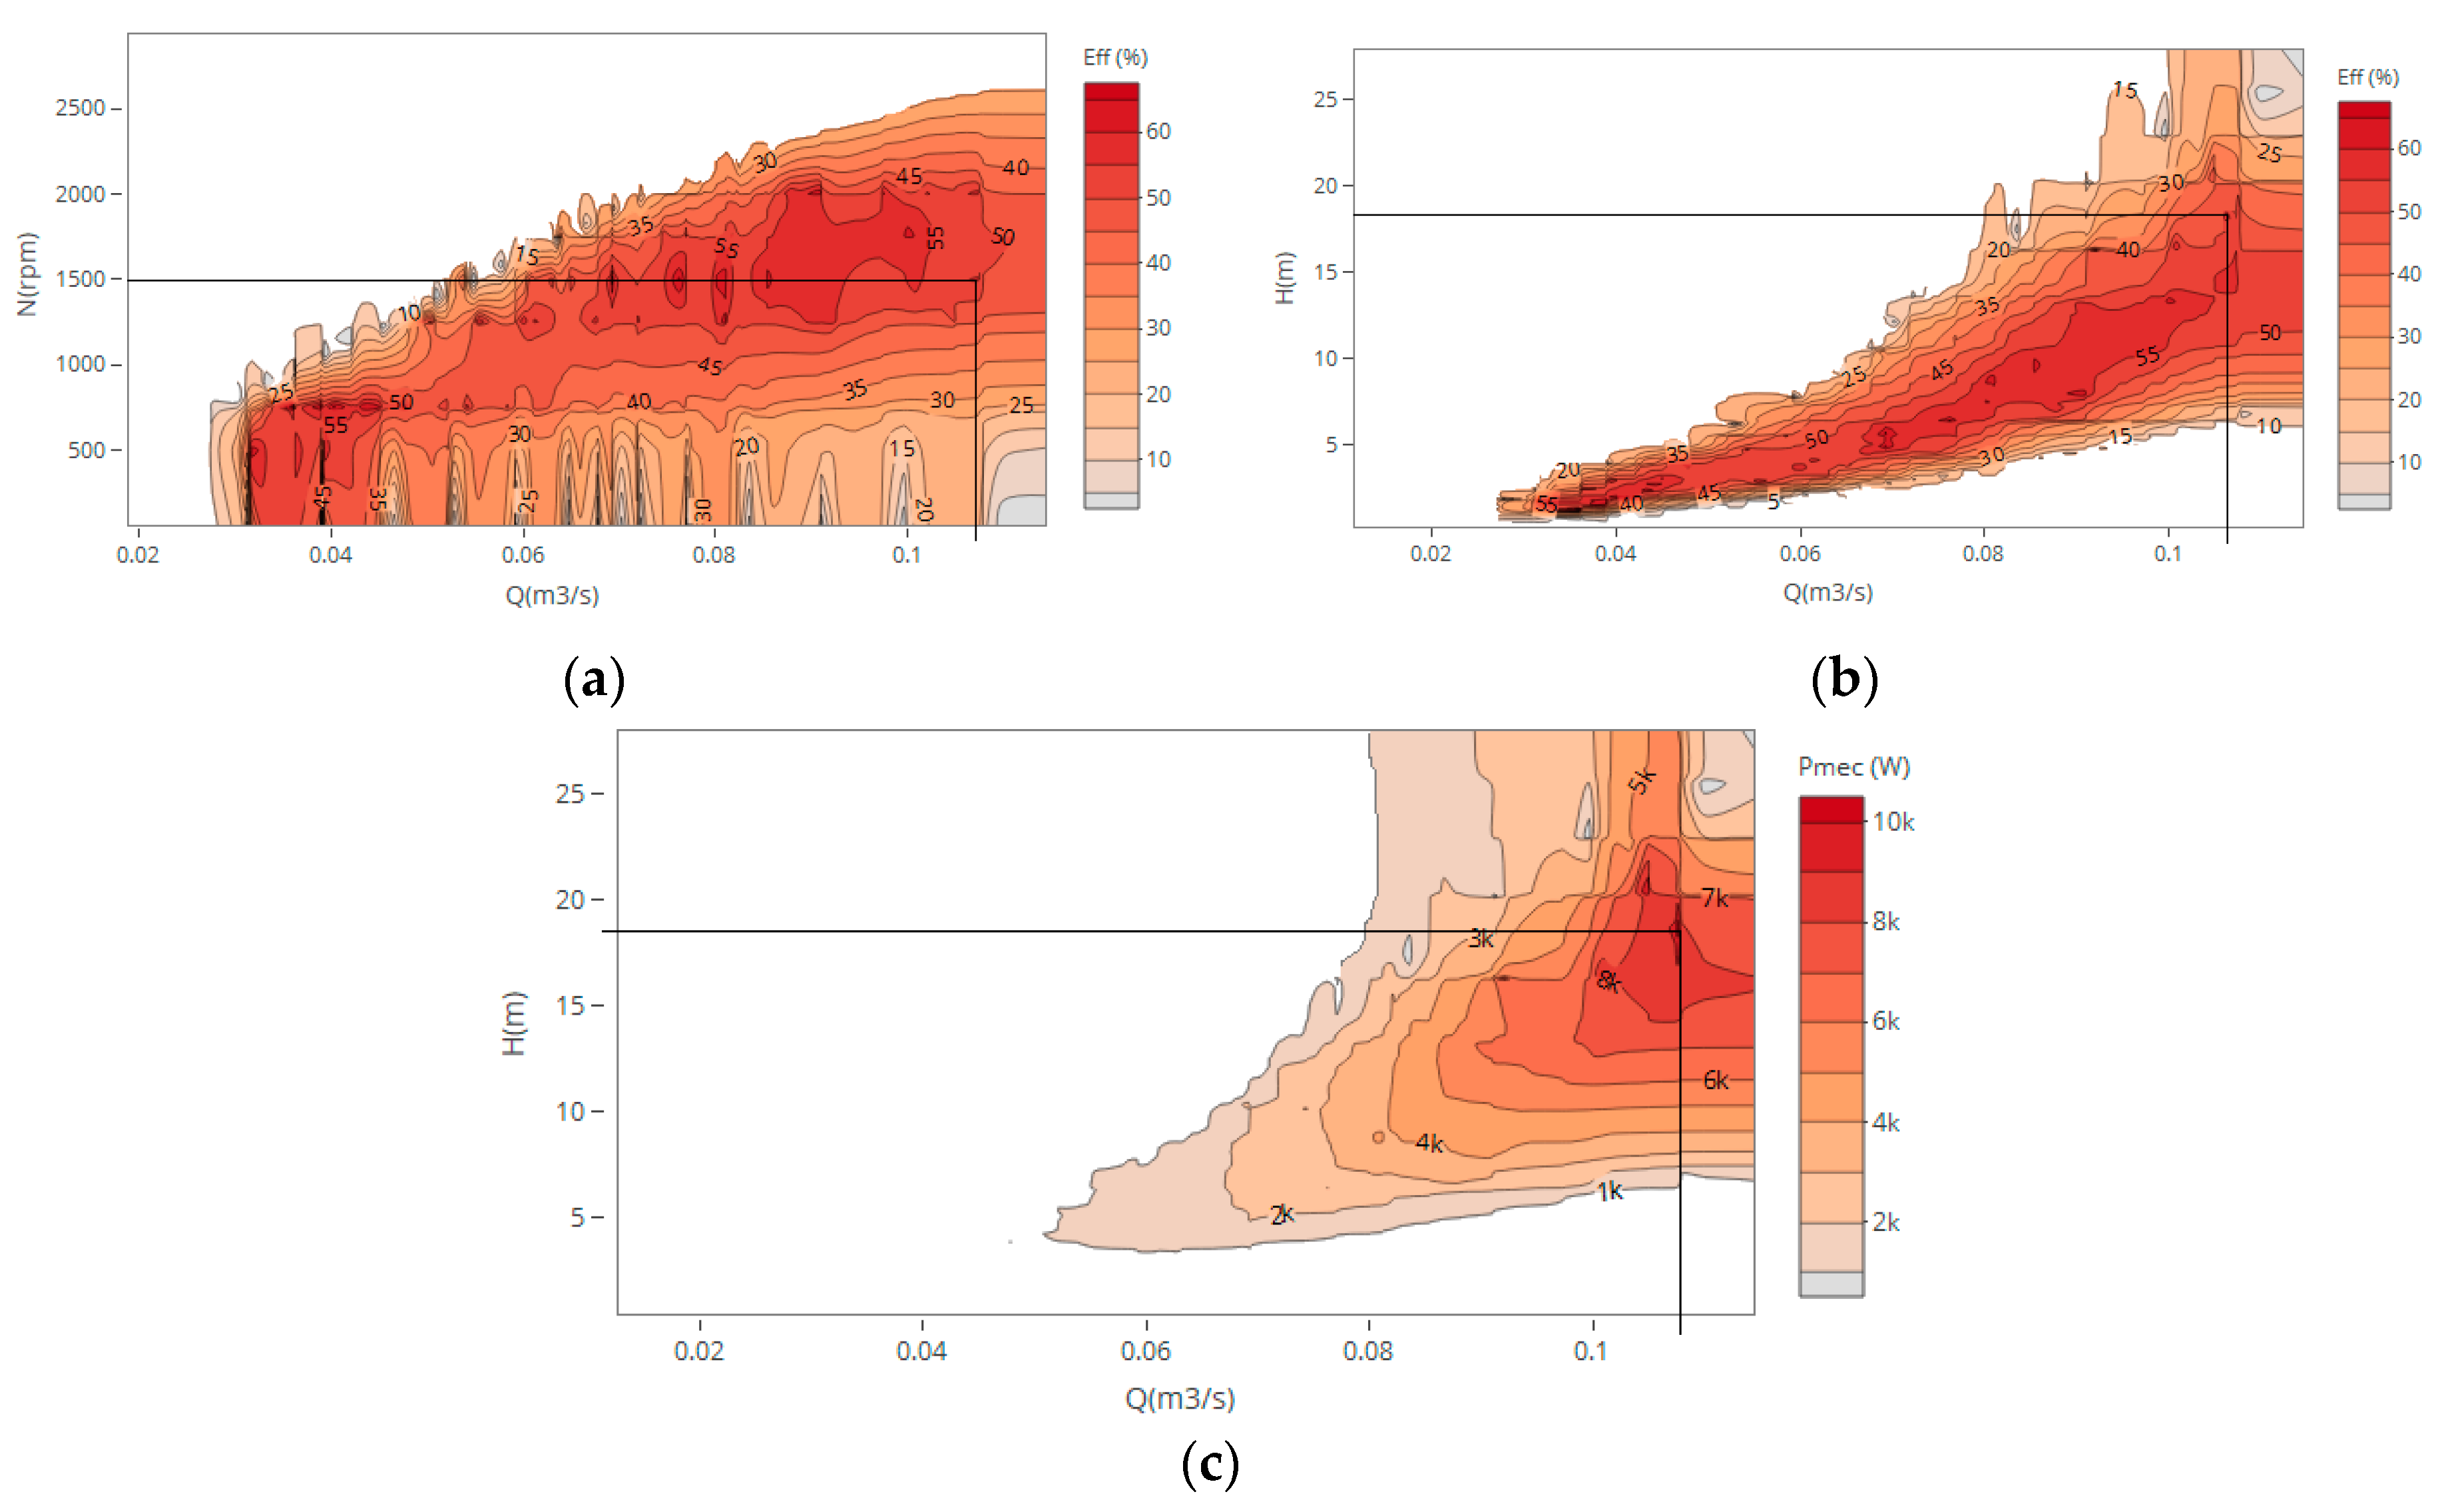
For axial turbines, the performance assessment in hill chart representation for a turbine with
D = 170 mm was obtained (
Figure 9), i.e., the characteristic and efficiency curves through Equation (6).
The maximum mechanical power achieved was 10 kW, for a rotational speed of 1500 rpm, 0.107 m
3/s of flow, and 18.67 m of head (
Figure 9). These results help to understand how this turbine behaves by applying affinity laws and CFD (calibrated model), for installing this micro turbine in a main trunk pipe, with better power value installed.
3.4. Comparisons
Scale effects lead as a deviation between the prototype and the numerical model owing to parameters of design that are not identical to actual parameters. Since the model’s Reynolds number is typically higher than the prototype, friction losses are bigger than the prototype. In addition, because of the viscous effects, associated to vortex or eddy effects, the model efficiency is usually higher than the prototype.
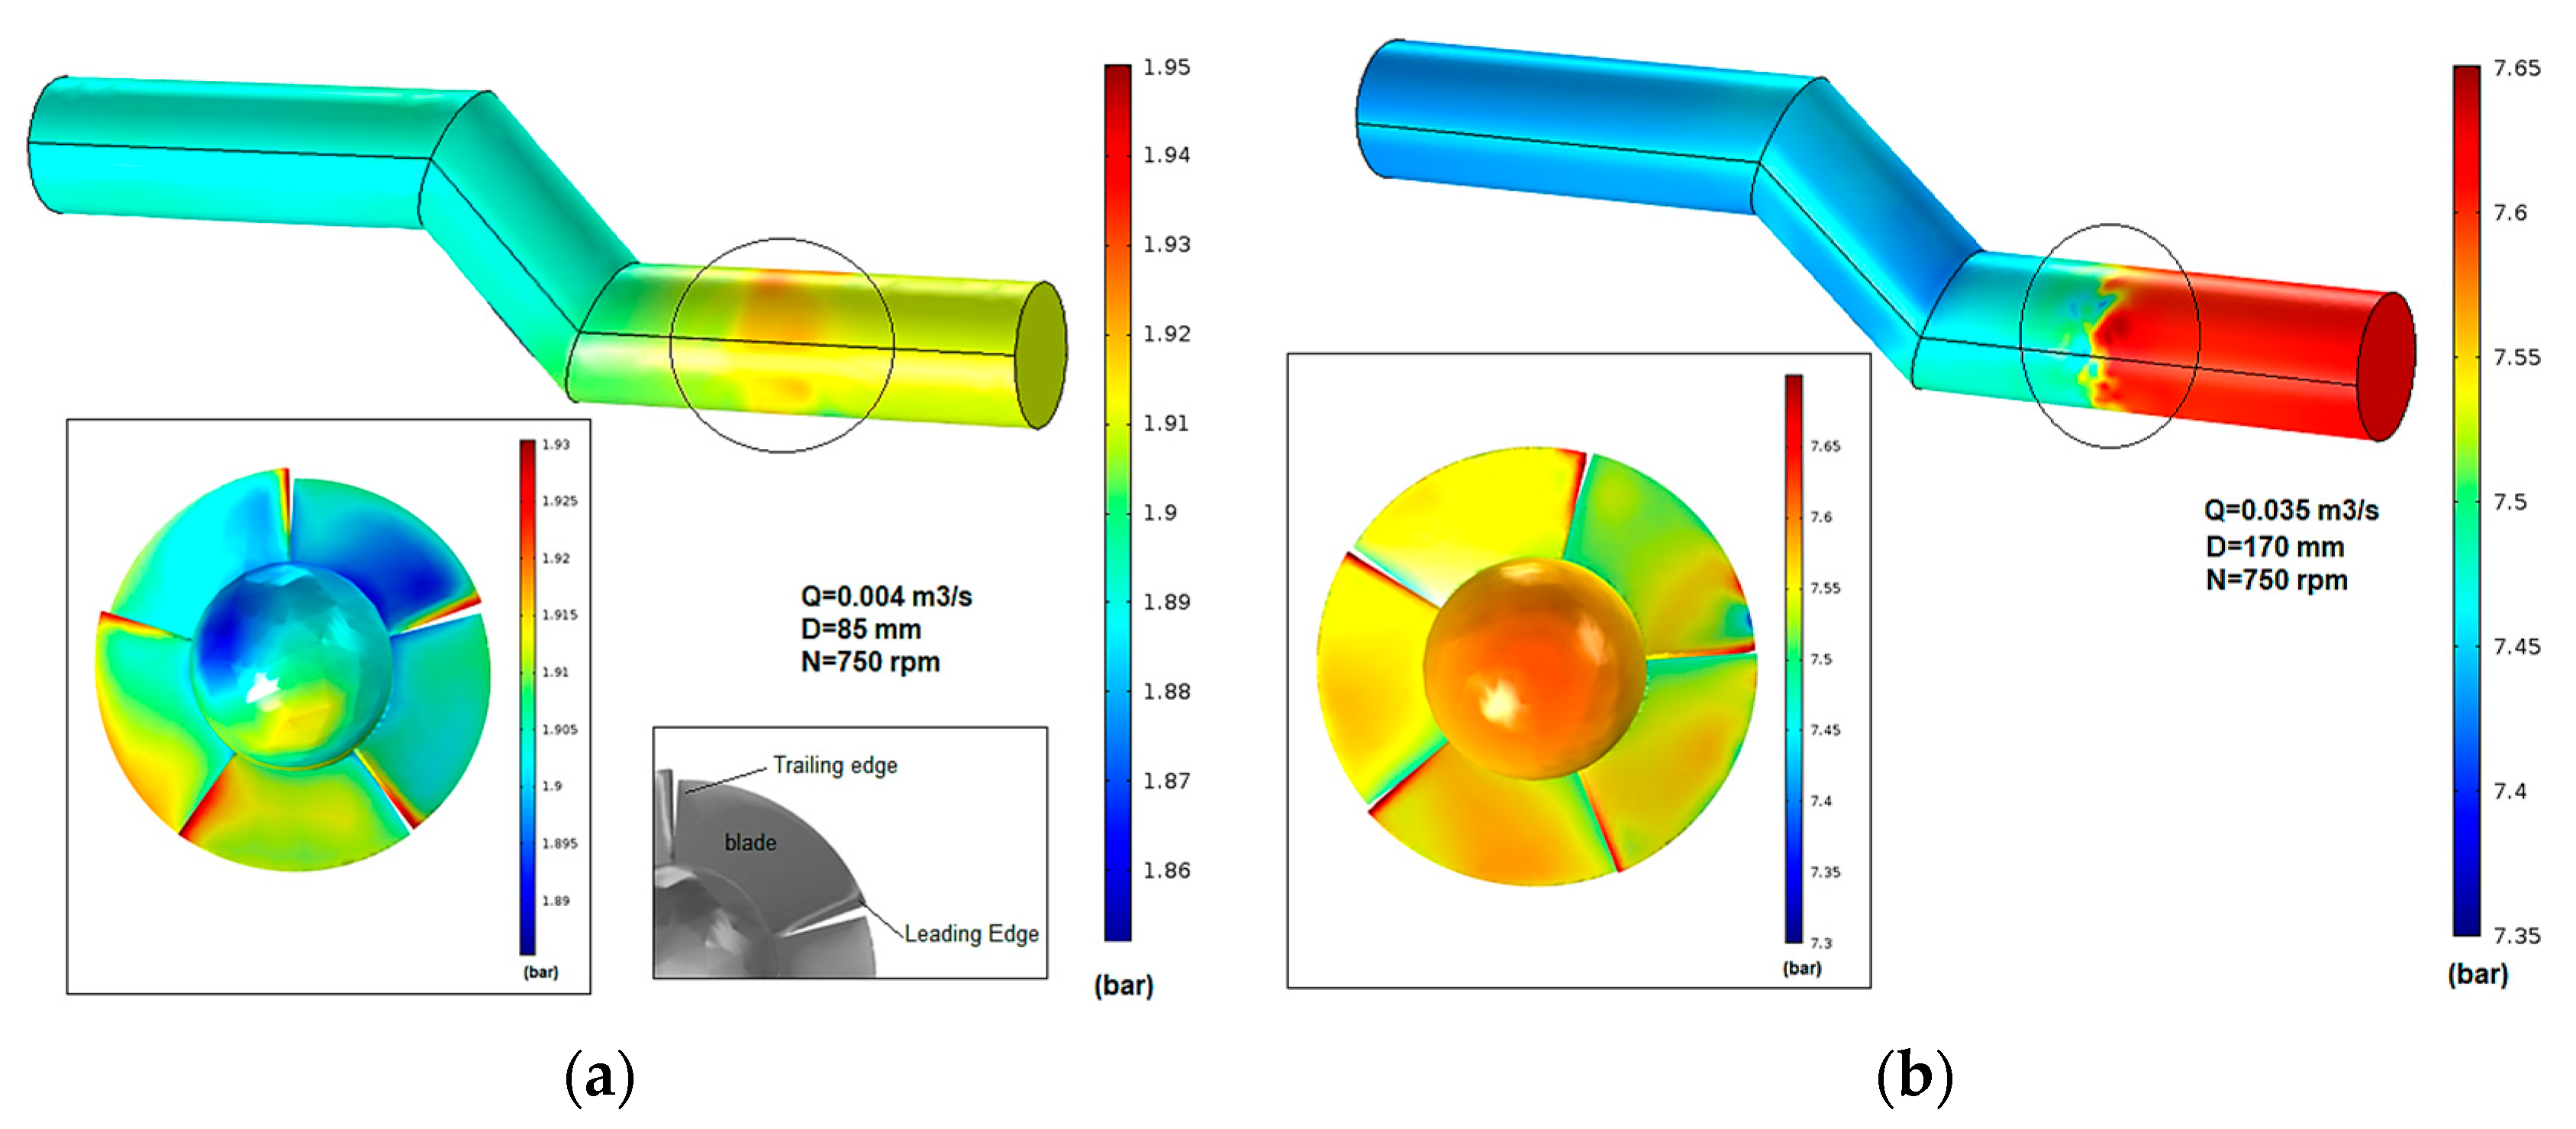
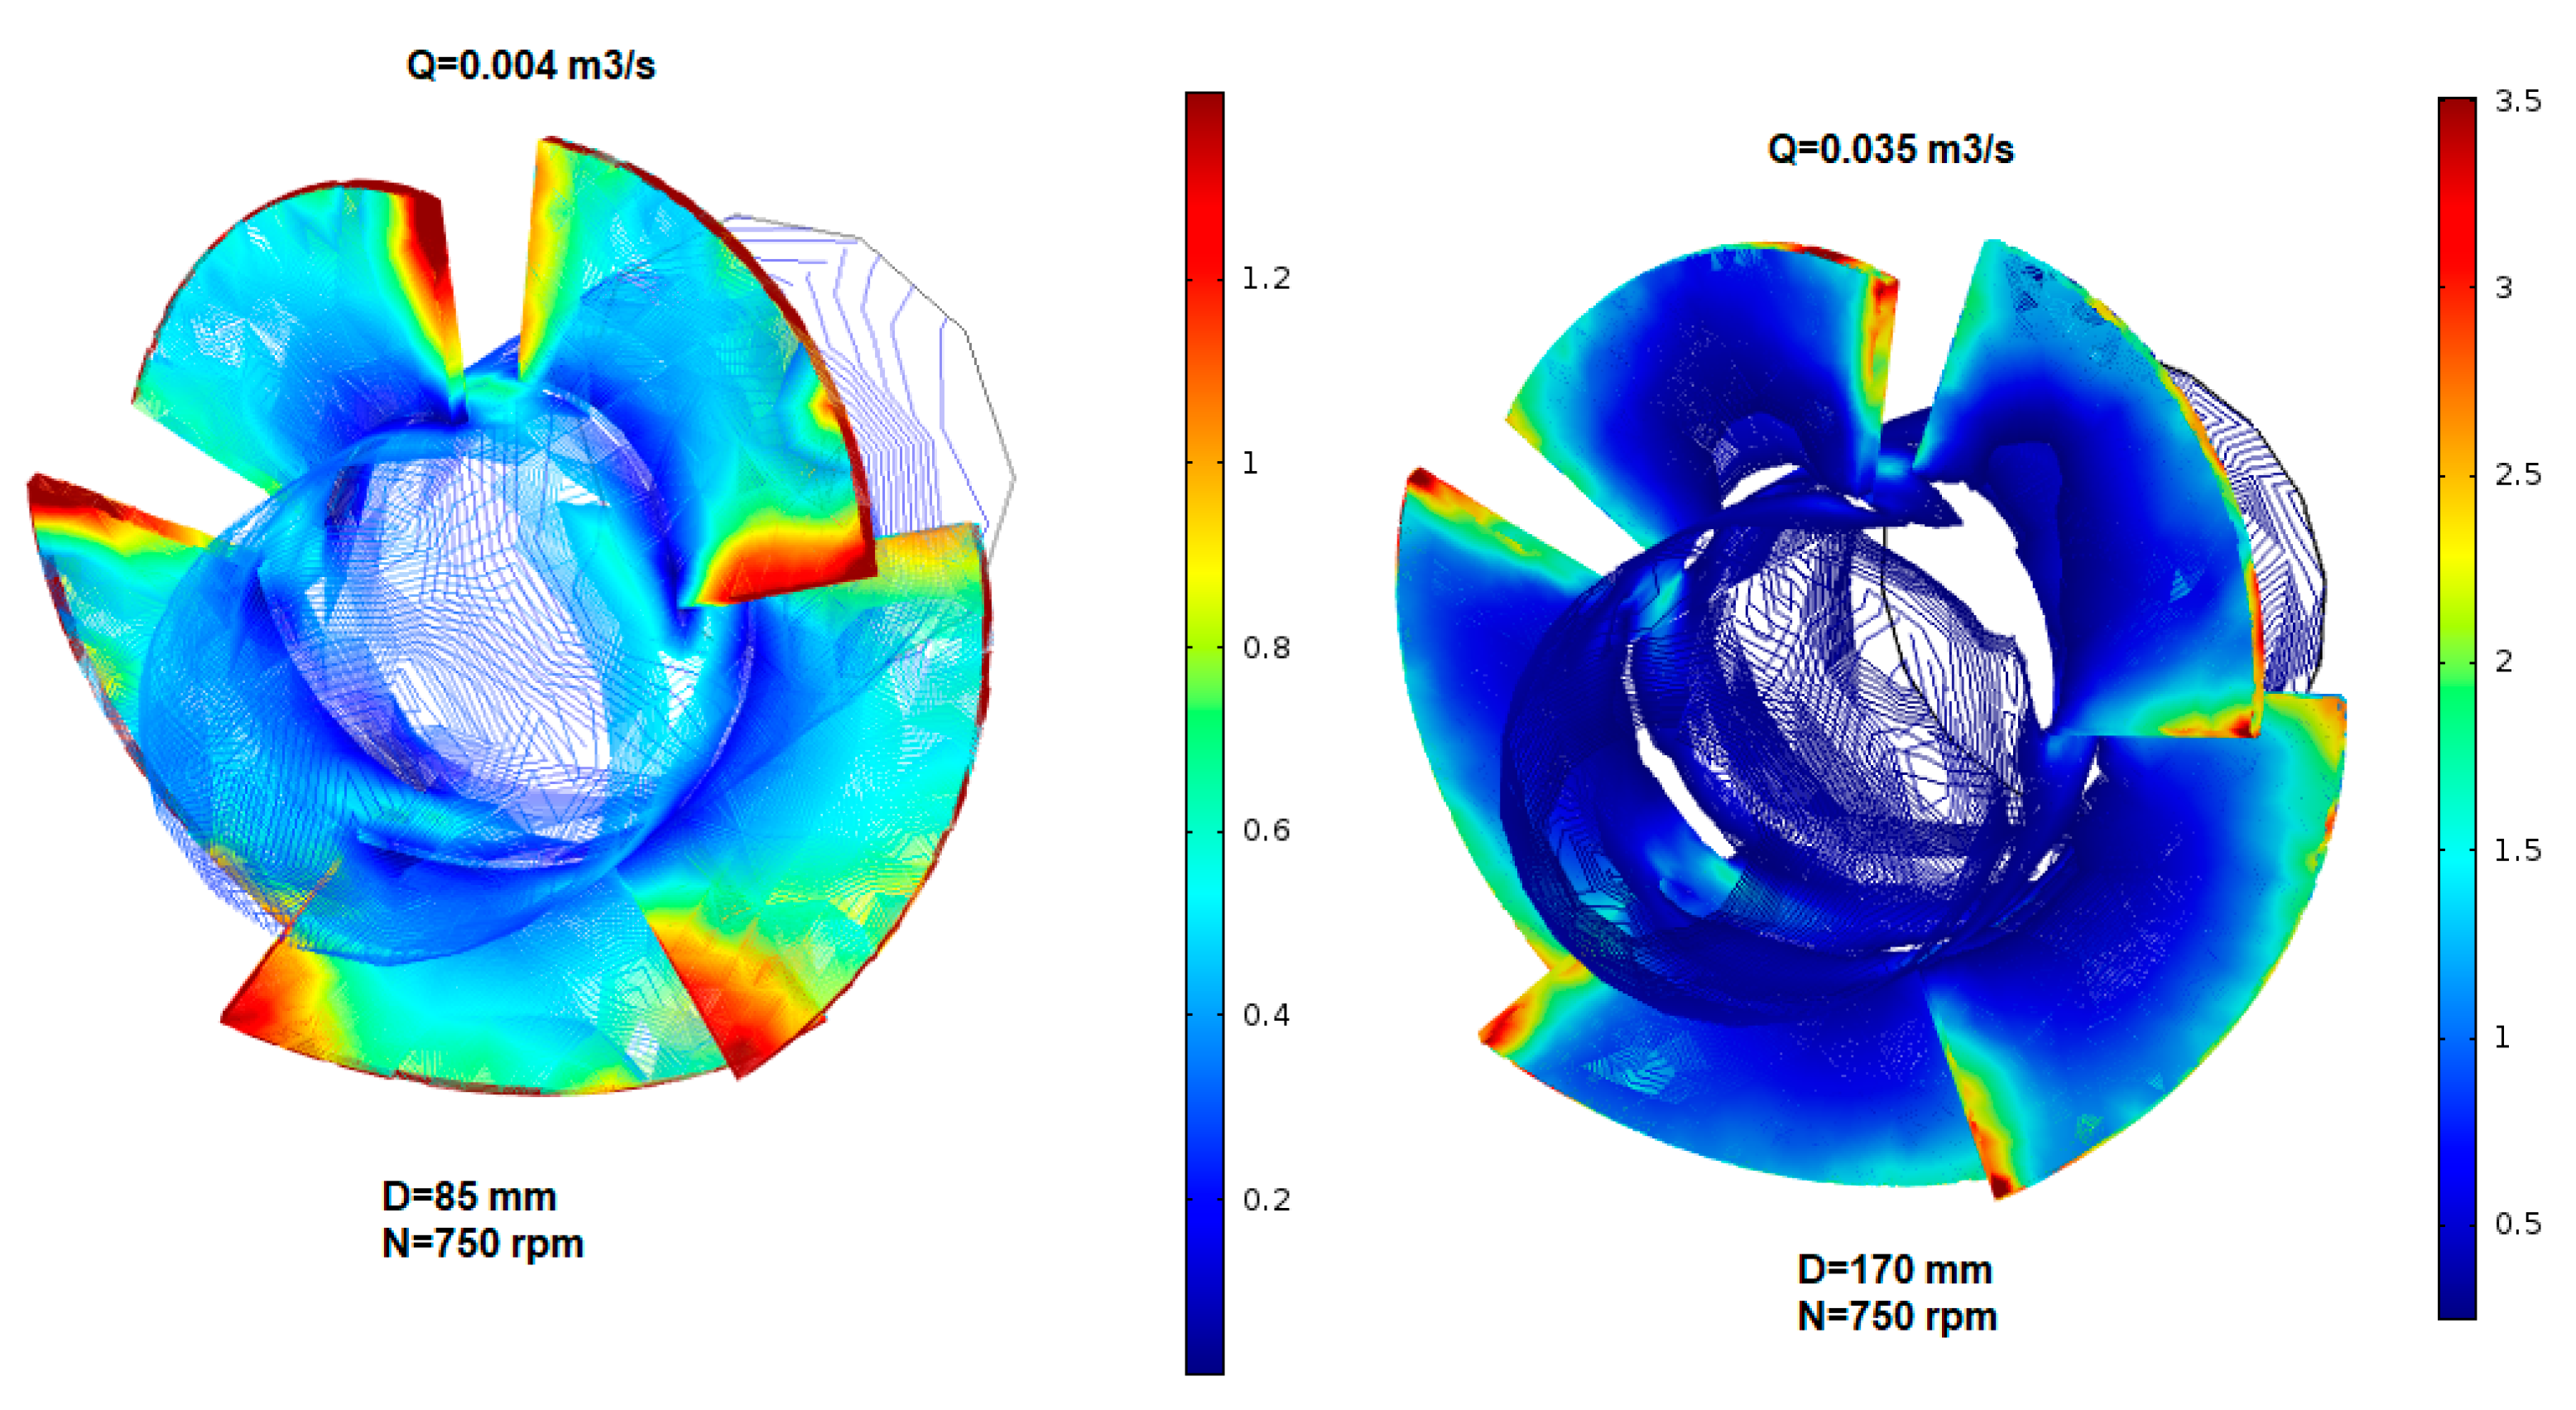
The static pressure distributions inside the tubular propeller turbine are shown in
Figure 10 for design condition 4.4 L/s of mass flow rate and 750 rpm of rotation speed, for
D = 85 mm (Model 1) and for the same speed equivalent to
D = 170 mm (Model 2). Looking to the pressure distribution in the runner, the pressure variation between the inlet and outlet of the runner is lower in Model 1 than Model 2, meaning that in the first one the impeller generates a lower angular momentum. As a result, energy production in Model 1 is also lower.
Low pressure zones (blue region in
Figure 10a) may be detected at the upper side of the bulb at the bottom of the blade’s leading edge after half the blade length [
28]. In
Figure 10b, the maximum pressure is 7.65 bar at the leading edge against 7.45 bar at the trailing edge. The higher velocity speed magnitudes at the trailing edge can explain this low-pressure area [
28] (
Figure 11).
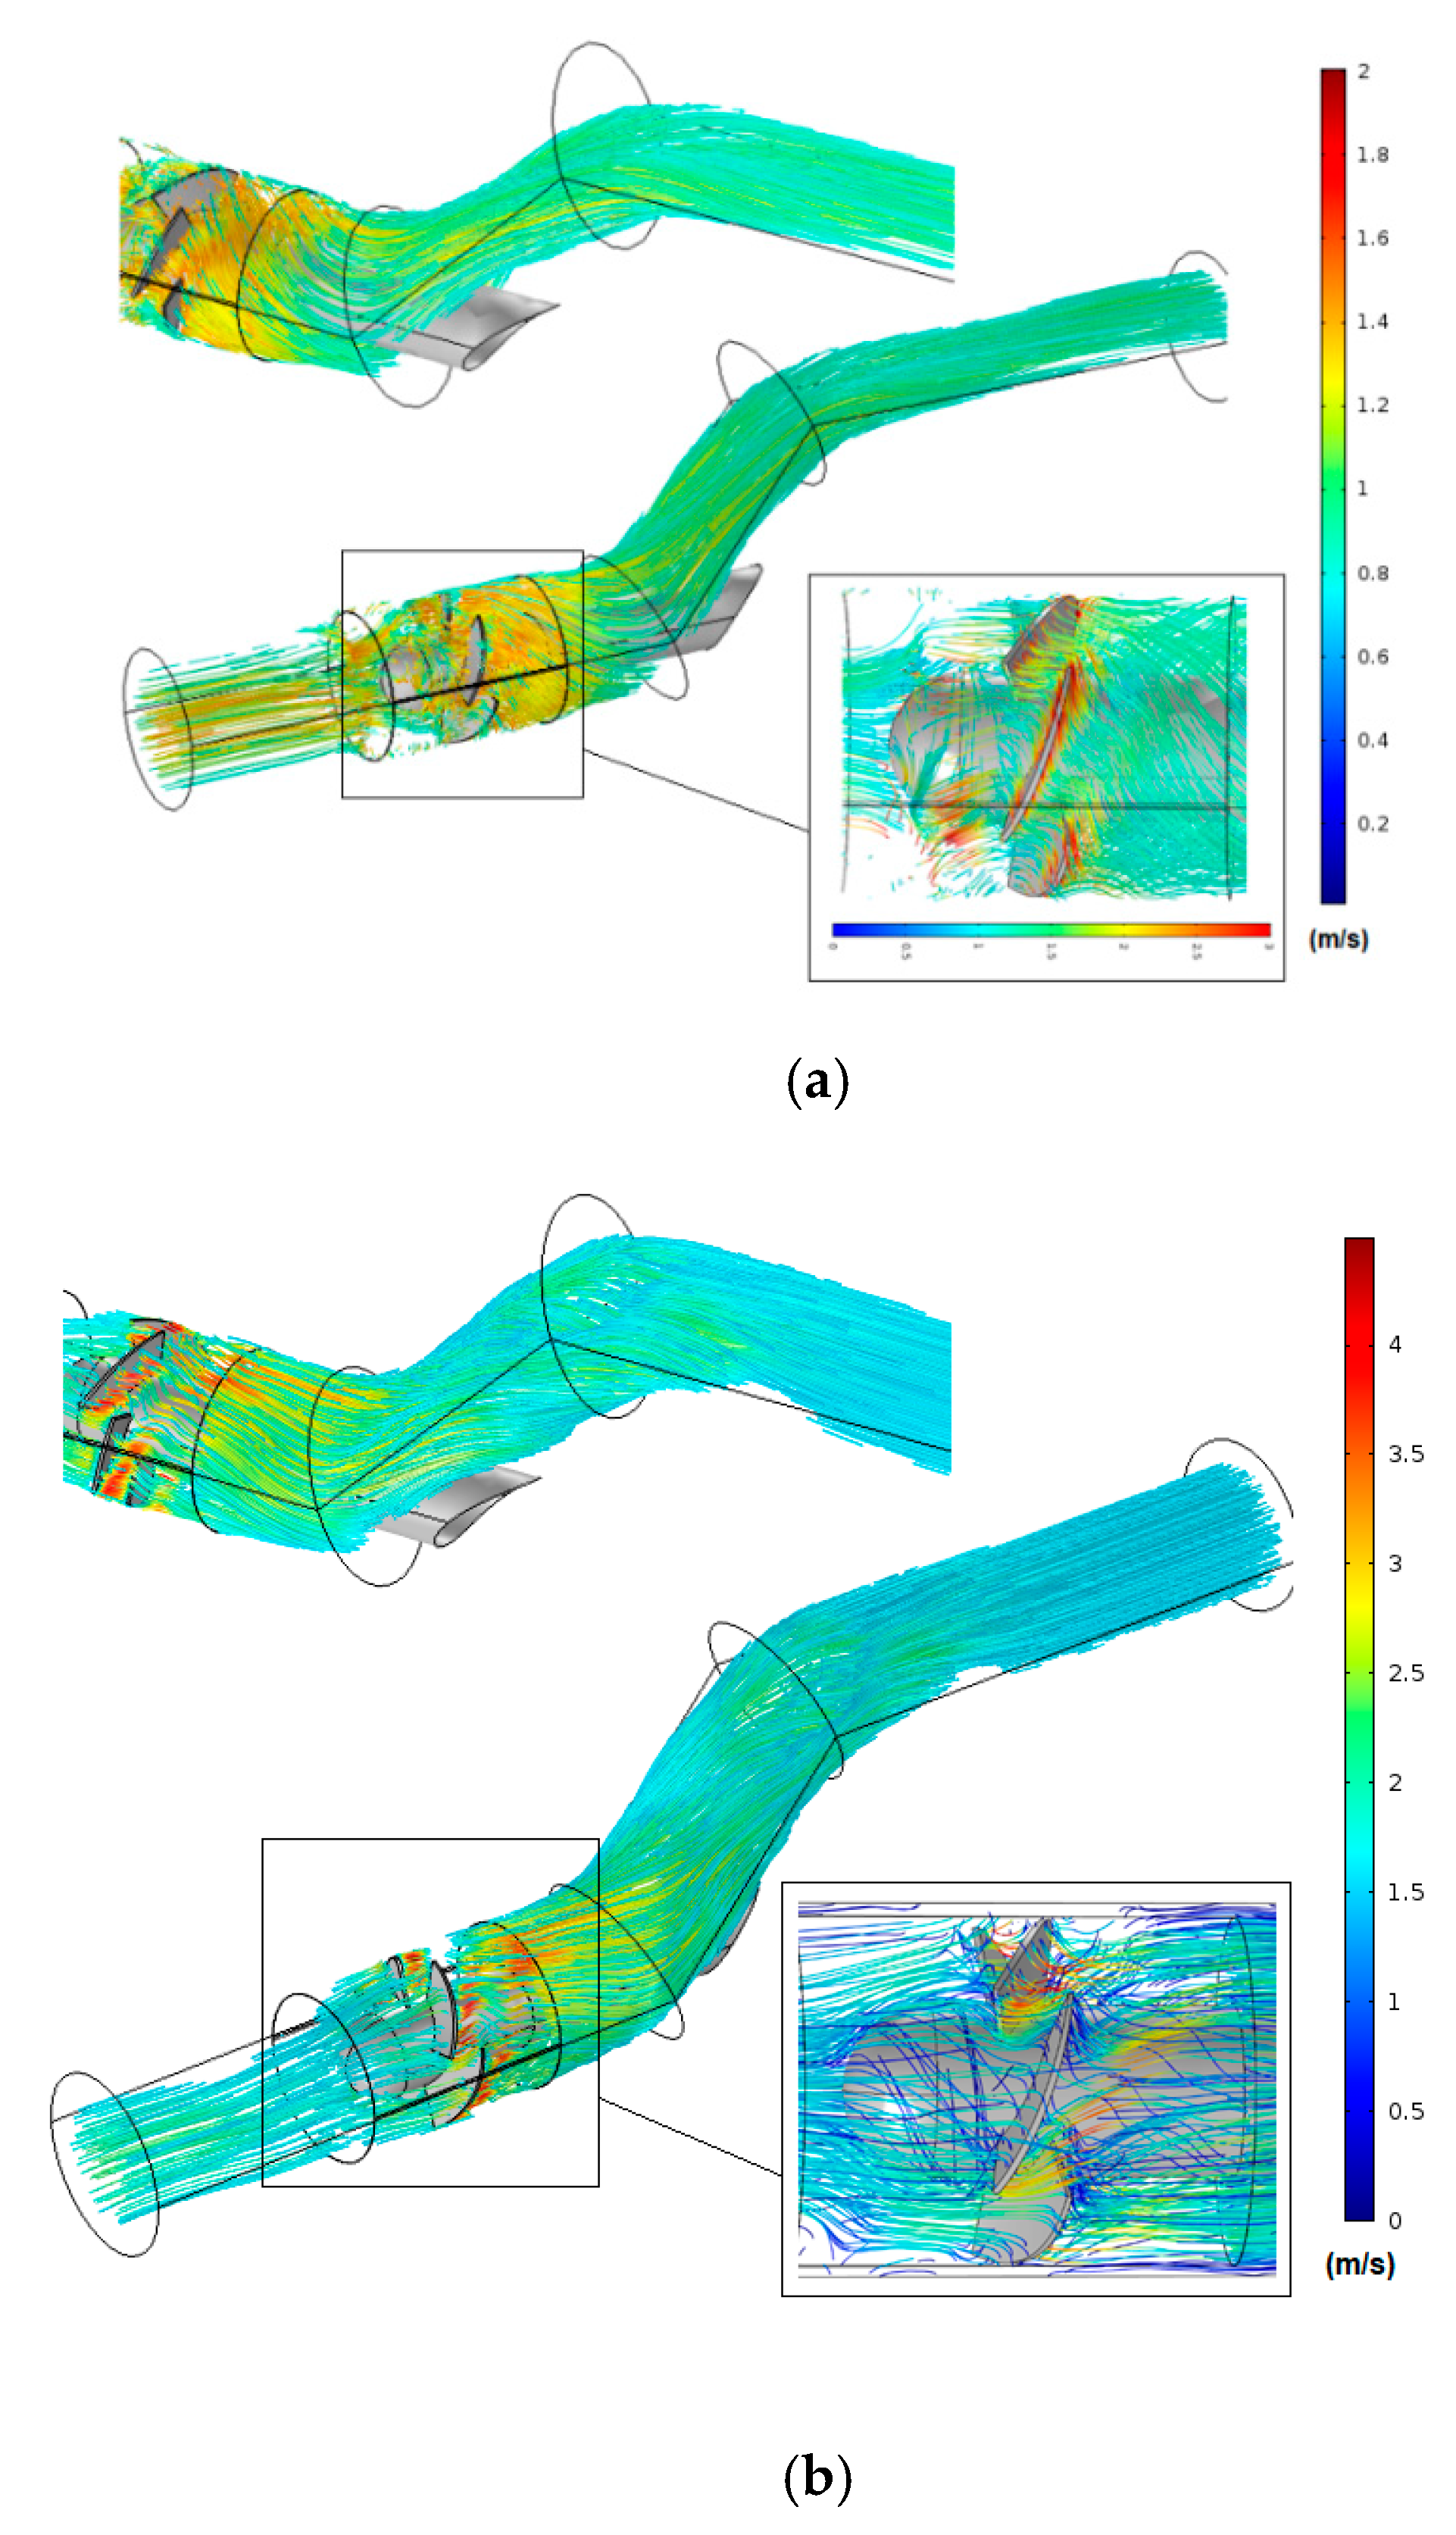
Figure 11 shows the regions of higher and lower velocities visualization obtained from CFD results on the turbine assembly. The streamlines show higher values nearby the blades crossing the impeller. The streamlines on each blade have different velocities such that set of velocity streamlines imparts a pressure force on the blades in the clockwise direction. Thus, most blades have a region of lower velocity on the leading edges, corresponding to a higher pressure, than the trailing edges of each blade.
The numerical models allowed identifying critical zones that affect the turbine efficiency and consequently the mechanical power transmitted to the generator. One of the factors that can induce stresses or a non-steady state is the load fluctuations. Thus, computational analysis was carried out to determine the pressure on the surface blades, and the associated shear stress. The location of the higher stresses in all cases coincides in the right edge of each blade of the runner (
Figure 12).
4. Discussion
According to Equation (7), the hydraulic features dimensionless terms of the machine are described in accordance with the geometric and kinetic resemblance principles. Under similar operating modes, the dimensional parameters remain constant. Thus, reduced parameters are commonly used to check the model-prototype relationship [
29,
30,
31,
32,
33].
where
and
are used to provide the definition of the dimensionless flow (
) and head (
) coefficients, respectively.
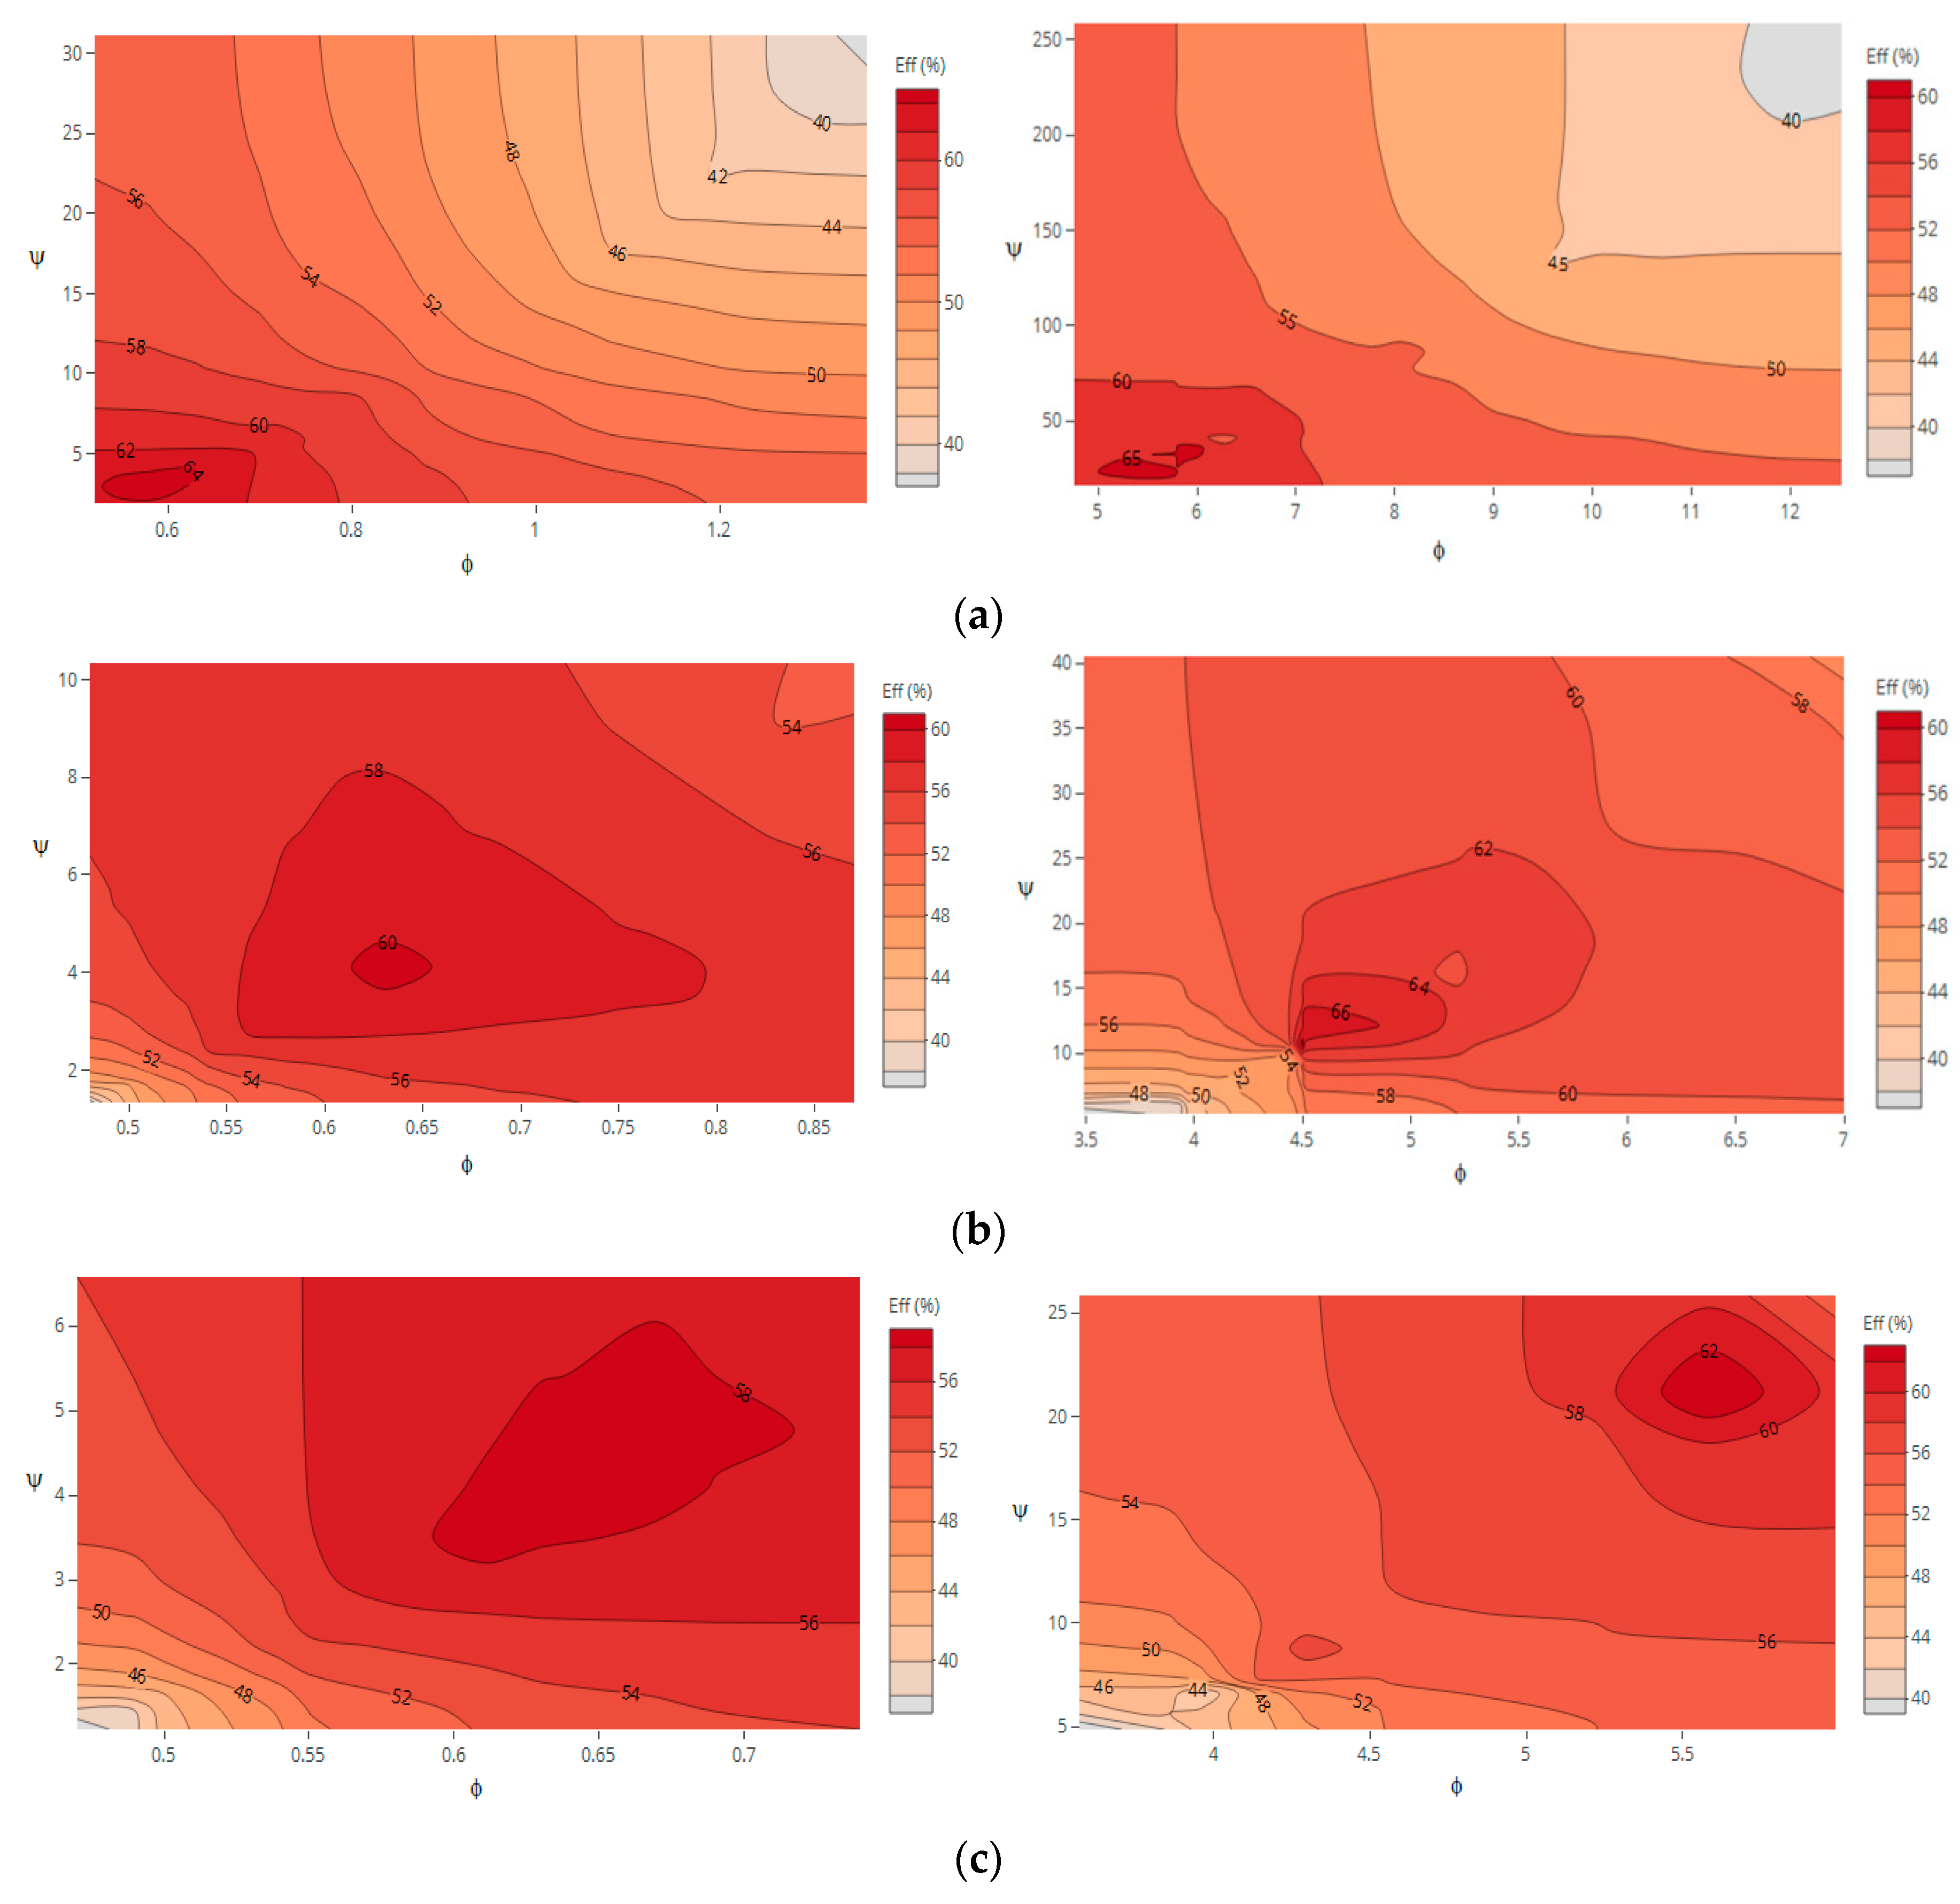
To observe the behavior of the flow due to the scaling effects, hill charts were created for the prototype and compared with the ones obtained in
Figure 9, by scaling up the turbine prototype (λ = 2).
Figure 13 shows the efficiency hill chart of both models for different rotational speeds (i.e.,
N = 750, 1500 and 1750 rpm). The design point for
D = 170 mm, corresponds to a flow and head coefficients of 10.67 and 4.50, respectively (
Figure 13a). As for
D = 85 mm, the design point belongs to 0.58 and 2.95 relative to flow and head coefficients (
Figure 13a).
The same efficiency variation can be verified in
Figure 13a either using
D = 85 mm or
D = 170 mm. In
Figure 13b,c, the efficiency range differs with less maximum values reached for
D = 85 mm, compared to
D = 170 mm. This can be explained by the fact that, contrary to
N = 170 mm, the propeller turbine with
N = 85 mm is more appropriate for
N < 1000 rpm operation.
Observing the hill charts, for rotational speeds below 1500 rpm, the efficiency is greater for low discharges and head coefficients, as opposite for higher rotational speeds. This condition is evident as for D = 85 mm and D = 170 mm. The turbine efficiency drops as the rotational speed increases, both in scaled model and in the real turbine, due to incidence losses, viscous effects, turbulence increasing, vortex generation, swirl structures and scale effects detected mostly within the impellers. Also, maximum efficiency values for D = 170 mm is significantly higher than for D = 85 mm.
This figure reflects the application of the principle of similarity to machines that are geometrically similar, where it is possible to predict the performance of one machine from experimental campaigns on another one that is geometrically similar, and the performance of the same machine for different operating conditions. Thus, principles of physical similarity can be applied, making possible and justifiable to apply the test results from laboratory under different states to the real problem in practice, covering a wide range of pressure and flow ranges.
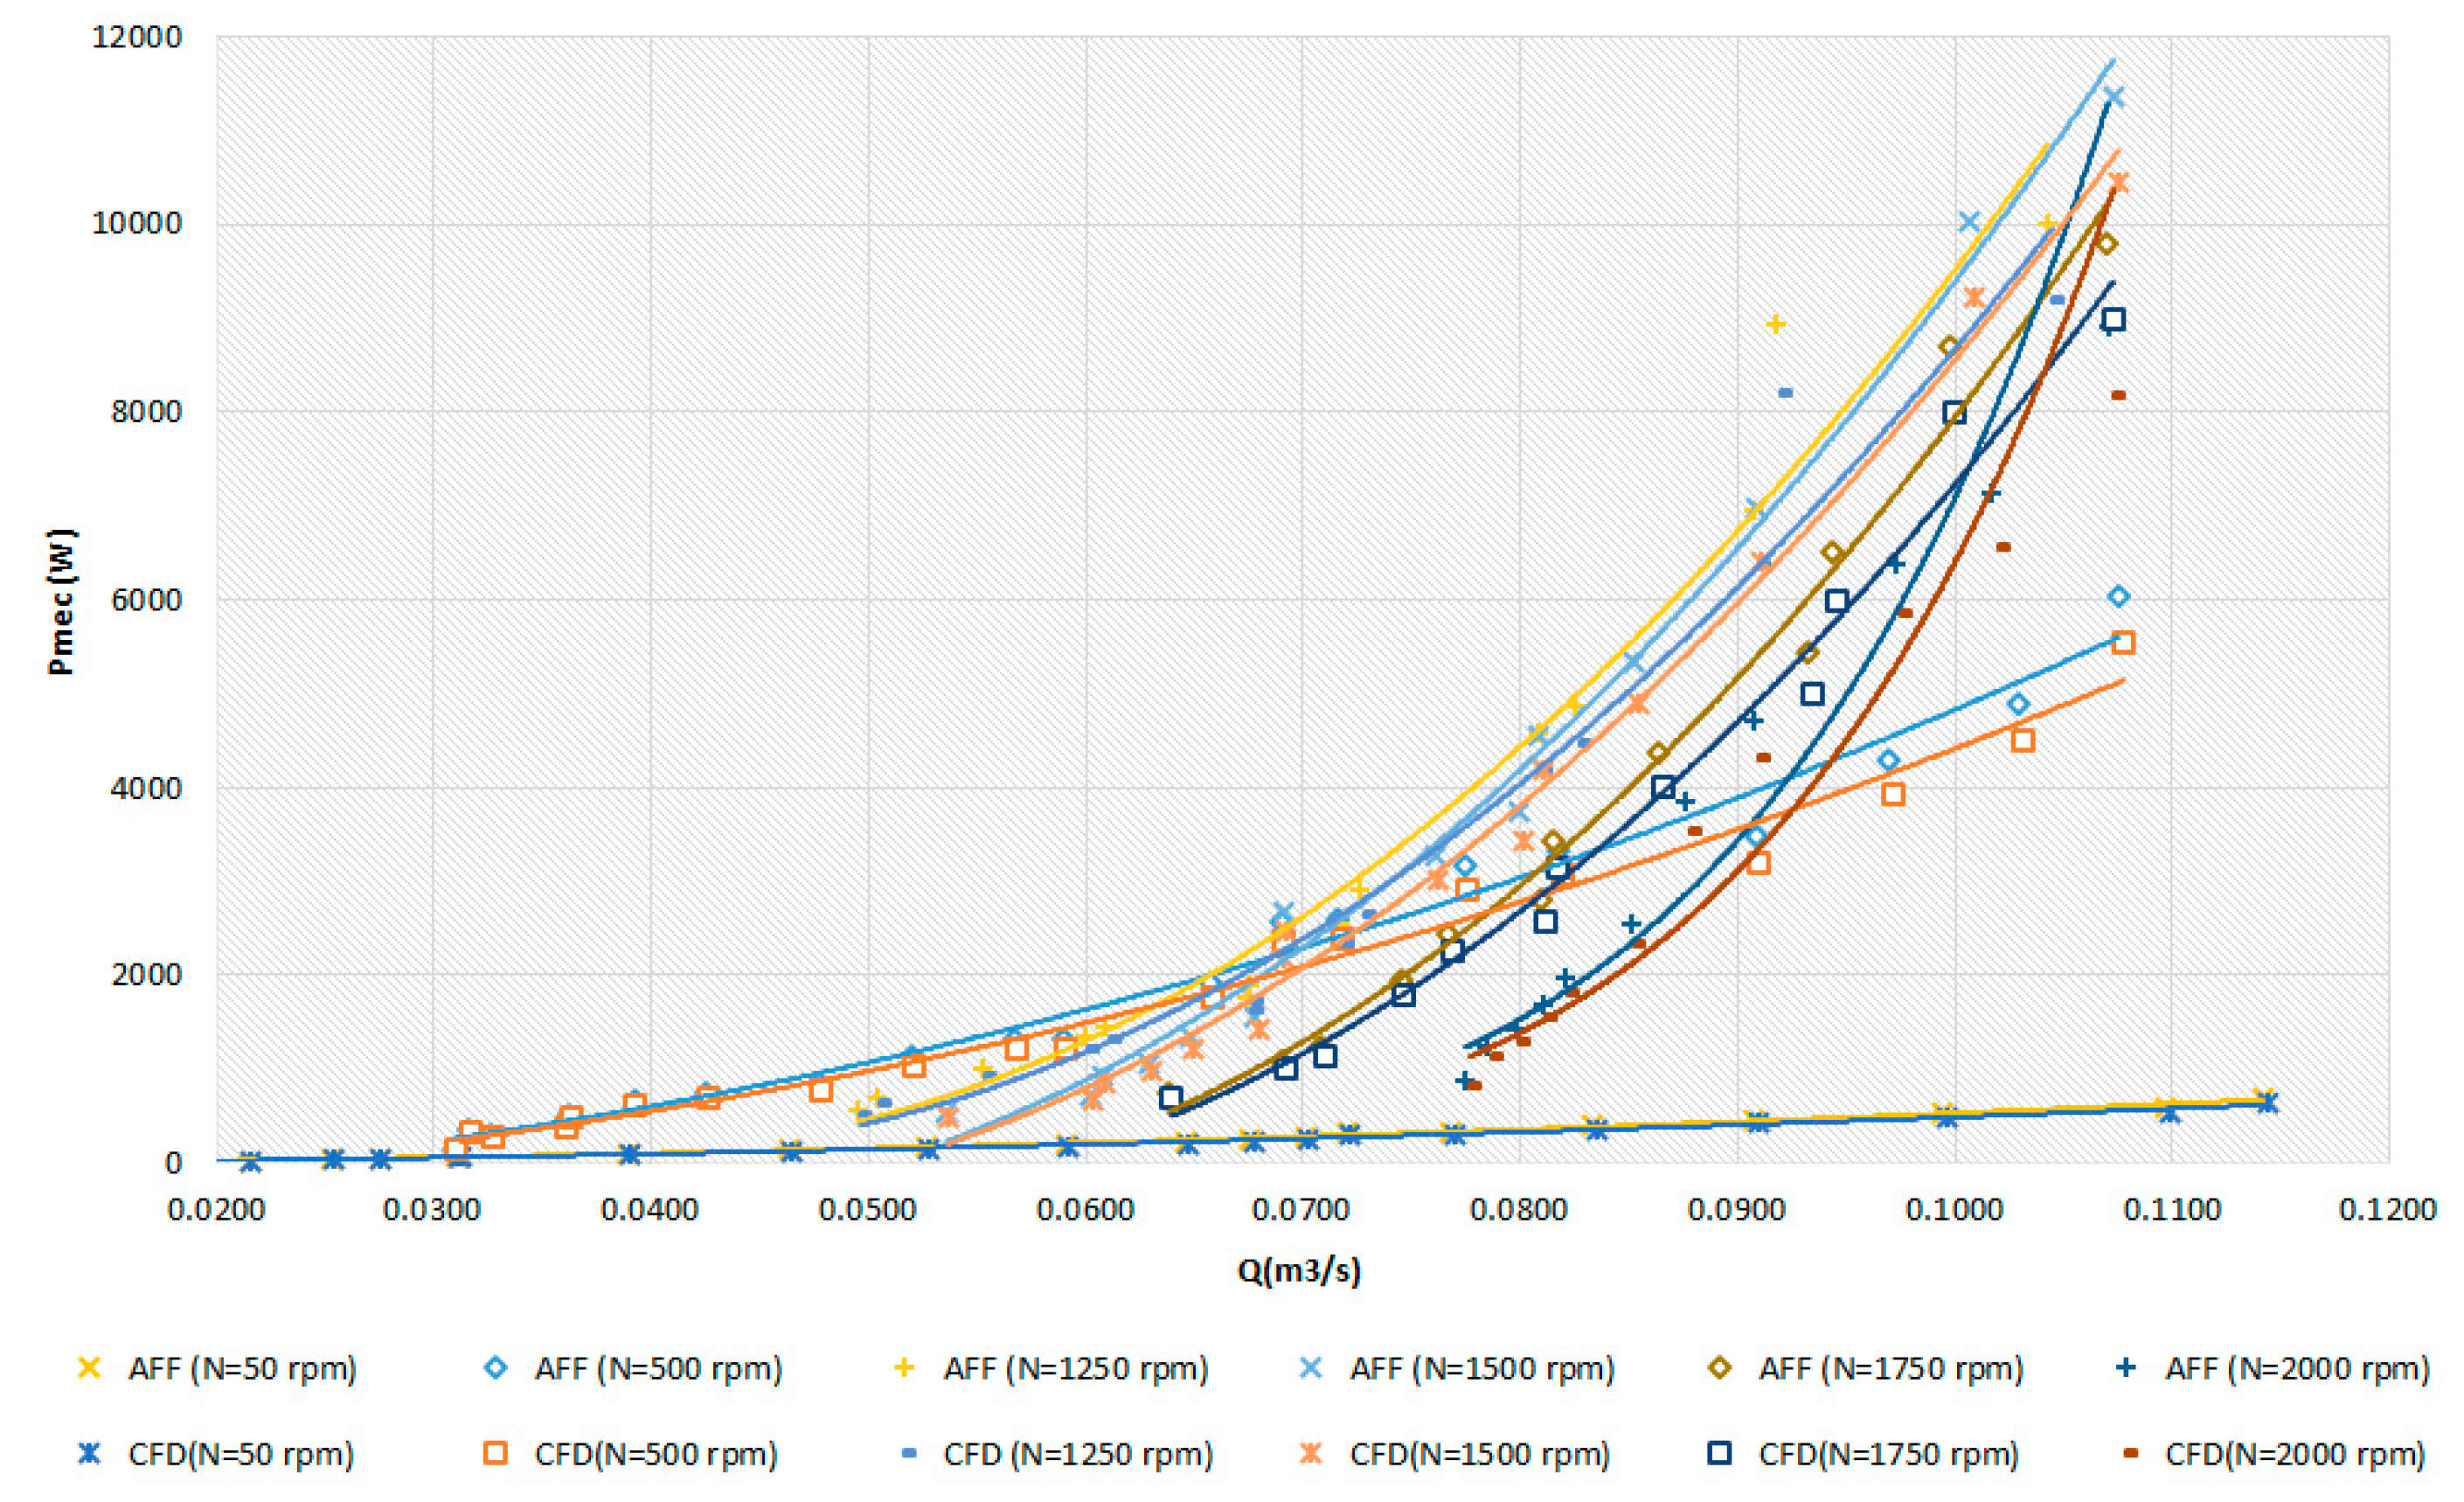
Figure 14 indicates the trend of power output curves in the experimental data using the modified affinity laws as well as for CFD analysis through Equation (6), which are approximately at the same level for different rotational speeds for
D = 170 mm.
The application of these affinity laws together with CFD models returned errors less than 5%, validating the strategy used. Indeed, with the variation of the rotational speed, the use of classical affinity laws in the simulations may result in erroneous results of recovered energy in the system (i.e., turbines do not behave as the classical affinities laws predicted).
5. Conclusions
This research presents experimental tests for an axial five blade tubular propeller turbine (5 BPT), with a specific rotational speed of 283 (m, kW). Hill charts were obtained (i.e., flow vs. head, flow vs. mechanical power and flow vs. efficiency) for different speeds. The experimental campaign applied to the 85 mm model of the 5BTP turbine, yielded results that can be considered promising when referring to micro/pico devices. The optimum point was around 65%, which is relevant for micro/pico machines. Based on this experiments, numerical simulations were performed for this diameter (D = 85 mm).
Hydraulic characteristics of the turbine with D = 170 mm were determined based on the D = 85 mm experimental data, and compared with numerical simulations performed for the same impeller design machine. Using the modified affinity laws, the prediction of the efficiency turned up in significant differences related to the head losses. As a result of the head loss overprediction, adjustments were performed to obtained the proper match between numerical models, affinity laws and experiments with suitable reduced mean errors. With this regard, the study shows how two different sizes of impellers with different rotating speeds can be effectively computed using CFD tools and how they can predict and modify the classical affinity laws towards the reality results.
Additionally, the CFD model was used to predict the performance of the two impellers’ diameters in different operating range. Two regions were found with irregular flow patterns, based on CFD analysis: the trailing edge of the impeller blades showed a possible point of stagnation and a region with potential recirculation between the blades, and a leak point between blades and the turbine case. The fluid velocities at design conditions ranged between approximately 0.8–1.2 m/s and 1–4 m/s, for D = 85 mm (model 1) and 170 mm (model 2), respectively. At design point, the models of D = 170 mm revealed a maximum fluid stress of 2.5 Pa at the leading edge of the impeller blades covering only approximately 2% of the surface area of the rotor’s hub, against 15% of the surface area in the rotor D = 85 mm. The hydraulic efficiency of both impellers showed up efficiencies ranged from 40–65%, which corresponds to a promise axial turbine in a near future application in the water sector.
Thus, this manuscript relies on searching for new functions and similarity conditions for axial turbines; with not only different diameters but also allowing different efficiencies. These new adjustments will help the industry estimate the performance of different axial turbines with different sizes and behaves, and to fill the gap of low head turbines for the water sector, which is a crucial shortfall to cover the domain of micro hydro application.


